Submitted:
26 October 2023
Posted:
27 October 2023
You are already at the latest version
Abstract
Keywords:
1. Introduction
2. Model and Methods
2.1. ICON Model Configuration
2.2. Experimental Data
2.3. Experiment Design
3. Results
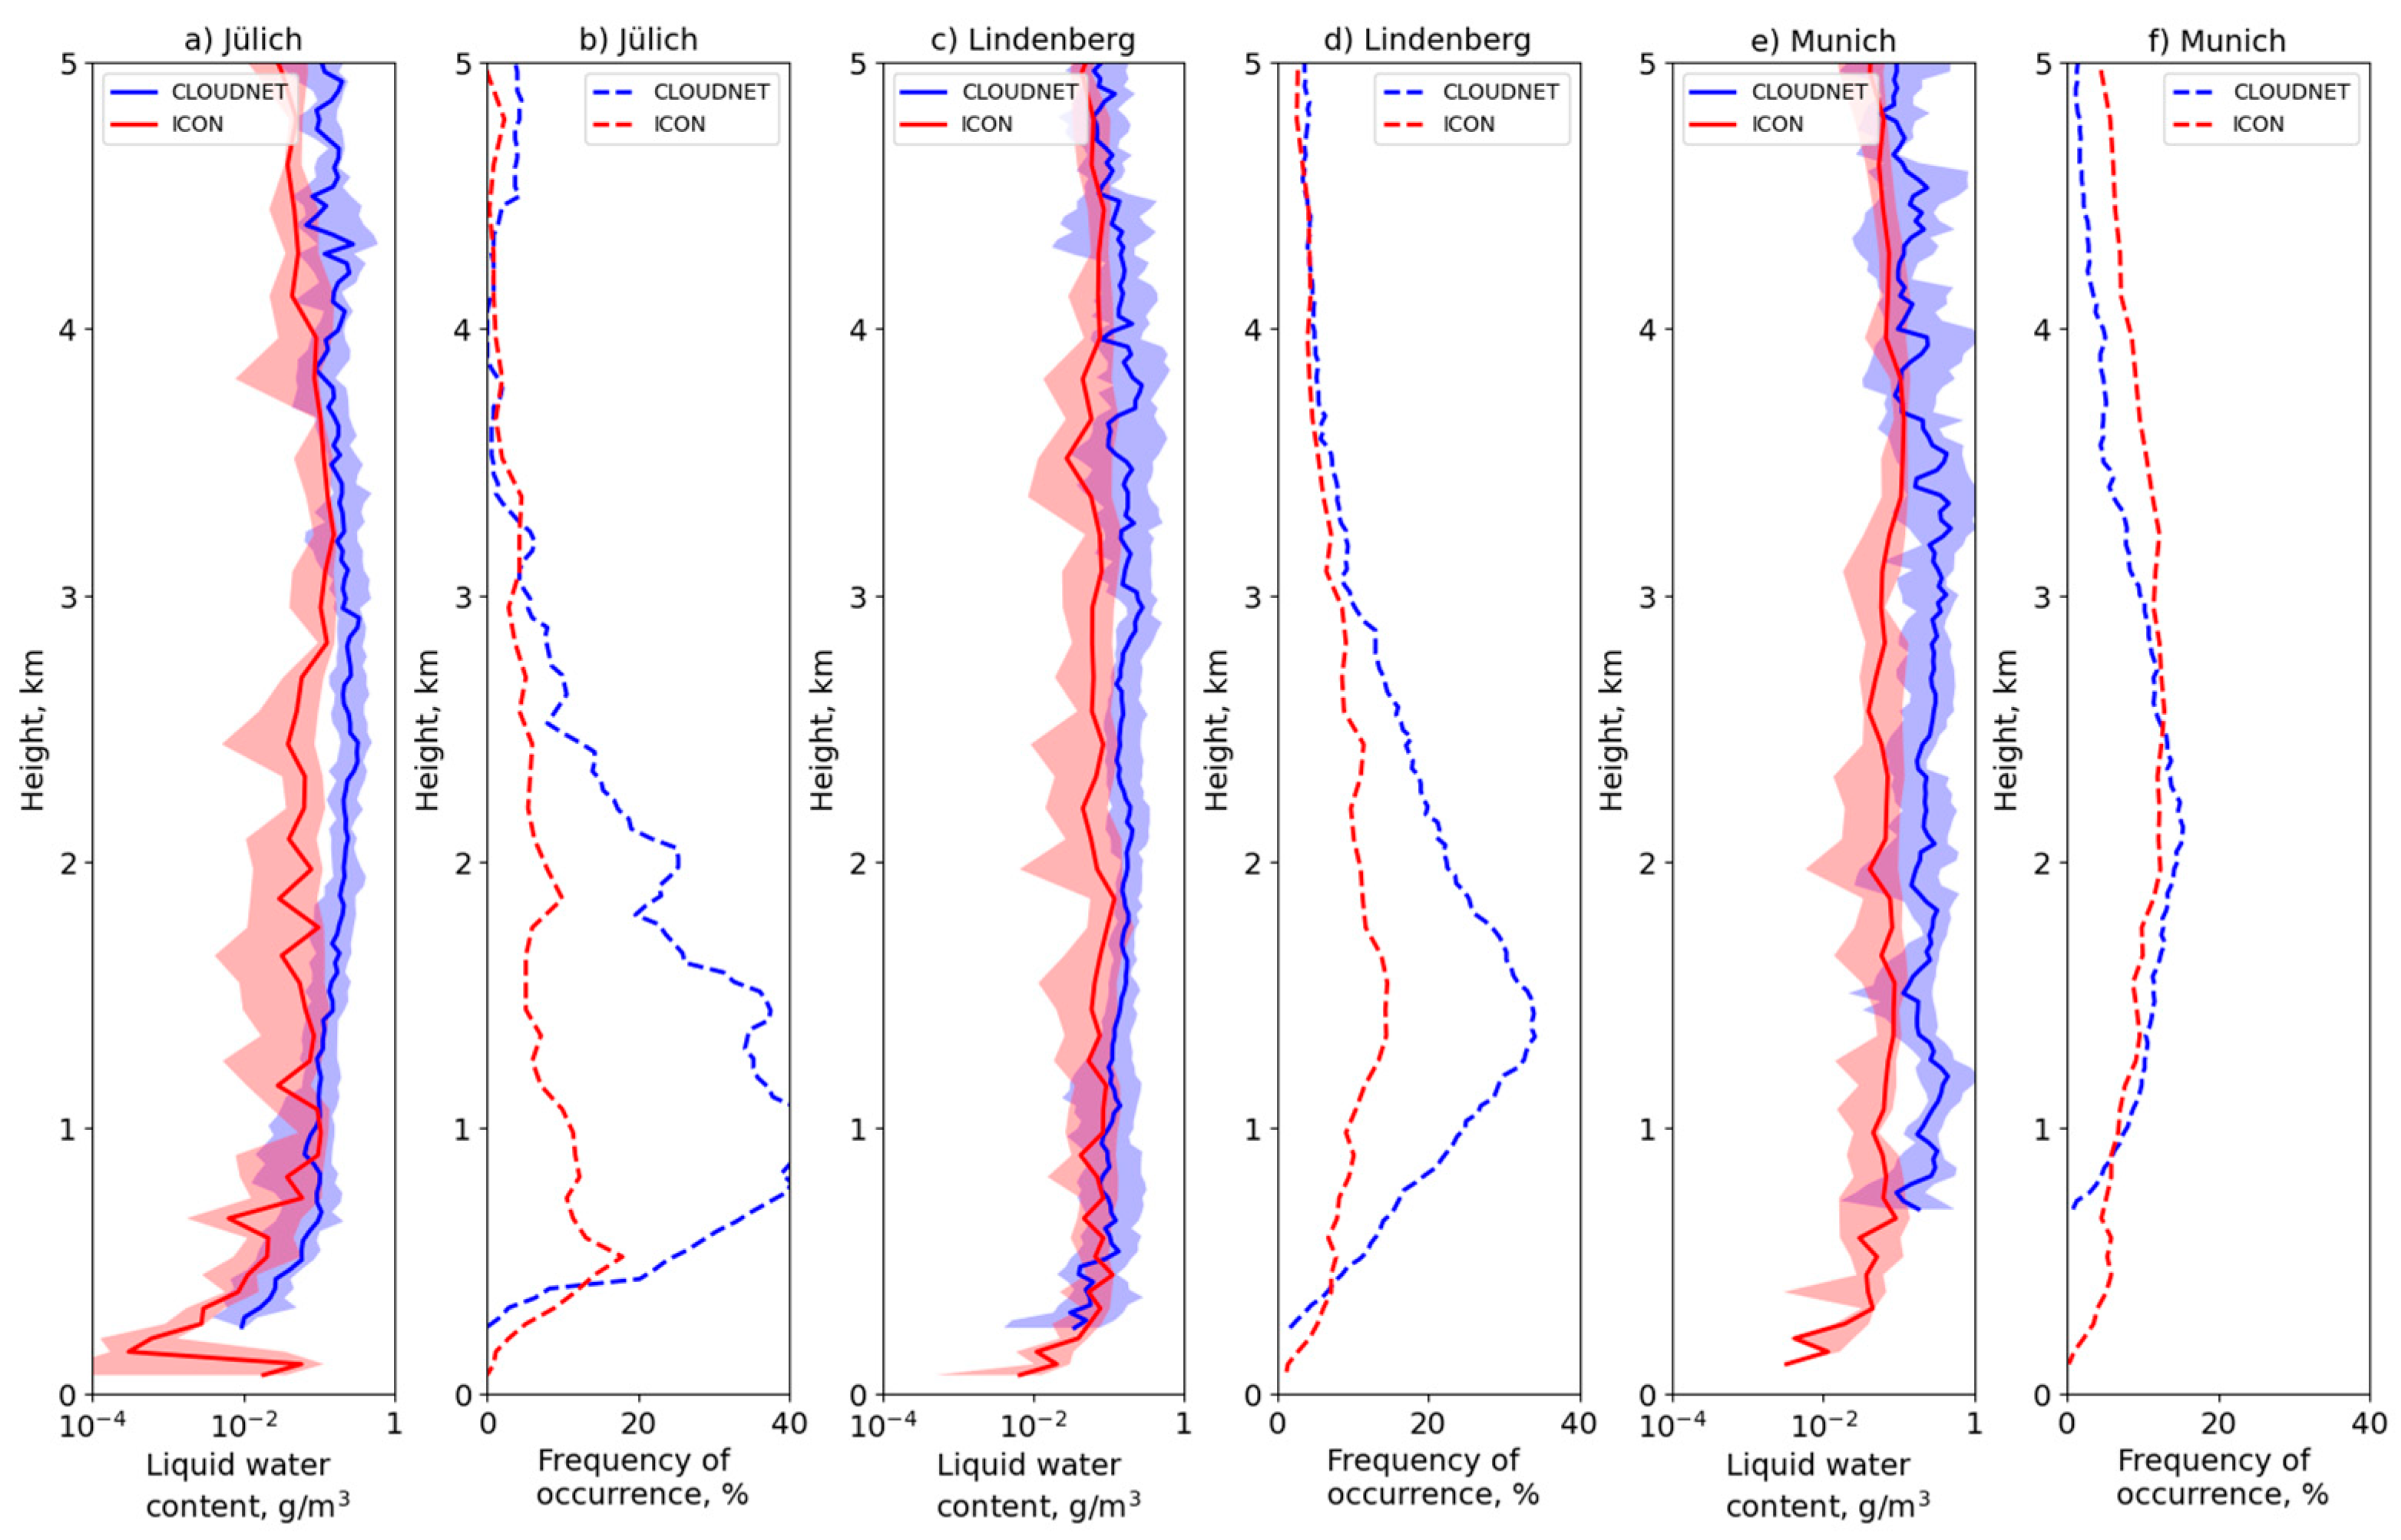
3.1. Liquid Water Content
3.2. Cloud Optical Thickness and Shortwave Irradiance at Ground
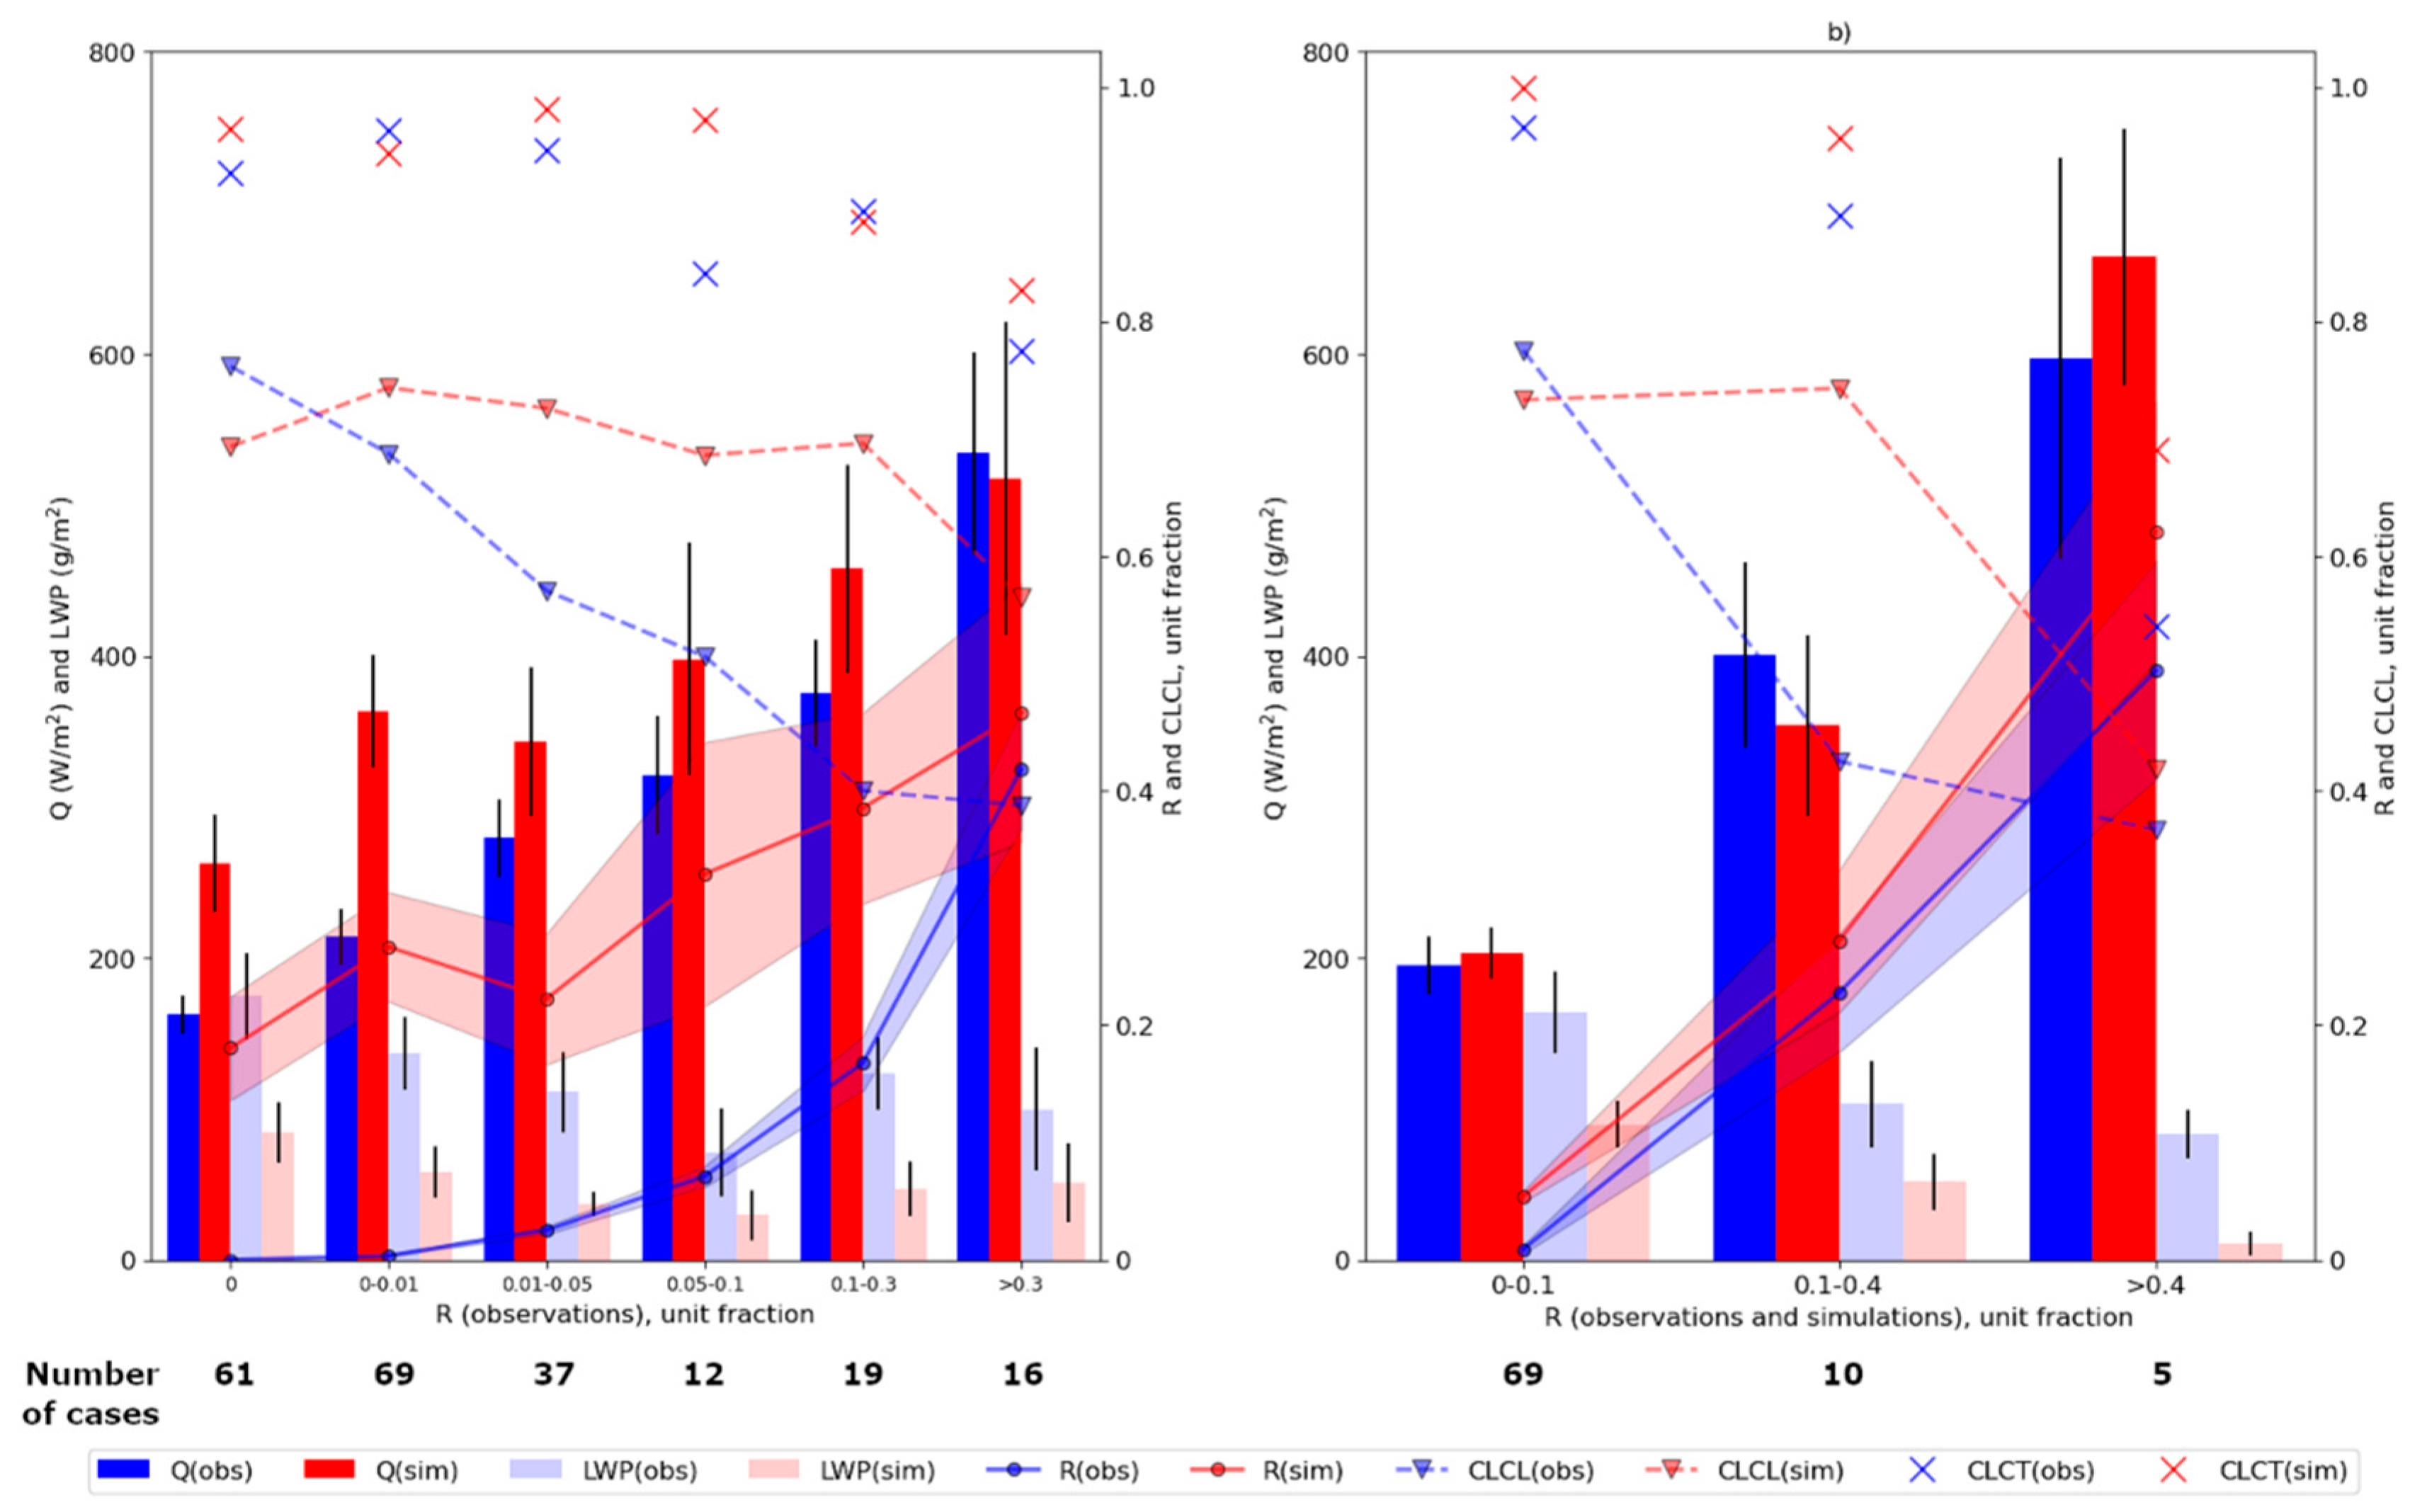
4. Discussion
5. Conclusions
Author Contributions
Funding
Institutional Review Board Statement
Informed Consent Statement
Data Availability Statement
Acknowledgments
Conflicts of Interest
References
- Mauder, M.; Foken, T.; Cuxart, J. Surface-Energy-Balance Closure over Land A Review. Boundary-Layer Meteorology 2020, 177, 395–426. [Google Scholar] [CrossRef]
- Marshak, A.; Davis, A.B. 3D Radiative Transfer in Cloudy Atmospheres. Springer-Verlag: Berlin Heidenberg, Germany, 2005: 686 pp.
- Khain, A. P.; Pinsky, M. Physical Processes in Clouds and Cloud Modeling. Cambridge University Press: Cambridge, UK, 2005: 626 pp. [CrossRef]
- Haiden, T.; Forbes, R.M.; Ahlgrimm, M.; Bozzo, A. The skill of ECMWF cloudiness forecast. ECMWF Newsletter 2015, 143, 1–7. (https://www.researchgate.net/profile/Thomas-Haiden/publication/292989145_The_skill_of_ECMWF_cloudiness_forecasts/links/56b497e608ae922e6c020100/The-skill-of-ECMWF-cloudiness-forecasts.pdf; accessed on 14 October 2023).[. [Google Scholar]
- Sotiropoulou, G.; Sedlar, J.; Forbes, R.; Tjernström, M. Summer Arctic clouds in the ECMWF forecast model: an evaluation of cloud parametrization schemes. Quarterly Journal of the Royal Meteorological Society 2016, 142, 387–400. [Google Scholar] [CrossRef]
- Tuccella, P.; Curci, G.; Grell, G. A.; Visconti, G.; Crumeyrolle, S.; Schwarzenboeck, A.; et al. A new chemistry option in WRF-Chem v. 3.4 for the simulation of direct and indirect aerosol effects VBS: evaluation against IMPACT-EUCAARI data. Geoscientific Model Development 2015, 8, 2749–2776. [Google Scholar] [CrossRef]
- Dipu, S.; Quaas, J.; Wolke, R.; Stoll, J.; Mühlbauer, A.; Sourdeval, O.; et al. Implementation of aerosol-cloud interactions in the regional atmosphere-aerosol model COSMO-MUSCAT(5.0) and evaluation using satellite data. Geoscientific Model Development 2017, 10, 2231–2246. [Google Scholar] [CrossRef]
- Muskatel, H.B.; Blahak, U.; Khain, P.; Levi, Y.; Fu, Q. Parametrizations of liquid and ice clouds’ optical properties in operational numerical weather prediction models. Atmosphere 2021, 12, 89. [Google Scholar] [CrossRef]
- Tao. , W.-K.; Simpson, J.; McCumber, M. An Ice-Water Saturation Adjustment. Monthly Weather Review 1989, 117, 231–235. [Google Scholar] [CrossRef]
- Khain, A.; Beheng, K. D.; Heymsfield, A.; Korolev, A.; Krichak, S. O.; Levin, Z.; et al. Representation of microphysical processes in cloud-resolving models: Spectral (bin) microphysics versus bulk parametrization. Reviews of Geophysics 2015, 53, 247–322. [Google Scholar] [CrossRef]
- Wang, Y.; Fan, J.; Zhang, R.; Leung, L. R.; Franklin, C. Improving bulk microphysics parametrizations in simulations of aerosol effects. Journal of Geophysical Research: Atmospheres 2013, 118, 5361–5379. [Google Scholar] [CrossRef]
- Haiden, T.; Trentmann, J. Verification of cloudiness and radiation forecasts in the greater Alpine region. Meteorologische Zeitschrift 2016, 25, 3–15. [Google Scholar] [CrossRef]
- Sundqvist, H.; Berge, E.; Kristjansson, J. E. Condensation and Cloud Parametrization Studies with a Mesoscale Numerical Weather Prediction Model. Monthly Weather Review 1989, 117, 1641–1657. [Google Scholar] [CrossRef]
- Tiedke, M. Representation of Clouds in Large-Scale Models. Monthly Weather Review 1993, 121, 3040–3061. [Google Scholar] [CrossRef]
- Ma, Z.; Liu, Q.; Zhao, C.; Shen, X.; Wang, Y.; Jiang, J. H.; et al. Application and Evaluation of an Explicit Prognostic Cloud-Cover Scheme in GRAPES Global Forecast System. Journal of Advances in Modeling Earth Systems 2018, 10, 652–667. [Google Scholar] [CrossRef]
- Zängl, G.; Reinert, D.; Ripodas, P.; Baldauf, M. The ICON (ICOsahedral Non-hydrostatic) modelling framework of DWD and MPI-M: Description of the non-hydrostatic dynamical core. Quarterly Journal of the Royal Meteorological Society 2015, 141, 563–579. [Google Scholar] [CrossRef]
- Rivin, G. S.; Rozinkina I., A. Astakhova, E. D.; Blinov, D. V.; Bundel, A. Yu.; Kirsanov, A. A.; et al. COSMO-Ru high-resolution short-range numerical weather prediction system: its development and applications. Hydrometeorological research and forecasts 2019, 374, 37–53. In Russian. (https://method.meteorf.ru/publ/tr/tr374/03.pdf; accessed on 14 October 2023). [Google Scholar] [CrossRef]
- Seifert, A.; Beheng, K. D. A two-moment cloud microphysics parameterization for mixed-phase clouds. Part 1: Model description. Meteorology and atmospheric physics 2006, 92, 45–66. [Google Scholar] [CrossRef]
- Segal, Y.; Khain, A. Dependence of droplet concentration on aerosol conditions in different cloud types: Application to droplet concentration parameterization of aerosol conditions. Journal of Geophysical Research: Atmospheres 2006, 111. [Google Scholar] [CrossRef]
- Seifert, A. On the parametrization of evaporation of raindrops as simulated by a one-dimensional rainshaft model. Journal of the Atmospheric Sciences 2008, 65, 3608–3619. [Google Scholar] [CrossRef]
- Kärcher, B.; Hendricks, J.; Lohmann, U. Physically based parameterization of cirrus cloud formation for use in global atmospheric models. Journal of Geophysical Research: Atmospheres 2006, 111. [Google Scholar] [CrossRef]
- Phillips, V. T. J.; DeMott, P. J.; Andronache, C. An Empirical Parametrization of Heterogeneous Ice Nucleation for Multiple Chemical Species of Aerosol. Journal of Atmospheric Sciences 2008, 65, 2757–2783. [Google Scholar] [CrossRef]
- Doms, G.; Foerstner, J.; Heise, E.; Herzog, H.-J.; Mironov, D.; Raschendorfer, M.; et al. A Description of the Nonhydrostatic Regional COSMO-Model. Part II: Physical Parametrizations (COSMO 6.0). Deutscher Wetterdienst: Offenbach, Germany, 2021: 171 pp. [CrossRef]
- Hogan, R. J.; Bozzo, A. ECRAD: A new radiation scheme for the IFS. ECMWF Technical Memoranda 2016, 787. (https://www.ecmwf.int/sites/default/files/elibrary/2016/16901-ecrad-new-radiation-scheme-ifs.pdf; accessed on 14 October 2023). [Google Scholar]
- Pincus, R.; Barker, H. W.; Morcrette, J. J. A fast, flexible, approximate technique for computing radiative transfer in inhomogeneous cloud fields. Journal of Geophysical Research: Atmospheres 2003, 108. [Google Scholar] [CrossRef]
- Edwards, J. M.; Slingo, A. Studies with a flexible new radiation code. I: Choosing a configuration for a large-scale model. Quarterly Journal of the Meteorological Society 1996, 122, 689–719. [Google Scholar] [CrossRef]
- Fu, Q. An accurate parametrization of the solar radiative properties of сirrus clouds for climate models. Journal of Climate 1996, 9, 2058–2082. [Google Scholar] [CrossRef]
- Fu, Q.; Yang, P.; Sun, W. B. An accurate parameterization of the infrared radiative properties of cirrus clouds for climate models. Journal of Climate 1998, 11, 2223–2237. [Google Scholar] [CrossRef]
- Hogan, R. J.; Illingworth, A. J. Deriving cloud overlap statistics from radar. Journal of the Atmospheric Sciences 2000, 126, 2903–2909. [Google Scholar] [CrossRef]
- CLU. Cloud profiling products: Classification, Liquid water content, Categorize; cloud profiling measurements: Microwave radiometer; 2021-03-01 to 2021-10-31; from Jülich, Lindenberg, Munich. Generated by the cloud profiling unit of the ACTRIS Data Centre, 14 October 2023. Available online: https://hdl.handle.net/21.12.132/2.117b713d7c04494e (accessed on 14 October 2023).
- Illingworth, A. J.; Hogan, R. J.; O’Connor, E. J.; Bouniol, D.; Brooks, M. E.; Delanoea, J.; et al. Cloudnet: Continuous evaluation of cloud profiles in seven operational models using ground-based observations. Bulletin of the American Meteorological Society 2007, 88, 883–898. [Google Scholar] [CrossRef]
- Görsdorf, U.; Lehmann, V.; Bauer-Pfundstein, M.; Peters, G.; Vavriv, D.; Vinogradov, V.; Volkov, V. A 35-GHz Polarimetric Doppler Radar for Long-Term Observations of Cloud Parameters – Description of System and Data Processing. Journal of Atmospheric and Oceanic Technology 2015, 32, 675–690. [Google Scholar] [CrossRef]
- Löhnert, U.; Scheween, J.H.; Acquistapace, C.; Ebell, K.; Maahn, M.; Barrera-Verdejo, M.; et al. JOYCE: Jülich observatory for cloud evolution. Bulletin of the American Meteorological Society 2015, 96, 1157–1174. [Google Scholar] [CrossRef]
- Gaussiat, N.; Hogan, R. J.; Illingworth, A. J. Accurate liquid water path retrieval from low-cost microwave radiometers using additional information from a lidar ceilometer and operational forecast models. Journal of Atmospheric and Oceanic Technology 2007, 24, 1562–1575. [Google Scholar] [CrossRef]
- Roebeling, R. A.; Deneke, H. M.; Feijt, A. J. Validation of cloud liquid water path retrievals from SEVIRI using one year of CloudNET observations. J. Appl. Meteorol. And Climatol. 2007, 47, 206–222. [Google Scholar] [CrossRef]
- Platnick, S.; Meyer, K.G.; King, M.D.; Wind, G.; Amarasinghe, N.; Marchant, B.; et al. The MODIS cloud optical and microphysical products: Collection 6 updates and examples from Terra and Aqua. IEEE Trans. Geosci. Remote Sens 2016, 55, 502–525. [Google Scholar] [CrossRef]
- Platnick, S.; King, M. D.; Ackerman, S. A.; Menzel, W. P.; Baum, B. A.; Riedi, J. C.; Frey, R. A. The MODIS cloud products: Algorithms and examples from Terra. IEEE Trans. Geosci. Remote Sens. 2003, 41, 459–473. [Google Scholar] [CrossRef]
- McArthur, L. J. B. World Climate Research Programme-Baseline Surface Radiation Network (BSRN)-Operations Manual Version 2.1. WMO/TD 2005, 1274. (https://epic.awi.de/id/eprint/45991/1/McArthur.pdf; accessed on 14 October 2023). [Google Scholar]
- Gultepe, I.; Isaac, G. A. Liquid water content and temperature relationship from aircraft observations and its applicability to GCMs. Journal of Climate 1997, 11, 446–452. [Google Scholar] [CrossRef]
- Löhnert, U.; Crewell, S.; Simmer, C.; Macke, A. Profiling cloud liquid water combining active and passive microwave measurements with cloud model statistics. Journal of Atmospheric and Oceanic Technology 2001, 18, 1354–1366. [Google Scholar] [CrossRef]
- Tselioudis, G.; Rossow, W.B.; Rind, D. Global patterns of cloud optical thickness variation with temperature. Journal of Climate 1992, 5, 1484–1495. [Google Scholar] [CrossRef]
- Lau, Ng.-Ch.; Crane, M.W. A satellite view of the synoptic-scale organization of cloud properties in Midlatitude and tropical circulation systems. Monthly Weather Review 1995, 123, 1984–2006. [Google Scholar] [CrossRef]
- Hogan, R.J.; Illingworth, A.J.; O’Connor, E.J.; Bouniol, D.; Brooks, M.E.; Delanoea, J.; et al. Cloudnet: Evaluation of model clouds using ground-based observations. In Proceedings of the ECMWF Workshop on Parametrization of clouds in large-scale models, Reading, 13-15. (https://www.ecmwf.int/sites/default/files/elibrary/2007/9929-cloudnet-evaluation-model-clouds-using-ground-based-observations.pdf; accessed on 14 October 2023). 2006. [Google Scholar]
- Fix, E.; Hodges, J. L. Discriminatory analysis, nonparametric estimation: consistency properties. US Air Force School of Aviation Medicine 1951, 4, 21–49. [Google Scholar] [CrossRef]
- Merk, D.; Deneke, H.; Pospichal, B.; Seifert, P. Investigation of the adiabatic assumption for estimating cloud micro- and macrophysical properties from satellite and ground observations. Atmospheric Chemistry and Physics 2016, 16, 933–952. [Google Scholar] [CrossRef]
- Gupta, S.; McFarququhar, G. M.; O’Brien, J. R.; Poellot, M. R.; Delene, D. J.; Chang, I.; et al. In situ and satellite-based estimates of cloud properties and aerosol-cloud interactions over the southeast Atlantic Ocean. Atmospheric Chemistry and Physics 2022, 22, 12923–12943. [Google Scholar] [CrossRef]
- Hande, L.B.; Engler, C.; Hoose, C.; Tegen, I. Parameterizing cloud condensation nuclei concentrations during HOPE. Atmospheric Chemistry and Physics 2016, 16, 12059–12079. [Google Scholar] [CrossRef]
- Paramonov, M.; Kerminen, V.-M.; Gysel, M.; Aalto, P.P.; Andreae, M.O.; Asmi, E.; et al. A synthesis of cloud condensation nuclei counter (CCNC) measurements within the EUCAARI network. Atmospheric Chemistry and Physics 2015, 15, 12211–12229. [Google Scholar] [CrossRef]
- Li, J.; Jian, B.; Huang, J.; Hu, Y.; Zhao, C.; Kawamoto, K.; et al. Long-term variation of cloud droplet number concentrations from Space-based Lidar. Remote Sens. Environ. 2018, 213, 144–161. [Google Scholar] [CrossRef]
- Quaas, J.; Boucher, O.; Lohmann, U. Constraining the total aerosol indirect effect in the LMDZ and ECHAM4 GCMs using MODIS satellite data. Atmospheric Chemistry and Physics 2006, 6, 947–955. [Google Scholar] [CrossRef]
- Fanourgakis, G. S.; Kanakidou, M.; Nenes, A.; Bauer, S. E.; Bergman, T.; Carslaw, K. S.; et al. Evaluation of global simulations of aerosol particle and cloud condensation nuclei number, with implications for cloud droplet formation. Atmospheric Chemistry and Physics 2019, 19, 8591–8617. [Google Scholar] [CrossRef] [PubMed]
- Shuvalova, J.; Chubarova, N.; Shatunova, M. Impact of cloud condensation nuclei reduction on cloud characteristics and solar radiation during COVID-19 lockdown 2020 in Moscow. Atmosphere 2022, 13, 1710. [Google Scholar] [CrossRef]
- Rosenfeld, D.; Zheng, Y.; Hashimshoni, E.; Poehlker, M.L.; Jefferson, A.; Poehlker, C.; et al. Satellite retrieval of cloud condensation nuclei concentrations by using clouds as CCN chambers. Proceedings of the National Academy of Sciences 2016, 113, 5828–5834. [Google Scholar] [CrossRef] [PubMed]
- McComiskey, A.; Feingold, G.; Frisch, A.S.; Turner, D.D.; Miller, M.A.; Chiu, J.C.; et al. An assessment of aerosol-cloud interactions in marine stratus clouds based on surface remote sensing. J. Geophys. Res. Atmos. 2009, 114, D09203. [Google Scholar] [CrossRef]
- Mikhailov, E. F.; Ivanova O., A.; Vlasenko, S. S.; Nebos’ko, E. Yu.; Ryshkevich, T. I. Cloud Condensation Nuclei Activity of the Aitken Mode Particles near St. Petersburg, Russia. Izvestiya, Atmospheric and Oceanic Physics 2017, 53, 326–333. [Google Scholar] [CrossRef]
- Quaas, J.; Arola, A.; Cairns, B.; Christensen, M.; Deneke, H.; et al. Constraining the Twomey effect from satellite observations: issues and perspectives. Atmospheric Chemistry and Physics 2020, 20, 15079–15099. [Google Scholar] [CrossRef]
- Painemal, D.; Chang, F.-L.; Ferrare, R.; Burton, S.; Li, Z.; et al. Reducing uncertainties in satellite estimates of aerosol-cloud interactions over the subtropical ocean by integrating vertically resolved aerosol observations. Atmospheric Chemistry and Physics 2020, 20, 7167–7177. [Google Scholar] [CrossRef]
- Steinke, S.; Eikenberg, S.; Loehnert, U.; Dick, G.; Klocke, D.; Di Girolamo, P.; Crewell, S. . Assessment of small-scale integrated water vapour variability during HOPE. Atmospheric Chemistry and Physics 2015, 15, 2675–2692. [Google Scholar] [CrossRef]
- Kiszler, T.; Ebell, K.; Schemann, V. A Performance Baseline for the Representation of Clouds and Humidity in Cloud-Resolving ICON-LEM Simulations in the Arctic. Journal of Advances in Modeling Earth Systems 2023, 15, 1–14. [Google Scholar] [CrossRef]
- Schmale, J.; Henning, S.; Henzing, B.; Keskinen, H.; Sellegri, K.; Ovadnevaite, J.; et al. Collocated observations of cloud condensation nuclei, particle size distributions, and chemical composition. Scientific data 2017, 4, 1–27. [Google Scholar] [CrossRef]
- Twomey, S. The nuclei of natural cloud formation. Part II: The supersaturation in natural clouds and the variation of cloud droplet concentration. Geofisica pura e applicata 1959, 43, 243–249. [Google Scholar] [CrossRef]
- Kretzschmar, J.; Stapf, J.; Klocke, D.; Wendisch, M.; Quaas, J. Employing airborne radiation and cloud microphysics observations to improve cloud representation in ICON at kilometer-scale resolution in the Arctic. Atmospheric Chemistry and Physics 2020, 20, 13145–13165. [Google Scholar] [CrossRef]
- Costa-Suros, M.; Sourdeval, O.; Acquistapace, C.; Baars, H.; Henken, C. C.; Genz, C.; et al. Detection and attribution of aerosol-cloud interactions in large-domain large-eddy simulations with the ICOsahedral Non-hydrostatic model. Atmospheric Chemistry and Physics 2020, 20, 5657–5678. [Google Scholar] [CrossRef]
- Wood, R. Relationships between optical depth, liquid water path, droplet concentration, and effective radius in adiabatic layer cloud, University of Washington, 2006. (https://atmos.uw.edu/~robwood/papers/chilean_plume/optical_depth_relations.pdf; accessed on 14 October 2023). 14 October.
- Mittermaier, M. A critical assessment of surface cloud observations and their use for verifying cloud forecasts. Quarterly Journal of the Royal Meteorological Society 2012, 138, 1794–1807. [Google Scholar] [CrossRef]
- Hogan, R. J.; O’Connor, E. J.; Illingworth, A. J. Verification of cloud-fraction forecasts. Quarterly Journal of the Royal Meteorological Society 2009, 135, 1494–1511. [Google Scholar] [CrossRef]
- Morcette, C. J.; O’Connor, E. J.; Petch, J. C. Evaluation of two cloud parametrization schemes using ARM and Cloud-Net observations. Quarterly Journal of the Royal Meteorological Society 2012, 138, 964–979. [Google Scholar] [CrossRef]
- Mullammaa, Y. R.; Sulev, M. A.; Pyldmaa, V. K.; Ohvril, H. A.; Niylisk, H. J.; Allenov, M. I.; et al. Stochastic structure of cloud and radiation fields. NASA TT F-822, Studies in atmospheric physics, AN ESR, Institute of Physics and Astronomy, 1975, 18, (https://archive.org/details/nasa_techdoc_19760004517; accessed on 14 October 2023). [Google Scholar]
- Kawai, H.; Yukimoto, S.; Koshiro, T.; Oshima, N.; Tanaka, T.; Yoshimura, H.; Nagasawa, R. Significant improvement of cloud representation in the global climate model MRI-ESM2. Geoscientific Model Development 2019, 12, 2875–2897. [Google Scholar] [CrossRef]
- Tarasova, T.; Chubarova, N. On the calculation of optical thickness of extended low and middle clouds using measurements of solar radiation in three solar spectrum ranges on the Earth’s surface. Izvestiya Atmospheric and Oceanic Physics 1994, 30, 253–257. (https://istina.msu.ru/publications/article/376715/; accessed on 14 October 2023). [Google Scholar]
- Crewell, S.; Simmer, C.; Feijt, A.; van Meijgaard, E. CLIWA-NET: BALTEX BRIDGE Cloud Liquid Water Network. Internat. BALTEX Secretariat, 2003. (https://baltex-research.eu/publications/SSG_minutes_diverse/BALTEX_NO26.pdf; accessed on 14 October 2023). 14 October.
- Teixeira, J. Cloud Fraction and Relative Humidity in a Prognostic Cloud Fraction Scheme. Monthly Weather Review 2001, 129, 1750–1753. [Google Scholar] [CrossRef]
- Shimpo, A.; Kanamitsu, M.; Iacobellis, S.F. Comparison of Four Cloud Schemes in Simulating the Seasonal Mean Field Forced by the Observed Sea Surface Temperature. Monthly Weather Review 2008, 136, 2557–2575. [Google Scholar] [CrossRef]
- Park, R.-S.; Chae, J.-H.; Hong, S.-Y. A revised prognostic cloud fraction scheme in a global forecasting system. Monthly Weather Review 2016, 144, 1219–1229. [Google Scholar] [CrossRef]
- Schaefer, S.; Hogan, R.; Rieger, D.; Koehler, M.; Ahlgrimm, M.; Ukkonen, P. Improvements in radiation, gas and cloud parametrization in ICON with ecRad. ICCARUS 2023. Book of Abstracts, 2023, 23. (https://go.dwd-nextcloud.de/index.php/s/cGZw9B35N8W8njF ?dir=undefinedpath=%2FTuesdayopenfile=68207; accessed on 14 October 2023).
- Park, S.; Bretherton, C.S.; Rasch, P.J. Integrating cloud processes in the Community Atmosphere Model, Version 5. Journal of Climate 2014, 27, 6821–6856. [Google Scholar] [CrossRef]
- Li, J.; Huang, J.; Wang, T.; Lv, Q.; Jin, H. A global survey of cloud overlap based on CALIPSO and CloudSat measurements. Atmospheric Chemistry and Physics 2015, 15, 519–536. [Google Scholar] [CrossRef]
- Dupuy, F.; Mestre, O.; Serrurier, M.; Burda, K.V.; Zamo, M.; Citlali, N.; et al.; 2021 ARPEGE Cloud Cover Forecast Postprocessing with Convolutional Neural Network. Weather and Forecasting 2021, 36, 567–586. [Google Scholar] [CrossRef]
- Baran, A.; Lerch, S.; El Ayari, M.; Baran, S. Machine learning for total cloud cover prediction. Neural Computing and Applications 2021, 33, 2605–2620. [Google Scholar] [CrossRef]
- Prill, F.; Reinert, D.; Rieger, D.; Zängl, G. ICON Tutorial. Working with the ICON Model, Deutscher Wetterdienst: Offenbach, Germany, 2023: 272 pp. [CrossRef]
- Muench, S.; Lohmann, U. Developing a Cloud Scheme With Prognostic Cloud Fraction and Two Moment Microphysics for ECHAM-HAM. Journal of Advances in Modeling Earth Systems 2020, 12, 1–37. [Google Scholar] [CrossRef]
- Khain, P.; Shpund, J.; Levi. , Y.; Khain, A. Warm-phase spectral-bin microphysics in ICON: reasons of sensitivity to aerosols. Atmospheric Research 2022, 279, 106388. [Google Scholar] [CrossRef]
- Rothenberg, D.; Avramov, A.; Wang, C. On the representation of aerosol activation and its influence on model-derived estimated of the aerosol indirect effect. Atmospheric Chemistry and Physics 2018, 18, 7961–7983. [Google Scholar] [CrossRef]
- Tontilla, J.; O’Connor, E.J.; Niemelae, S.; Raeisaenen, P.; Jaervinen, H. Cloud base vertical velocity statistics: a comparison between an atmospheric mesoscale model and remote sensing observations. Atmospheric Chemistry and Physics 2011, 11, 9207–9218. [Google Scholar] [CrossRef]
- Malavelle, F. F.; Haywood, J. M.; Field, P. R.; Hill, A. A.; Abel, S. J.; Lock, A. P.; et al. A method to represent subgrid-scale updraft velocity in kilometer-scale models: Implication for aerosol activation. Journal of Geophysical Research: Atmospheres 2014, 119, 4149–4173. [Google Scholar] [CrossRef]
- Khain, A.; Pokrovsky, A.; Pinsky, M.; Seifert, A.; Phillips, V. Simulation of effects of atmospheric aerosols on deep turbulent convective clouds using a spectral microphysics mixed-phase cumulus cloud model. Part I: Model description and possible applications. Journal of the Atmospheric Sciences 2004, 124, 2963–2982. [Google Scholar] [CrossRef]
- Van Weverberg, K.; Morcette C., J. Sensitivity of cloud-radiative effects to cloud fraction parametrizations in tropical, midlatitude, and arctic kilometer-scale simulations. Quarterly Journal of the Royal Meteorological Society 2022, 148, 2563–2586. [Google Scholar] [CrossRef]
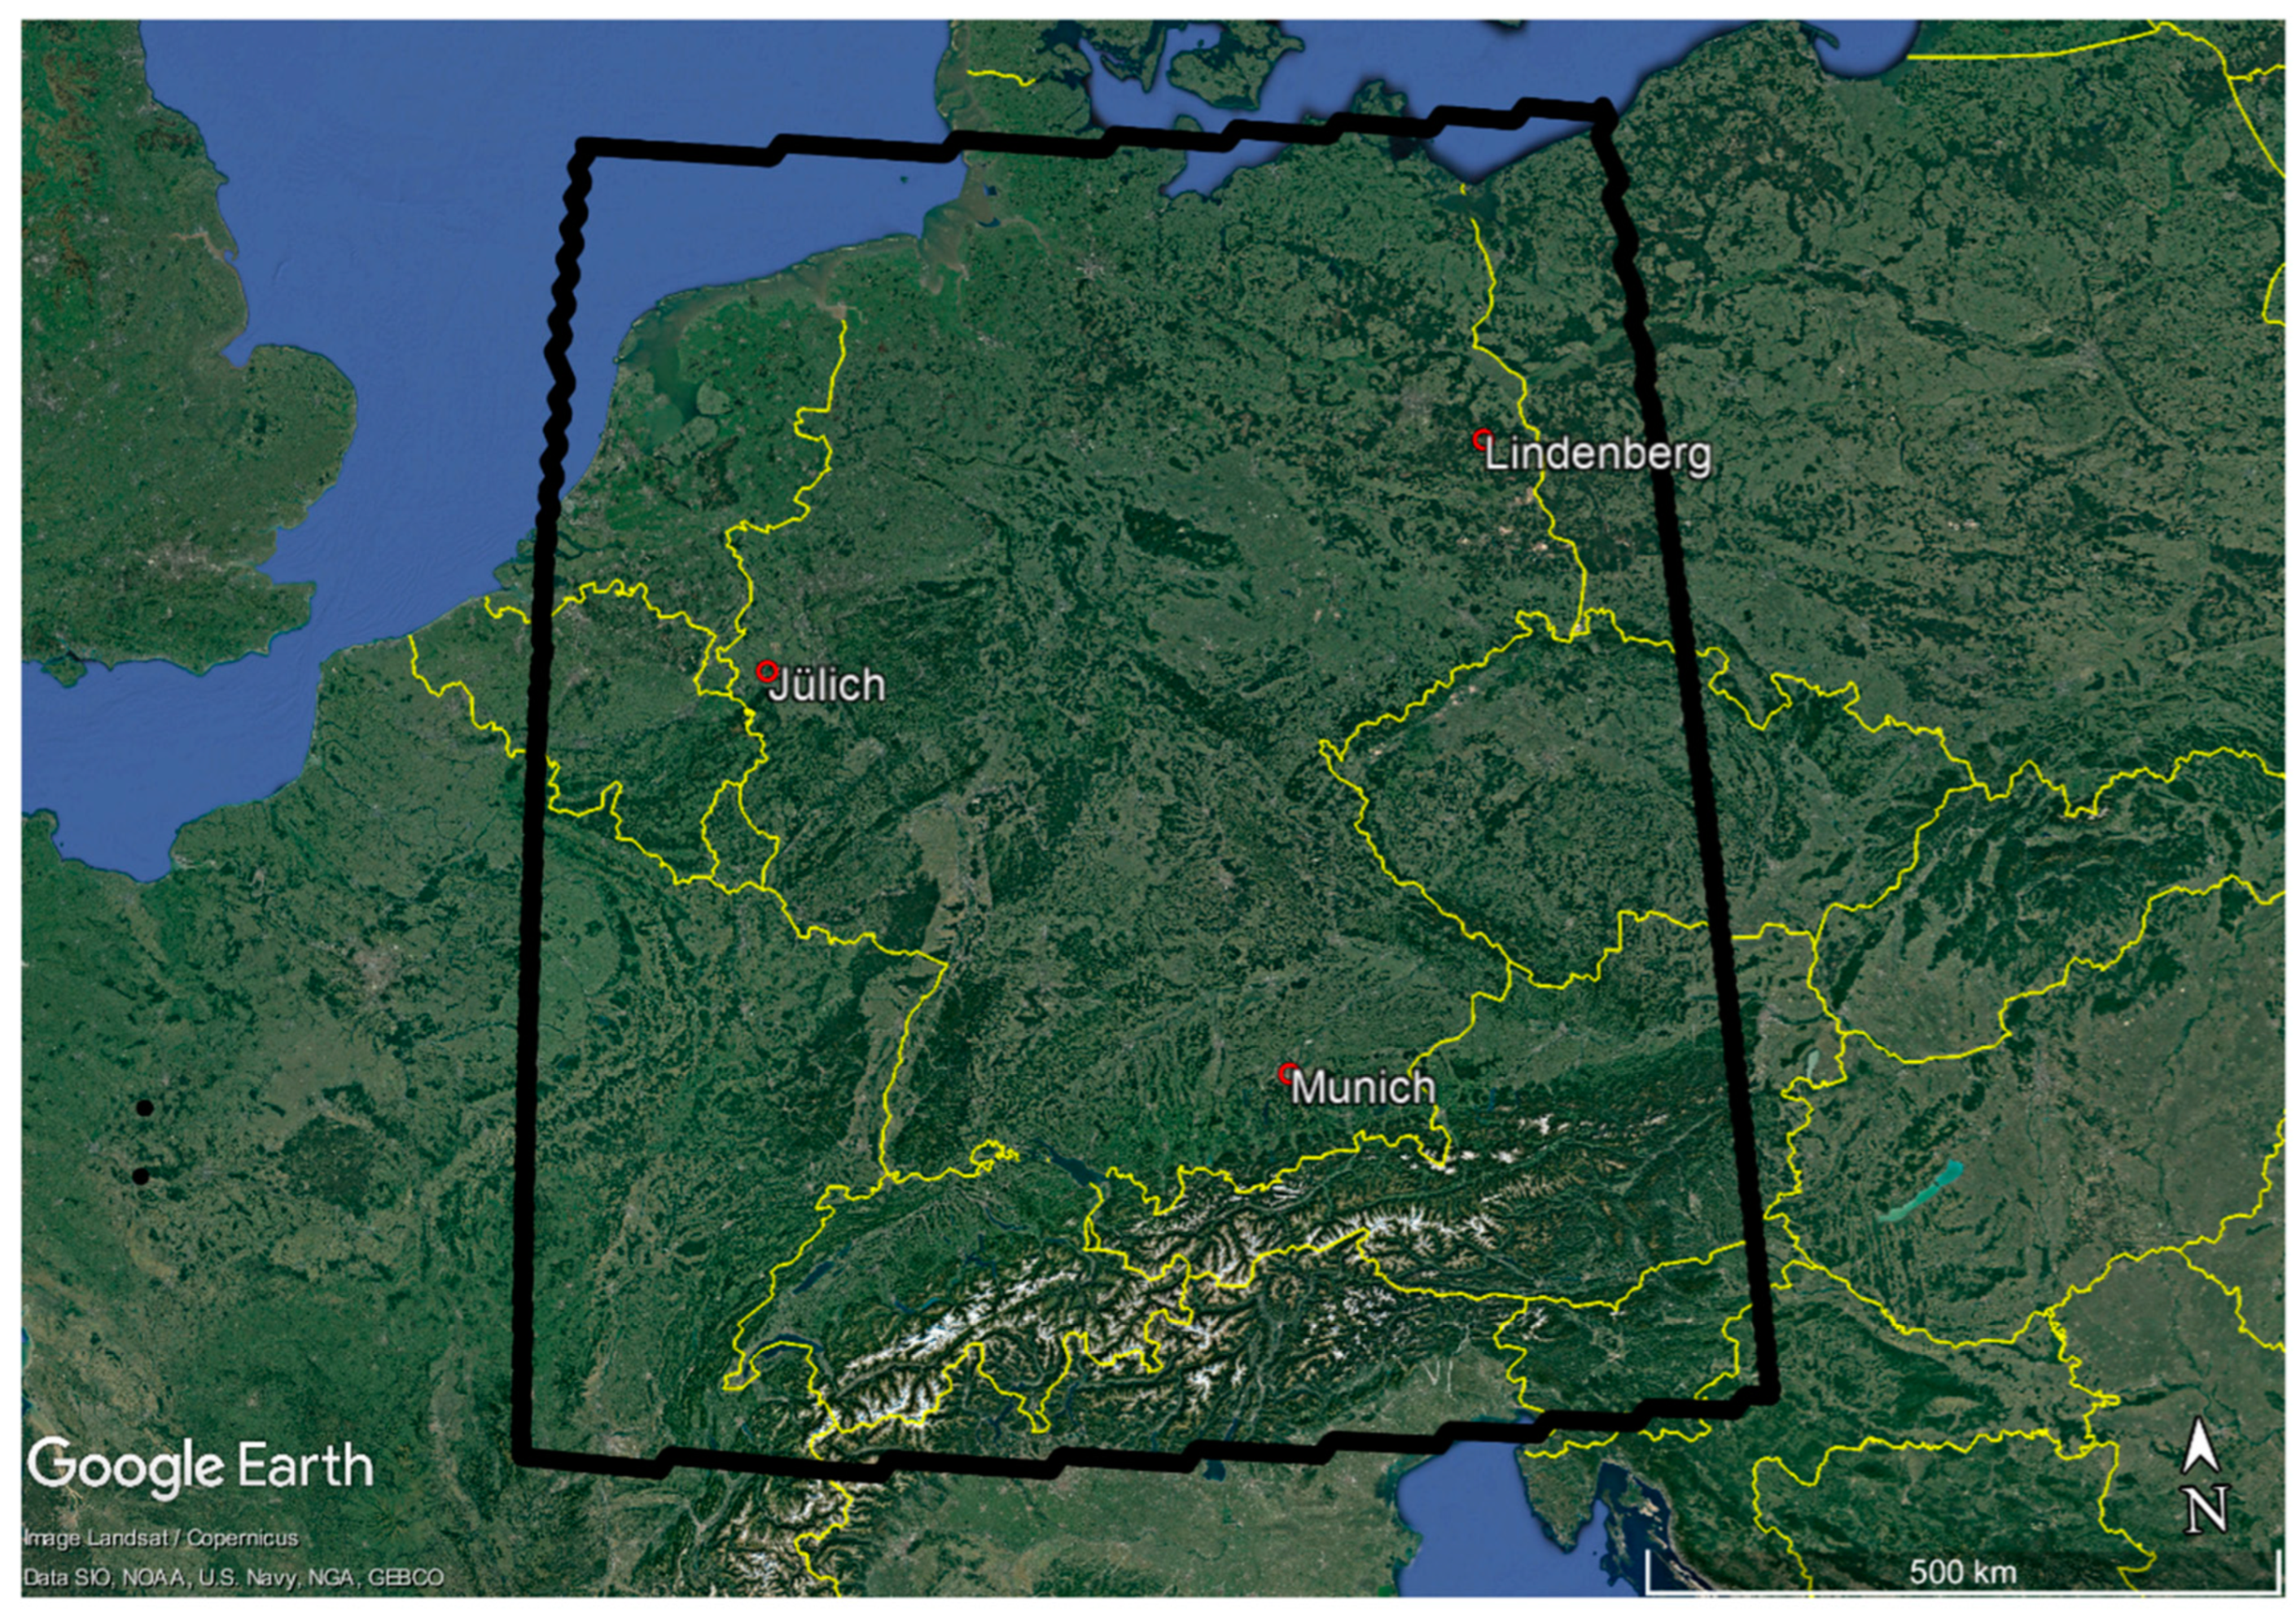
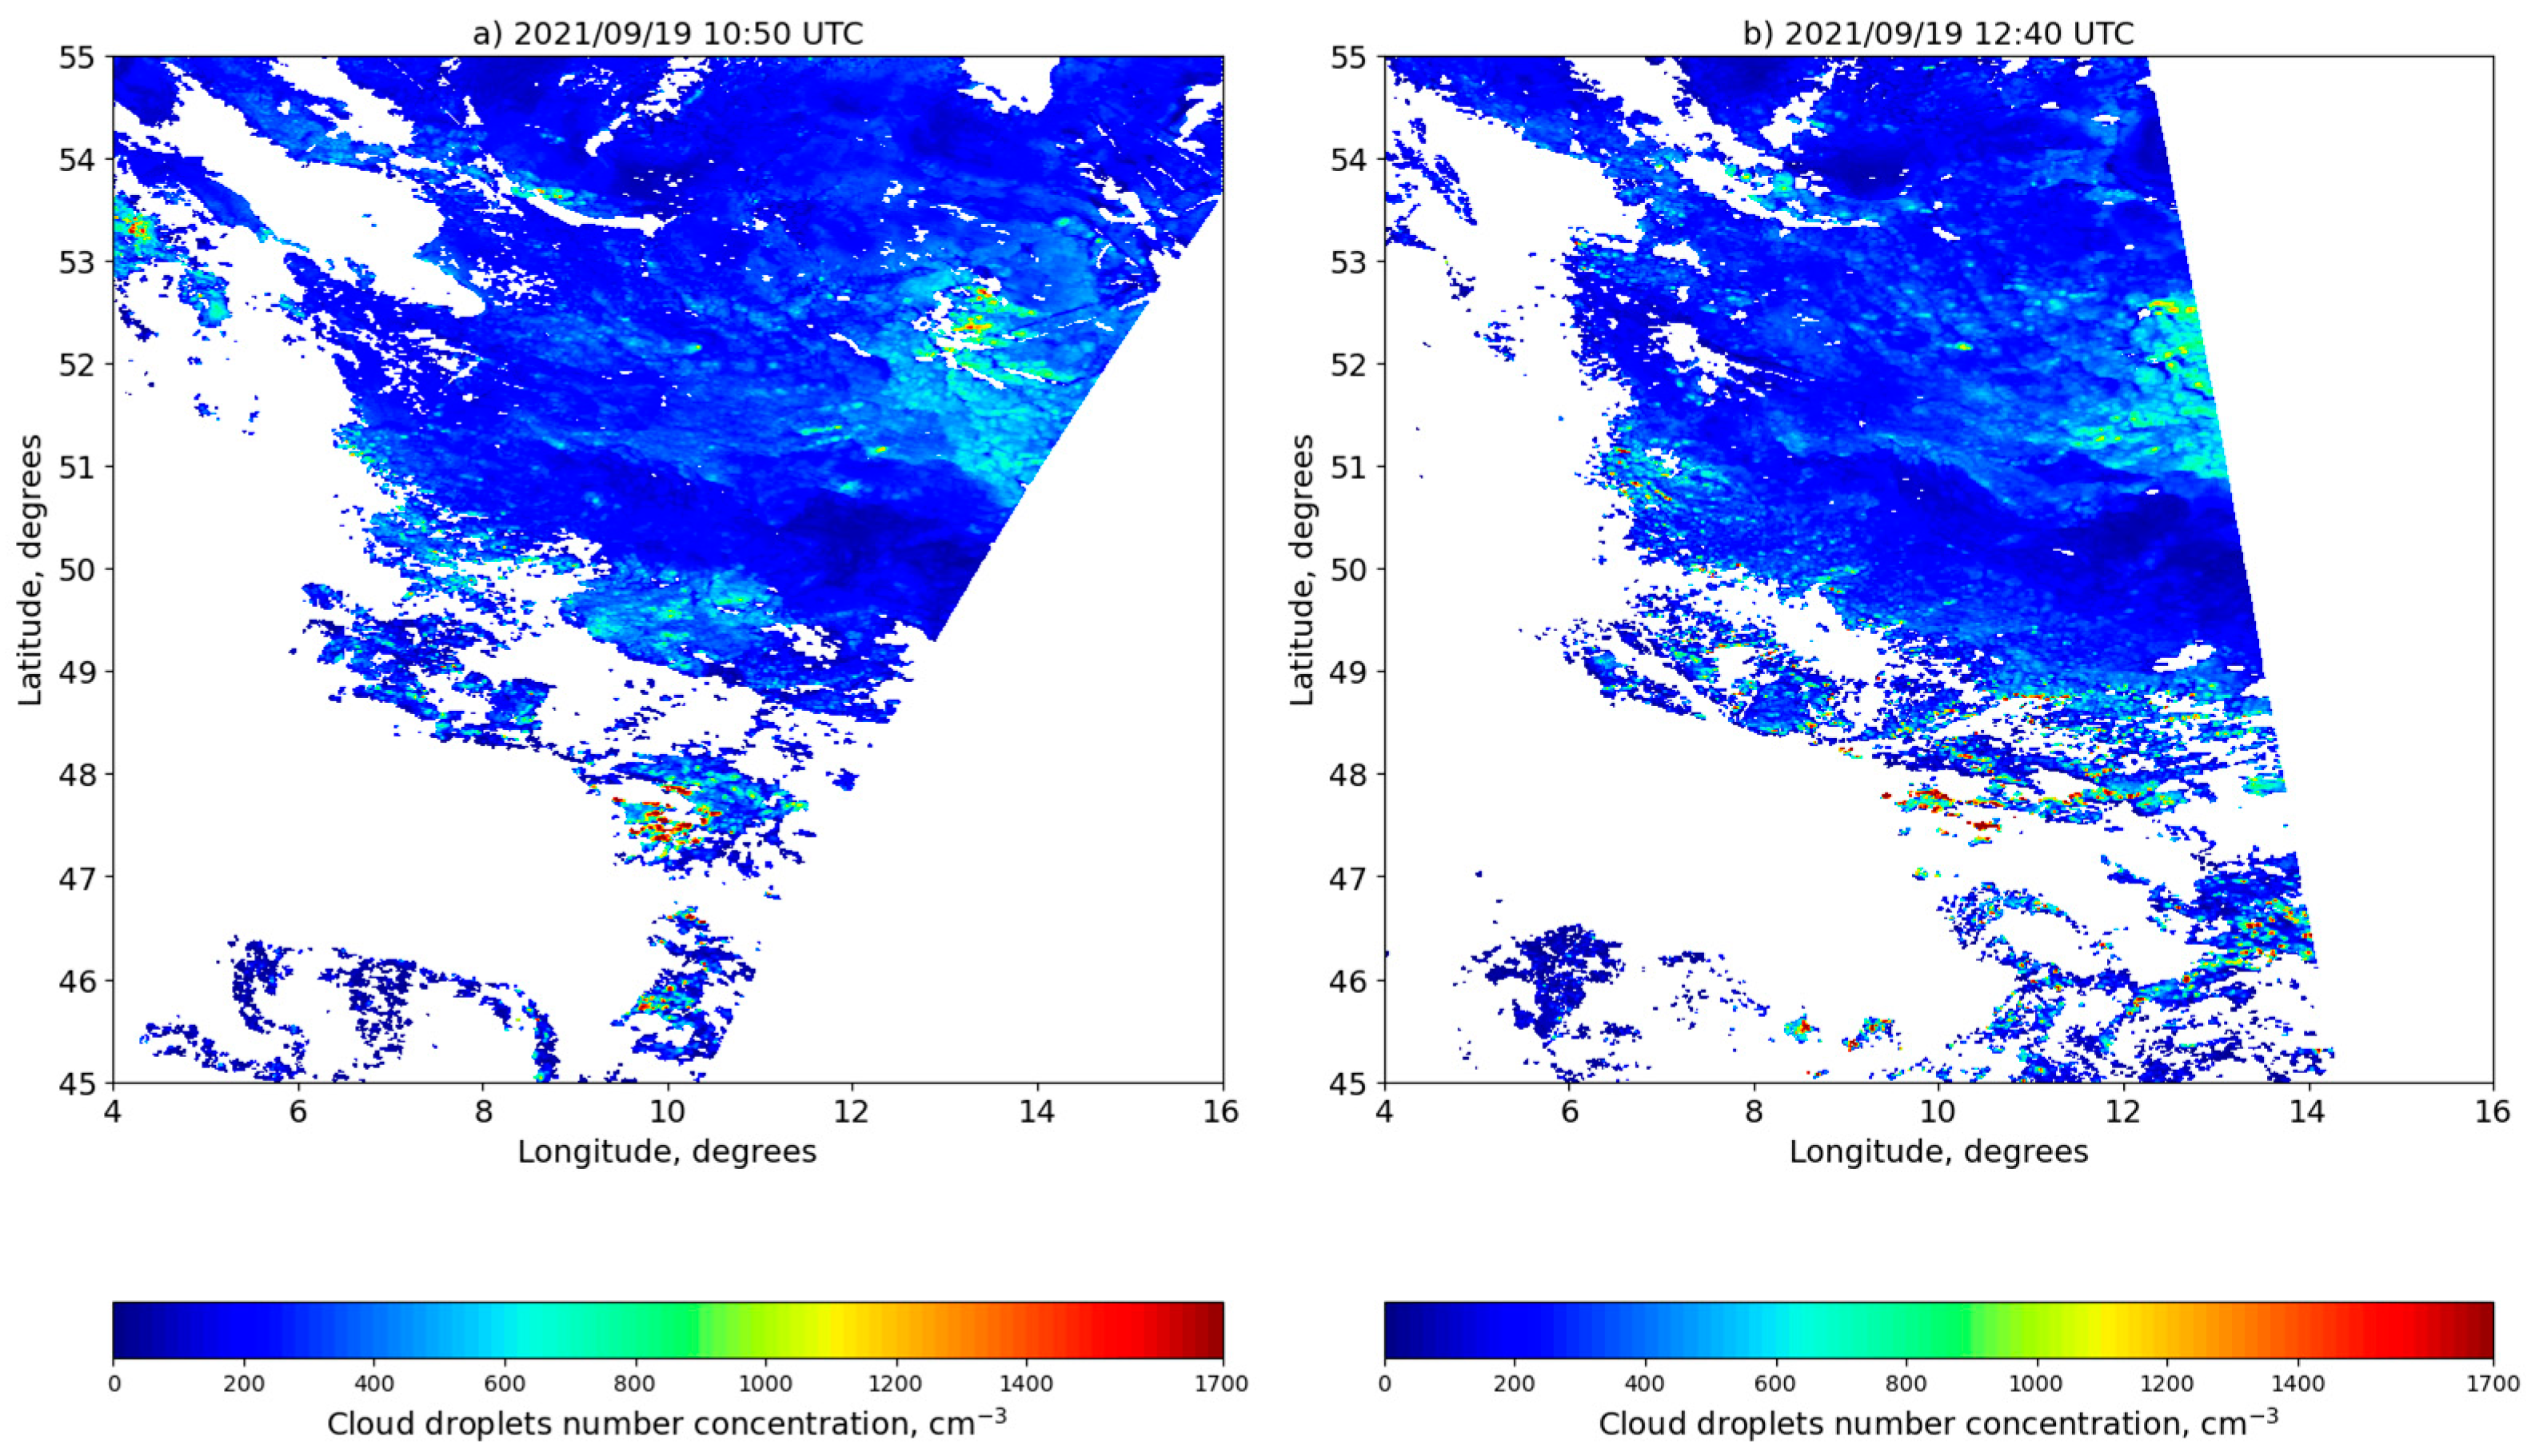
| Source | Data spatial and temporal resolution | Name | Quantiles | Number | Measurement error | ||
|---|---|---|---|---|---|---|---|
| 25% | 50% | 75% | |||||
| CLOUDNET | 30 sec | Liquid water content (LWC), g/m3 | 0.04 | 0.10 | 0.24 | 116206 | 1.7 dBZ |
| Liquid water path (LWP), g/m2 | 57 | 106 | 219 | 3670 | 48 g/m2 | ||
| Ice water content, g/m3 | 0.0008 | 0.004 | 0.012 | 93008 | 1.7 dBZ | ||
| MODIS | 5 min, 1 km |
LWP, g/m2 | 46 | 99 | 208 | 622 335 910 | 19% |
| Droplets effective radius (Reff), um | 11 | 15 | 23 | 8% | |||
| Cloud optical thickness (COT) | 5 | 10 | 20 | 9% | |||
| BSRN | 10 min | Global solar irradiance (Q), W/m2 | 140 | 225 | 350 | 2123 | 2% (5 W/m2) |
| Diffuse solar irradiance (D), W/m2 | 129 | 191 | 287 | 2% (3 W/m2) | |||
| Median value / interquartile range / average value, g/m2 | ||||
|---|---|---|---|---|
| Liquid water path source | Jülich | Lindenberg | Munich | All sites |
| CLOUDNET | 106 / 152 / 151 | 89 / 112 / 127 | 118 / 202 / 215 | 102 / 139 / 147 |
| ICON grid-scale | 21 / 129 / 92 | 32 / 76 / 65 | 89 / 99 / 107 | 35 / 101 / 79 |
| ICON total | 53 / 157 / 108 | 53 / 67 / 69 | 93 / 81 / 112 | 61 / 85 / 88 |
| Number of cases | 121 | 201 | 53 | 375 |
Disclaimer/Publisher’s Note: The statements, opinions and data contained in all publications are solely those of the individual author(s) and contributor(s) and not of MDPI and/or the editor(s). MDPI and/or the editor(s) disclaim responsibility for any injury to people or property resulting from any ideas, methods, instructions or products referred to in the content. |
© 2023 by the authors. Licensee MDPI, Basel, Switzerland. This article is an open access article distributed under the terms and conditions of the Creative Commons Attribution (CC BY) license (http://creativecommons.org/licenses/by/4.0/).


