1. Introduction
UAVs offer numerous advantages, such as strong maneuverability, low maintenance costs, vertical takeoff ability, and impressive hovering capabilities. As a result, they are widely used in various fields, including search and rescue, exploration, disaster monitoring, inspection, and agriculture [
1,
2,
3,
4]. However, limitations on payload and flight time significantly restrict the range of UAV missions. Therefore, it is essential to develop fully autonomous multi-rotor UAVs that can collaborate with ground-based robots to perform more complex tasks [
5,
6]. It is also fraught with considerable challenges. In this case, especially during the takeoff and landing phases, high-precision vehicle position and attitude estimation and motion planning are required [
7,
8].
In recent years, scholars globally have extensively researched UAV tracking [
9,
10] and landing techniques [
11]. For instance, identifying safe landing locations using visual cues following a severe UAV malfunction [
12]. Landing an UAV on an unmanned vessel is a challenging problem [
13,
14,
15]. The fluctuating water surface causes unpredictable changes in the position and attitude of the unmanned vessel. Landing the UAV on the UGV can give the UGV system the ability to work in three-dimensional space, and carrying the charging module on the UGV can solve the limitations of payload and flight time on the working range of the UAV, but it places high requirements on the accuracy of the drone landing [
16,
17,
18,
19]. The position and attitude of a UAV is estimated during the landing process, but the position and attitude of today's UAVs are typically measured by inertial measurement units (IMUs) and Global Positioning System(GPS) [
20]. However, the positioning accuracy of GPS is low, and it is not possible to use GPS positioning indoors or in places with a lot of cover. IMUs have the problem of accumulating errors in long-term positioning, making it difficult to perform high-precision tasks such as landing. Therefore, the selection of sensors is particularly important when the UAV performs the landing mission. Laser sensors can provide accurate distance information, accurately calculate the relative position and attitude relationship between the UAV and the landing landmark, and are used in the UAV landing mission [
14]. However, laser sensors are expensive, require a large amount of data, and have high platform requirements, making them unsuitable for mounting on small multi-rotor UAVs.
With the advantages of easy maintenance, low price, miniaturization, light weight and low power consumption, vision sensors are widely used in various intelligent robots. With the development of technology, UAV visual localization can provide precise position and angle information, which can meet the accuracy requirements of UAV landing guidance. However, accurate landmark recognition is a challenge, and edge detection algorithms [
21,
22] and deep learning methods [
19] are commonly used. These methods are computationally intensive, poorly portable, and deep learning also requires large amounts of data. Optical flow is also a promising solution for autonomous landing missions [
23], but it is less stable as it is highly dependent on the environment.
During UAV landings, as the visual sensor approaches the landing landmark, there is a potential for loss of global and relative position and attitude information, resulting in decreased landing precision or even failure. Therefore, a precise landmark must be designed to steer the UAV towards a successful landing. The use of ArUco marker is a common method for guiding UAV landings [
17,
18,
19]. When utilizing an ArUco marker for UAV landing guidance, the global information of the marker is forfeited when the UAV landmarks are in close proximity. As a result, nested ArUco markers or ArUco marker matrices are commonly implemented to ensure the precision of the low altitude relative positions and attitudes of the UAV during landing.
The paper's primary contribution is the development of dynamic tracking and landing control strategies for UAV and the optimization of landmark structure and dimensions to obtain the best possible landmark parameters. By relying solely on vision to achieve dynamic tracking and precise landing of UAV, an experimental platform for indoor UAV tracking and landing was established. The UAV tracking performance was validated by tracing three different trajectories of the unmanned ground vehicle (UGV) at varying speeds, while the landing precision of the UAV was confirmed through both static and dynamic landing experiments.
2. Materials and Methods
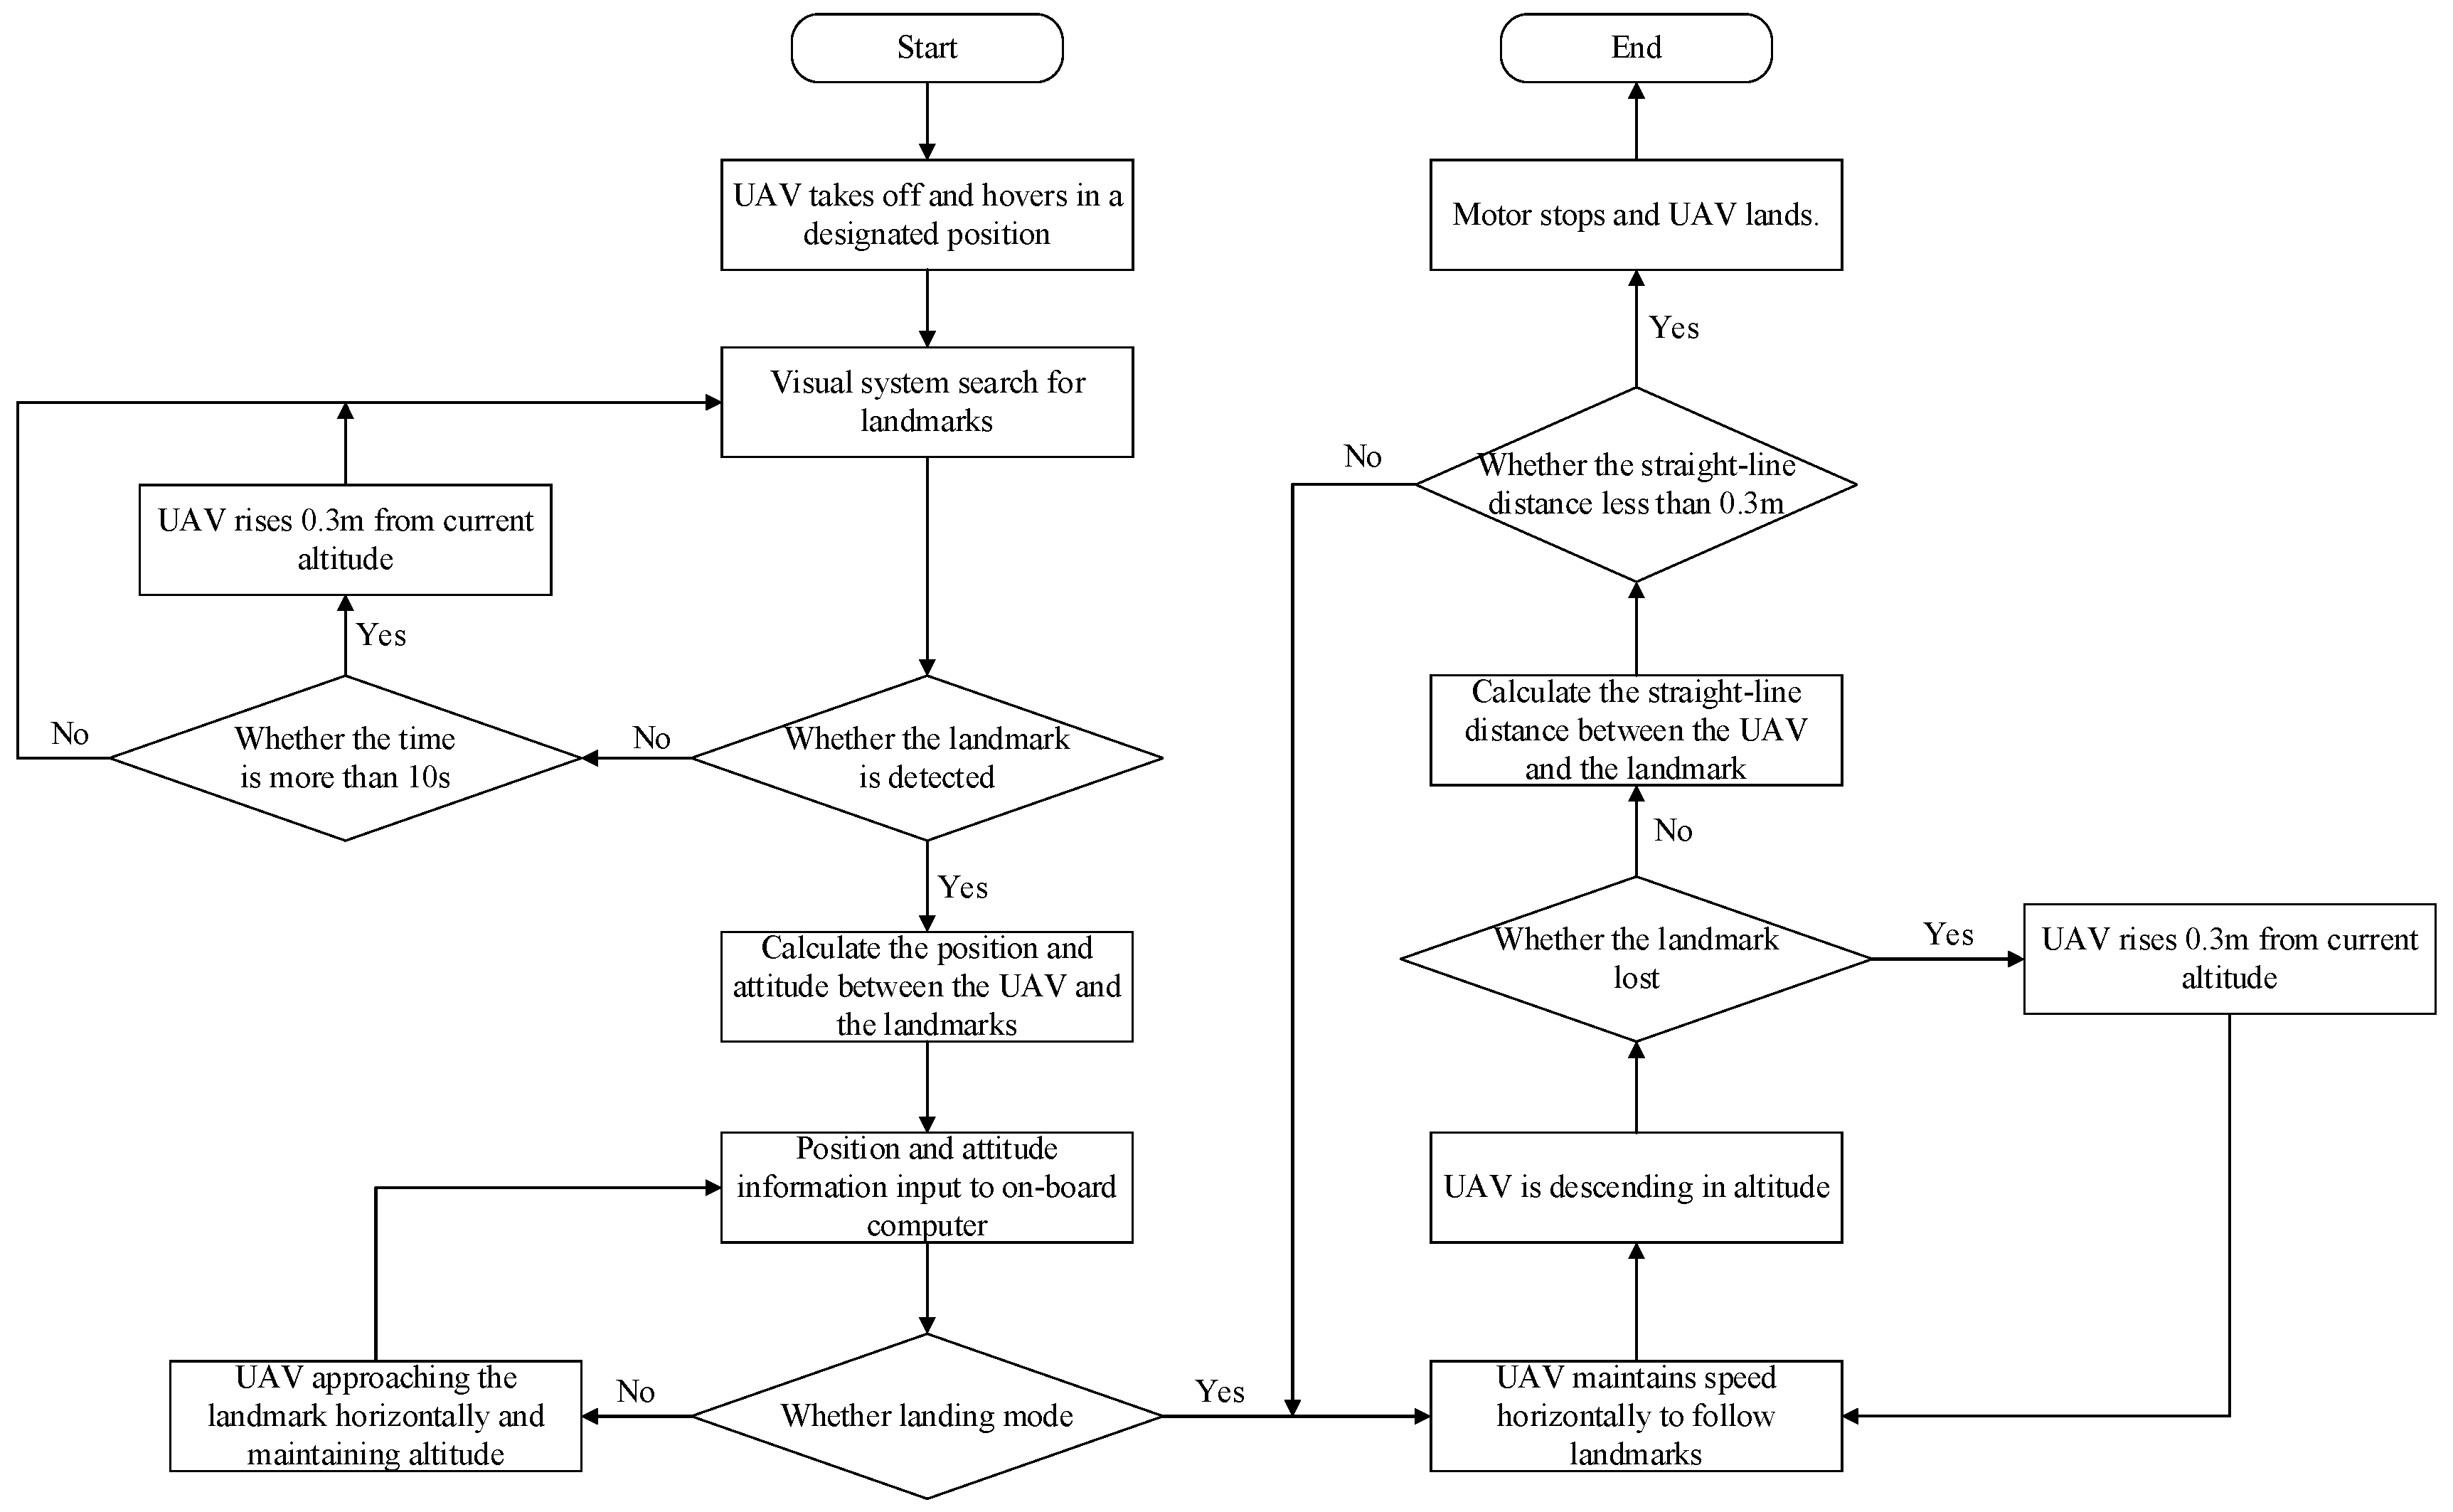
During the dynamic tracking and landing of the UAV, the state of the UAV is categorized into a tracking mode and a landing mode based on the relative position and attitude of the UAV and the landmark carried by the UGV (shown in
Figure 1). The UAV is operated via a control system that features both inner and outer loop structures. The inner loop attitude controller utilizes a fuzzy PID control algorithm to regulate the attitude angle and angular velocity, whereas the outer loop position controller deploys a serial PID control to manage the UAV's position. Initially, the UAV utilizes vision to gather details about the surrounding area. If a landmark is identified, the UAV calculates the relative positions and attitudes of itself and the landmark. If no landmark is detected, the UAV will automatically elevate its altitude to broaden its field of view and locate the landmark. The controller receives the relative position and attitude obtained and translates it into commands to control the UAV. In tracking mode, the UAV sends horizontal channel commands to the UAV's flight controller to steer the UAV horizontally close to landmarks for autonomous UAV tracking, maintaining the UAV's altitude to keep the target in view and adjusting the UAV's speed to keep up with the target. The UAV enters the landing mode when the relative positions and attitudes of the UAV and the landmark meet the landing conditions. In landing mode, the UAV approaches the landmark horizontally, dropping its own altitude and keeping the UGV at the same speed as the tracked target; if the target is lost, it rises to expand the field of view to bring the target back into view; if the target is not lost, it calculates the straight-line distance to the center of the landmark. When the straight-line distance is less than 0.3m, the UAV's landing command is triggered: the motor stops to land the UAV.
Using only visual information for autonomous UAV tracking and landing in GPS-less environments requires both estimating the position and attitude of the UAV itself based on visual navigation techniques, and detecting and tracking landmarks to achieve a landing. Therefore, the UAV has to carry two cameras, the first with a T265 binocular camera from Intel for localization and the second with a monocular camera for target tracking.
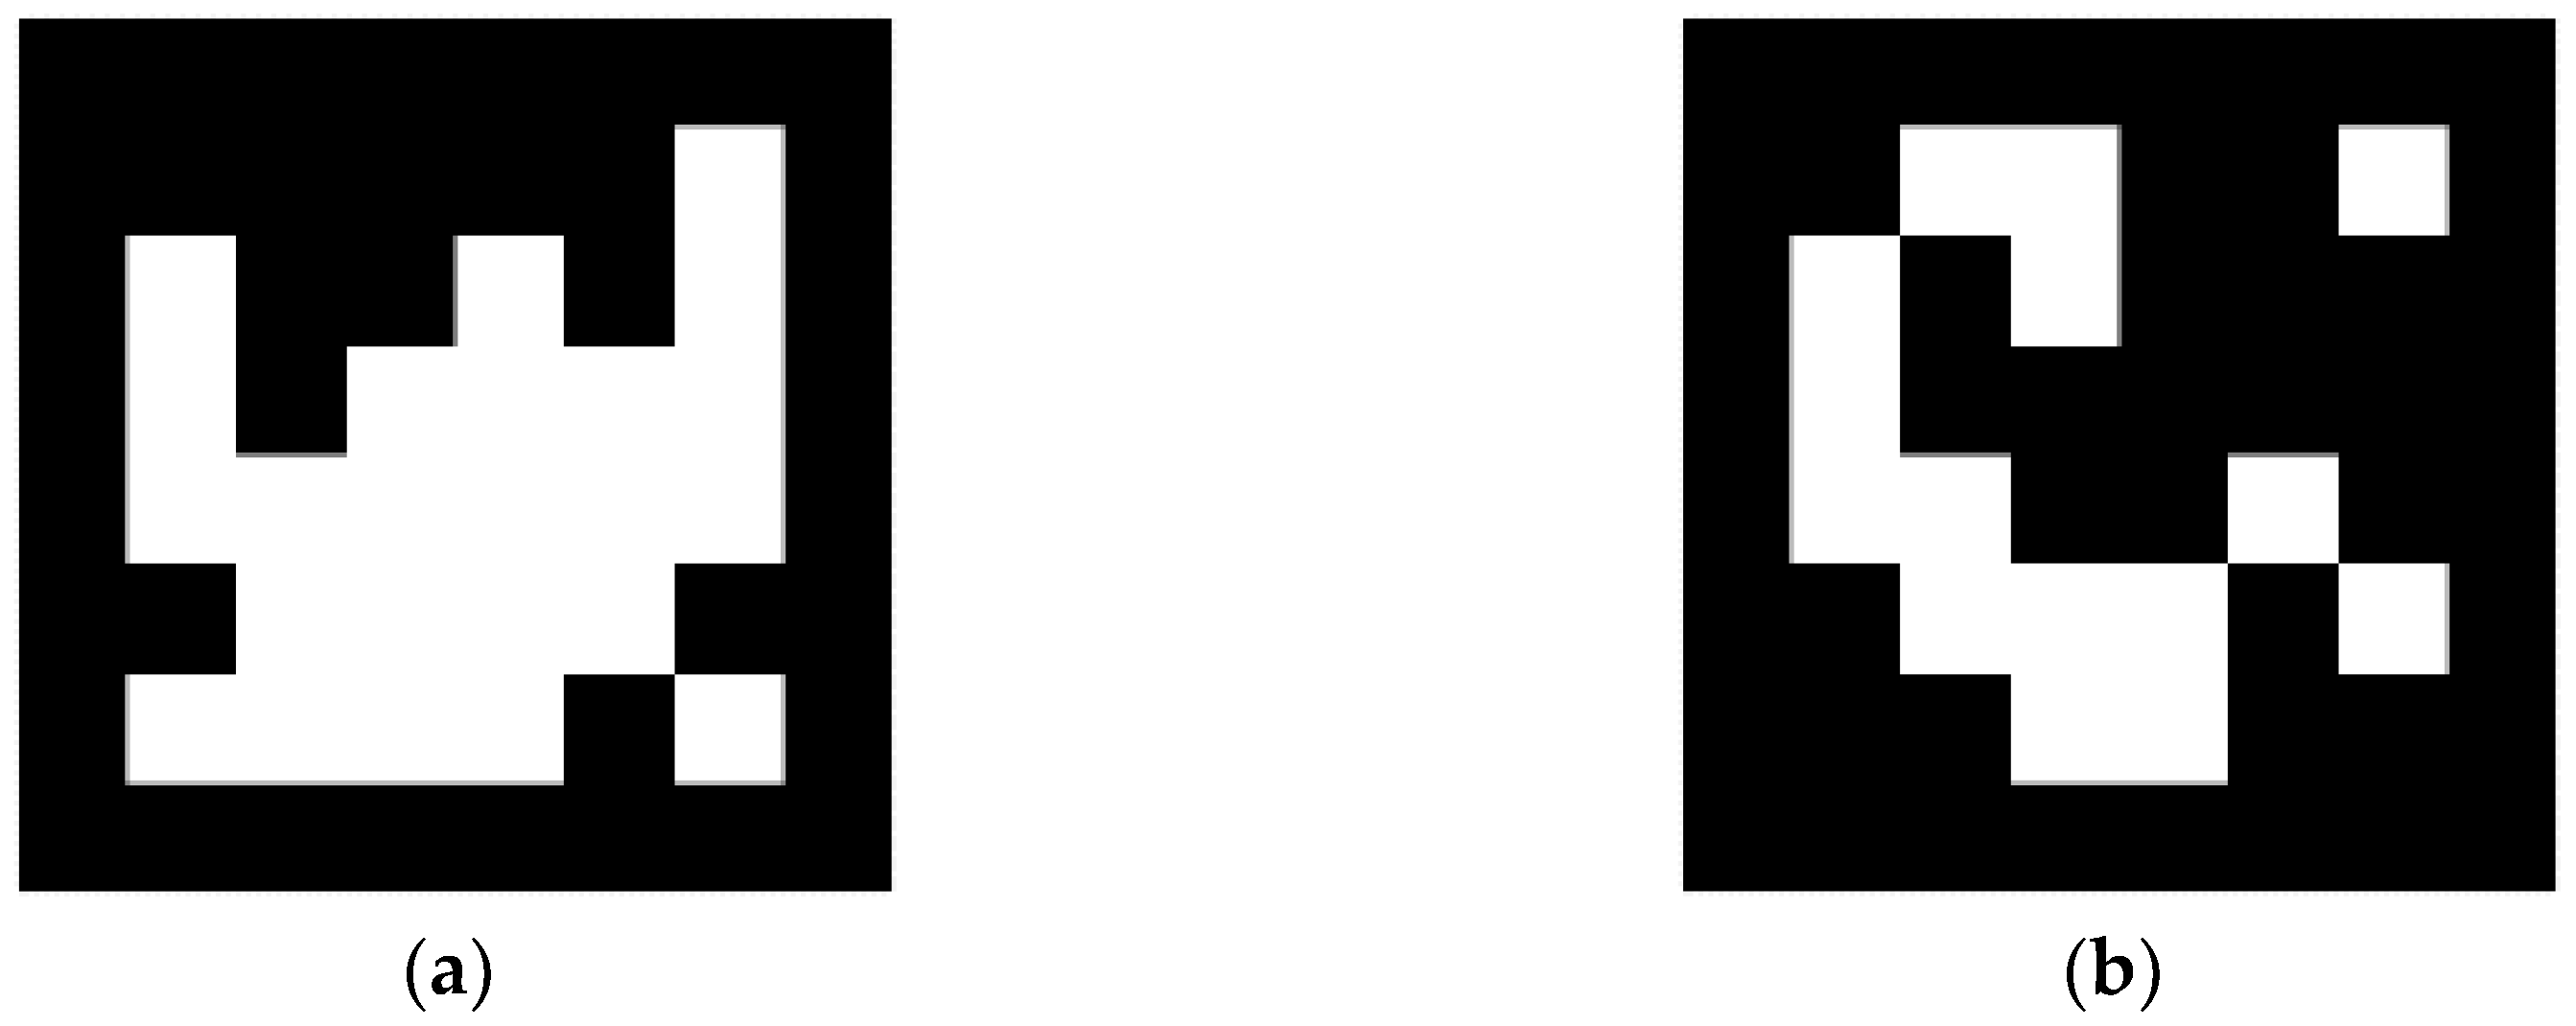
In this experimental research, we use the landmark generated by the ArUco library provided by OpenCV to guide the UAV to perform a tracking landing task. The inner and outer nested landmarks were used (shown in
Figure 2), the landmarks were parameterized, and landmark parameter optimization experiments were performed to derive the optimal landmark parameters.
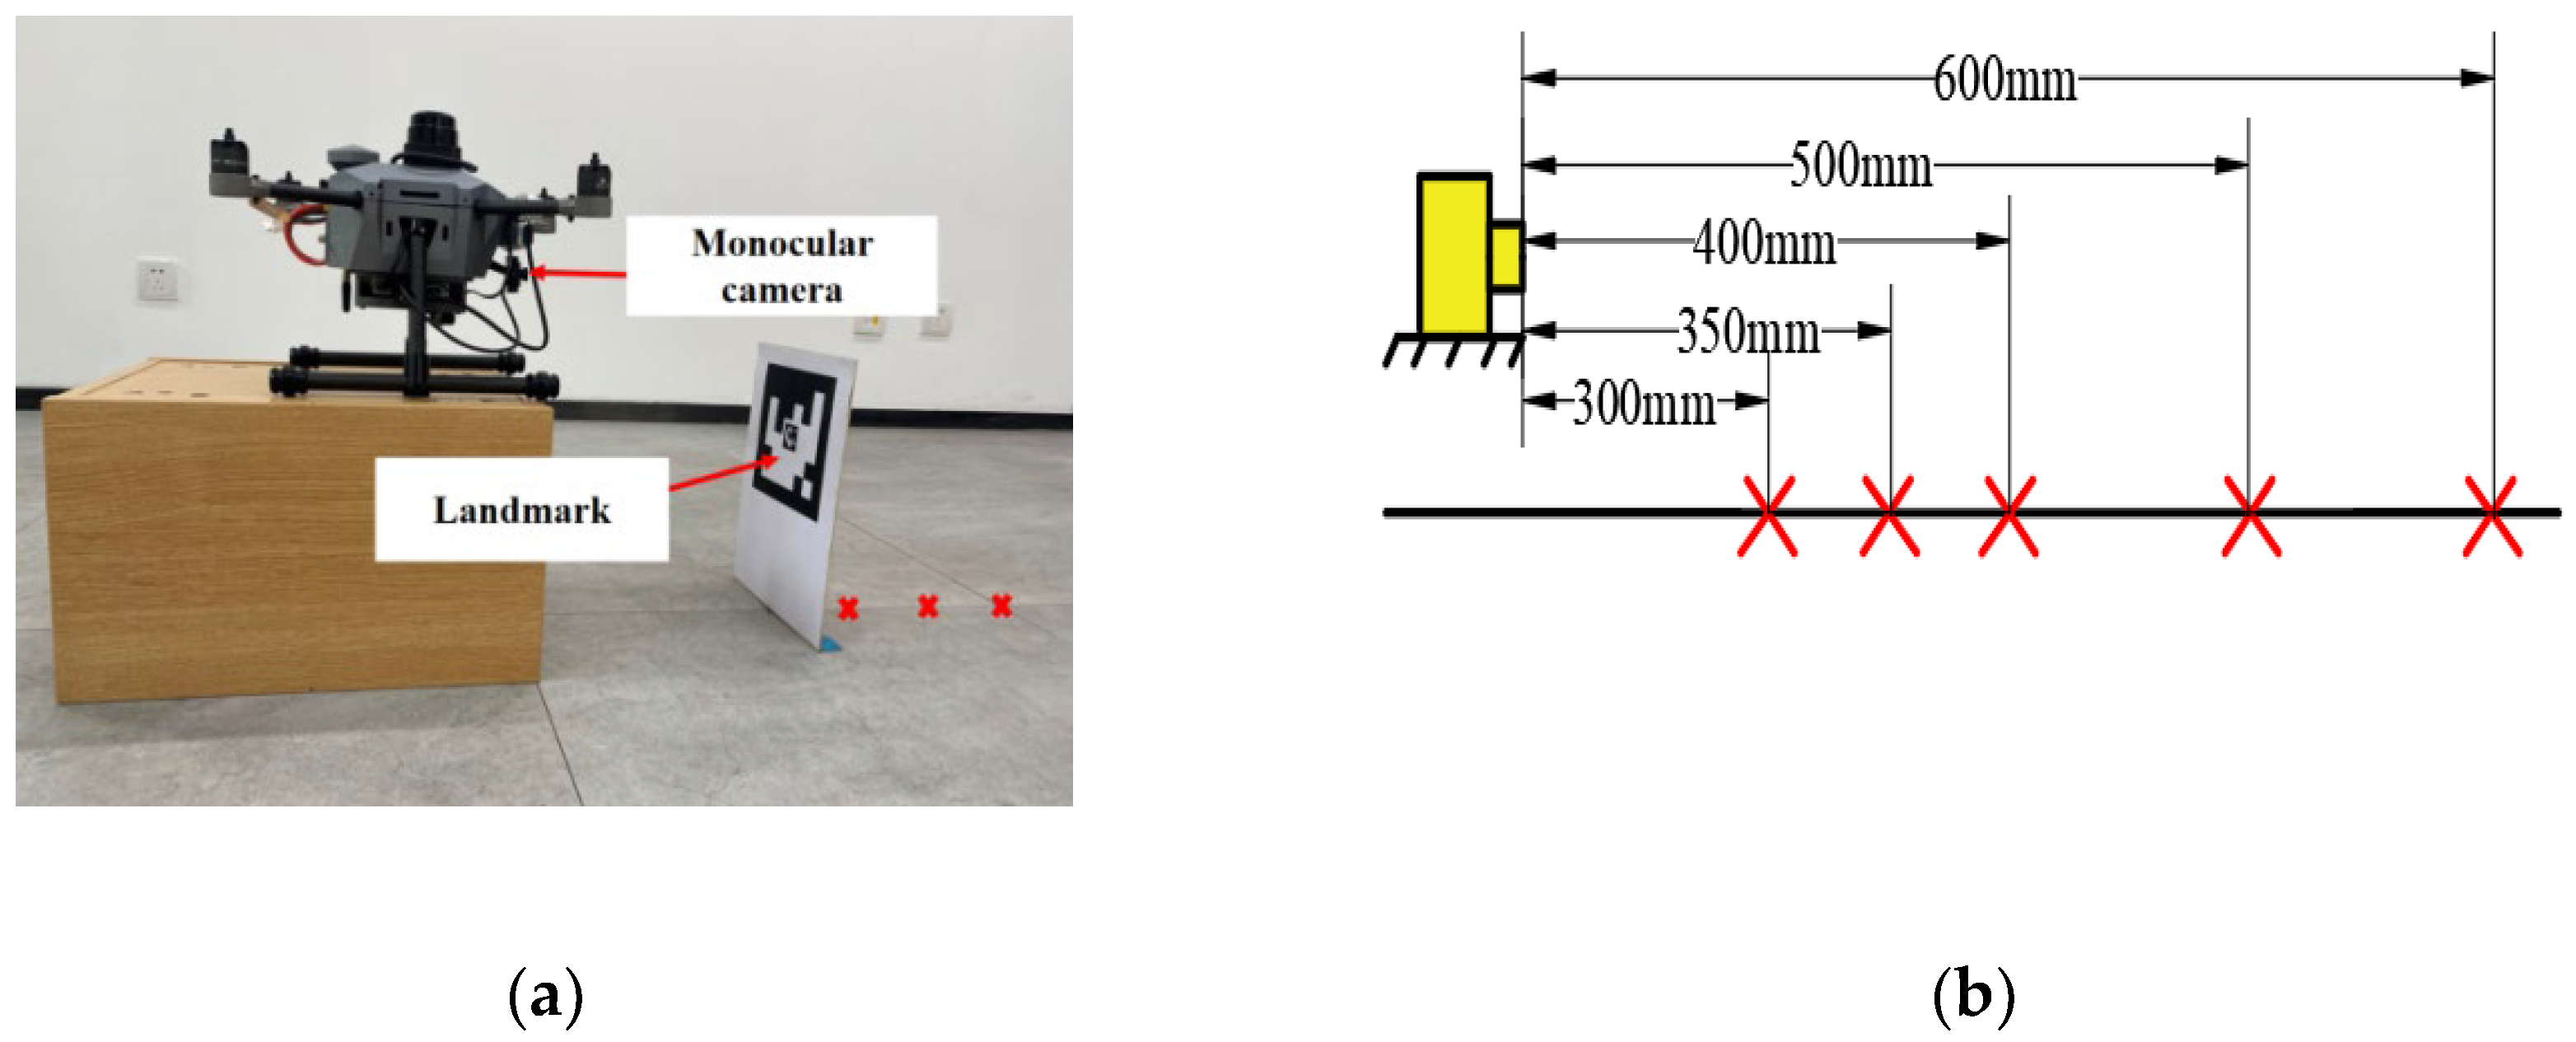
In the UAV tracking landing missions, landmark failure typically occurs at the time of touchdown. While the relative distance between the UAV and the landmark in the height direction in the landing mode is between 0.3 and 0.6m, the variation of the relative distance between the UAV and the landmark in the landmark parameter optimization experiments is therefore set in the range of 0.3 to 0.6m (shown in
Figure 3). The UAV use vision to measure the relative distance between the UAV and inner and outer markers of varying sizes. The position of the UAV does not move, changing the position of the landmark. The red "x" in the graph indicates each position of the landmark in the experiment, and the results of three experiments were recorded at each position.
Table 1 shows the estimated relative distances for inner markers of different sizes.
Table 2 shows the estimated relative distances for outer markers of different sizes. Where "-" indicates that the relative distance could not be calculated because the marker was not detected due to camera resolution issues.
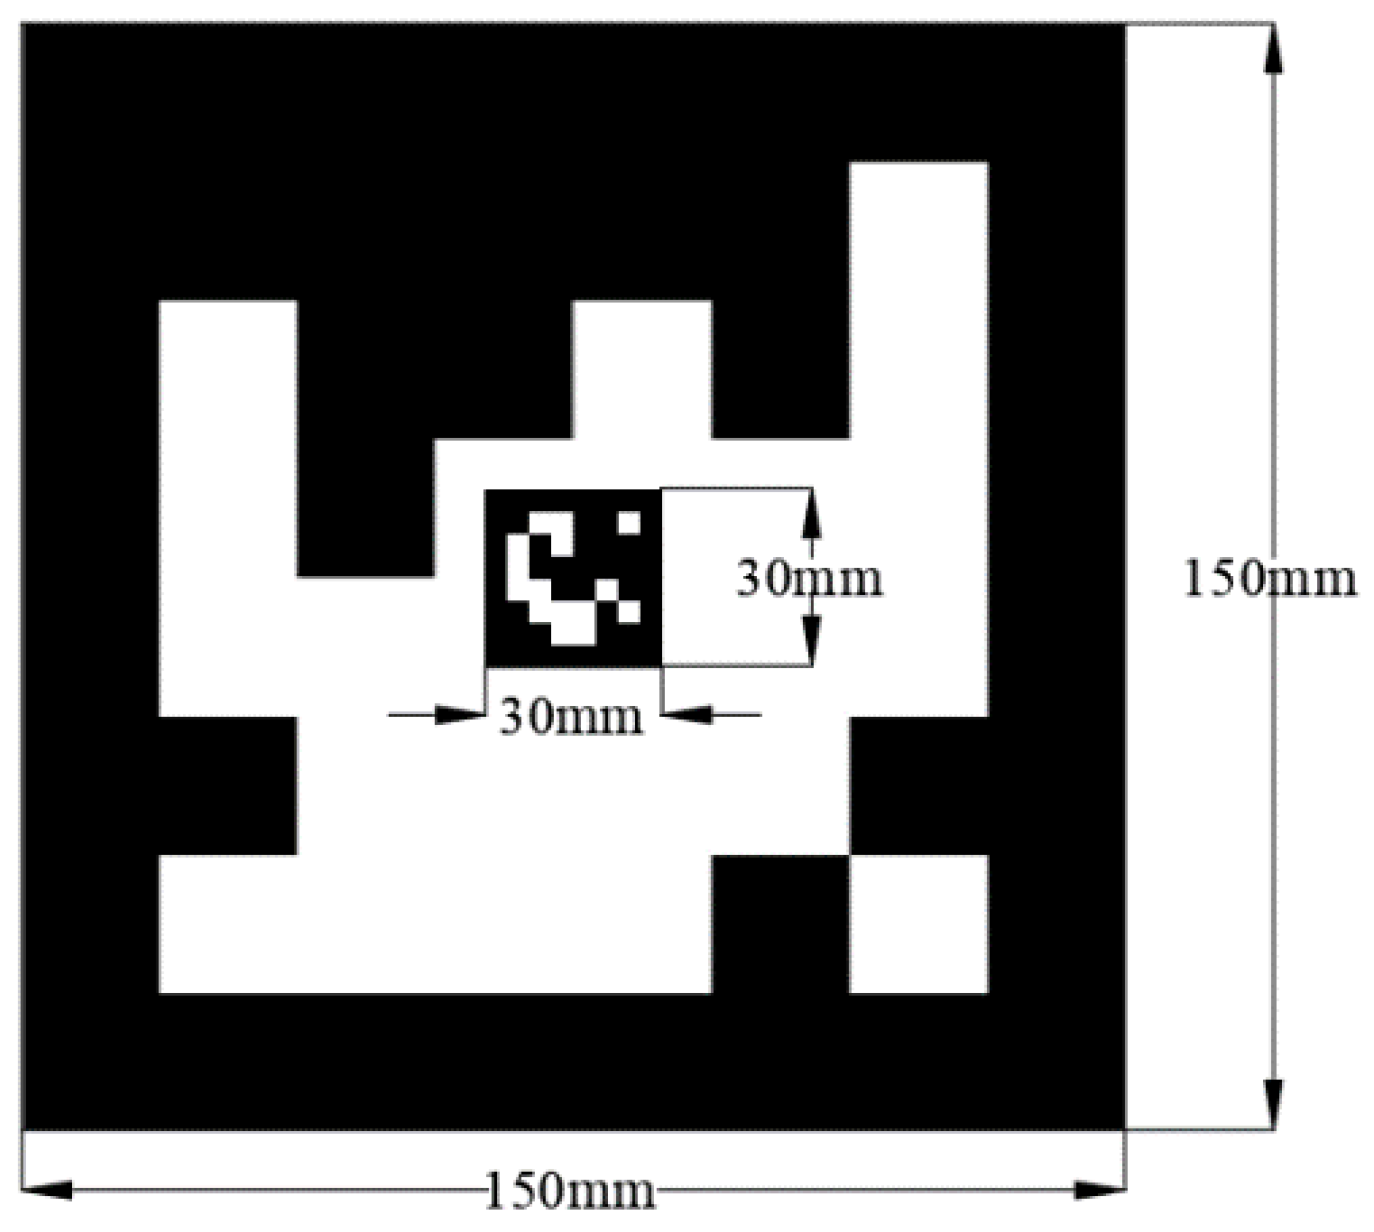
To achieve more accurate landings, it is necessary for the relative position estimation data to possess a higher level of accuracy as the distance between the UAV and the landmark decreases. Based on data in the table, the relative distance derived from the inner marker of size 30mm*30mm is closer to the actual value when the relative distance is small. Although the UAV cannot detect the inner marker measuring 30mm*30mm at long distances, it can still obtain relative position information by recognizing the outer marker, which follows the sequence of landmark recognition in real-world scenarios. Choose an outer marker with a size of 150x150mm for more precise relative position estimation at smaller distances. The optimal nested landmark parameters are then determined (shown in
Figure 4).
3. Results
Indoor flight experiments on UAV tracking landings were conducted in this research. The experimental scenario can be seen in
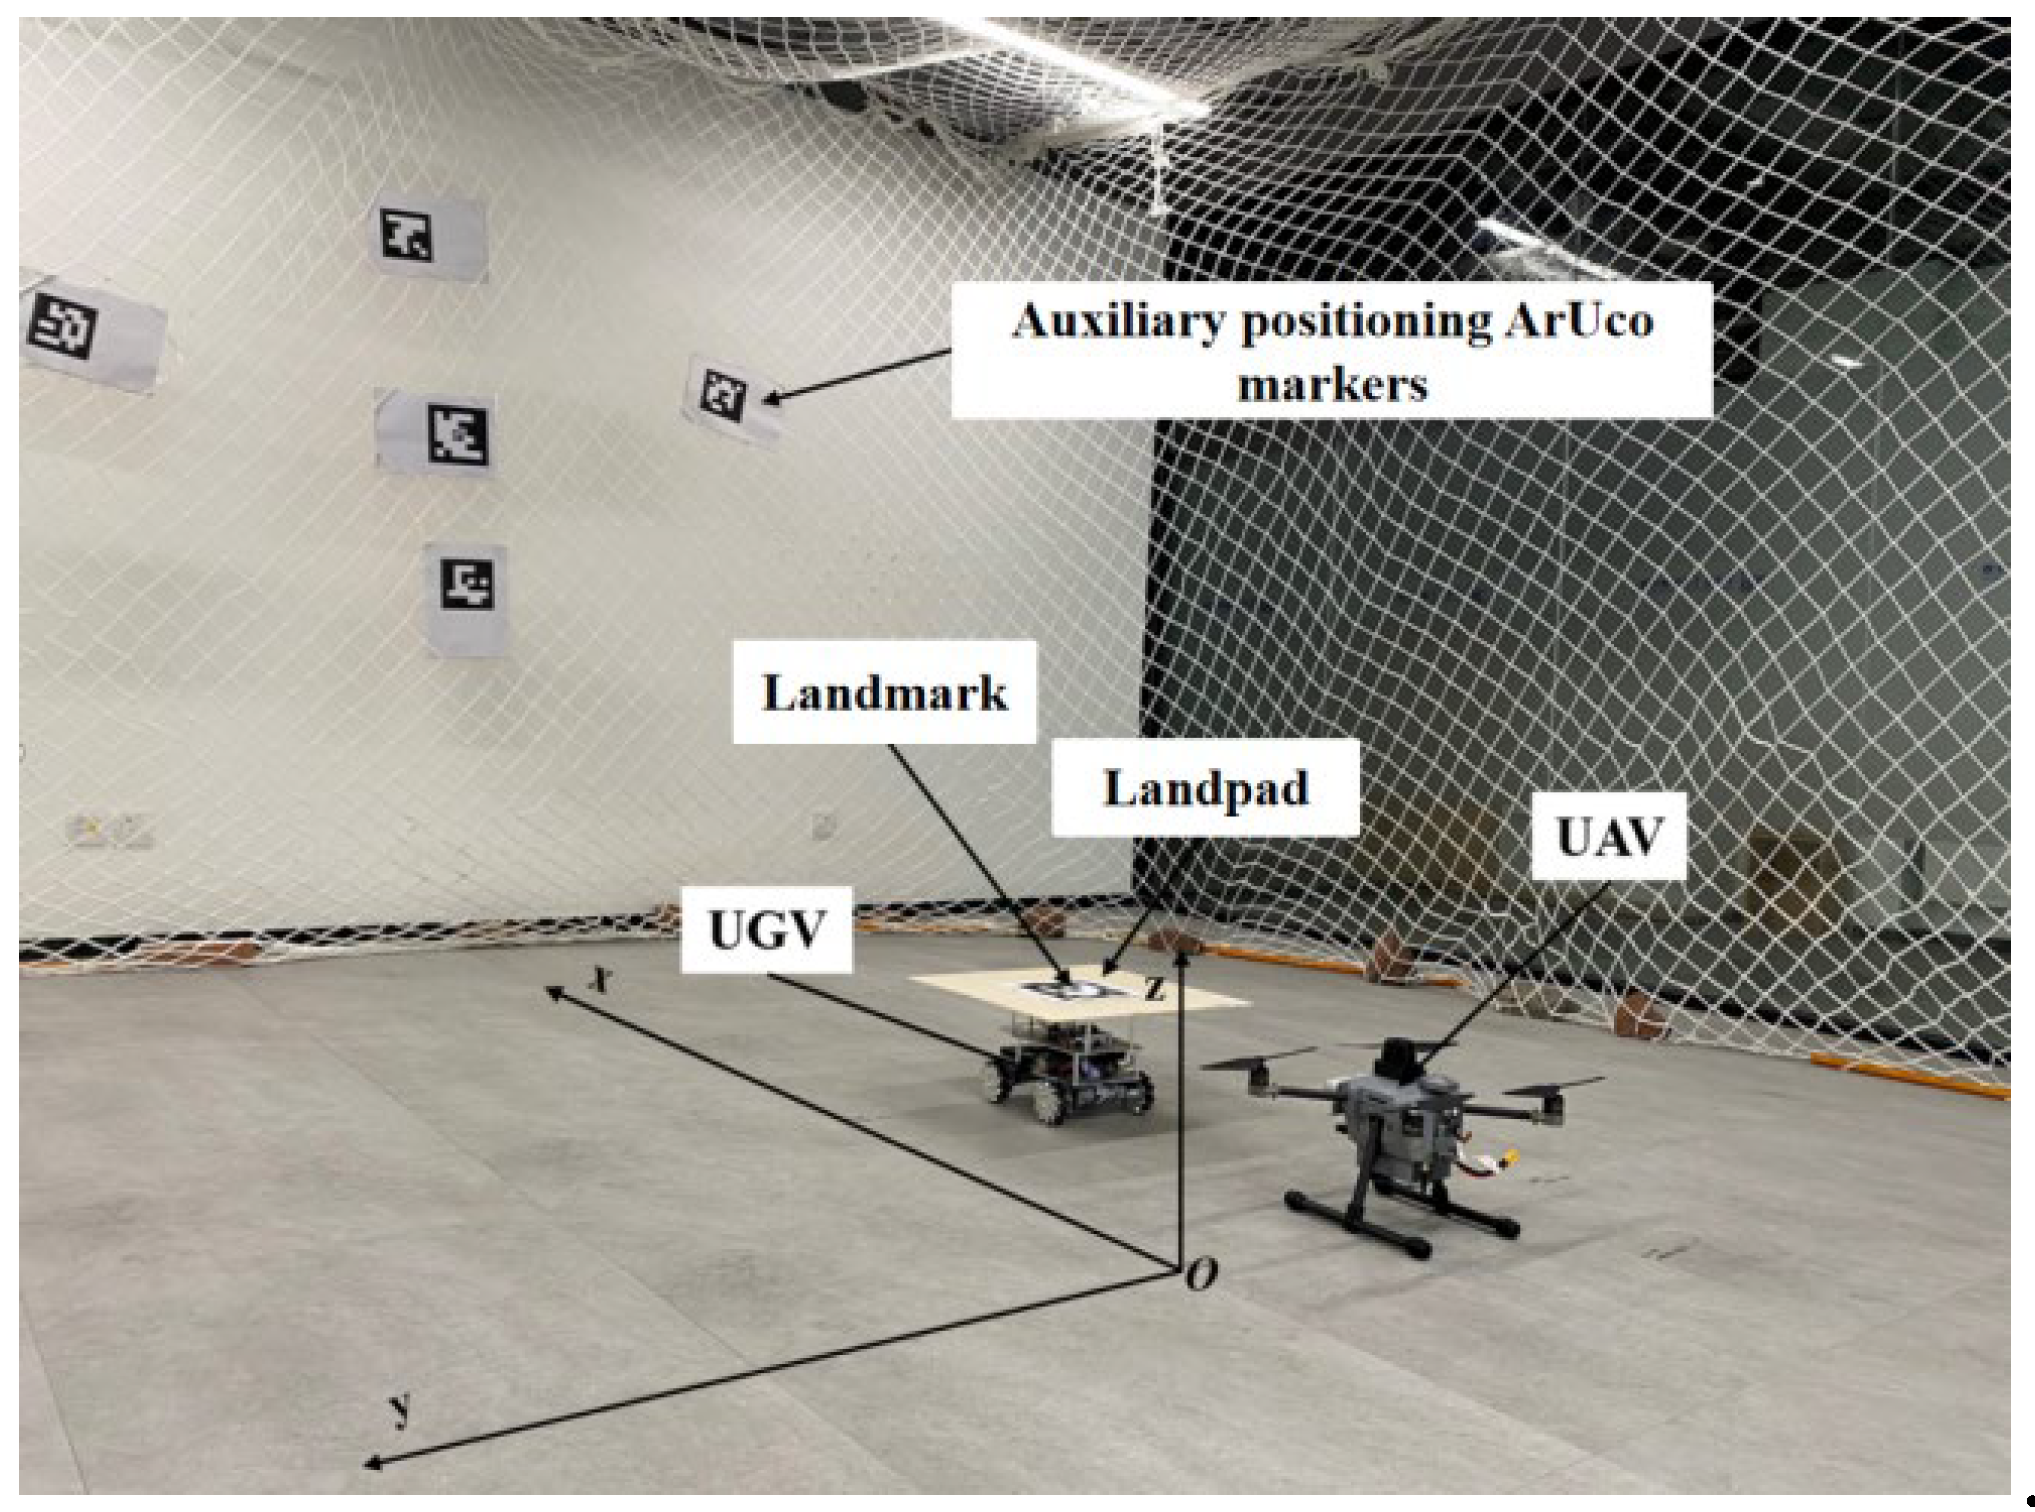
Figure 5, which includes a quadcopter UAV with a wheelbase of 450mm, a ground-based UGV, and a landing platform with ArUco marker. The UAV features high-speed monocular and binocular cameras, an on-board processor, the Nvidia-developed Jetson Xavier NX board, and flight controllers utilizing the Pixhawk4 hardware co-created by the PX4 team. A protective net was constructed around the experimental site perimeter, and ArUco markers were affixed to the net to enhance the UAV's positional accuracy. A coordinate system was established at the experimental site, as depicted in
Figure 5. Record the offset of the initial UAV and UGV positions from the origin of the defined coordinate system prior to the experiment's commencement. Since the position and attitude transformations of UAV and UGV are based on the body coordinate system, and the position information is recorded with its own starting point as the origin, the position information of the two in the same coordinate system can be obtained by making a difference between the data recorded by the two and the deviation of their respective initial positions.
We conduct experiments to track the flight of ArUco marker that move with the UGV three types of motion: linear reciprocating, circular, and straight-sided elliptical. The UGV was made to move at three speeds, v1=0.2m/s, v2=0.4m/s, and v3=0.6m/s, while performing three different forms of motion in order to test the robustness and accuracy of the UAV's dynamic tracking of landings.
3.1. Tracking Experiments
3.1.1. Linear Reciprocating Trajectory
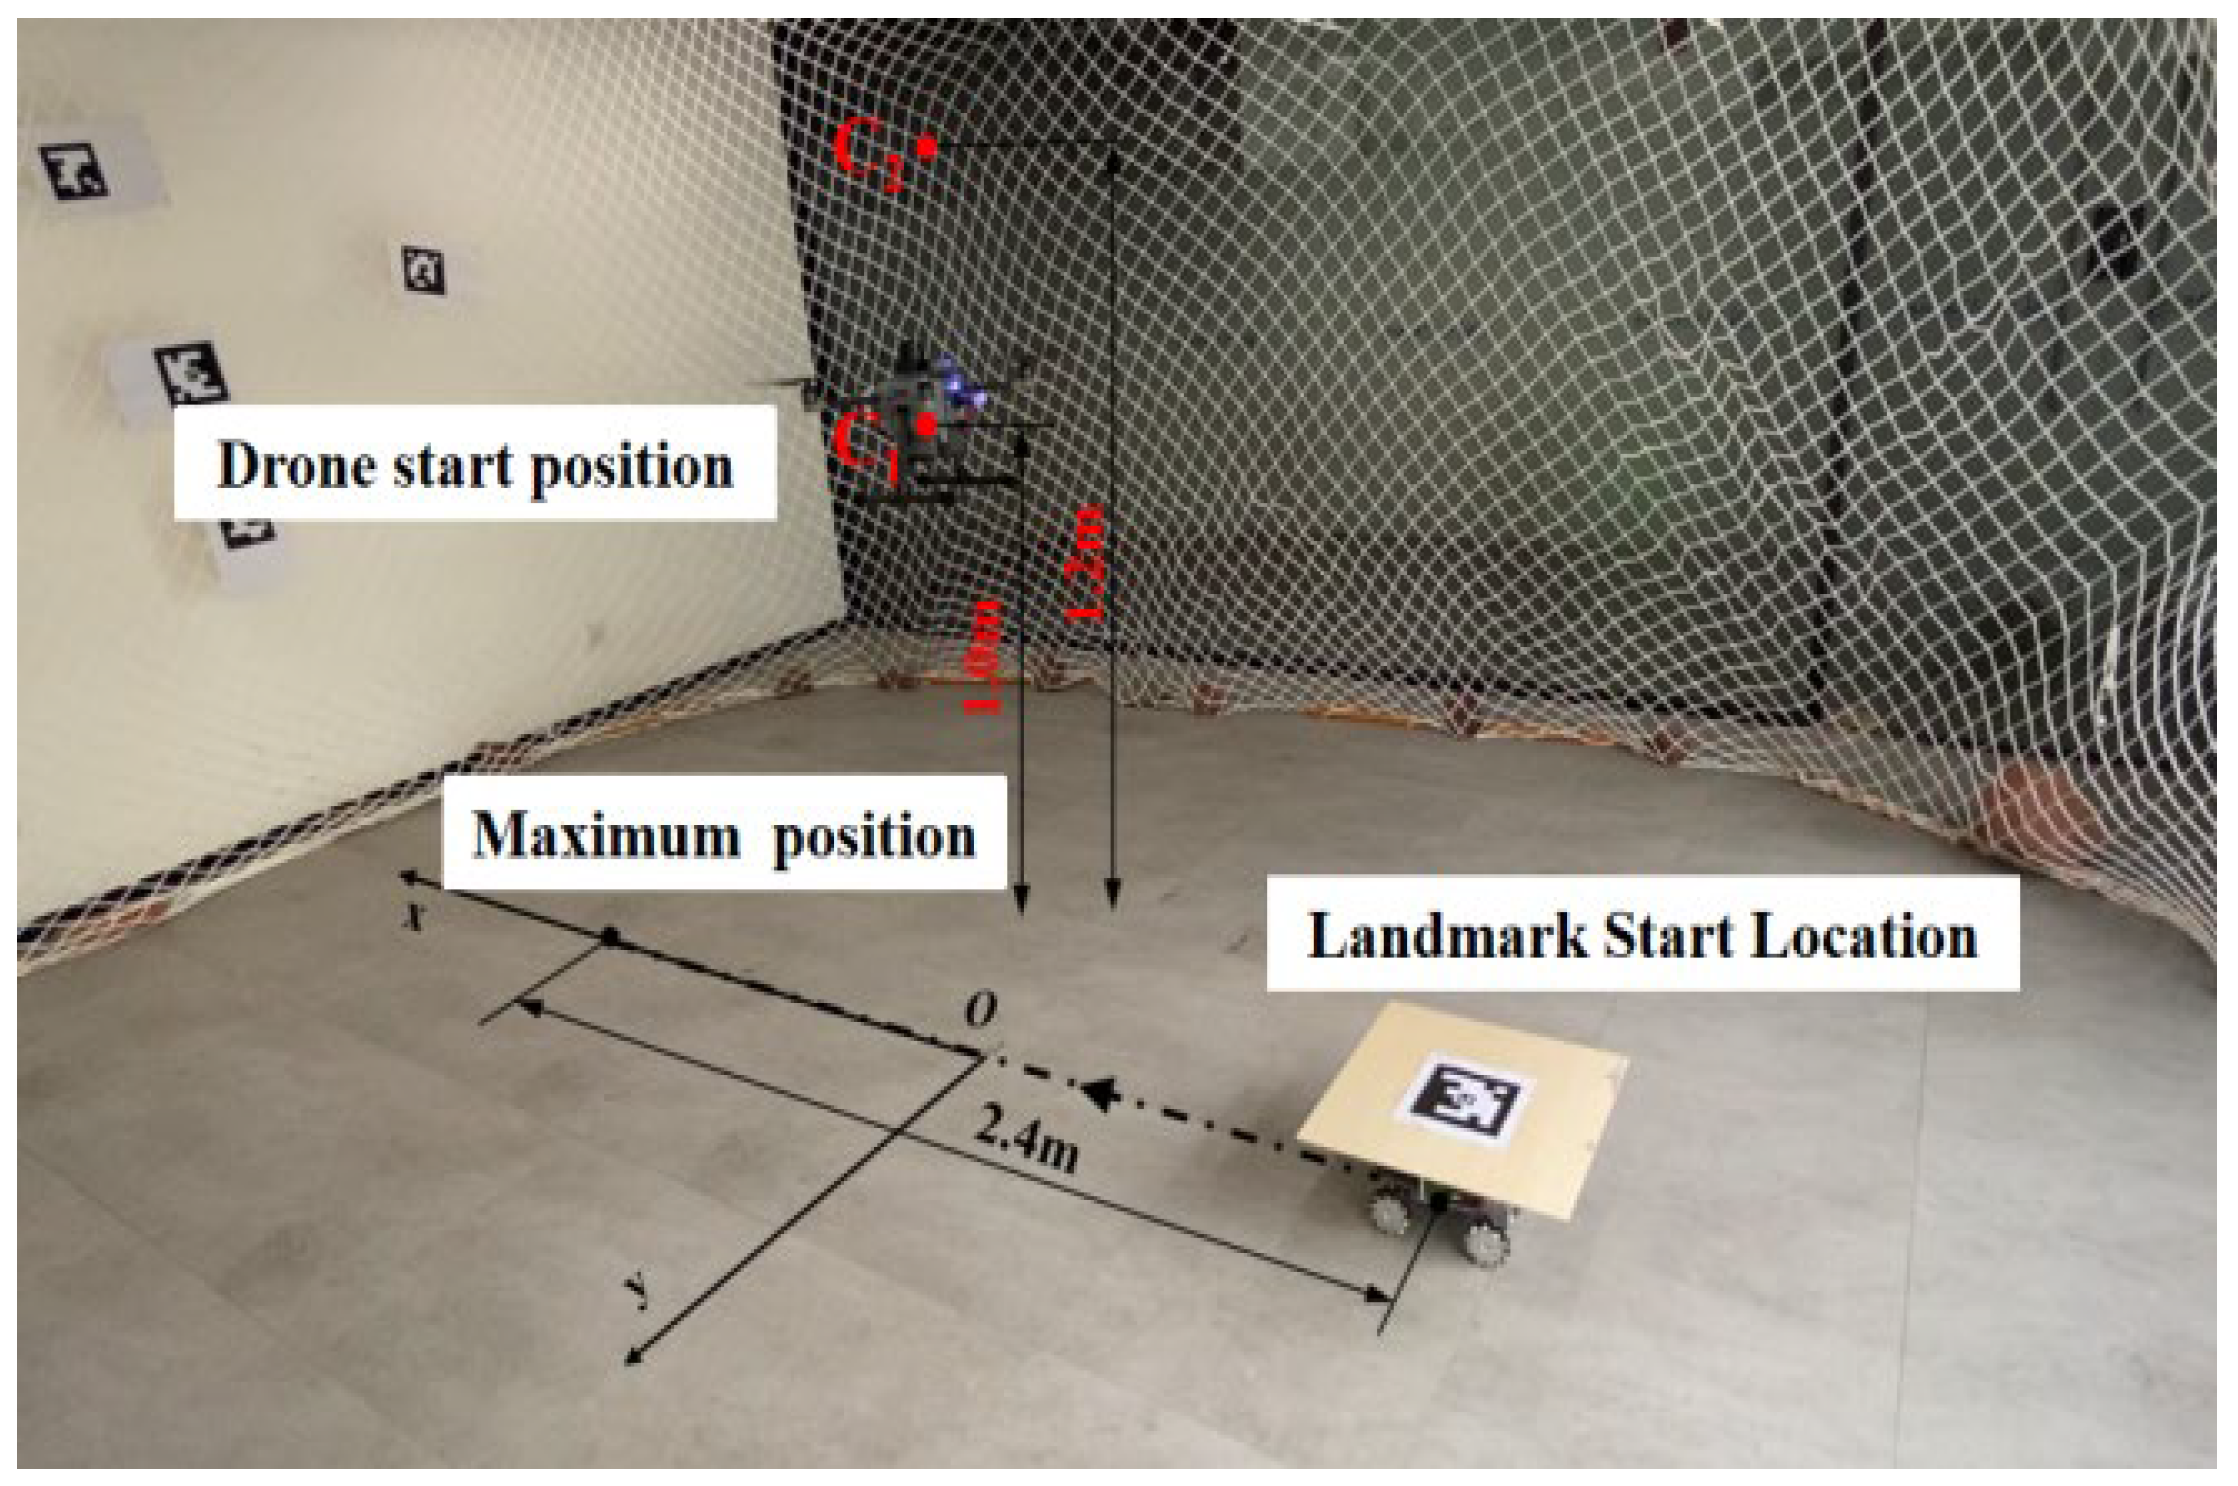
In the experiment, landmarks follow the UGV while it moves in a straight reciprocating motion at three different speeds. This is done to verify the tracking performance of the UAV. Taking into account the influence of the UAV's movement speed and camera field of view on tracking performance, we adjusted the starting point of the UAV's tracking at different heights depending on the speed (shown in
Figure 6).
When the UGV's is moving at velocity
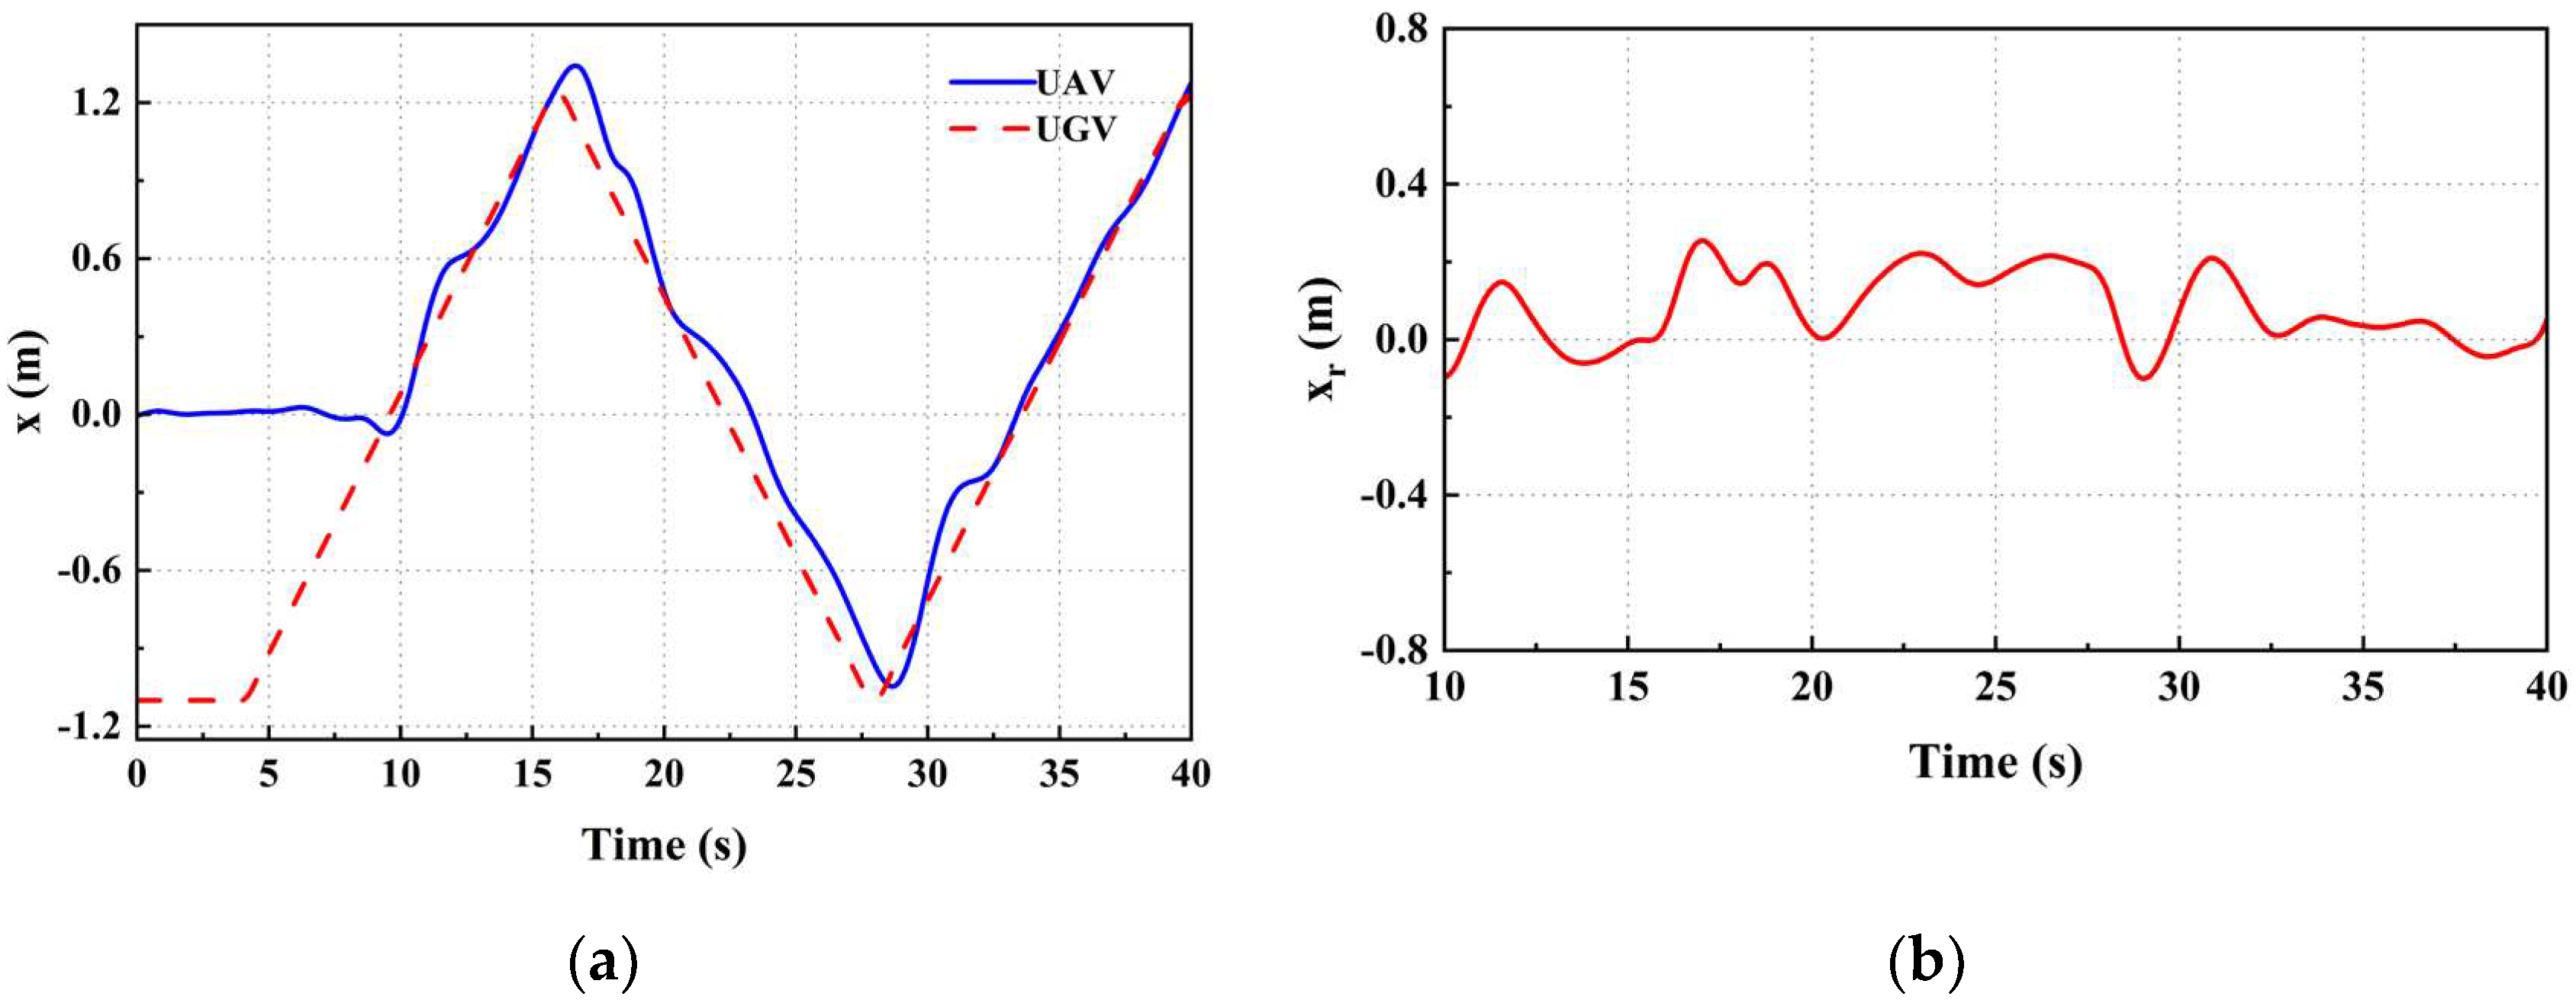
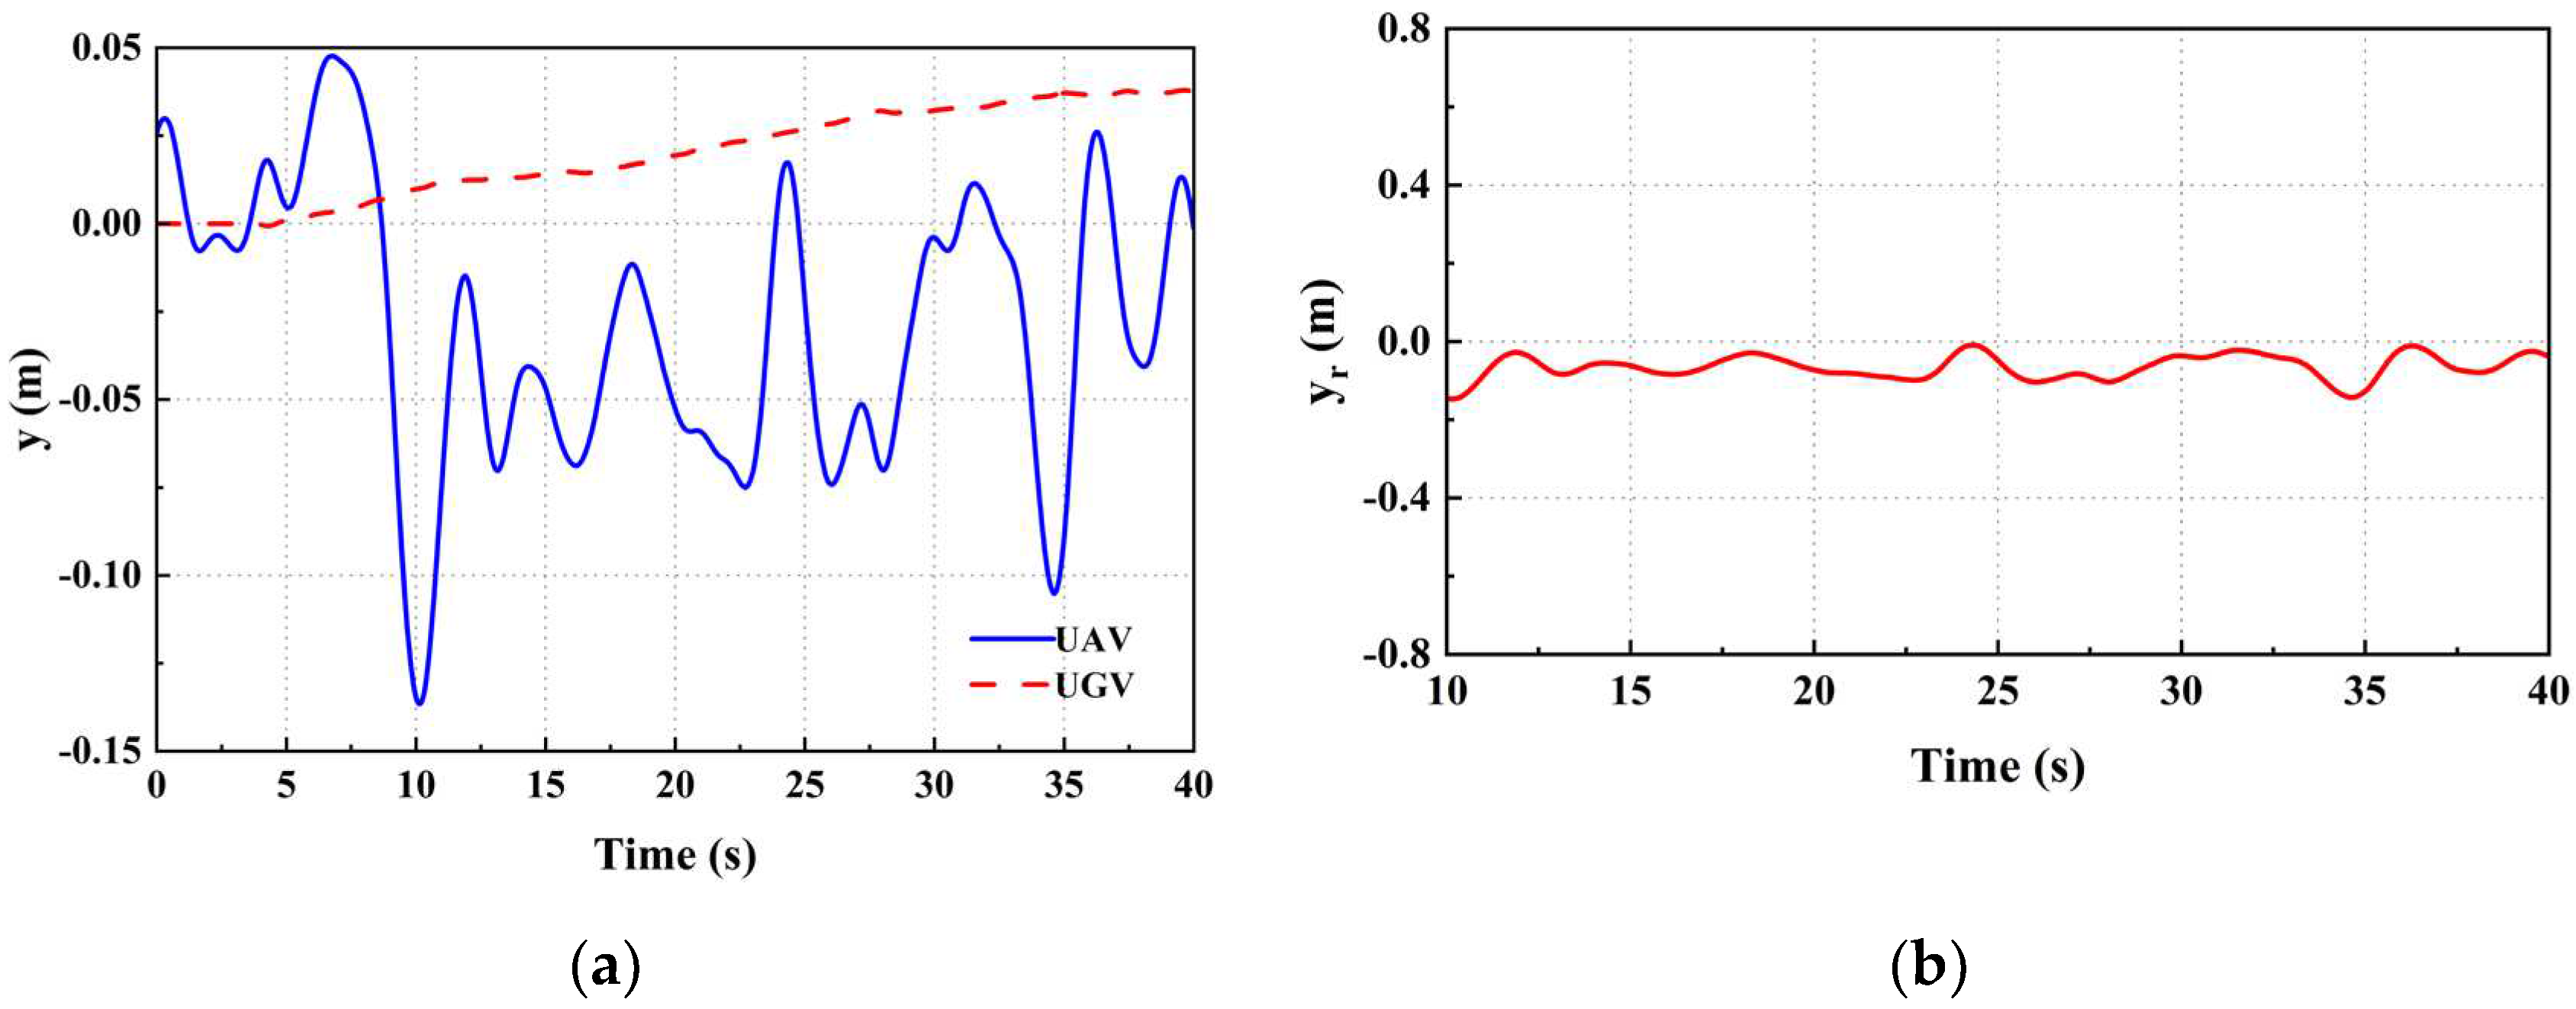
v1, the UAV's position relative to the UGV in the x and y axes can be obtained (
Figure 7 and
Figure 8). Where x
r and y
r represent the deviations of the UAV and UGV along the x and y axes, respectively. The speeds of the UAV and the UGV on the x and y axes are depicted in
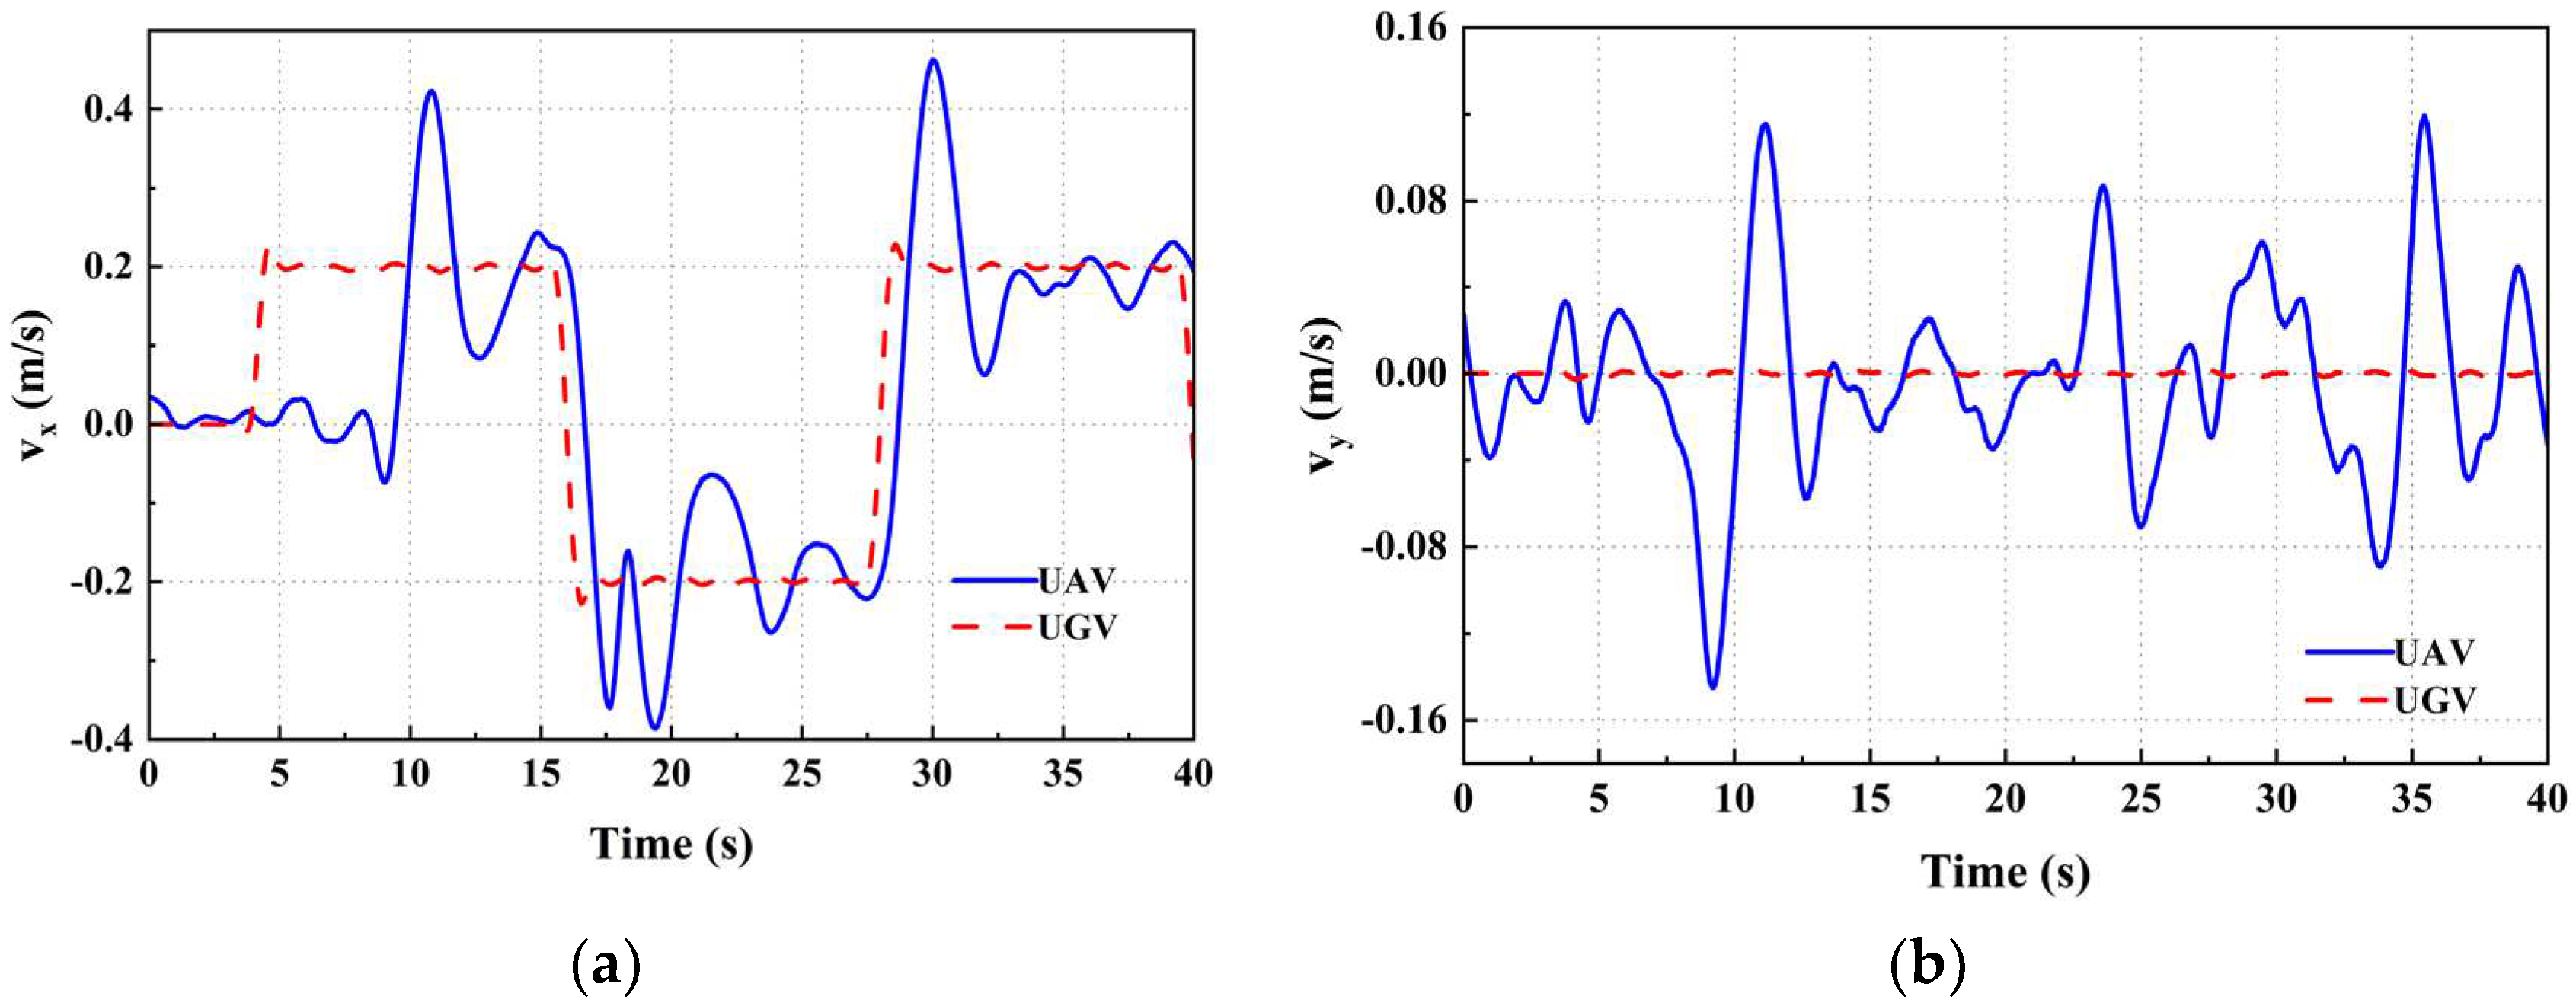
Figure 9. There was a momentary increase in the speed of the UAV at 10 seconds, attributed to the landmark entering the UAV's field of view. The UAV's speed overshooting at 18s and 28s recurs as a result of the UGV changing direction. During stable tracking, the UAV's linear velocities along the x and y axes fluctuate at a rate commensurate with the speed of the UGV motion attachment.
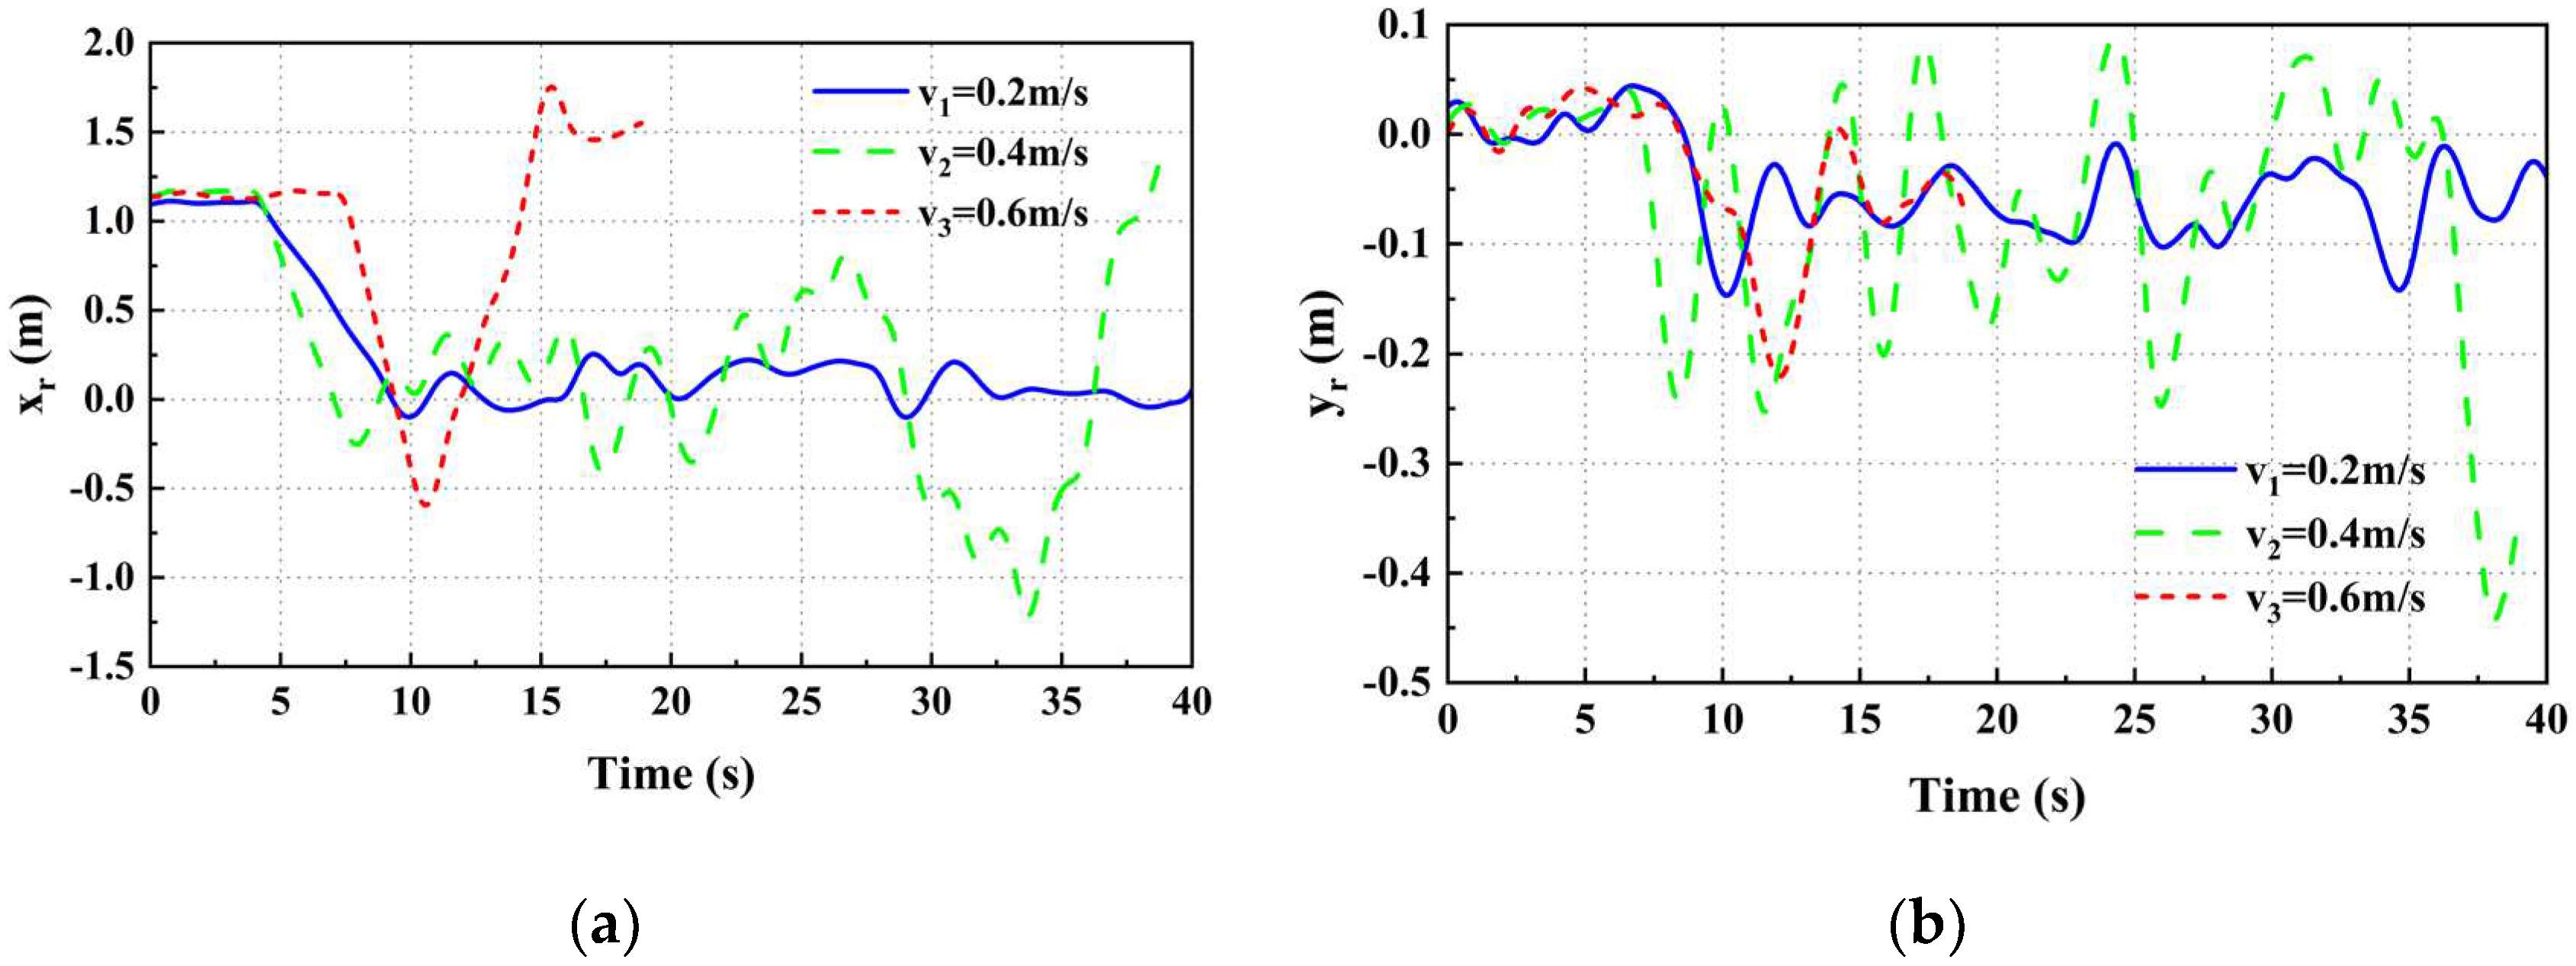
From
Figure 10, we are able to obtain the positional deviation of both the UAV and UGV on the x and y axes while the UGV is moving at three distinct speeds, namely x
r and y
r. The UGV's tracking was stable at speed
v1, but failed to maintain stability for extended durations at speeds
v2 and
v3. The UAV was more susceptible to losing the target due to the experimental site's limitations. The UAV flew at a lower altitude, and the camera's field of view was smaller. The mean and the mean square deviation of positional deviations in the x and y axes during constant tracking at speeds
v1 and
v2 were calculated and presented in
Table 3. The mean outcomes in the table indicate that there is a slight increase in positional deviation between the UAV and the UGV in both the x and y-axis directions, as the speed of UGV movement increases. However, it still remains at the decimeter level. The table's mean square results indicate a gradual increase in x-axis position deviation fluctuation with the UGV's increasing speed, whereas the UGV's speed does not have a direct relation to y-axis position deviation fluctuation.
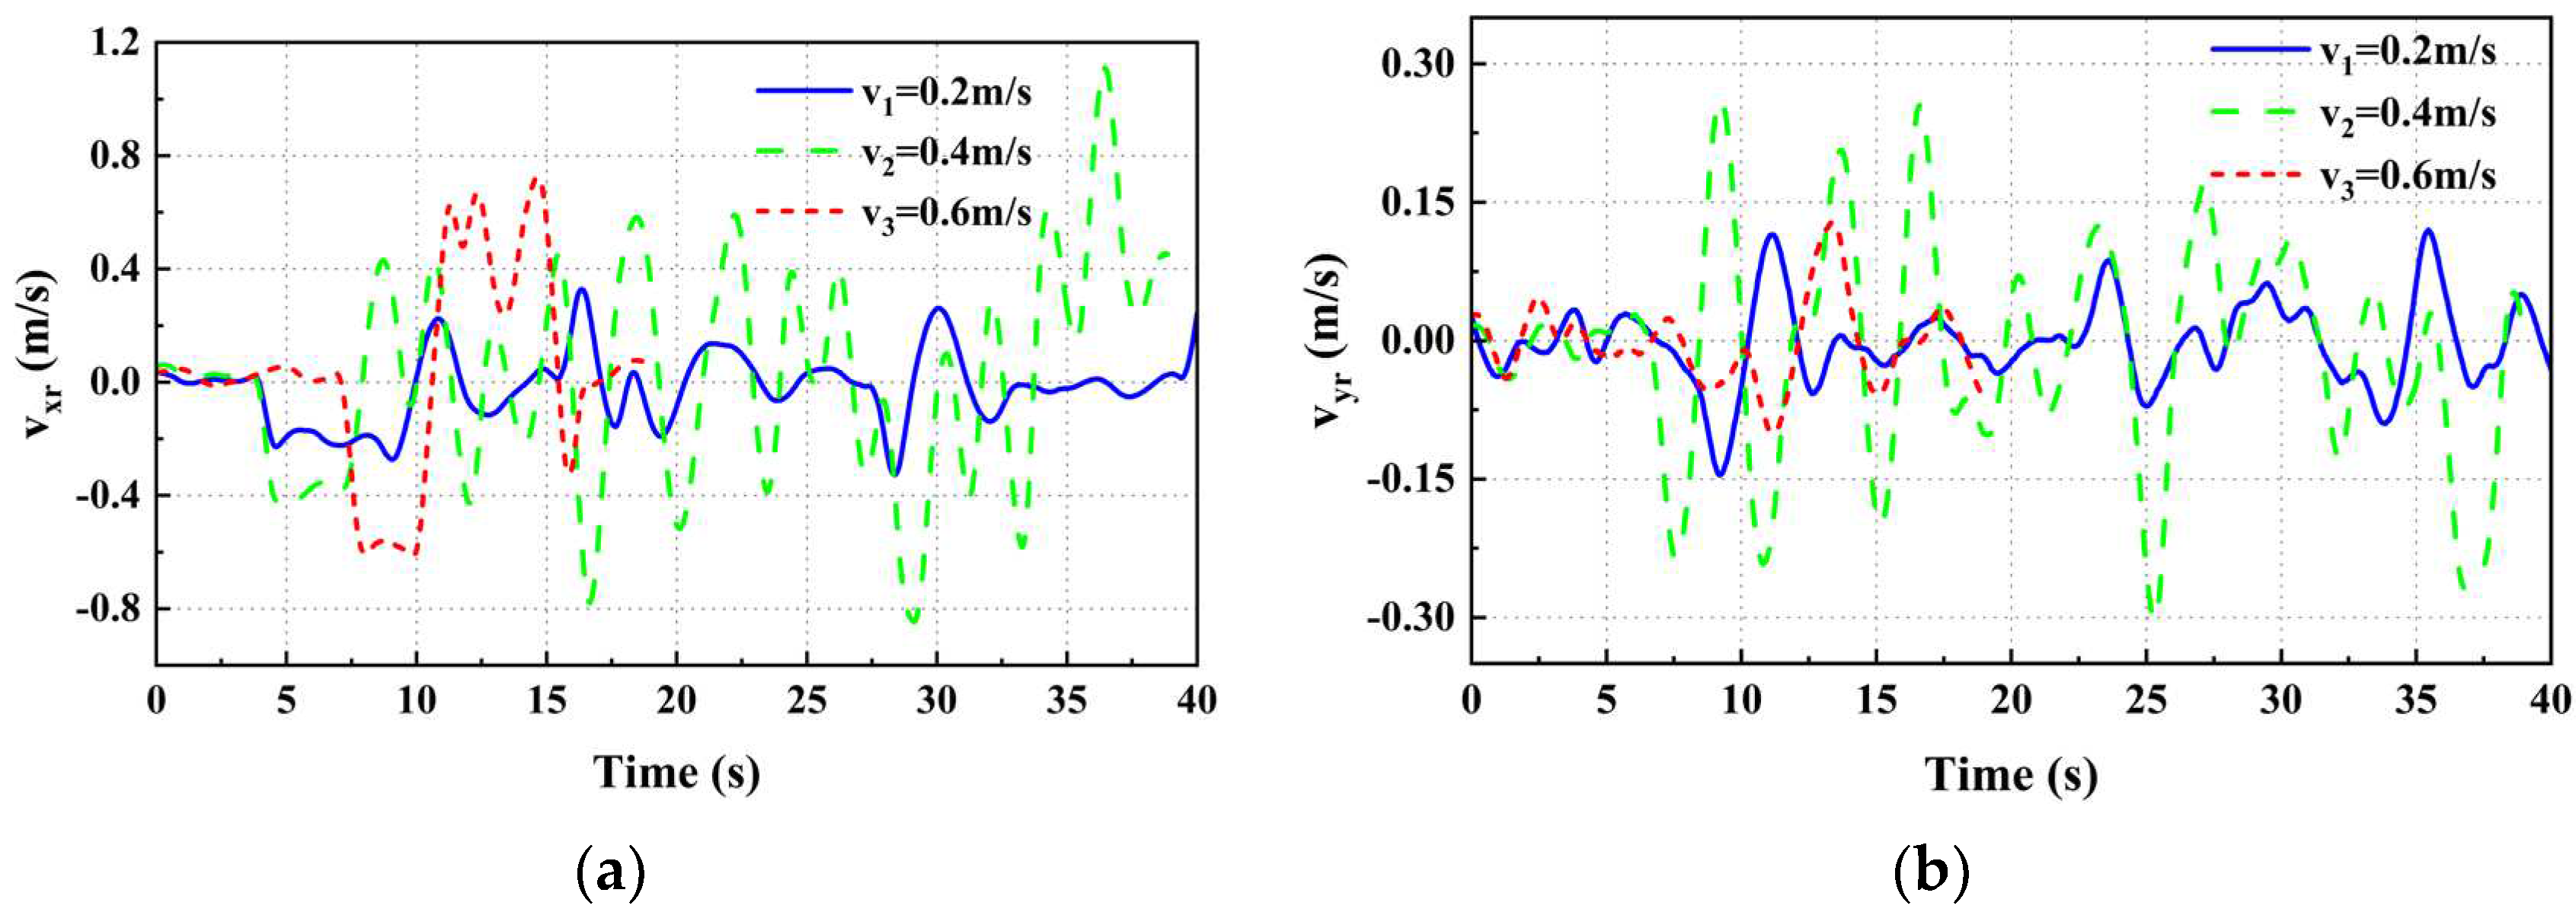
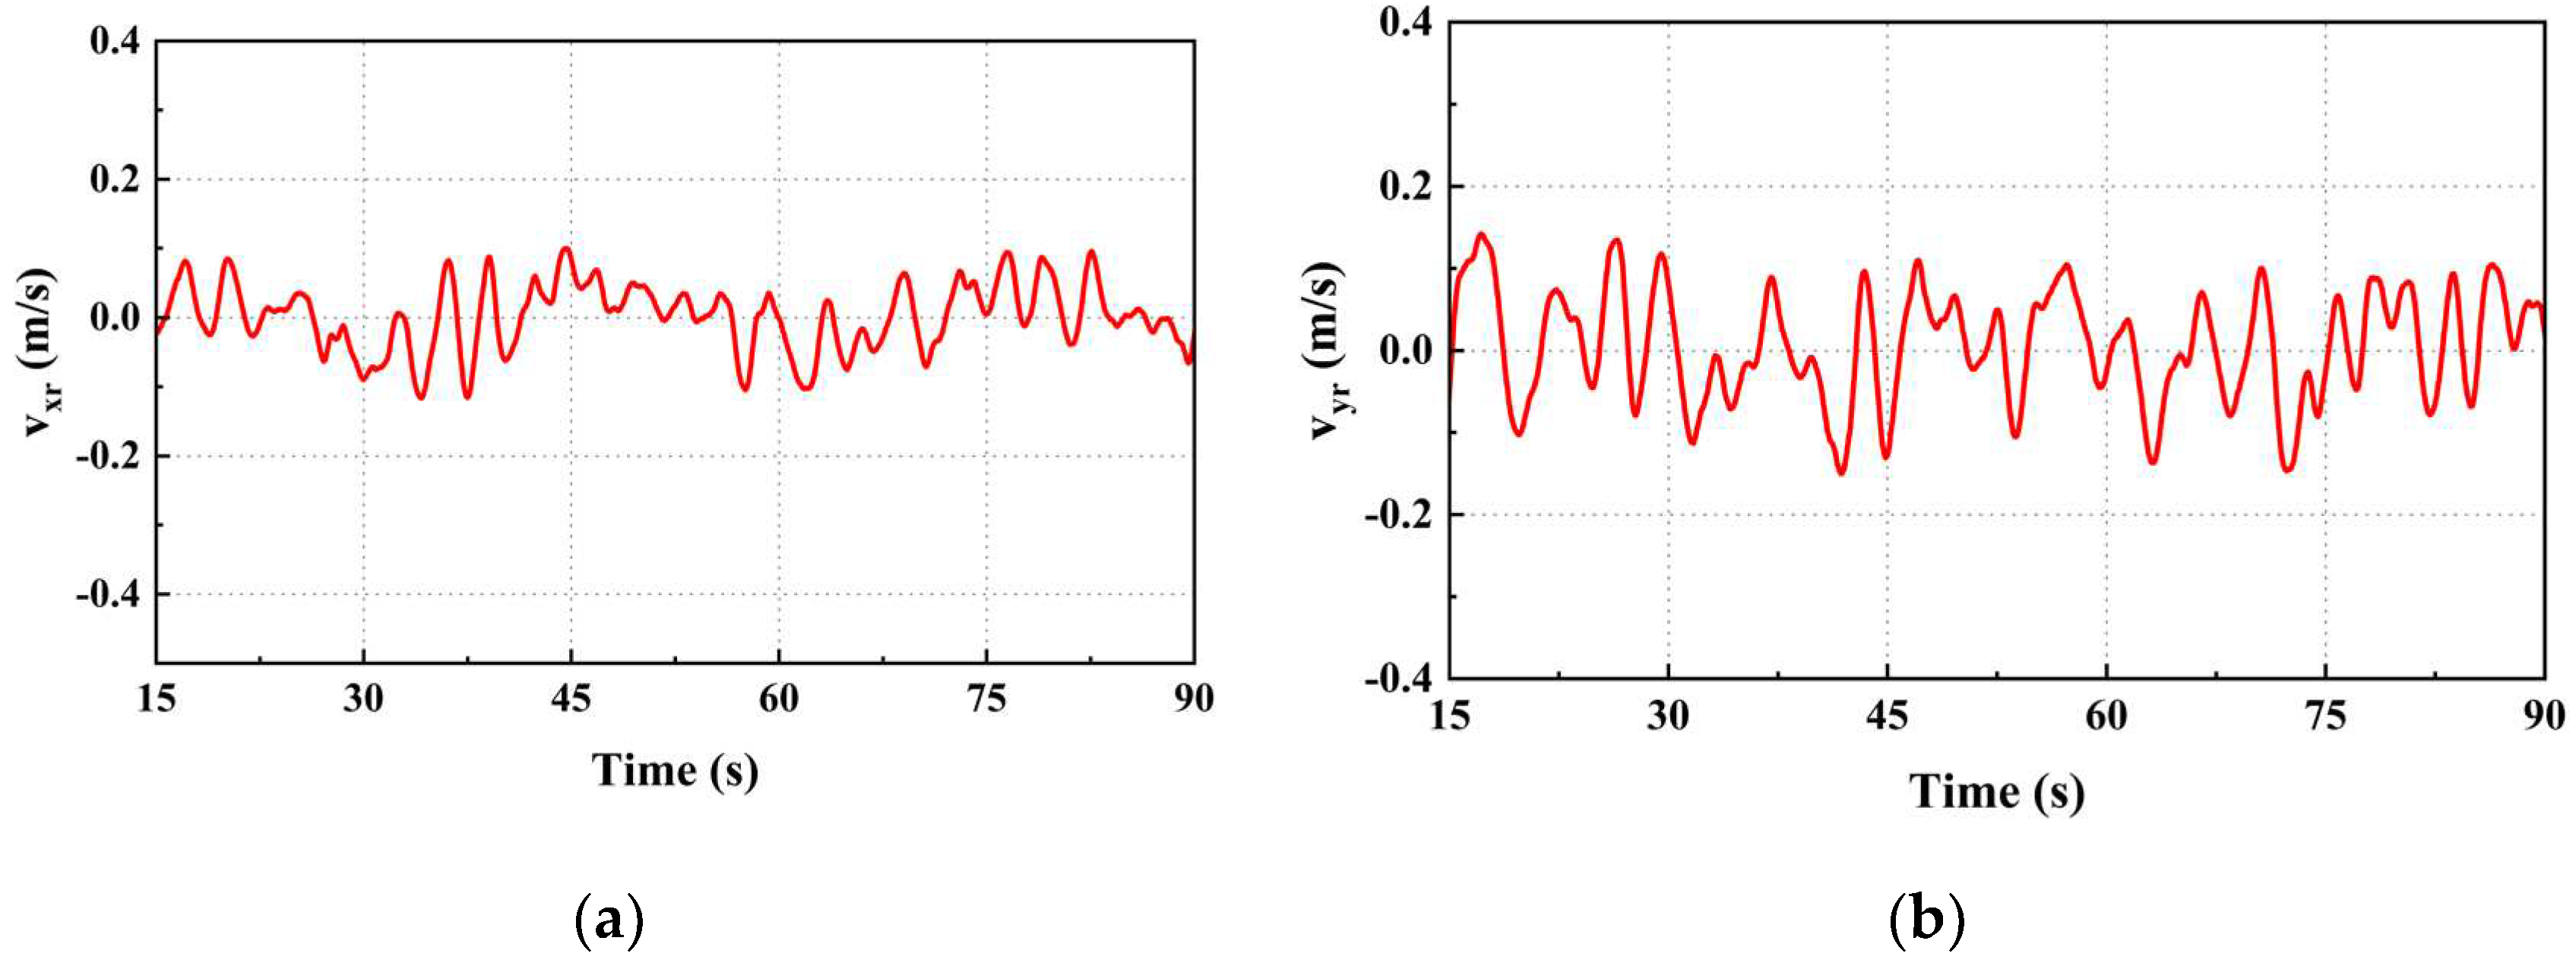
From
Figure 11, one can derive the velocity deviation between the UAV and UGV on the x and y axes, denoted as v
xr and v
yr, respectively, when the UAV moves at three distinct velocities. The mean squared sum of the difference in velocity between the UAV and the UGV in the x and y axes directions is computed for UGV velocities
v1 and
v2. The findings are presented in
Table 4. When comparing the speed deviation fluctuations near 0m/s at different speeds, it becomes more evident that the fluctuation near 0m/s increases as the mean square sum of the speed deviation increases. As the UGV's speed increases, the mean square sum of the deviation in the x-axis velocity also increases resulting in more noticeable fluctuation. Meanwhile, the y-axis deviation fluctuation remains consistent near the speed of 0 m/s. Throughout the entire tracking process, the speed response of the UAV exhibits no noticeable oscillations and remains consistent with the moving speed of the UGV. This observation suggests that the UAV performs well in tracking. Throughout the entire tracking process, the speed response of the UAV exhibits no noticeable oscillations and remains consistent with the moving speed of the UGV. This observation suggests that the UAV performs well in tracking.
3.1.2. Circular Trajectory
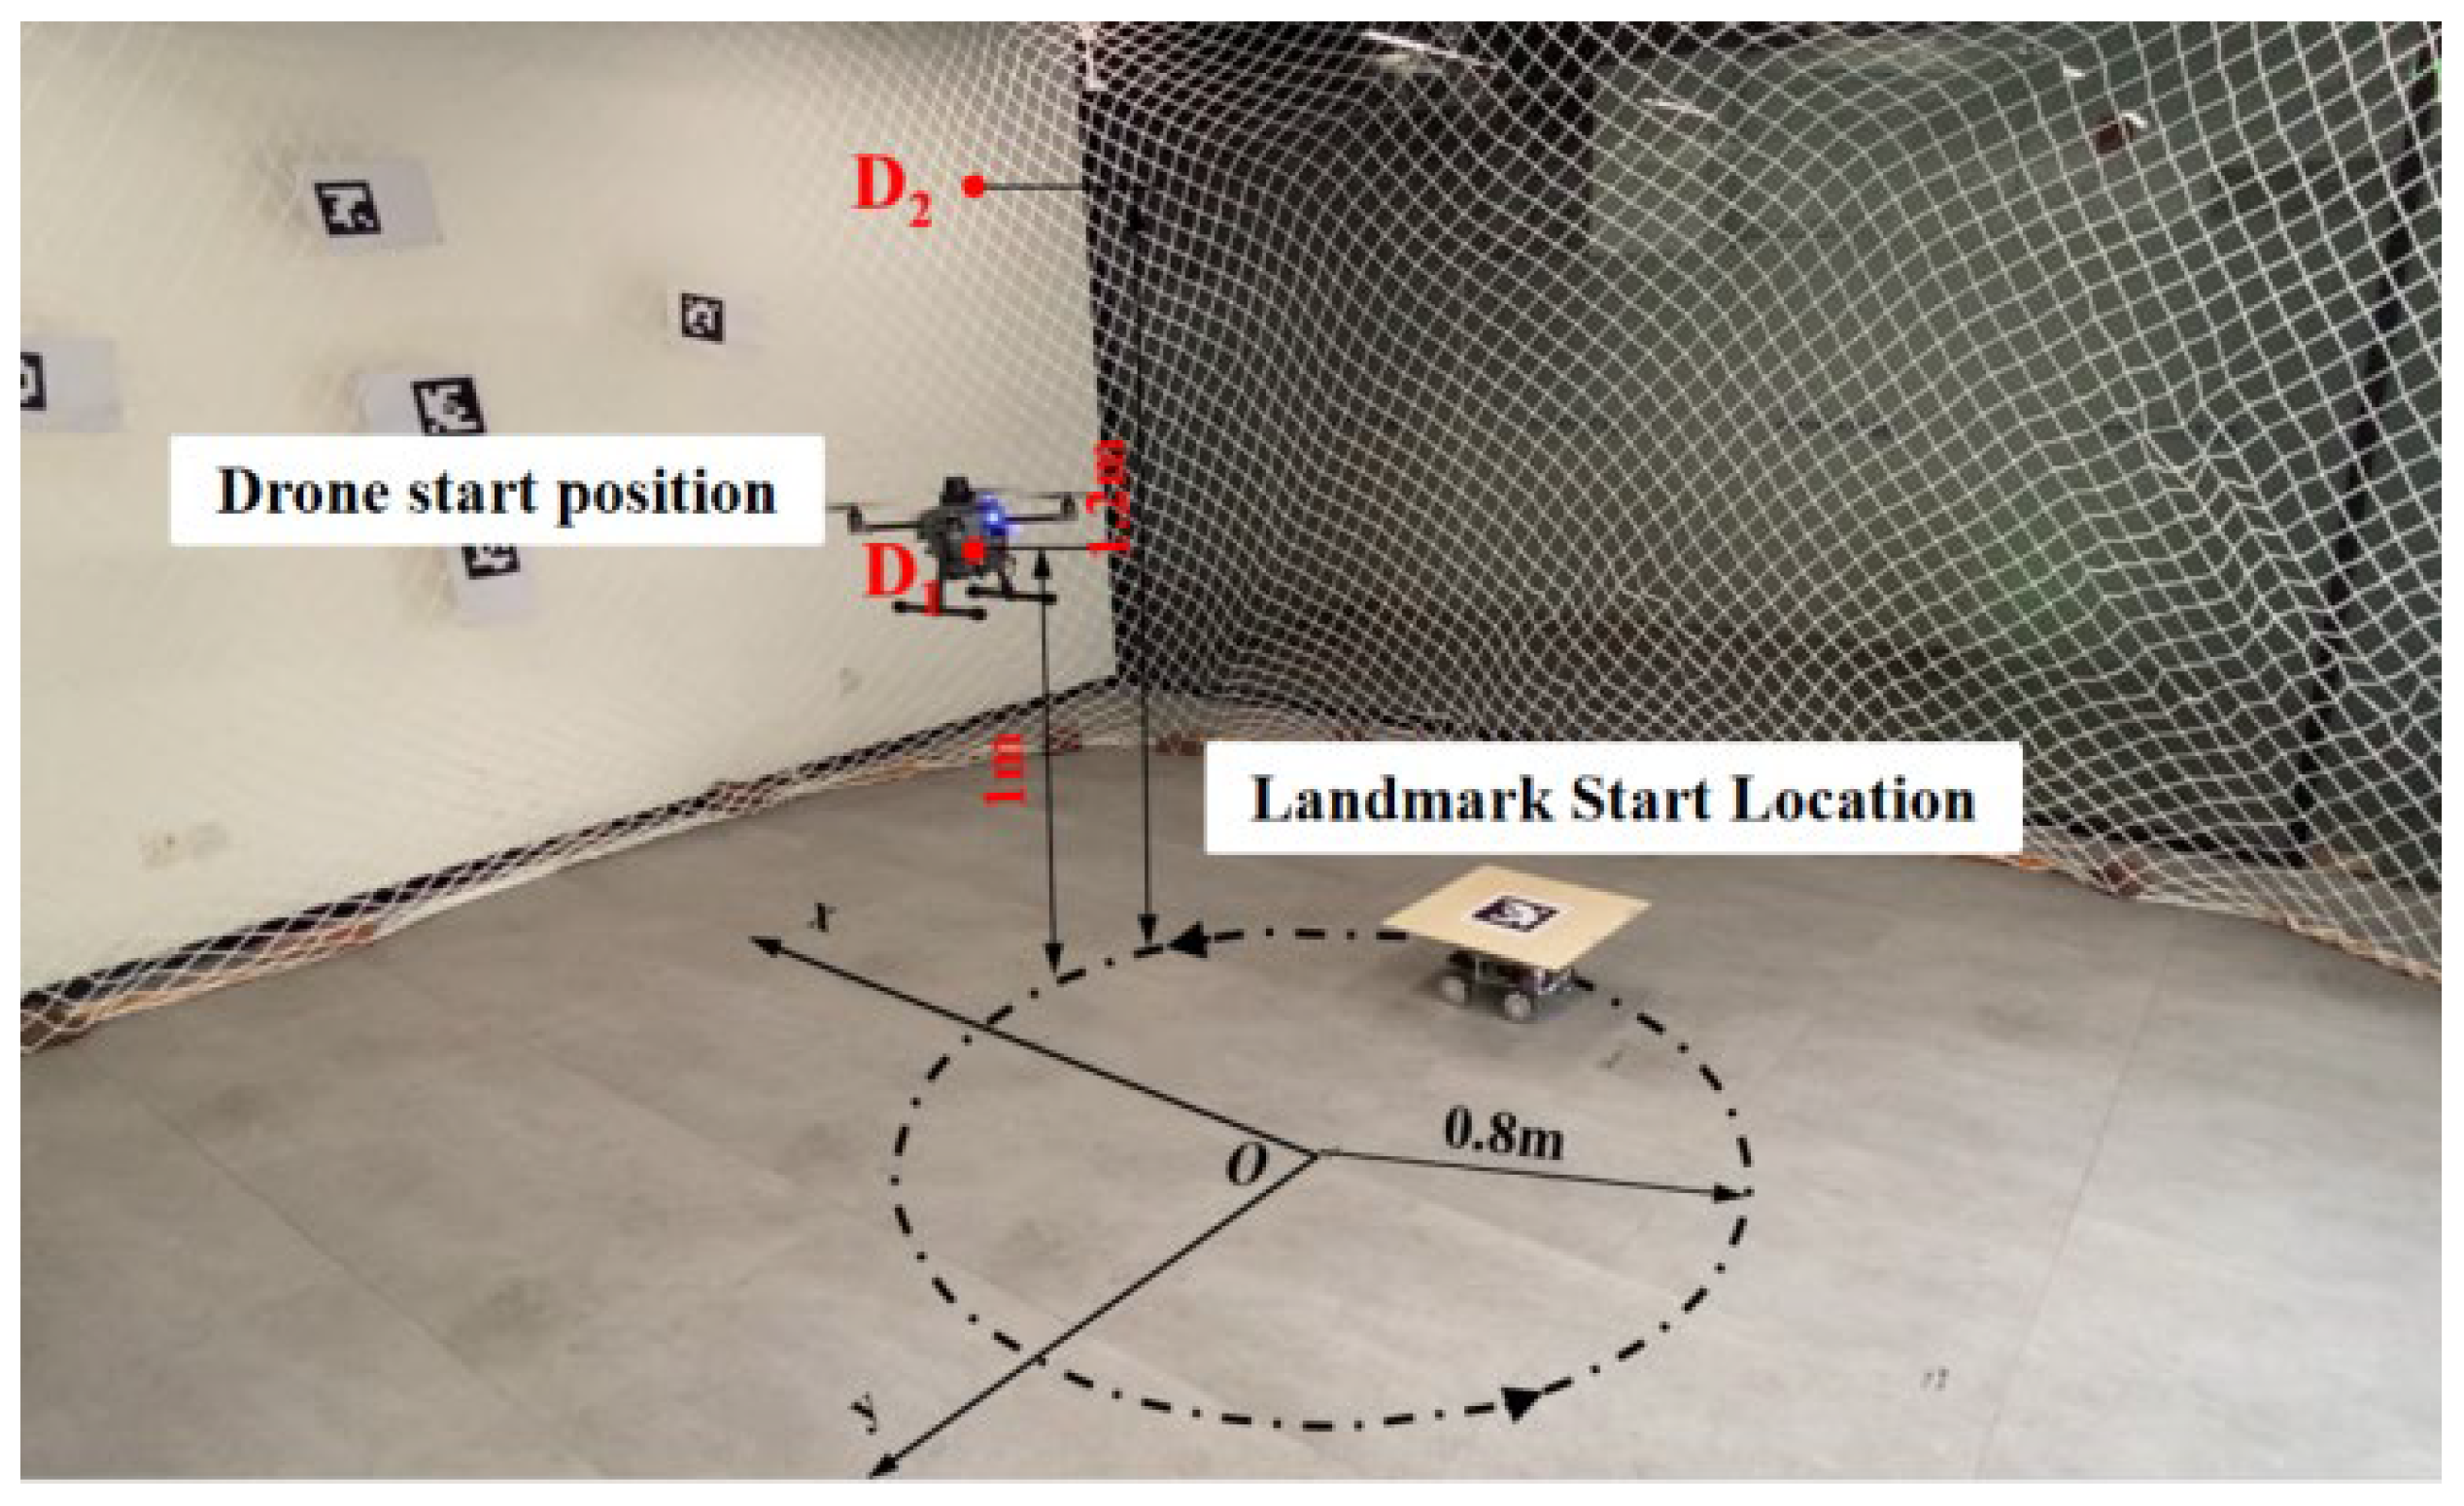
The UAV circular trajectory tracking experiment parallels the linear reciprocating motion tracking experiment. The UGV moves in a circular motion, with a radius of 0.8 meters, at three distinct velocities. Only the starting point coordinates for the UAV and UGV were altered in comparison to the linear reciprocal motion tracking experiment (shown in
Figure 12).
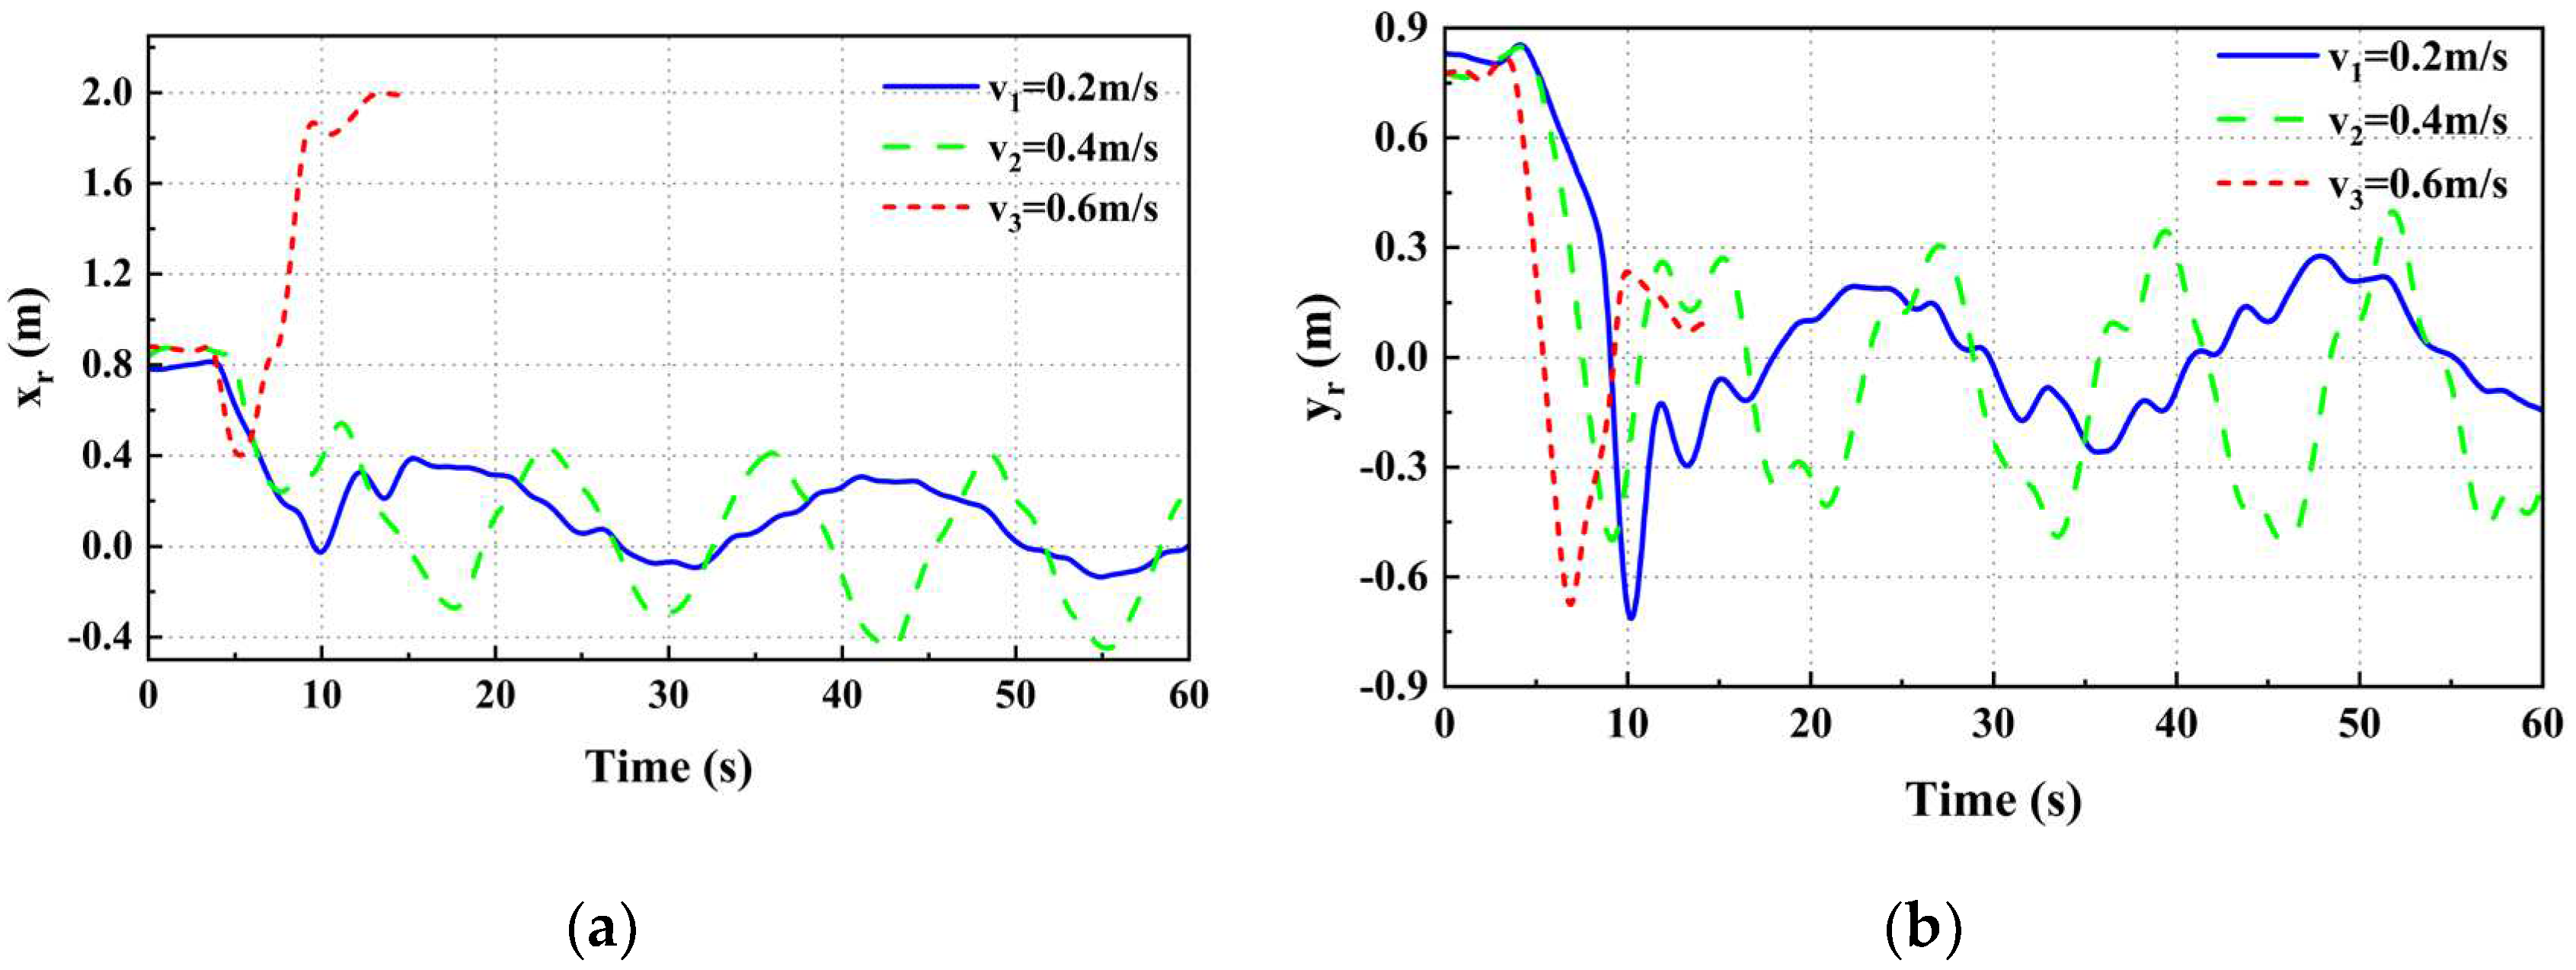
We can determine the amount of deviation in position between the UAV and the UGV when the UGV is moving at three distinct speeds (shown in
Figure 13). Achieving stable tracking is possible at UGV speeds
v1 and
v2, however, at speed
v3, the target is lost around the 15th second, making it impossible to maintain stable tracking for a long time. The probable reason for this is the low flight altitude of the UAV which narrows the field of view of the camera and thereby increases the chances of target loss. The mean and mean square deviation of the position deviation of the UAV and the UGV are calculated and the results are shown in
Table 5. It can be concluded that as the speed of the UGV increases, the mean position error and the mean square error of the x and y axes increase to a certain extent, i.e., the position error and the degree of fluctuation of the position error are positively correlated with the speed of the UGV. Furthermore, when compared with
Table 3, the mean value of the x-axis position deviation for the UGV making a circular motion at the same speed is smaller. And since the UGV has a y-axis velocity in the circular motion, the mean and the mean square of the y-axis position deviation are larger in the circular motion.
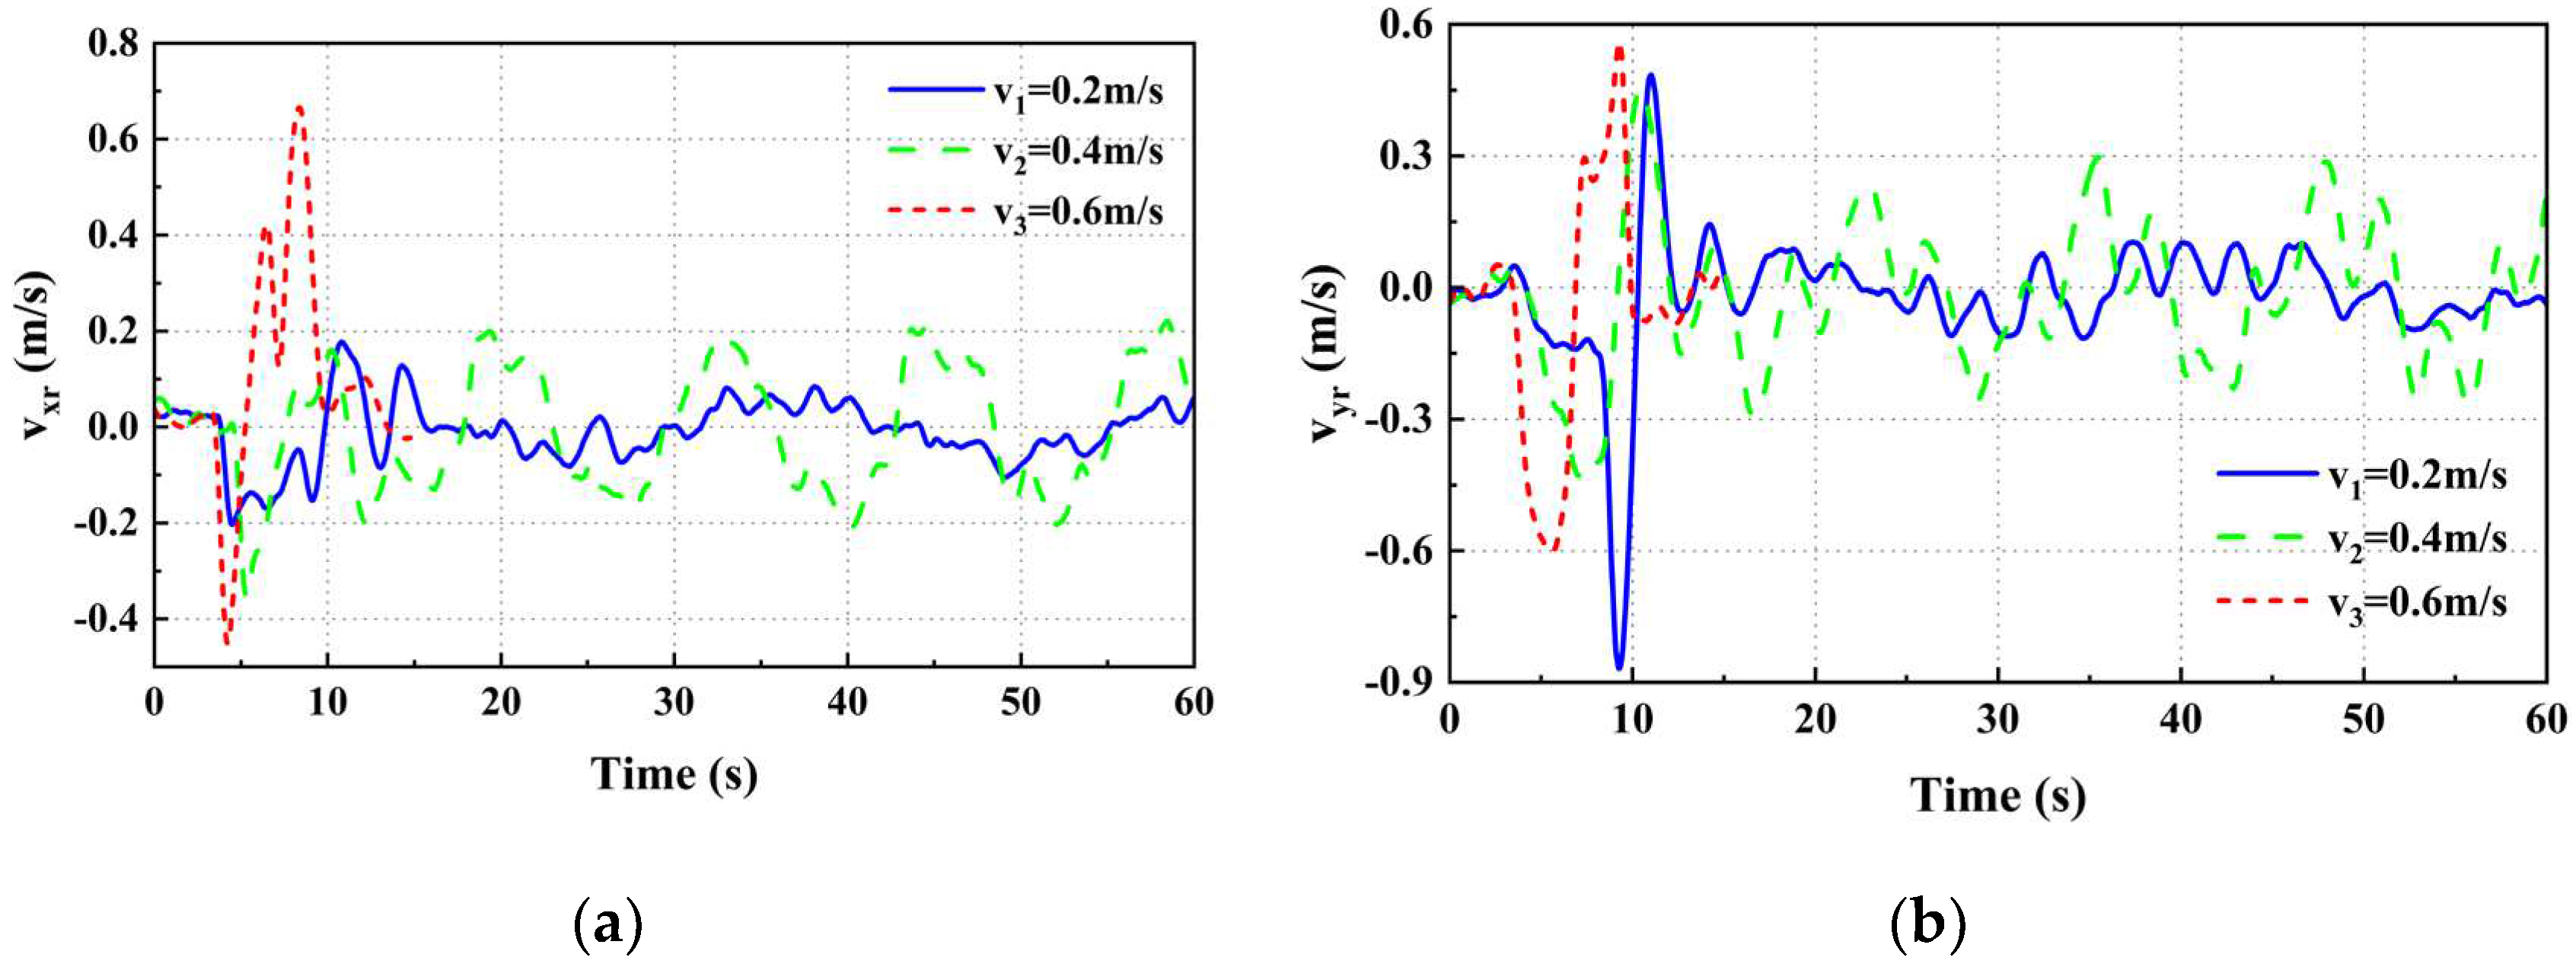
We can get the velocity deviation between the UAV and the UGV on the x and y axes when the UGV is moving at three different speeds (shown in
Figure 14). The mean square sum of the velocity deviations was calculated and the results are shown in
Table 6. The fluctuation of UAV and UGV speed deviation becomes more noticeable as the speed of the UGV increases. Compared to
Table 4, the fluctuation of the velocity deviation in the x-axis direction is smaller for the same velocity in circular motion. At the same time, since the UGV has a y-axis velocity during its circular motion, the phenomenon of fluctuating velocity deviation in the y-axis direction between the UAV and the UGV is more noticeable.
As a whole, when the UGV moves at three different speeds, the position deviation of the UAV and the UGV in the x and y axes directions can be kept within the range of ±0.4m under the stable tracking state of the UAV and the velocity deviation of the two in the x and y axes directions basically stays within the ranges of ±0.2m/s, ±0.3m/s, which means that the tracking performance of the UAV is good.
3.1.3. Straight Sided Ellipse Trajectory
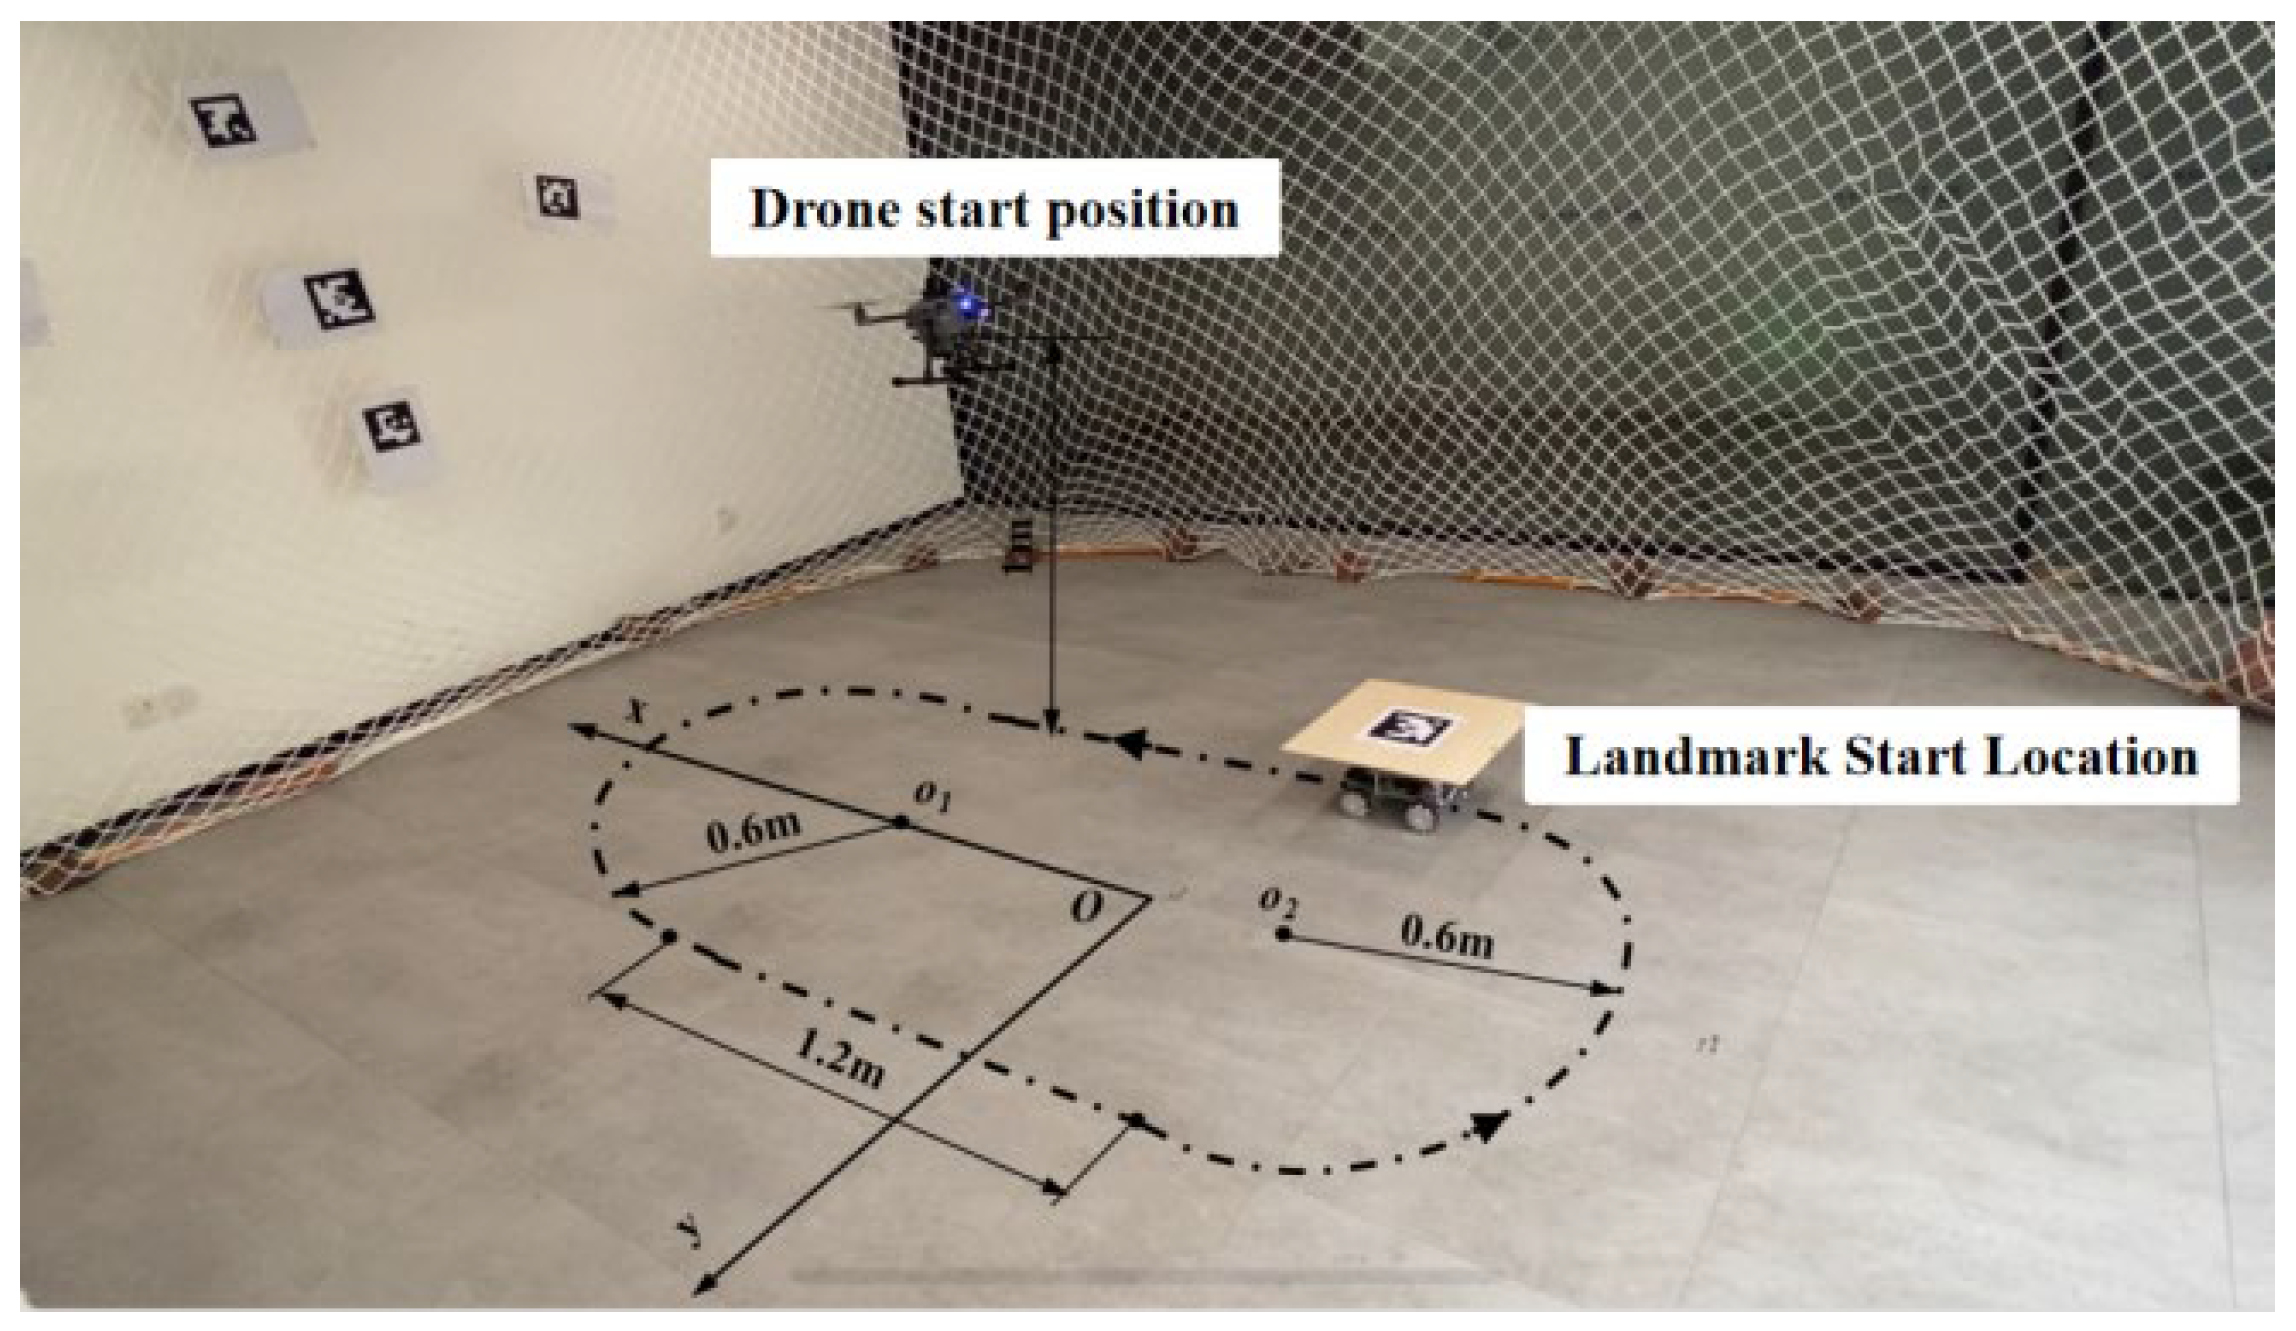
Experiments on UAV tracking of UGV moving in a straight elliptical trajectory (shown in
Figure 15). Since the results of the previous experiments show that the UAV can realize the tracking of the UGV when it is moving at three speeds, the experiments are conducted only for the UGV moving at speed
v1 when the UGV is moving in a straight-sided elliptical trajectory.
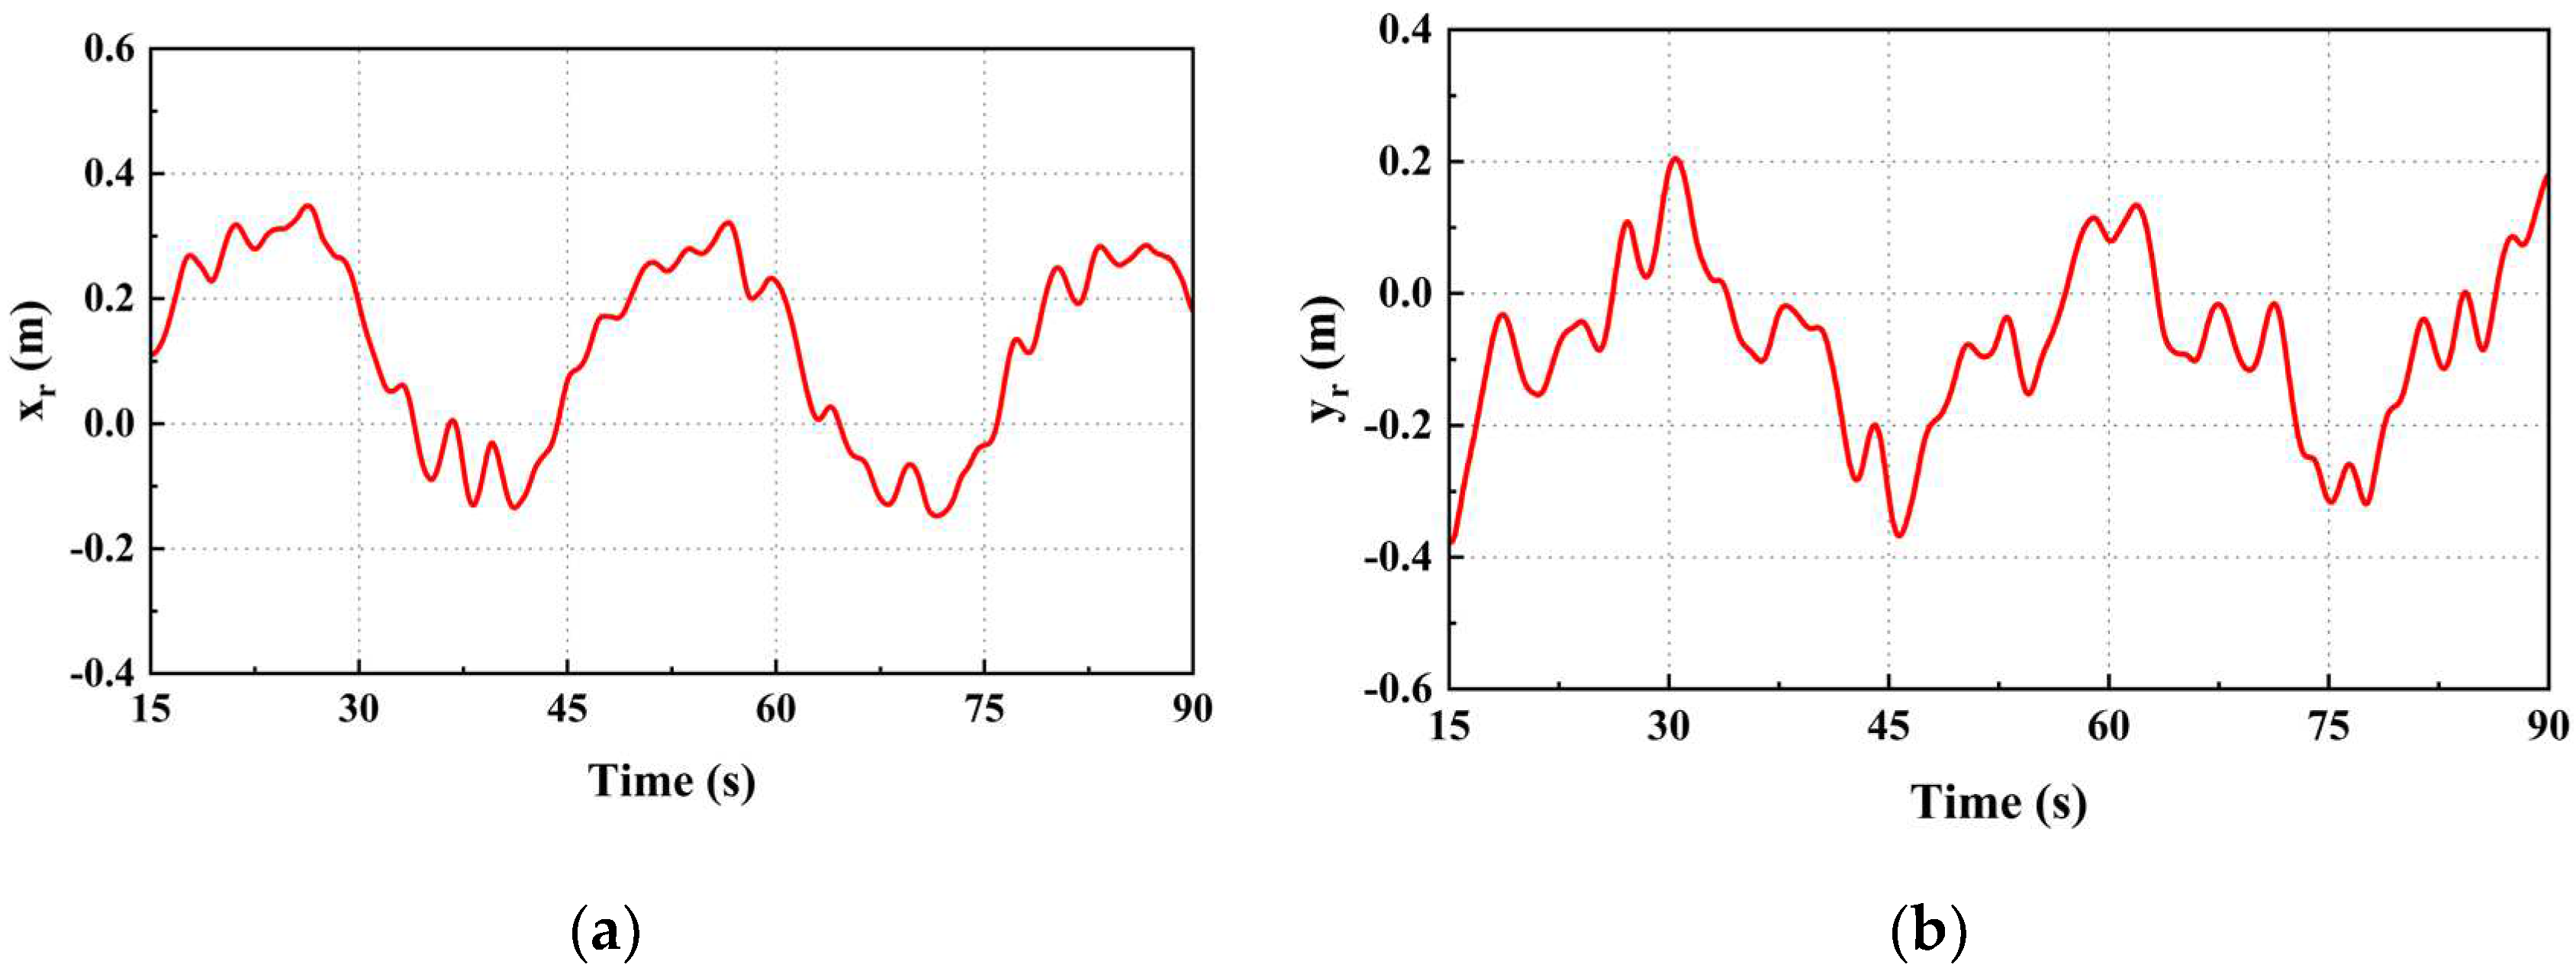
We can obtain the position and velocity deviation of the UAV and the UGV when the UGV moves in a straight-sided ellipse with velocity
v1 (
Figure 16 and
Figure 17). The position deviation between the UAV and the UGV in the x and y axes directions is always within the range of ±0.4m, and the speed deviation in the x and y axes directions is always within the range of ±0.15m/s, which indicates that the tracking performance of the UAV for the complex trajectory is still good.
3.2. Landing Experiments
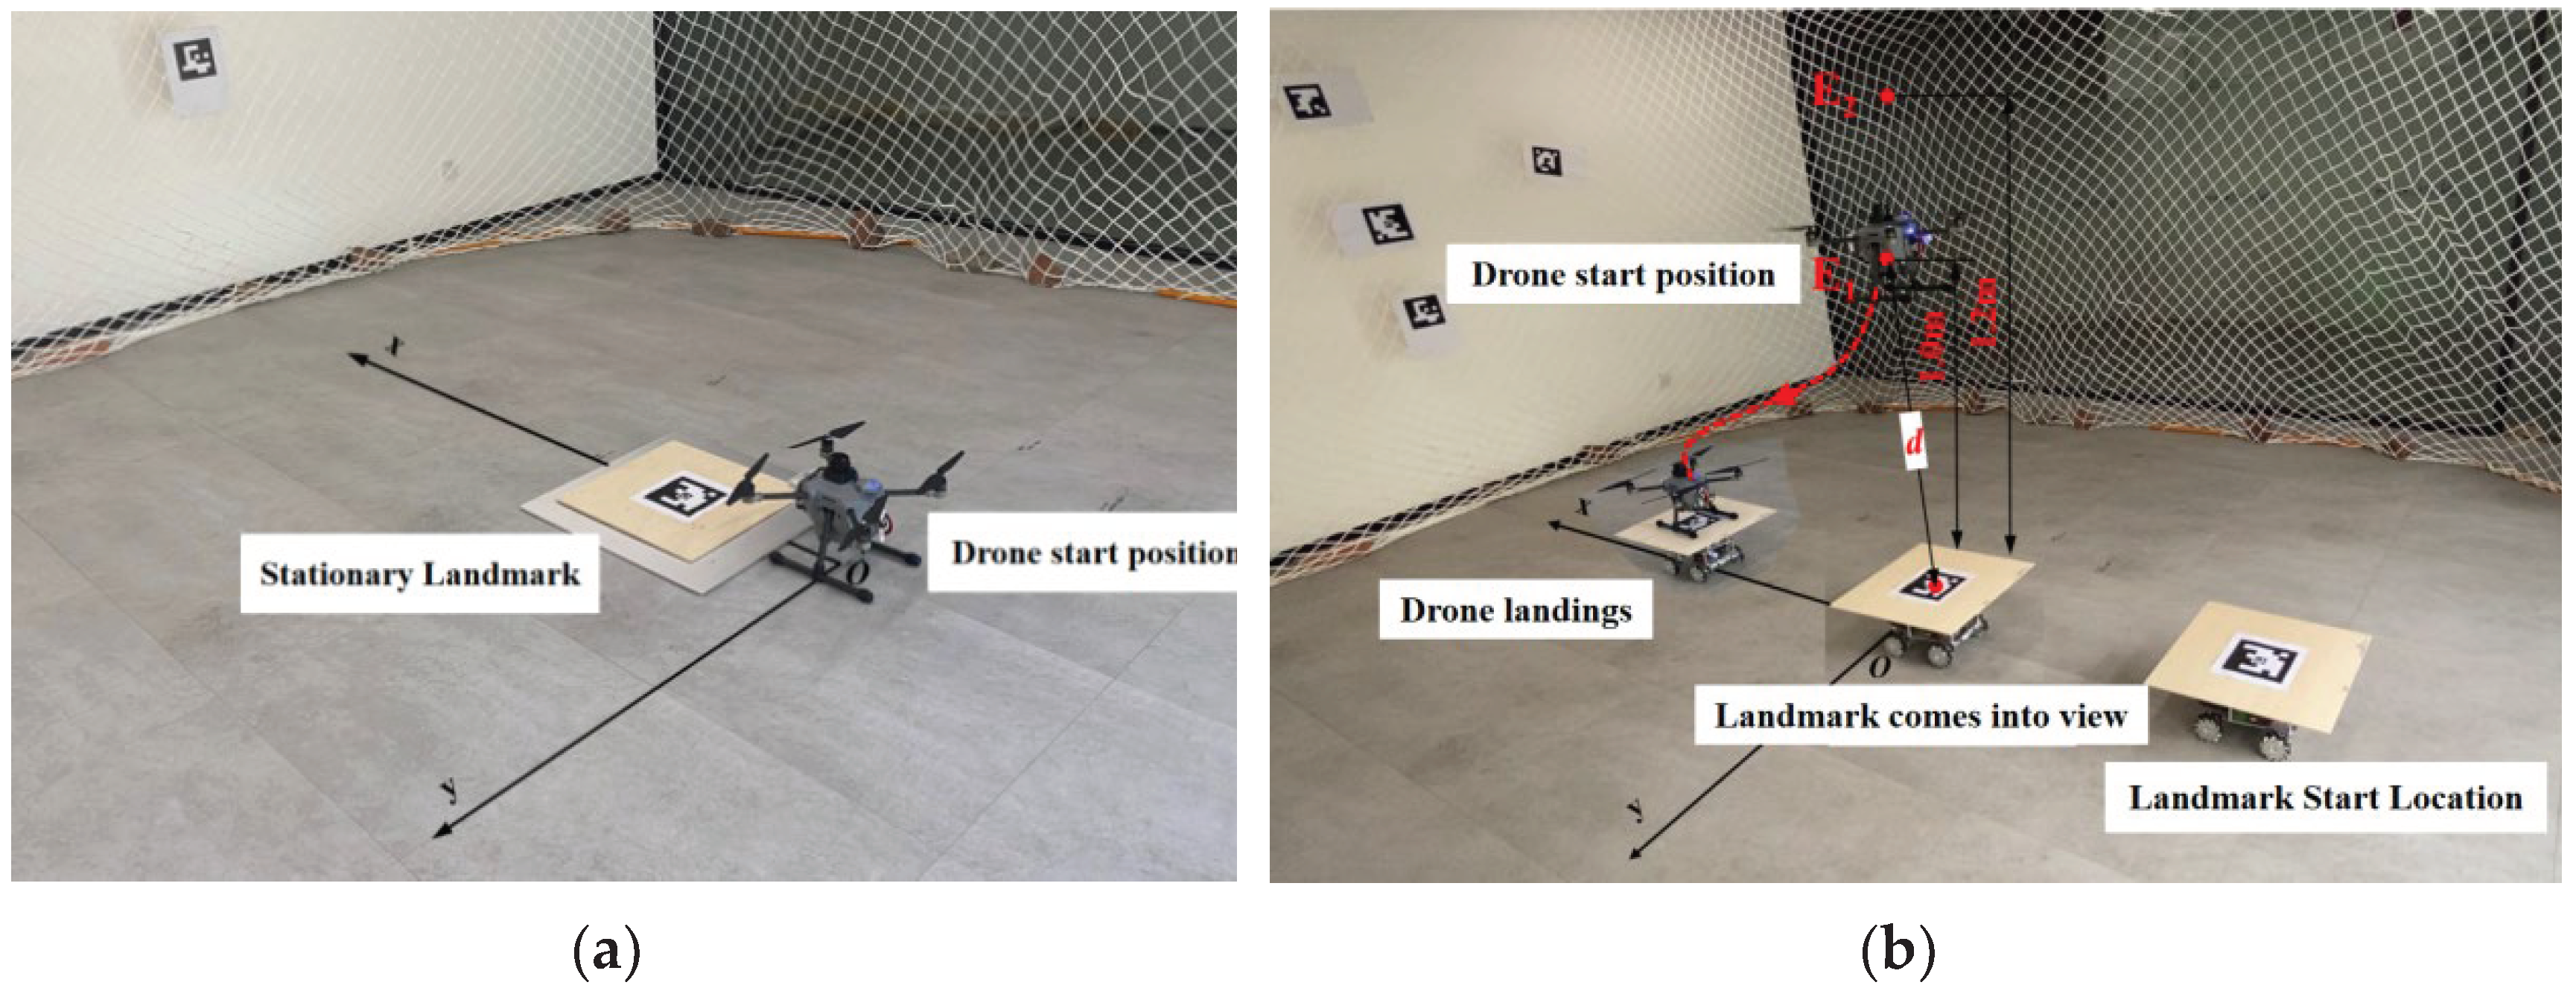
To further verify the landing performance of the UAV, we conducted landing experiments in static and dynamic scenarios (shown in
Figure 18). We expect the horizontal landing accuracy to be no more than 0.5m. In the stationary landmark landing experiment, the UAV ascends to a specific altitude and initiates a tracking landing mission once the landmark enters the field of view of the UGV. To minimize the possibility of error, we replicated three experiments and tabulated the x and y axes position coordinates and averaged values from each experiment in
Table 7. In the dynamic landing experiment, the UGV moves linearly along the x-axis at three different speeds, while the UAV performs dynamic tracking and landing experiments on the UGV. When the landmark enters the monocular camera's field of view, the UAV initiates the tracking landing mission. The UAV horizontally approaches the landmark while computing its relative position and attitude. Additionally, it adjusts its speed to match that of the UGV. As the UAV reduces its flight altitude, it measures its distance from the center of landmark
d. When the relative position of the two meets the landing conditions, the UAV enters the landing mode. When the distance,
d, is less than or equal to 0.3 meters, the on-board processor will send a command to the UAV flight controller to land. The motor will stop and the UAV will land on the UGV.
Table 8 displays the dynamic landing accuracy of the UAV at three separate vehicle speeds. The results of the experiment indicate that the UAV's static landing accuracy can achieve a range between 0.03 and 0.04 meters. During dynamic landing scenarios, the UAV demonstrated an x-axis landing accuracy of 0.23 meters and a y-axis landing accuracy of 0.2 meters, which is consistent with the predetermined expectations and satisfies the landing accuracy requirements.
Figure 1.
UAV visual tracking landing system control strategy.
Figure 1.
UAV visual tracking landing system control strategy.
Figure 2.
This is ArUco marker: (a) outer marker; (b) inner marker.
Figure 2.
This is ArUco marker: (a) outer marker; (b) inner marker.
Figure 3.
Parameter optimization experiment: (a) shows the experimental scenario; (b) shows the experimental design.
Figure 3.
Parameter optimization experiment: (a) shows the experimental scenario; (b) shows the experimental design.
Figure 4.
This is a tracking landing landmark.
Figure 4.
This is a tracking landing landmark.
Figure 5.
This is the experimental scenario.
Figure 5.
This is the experimental scenario.
Figure 6.
Linear reciprocating tracking experimental environment. C1 represents the initial altitude of the UAV while the UGV is in motion at velocity v1. The coordinates of point C1 in space are designated as (0m, 0m,1.0m). C2 is the initial altitude of the UAV while it travels at velocities v2 and v3. The coordinates of C2 are (0m, 0m, 1.2m). In all three velocity changes, the UGV's initial coordinates are consistently (-1.1m, 0m, 0m), while the landmark's initial position is (-1.1m, 0m, 0.3m) due to the landing platform's height being 0.3m from the ground.
Figure 7.
UAV x-axis position relationship diagram: (a) x-axis absolute position relationship; (b) Position deviation in x-axis direction.
Figure 7.
UAV x-axis position relationship diagram: (a) x-axis absolute position relationship; (b) Position deviation in x-axis direction.
Figure 8.
UAV y-axis position relationship diagram: (a) y-axis absolute position relationship; (b) Position deviation in y-axis direction.
Figure 8.
UAV y-axis position relationship diagram: (a) y-axis absolute position relationship; (b) Position deviation in y-axis direction.
Figure 9.
UAV and UGV line speed relationship chart: (a) x-axis velocity relationship; (b) y-axis velocity relationship.
Figure 9.
UAV and UGV line speed relationship chart: (a) x-axis velocity relationship; (b) y-axis velocity relationship.
Figure 10.
Position relationship between UAV and UGV at three speeds: (a) x-axis position deviation; (b) y-axis position deviation.
Figure 10.
Position relationship between UAV and UGV at three speeds: (a) x-axis position deviation; (b) y-axis position deviation.
Figure 11.
Velocity relationship between UAV and UGV at three speeds: (a) x-axis speed deviation; (b) y-axis speed deviation.
Figure 11.
Velocity relationship between UAV and UGV at three speeds: (a) x-axis speed deviation; (b) y-axis speed deviation.
Figure 12.
Circular trajectory tracking experimental environment. The starting coordinates of the UGV are consistently (0m, -0.8m, 0m). D1 represents the initial altitude of the UAV when the UGV is in motion at speed v1. The coordinates of D1 in space are (0m, 0m, 1.0m). D2 is another initial altitude of the UAV, but this time when the UGV moves at speeds v2 and v3. The coordinates of D2 are (0m, 0m, 1.2m).
Figure 13.
Position relationship between UAV and UGV at three speeds: (a) x-axis position deviation; (b) y-axis position deviation.
Figure 13.
Position relationship between UAV and UGV at three speeds: (a) x-axis position deviation; (b) y-axis position deviation.
Figure 14.
Velocity relationship between UAV and UGV at three speeds: (a) x-axis speed deviation; (b) y-axis speed deviation.
Figure 14.
Velocity relationship between UAV and UGV at three speeds: (a) x-axis speed deviation; (b) y-axis speed deviation.
Figure 15.
Straight sided ellipse trajectory tracking experimental environment. The coordinates of the UAV tracking start point are (0.9m, -0.6m, 1.0m) and the coordinates of the UGV start point are (-0.3m, -0.6m, 0m).
Figure 15.
Straight sided ellipse trajectory tracking experimental environment. The coordinates of the UAV tracking start point are (0.9m, -0.6m, 1.0m) and the coordinates of the UGV start point are (-0.3m, -0.6m, 0m).
Figure 16.
Position deviation of UAV from UGV: (a) x-axis position deviation; (b) y-axis position deviation.
Figure 16.
Position deviation of UAV from UGV: (a) x-axis position deviation; (b) y-axis position deviation.
Figure 17.
Speed deviation of UAV from UGV: (a) x-axis velocity deviation; (b) y-axis velocity deviation.
Figure 17.
Speed deviation of UAV from UGV: (a) x-axis velocity deviation; (b) y-axis velocity deviation.
Figure 18.
UAV landing experiment environment: (a) Static experimental environment, the landmark coordinate point is (0.48m, 0m, 0m) and the UAV start point is (0m, 0m, 0m); (b) Dynamic experimental environment, E1 serves as the initial altitude for the UAV when the UGV is traveling at speed v1. The coordinates of E1 in space are (0.0m, 0.0m, 1.0m). On the other hand, when the UGV is moving at speeds v2 and v3, E2 serves as the starting altitude point of the UAV, and its coordinates are (0.0m, 0.0m, 1.2m). It is worth noting that the UGV starting coordinates remain constant at (-1.1m, 0m, 0m) regardless of the speed.
Table 1.
Inner ArUco marker different sizes relative distance estimation data.
Table 1.
Inner ArUco marker different sizes relative distance estimation data.
| Size (mm) |
Reference Value (mm) |
Measured Value1 (mm) |
Measured Value2 (mm) |
Measured Value3 (mm) |
Average Value (mm) |
Deviation
(mm) |
| 20*20 |
300 |
306 |
310 |
312 |
309.3 |
9.3 |
| 350 |
- |
- |
- |
- |
- |
| 400 |
- |
- |
- |
- |
- |
| 500 |
- |
- |
- |
- |
- |
| 600 |
- |
- |
- |
- |
- |
| 30*30 |
300 |
313 |
312 |
311 |
312 |
12.0 |
| 350 |
369 |
366 |
368 |
367.7 |
17.7 |
| 400 |
426 |
419 |
421 |
422 |
22.0 |
| 500 |
- |
- |
- |
- |
- |
| 600 |
- |
- |
- |
- |
- |
| 40*40 |
300 |
313 |
311 |
313 |
312.3 |
12.3 |
| 350 |
369 |
366 |
371 |
368.7 |
18.7 |
| 400 |
426 |
419 |
421 |
423 |
23.0 |
| 500 |
524 |
527 |
520 |
523.7 |
23.7 |
| 600 |
- |
- |
- |
- |
- |
Table 2.
Outer ArUco marker different sizes relative distance estimation data.
Table 2.
Outer ArUco marker different sizes relative distance estimation data.
| Size (mm) |
Reference Value (mm) |
Measured Value1 (mm) |
Measured Value2 (mm) |
Measured Value3 (mm) |
Average Value (mm) |
Deviation
(mm) |
| 100*100 |
300 |
305 |
306 |
306 |
306 |
6 |
| 350 |
361 |
360 |
361 |
361 |
11 |
| 400 |
411 |
412 |
413 |
412 |
12 |
| 500 |
517 |
518 |
519 |
518 |
18 |
| 600 |
620 |
623 |
621 |
621 |
21 |
| 150*150 |
300 |
306 |
306 |
306 |
306 |
6 |
| 350 |
359 |
358 |
358 |
358 |
8 |
| 400 |
410 |
411 |
410 |
410 |
10 |
| 500 |
516 |
514 |
515 |
515 |
15 |
| 600 |
621 |
619 |
620 |
620 |
20 |
| 200*200 |
300 |
307 |
307 |
307 |
307 |
7 |
| 350 |
359 |
360 |
358 |
359 |
9 |
| 400 |
410 |
411 |
410 |
410 |
10 |
| 500 |
515 |
514 |
515 |
515 |
15 |
| 600 |
619 |
618 |
618 |
618 |
18 |
Table 3.
Mean and mean square deviation of the position deviation of UAV from the UGV.
Table 3.
Mean and mean square deviation of the position deviation of UAV from the UGV.
| Velocity |
Average Value Error |
Mean Square Error |
|
(m/s) |
(m/s) |
(m/s) |
(m/s) |
| v1 |
|
|
|
|
| v2 |
|
|
|
|
Table 4.
Mean square sum of velocity deviation of UAV and UGV.
Table 4.
Mean square sum of velocity deviation of UAV and UGV.
| Velocity |
Mean Square Error |
|
(m/s) |
(m/s) |
|
|
|
|
|
|
Table 5.
Mean and mean square deviation of the position deviation of UAV from the UGV.
Table 5.
Mean and mean square deviation of the position deviation of UAV from the UGV.
| Velocity |
Average Value Error |
Mean Square Error |
|
(m/s) |
(m/s) |
(m/s) |
(m/s) |
| v1 |
|
|
|
|
| v2 |
|
|
|
|
Table 6.
Mean square sum of velocity deviation of UAV and UGV.
Table 6.
Mean square sum of velocity deviation of UAV and UGV.
| Velocity |
Mean Square Error |
|
(m/s) |
(m/s) |
|
|
|
|
|
|
Table 7.
Static landing experiment accuracy and its mean value.
Table 7.
Static landing experiment accuracy and its mean value.
Experimental
Sequence |
x-Axis Landing
Accuracy (m) |
y-Axis Landing
Accuracy (m) |
| Test 1 |
0.05 |
0.04 |
| Test 2 |
0.01 |
0.04 |
| Test 3 |
0.04 |
0.05 |
| Average value |
0.03 |
0.04 |
Table 8.
Dynamic landing experiment accuracy and its mean value.
Table 8.
Dynamic landing experiment accuracy and its mean value.
| Velocity |
x-Axis Landing
Accuracy (m) |
y-Axis Landing
Accuracy (m) |
| v1 |
0.14 |
0.04 |
| v2 |
0.23 |
0.01 |
| v3 |
0.32 |
0.01 |
| Average value |
0.23 |
0.20 |
