
Submitted:
27 October 2023
Posted:
27 October 2023
You are already at the latest version
Abstract
Compton cameras detect scattered gamma rays and estimate the distribution of gamma-ray sources. Nonetheless, crafting a camera tailored to a specific application presents formidable challenges, often necessitating the implementation of diverse image reconstruction techniques. Delving into the factors influencing these cameras can pave the way for design optimization and performance enhancement. This study introduces an inventive detector design for Compton imaging systems, building upon the achievements of prior designs. The proposed system contains eight scatterer detectors and a semiconductor absorber detector, spaced at 1 mm and 30 mm intervals, respectively. The source-to-first-scatterer-detector distance is 5 mm, with scatterer and absorber detector plates measuring 70× 70× 2.125 mm3 and 70× 70× 10 mm3, respectively. Geant4 simulation toolkit models the Compton imaging system, and an analytical method reconstructs Compton camera images. Unlike more straightforward techniques, the analytical method directly reconstructs Compton camera images by solving the equation relating to the reflected image data. This approach is implemented in the C++ programming language. The study's findings reveal that the analytical method discerns optimal conditions and parameters that significantly influence efficiency, yielding a full width at half maximum (FWHM) of 3.7 mm with an angular uncertainty of approximately 2.7 degrees at an energy level of 0.662 MeV. Compared to another experimental design employing the analytical image reconstruction approach, the FWHM value decreased by 0.7 mm. This study presents an innovative detector design and an analytical reconstruction method for Compton imaging systems, showcasing improved efficiency and accuracy.
Keywords:
compton camera
; semiconductor detectors
; efficiency
; analytical reconstruction method
; Geant4
1. Introduction
Nuclear imaging systems are crucial in various applications, including detection, diagnosis, and therapy. Two main procedures in nuclear imaging are single-photon emission computed tomography (SPECT) and Compton imaging systems, both of which use gamma-ray emitting radioactive nuclei [1,2]. Positron emission tomography (PET) uses positron-emitting radioisotopes as radioactive materials [3].
SPECT typically uses mechanical collimators to determine the direction of gamma rays. In contrast, PET detects the coincidence of two 511 keV gamma rays emitted in opposite directions when a positron annihilates with an electron [4]. In contrast, Compton cameras use electronic collimators and do not require mechanical collimators for multinuclear imaging [5]. Although there has been less attention on electronic collimators in recent years, several studies have succeeded with Compton cameras. Several studies have reported successful in vivo multitracer imaging using Compton cameras [6,7,8].
Everett et al. first used Compton cameras for nuclear medicine imaging [9]. Additionally, studies [10,11] used a combination of Compton and PET cameras within a single system for imaging, whereas the Everett study used only a Compton camera. Comparing the Compton camera with PET and SPECT in terms of economic effectiveness and appropriate performance in medical applications has shown that the Compton camera has high potential in these situations, according to most studies [12,13,14]. Additionally, using scintillation and semiconductor detectors, Compton cameras have been investigated for ion-beam therapy [15,16,17].
Scintillation detectors first used the Compton imaging method to detect gamma rays in the mid-twentieth century. The Compton imaging method has proven helpful in astrophysical applications by Compton cameras [18]. It was later developed in 1961 and 1964 as the Compton telescope and Compton spectrometer, respectively [19,20]. The first Compton telescope to orbit Earth, COMPTEL, was launched in 1991 [21,22,23,24,25]. Researchers are developing Compton cameras for various astrophysical applications because of their detection capabilities [26].
Researchers have studied various structures and designs to improve the performance of Compton cameras. For example, Singh and colleagues developed the first Compton camera using pixelated arrays of Ge for the scatterer detector and NaI(TL) for the absorber detector [27]. Dogan and colleagues developed a new design that reduces multiple interactions using thin, independent, two-dimensional, position-sensitive layers [28]. Researchers have recently developed numerous Compton camera designs for different applications and employed various image reconstruction methods [29,30,31].
The Compton camera consists of a scatterer detector and an absorber detector, both sensitive to the energy and location of scattered gamma rays. The basic operating principles of the Compton imaging system are as follows: as illustrated in Figure 1, gamma rays from the source are scattered by the scatterer detector through Compton scattering and then absorbed by the absorber detector. By operating the scatterer and absorber detectors in coincident timing mode, a Compton camera can electrically detect gamma rays without limitation along their entry paths. This overcomes the constraint of mechanical collimation in prior techniques like SPECT, which restricted the complete detection of gamma-ray trajectories. The scatterer material in Compton cameras is commonly silicon, as it has an optimal Compton scattering cross-section for gamma rays in the prompt energy range typical of medical isotope emitters. Silicon exhibits less Doppler broadening than other semiconductors at these energies, increasing the probability of Compton interactions while reducing spectral distortions caused by electron binding and motion within the scatterer material [32].
The absorber detector detects the Compton-scattered photons through the photoelectric effect. In the Compton camera, the Compton scattering angle defines the opening angle of the cone. We define the cone axis as the line passing through the two scattering locations and extending perpendicularly from the circular base. The base of the cone traces the path of the initial gamma ray, with the interaction position in the first scatterer defining the cone's apex. The scattering angle, axis, base, and apex geometrically describe the Compton cone reconstructed from each scattered gamma ray interaction. The correct events are identified within the conical surfaces formed by the intersection of numerous cones [27]. A 'correct' event refers to one that has been accurately reconstructed based on the known interaction locations and scattering angle. Due to potential degeneracies where different gamma-ray trajectories could be consistent with the same scattering data, multiple cones may intersect at the actual emission point. Therefore, identifying the correct events involves analyzing the intersections of multiple cones to determine which ones are consistent with a unique, real gamma ray interaction. We can use Eq. (1) to describe the Compton scattering angle [33]:
where is the incoming gamma-ray energy, is the scattered gamma-ray energy immediately after contact, and is the electron's rest mass energy.
Image reconstruction in a Compton camera poses a challenging task that has hindered its adoption as a viable alternative to SPECT in modern clinics. This is due to the difficulty of performing image reconstruction and the high computing requirements for executing image reconstruction procedures. While both Compton and gamma cameras find application in SPECT, each method generates data that exhibit substantial differences. Consequently, the analytical image reconstruction techniques developed for gamma-based SPECT systems cannot directly be employed with Compton cameras.
Image reconstruction procedures commonly used for Compton cameras include filtered back projection (FBP) algorithms [34,35], maximum likelihood expectation maximization (MLEM) techniques [36,37], and list mode maximum likelihood algorithm (LM-ML) methods [38]. FBP algorithms are widely employed as they provide rapid image reconstruction but can suffer from artifacts. MLEM techniques iteratively maximize the likelihood of obtaining the measured data and tend to produce higher-quality images, though they require more computation time. LM-ML algorithms treat each detected photon interaction as an independent event, allowing efficient modeling of the Compton camera's response function.
Analytical image reconstruction is one of the techniques used for Compton camera image reconstruction. Nonetheless, researchers and professionals employ iterative reconstruction and hybrid methods to enhance image quality and reduce computation time. Continued research in image reconstruction is necessary to improve the accuracy and efficiency of Compton camera imaging. Some analytical methods utilize linear algebraic techniques to find an analytical solution to the image reconstruction problem. Specifically, these methods apply projection operators that model the system matrix of the Compton camera, allowing direct inversion to obtain the reconstructed image. The goal of the analytical method is to discover an analytical solution or to use operators that enable the discovery of an analytical solution.
Efficiency is one of the most critical parameters affecting the output image quality of a Compton camera [39]. The Compton camera efficiency is defined as the ratio of photons absorbed by Compton scattering in the scatter detector without any interaction in the absorber detector [40]. This study developed a new design based on research into Compton camera efficiency using semiconductor detectors [41]. The simulations used the Geant4 Monte Carlo code toolkit [42] to evaluate the efficiency sensitivity of the proposed design.
The goal of simulating the Compton imaging system and analyzing the efficiency sensitivity results in this study is to identify the optimal mode to improve the output image quality and reduce image noise in Compton camera imaging. By optimizing the design parameters, such as the energy threshold and detector size, the efficiency of the Compton camera can be improved, leading to better image quality and more accurate disease diagnosis.
The remaining sections of this paper can be summarized as follows: Section 2 introduces the theory of analytical image reconstruction in the Compton camera and presents the technique for simulating the Compton camera using the Geant4 code. Section 3 presents the design of a novel Compton camera utilizing semiconductor detectors. The new design was also simulated based on the efficiency study in this section and compared with the experimental data from a different study. Finally, Section 4 discusses the results and conclusions of this study.
2. Material and Methods
2.1. Analytical Image Reconstruction in the Compton Camera
The analytical reconstruction method used in Compton imaging systems involves directly reconstructing the image by solving the equation that reflects the data in the image. The Compton camera provides a list of coincident events, each involving a pair of interactions, one in the scatterer detector and the other in the absorber detector. The Compton imaging system employs pixelated screens for two-dimensional imaging to locate the source. Each pixel's count is determined by intersecting the cone sections with the image plane and selecting only the correct events.
As shown in Figure 2, this analytical method demonstrates the number of cone passes per pixel, documenting a pixelated two-dimensional image of four events. Indeed, when there are four cones, they collectively form the solution we seek at the point of their intersection.
In Eq. (2), the cones are reconstructed based on the interaction coordinates and in the absorber and scatterer detectors, respectively, as well as the scattering angle and the position of the photon emission coordinates :
Eq. (2) identifies the points from which the photon is emitted for each event and generates a cone of possible locations. If and are decomposed into components, Eq. (3) is obtained:
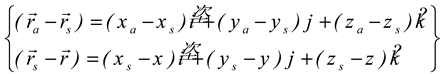
Eq. (4) derived by inserting Eq. (3) into Eq. (2):
The values of , , and are given in Eq. (5):
By placing the image plane perpendicular to the z-axis, we can derive Eq. (4) for the conic section resulting from the intersection of the image plane with Eq. (6), as follows:
Calculating the intersection of cones with the two-dimensional image plane reduces the three-dimensional problem to a two-dimensional one. This allows us to draw conic sections directly on the image plane ().
2.2. Simulation of Compton Cameras Using the Geant4 Toolkit and Analytical Image Reconstruction
The Compton camera simulation program generates seven values for each event of interest, including the interaction location in the scatterer and absorber detectors and the energy lost in the scatterer detector [43]. Unlike the gamma camera, a single event alone does not provide sufficient information to locate the source accurately [44]. Therefore, multiple events must be analyzed to construct a reliable image of the source location. The simulation utilized Geant4, a Monte Carlo code that researchers have also employed to evaluate the efficiency of Compton cameras.
Geant4 was used to simulate a simple Compton camera pattern, as illustrated in Figure 3. In this illustration, the absorber is represented by Ge, and the scatterer is represented by Si. It is worth noting that Cs-137 (662 keV) gamma rays undergo scattering from Si into Ge. In our previous work, we utilized this same stationary photon model to study factors influencing the detection efficiency of a Compton camera [41,45]. For the simulation, the absorber and scatterer detectors were pixelated using the "G4PVReplica" function in the geometry section of Geant4. The C++ code for analytical reconstruction interprets the information contained within the 'comptonresult.txt' output file to identify the correct pixel position where the event occurred. This file contains data from the simulation that is analyzed by the C++ code to determine the pixel location, rather than explicitly specifying the position within the file itself. The determination of the image plane size involves the calculation of values such as "xmin," "xmax," "ymin," and "ymax." These values are subsequently used in conjunction with the specified number of pixels for the image screen to derive the intervals for each pixel, denoted as "xstep" and "ystep." The values in Eq. (6) are then calculated based on the input file (constant z), where x and y are unknowns. To solve for x, "x=xmin" is set, and "y" is calculated using the quadratic equation. In the end, the code verifies the intersection of the generated curve with the designated plane for every pixel. This iterative process is applied to all events, and the outcomes are recorded in the "array1.txt" file as two-dimensional arrays, which are essential for subsequent image reconstruction.
The Gnuplot data analysis software uses image reconstruction for 10, 100, and 1000 events, as shown in Figure 4, Figure 5 and Figure 6. Therefore, the position of the source can be obtained by overlapping the conical sections and planes with more events. As shown in Figure 4, Figure 5 and Figure 6, the more events used to reconstruct the images, the better the position and intensity of the source are determined.
3. Results and Discussion
In this multi-section exploration, we delve into the intricacies of our study, breaking it down into several key stages for clarity and detail."
3.1. Introduction and Prior Work
- Efficiency Sensitivity Analysis: The results presented in Table 1 guided us to propose a novel camera design based on an efficiency sensitivity analysis of the Compton camera.
- Design Requirements: The new design necessitates scatterer detector arrays with dimensions of , absorber detector arrays with dimensions of , and image screen arrays measuring to define the image.
- Geometric Configuration: As illustrated in Figure 7, the configuration specifies the distance between the first scatterer detector and the selected radioactive source (5 mm), along with eight scatterer layers with 2.125 mm thickness and 1 mm spacing between them.
3.2. Simulation and Image Reconstruction
- Simulation Tool: The simulation employed Geant4, a Monte Carlo code.
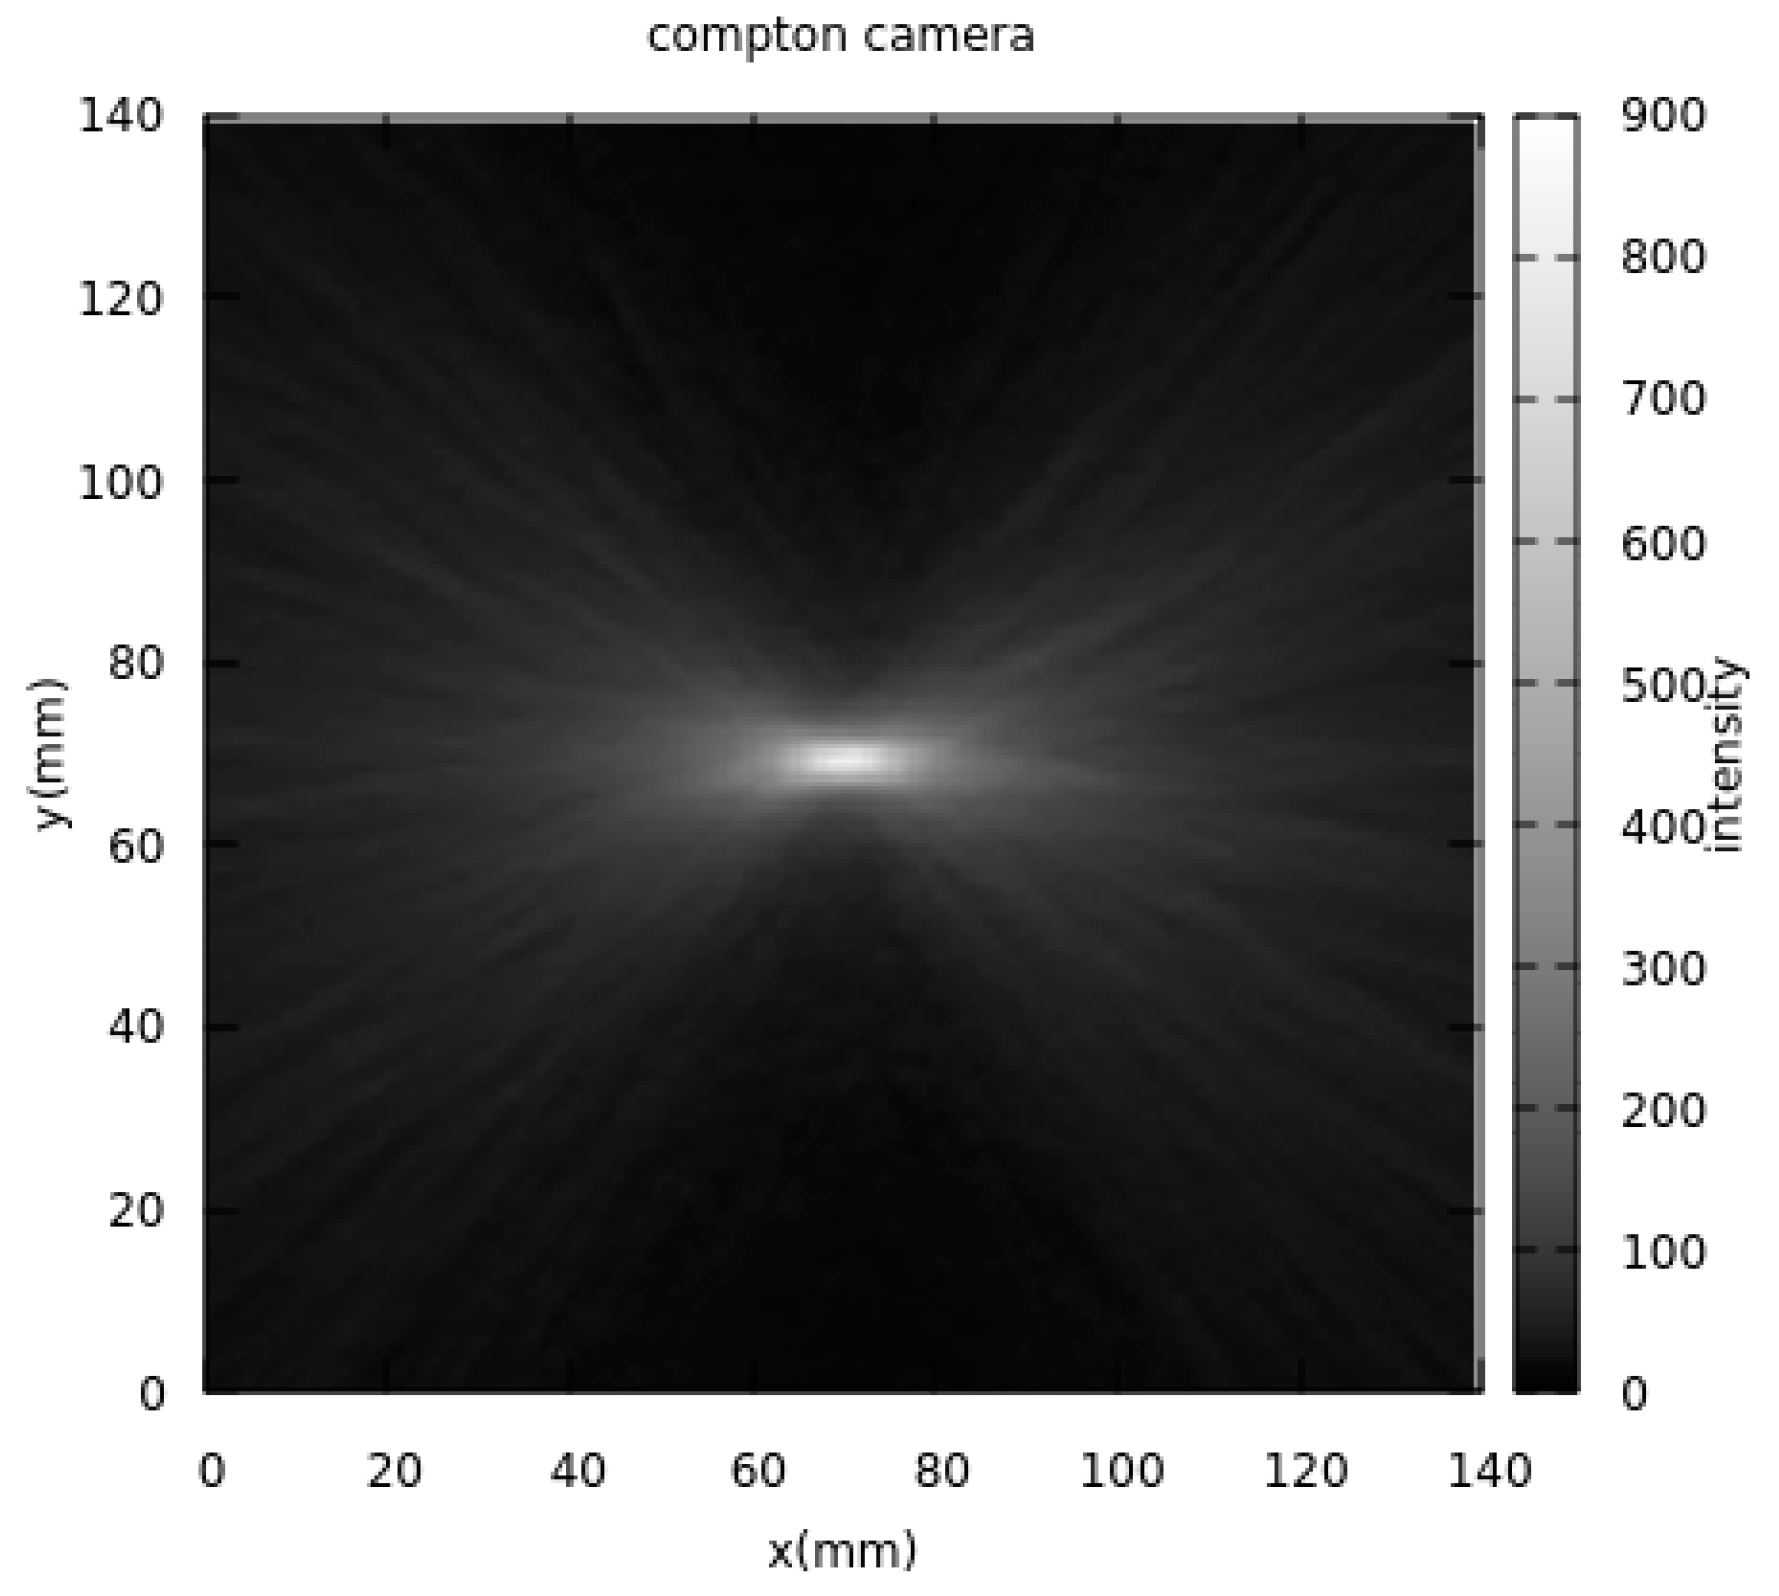
- Image Reconstruction: Figure 8 displays the 2D image reconstruction, locating the source at the intersection of the image screen and cones formed by correct events within the Compton imaging system.
- Image Verification: Following the reconstruction, the image screen was placed at the source location to verify accuracy.
3.3. Image Reconstruction and Analysis
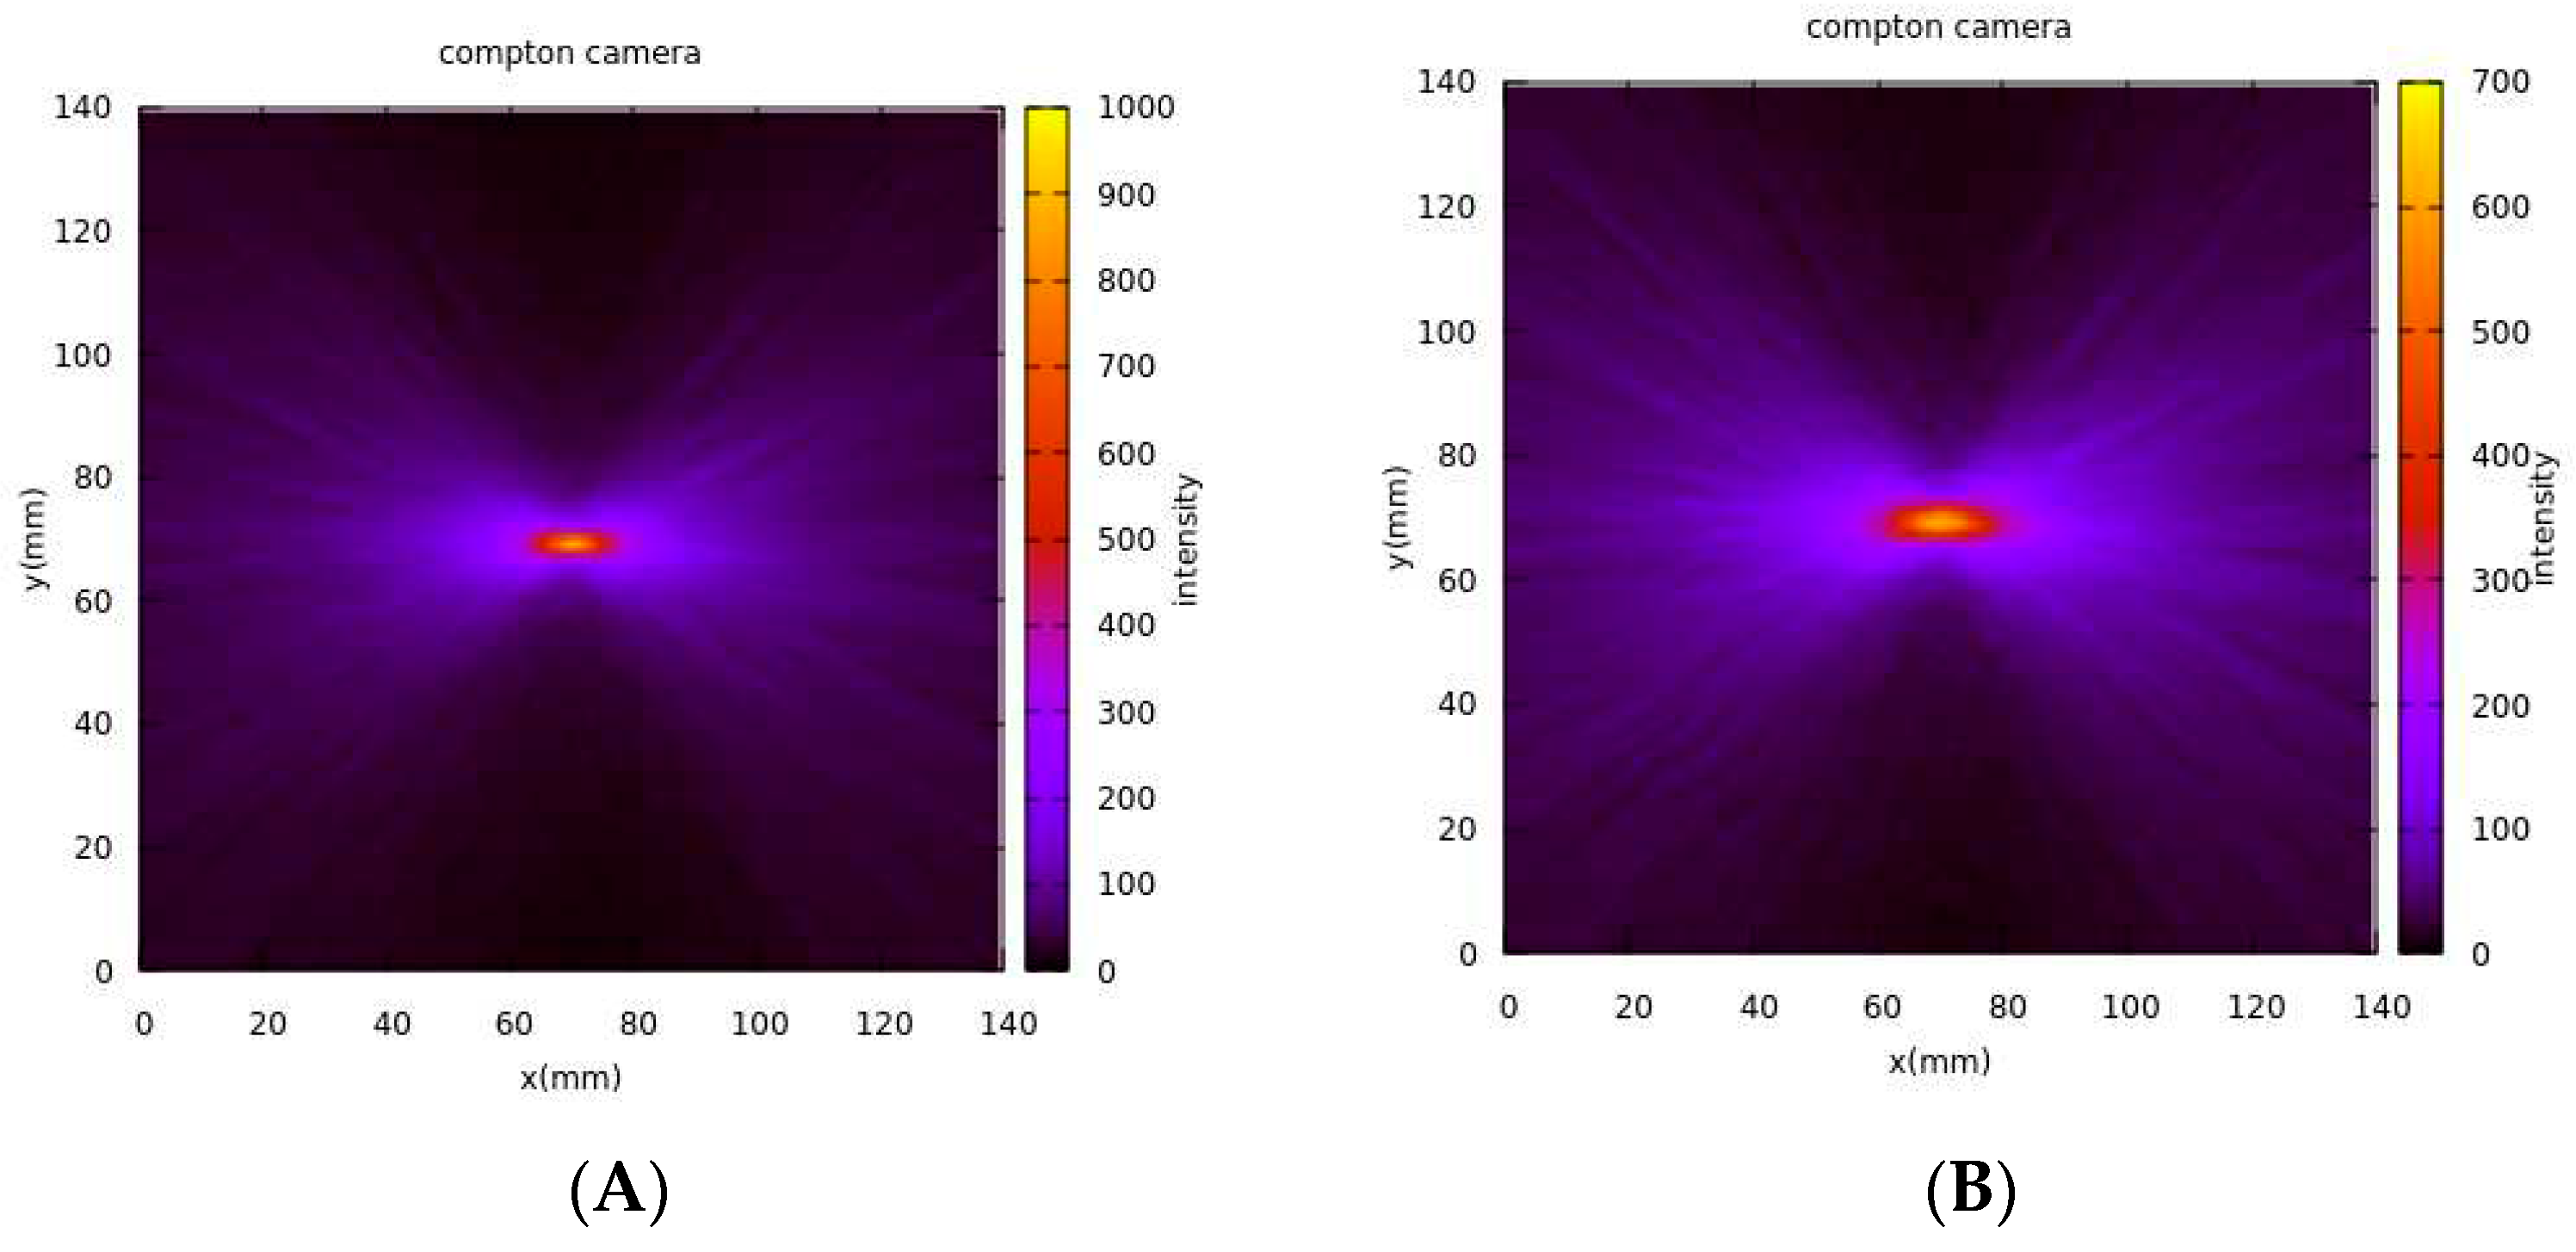
- Image Reconstruction at Varying Distances: The image was reconstructed using the Gnuplot tool at distances of 10, 15, 20, 25, and 50 mm from the screen of the first scatterer detector, as depicted in Figure 9.
- Functionality Demonstration: The purpose of Figure 9 is to showcase the expected functionality of the reconstruction algorithm.
- Distance Impact on Image Clarity: The results indicate that increasing the distance from the source reduces the intensity of events used for reconstruction, impacting source localization clarity.
- Uncertainty at 10 mm: Notably, at a distance of 10 mm from the first scatterer detector, there is a measurable level of uncertainty in determining the source position along the z-axis. This is visible in the figures as a blurred or less-defined reconstructed source image, especially compared to other distances. The increased uncertainty at 10 mm affects the overall image quality.
Figure 7.
Geometry and source used in image reconstruction of the Compton camera.
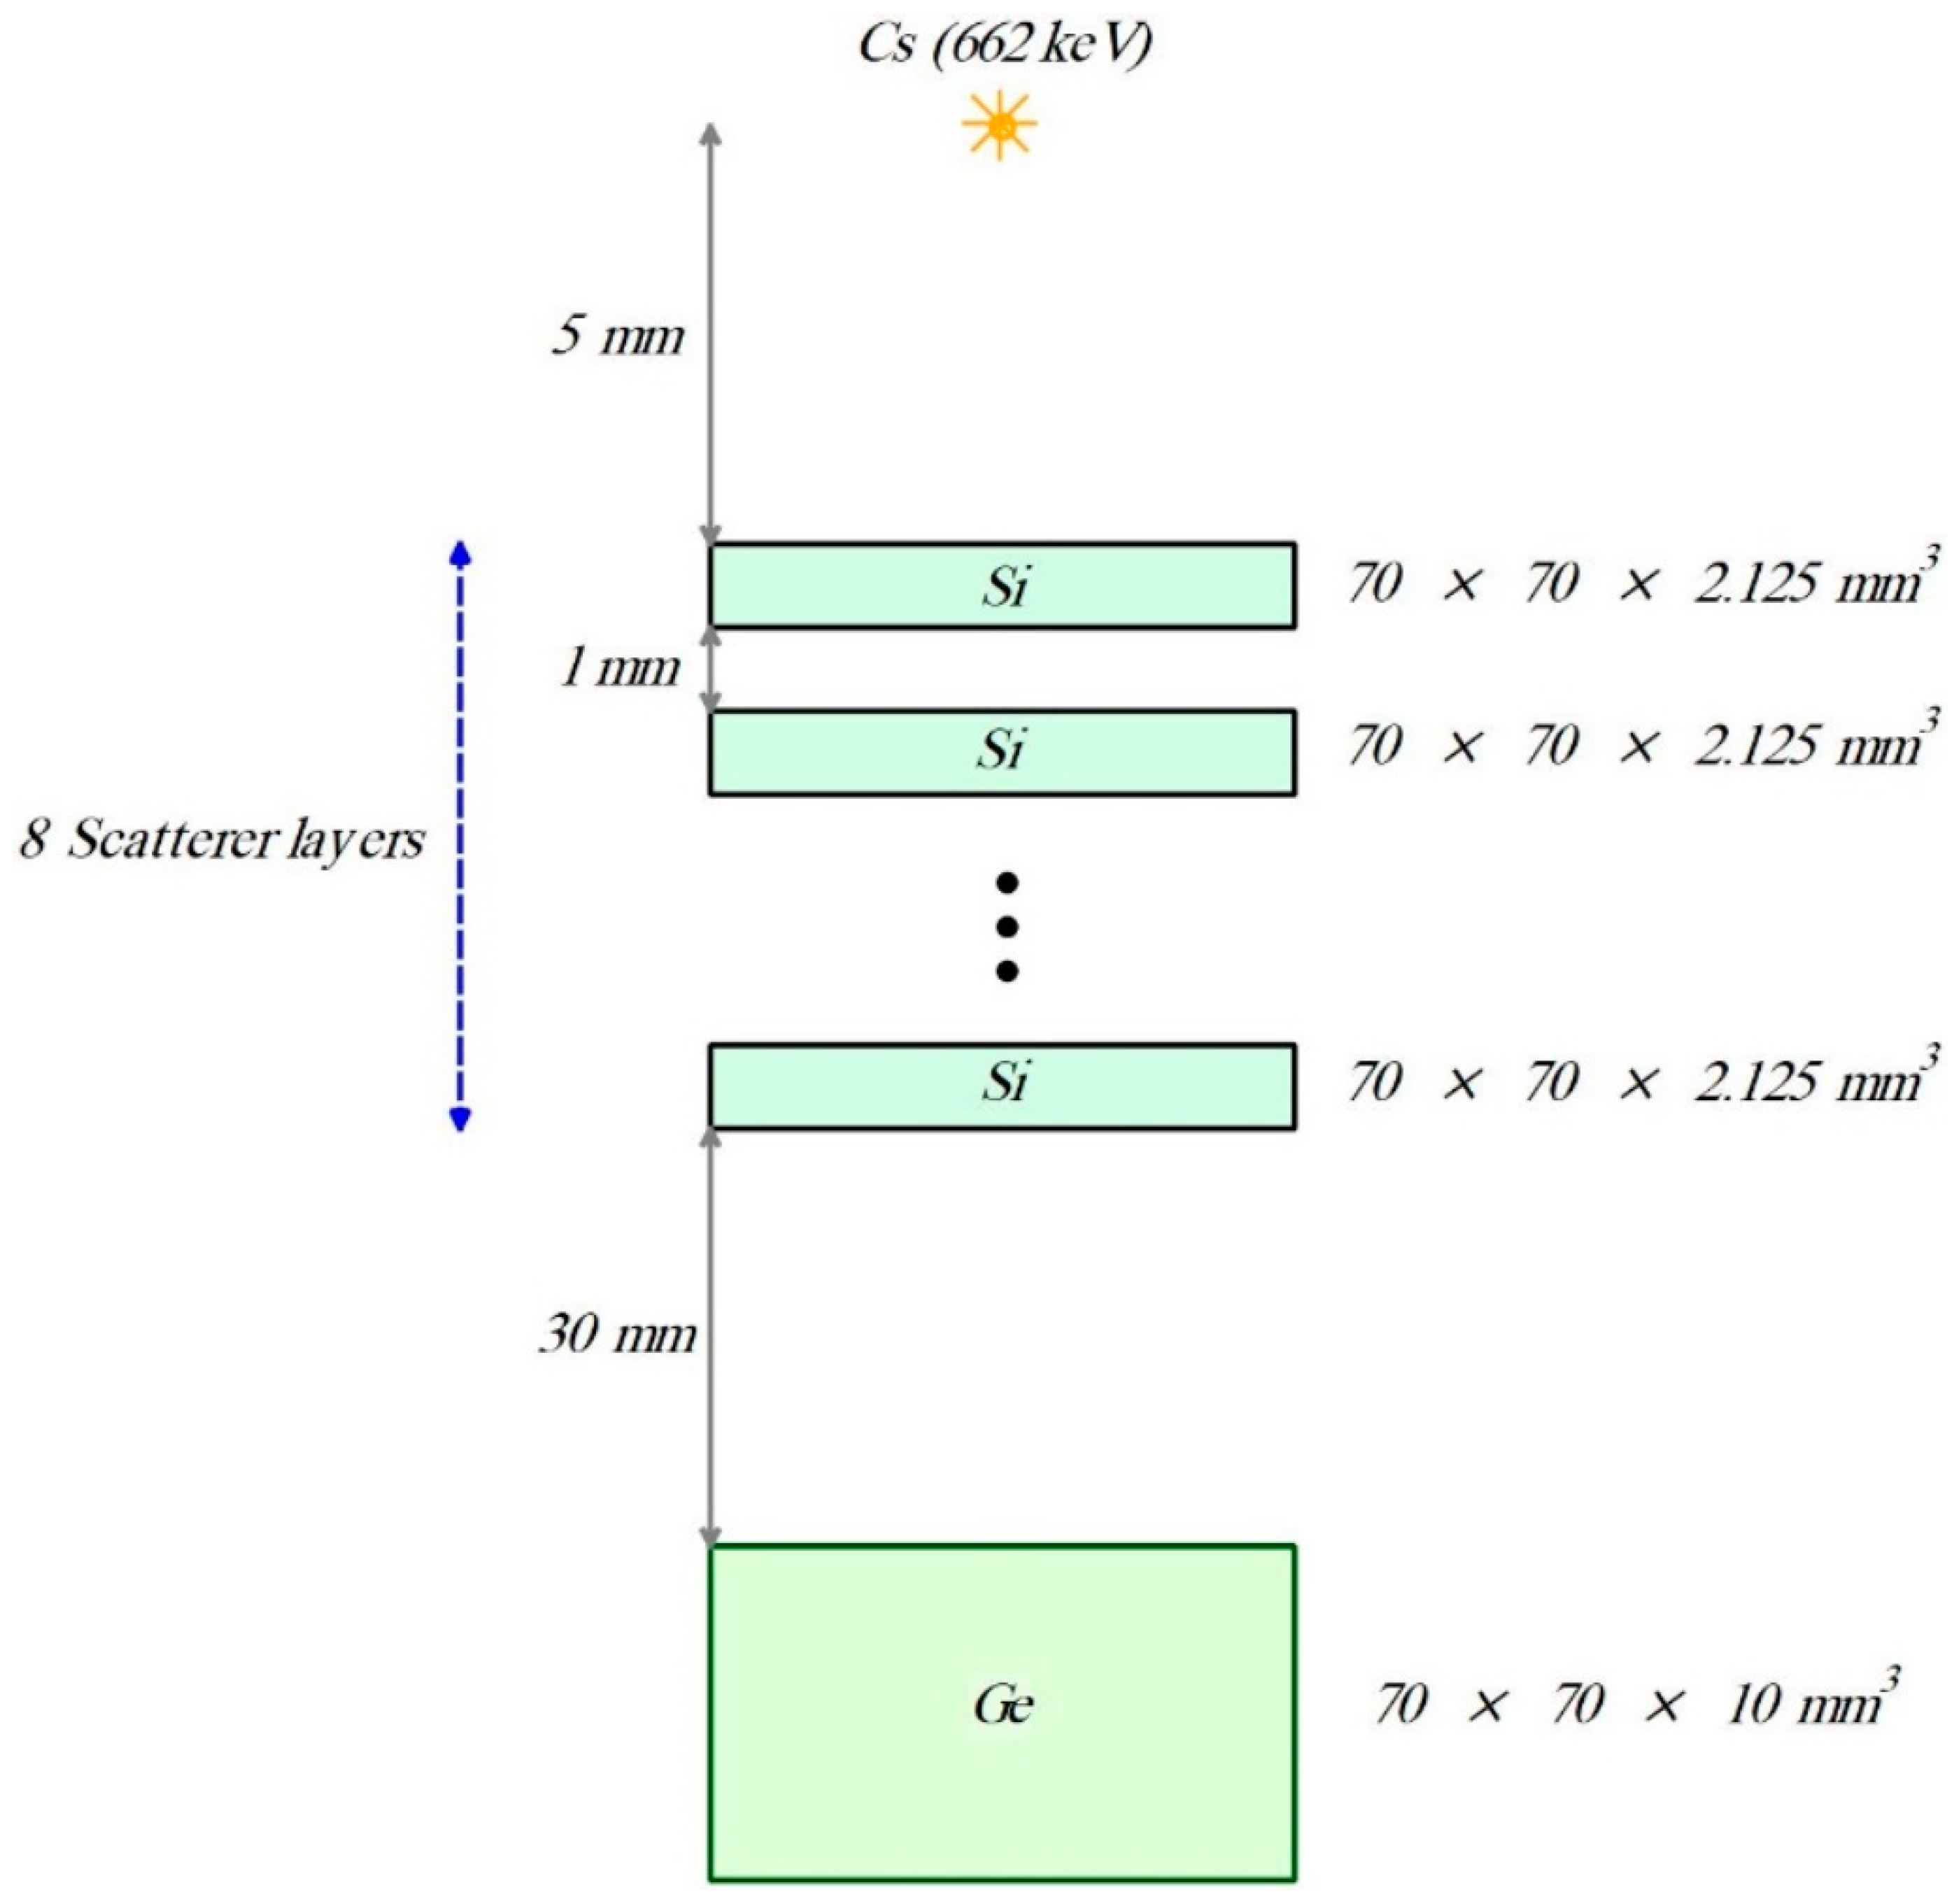
Figure 8.
Analytical image reconstruction of the Compton camera in 2D for Figure 8 with the Gnuplot tool.
Figure 8.
Analytical image reconstruction of the Compton camera in 2D for Figure 8 with the Gnuplot tool.
3.4. Spatial Resolution Analysis
- Spatial Resolution Assessment: Figure 10 presents the Full Width at Half Maximum (FWHM) as a measure of the spatial resolution of the Compton camera, specifically for image reconstruction along the y-axis.
- Angular and Spatial Uncertainty: For an energy of 0.662 MeV, the angular uncertainty is 2.7 degrees, and the spatial uncertainty is 3.7 mm.
- Impact of Electronic Noise: Note that the calculations were conducted without considering electronic noise, which can significantly influence image quality depending on camera design and conditions.

Table 1.
The parameter under investigation is efficiency sensitivity analysis in the Compton camera [41].
Table 1.
The parameter under investigation is efficiency sensitivity analysis in the Compton camera [41].
| The parameter under investigation | The range where the efficiency value is optimal. |
| Distance between the source and scatterer detector | 5 mm |
| Distance between the scatterer detector and the absorber detector |
30 mm (It decreases exponentially with increasing distance) |
| Dimensions of the scatterer detector plate |
70 mm (It is almost constant) |
| Dimensions of the absorber detector plate |
70 mm (increases linearly) |
| The thickness of the scatterer detector | 17 mm |
| The thickness of the absorber detector |
10 mm (It increases exponentially) |
| The energy source. |
662 keV (The choice of the source according to the intended application) |
| Number of scatterer detector layers (Single to multiple ratios) | 8 |
Figure 9.
Analytical image reconstruction of the Compton camera for Figure 8 at the intersection of the screen at distances of (A) 10 mm, (B) 15 mm, (C) 20 mm, (D) 25 mm and (E) 50 mm from the screen of the first scatterer detector.
Figure 9.
Analytical image reconstruction of the Compton camera for Figure 8 at the intersection of the screen at distances of (A) 10 mm, (B) 15 mm, (C) 20 mm, (D) 25 mm and (E) 50 mm from the screen of the first scatterer detector.
3.5. Experimental Research Design
- Introduction to Experimental Design: A fresh phase of the study explores an experimental research design employing the Compton imaging system to capture an image of a gamma-ray source, as illustrated in Figure 11.
3.6. Experimental Design Details
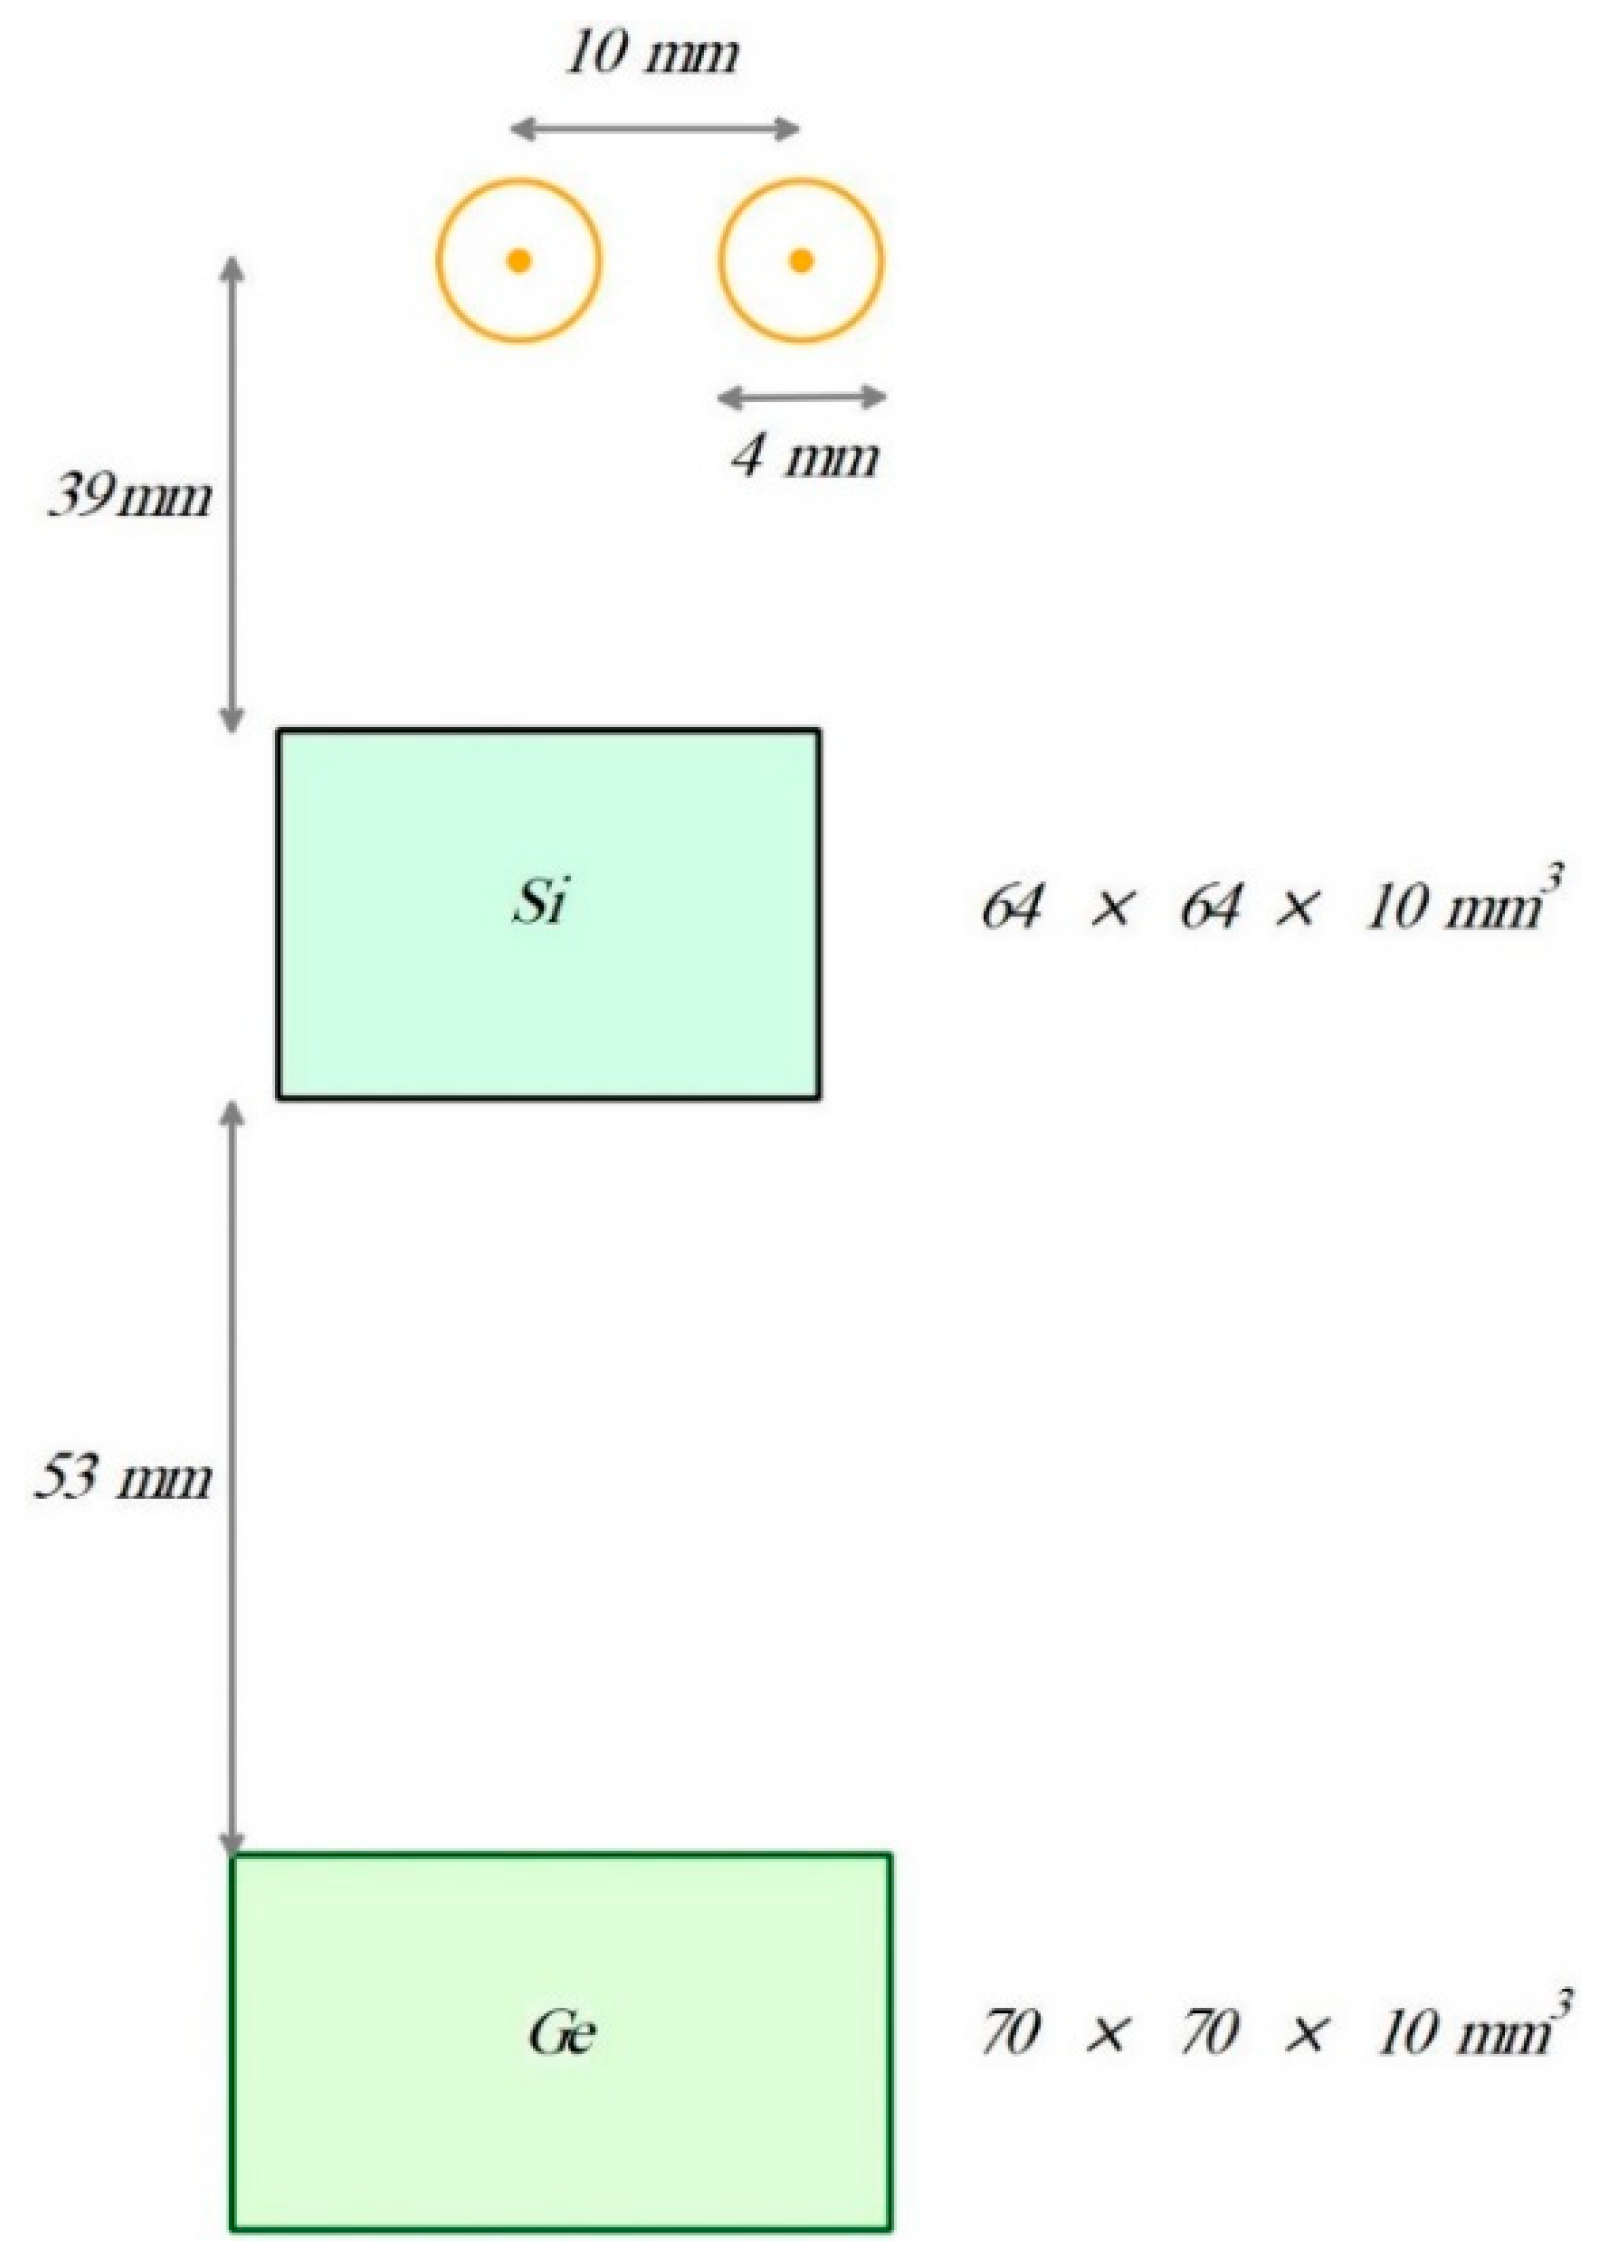
- Novel Experimental Setup: Figure 12 reveals the novel design of the proposed Compton imaging system tailored specifically for this experimental research. The gamma-ray source is enclosed within an ultra-thin hollow sphere less than 1 mm thick.
- Energy Sources: The radioisotope used in the experiment emits gamma rays with energies of 0.024 and 0.392 MeV, with the 0.392 MeV gamma ray serving as the primary detection source.
- Threshold Implementation: A threshold was introduced to filter out signals that do not meet the minimum energy requirement for gamma rays at this higher energy level.
- Conical Interaction: A threshold level was defined to enable the interaction of gamma rays with conical half-angles exceeding 20 degrees.
Figure 11.
The geometry used in the study [17] to simulate and reconstruct the image of experimental research.
Figure 11.
The geometry used in the study [17] to simulate and reconstruct the image of experimental research.
3.7. Geometric Setup and Material Details
- Chamber Construction: The chamber was constructed using "G4Sphere," specifying inner and outer radii and source dimensions.
- Material Selection: The universe's volume was cubic, filled with air, and the chamber's polymer material was polyethylene.
- Element and Material Specifications: Geometries incorporated elements and materials using "G4Element" and "G4Material" classes, specifying properties such as atom type, atomic number, mass number, molar weight, and constituent element percentages.
3.8. Radioactive Source and Simulation
- Source Generation:"G4GeneralParticleSource" was employed to create a radioactive source. The volumetric radioactive source had specific dimensions.
- Simulation with Standard Model:The simulation was executed using the standard model, including electromagnetic processes, which generated a physical list for simulation.
- Scattering Angle Selection:Events featuring a scattering angle greater than 20° were extracted using C++ code.
3.9. Image Reconstruction and Comparison
- Image Reconstruction with Analytical Method:The image reconstruction involved a pixelated screen at the source's center with a two-dimensional configuration.
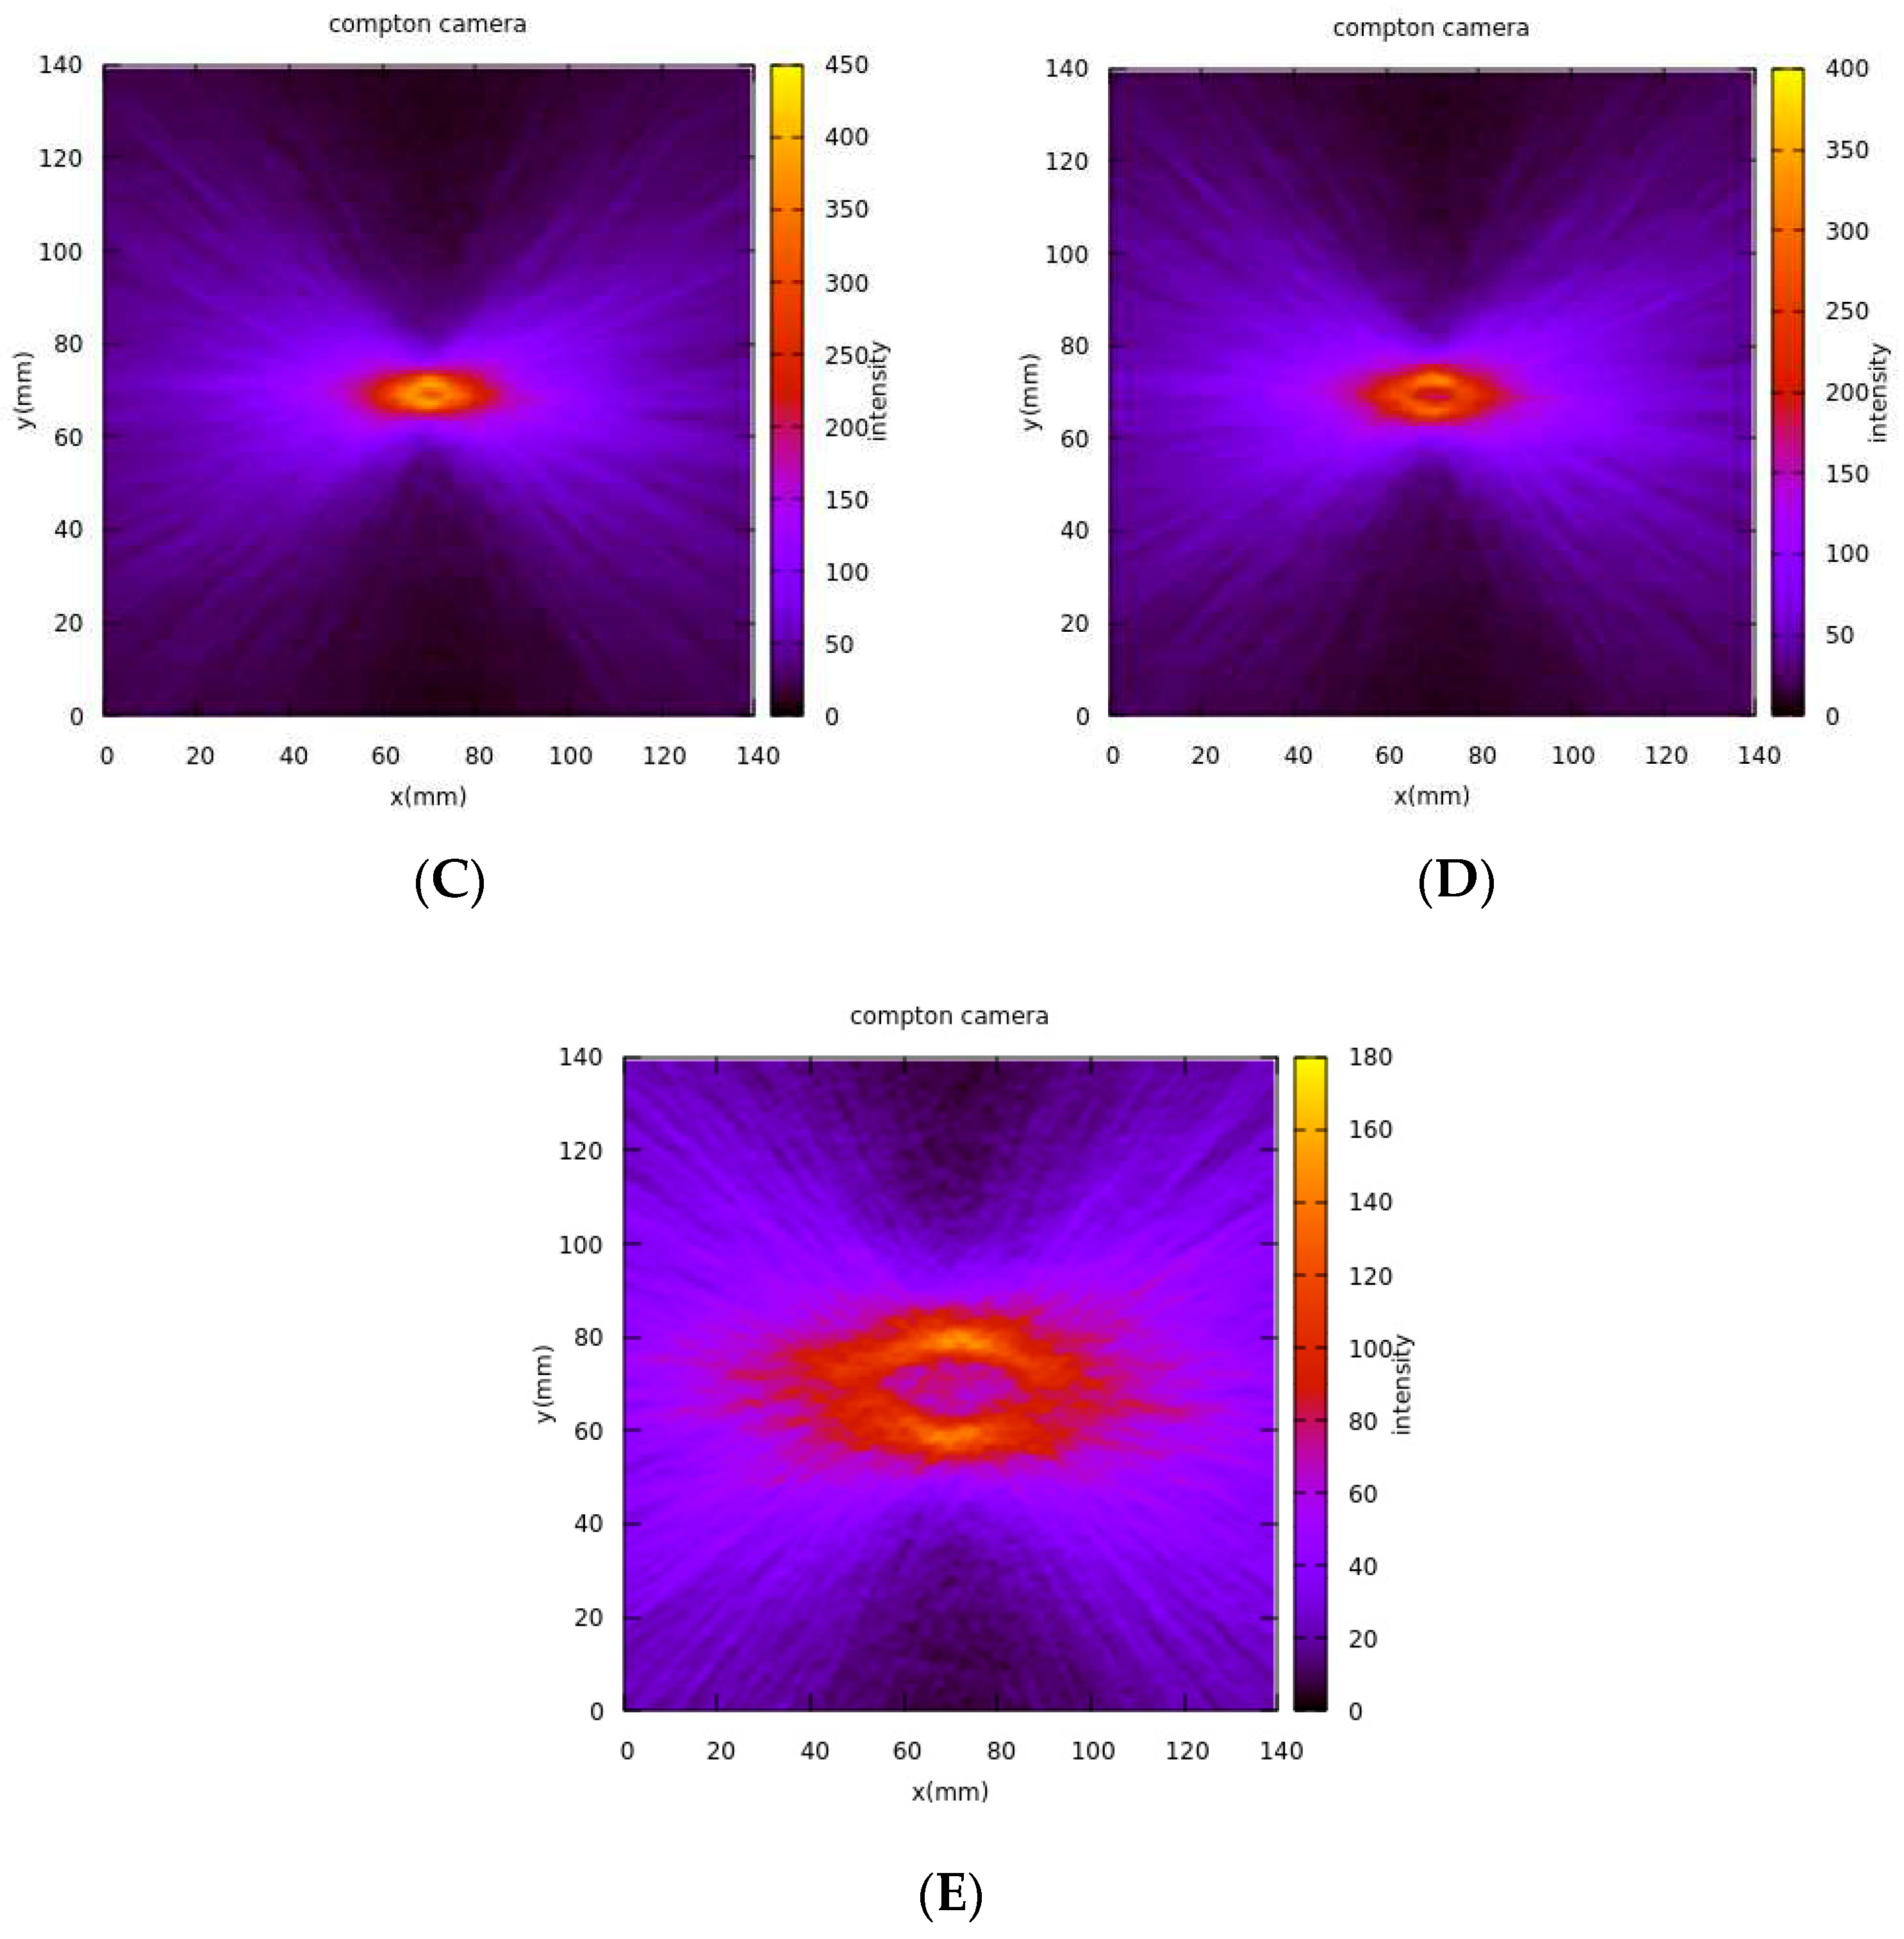
- Source Center Determination:Figure 13demonstrates the precise determination of the source's center, as observed in the experimental results.
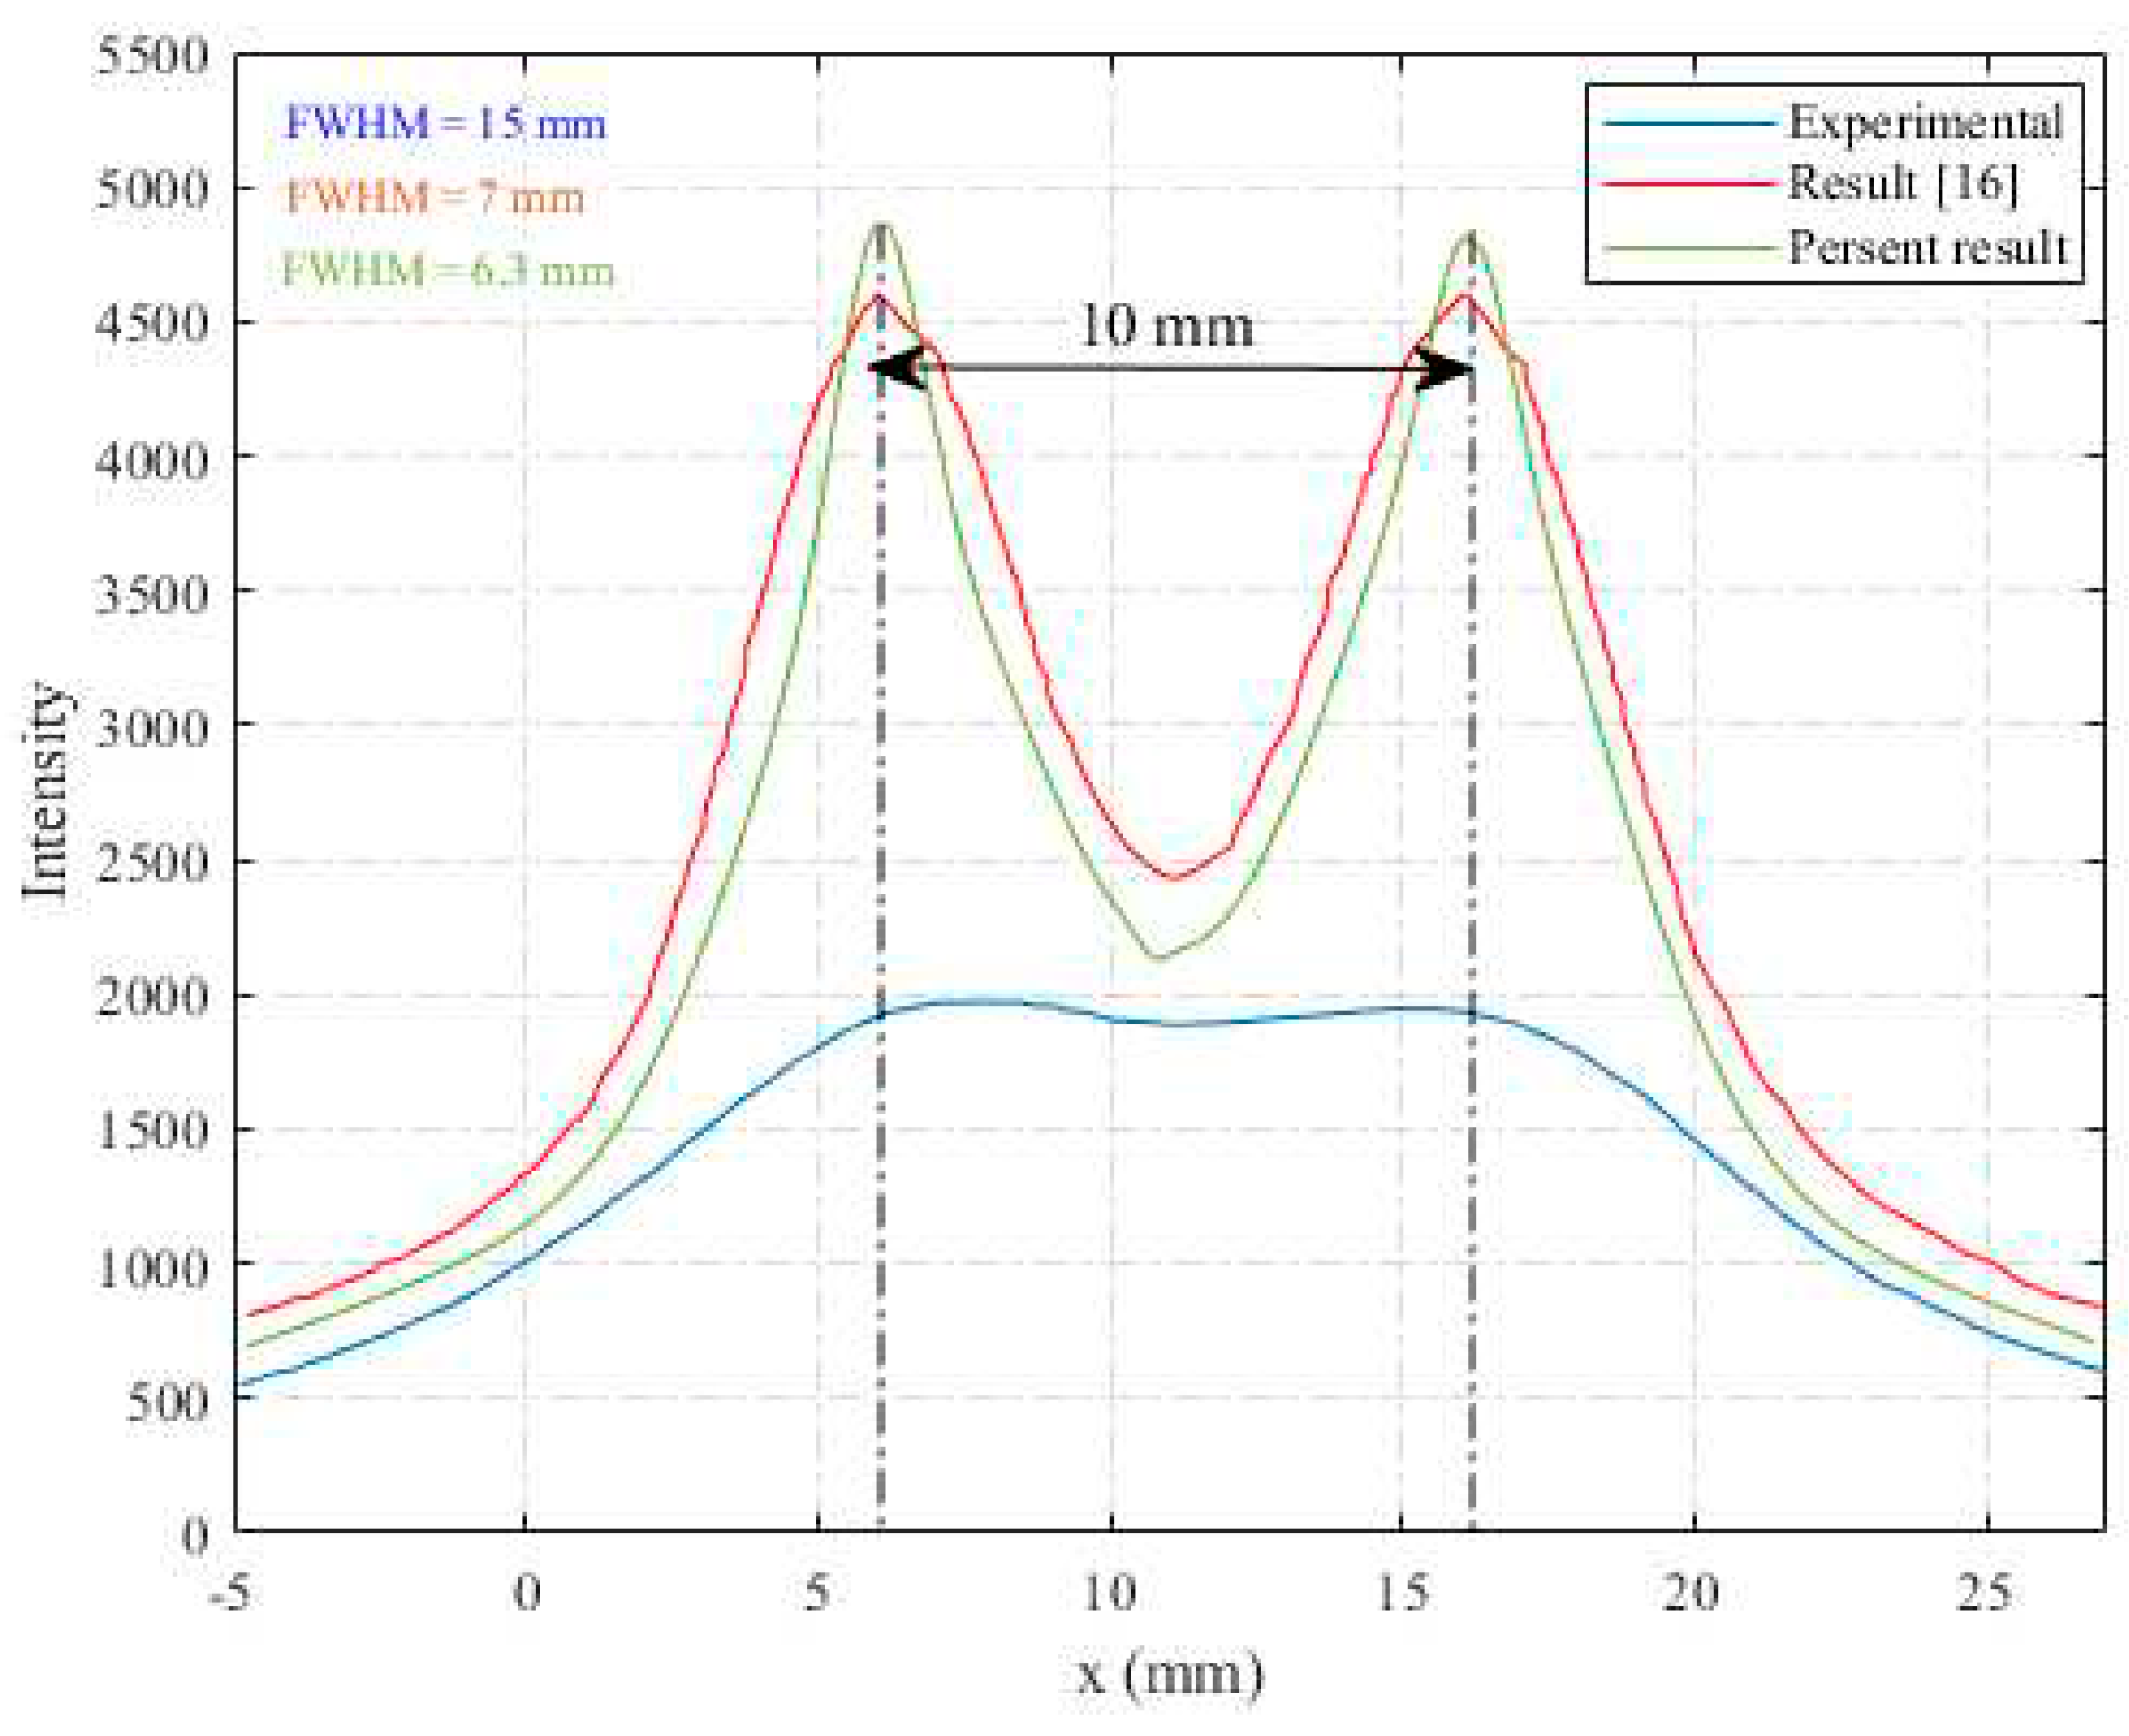
- Experimental vs. Simulation:Observing the disparity between the experimental and simulation images is essential when comparing the results. In the experimental image, two sources, each with a 4 mm diameter, appear to be blended, giving the impression of a single source with a 7 mm diameter. Conversely, in the simulation, as depicted in Figure 14, two 4 mm diameter sources are distinctly and accurately discernible, separated by a distance of 10 mm.
The amplitude of the image obtained from experimental research and simulation is an observable parameter that may be affected by errors in cone reconstruction. Differences between the experimental image and simulation results can be attributed to various factors, such as errors in the energy recorded by the detector, the resolution of the event synchronization system, the recording systems used, and the effects of the underlying signal on the output image.
4. Conclusions
In this study, the Compton imaging system was simulated, and the efficiency sensitivity results were analyzed to find the best model for improving the output image and reducing image noise in the Compton camera. Based on the analysis and efficiency analysis results, it was found that the new design of the Compton camera reduced its FWHM.
Parameters affecting the efficiency using an analytical method, the FWHM value obtained was 3.7 mm with an angular uncertainty of approximately 2.7 at an energy of 0.662 MeV, representing a 0.7 mm decrease from the previous value. The amplitude of the image obtained from both experimental research and simulation was observed to be one of the parameters affected by errors in cone reconstruction. While the interactions in the simulation were highly accurate, differences between the experimental image and simulation results were attributed to errors in energy recorded by the detector, resolution of the event synchronization system, data recording systems used, and effects of the underlying signal on the output image. As a result, efficiency can help obtain a better image of the radioactive source in the Compton camera. When designing a Compton camera, it is essential to consider factors such as angular uncertainty, spatial uncertainty, energy uncertainty, image reconstruction, electronics approaches, and efficiency.
Declaration of competing interests
The author has no affiliations with or involvement in any organization or entity with any financial interest (such as honoraria; educational grants; participation in speakers’ bureaus; membership, employment, consultancies, stock ownership, or other equity interest; and expert testimony or patent-licensing arrangements) or nonfinancial interest (such as personal or professional relationships, affiliations, knowledge or beliefs) in the subject matter or materials discussed in this manuscript.
Funding
No funding was received for this manuscript.
Acknowledgments
The authors thank Sharif University of Technology's research office for supporting the present work.
Availability of data and materials
Not applicable
References
- Hussein, M.; Ibrahim, H.; Morad, E.; Maamoun, I.; Attala, E. A Study of Single Photon Emission Computed Tomography by using Geant4/GATE.
- Terzioglu, F.; Kuchment, P.; Kunyansky, L. Compton camera imaging and the cone transform: a brief overview. Inverse Problems 2018, 34, 054002. [CrossRef]
- Ahmed, A.M.; Chacon, A.; Rutherford, H.; Akamatsu, G.; Mohammadi, A.; Nishikido, F.; Tashima, H.; Yoshida, E.; Yamaya, T.; Franklin, D.R. A validated Geant4 model of a whole-body PET scanner with four-layer DOI detectors. Physics in Medicine & Biology 2020, 65, 235051. [CrossRef]
- Kim, D.; Uenomachi, M.; Shimazoe, K.; Takahashi, H. Evaluation of single scattering correction method in compton imaging system. Nuclear Instruments and Methods in Physics Research Section A: Accelerators, Spectrometers, Detectors and Associated Equipment 2021, 1010, 165568. [CrossRef]
- Fontana, M. Tests and characterization of gamma cameras for medical applications. Université de Lyon, 2018.
- Sakai, M.; Yamaguchi, M.; Nagao, Y.; Kawachi, N.; Kikuchi, M.; Torikai, K.; Kamiya, T.; Takeda, S.i.; Watanabe, S.; Takahashi, T. In vivo simultaneous imaging with 99mTc and 18F using a Compton camera. Physics in Medicine & Biology 2018, 63, 205006. [CrossRef]
- Motomura, S.; Kanayama, Y.; Haba, H.; Watanabe, Y.; Enomoto, S. Multiple molecular simultaneous imaging in a live mouse using semiconductor Compton camera. Journal of analytical atomic spectrometry 2008, 23, 1089-1092. [CrossRef]
- Koide, A.; Kataoka, J.; Masuda, T.; Mochizuki, S.; Taya, T.; Sueoka, K.; Tagawa, L.; Fujieda, K.; Maruhashi, T.; Kurihara, T. Precision imaging of 4.4 MeV gamma rays using a 3-D position sensitive Compton camera. Scientific reports 2018, 8, 8116. [CrossRef]
- Everett, D.; Fleming, J.; Todd, R.; Nightingale, J. Gamma-radiation imaging system based on the Compton effect. In Proceedings of Proceedings of the Institution of Electrical Engineers; IET: 1977.
- Yoshida, E.; Tashima, H.; Nagatsu, K.; Tsuji, A.B.; Kamada, K.; Parodi, K.; Yamaya, T. Whole gamma imaging: a new concept of PET combined with Compton imaging. Physics in Medicine & Biology 2020, 65, 125013. [CrossRef]
- Ogane, K.; Uenomachi, M.; Shimazoe, K.; Takahashi, M.; Takahashi, H.; Seto, Y.; Momose, T. Simultaneous measurements of single gamma ray of 131I and annihilation radiation of 18F with Compton PET hybrid camera. Applied Radiation and Isotopes 2021, 176, 109864. [CrossRef]
- Han, L.; Rogers, W.L.; Huh, S.S.; Clinthorne, N. Statistical performance evaluation and comparison of a Compton medical imaging system and a collimated Anger camera for higher energy photon imaging. Physics in Medicine & Biology 2008, 53, 7029. [CrossRef]
- Zhang, L.; Rogers, W.L.; Clinthorne, N.H. Potential of a Compton camera for high performance scintimammography. Physics in Medicine & Biology 2004, 49, 617. [CrossRef]
- Fontana, M.; Dauvergne, D.; Létang, J.M.; Ley, J.-L.; Testa, É. Compton camera study for high efficiency SPECT and benchmark with Anger system. Physics in Medicine & Biology 2017, 62, 8794. [CrossRef]
- Richard, M.-H. Design study of a Compton camera for prompts-gamma imaging during ion beam therapy. Université Claude Bernard-Lyon I, 2012.
- Golnik, C.; Bemmerer, D.; Enghardt, W.; Fiedler, F.; Hueso-González, F.; Pausch, G.; Römer, K.; Rohling, H.; Schöne, S.; Wagner, L. Tests of a Compton imaging prototype in a monoenergetic 4.44 MeV photon field—a benchmark setup for prompt gamma-ray imaging devices. Journal of Instrumentation 2016, 11, P06009. [CrossRef]
- Aldawood, S.; Thirolf, P.; Miani, A.; Böhmer, M.; Dedes, G.; Gernhäuser, R.; Lang, C.; Liprandi, S.; Maier, L.; Marinšek, T. Development of a Compton camera for prompt-gamma medical imaging. Radiation Physics and Chemistry 2017, 140, 190-197. [CrossRef]
- Hofstadter, R.; McIntyre, J.A. Measurement of gamma-ray energies with two crystals in coincidence. Physical Review 1950, 78, 619. [CrossRef]
- Kalish, Y.; Nardi, E. A three crystal NaI (Tl) gamma-ray scintillation spectrometer. Nuclear Instruments and Methods 1964, 26, 329-332. [CrossRef]
- Peterson, L.; Howard, R. Gamma-ray astronomy in space in the 50-kev to 3-mev region. IRE Transactions on Nuclear Science 1961, 8, 21-29. [CrossRef]
- McConnell, M.; Bennett, K.; Collmar, W.; Connors, A.; van Dijk, R.; Forrest, D.; Hermsen, W.; Ryan, J.; Schönfelder, V.; Steinle, H. COMPTEL Observations of X-Ray Binaries. In Proceedings of 23rd International Cosmic Ray Conference (ICRC23), Volume 1; 1993.
- Bloemen, H.; Wijnands, R.; Bennett, K.; Diehl, R.; Hermsen, W.; Lichti, G.; Morris, D.; Ryan, J.; Schonfelder, V.; Strong, A. COMPTEL observations of the Orion complex: Evidence for cosmic-ray induced gamma-ray lines. Astronomy and Astrophysics 1994, 281, L5-L8.
- Schönfelder, V.; Bennett, K.; Bloemen, H.; Diehl, R.; Hermsen, W.; Lichti, G.; McConnell, M.; Ryan, J.; Strong, A.; Winkler, C. COMPTEL overview: Achievements and expectations. Astronomy and Astrophysics Supplement, v. 120, p. 13-21 1996, 120, 13-21.
- Kuiper, L.; Hermsen, W.; Cusumano, G.; Diehl, R.; Schönfelder, V.; Strong, A.; Bennett, K.; McConnell, M.L. The Crab pulsar in the 0.75-30 MeV range as seen by CGRO COMPTEL-A coherent high-energy picture from soft X-rays up to high-energy γ-rays. Astronomy & Astrophysics 2001, 378, 918-935. [CrossRef]
- Iyudin, A.; Diehl, R.; Lichti, G.; Schönfelder, V.; Steinle, H.; Bloemen, H.; Hermsen, W.; de Vries, C.; Morris, D.; Ryan, J. COMPTEL observations of 44Ti gamma-ray line emission from Cas A. In Proceedings of AIP Conference Proceedings; American Institute of Physics: 1994.
- Takada, A.; Tanimori, T.; Mizumura, Y.; Takemura, T.; Yoshikawa, K.; Nakamura, Y.; Abe, M.; Kubo, H.; Kurosawa, S.; Miuchi, K. SMILE-3: sky survey in MeV gamma-ray using the electron-tracking Compton telescope loaded on balloons. In Proceedings of Space Telescopes and Instrumentation 2020: Ultraviolet to Gamma Ray; SPIE: 2020.
- Singh, M.; Doria, D. An electronically collimated gamma camera for single photon emission computed tomography. Part II: Image reconstruction and preliminary experimental measurements. Medical Physics 1983, 10, 428-435. [CrossRef]
- Dogan, N.; Wehe, D.K.; Knoll, G.F. Multiple Compton scattering gamma ray imaging camera. Nuclear Instruments and Methods in Physics Research Section A: Accelerators, Spectrometers, Detectors and Associated Equipment 1990, 299, 501-506. [CrossRef]
- Ida, T.; Motomura, S.; Ueda, M.; Watanabe, Y.; Enomoto, S. Accurate modeling of event-by-event backprojection for a germanium semiconductor Compton camera for system response evaluation in the LM-ML-EM image reconstruction method. Japanese Journal of Applied Physics 2018, 58, 016002. [CrossRef]
- Basko, R.; Zeng, G.L.; Gullberg, G.T. Application of spherical harmonics to image reconstruction for the Compton camera. Physics in Medicine & Biology 1998, 43, 887. [CrossRef]
- Lang, C. Design of a Compton camera for medical imaging and characterization of its components. lmu, 2015.
- Ordonez, C.E.; Bolozdynya, A.; Chang, W. Doppler broadening of energy spectra in Compton cameras. In Proceedings of 1997 IEEE Nuclear Science Symposium Conference Record; IEEE: 1997.
- Lojacono, X. Image reconstruction for Compton camera with application to hadrontherapy. Lyon, INSA, 2013.
- Lewitt, R.M. Reconstruction algorithms: transform methods. Proceedings of the IEEE 1983, 71, 390-408. [CrossRef]
- Barrett, H.H. Objective assessment of image quality: effects of quantum noise and object variability. JOSA A 1990, 7, 1266-1278. [CrossRef]
- Hudson, H.M.; Larkin, R.S. Accelerated image reconstruction using ordered subsets of projection data. IEEE transactions on medical imaging 1994, 13, 601-609. [CrossRef]
- Llacer, J.; Chatterjee, A.; Jackson, H.C.; Lin, J.C.; Zunzunegui, M.V. An imaging instrument for positron emitting heavy ion beam injection. IEEE Transactions on Nuclear Science 1979, 26, 634-647. [CrossRef]
- Wilderman, S.J.; Clinthorne, N.H.; Fessler, J.A.; Rogers, W.L. List-mode maximum likelihood reconstruction of Compton scatter camera images in nuclear medicine. In Proceedings of 1998 IEEE Nuclear Science Symposium Conference Record. 1998 IEEE Nuclear Science Symposium and Medical Imaging Conference (Cat. No. 98CH36255); IEEE: 1998.
- Alnaaimi, M. Evaluation of the UCL Compton camera imaging performance. UCL (University College London), 2011.
- Schuemann, J. Monte Carlo Calculations in Nuclear Medicine: Applications in Diagnostic Imaging. Wiley Online Library: 2014.
- Niknami, M.; Hosseini, S.A.; Loushab, M.E. Sensitivity analysis of the efficiency of Compton camera to the detector parameters using the GEANT4 computer code. Applied Radiation and Isotopes 2021, 176, 109883. [CrossRef]
- Agostinelli, S.; Allison, J.; Amako, K.a.; Apostolakis, J.; Araujo, H.; Arce, P.; Asai, M.; Axen, D.; Banerjee, S.; Barrand, G. GEANT4—a simulation toolkit. Nuclear instruments and methods in physics research section A: Accelerators, Spectrometers, Detectors and Associated Equipment 2003, 506, 250-303. [CrossRef]
- Chelikani, S.; Gore, J.; Zubal, G. Optimizing Compton camera geometries. Physics in Medicine & Biology 2004, 49, 1387. [CrossRef]
- Holstensson, M.; Partridge, M.; Buckley, S.E.; Flux, G.D. The effect of energy and source location on gamma camera intrinsic and extrinsic spatial resolution: an experimental and Monte Carlo study. Physics in Medicine & Biology 2010, 55, 1735. [CrossRef]
- Niknami, M.; Valipour, M. Compton Imaging Systems Based on Semiconductor Detectors. In Gamma Ray Imaging: Technology and Applications, Springer: 2023; pp. 65-86.
Figure 1.
Principles of the Compton imaging system.
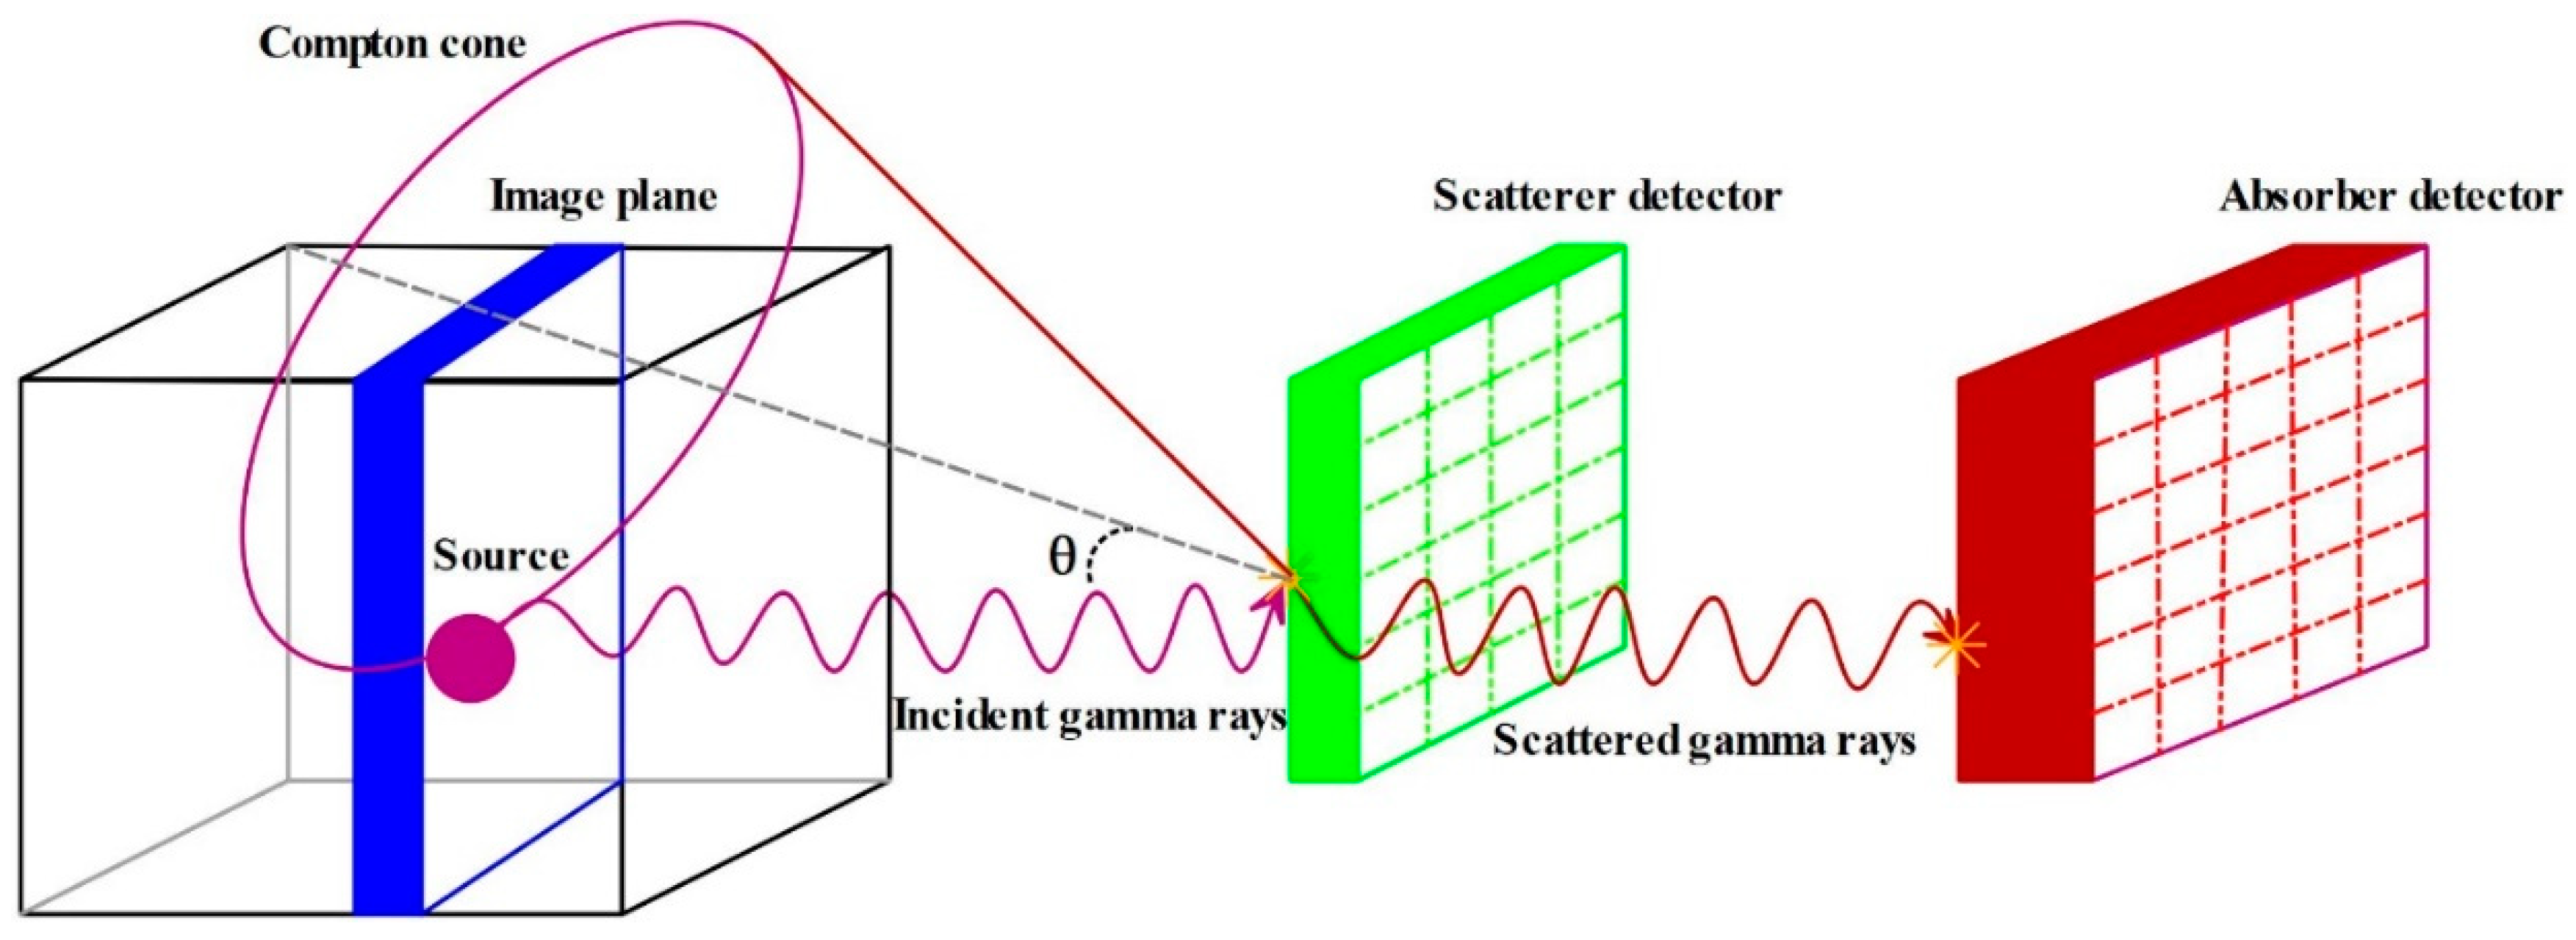
Figure 2.
Analytical reconstruction for 4 events.
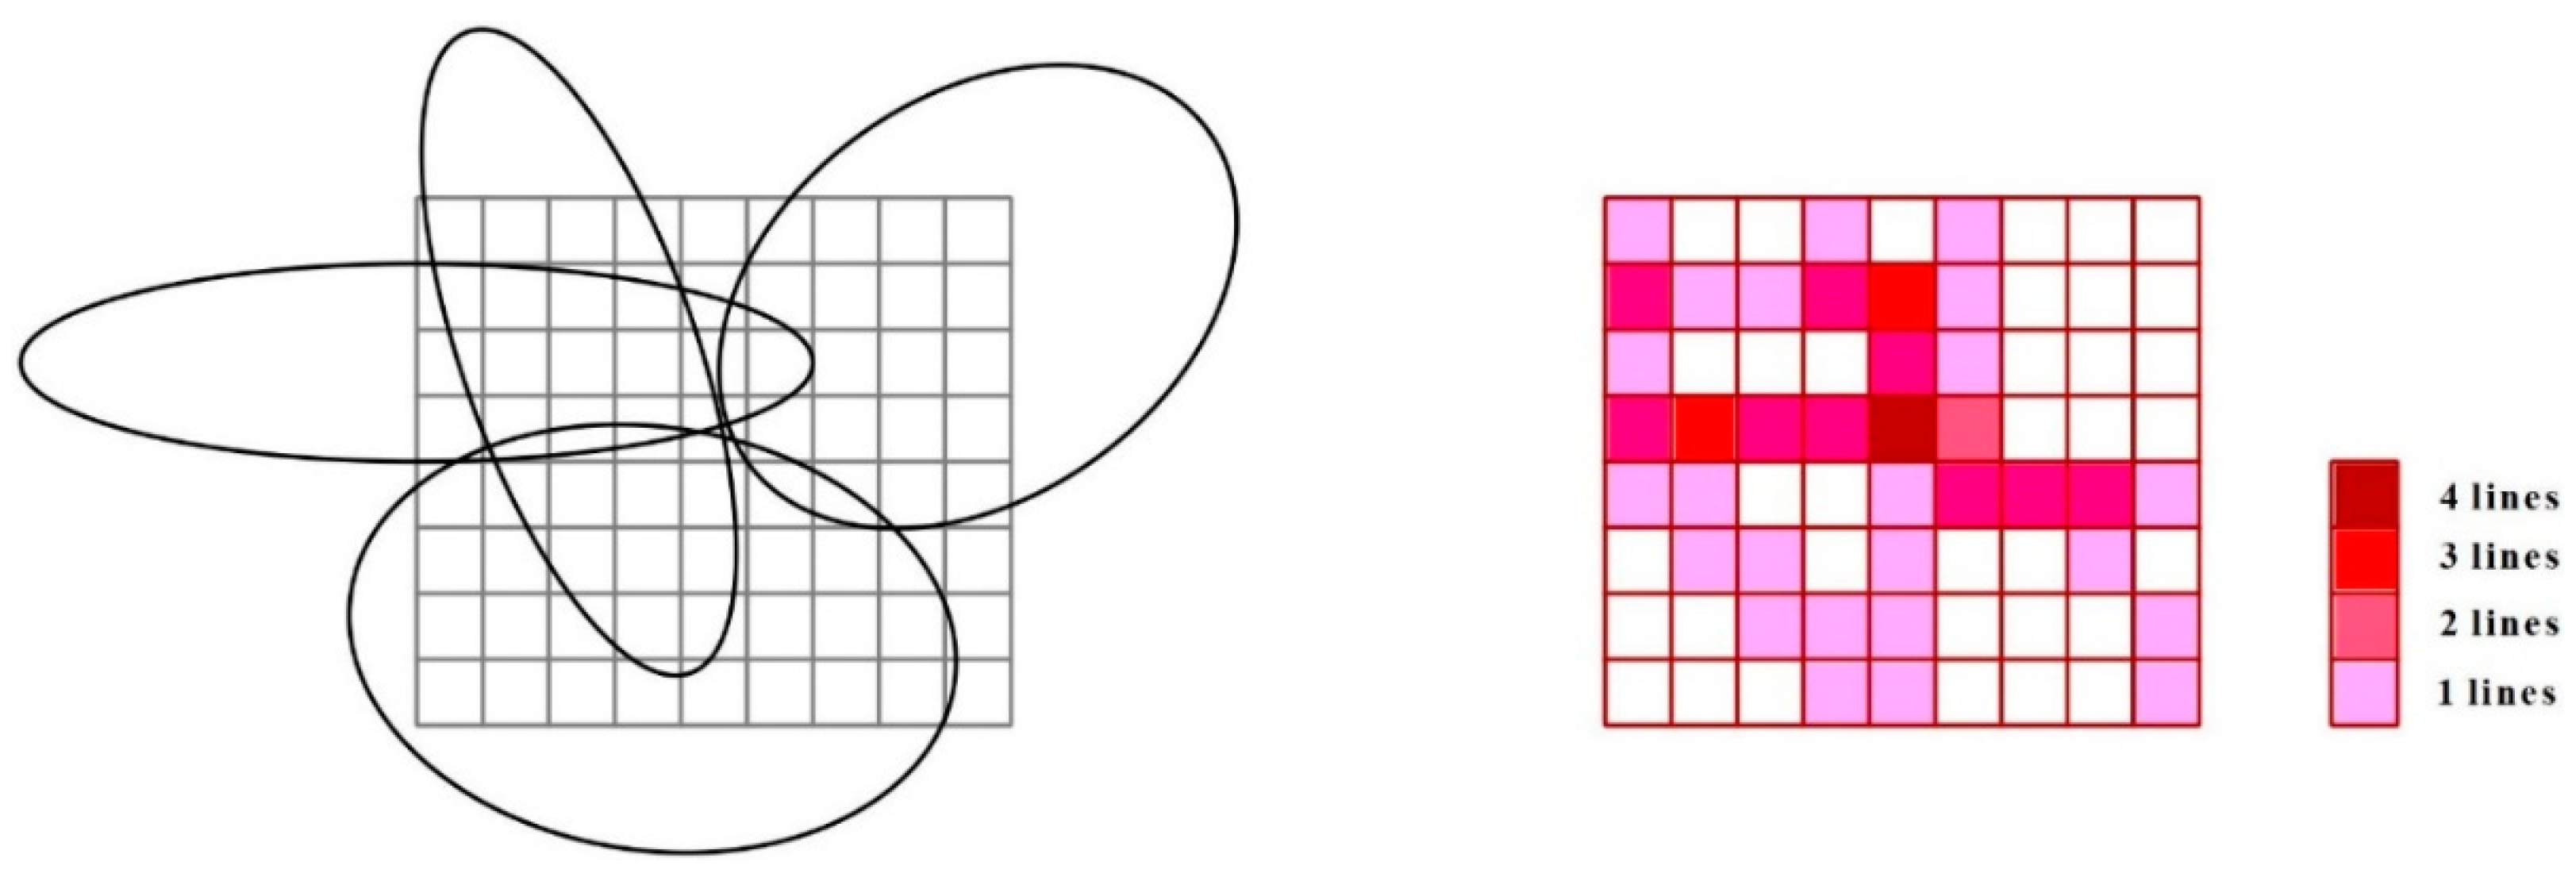
Figure 3.
A simulation example captured by a Compton camera.
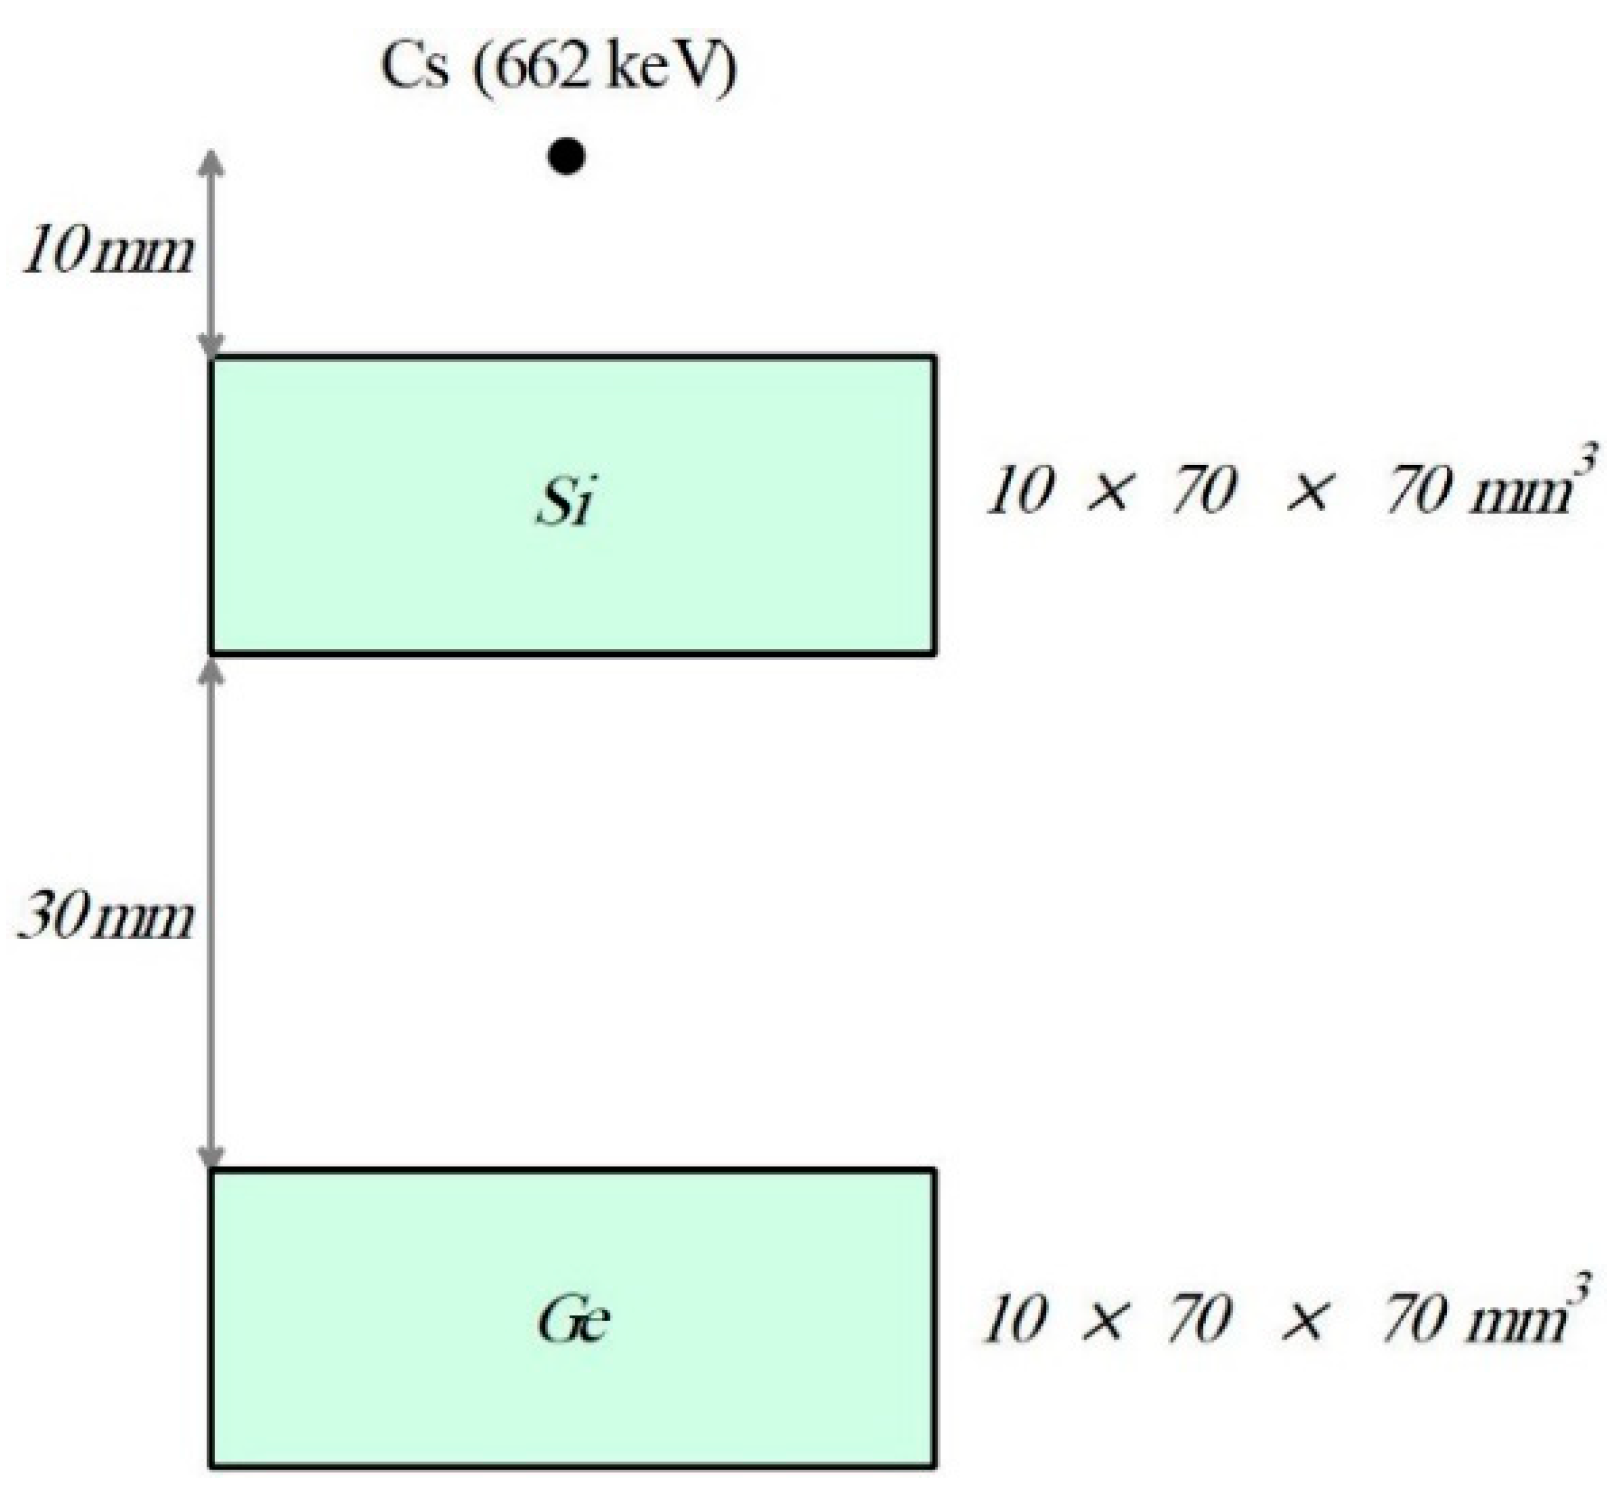
Figure 4.
Source image reconstruction for Figure 3 (10 events).
Figure 4.
Source image reconstruction for Figure 3 (10 events).
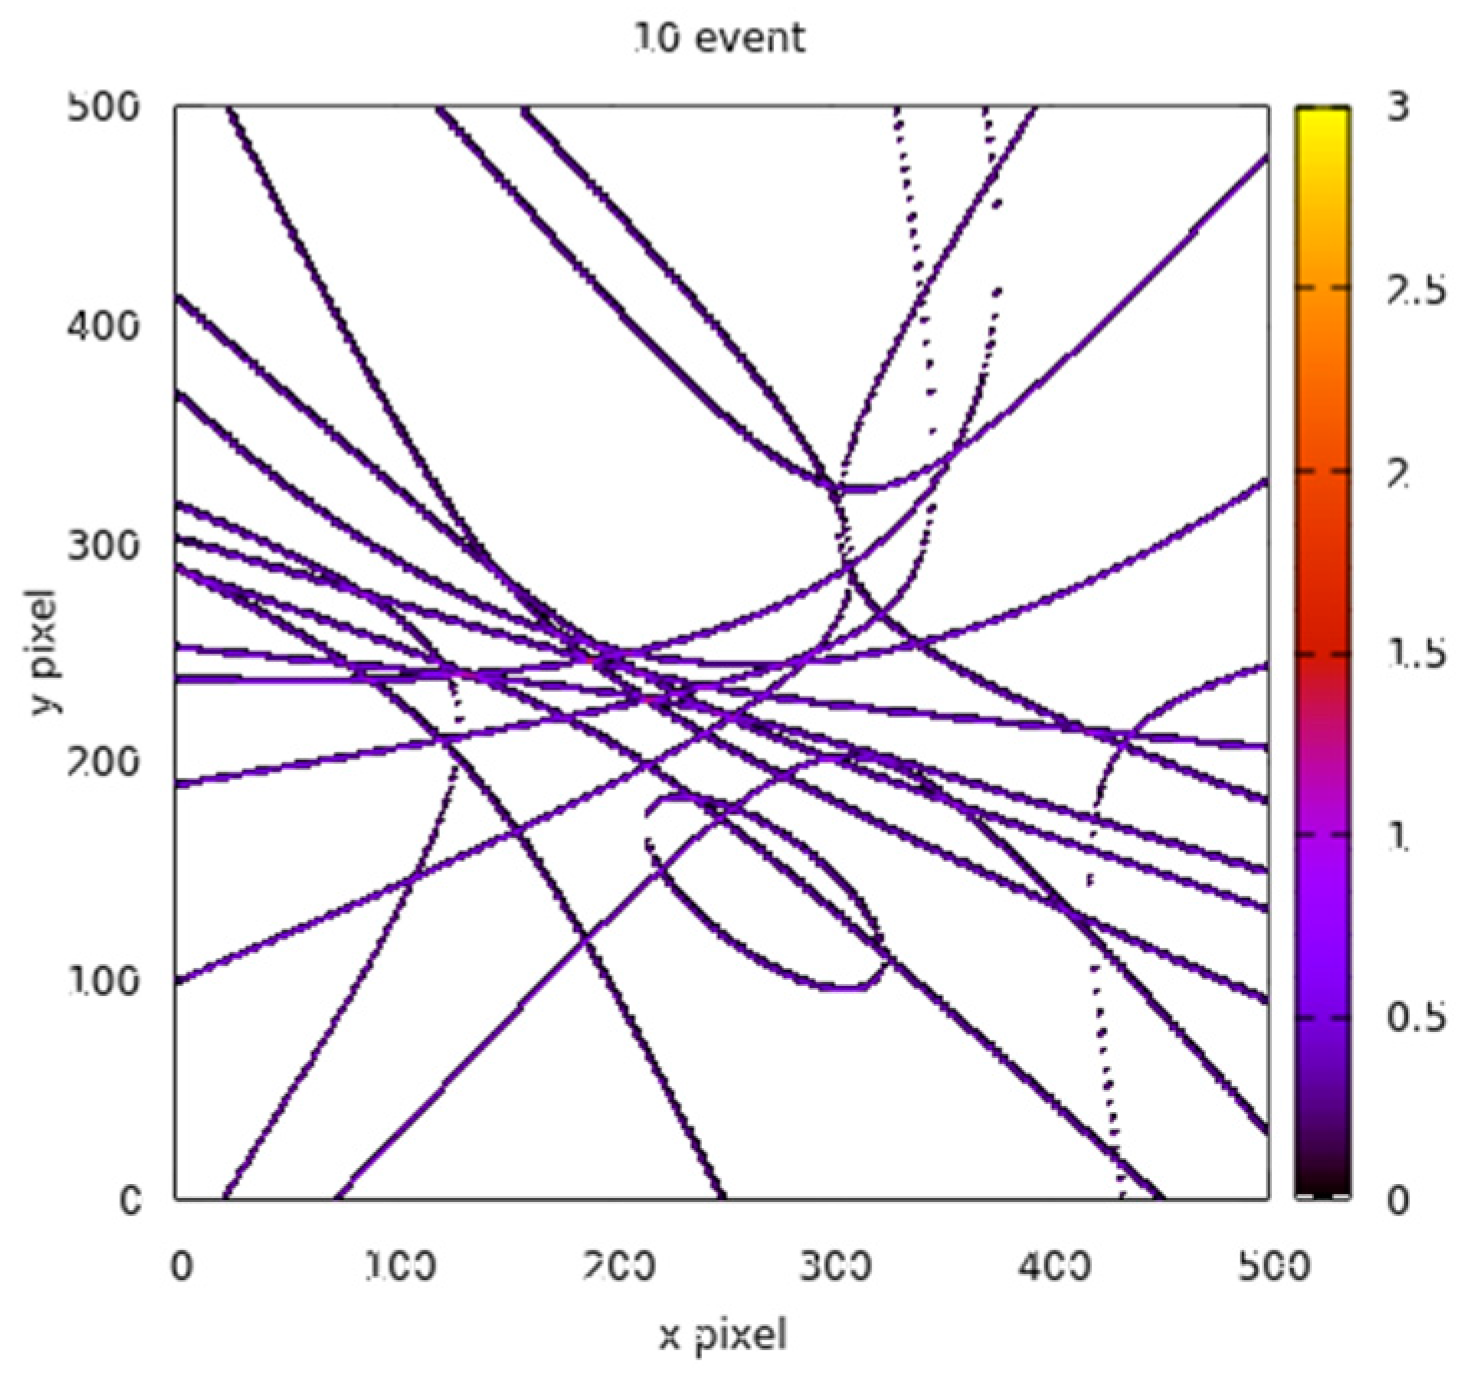
Figure 5.
Source image reconstruction for Figure 3 (100 events).
Figure 5.
Source image reconstruction for Figure 3 (100 events).
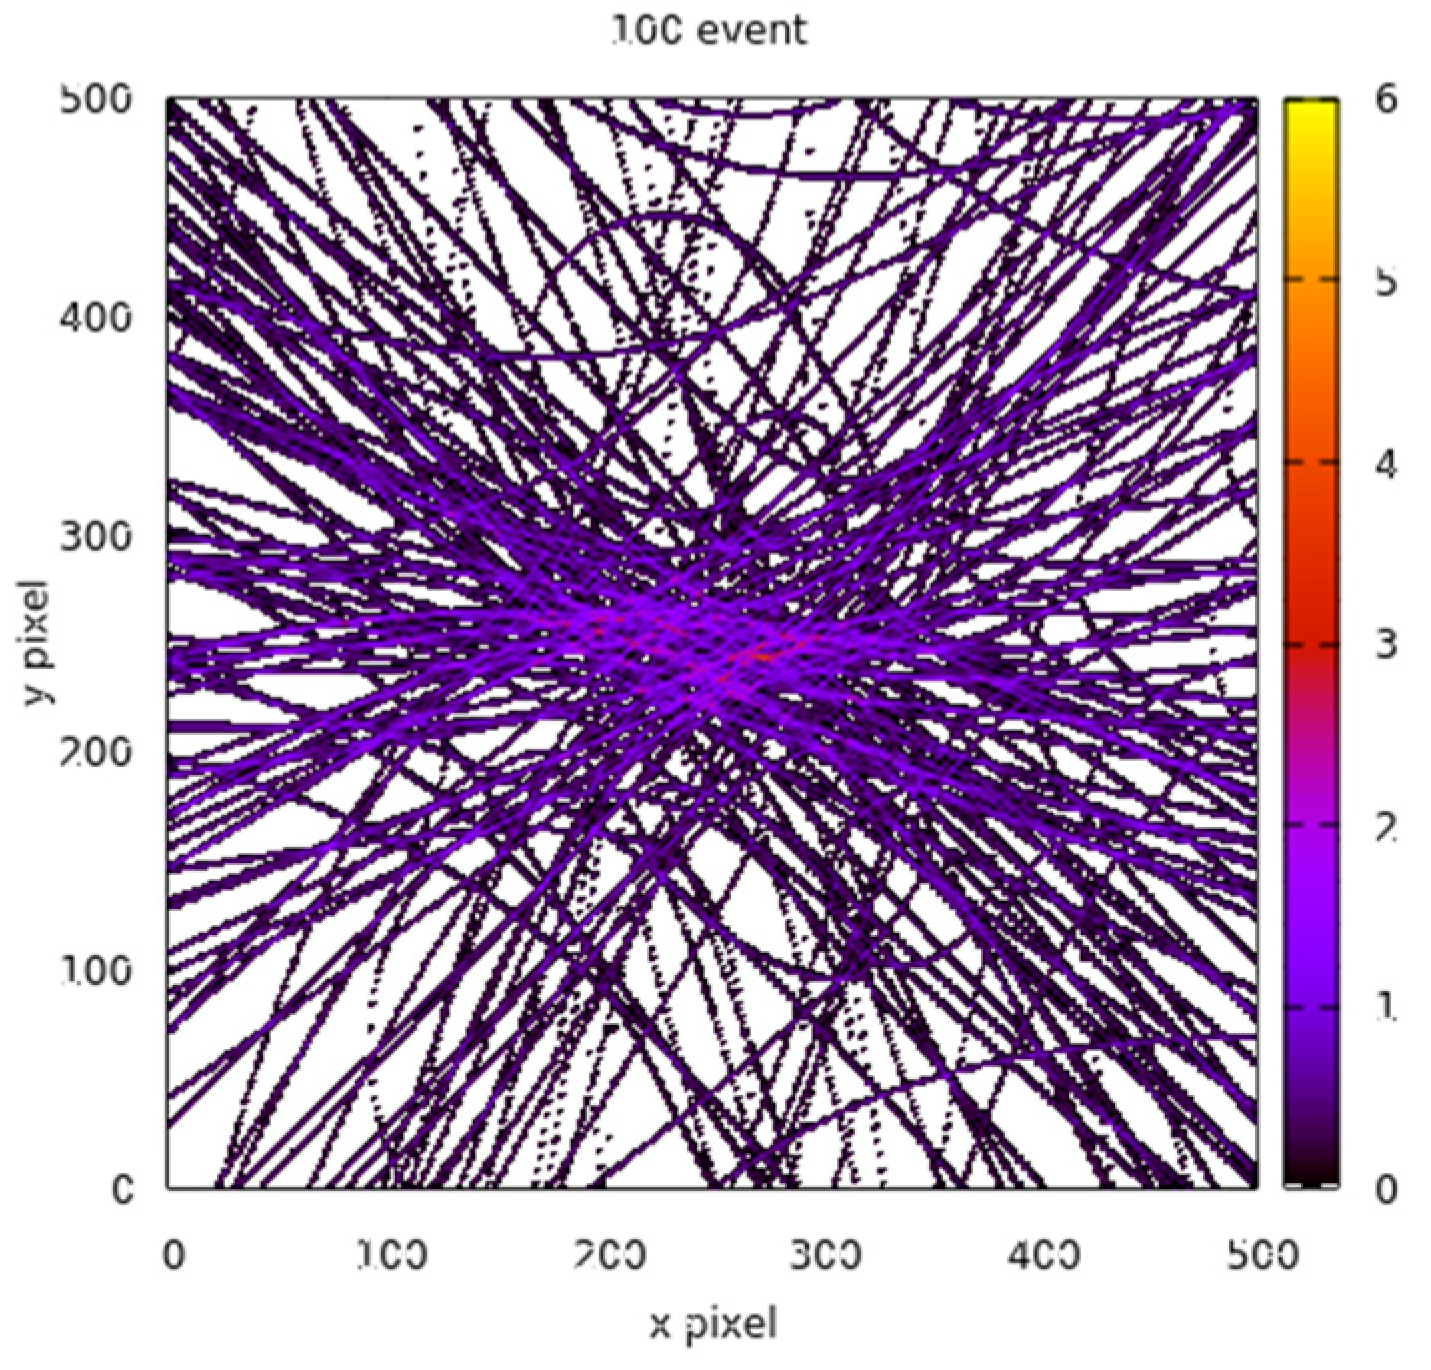
Figure 6.
Source image reconstruction for Figure 3 (1000 events).
Figure 6.
Source image reconstruction for Figure 3 (1000 events).
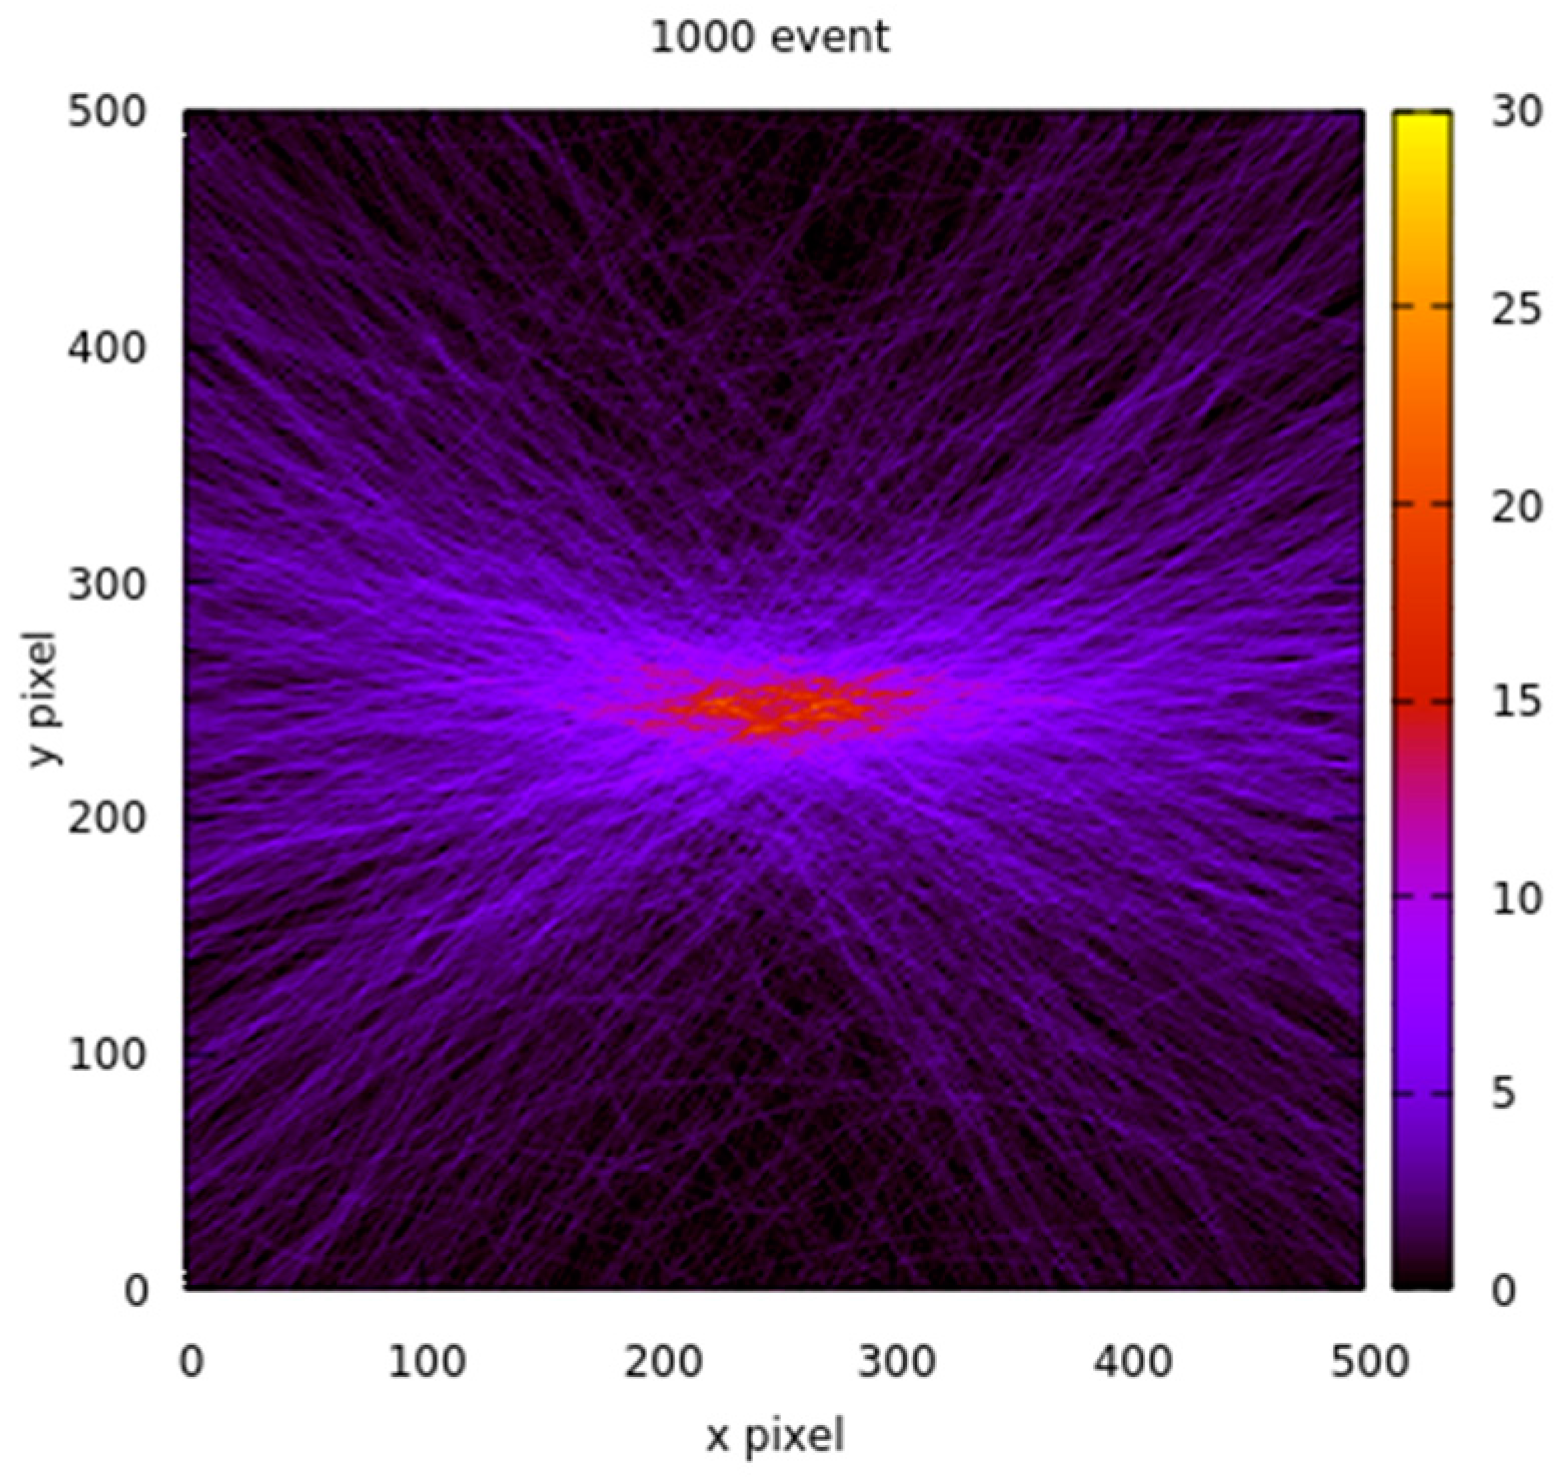
Figure 10.
Cross-sectional profile on the image screen at the source location along the y-axis.
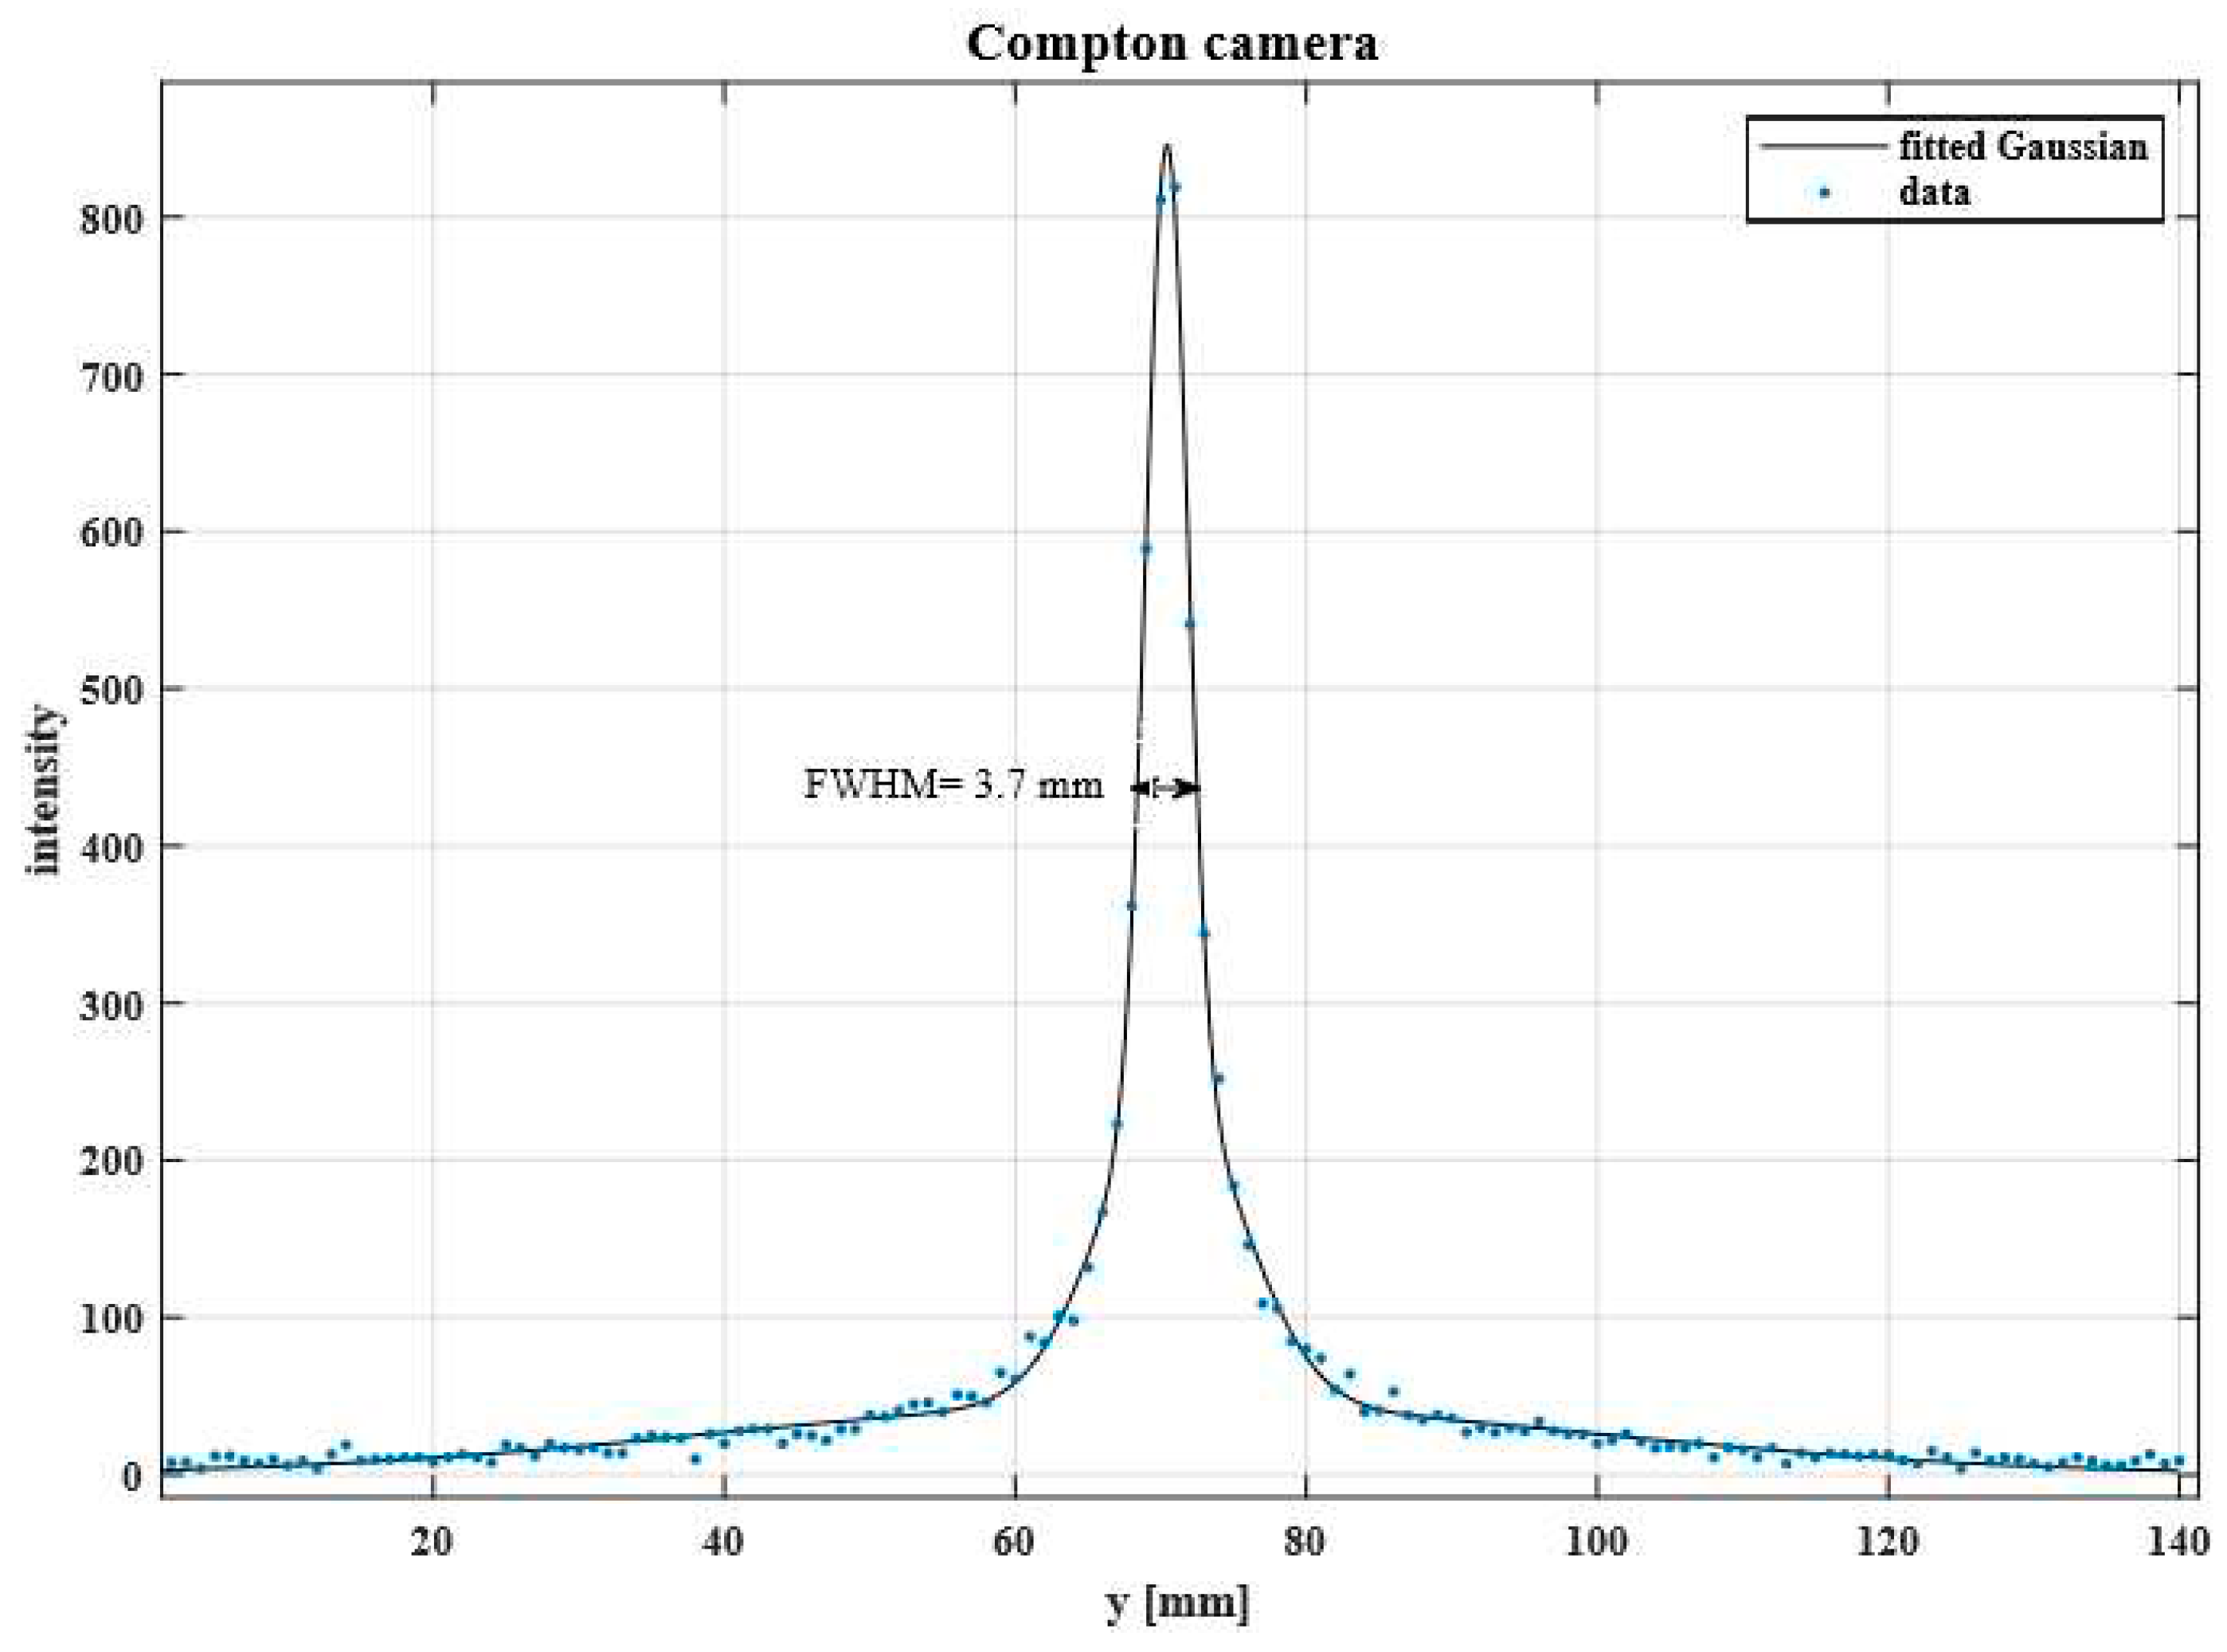
Figure 12.
Geometry is designed in this paper to simulate and reconstruct the image of experimental research.
Figure 12.
Geometry is designed in this paper to simulate and reconstruct the image of experimental research.

Figure 13.
Analytically reconstruct the image with a Compton camera of two (A) experimental (B) simulated [17] (C) present simulated spherical sources.
Figure 13.
Analytically reconstruct the image with a Compton camera of two (A) experimental (B) simulated [17] (C) present simulated spherical sources.
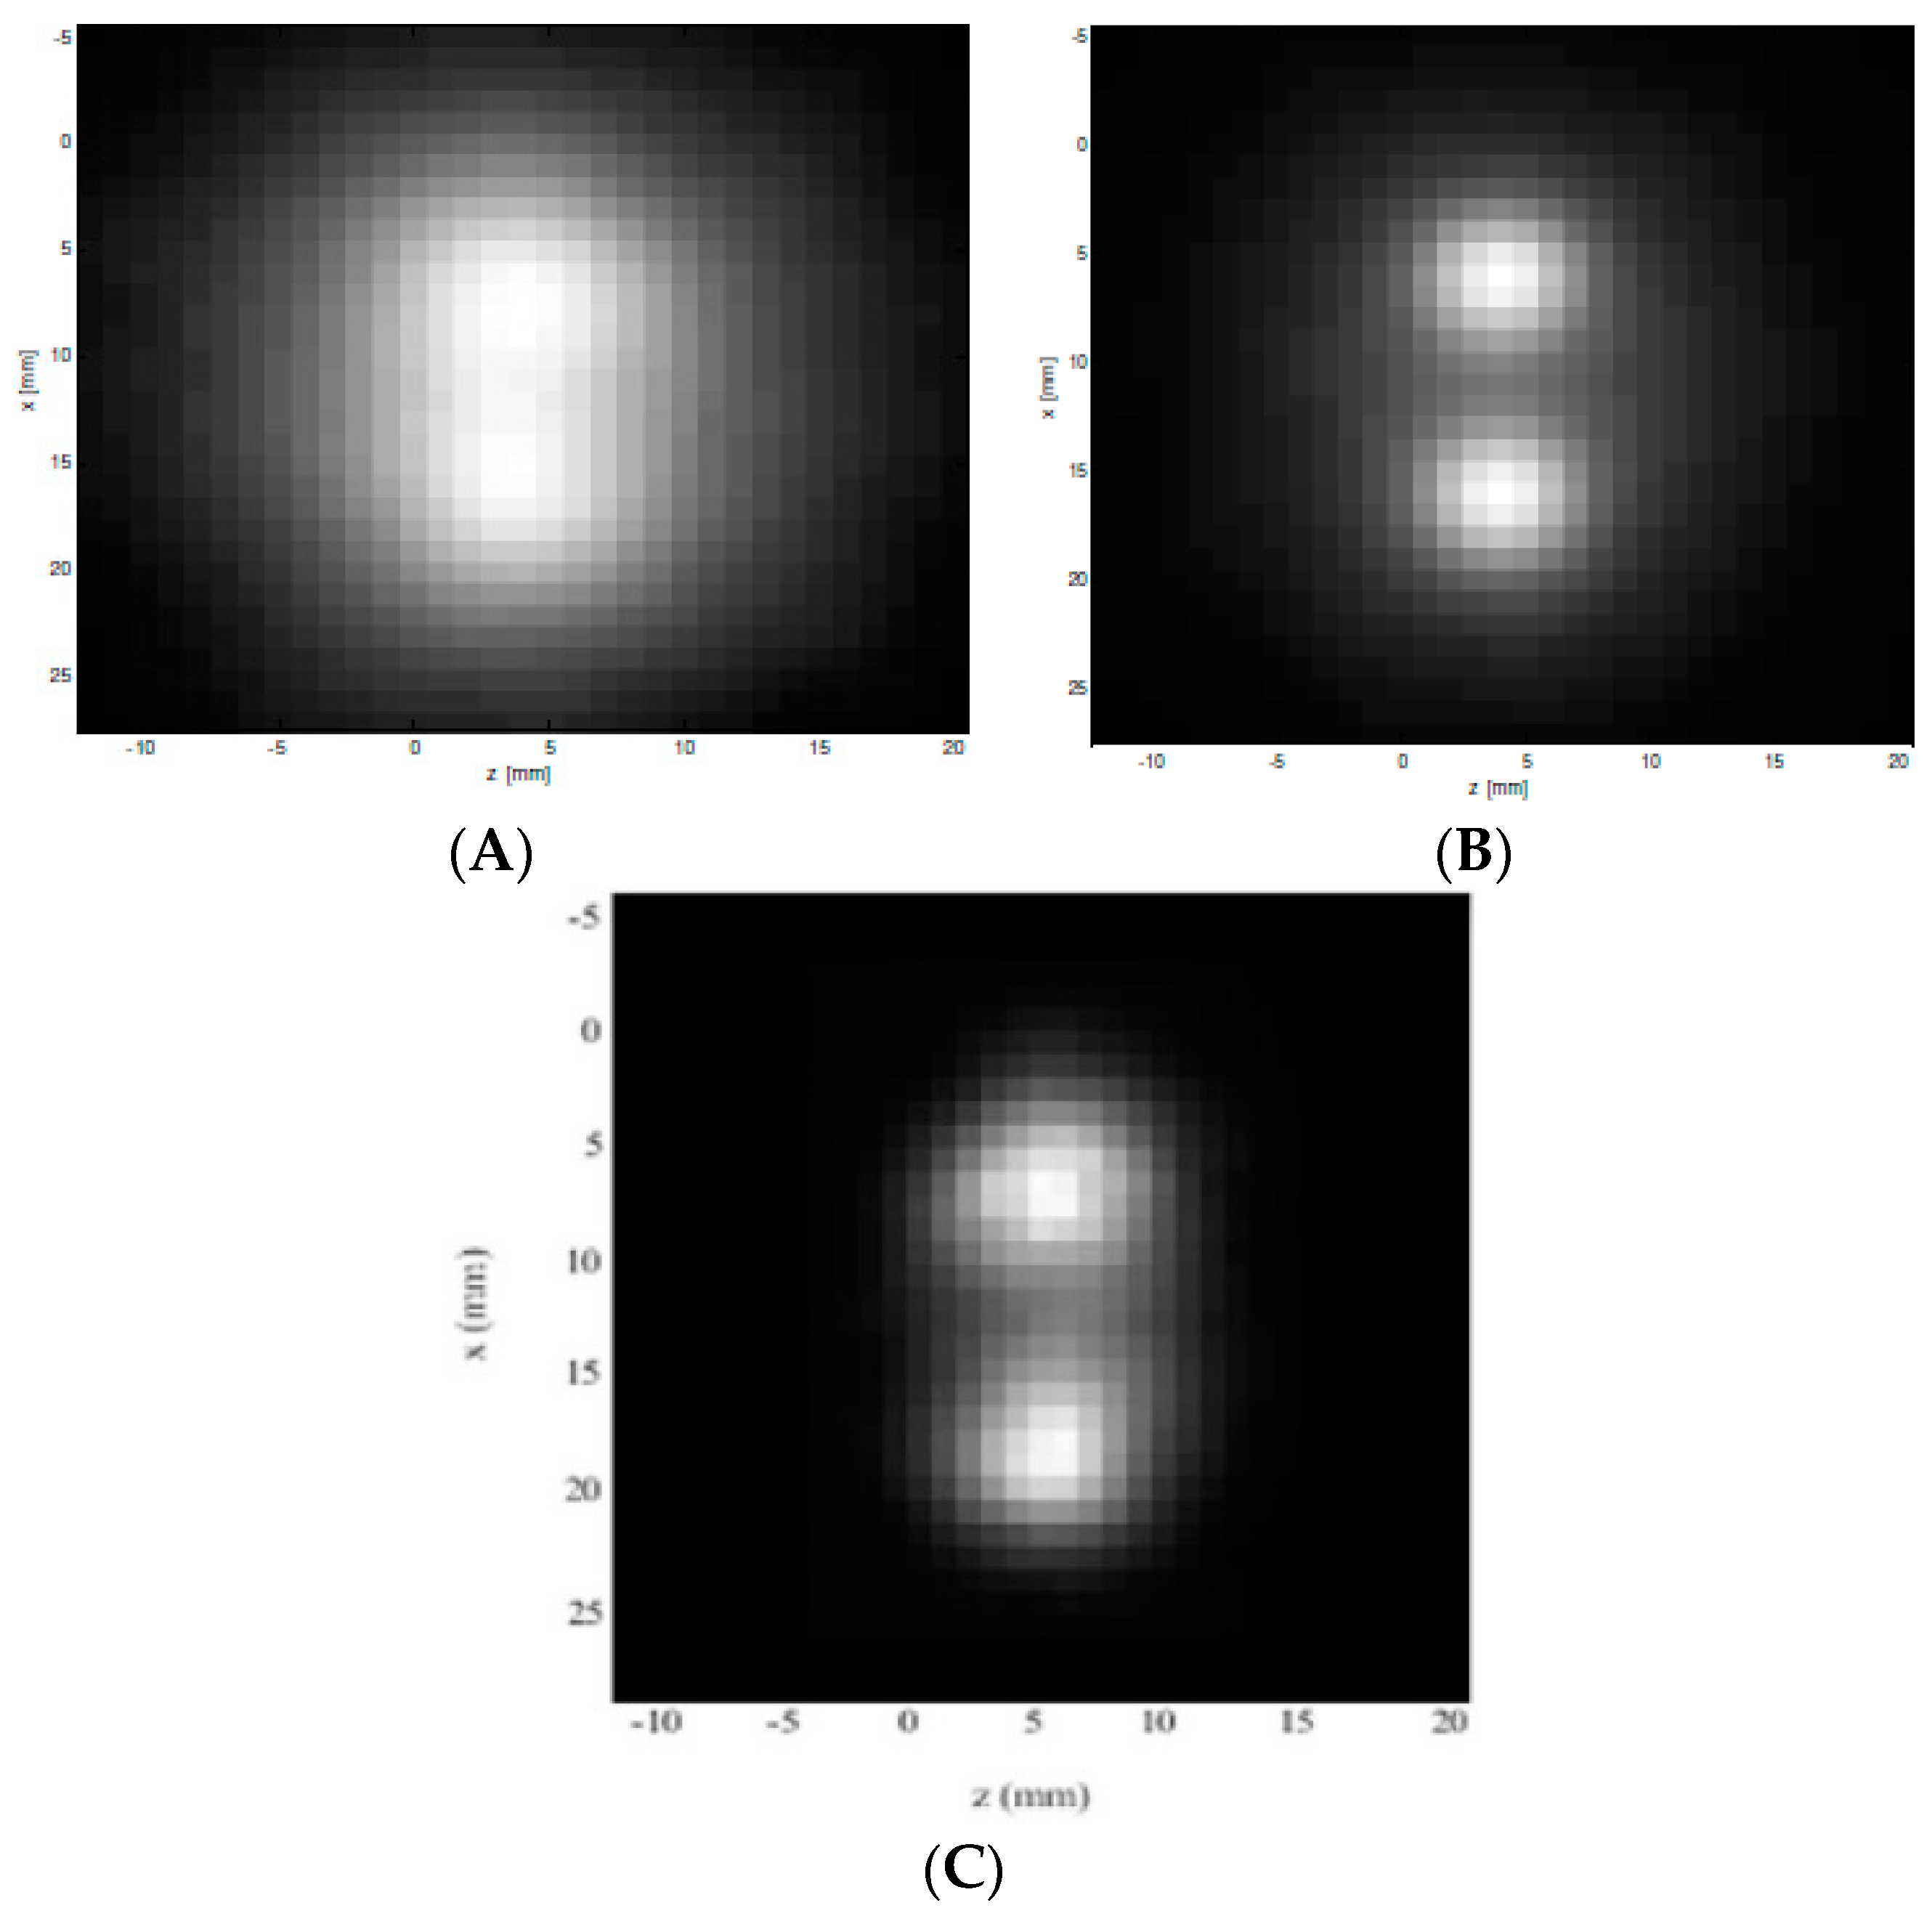
Figure 14.
Reconstruction of both spherical sources' intensity.
Disclaimer/Publisher’s Note: The statements, opinions and data contained in all publications are solely those of the individual author(s) and contributor(s) and not of MDPI and/or the editor(s). MDPI and/or the editor(s) disclaim responsibility for any injury to people or property resulting from any ideas, methods, instructions or products referred to in the content. |
© 2023 by the authors. Licensee MDPI, Basel, Switzerland. This article is an open access article distributed under the terms and conditions of the Creative Commons Attribution (CC BY) license (http://creativecommons.org/licenses/by/4.0/).
Copyright: This open access article is published under a Creative Commons CC BY 4.0 license, which permit the free download, distribution, and reuse, provided that the author and preprint are cited in any reuse.


