Submitted:
02 December 2023
Posted:
04 December 2023
You are already at the latest version
Abstract
Keywords:
1. Introduction
1.1. Factors that affect EV adoption
-
Manufacturing Factors: The manufacturing landscape for EVs has been evolving rapidly. Innovations in battery technology, vehicle range, and model availability have been integral in shaping consumer choice. [11] illustrates the pivotal role of manufacturing advancements in reducing EV costs, thereby influencing adoption rates [12]. However, production capacity limitations and supply chain challenges, as highlighted by Green, Smith, and Wang (2023), remain substantial hurdles. To increase the adoption of EVs, the following changes need to be made:
- Advances in Battery Technology: Battery life and efficiency are crucial in EV adoption. Improvements in battery technology can significantly lower the cost of EVs and increase their range, making them more attractive to consumers [13]
- Supply Chain Optimization: A robust and responsive supply chain is essential for the mass production of EVs. Efficient supply chains can reduce manufacturing costs and improve the availability of EVs in the market [14]
- Vehicle Design and Features: The design of electric vehicles, including aesthetics and additional features, plays a significant role in consumer adoption. Innovative designs that appeal to consumer preferences can boost EV sales [11]
-
The personal/driver factors: Personal considerations, including driving patterns, vehicle preferences, and charging convenience, significantly impact EV adoption [16]. [17] explore how range anxiety and charging time concerns deter potential EV buyers, while [18] discusses the cultural shift toward eco-conscious consumerism, bolstering EV attractiveness. The visibility and accessibility of EVCS, as noted by [19] are also strong personal motivators for the transition to electric mobility.
- Range Anxiety: The fear of running out of battery without access to a charging station is a significant barrier to EV adoption. Overcoming range anxiety through improved infrastructure and vehicle technology is critical [20]
- Consumer Awareness and Perception: The level of awareness and the general perception of EVs influence adoption rates. Educational campaigns and positive messaging can sway public opinion in favor of electric vehicles [21]
- Economic Incentives for Consumers: Financial considerations, such as the total cost of ownership, fuel savings, and maintenance costs, impact the decision to purchase EVs. Rebates and incentives can make EVs more financially attractive [22]
-
Environmental and External Factors: External factors, such as environmental awareness and urban planning policies, play a decisive role in the adoption of LDEVs. The works of [23] delve into how air quality concerns drive policy support for EVs. Concurrently, [24] study emphasizes the influence of urban infrastructure on the practicality of owning and operating an EV within city environments.
- Air Quality and Environmental Concerns: Growing awareness of environmental issues, particularly air quality concerns, can drive consumers toward EVs as a cleaner alternative to internal combustion engines [25]
- Government Policies and Regulations: Legislation that promotes EVs through subsidies, rebates, and infrastructure investment is a powerful driver of adoption. Such policies can lower the barriers to EV entry for consumers [11]
- Charging Infrastructure Availability: The availability and convenience of charging infrastructure are key to EV adoption. Public and private investments in charging networks can alleviate concerns about the practicality of owning an EV [26]
| Title 1 | Level 1 | Level 2 | DC Fast Charging |
|---|---|---|---|
| Connector Type | CCS/SAE connector | ||
| J1772 connector | J1772 connector | CHAdeMO connector | |
| Tesla connector | Tesla connector | ||
| Typical Power Output | 1 kW | 7 kW-19 kW | 50-350 kW |
| Estimated PHEV Charge Time from Empty | 5-6 hours | 1-2 hours | N/A |
| Estimated BEV Charge Time from Empty | 40-50 hours | 4-10 hours | 20 minutes-1 hours |
| Typical Locations | Home | Home, Workplace, | Public |
| and Public |
| Year | Avg. EV Range | Maximum EV Range | Average MSRP |
|---|---|---|---|
| 2010 | 79 miles (127 km) | N/A | N/A |
| 2011 | 86 miles (138 km) | 94 miles (151 km) | N/A |
| 2012 | 99 miles (159 km) | 265 miles (426 km) | N/A |
| 2013 | 117 miles (188 km) | 265 miles (426 km) | N/A |
| 2014 | 130 miles (209 km) | 265 miles (426 km) | N/A |
| 2015 | 131 miles (211 km) | 270 miles (435 km) | N/A |
| 2016 | 145 miles (233 km) | 315 miles (507 km) | $33,380 |
| 2017 | 151 miles (243 km) | 335 miles (539 km) | $58,965 |
| 2018 | 189 miles (304 km) | 335 miles (539 km) | $64,300 |
| 2019 | 209 miles (336 km) | 370 miles (595 km) | $55,600 |
| 2020 | 210 miles (338 km) | 402 miles (647 km) | $54,668 |
| 2021 | 217miles (349 km) | 520 miles (837 km) | $64,249 |
| 2022 | 211 miles (341 km) | 520 miles (837 km) | $65,291 |
1.2. Quantitative Expansion and Qualitative Enhancement of Electric Vehicle Charging Infrastructure
1.3. Quantitative Expansion
1.3. Quantitative Expansion
- User Interface and Experience: Charging station interfaces that are user-friendly and informative provide real-time data on charging status, cost, and availability, significantly improving the user experience [24]
- Payment Systems and Pricing Models: The adoption of flexible payment systems and transparent pricing models has been identified as a key determinant of EVCS satisfaction and, consequently, EV adoption [32]
- Network Accessibility: The development of a robust, accessible EVCS network that allows for easy location and availability checking through mobile apps and integrated systems is also a part of the qualitative improvement process [24]
- Reliability and Maintenance: Ongoing maintenance and reliable performance of EVCS are vital for user trust. Frequent system checks and rapid response to faults are essential components of high-quality service delivery [33]
- Sustainability of Charging Stations: Utilizing renewable energy sources to power EVCS, like solar or wind energy, enhances the green credentials of electric mobility, a strong qualitative factor for environmentally conscious consumers [34].
- Safety and Security: Ensuring safety and security at charging stations through good lighting, surveillance, and emergency services is also a critical qualitative aspect [35]
- Integration with Public Transport: Creating synergy between EVCS and public transport systems can reduce private vehicle reliance and encourage multimodal transportation use, positively impacting the overall transport ecosystem [36]
1.4. Role of Rebate in EV adoption
- Consumer Decision-Making and Upfront Cost Barrier: A primary barrier to EV adoption is the higher upfront cost compared to conventional vehicles. Rebates and incentives directly address this barrier by reducing the initial cost differential, thereby influencing consumer purchasing decisions [38]
- Acceleration of Market Penetration: Rebates serve to accelerate the market penetration of LDEVs by making them financially competitive with internal combustion engine vehicles. Studies have shown that purchase incentives are correlated with higher rates of EV adoption [39]
- Reduction in Total Cost of Ownership: While rebates reduce the purchase price, they also contribute to a lower total cost of ownership when combined with lower operational and maintenance costs of EVs, thereby increasing the attractiveness of LDEVs over their lifecycle [40]
- Influence on Consumer Perception: Rebates can also influence consumer perception by signaling government commitment to EVs and thus providing a form of endorsement, which can be an important factor in technology adoption [41]
1.5. Variations in Rebate Effectiveness
- Income Sensitivity: The effectiveness of rebates varies across different income groups. Higher-income individuals may be less influenced by rebates as their purchasing decision may not be as constrained by the vehicle’s cost [43]
- Geographic Variability: The geographic distribution of rebates also affects their effectiveness. Urban areas with better charging infrastructure may see a higher impact of rebates than rural areas where charging stations are sparse [23]
1.6. Interplay Between Rebates and Other Factors
- Charging Infrastructure: The presence of an accessible and reliable charging infrastructure can enhance the effectiveness of rebates. When consumers are confident in the infrastructure, rebates may be more likely to tip the balance in favor of purchasing an EV [44]
- Peer Influence and Social Acceptance: Rebates may be more effective in communities where there is already a significant penetration of EVs, suggesting a role for peer influence and social acceptance in the effectiveness of incentives [45]
- Policy Stability and Long-Term Commitment: The assurance of long-term rebate programs can contribute to a stable market environment, encouraging consumers and manufacturers to invest in EV technology [46]
- Educational and Awareness Programs: Pairing rebates with educational and awareness programs can increase their impact by addressing informational barriers and misconceptions about EVs [47]
2. Data and Methodology
2.1. The framework of the analysis
- Pre- and Post-2019 Analysis: The study is structured to compare data on EV adoption and charging infrastructure before and after 2019. This comparison is critical in understanding how policy changes and the expansion of EV infrastructure have influenced EV adoption rates. Such an approach is supported by the methodology outlined in longitudinal studies focusing on policy impacts [62,63]
- Temporal Scope: The time frame from 2010 to 2022 allows for a comprehensive view of the evolution of the EV market in California. This longitudinal perspective is essential for capturing the trends over time and understanding the long-term impacts of policy and infrastructure changes [64]
- Time-Series Analysis: To analyze trends over time, the study employs time-series analysis methods. This approach is instrumental in identifying patterns and changes in EV adoption and infrastructure development over the defined period [65]
- Difference-in-Differences (DiD) Analysis: The DiD methodology is utilized to evaluate the impact of policy changes. This econometric technique is particularly effective in discerning the causal effects of policy interventions by comparing the changes in outcomes over time between a treatment group and a control group [66]
- Policy Contextualization: A thorough review of policy developments and initiatives in California related to EVs provides the necessary context for the analysis. This includes examining legislation, state incentives, and regulatory changes that have the potential to influence EV adoption [67]
- Market Dynamics: The study also considers broader market dynamics, such as changes in EV technology, consumer preferences, and economic factors, that may impact EV adoption independently of charging infrastructure [68].
- Assessing Infrastructure Impact: The primary aim is to assess how the growth and distribution of EV charging stations have influenced the adoption of light-duty EVs in California.
- Evaluating Policy Effectiveness: Another key objective is to evaluate the effectiveness of state policies implemented around and after 2019 in promoting EV adoption and infrastructure expansion.
2.2. Policy Impact Evaluation
2.3. Incorporation of Geospatial Data in Methodology
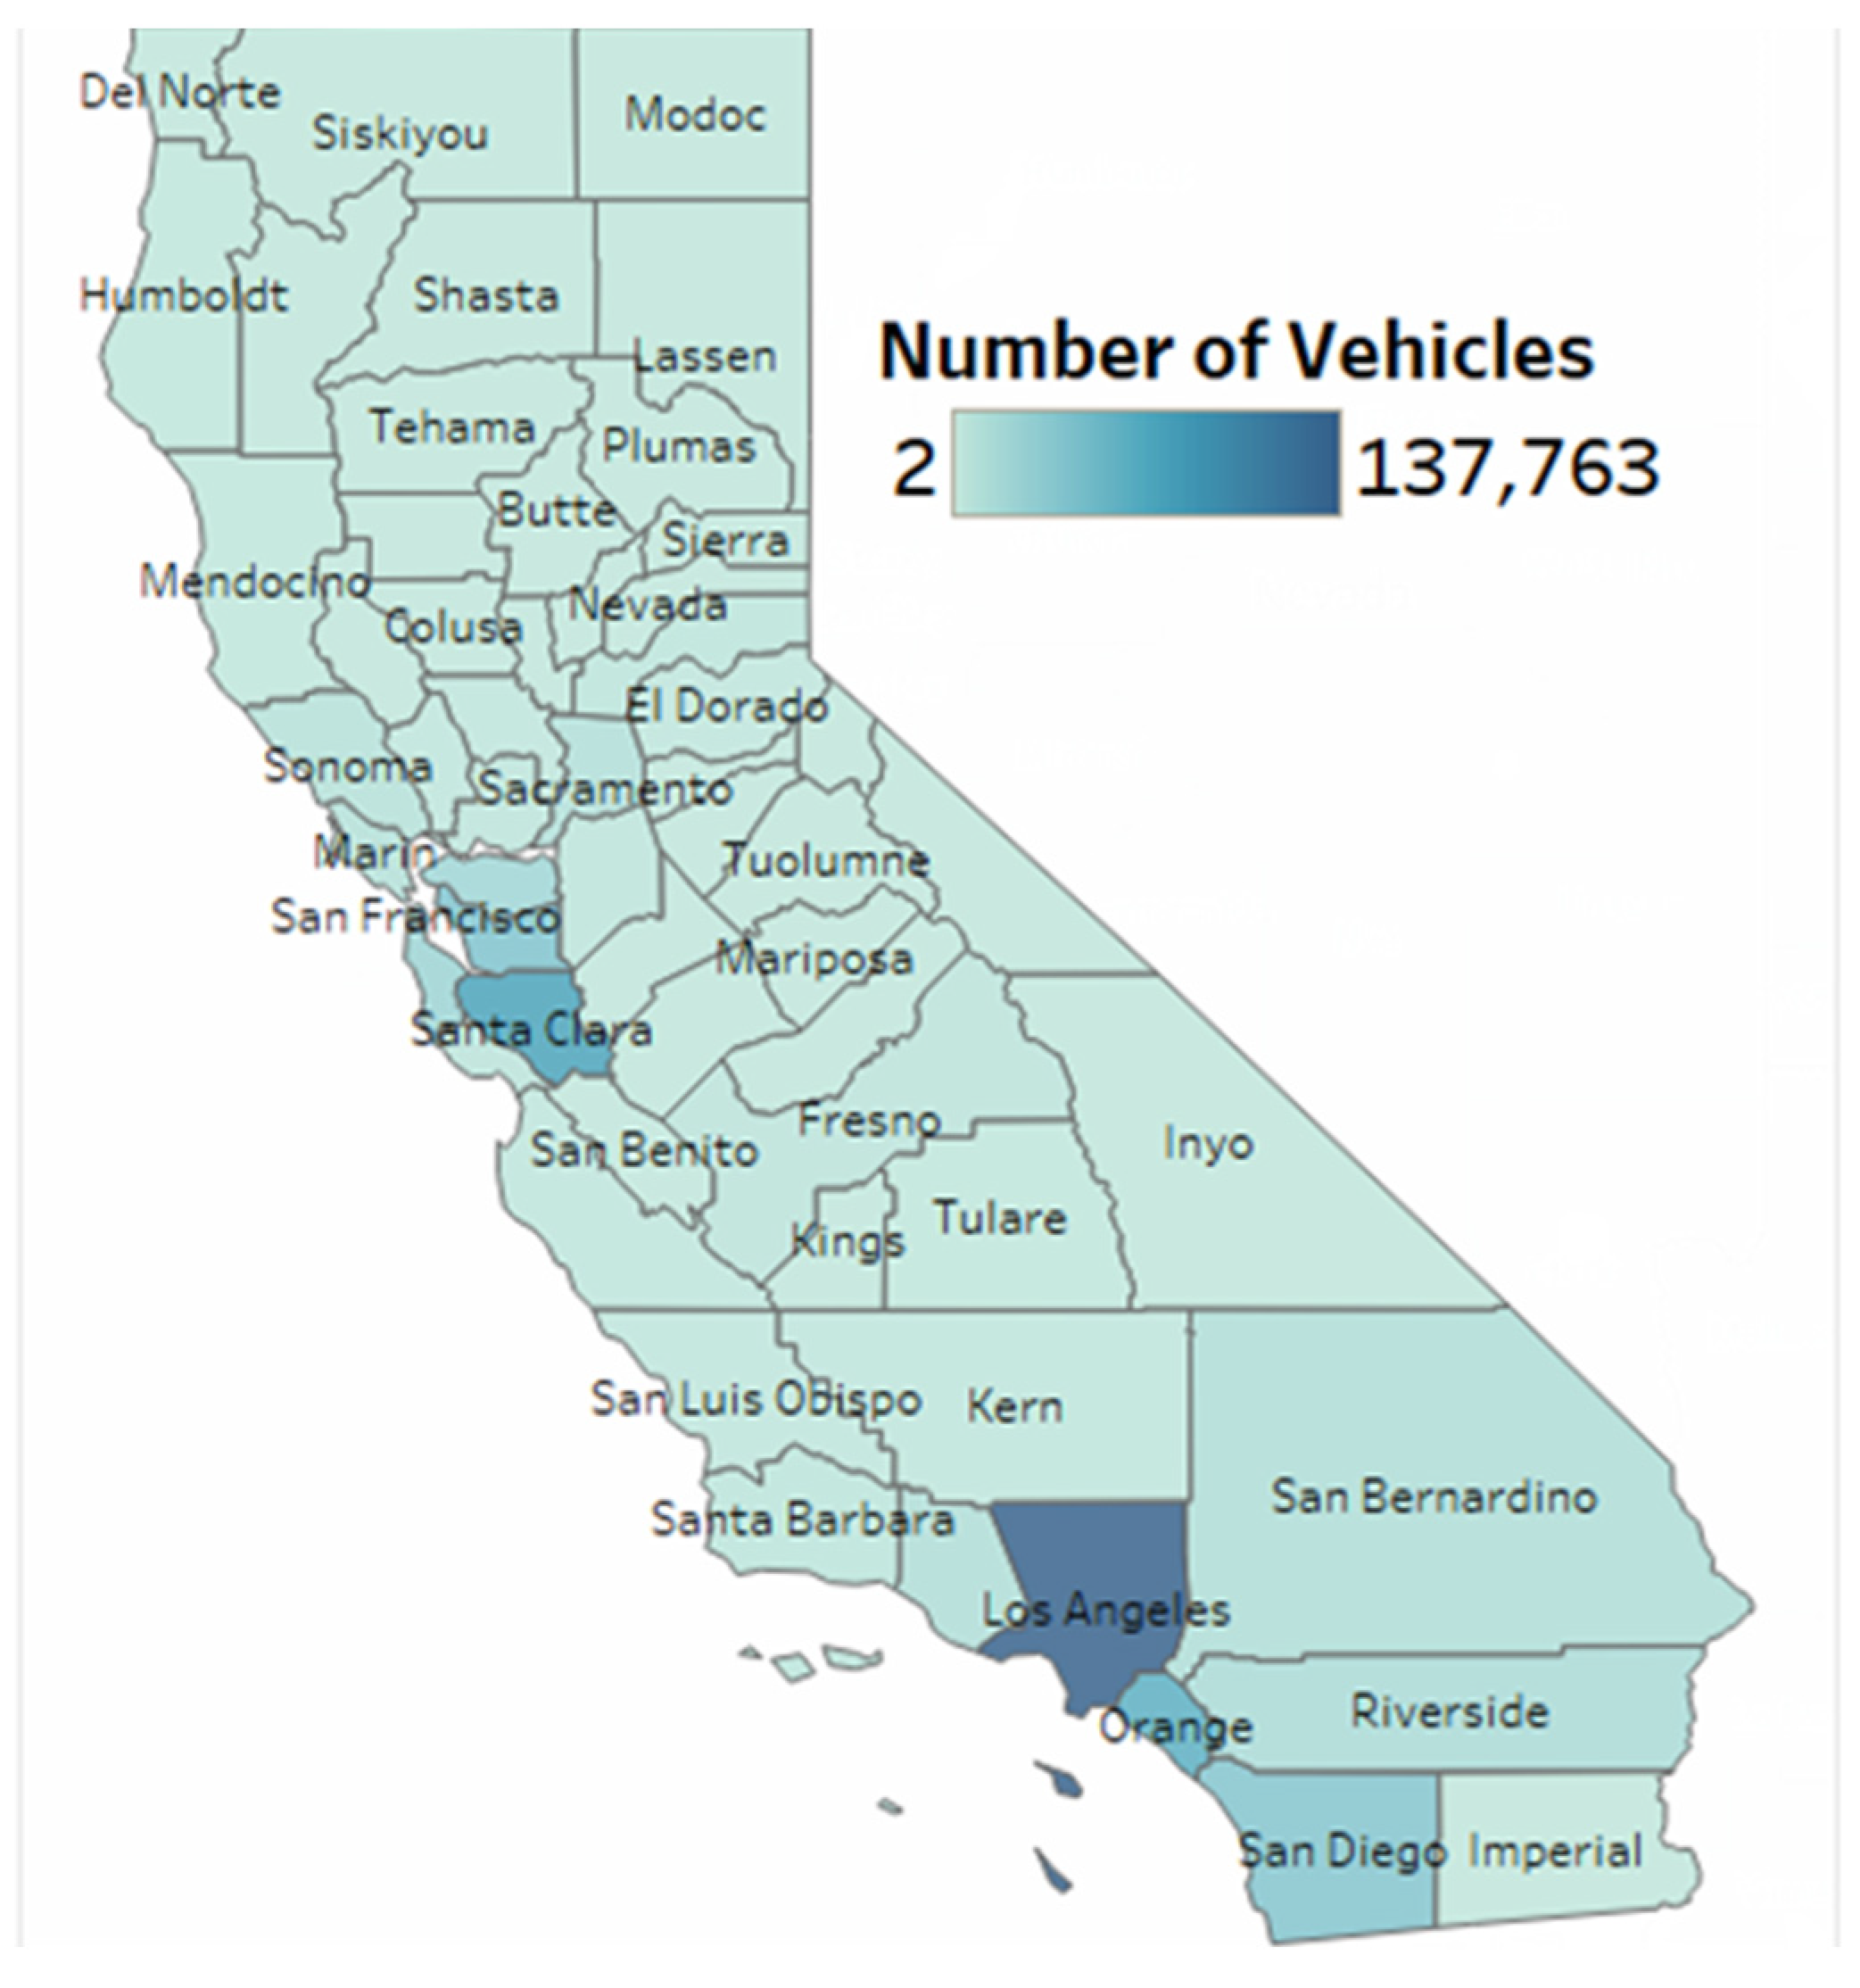
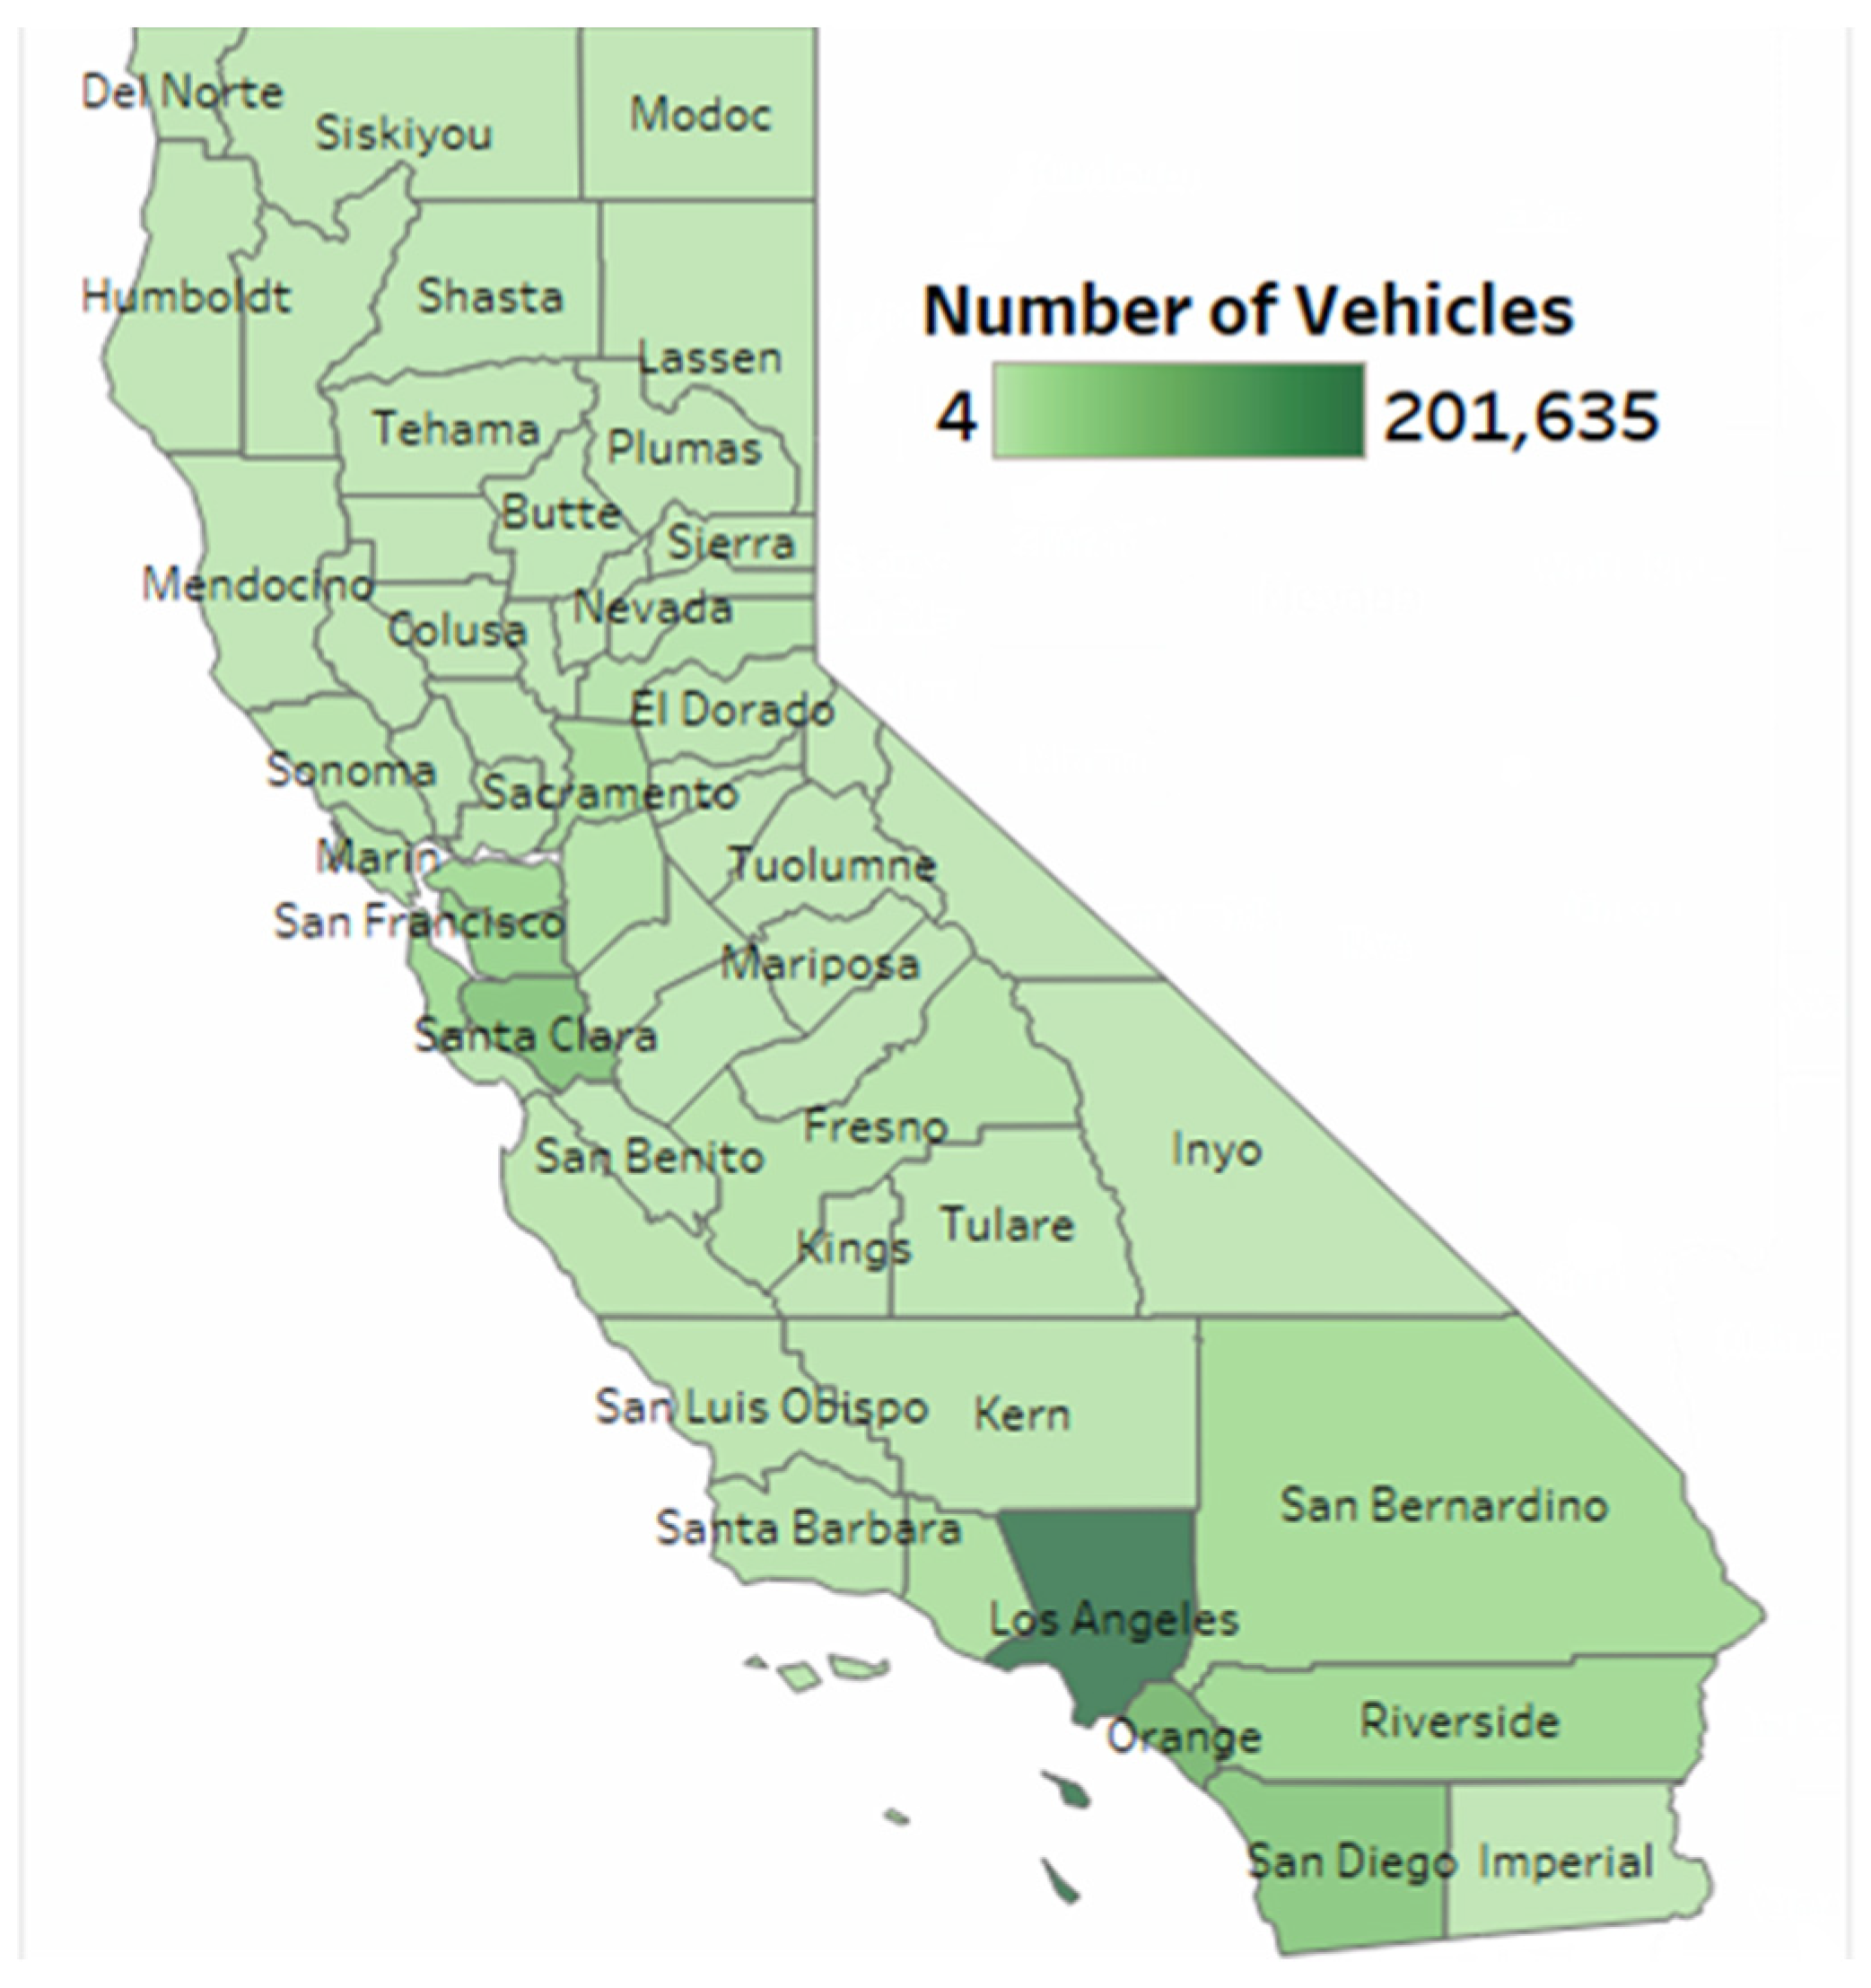
3. Discussion
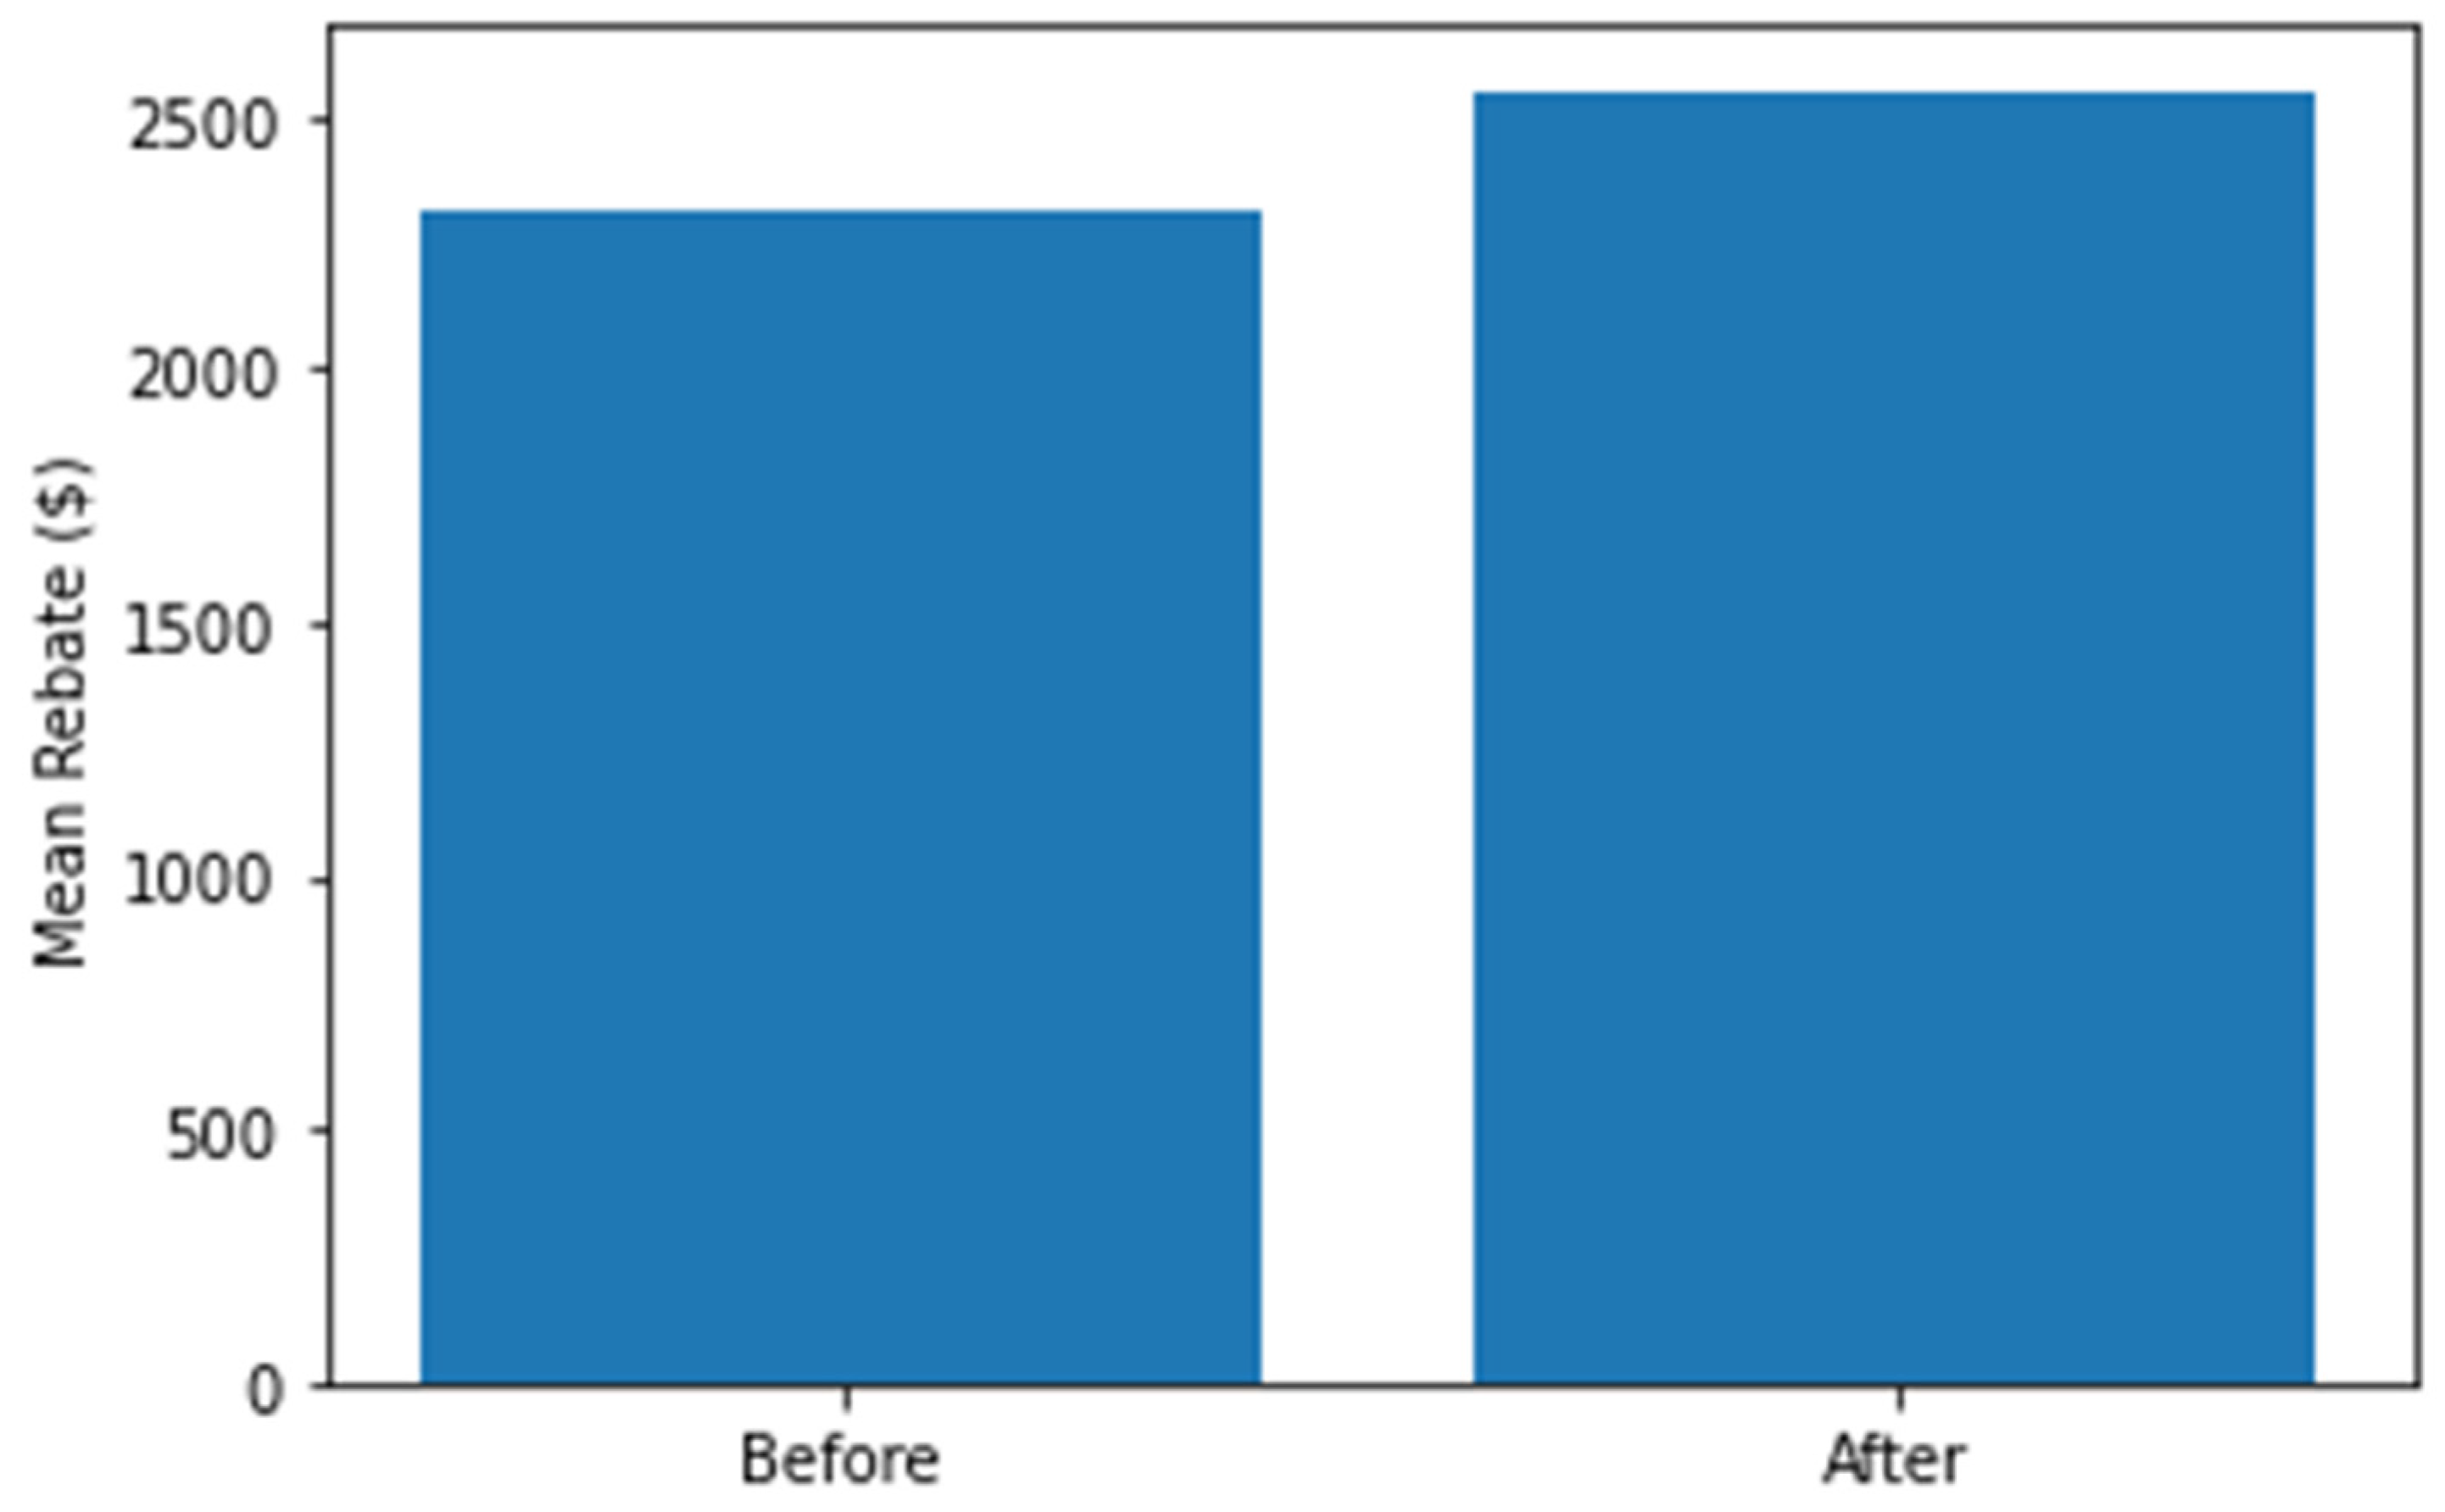
3.1. Rebate Analysis
| Methodology | Description |
|---|---|
| Data Source | California Energy Commission (CEC), California Department of Motor Vehicles, California Air Resources Board (CARB), and U.S. Census Bureau |
| Period | 2010-2022 |
| Treatment | Installation of EV charging stations |
| Control Group | N/A |
| Pre-Period | >2019 |
| Post-Period | <2019 |
| Outcome Variable | The dollar amount of the Rebate |
| t-statistics | nan |
3.2. EV Adoption Analysis
- Infrastructure Accessibility Matters: The increased adoption of electric vehicles after the installation of charging stations highlights the importance of accessibility to charging infrastructure. Consumers are more likely to embrace EVs when they have confidence in their ability to find convenient and reliable charging points.
- Reducing Range Anxiety: Charging station installations contribute to reducing “range anxiety,” a common concern among potential EV adopters. Knowing that charging stations are readily available can alleviate fears of running out of power during trips, making EVs a more attractive choice for daily use and longer journeys.
- Policy Implications: Policymakers can draw significant lessons from these results. Investments in expanding the charging network can yield substantial returns in terms of increased EV adoption, aligning with California’s ambitious emissions reduction goals.
- Consumer Behavior: Understanding the impact of charging infrastructure on adoption provides insights into consumer behavior. It suggests that the decision to switch to an electric vehicle is not solely based on the environmental benefits but is also influenced by practical considerations, including charging convenience.
- Future Growth: As the EV market continues to expand, the role of charging infrastructure will become increasingly critical. With ongoing technological advancements and infrastructure development, the EV adoption rate is likely to continue rising.
| Methodology | Description |
|---|---|
| Data Source | California Energy Commission (CEC), California Department of Motor Vehicles, California Air Resources Board (CARB), and U.S. Census Bureau |
| Period | 2010-2022 |
| Treatment | Installation of EV charging stations |
| Control Group | N/A |
| Pre-Period | >2019 |
| Post-Period | <2019 |
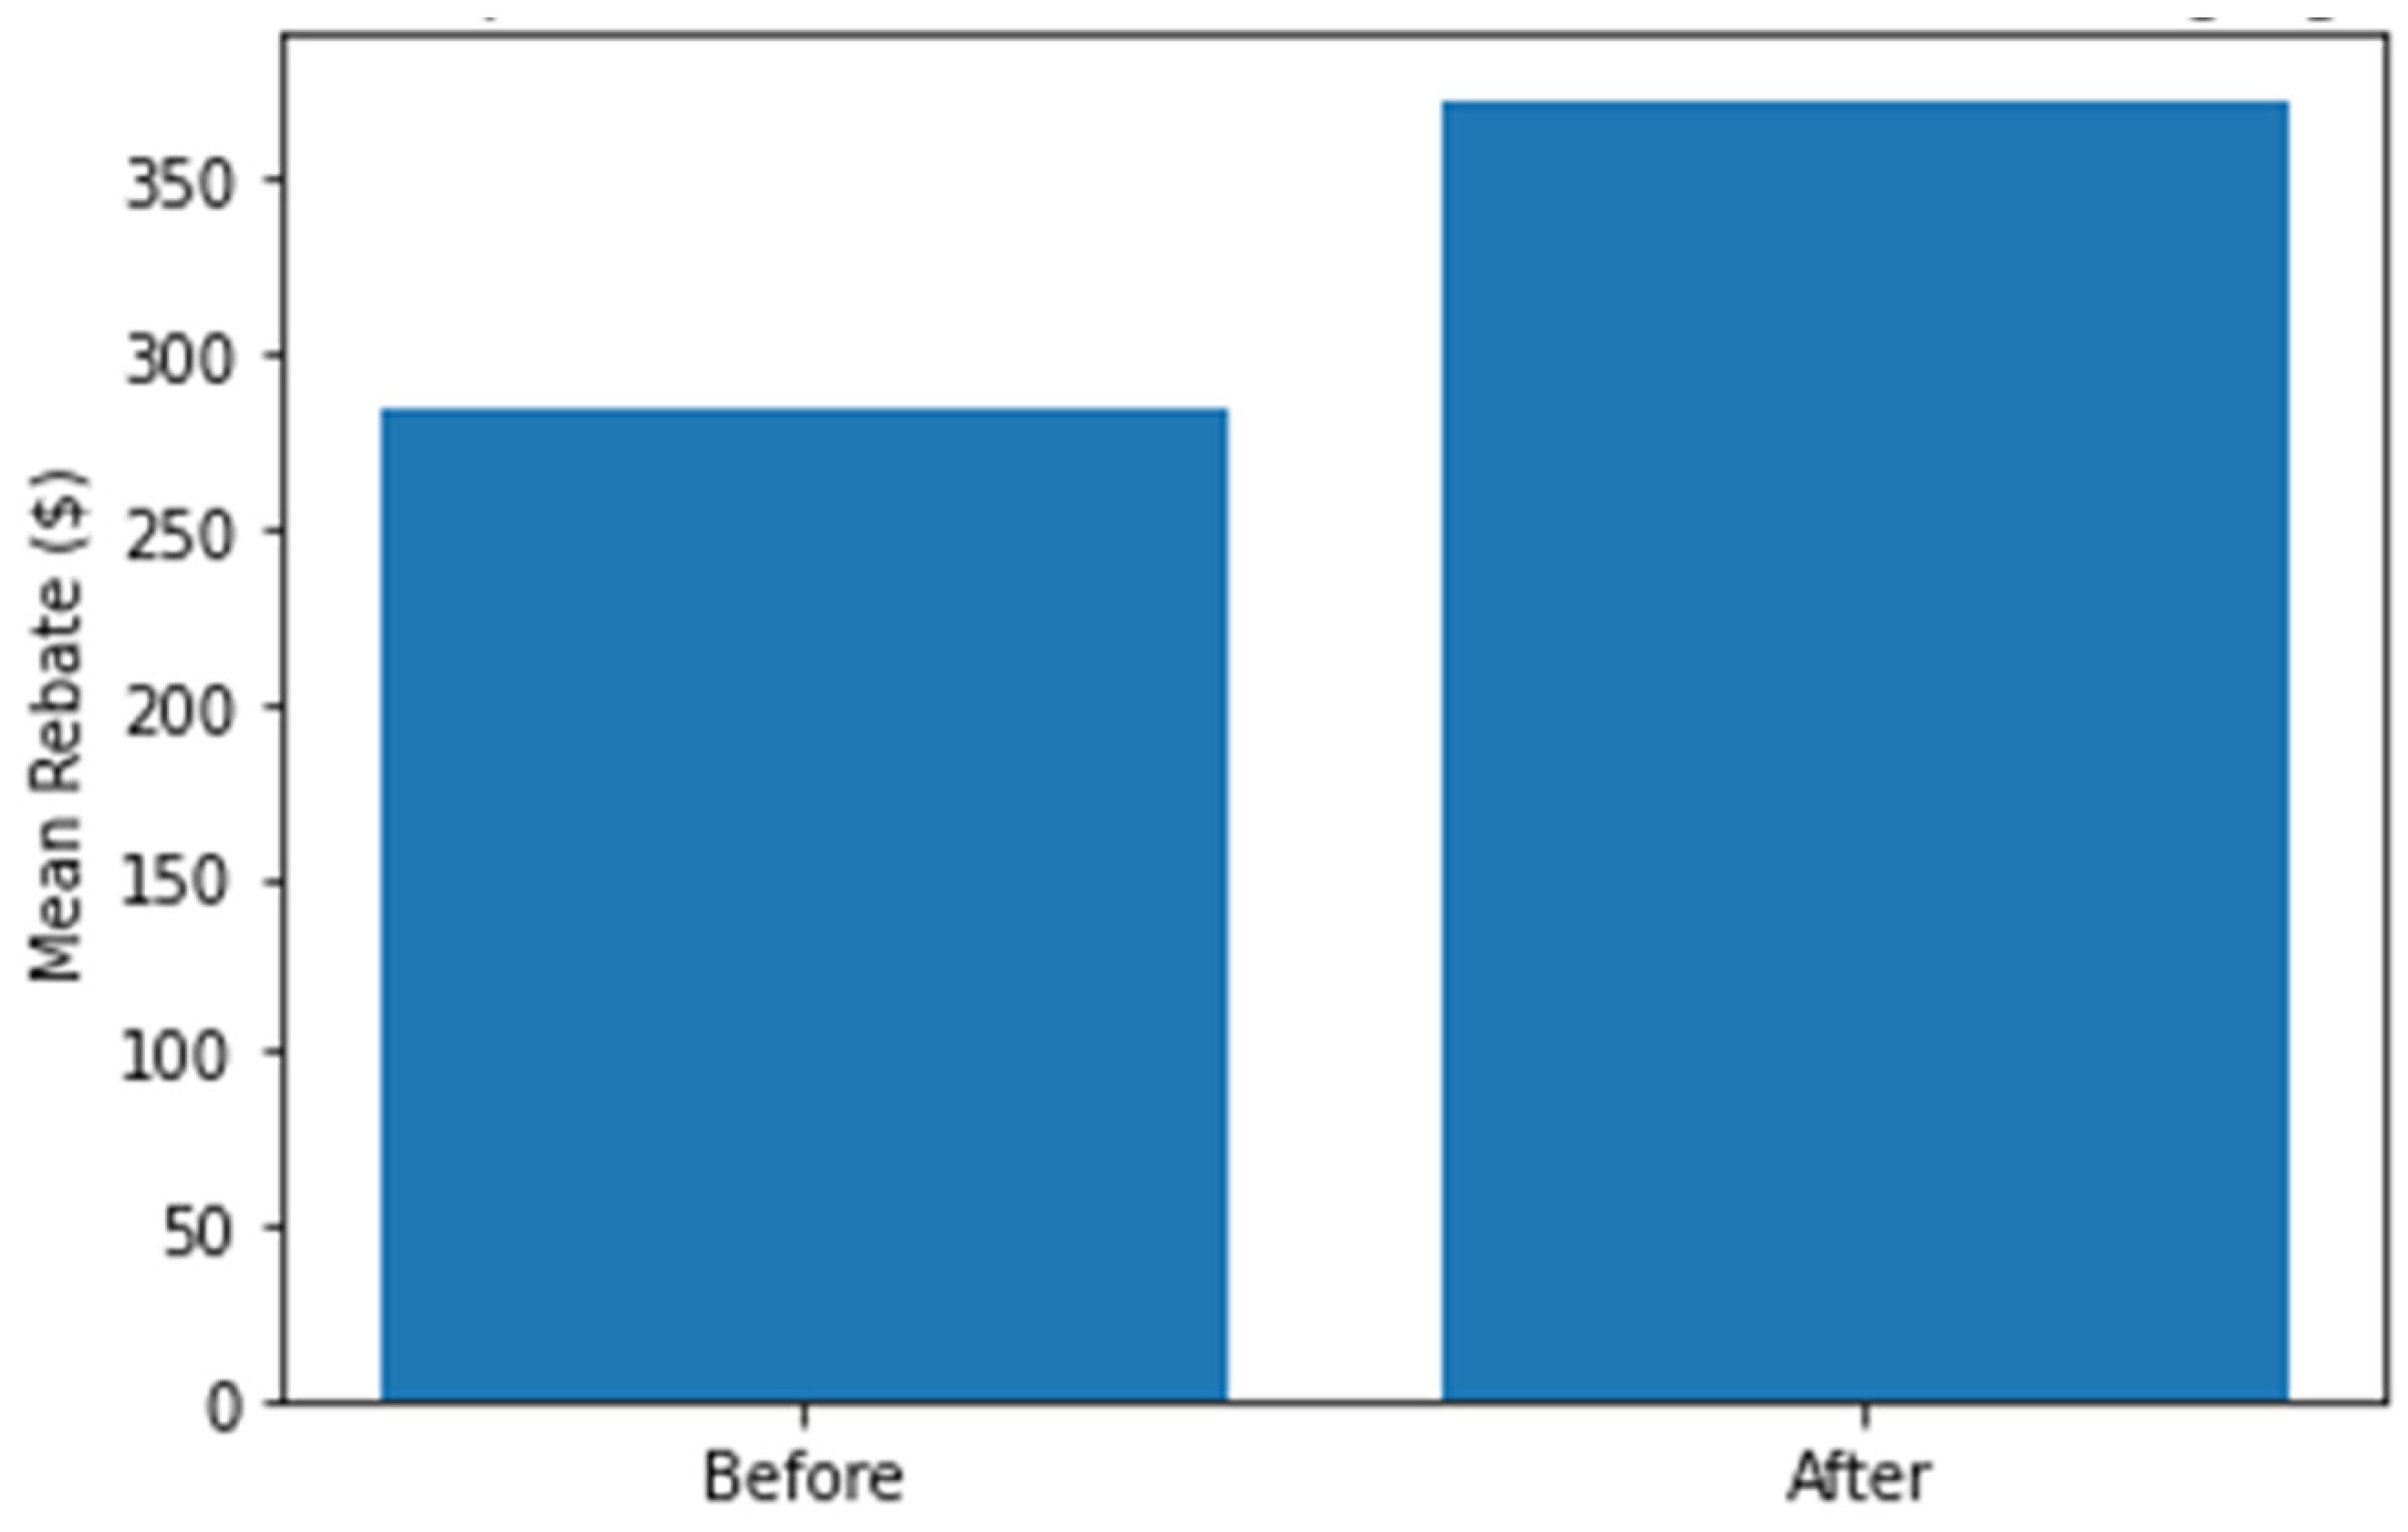
| Outcome Variable | EV adoption count |
| t-statistics | -23.89 |
| Significance Level (p-value) | 0.000 |
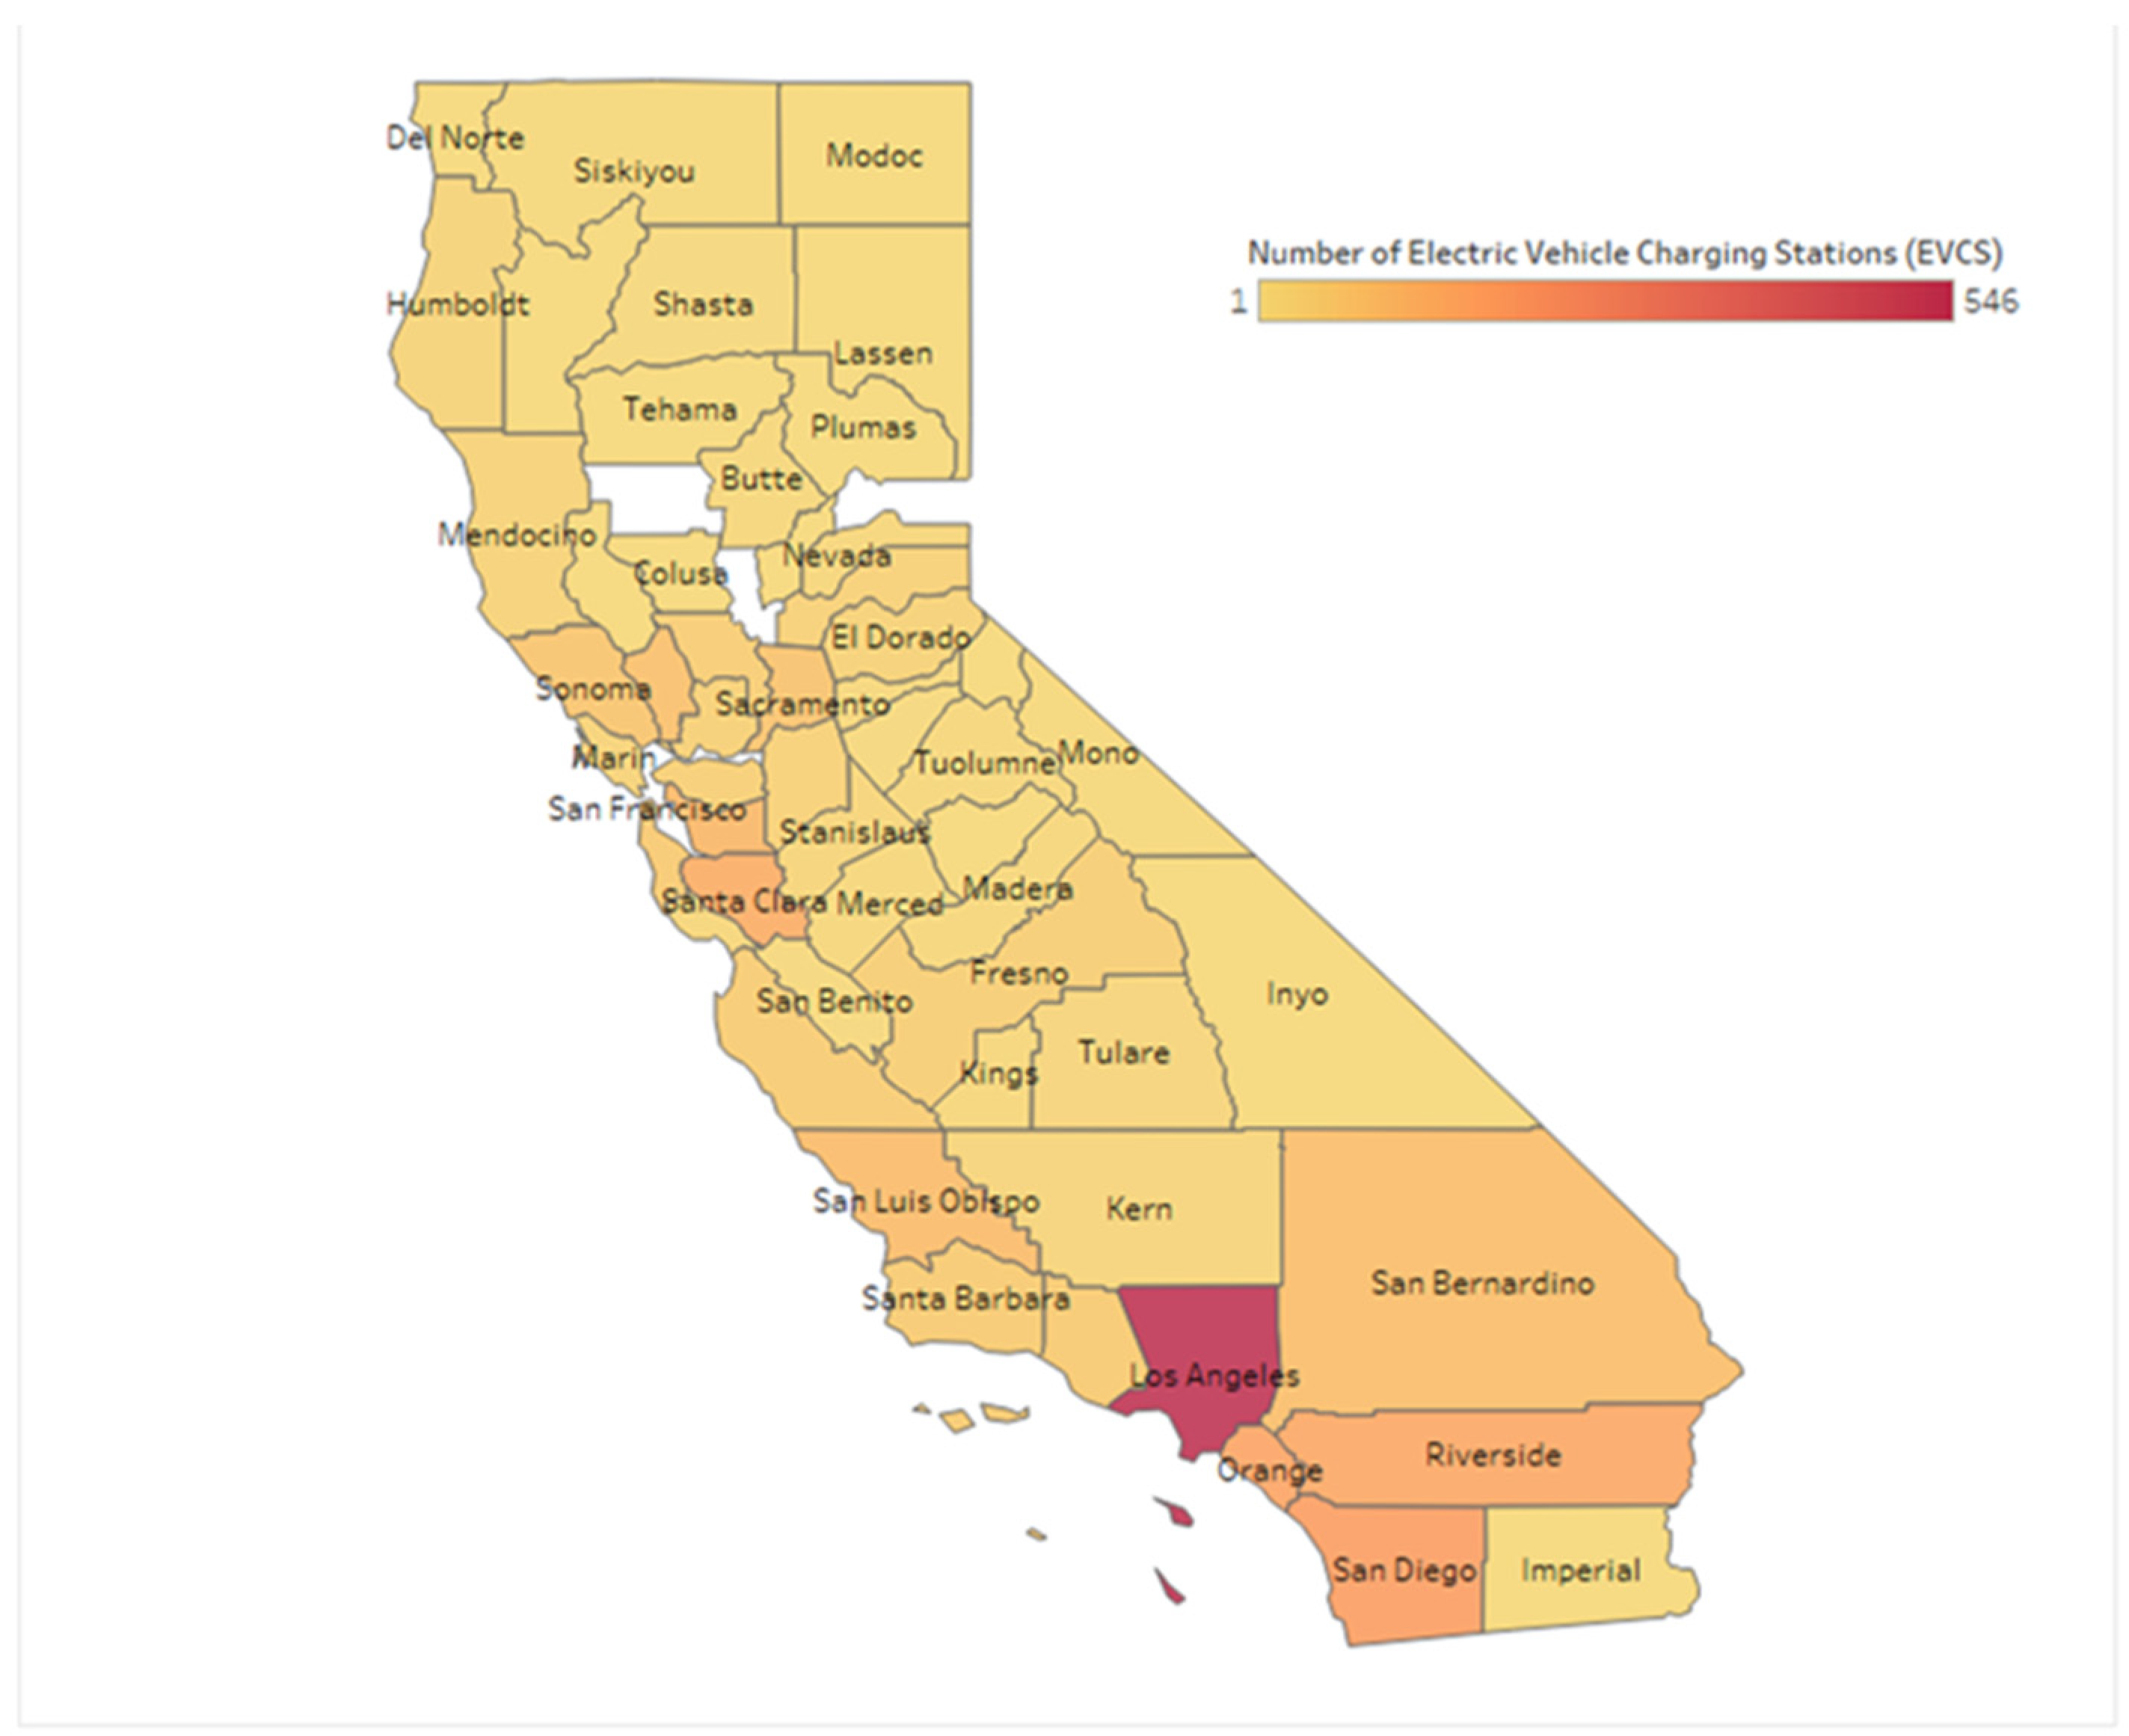
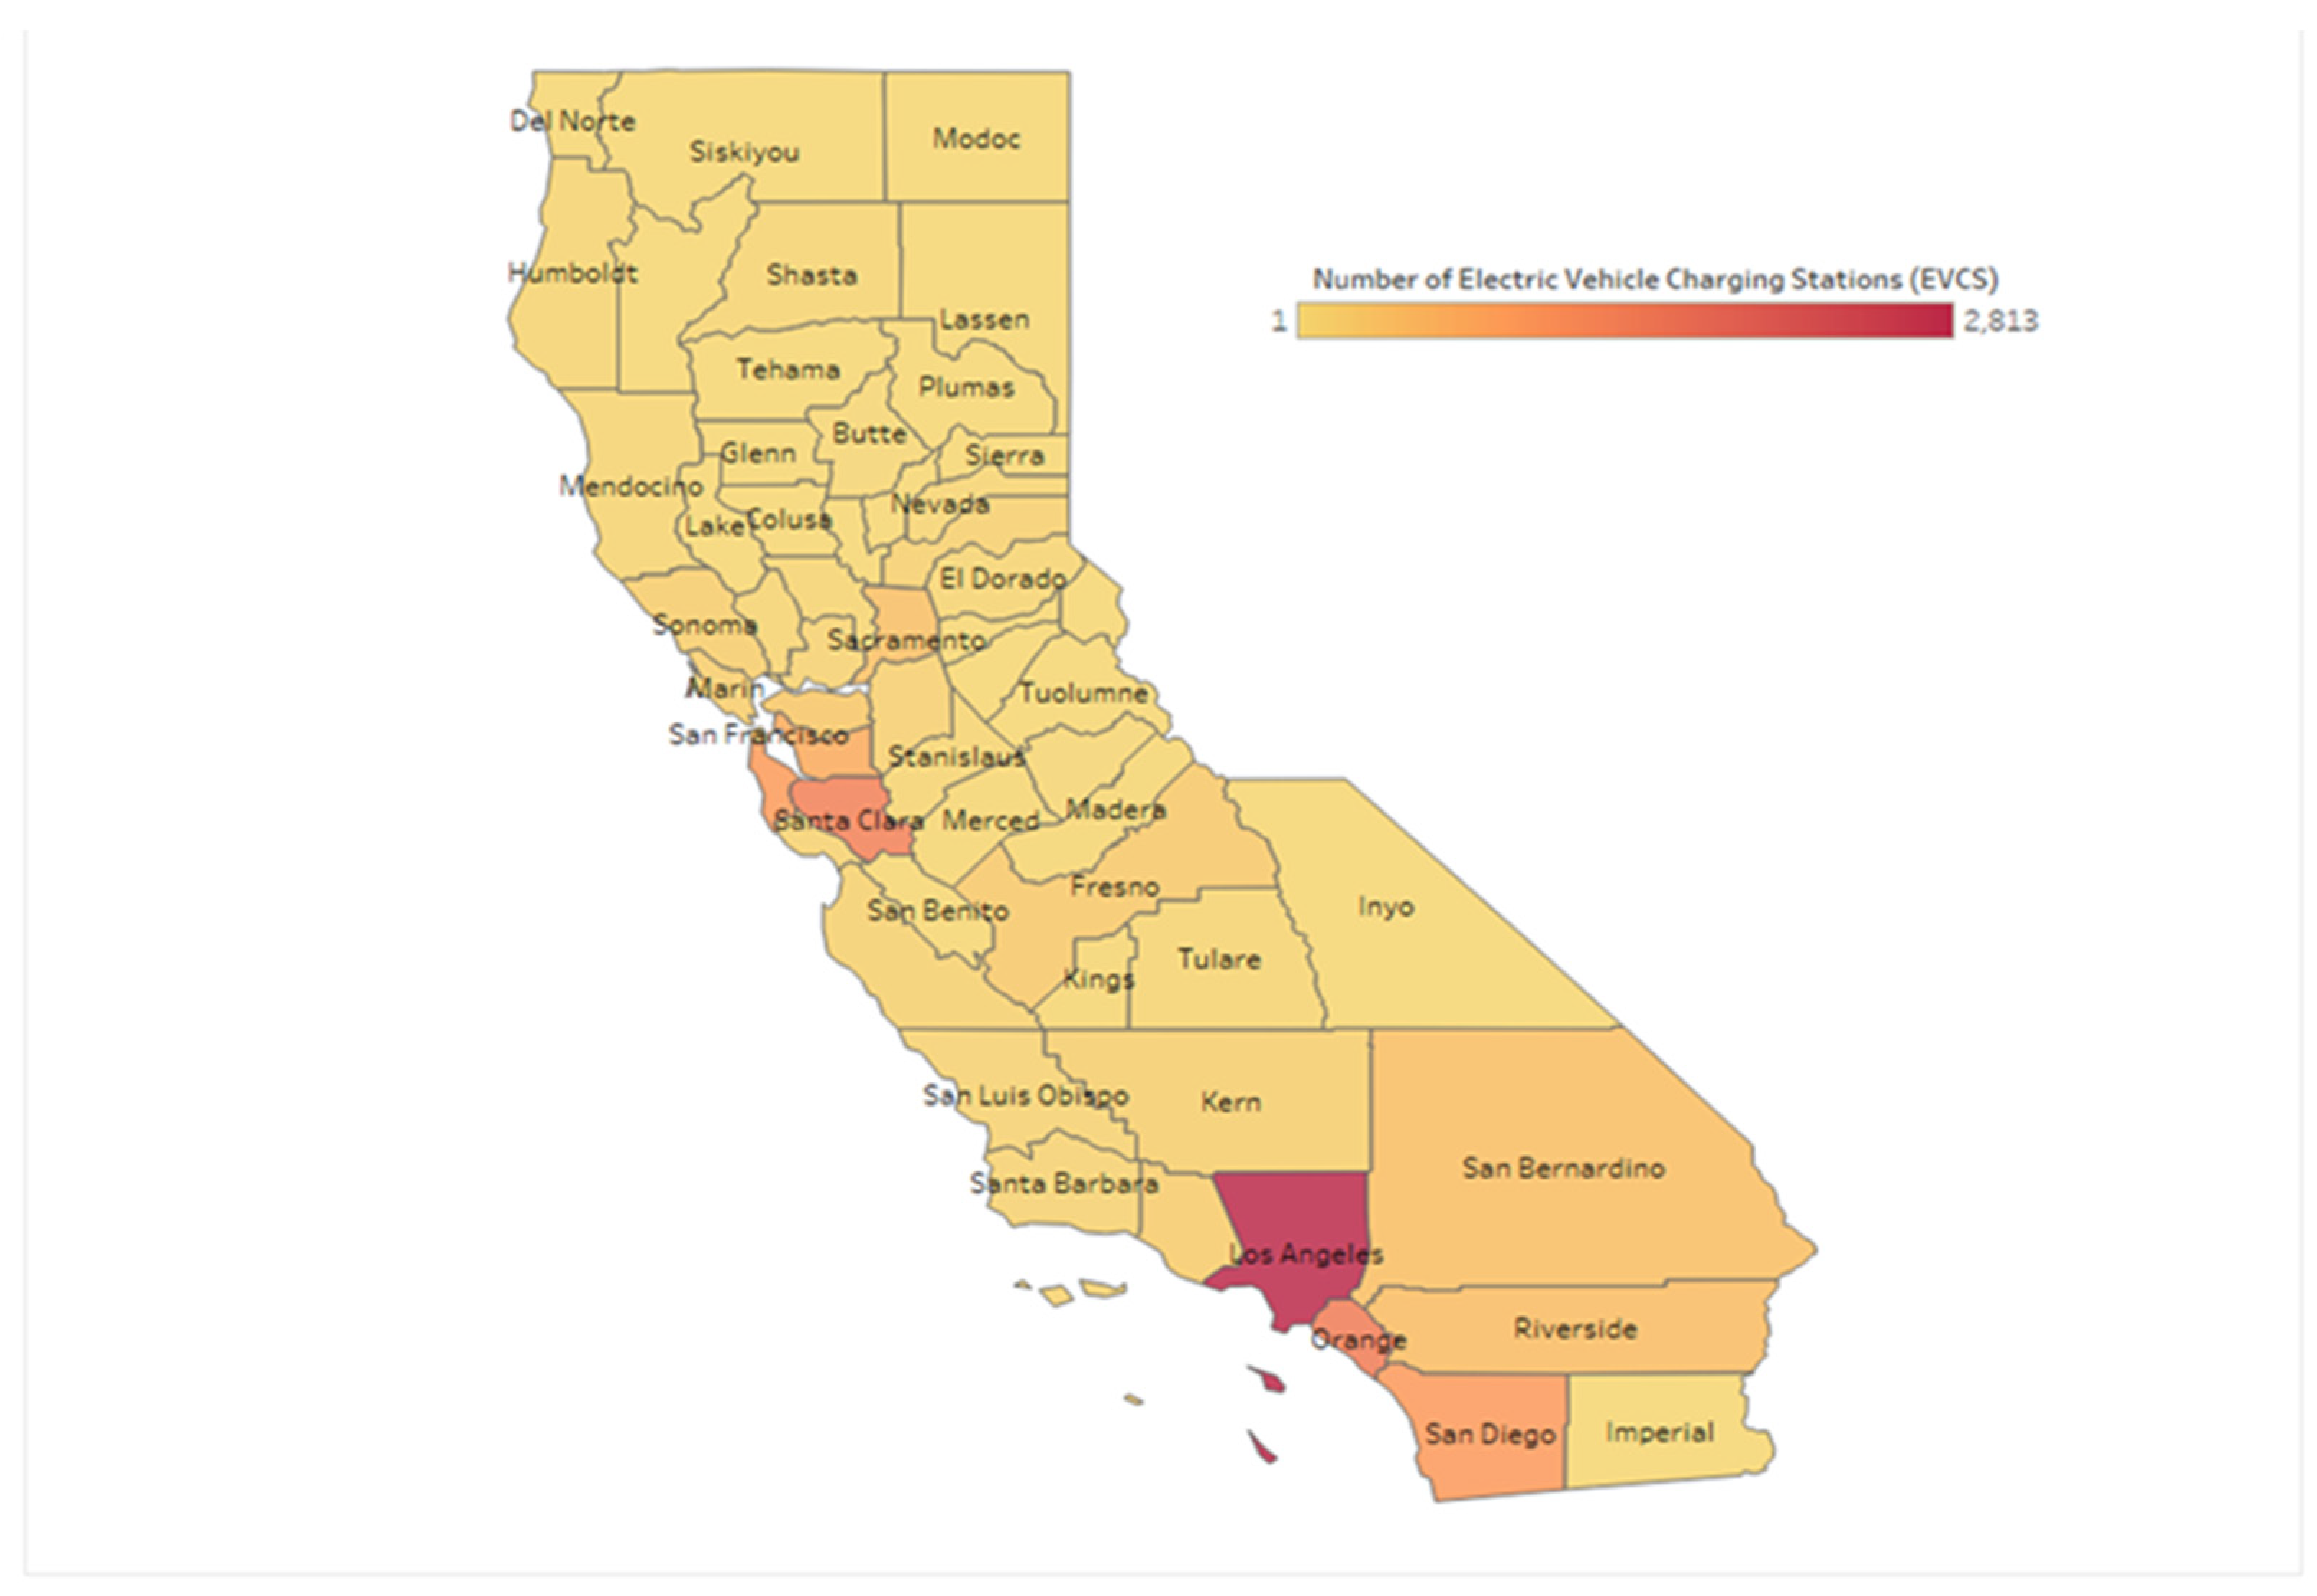
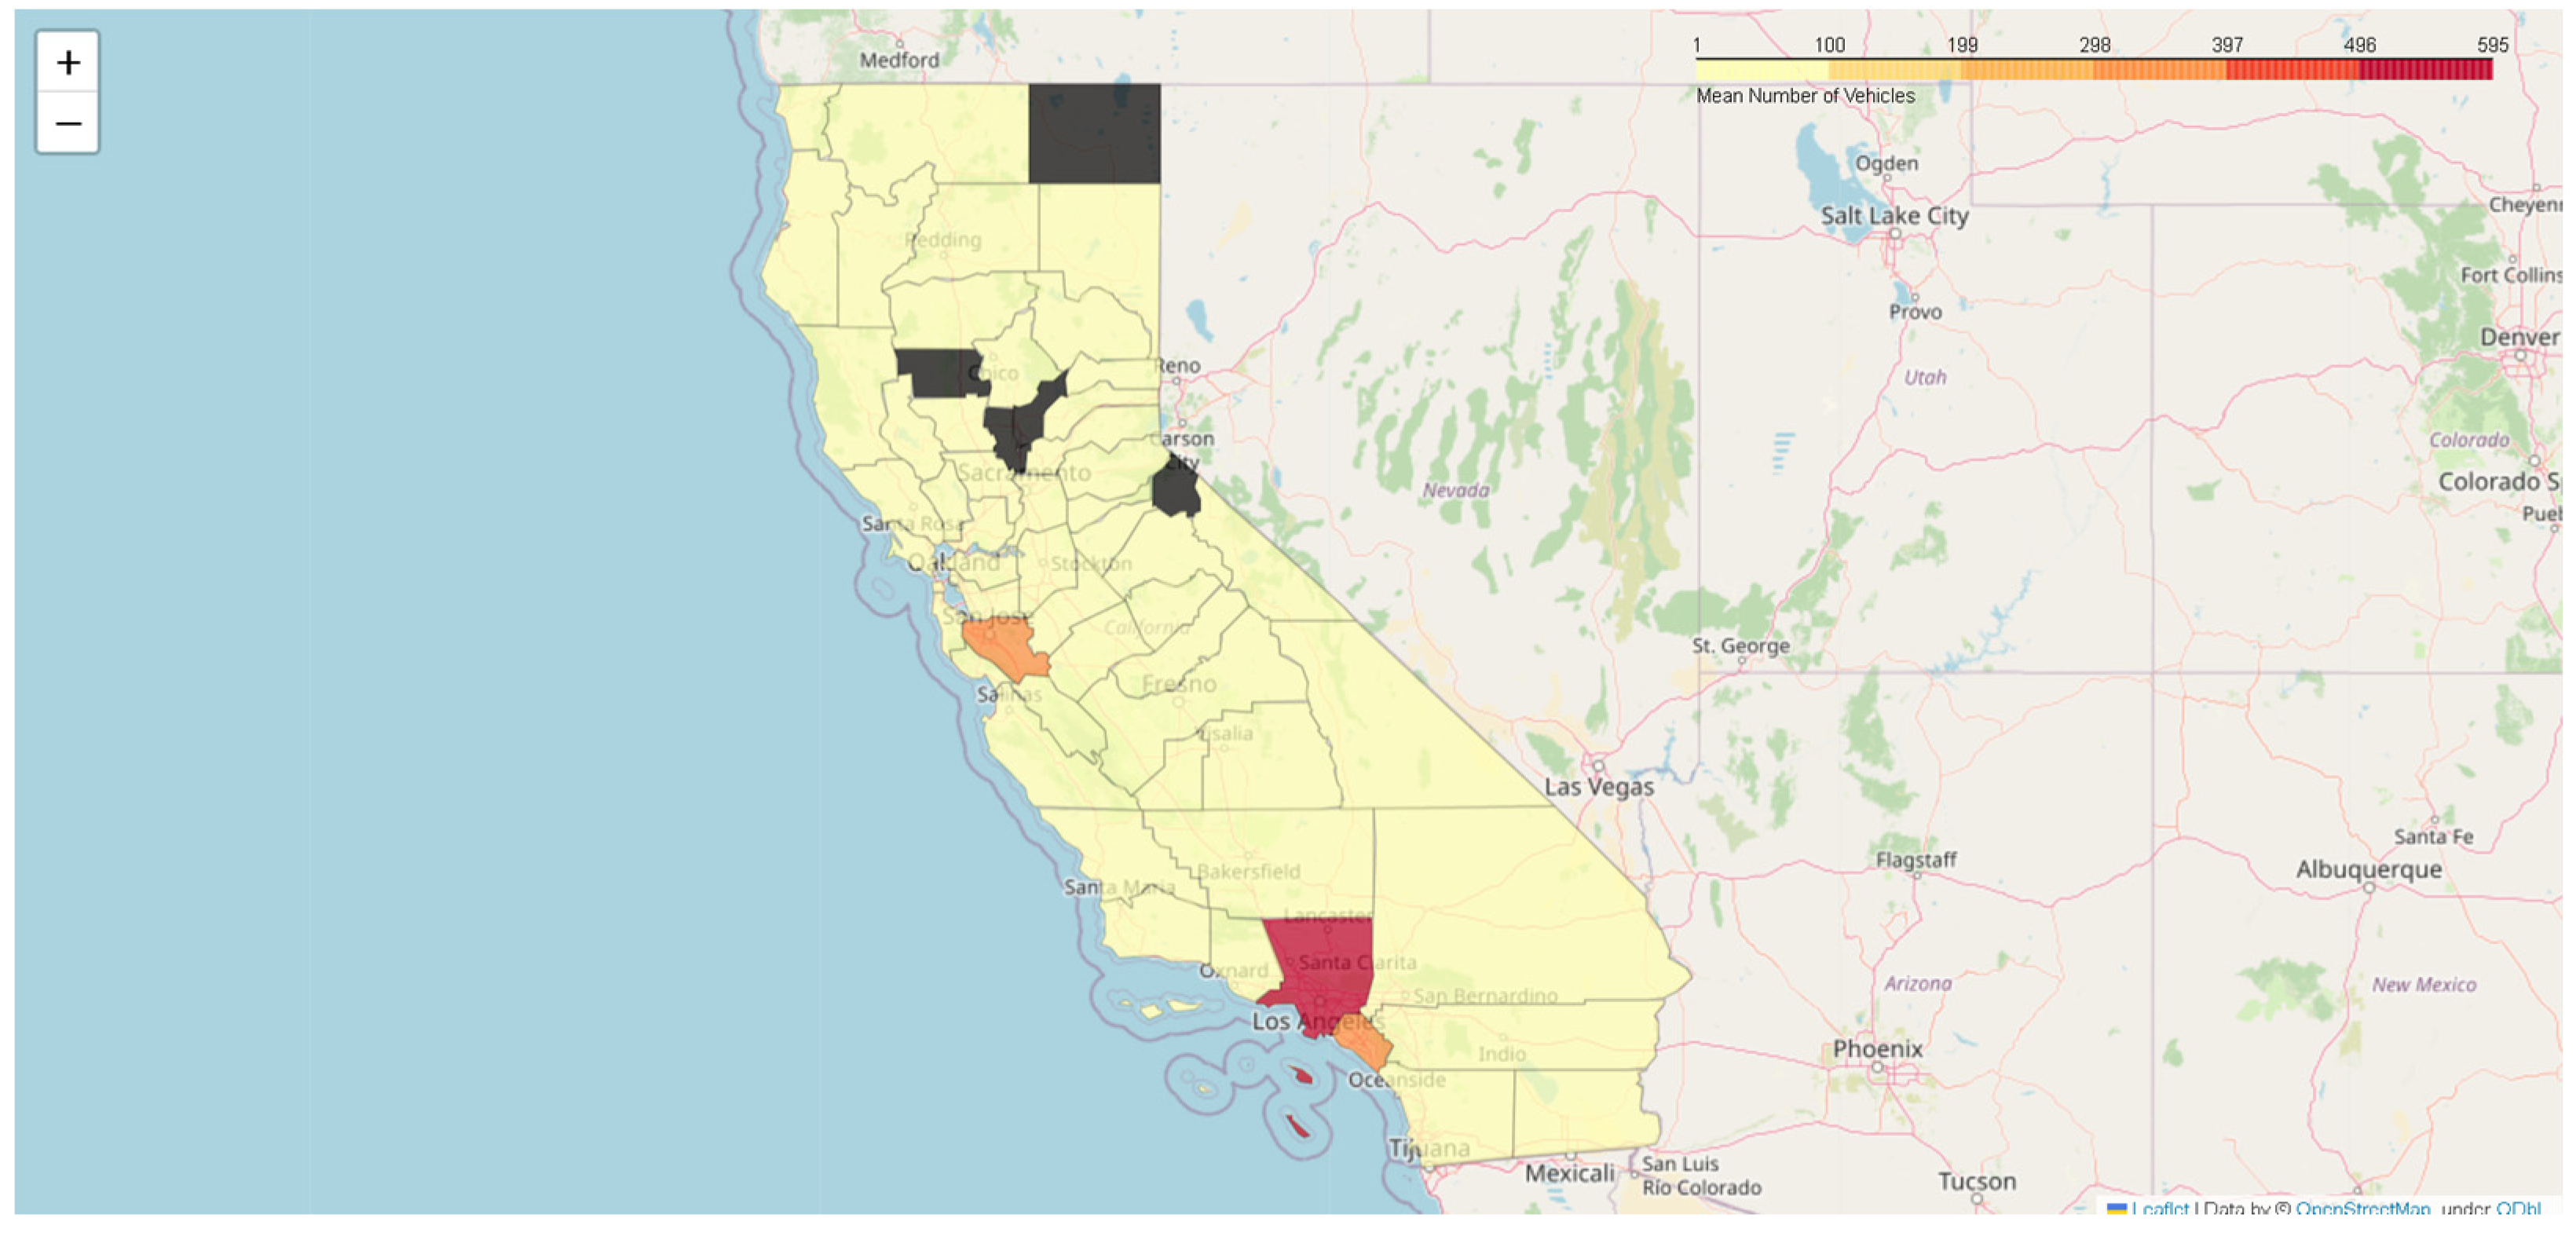
3.3. Implications of Pre-2019 EVCS Distribution
4. Policy Implications/Conclusion
-
Investment in Charging Infrastructure: The statistically significant increase in EV adoption after the installation of EV charging stations underscores the importance of continued investment in charging infrastructure. Policymakers should prioritize the expansion of charging networks to improve accessibility and convenience for EV owners. This includes increasing the number of charging stations in urban areas, along highways, and in public places.
- Analysis Support: The statistical analysis showed that the mean EV adoption count increased significantly from 283 to 373.02 after EVCS installation, indicating the direct impact of infrastructure accessibility on adoption.
-
Reducing Range Anxiety: One of the major barriers to EV adoption is range anxiety, the fear of running out of battery power while driving. By strategically placing charging stations, policymakers can help alleviate this concern and encourage more consumers to transition to EVs.
- Analysis Support: The significant increase in EV adoption rates can be attributed to reduced range anxiety, as consumers have more confidence in their ability to find charging stations conveniently.
-
Supporting Emission Reduction Goals: Many regions, including California, have set ambitious goals to reduce greenhouse gas emissions. The study’s results suggest that promoting EV adoption through infrastructure development can contribute to achieving these targets. Policymakers should align their EV policies with broader environmental objectives.
- Analysis Support: As EVs produce lower emissions compared to traditional vehicles, the increase in EV adoption contributes to reducing overall greenhouse gas emissions.
-
Incentives and Regulations: While infrastructure expansion is crucial, policymakers should also consider a comprehensive approach that includes financial incentives, tax credits, and regulations that promote EV adoption. These measures can work in tandem with infrastructure development to drive consumer interest.
- Analysis Support: The study did not directly account for incentives and regulations, but their role in EV adoption is well-documented in the literature, and they likely interact with infrastructure availability.
-
Long-Term Planning: Policymakers should consider the long-term sustainability of charging infrastructure. This includes addressing issues related to maintenance, technology upgrades, and ensuring that charging stations remain accessible and functional over time.
- Analysis Support: While the study’s data covers up to 2022, long-term planning is essential to support the continued growth of the EV market beyond the scope of this analysis.
-
Public-Private Partnerships: Collaborations between government entities and private sector stakeholders, including charging station providers and automakers, can help accelerate the deployment of EVCS. Policymakers can create a conducive environment for such partnerships.
- Analysis Support: The study’s findings provide evidence that the installation of EVCS positively impacts EV adoption, making the case for continued collaboration between public and private sectors.
4.1. Future Research Directions
- Long-Term Impact: This study focused on a relatively short-term period from 2010 to 2022. Future research could explore the long-term impact of EV charging stations on EV adoption and rebates over several decades. This would provide a more comprehensive view of how charging infrastructure influences the evolution of the electric vehicle market.
- Regional Variations: California is a diverse state with varying demographics and geographic features. Future research could delve deeper into regional variations in the impact of EV charging stations on EV adoption and rebates. This would help identify areas where charging infrastructure has a more significant effect and tailor policies accordingly.
- Consumer Behavior: Understanding consumer behavior is crucial in promoting EV adoption. Future research could investigate the psychological and sociological factors that influence individuals’ decisions to purchase EVs, even in the presence of charging infrastructure. This could include factors like social norms, peer influence, and perceived environmental benefits.
- Economic Analysis: A more comprehensive economic analysis could be conducted to assess the cost-effectiveness of EV charging station installations compared to other policy measures aimed at promoting EV adoption. This would help policymakers allocate resources more efficiently.
- Policy Evaluation: Evaluating the effectiveness of specific policies, such as rebate programs and incentive schemes, in conjunction with charging infrastructure expansion could provide valuable insights into the most impactful strategies for accelerating EV adoption.
- Technological Advancements: With rapid advancements in battery technology and charging infrastructure, future research should keep pace with these developments. Assessing how emerging technologies, such as fast-charging stations and higher-capacity batteries, impact EV adoption will be essential.
- Environmental Impact: While this study briefly touched on the environmental benefits of EV adoption, future research could delve deeper into quantifying the reduction in greenhouse gas emissions attributable to increased EV adoption facilitated by charging infrastructure.
- Public Perception: Understanding how the public perceives EV charging stations and their role in the transition to electric mobility is crucial. Future studies could explore public attitudes, concerns, and awareness regarding EV infrastructure.
4.2. Limitations
- Causality and Correlation: The analysis presented in this study establishes a correlation between the installation of EV charging stations and increased EV adoption. However, it does not establish causality. While the presence of charging infrastructure is associated with higher EV adoption rates, other unmeasured factors may also contribute to the observed trends.
- Data Limitations: The study relies on publicly available data sources, which may have limitations in terms of accuracy and completeness. Additionally, the data might not capture all relevant variables that could influence EV adoption, such as local economic conditions, consumer preferences, and advertising campaigns.
- Temporal Scope: The analysis covers the period from 2010 to 2022, with a post-period defined as 2019. While this choice was made to align with significant policy developments, it may not capture longer-term trends and the full impact of charging infrastructure on EV adoption.
- Regional Specificity: The study focuses on California, a state known for its strong commitment to environmental initiatives and EV adoption goals. Findings from this study may not be directly applicable to regions with different policies, economic conditions, and cultural attitudes toward EVs.
- Other Policy Factors: While this study focuses on the role of EVCS, it does not account for other policy factors, such as tax incentives, rebates, and emissions regulations, which can also influence EV adoption rates. Isolating the specific impact of EVCS can be challenging given the complex interplay of multiple policy initiatives.
- Future Developments: The analysis is based on historical data, and the EV landscape is rapidly evolving. Future developments in technology, government policies, and consumer attitudes may impact EV adoption differently, and the study’s findings may not fully reflect these changes.
- Sample Size: The study’s sample size, especially when examining subgroups based on factors like income and housing density, may limit the generalizability of results. Larger and more diverse datasets could provide a more comprehensive understanding.
- Consumer Behavior: The study primarily focuses on quantitative data and does not delve deeply into the underlying motivations and decision-making processes of consumers when adopting EVs. Qualitative research could provide additional insights into the driving factors behind EV adoption.
- External Factors: External events and unforeseen circumstances, such as global economic downturns or natural disasters, can influence EV adoption rates. These factors are difficult to account for in retrospective data analysis.
Acknowledgments
Conflicts of Interest
References
- Wood, Eric, et al. The 2030 National Charging Network: Estimating U.S. Light-Duty Demand for Electric Vehicle Charging Infrastructure. s.l. : National Renewable Energy Laboratory, 2023.
- California Air Resource Board. Going Zero. 2023.
- Review and Meta-Analysis of EVs: Embodied Emissions and Environmental Breakeven. Dillman, Joseph Kevin, et al. 2020, Transport Systems for Sustainability: Policy, Planning and Exploitation).
- National Academies of Science Engineering and Medicine. Assessment of Technologies for Improving Light-Duty Vehicle Fuel Economy—2025-2035. Washington, DC : The National Academies Press, 2021.
- Bosetti, Valentina, et al. Integrated Risk and Uncertainty Assessment of Climate Change Response Policies. 2022.
- The White House. Building Resilient Supply Chains, Reviralizing American Manufacturing, and Fostering Broad -Based Growth. 2021.
- Energys your way. The Relationship Between Electric Vehicle Adoption and Accessible Charging Infrastructure. 2023.
- Global EV Outlook. Trends in charging infrastructure. 2023.
- California Energy Commission. Electric Vehicle Charging Infrastructure Assessment - AB 2127. 2023.
- The Impact of Consumer Subsidy on Green Technology Innovations for Vehicles and Environmental Impact. Juan, Zhang, Ziyue, Wang and Huiju, Zhao. 2020, Int J Environ Res Public Health. [CrossRef]
- Electric Vehicles: Benefits, Challenges, and Potential Solutions for Widespread Adaptation. Alanazi, Fayez. 2023, Towards a Sustainable Future: The Role of Electric Vehicles and Smart Grids in the Energy Transition).
- Environmental and economic impact of electric vehicle adoption in the U.S. Zhenhua, Chen, et al. 2021, Environmental Research Letters,, pp. Volume 16, Number 4.
- Electric Vehicle Benefits and Considerations. U.S. Department of Energy. 2023, Energy Efficiency & Renewable Energy.
- Carreon, R. Alessandra. The EV Battery Supply Chain Explained. s.l. : RMI, 2023.
- U.S. Department of Transportation. transportation.gov. transportation.gov. [Online] December 27, 2022. https://www.transportation.gov/rural/ev/toolkit/ev-basics/charging-speeds.
- Are Individuals’ stated preferences for electric vehicles (EVs) consistent with real-world EV ownership patterns? Wenjian Jia, T. Donna Chen. 2021, Transportation Research Part D: Transport and Environment. [CrossRef]
- E.V. Range Anxiety: A Case Study. A dearth of Charging Stations makes road trips dicey. Gelles, David. 2023, The New York Times.
- Chhatwal, Geetika. Revving Up Innovation: The Surge of Electric Vehicles in Global Markets. s.l. : Kadence International, 2023.
- Identifying optimal locations for community electric vehicle charging. Charly, Anna, et al. s.l. : Sustainable Cities and Society, 2023, Sustainable Cities and Society. [CrossRef]
- Understanding and identifying barriers to electric vehicle adoption through thematic analysis. Krishna, G. 2021, Transportation Research Interdisciplinary Perspectives.
- Electric Vehicle Uptake: Understanding the Print Media’s Role in Changing Attitudes and Perceptions. Broadbent, Gail Helen, Wiedmann, Thomas Oliver and Metternicht, Graciela Isabel. 2021, World Elecrtic Vehicle Journal.
- Brower, Michael. The EV Revolution: Cost, Performance, Safety, and Environmental Impacts. 2023.
- Electric Vehicles: Benefits, Challenges, and Potential Solutions for Widespread Adaptation. Alanazi, Fayez. 2023, Applied Science, pp. 1-23. [CrossRef]
- Mastoi, Muhammad Shahid, et al. An in-depth analysis of electric vehicle charging station infrastructure, policy implications, and future trends. s.l. : Energy Reports, 2022.
- Consumers’ preferences for electric vehicles: The role of status and reputation. Buhmann, Kathrin Monika and Criado, Josep Rialp. s.l. : Transportation Research Part D: Transport and Environment, 2023.
- Promoting electric vehicle adoption: Who should invest in charging infrastructure? Kumar, Rajeev Ranjan, Chakraborty, Abhishek and Mandal, Prasenjit. India : Promoting electric vehicle adoption: Who should invest in charging infrastructure?, 2021, Vol. 149.
- Electrification of Vehicle Miles Traveled and Fuel Consumption within the Household Context: A Case Study from California, U.S.A. Mandev, Ahmet, Sprei, Frances and Tal, Gil. Davis : World Electric Vehicle Journal, 2022. [CrossRef]
- User preferences for EV charging, pricing schemes, and charging infrastructure. Visaria, Anant Atul, et al. s.l. : Transportation Research Part A: Policy and Practice, 2022, Vol. 165. [CrossRef]
- Examining spatial disparities in electric vehicle charging station placements using machine learning. Roy, Avipsa and Law, Mankin. Irvine : Sustainable Cities and Society, 2022. [CrossRef]
- Federal Funding to Help California Expand Electric Vehicle Charging Network. California Energy Commission. s.l. : California Energy Commission,, 2022.
- Research, National Center for Transit. Integrated Approaches to EV Charging Infrastructure and Transit System Planning. s.l. : National Center for Transit Research, 2016.
- A Study to Investigate What Tempts Consumers to Adopt Electric Vehicles. Ali, Imran and Naushad, Mohammad. s.l. : World Electric Vehicle Journal, 2022. [CrossRef]
- Comprehensive Review of Electric Vehicle Technology and Its Impacts: Detailed Investigation of Charging Infrastructure, Power Management, and Control Techniques. Kumar, Madhav, et al. s.l. : Applied Science, 2023. [CrossRef]
- Integration of Renewable Energy and Electric Vehicles in Power Systems: A Review. Manousakis, Nikolaos M., et al. s.l. : processes, 2023. [CrossRef]
- A critical review of the effect of light duty electric vehicle charging on the power grid. Tasnim, Moshammed Nishat, et al. s.l. : Energy Reports, 2023, Vol. 10. [CrossRef]
- A Review on Electric Vehicles: Technologies and Challenges. Sanguesa, Julio and A. 1, *ORCID,Vicente Torres-Sanz 1,Piedad Garrido 1,Francisco J. Martinez 1ORCID andJohann M. Marquez-Barja. s.l. : Smart cities, 2021. [CrossRef]
- Effectiveness of electric vehicle incentives in the United States . Jenn, Alan, Springel, Katalin and Gopal, Anand R. Berkeley : Elsevier, 2018.
- The impact of UK financial incentives on the adoption of electric fleets: The moderation effect of GDP change. Alali, Layla, Niesten, Eva and Gagliardi, Dimitri. United Kingdom : Transportation Research Part A: Policy and Practice, 2022, Vol. 161. [CrossRef]
- A Systematic Review on power systems planning and operations management with grid integration of transportation electrification at scale. Zhang, Qianzhi, et al. s.l. : Advances in Applied Energy, 2023, Vol. 11. [CrossRef]
- Electric Vehicle Ownership Costs: Today’s Electric Vehicle Offer Big Savings for Consumers. Reports, Consumer. s.l. : Consumer Reports, 2020.
- Policy Incentives for the Adoption of Electric Vehicles across Countries. Zhang, Xingping, et al. Beijing : Sustainability, 2014. [CrossRef]
- Incentives for promoting Battery Electric Vehicle (BEV) adoption in Norway. Bjerkan, Kristin Ystmark, Nørbech, Tom E. and Nordtømme, Marianne Elvsaas. Norway : Transportation Research Part D: Transport and Environment, 2016, Vol. 43. [CrossRef]
- Nudging adoption of electric vehicles: Evidence from an information-based intervention in Nepal. Filippini, Massimo, Kumar, Nilkanth and Srinivasan, Suchita. Switzerland : Transportaion Research Part D: Transport and Environment, 2021, Vol. 97. [CrossRef]
- Determinants of Electric Vehicle Diffusion in China. Kalthaus, Martin and Sun, Jiatang. s.l. : Springer Link, 2021, Vol. 80. [CrossRef]
- No Longer Riding Dirty: The Effect of Electric Vehicle Subsidies on the Diffusion of Emerging Technologies in Automobile Markets. Wu, Xi, et al. s.l. : SSRN, 2019.
- The influence of financial incentives and other socio-economic factors on electric vehicle adoption. Sierzchula, Will, et al. s.l. : Energy Policy, 2014, Vol. 68. [CrossRef]
- The influence of financial incentives and other socio-economic factors on electric vehicle adoption . Sierzchulaa, William, et al. 2014. [CrossRef]
- Additionality Effects of Rebate Programs in the Residential Water Sector: Indoor vs. Outdoor. Pérez-Urdiales, María and Baerenklau, Kenneth A. Riverside : MDPI water, 2019, Vol. 11. [CrossRef]
- Placement of Infrastructure for Urban Electromobility: A Sustainable Approach. Machado, Cláudia A. Soares, et al. s.l. : MDPI sustainability, 2020, Vol. 12. [CrossRef]
- Climate Change. California Air Resource Board. California : s.n., 2020.
- UC DAVIS. Decarbonizing California Transportation by 2045. Report to State Outlines Policy Pathways to Meet the Zero-Carbon Time Crunch. s.l. : UC DAVIS,, 2021.
- Office of Governor Gavin Newsom. California Releases World’s First Plan to Achieve Net Zero Carbon Pollution. s.l. : Office of Governor Gavin Newsom,, 2022.
- Addressing electric vehicle (EV) sales and range anxiety through parking layout, policy and regulation. Henry, A. Bonges III and Anne, C. Lusk. s.l. : Transportation Research Part A: Policy and Practice, 2016, Vol. 83.
- Matkins, Allen. California Laws Related to Permitting Electric Vehicle Charging Stations and Electric Infrastructure Projects. https://www.jdsupra.com/legalnews/california-laws-related-to-permitting-8087713/. [Online] October 11, 2023. [Cited: October 11, 2023.] https://www.jdsupra.com/legalnews/california-laws-related-to-permitting-8087713/.
- Zeldow, Bret and Hatfield, Laura. Difference-in-Difference. Difference-in-Difference. [Online] 2019. https://diff.healthpolicydatascience.org/.
- Loeb, Susanna, et al. Descriptive analysis in education: A guide for researchers . s.l. : Decision Information Resources, Inc. under Contract ED-IES-12-C-0057, Analytic Technical Assistance and Development., 2017.
- Jr., Office of Governor Edmund G. Brown. Governor Brown Takes Action to Increase Zero-Emission Vehicles, Fund New Climate Investments. s.l. : Office of Governor Edmund G. Brown Jr., 2018.
- Governor Edmund G. Brown Jr. California Sustainable Freight Action Plan,. s.l. : Governor Edmund G. Brown Jr,, 2016.
- Nanaki, Evanthia A. Chapter 2 - Electric vehicles. Herning : s.n., 2020.
- Electric vehicle industry sustainable development with a stakeholder engagement system. Cao, Jidi, et al. s.l. : Technology in Society, 2021, Vol. 67.
- U.S. Department of Energy, Energy Efficiency and Renewable Energy. Alternative Fuel Data Center. Alternative Fuel Data Center. [Online] 2023. https://afdc.energy.gov/fuels/electricity_infrastructure_trends.html.
- Developing longitudinal qualitative designs: lessons learned and recommendations for health services research. Calman, Lynn, Brunton, Lisa and Molassiotis, Alex. s.l. : National Library of Medicine: National Center for Biotechnology Information, 2013, Vol. 13.
- Retention strategies in longitudinal cohort studies: a systematic review and meta-analysis. Teague, Samantha, et al. s.l. : BMC Medical Research Methodology, 2018. [CrossRef]
- Implications of automated vehicles for physical road environment: A comprehensive review. Tengilimoglu, Oguz, Carsten, Oliver and Wadud, Zia. s.l. : Transportation Research Part E: Logistics and Transportation Review, 2023, Vol. 169. [CrossRef]
- Modelling electric vehicles use: a survey on the methods. Daina, Nicolò, Sivakumar, Aruna and Polak, John W. s.l. : Renewable and Sustainable Energy Reviews, 2017, Vol. 68. [CrossRef]
- Estimating causal effects: considering three alternatives to difference-in-differences estimation. O’Neill, Stephen, et al. s.l. : National Library of Medicine: National Center for Biotechnology Information, 2016. 10.1007/s10742-016-0146-8. [CrossRef]
- California Air Resources Board. California moves to accelerate to 100% new zero-emission vehicle sales by 2035. s.l. : California Air Resources Board,, 2022.
- How to support EV adoption: Tradeoffs between charging infrastructure investments and vehicle subsidies in California. Ledna, Catherine, et al. s.l. : Energy Policy, 2022, Vol. 165. [CrossRef]
- Understanding and identifying barriers to electric vehicle adoption through thematic analysis. Krishna, G. 2021, Transportation Research Interdisciplinary Perspectives.
- WhiteHouse, The. The WhiteHouse: https://www.whitehouse.gov/briefing-room/statements-releases/2021/04/22/fact-sheet-president-biden-sets-2030-greenhouse-gas-pollution-reduction-target-aimed-at-creating-good-paying-union-jobs-and-securing-u-s-leadership-on-c. The WhiteHouse: https://www.whitehouse.gov/briefing-room/statements-releases/2021/04/22/fact-sheet-president-biden-sets-2030-greenhouse-gas-pollution-reduction-target-aimed-at-creating-good-paying-union-jobs-and-securing-u-s-leadership-on-c. [Online] April 22, 2021.
- Congressional Budget Office. Emissions of Carbon Dioxide in the Transportation Sector. Congressional Budget Office Nonpartian Analysis for the U.S. Congress. 2022.
- Way, Energys Your. Examining the Role of Government Incentives in Increasing Electric Vehicle Demand. 2023.
- Scott, Hardmana, et al. The effectiveness of financial purchase incentives for battery electric vehicles – Are view of the evidence. United Kingdom : Renewable and Sustainable Energy Reviews, 2017. [CrossRef]
- California Clean Cehicle Rebate Project. CVRP Overview 2023.
Disclaimer/Publisher’s Note: The statements, opinions and data contained in all publications are solely those of the individual author(s) and contributor(s) and not of MDPI and/or the editor(s). MDPI and/or the editor(s) disclaim responsibility for any injury to people or property resulting from any ideas, methods, instructions or products referred to in the content. |
© 2023 by the authors. Licensee MDPI, Basel, Switzerland. This article is an open access article distributed under the terms and conditions of the Creative Commons Attribution (CC BY) license (http://creativecommons.org/licenses/by/4.0/).


