3. Discussion
Rapid and accurate identification of pathogens affecting cannabis and hemp crops is essential to implement the most appropriate disease management practices. Conventional diagnostic methods that include symptomology, microscopic observations of pathogen presence/morphology, culturing techniques for pathogen recovery, and pathogen identification and proof of pathogenicity, have all been successfully and reliably used for diagnosis of emerging pathogens of cannabis and hemp [
1,
2]. These methods are now being augmented with molecular advances in nucleic acid-based diagnosis for characterization of specific pathogens based on their DNA or RNA sequences. These methods primarily involve the polymerase chain reaction (PCR), DNA barcoding, and next-generation and high-throughput sequencing. These molecular approaches are particularly useful in instances where multiple pathogens may be involved in a disease complex, as is commonly encountered in cannabis and hemp crops [
1]. They are also useful where disease symptoms may be confused with environmental stresses or damage caused by insect pests. Lastly, molecular diagnostics are important for confirming pathogen presence in instances where plants remain asymptomatic or if the pathogen cannot be recovered on culture media. This study describes a range of recently developed molecular diagnostic approaches that can be used to confirm the presence of fungal and oomycete pathogens affecting cannabis, as well as to identify a diverse group of viruses and a viroid that affect cannabis and hemp crops during commercial production (
Table 5). By sampling and performing the requisite analyses over several years (2020-2023) on samples representing many different genotypes of each crop, the methods described were validated in several laboratories.
The most prevalent fungal and oomycete pathogens detected on roots and stems of cannabis plants were
Fusarium and
Pythium spp., confirming previous reports of the widespread occurrence of these pathogens in different cannabis growing environments [
2,
3,
4,
5,
6]. On leaves and inflorescence tissues, powdery mildew (
Golovinomyces ambrosiae) and
Botrytis cinerea were shown to be prevalent pathogens on cannabis, as previously reported [
7,
8,
9,
10]. The universal eukaryotic primers also confirmed the presence of
Trichoderma asperellum originating from root tissues and
Penicillium olsonii originating from stem tissues. The former is a biological control agent that was applied during greenhouse cannabis production, while the latter is a naturally occurring endophyte found in cannabis stems [
2,
11]. Cannabis DNA was also amplified with this primer set, which was differentiated by its different molecular weight fragment size and unique sequence that differentiated it from the respective pathogens. The advantage of a universal primer set is that prior knowledge of which pathogens may be present is not required, overcoming a limitation to the use of species-specific primers for undetermined pathogens in a diseased sample. The primer set also confirmed that three of the four most prevalent pathogens could also be detected in commercially dried cannabis flower samples following PCR amplification and sequencing. If routine testing of harvested product needs to be implemented, the universal primer set could confirm the presence of these three pathogens, and potentially others that may be present. An important component of cannabis quality assurance is the determination of total yeast and mold (TYM) levels in the final dried cannabis product that reaches the consumer [
12,
13,
14]. While molecular approaches were not investigated or utilized in the present study to determine how TYM could be assessed, previous whole genome sequencing [
15,
16,
17] and the use of PCR approaches that targeted specific fungal species considered to be of importance have been described [
18]. These types of studies should be extended to provide a view of the microbiome within cannabis inflorescences using next generation sequencing to identify the fungal species potentially posing the most concern for human health [
14].
Cannabis leaf samples of many genotypes which occasionally displayed mosaic, line patterns and mottling symptoms, particularly on younger leaves, were tested with primers to broad virus groups and to three specific viruses – Tobacco mosaic virus (TMV), Cucumber mosaic virus (CMV), and Alfalfa mosaic virus (AMV) – as described in Supplementary
Table 1. None of these RT-PCR analyses yielded a PCR product that confirmed the presence of these viruses in over 30 leaf samples displaying these symptoms. Furthermore, a host range study in which leaf extracts from three symptomatic cannabis genotypes were inoculated onto nine plant species did not result in local lesion development or other symptoms that would indicate the transmission and presence of putative viruses. Transmission electron microscopy furthermore showed no virus particles were present in these tissues. Subsequently, whole genome sequencing approaches were conducted on eight cannabis genotypes displaying these symptoms and which were sampled at different times. The results showed that the majority of the samples (95-100%) contained only Hop latent viroid (HLVd) and a previously reported cannabis mitovirus (CasaMV1) [
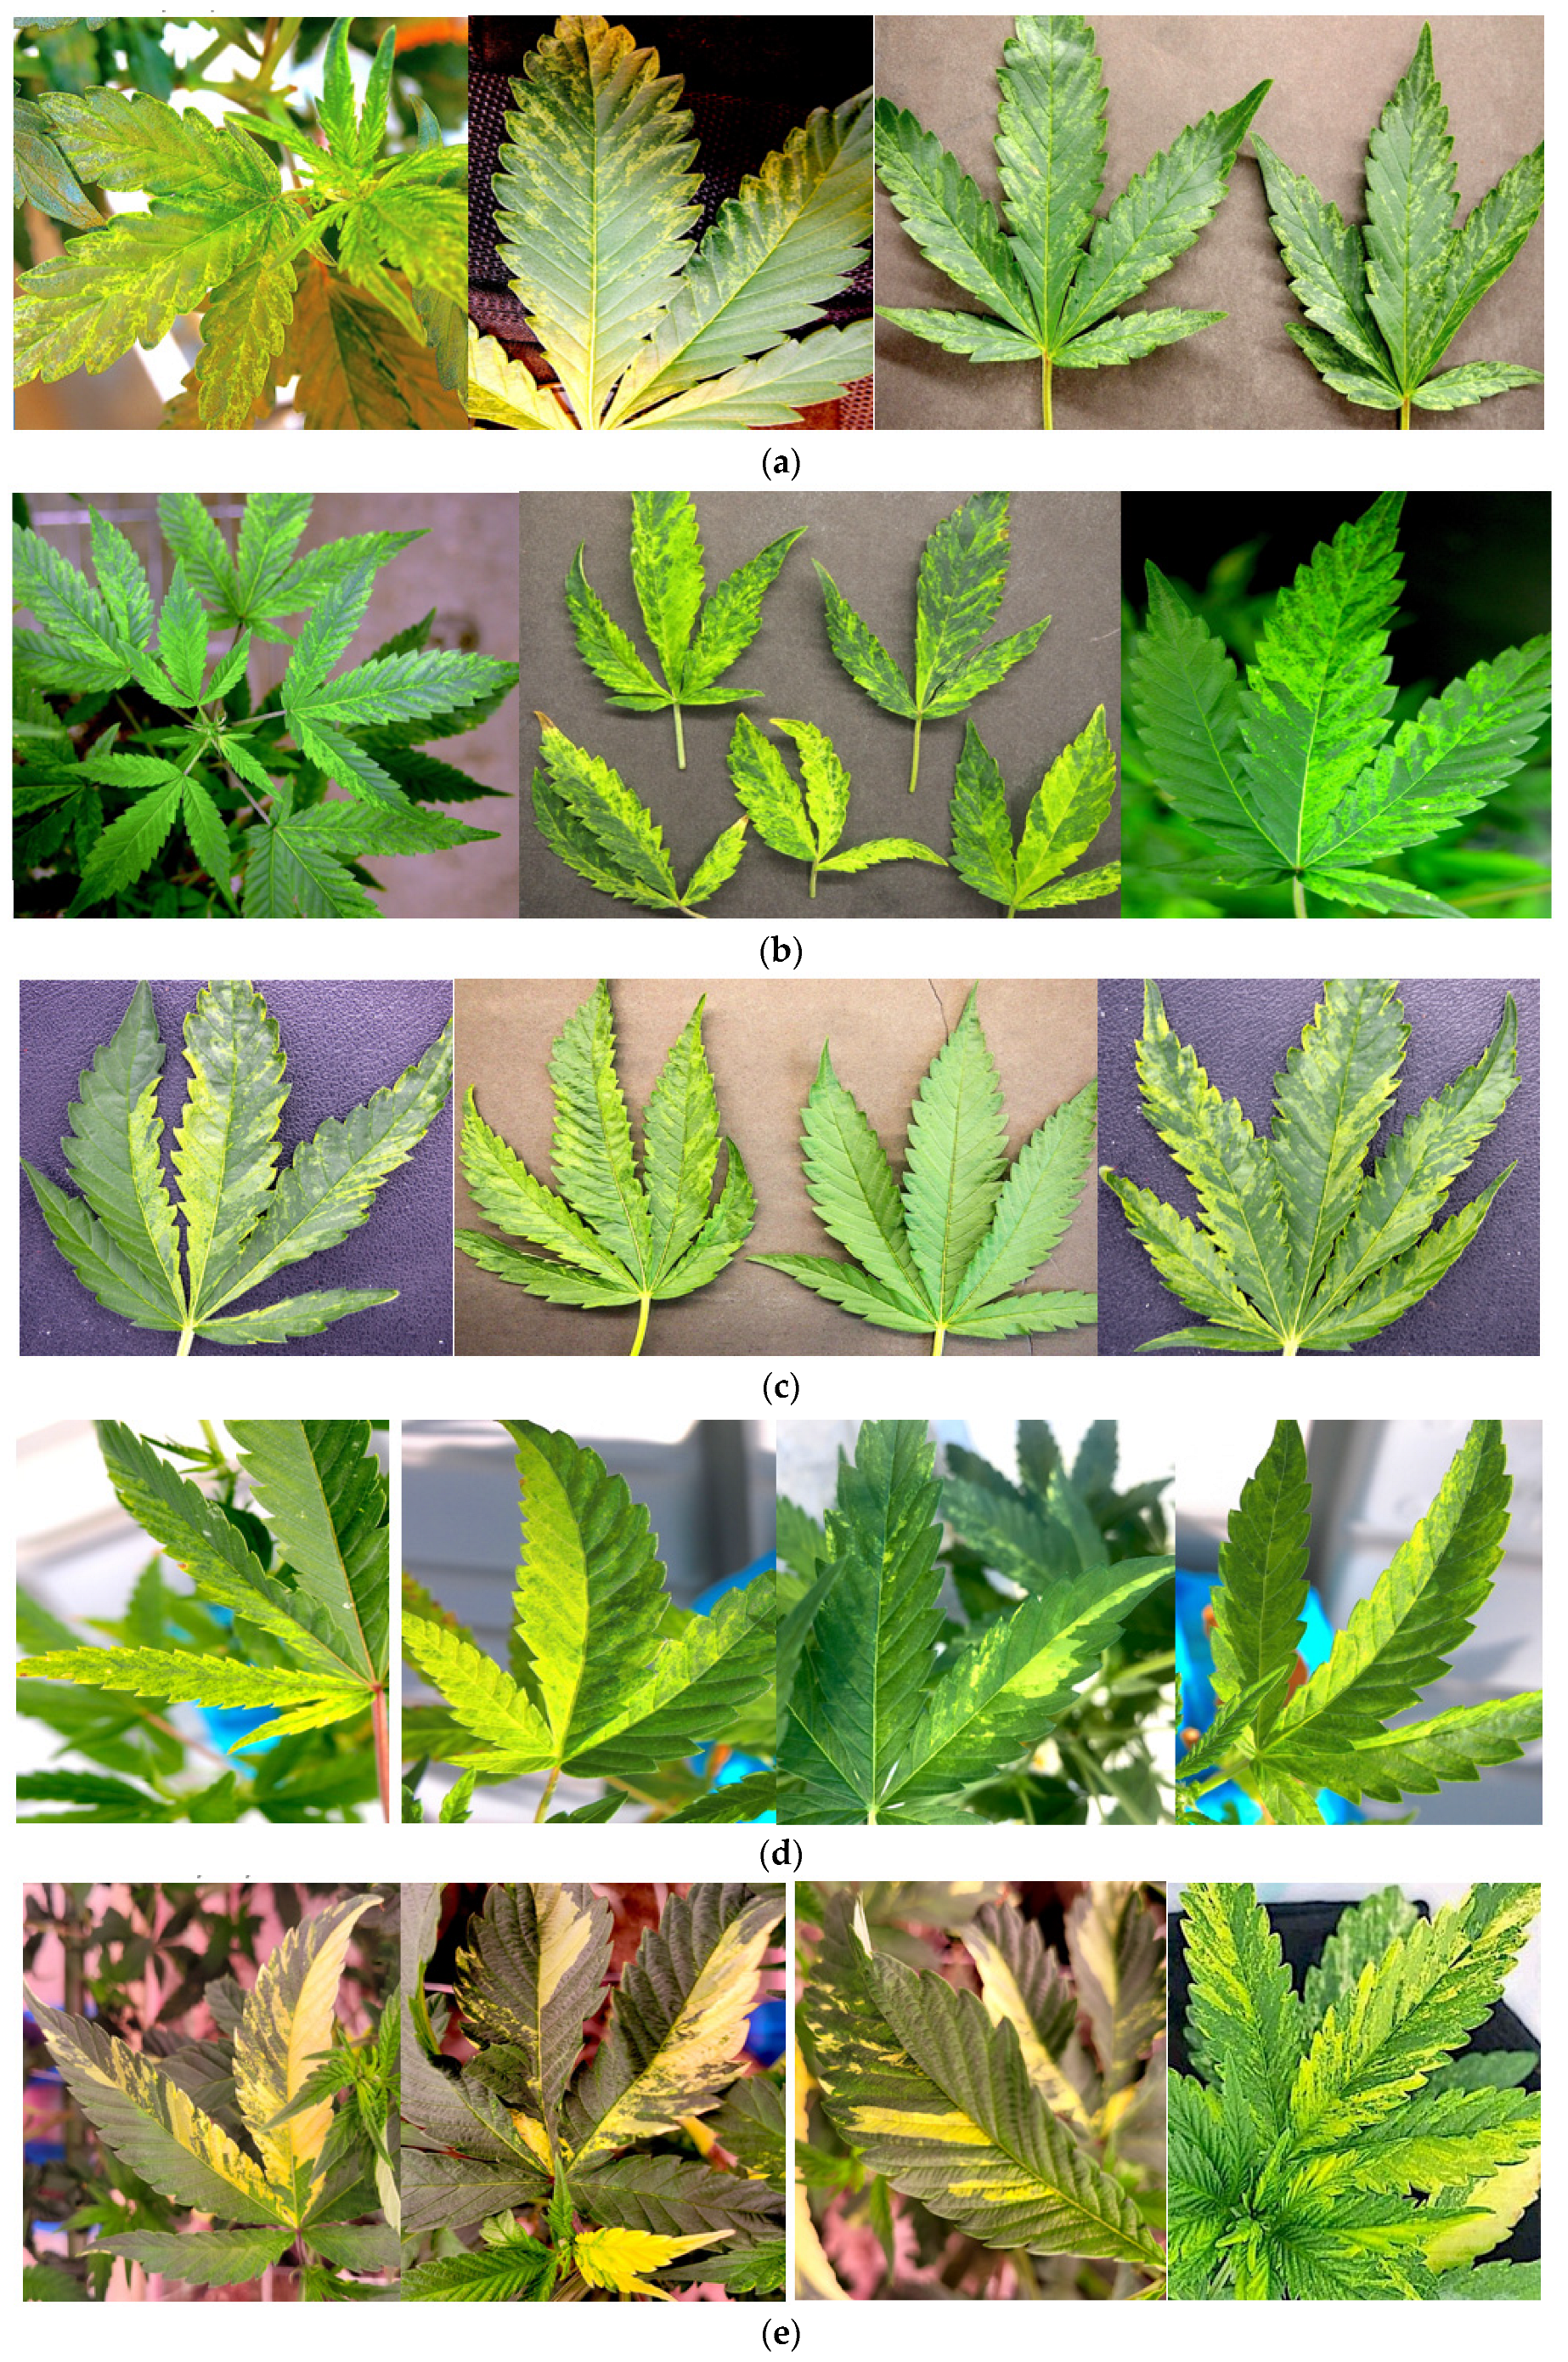
19]. Neither of these pathogens has been demonstrated to cause foliar symptoms resembling those shown in
Figure 4. The characteristic symptoms of HLVd infection are stunting and reduced inflorescence growth [
20]. Righetti et al. [
21] tested leaf samples from hemp plants displaying mosaic and streak patterns using PCR with specific primers to a large group of viruses, and also performed next generation sequencing, host range transmission studies and electron microscopy of symptomatic tissues, similar to what was conducted in the present study. They only reported the presence of Cannabis cryptic virus (CanCV) [
21,
22], which was present in symptomatic and asymptomatic tissues at varying levels. Their results and ours indicate that these symptoms were not caused by any previously described virus group.
In the present study, CasaMV1 was shown to be present in leaf, petiole and root tissues of a majority of cannabis plants (>90%) grown indoors, as well as in most cannabis plants grown outdoors. These samples represented a broad range of genotypes. It was also detected in inflorescence and seed samples derived from an infected mother plant. This confirms the previous finding of CasaMV1 reported to be present in tissues derived from leaves, inflorescences, seeds, seedlings and roots of
C. sativa [
19]. There has been no prior research to evaluate the impact of CasaMV1 on cannabis plants, which was also detected in hemp plants in commercial fields [
23] and in the present study on hemp samples. Mitoviruses are commonly reported to occur in fungi and may cause changes in host physiology, in many cases by altering mitochondrial structure and function [
24]. They have also been shown to be present in a number of plant species, including hemp and hops, without causing any apparent symptoms and are presumed to be cryptic [
19]. In fungi, disruptions in mitochondrial function due to mitoviruses can impact growth and pathogenicity [
24]. Alterations in levels of protein expression have been found in some plants infected by a mitovirus [
25]. Further research is needed to determine the significance of the widespread occurrence of CasaMV1 in various tissues of cannabis plants and whether it is indeed cryptic [
26] or could causes mild symptoms.
In cannabis plants grown indoors which are propagated vegetatively for successive generations, the occurrence of co-infections with viruses/viroid presents a challenge in experimentally demonstrating their individual effects. For example, both HLVd and CasaMV1 were found simultaneously in a large number of cannabis genotypes in this study, and were present in both symptomatic as well as in asymptomatic plants. Establishing the roles that each may play in symptom development requires elimination of one/both of these entities, followed by re-inoculation with individual and combined virus/viroid or infectious cDNA clones to observe symptoms and discern if there are any potential interactions between these two co-infecting agents. To date, these types of inoculation experiments have not been performed. Therefore, while the diagnostic assays described in this study provide confirmation of pathogen presence, the causation or involvement in symptom expression remains to be confirmed. In previous experimental inoculations conducted on hemp plants by Keglar and Sparr [
27] (summarized by Miotti et al. [
28]), it was reported that a number of mechanically-transmitted viruses could cause mosaic and mottling symptoms on leaves, including AMV, CMV, potato viruses X and Y, and Arabis mosaic virus. None of these viruses were identified in this study on cannabis, while AMV was detected in hemp plants in 2020. In addition, despite widespread statements in many non-verifiable sources, such as Internet sites, stating that TMV is an important pathogen causing mosaic symptoms, it has not been demonstrated to infect cannabis or hemp plants to date and there are no previous reports of its natural occurrence on these hosts.
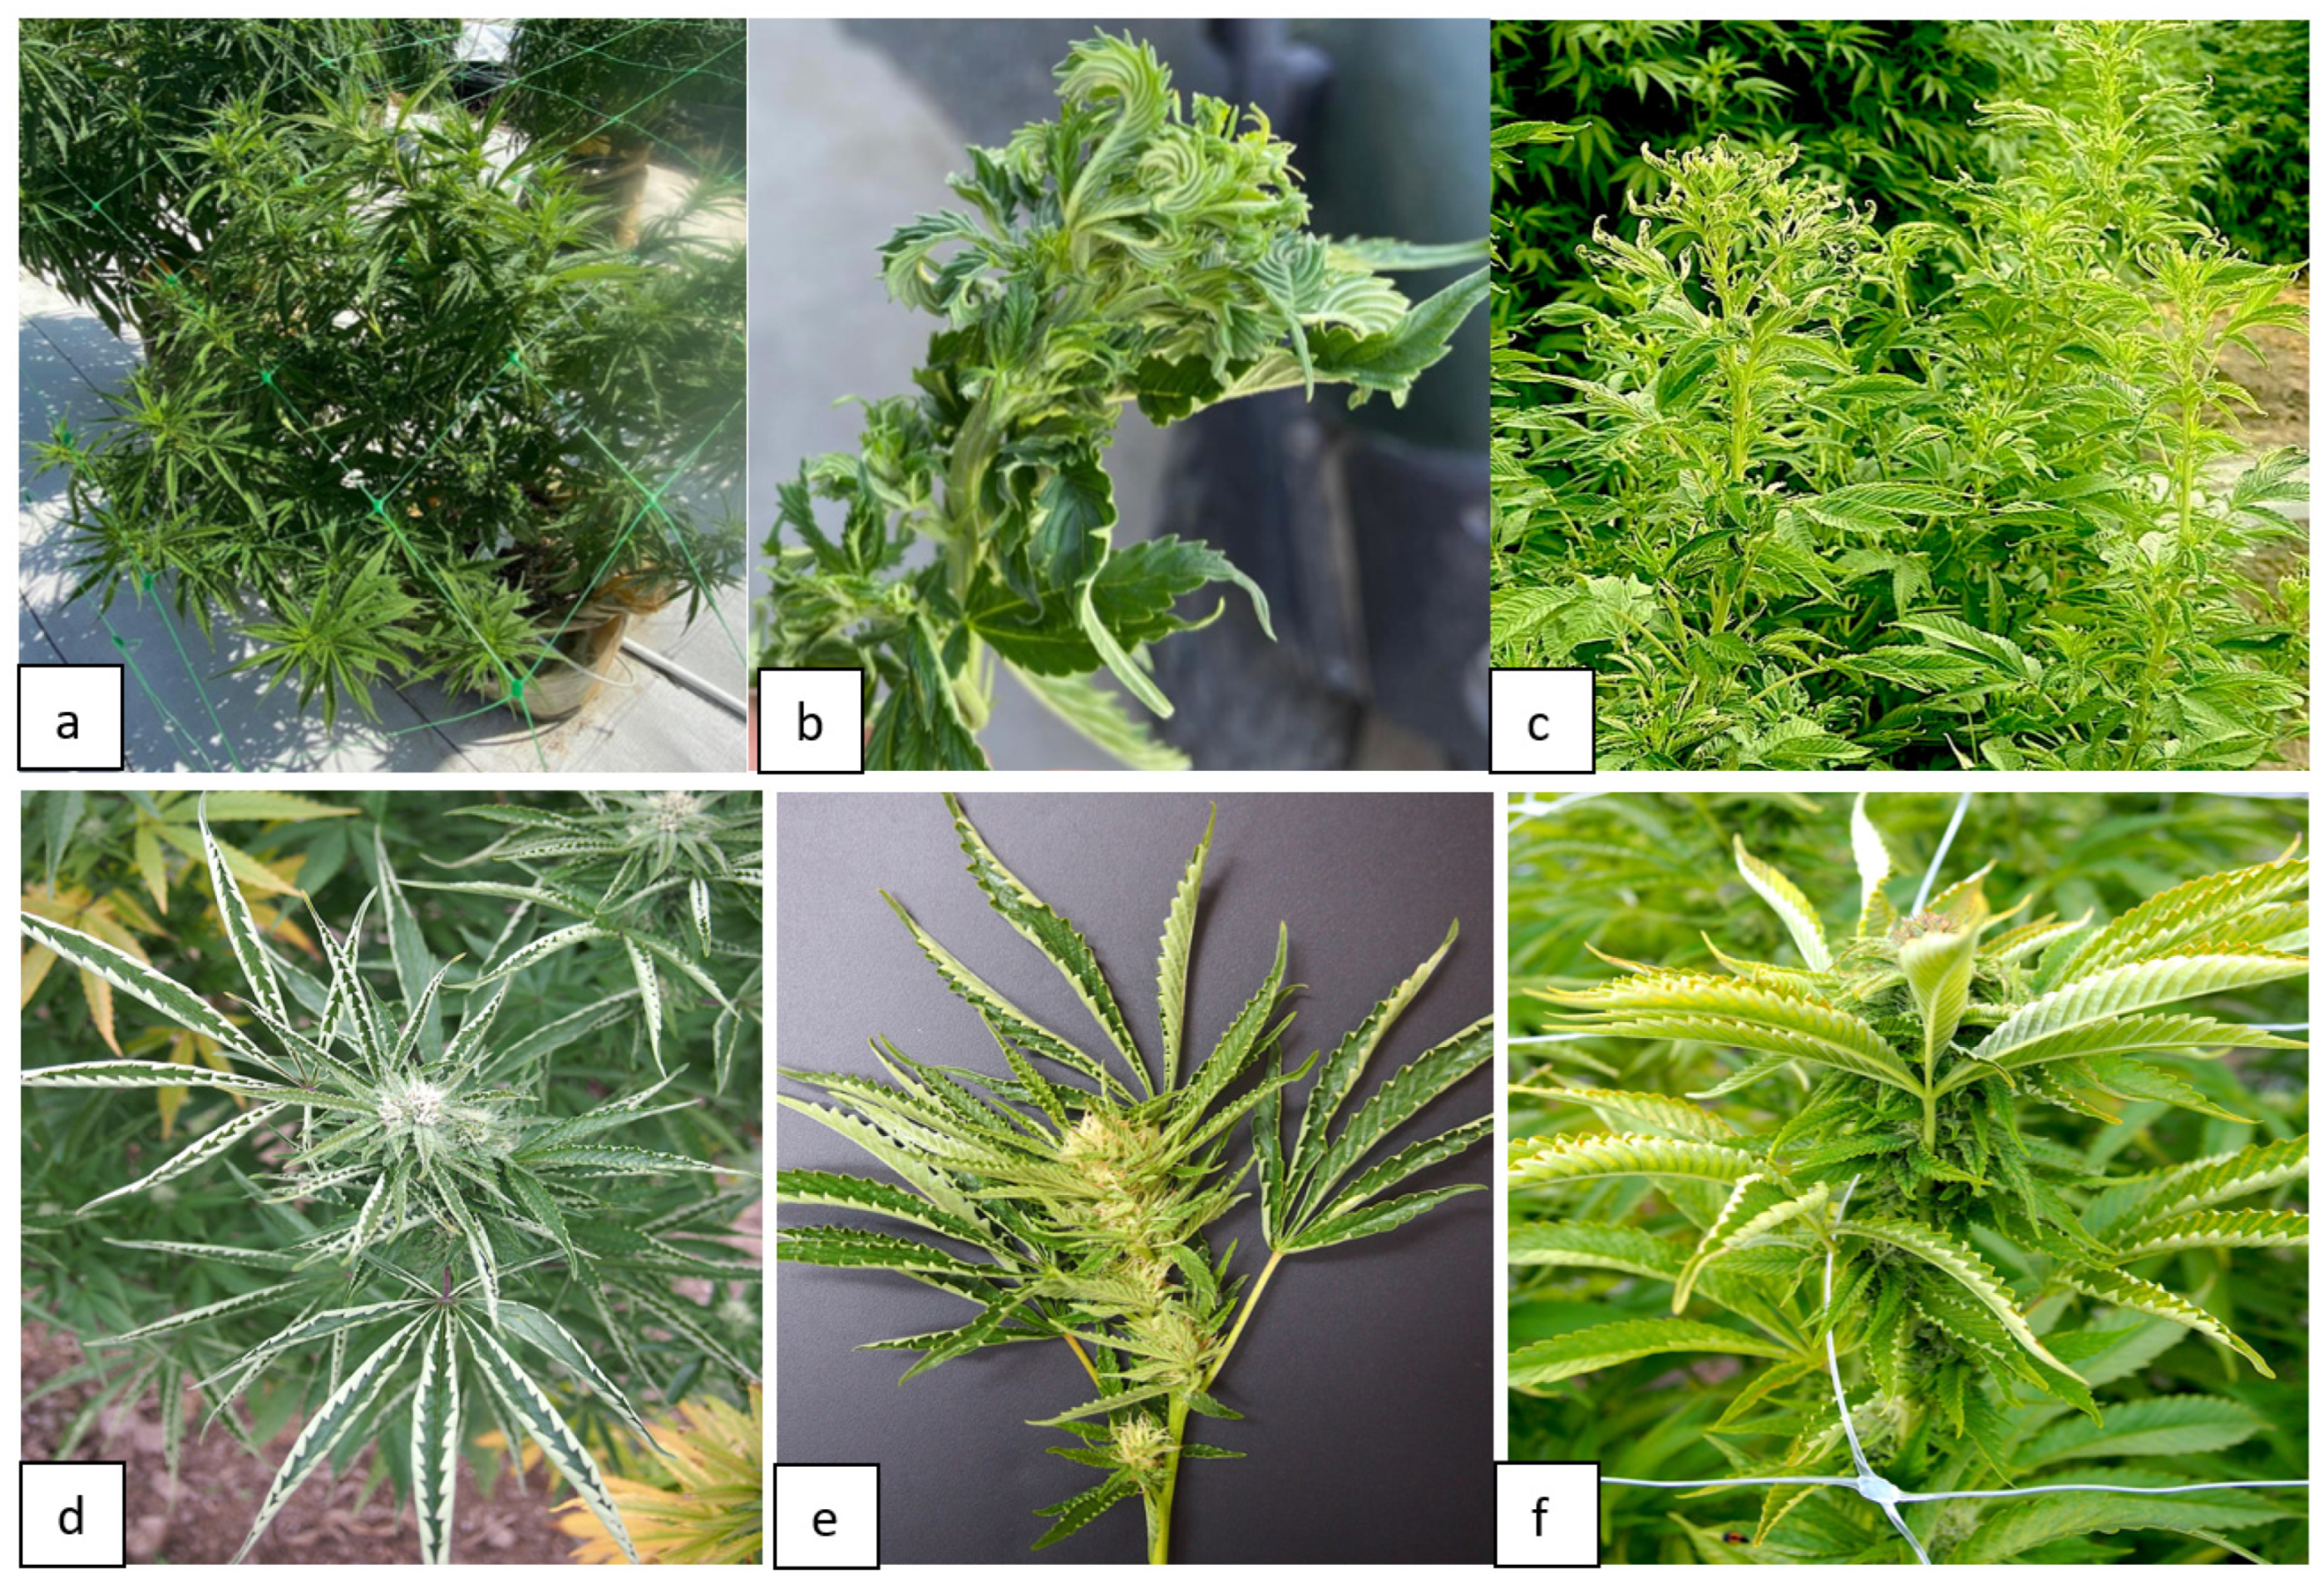
A possible explanation for the mosaic and mottling symptoms seen on cannabis plants is that they are the result of somatic mutations, which are commonly seen on vegetatively propagated plants [
29,
30]. A few obvious chimeras were observed on leaves of cannabis plants during this study (
Figure 4), some of which bore a striking resemblance to the foliar symptoms putatively attributed to virus infection. Further research is needed to establish whether these symptoms are the result of somatic mutations, which are known to occur in cannabis. Adamek et al. [
31] demonstrated the extent of intra-plant variation that arises from vegetative propagation from a cannabis stock plant to give rise to genetic mosaicism. Using deep sequencing of whole genomes, they reported a higher occurrence of variants among shoots obtained from actively growing regions of the plant compared to older shoots at the bottom of the plant. Their results showed that a large number of mutations arise as the cannabis plant grows and is maintained for a long period of time, and as a consequence, can potentially impact the functions of important genes [
31]. Epigenetic changes in plants and other organisms, caused by DNA methylation and histone modifications, among other mechanisms, have been proposed to be heritable, resulting in these epimutations potentially contributing to phenotypic variation in subsequent generations [
32]. In cannabis plants that are extensively propagated through vegetative means, the appearance of these variant phenotypes may be frequent and transgenerational and not the result of putative infection by viruses such as TMV or CMV.
Distinct symptoms of stunted plant growth, leaf distortion, chlorosis of leaves, and leaf curl have been recently associated with the presence of several confirmed viruses in cannabis and hemp plants. These include Lettuce chlorosis virus (LCV) [
33], Beet curly top virus (BCTV) [
23,
34,
35,
36,
37] and Citrus yellow vein-associated virus [
23,
37,
38]. Subsequently, diagnostic methods using RT-PCR with specific primers have been developed to detect these viruses [
23,
33,
34,
35,
36,
37,
38]. Recent studies have also reported spiroplasma/phytoplasma pathogens affecting hemp, including
Spiroplasma citri and
Candidatus Phytoplasma trifolii, which were detected using specific PCR primers [
39,
40]. Cannabis cryptic virus (CCV) has also been reported in cannabis plants, without causing any apparent symptoms [
21,
22]. This latter virus was not identified in cannabis samples in this study but was detected in hemp plants sampled during 2020 and 2021. Potential origins of some of these pathogen can be attributed to infected seed/planting material and/or to influxes of insect vectors. The occurrence of BCTV, HLVd, CasaMV1, Tobacco streak virus (TSV), AMV, Citrus yellow vein-associated virus (CYVaV), and cannabis cryptic virus (CCV) was confirmed on hemp plants through next generation sequencing. In addition, Tomato bushy stunt virus was detected for the first time in 2023 and has not been reported previously to infect cannabis or hemp. The diversity of viruses present in commercial hemp crops was much greater compared to indoor-grown cannabis, possibly due to the activity of insect vectors, especially leafhoppers, that are prevalent in outdoor production sites and are known to be vectors of some viruses [
23]. BCTV exists as phylogenetically different strains and affects hemp grown in Colorado, Arizona, Nevada, Oregon, Washington, and California [
23,
34,
35,
36,
37,
39,
41,
62]. The virus has an extremely wide host range and is considered to be a pathogen that poses a significant threat to this crop [
28]. Additional research will likely identify more viruses and phytoplasmas occurring on both cannabis and hemp, particularly where these crops are grown in close proximity to non-hemp crops that can provide a source of inoculum for spread to cannabis and hemp plants, in addition to the presence of insect vectors that can transmit these pathogens. A multiplex RT-PCR method that is capable of detecting multiple pathogens simultaneously, including BCTV, HLVd, CYVaV and CasaMV1, would be useful for rapid diagnostic confirmation and is currently being developed in several laboratories. The various PCR-based diagnostic assays described for these pathogens, augmented by whole genome and high throughput sequencing approaches, have been instrumental in confirming the presence and distribution of these pathogens.
Within indoor growing environments used for the majority of commercial production of cannabis, fewer viral pathogens have been reported to date. Mechanical transmission and vegetative propagation are likely to be the key means through which viral/viroid pathogens would spread if present. However, there is the potential for insect pests reported on indoor-grown cannabis plants, such as rice root aphids (
Rhopalosiphum rufiabdominalis) and onion thrips (
Thrips tabaci), to acquire HLVd during feeding. Diagnostic assays utilizing RT-qPCR and RT-PCR have demonstrated that HLVd can be acquired by root aphids
https://www.einnews.com/pr_news/581016978/3-rivers-biotech-identifies-root-aphids-as-potential-vector-for-hop-latent-viroid-hlvd) and by onion thrips, as demonstrated in this study. A recent study also demonstrated acquisition of the viroid by leafhoppers feeding on HLVd-infected plants [
42], suggesting potential pathogen transmission by these insect species could occur, although the importance of this mode for pathogen transmission remains unknown. In addition, whether HLVd-infected plants serve as better hosts for colonization and development of thrips, as has been demonstrated for Tomato spotted wilt virus-infected tomato plants and western flower thrips [
43], remains to be seen.
Many mechanically transmitted viruses can be transmitted by insect vectors in a non-persistent manner [
44]. The presence of whiteflies (
Bemesia tabaci) in indoor cannabis growing environments was reported to result in transmission of crinviruses, such as Lettuce chlorosis virus (LCV) [
33] and Cucurbit chlorotic yellows virus (CCYV) [
44], both first detected from cannabis farms in Israel. Transmission of viruses by insect pests affecting hemp crops under field conditions has resulted in multiple occurrences of viral pathogens in one field [
37], and sometimes co-infections of up to three different pathogens can occur on a single plant [
39]. In Nevada, BCTV was found in association with
Spiroplasma citri and
Candidatus Phytoplasma trifolii on the same and on different plants [
39]. In Washington, BCTV, HLVd and CYVaV were reported to occur in the same field and on the same plant [
37]. In Colorado and California, multiple viruses and strains have been shown to be present in hemp fields [
23,
36]. It remains to be seen if multiple viral complexes are detected on indoor-grown cannabis plants. On outdoor-grown cannabis plants, the potential for multiple virus complex development, similar to what has been observed in hemp fields, should be monitored. The development of PCR-based molecular diagnostic assays has aided in the characterization of these pathogen complexes, since symptomology alone is inadequate to distinguish which viruses may be occurring simultaneously.
A large part of this study was focused on developing molecular methods to detect and quantify HLVd in cannabis plants, due to its potential to cause significant damage and for which little is presently understood abouts its epidemiology and spread [
20,
46]. Initially, primers used in RT-PCR assays demonstrated the presence of the viroid in stock plants, in rooted cuttings derived from these stock plants, and in various types of plant tissues. The distribution of the viroid was not always uniform in 3-4 month old infected stock plants, but root tissues and youngest leaves generally tested positive for the viroid. In addition, the pathogen was detected in the inflorescence tissues of symptomatic flowering plants of several cannabis genotypes by RT-PCR. A comparison of 11 cannabis genotypes, utilizing plants ranging in age from 6 weeks to 10 weeks following the initiation of rooting from cuttings, and assessing presence/absence of HLVd using a LAMP assay, demonstrated that root tissues consistently showed the highest frequency of detection in these plants compared to leaves and petioles. These results were confirmed by RT-PCR, and also by RT-qPCR and ddPCR, all of which confirmed the presence of HLVd in different tissues of infected cannabis plants, including inflorescences, and demonstrated consistent viroid presence in root tissues. The LAMP (loop-mediated isothermal amplification) technique was developed for the detection of plant pathogens due to its speed, high specificity, sensitivity, efficiency, and isothermal conditions suitable for field conditions [
47,
48]. LAMP is a one-step amplification assay that amplifies the target DNA or RNA sequence and requires two or three pairs of primers to detect six distinct regions in the target sequence [
48]. Additionally, the target gene fragment is usually short, producing a series of DNA fragments that are of different sizes [
48,
49]. In this study, LAMP was used to demonstrate the presence of HLVd in various tissues of cannabis plants (leaves, petioles and roots). Some limitations of the LAMP technique include the high risk of cross-contamination, as well as carry-over contamination and off-target amplification, which subsequently can result in false-positives due to the high efficiency of DNA amplification in this method [
50,
51,
52,
53].
In a recent study, a combined method utilizing RT-LAMP with RT-qPCR was described for HLVd detection in cannabis plants (LAMP/-qPCR) [
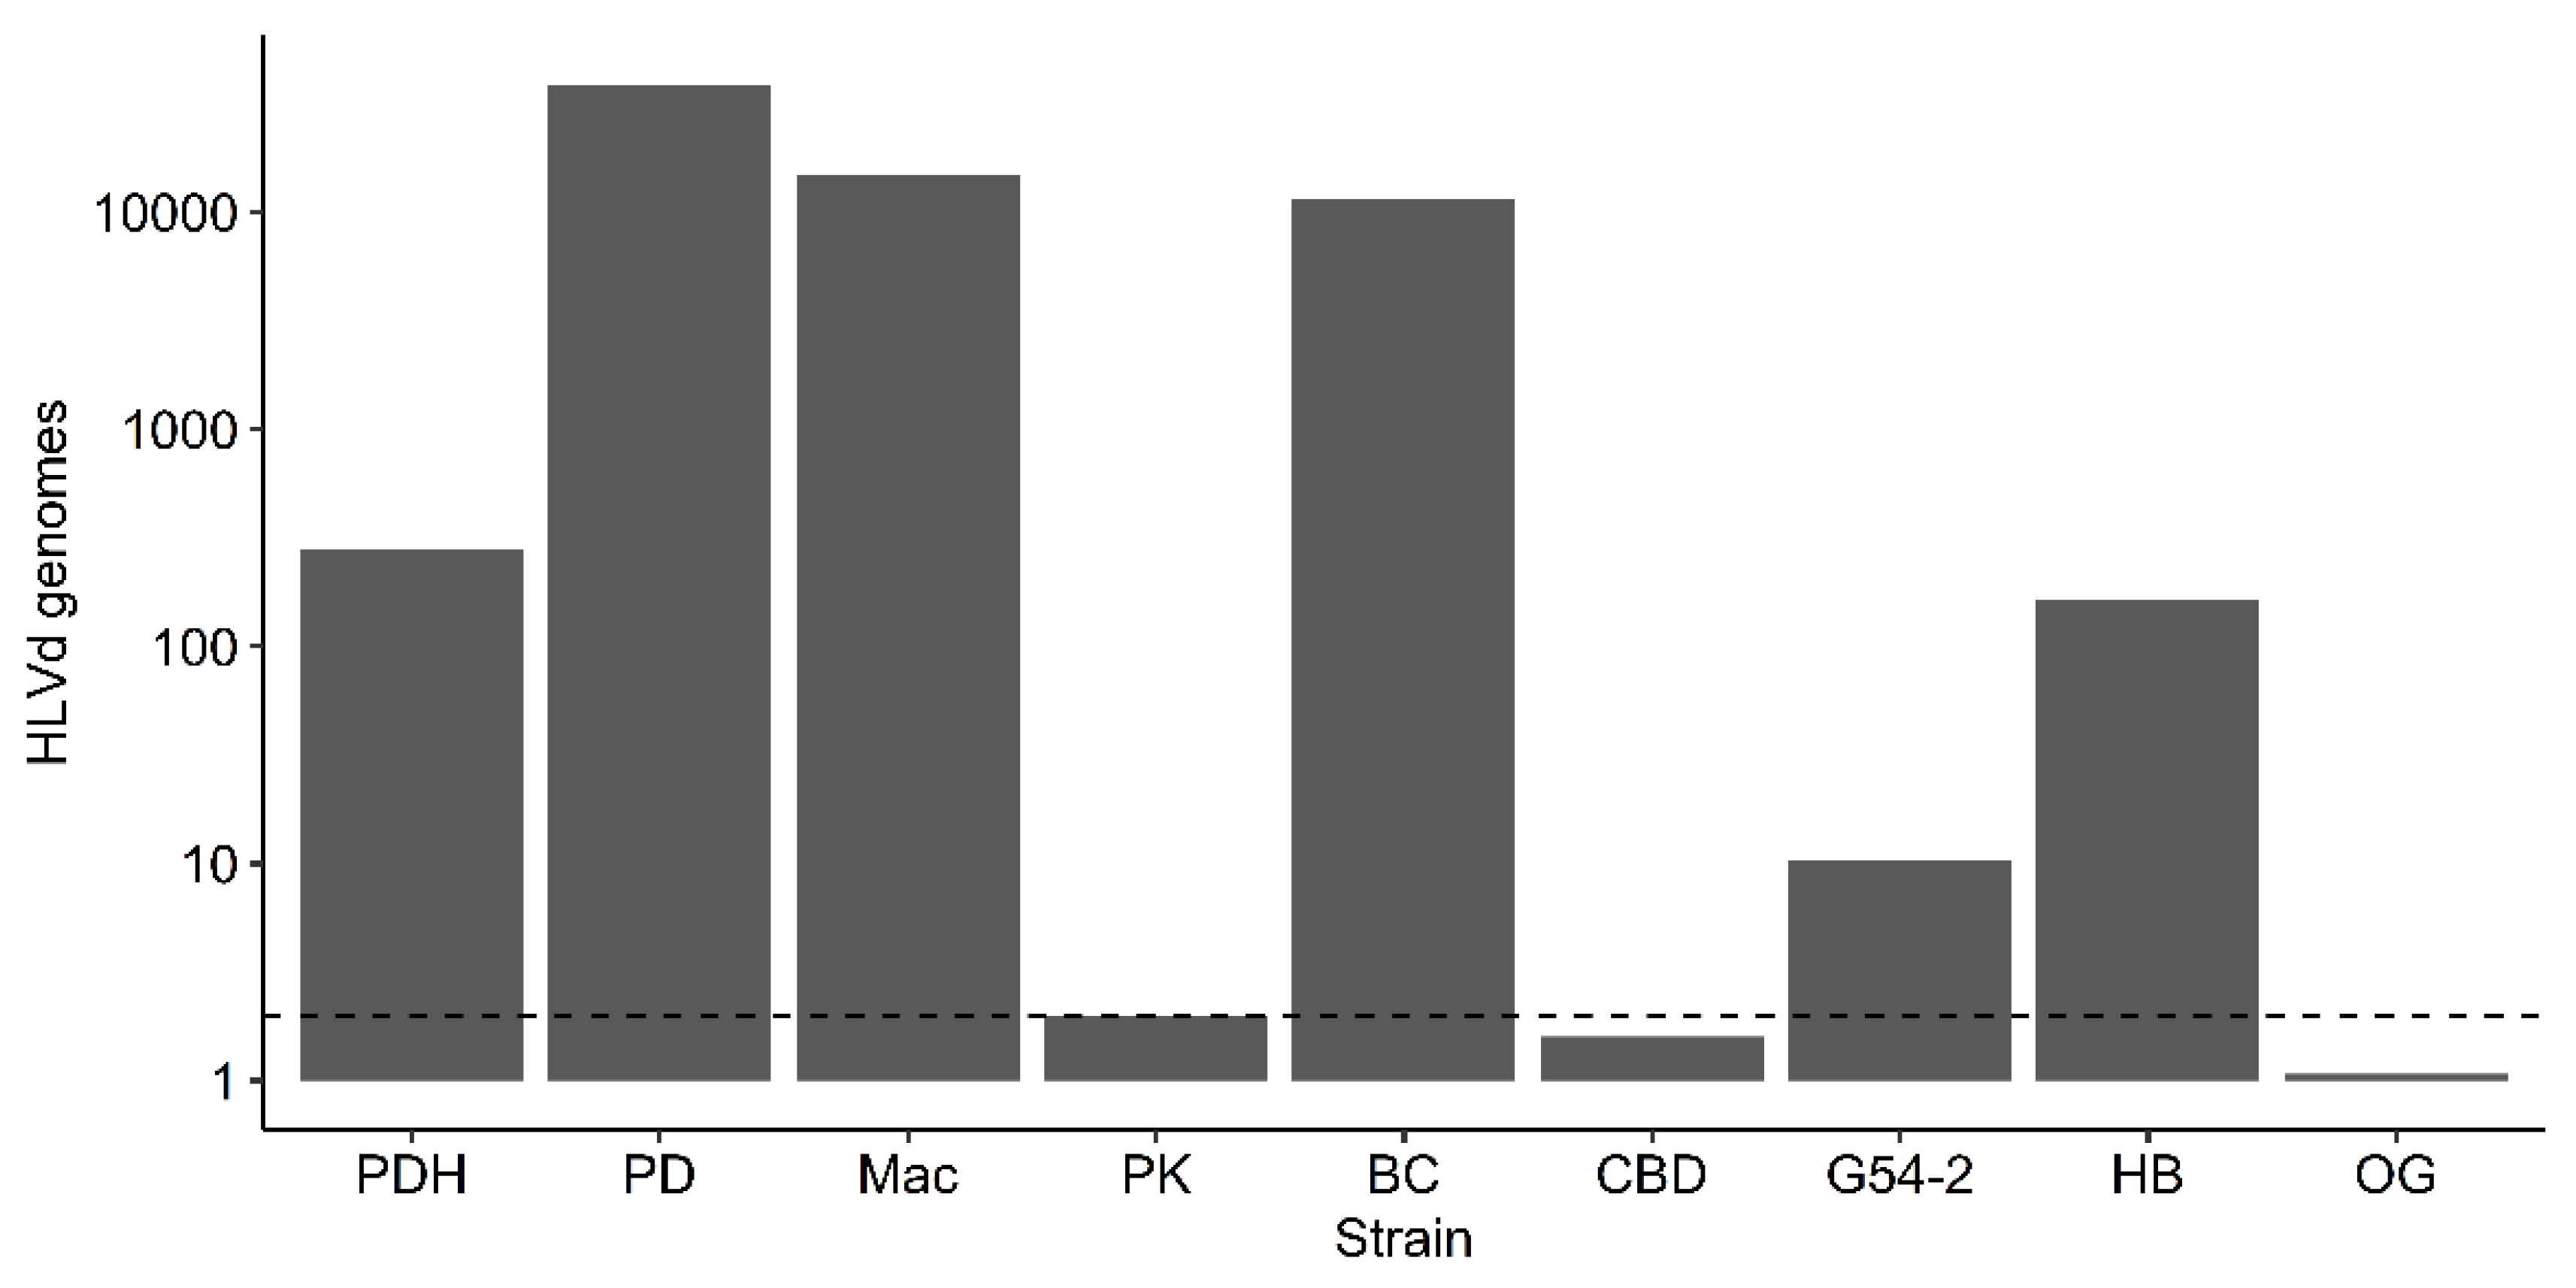
54]. The results provided comparable results to standard RT-qPCR methods and confirmed HLVd was present in various tissues (roots, petioles, leaves) of plants varying in age from 5 weeks to 10 weeks at high levels. A sampling strategy based on leaf tissues taken from 5-10 week old plants was recommended to be the most suitable approach for early detection of HLVd. Our findings using RT-PCR, RT-qPCR and ddPCR demonstrated that consistent and high levels of HLVd were present in root tissues of 6-10 week old plants, as well as in 3-4 month old stock plants. Leaf tissues sampled from these plants sometimes resulted in negative or low titers of HLVd, depending on the location of the samples. The results obtained from leaf samples also varied according to the genotype of the stock plant tested. The results from ddPCR showed that high levels of viroid genomes (>10,000 copies per reaction) were present in the roots of one genotype; in a second genotype, there were 10,000-100,000 copies in the roots and youngest leaves, indicating it was highly susceptible to infection. There were also significant differences in the levels to which the viroid accumulated in leaves of flowering plants among 8 cannabis genotypes grown adjacent to one another in the same environment, ranging from undetectable to >10,000 genomes, reflecting differences in susceptibility to infection or spread. The earliest detection of HLVd by RT-qPCR was observed in samples of root tissues from 2 week-old rooted cuttings in this study. Selection of the appropriate tissues, time of sampling, and cannabis genotype can impact the detection of HLVd. Currently, commercial laboratories offering diagnostic services for HLVd testing have identified root tissues as the preferred sampling material based on the earlier, higher and more consistent accumulation of viroid levels in plants ranging from 2 weeks to 3 months of age (
https://tumigenomics.com/hop-latent-viroid-information, https://medicinalgenomics.com/hop-latent-viroid-in-cannabis/,
https://3riversbiotech.com/3-rivers-biotech-identifies-root-tissue-from-mature-plants-as-the-most-reliable-to-detect-hop-latent-viroid-hlvd/).
In inflorescence tissues of cannabis genotype ‘Mac-1’, a highly susceptible genotype, HLVd was detected at the highest titer (>150,000 copies) within the central inflorescence tissues that had been stripped of the surrounding inflorescence leaves and the fan leaves. The viroid was also present at high levels (10,000 copies) in the inflorescence leaves but not in the fan leaves. In adjacent asymptomatic plants, the viroid was absent in inflorescence tissues but was present at low levels (5 copies) in vegetative leaf tissue. When HLVd-infected ‘Mac1’ was used as a female parent and fertilized with pollen from another cannabis genotype, the resulting seeds had a high incidence of HLVd infection (90%) as determined by RT-PCR. The ddPCR method has been previously used for the quantitative assessment of a range of different plant pathogens [
55,
56,
57,
58,
59,
60]. The main principle of ddPCR, as in other PCR-based methods including quantitative PCR (qPCR), is the specific amplification of a nucleic acid target. The distinctive feature of dPCR is the separation of the reaction mixture into thousands to millions of partitions, which is followed by a real-time or end-point detection in each partitioned reaction. The distribution of target sequences into partitions (droplets) is described by the Poisson distribution, thus allowing accurate and absolute quantification of the target from the ratio of positive against all partitions at the end of the reaction. This omits the need to use reference materials with known target concentrations and increases the accuracy of quantification at low target concentrations compared to qPCR. ddPCR has also shown higher resilience to inhibitors in a number of different types of samples. This is the first application of ddPCR to detect a pathogen in cannabis plants and the first for quantification of HLVd.
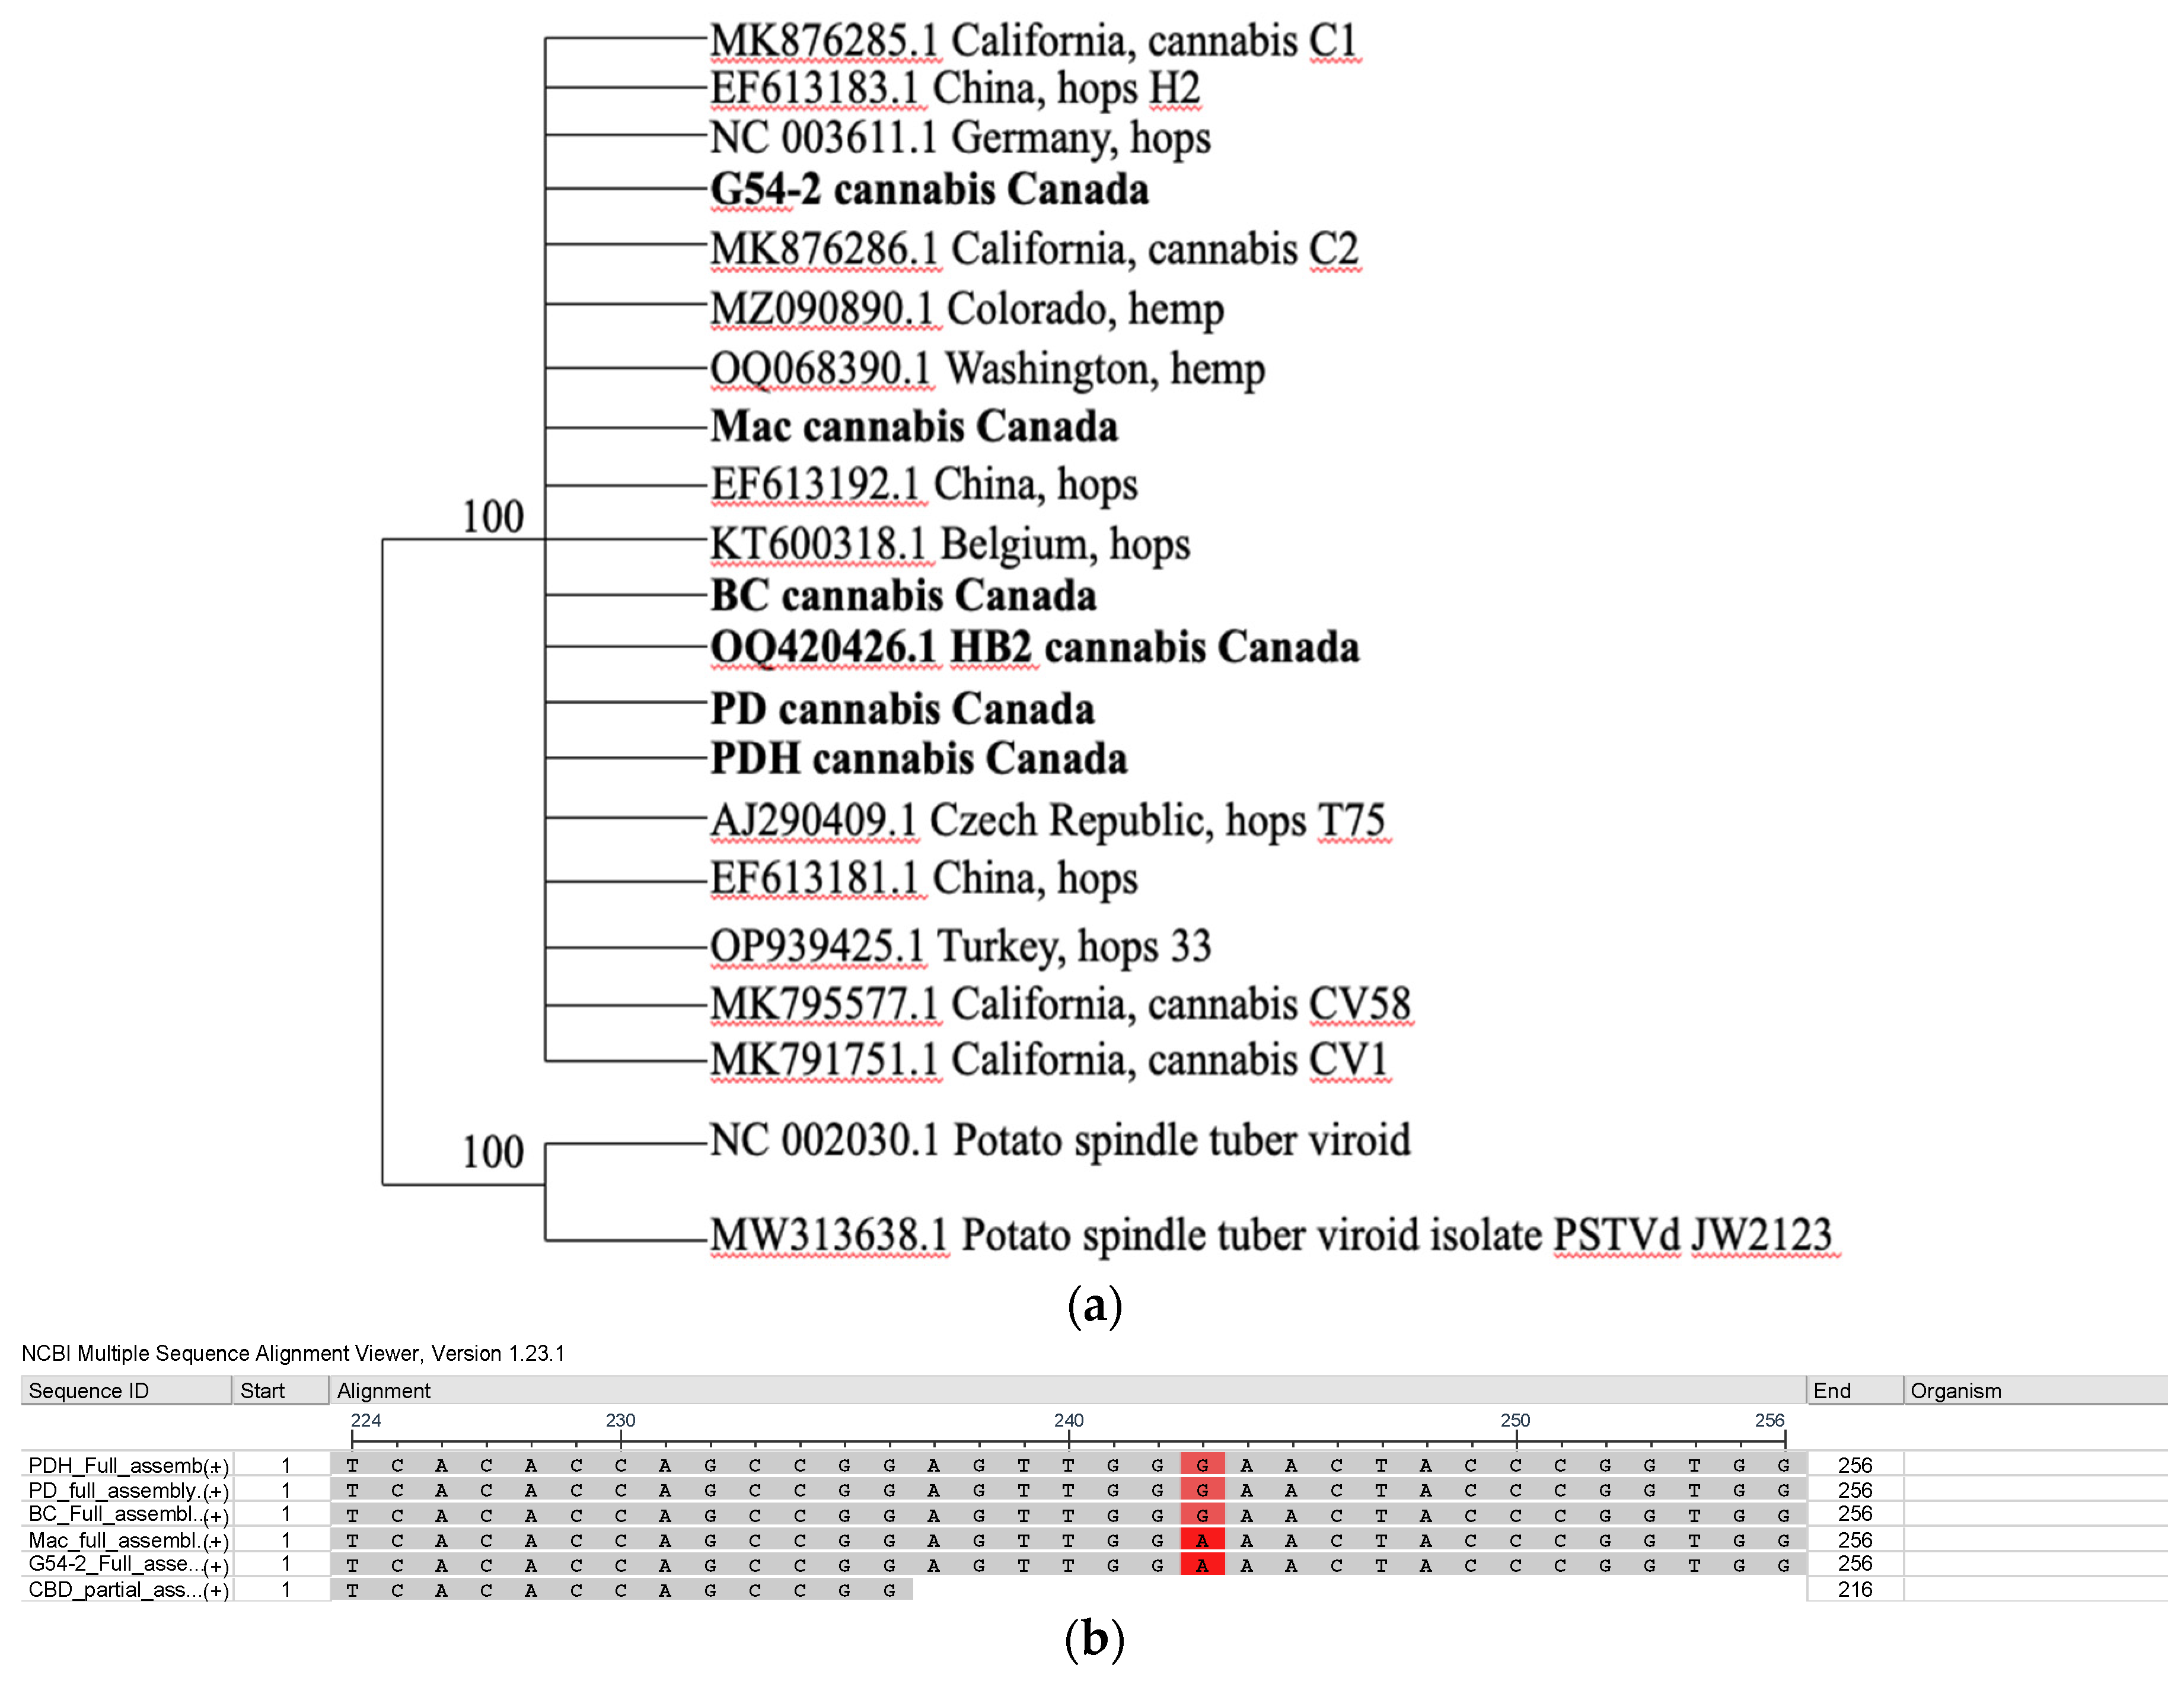
A comparison of the whole genome sequences of HLVd from hop, hemp and cannabis plants worldwide using phylogenetic analysis revealed a lack of diversity among the sequences included. Two single-nucleotide polymorphisms (SNPs) detected did not influence the overall alignment of the sequences and all isolates were placed into one large group. In contrast to HLVd, a related viroid – Potato spindle tuber viroid – shows considerably more sequence heterogeneity among isolates from different hosts and regions [
62,
63]. Continuous monitoring for any potential changes in the genome of HLVd is needed to detect possible variants that may arise in the near future as the pathogen continues to spread and evolve. In BCTV, the evolution of new strains (biotypes) has been shown to occur in different regions where hemp and other crops are cultivated, and currently up to 11 strains have been identified [
41]. In TSV, a variant found to be present in hemp plants had only 80-83% sequence similarity to previous strains infecting other crops [
23]. Variation in the CasaMV1 sequences from hemp plants was also observed, with 88-99% nt identity to sequences from C. sativa [
23]. The CYVaV sequences had 90% nt identity with CYVaV identified from citrus [
23]. Therefore, there is some evidence for the potential evolution of new and genetically diverse virus/viroid strains that can infect and become established in hemp and cannabis crops. Whether the virulence patterns have been altered in these strains has not been established. Similarly, whether commonly encountered and widespread viruses on other crops, such as AMV, CMV, and TMV, will become problematic on cannabis and hemp crops remains to be seen. Ongoing bioinformatics studies on populations of viruses and viroids that may be present in cannabis and hemp plants are needed. As well, the impact on host growth and development following pathogen infection and reproduction need to be established, preferably in studies involving artificial inoculations. Current reports of virus/viroid presence need to include further investigations into their potential role in causing symptoms.
An extensive review of the potential impact of viruses/viroid on cannabis and hemp (historical and current) has been recently published by Miotti et al. [
28]. Some potential aphid-transmissible viruses that can infect cannabis and hemp plants under artificial inoculation conditions, but have not yet become widespread under commercial conditions, include AMV, CMV and PVY [
28,
61]. Viruses vectored by thrips which can also pose a threat include Tobacco streak virus and Tomato spotted wilt virus [
28]. Many of these emerging viruses are potentially also seed-borne [
28]. These observations suggest that cannabis and hemp crops are susceptible to a range of viruses, and that the insect-vectored pathogens appear to have the greatest potential to cause damage under widespread cultivation conditions, with mechanically transmitted pathogens less so. The exception to this is HLVd, which is mechanically transmitted and is presently widespread on cannabis [
20]. Therefore, the development of diagnostic assays that can be applied in seed testing programs will be important for the cannabis and hemp industries moving forward. Such testing programs are currently unavailable in many production areas. In the present study, HLVd presence on cannabis and hemp seeds was confirmed by RT-PCR. Given the high titer of viroid present in cannabis inflorescence tissues (which consist of clusters of pistils) of a susceptible genotype, fertilization of the ovules contained in these infected tissues by pollen originating from a male plant would likely yield a high frequency of seed-borne transmission, which was demonstrated in this study for HLVd. Infection during seed development is likely to cause seed abortion and a reduction in seed weight of surviving seeds. While it was not determined whether HLVd was present on the seed coat or internally within the seed, it is likely to be both. The viroid was also detected on cannabis seeds that had been stored for more than 2 years (dating back to 2021), suggesting that seed stocks of cannabis should be tested before widespread distribution. Seedlings of hemp infected with HLVd gave rise to infected seedlings but the symptomology on these plants has not been established. The diagnostic approaches described in this study should aid in the routine screening of plants and seeds for the range of pathogens currently reported to affect cannabis and hemp crops.
A comparison of the prevalence of fungal and oomycete pathogens affecting cannabis and hemp crops to the viruses/viroid disease complex indicates that while there are new reports of the occurrence of the former group of pathogens on these hosts in different geographic regions, there is no evidence for selection of new pathogen strains that are adapted to cannabis and hemp i.e. the pathogens are shown to have originated and spread from previous crops or adjacent crops [
1]. A similar situation may be taking place with the virus/viroid pathogens but preliminary evidence may suggest an evolving suite of these pathogens may be found infecting these crops in the future. The applications of the molecular diagnostic and bioinformatics methods described in this study should provide useful information to address the evolving challenges facing cannabis and hemp crops resulting from these evolving multiple and assorted pathogens.
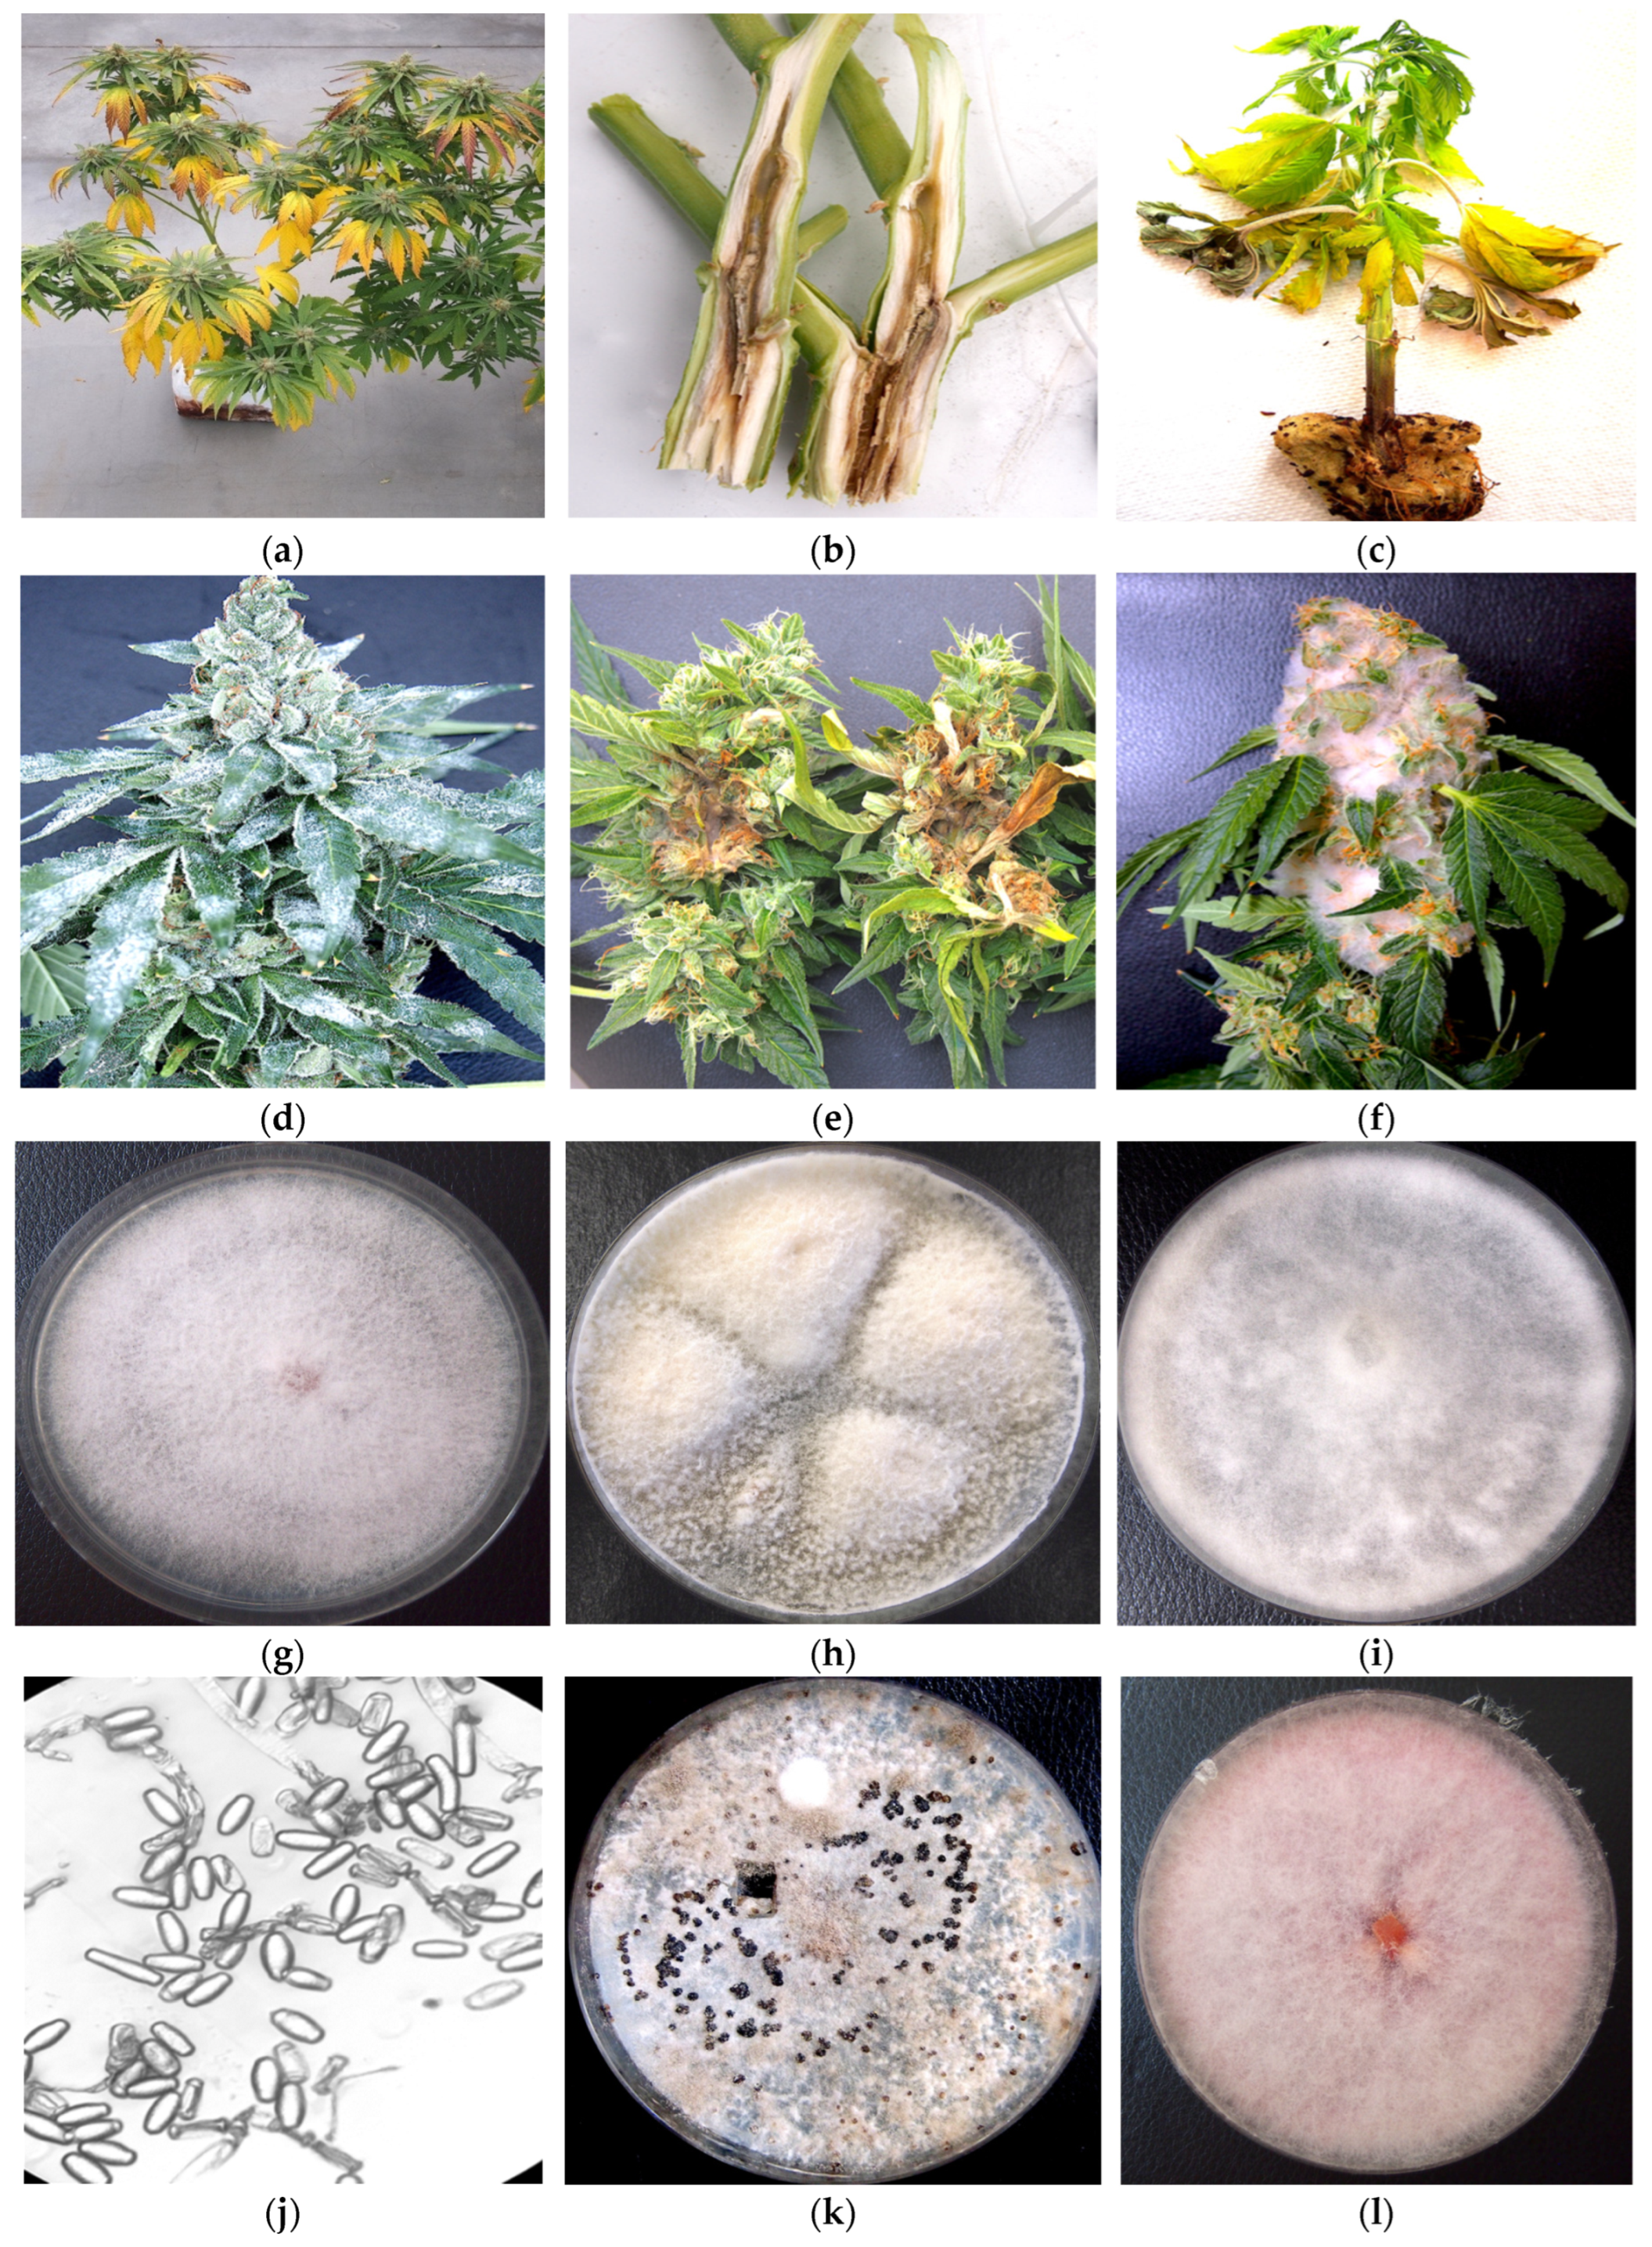
Figure 1.
Symptomatic cannabis plants that were included in this study for molecular diagnostics. The plant tissues were used in PCR analysis and isolations of potential pathogens were susequntly made on agar medium and then idenfified by PCR. The results indicated the presence of the following pathogens causing symptoms. a) Yelowing of plants caused by Fusarium oxysporum. b) Stems with internal discoloration caused by F. proliferatum. c) Plants with rotted roots and stem cankers due to Pythium myriotylum. d) Plants with visible powdery mildew infections (Golovinomyces ambrosiae) on leaves and inflorescences. e) Bud rot symptoms on inflorescences caused by Botrytis cinerea. f) Pinkish-white mycelium growing over the inflorescence tissues caused by Fusarium sporotrichiodes. The corresponding pathogens that were isolated in culture and identified were : g) F. oxysporum; h) F. proliferatum; i) P. myriotylum; j) G. ambrosiae; k) B. cinerea; l) F. sporotrichiodes. .
Figure 2.
a, b). PCR with universal eukaryotic primers for the ITS1-5.8S-ITS2 region of ribosomal DNA from diseased and healthy cannabis tissues. a) Tissues infected with powdery mildew (
G. ambrosiae) as shown in
Figure 1d. Lane 1 = noninfected tissues, lanes 2-4 = tissues with powdery mildew. A doublet banding pattern reflects pathogen-infected tissues. b) Tissues infected with
Botrytis cinerea as shown in
Figure 1e. Lanes 1, 2 = infected inflorescence leaves; lanes 3, 4, 6 = healthy leaves; 5 = infected ovary tissue; lanes 7-9 = infected pistils. Tissues infected with
B. cinerea consistently showed the double banding pattern.
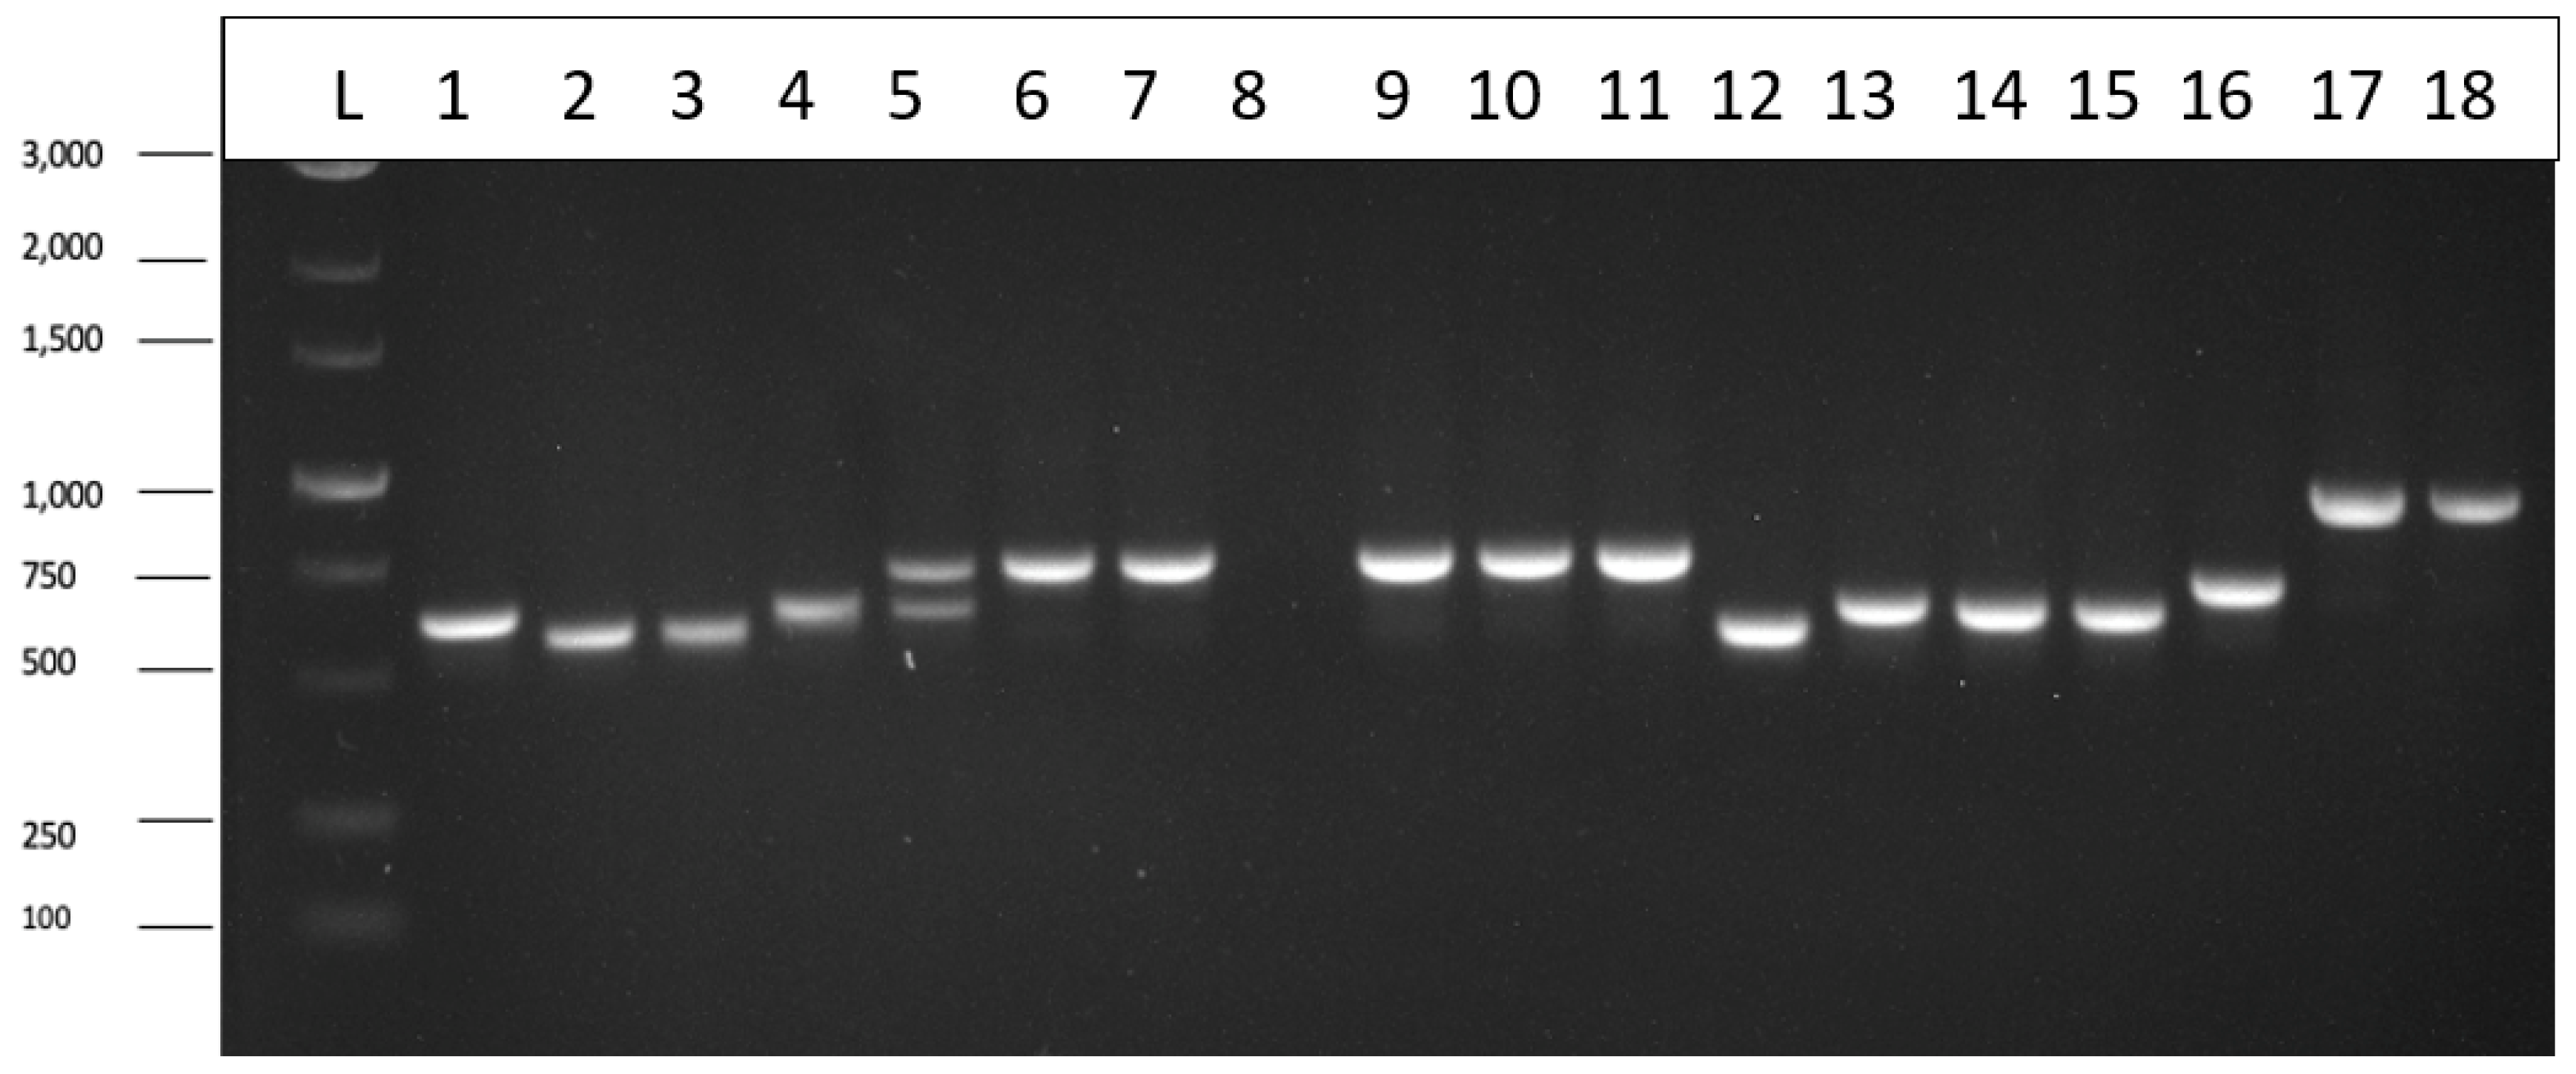
Figure 3.
PCR with universal eukaryotic primers for the ITS1-5.8S-ITS2 region of ribosomal DNA shows the amplification of DNA from a range of fungal/oomycete cultures isolated from cannabis plants to produce PCR products of different molecular weight sizes. In addition, cannabis leaf tissues were included for analysis. Lanes 1,4 = Trichoderma asperellum; 2,3 = Fusarium oxysporum; 5 = Golovinomyces infected leaf sample; 6,7,9-11= asymptomatic leaf tissues; 8 = blank; 12= Botrytis cinerea; 13-14= Fusarium oxysporum, 15 = F. proliferatum, 16 = Penicillium olsonii, 17-18 Pythium myriotylum, 19 = control.
Figure 4.
Cannabis leaves displaying symptoms of mosaic and chlorosis putatively attributed to viral/viroid pathogens were subjected to molecular diagnostic methods described in this study. Four genotypes are shown, namely ‘OG Kush’ (a), ‘Headband’ (b), ‘Golden Papaya’ (c) and ‘Motor Breath’ (d). By comparison, leaves with chlorotic sectors and loss of chlorophyll characteristic of somatic mutations are shown in (e).
Figure 5.
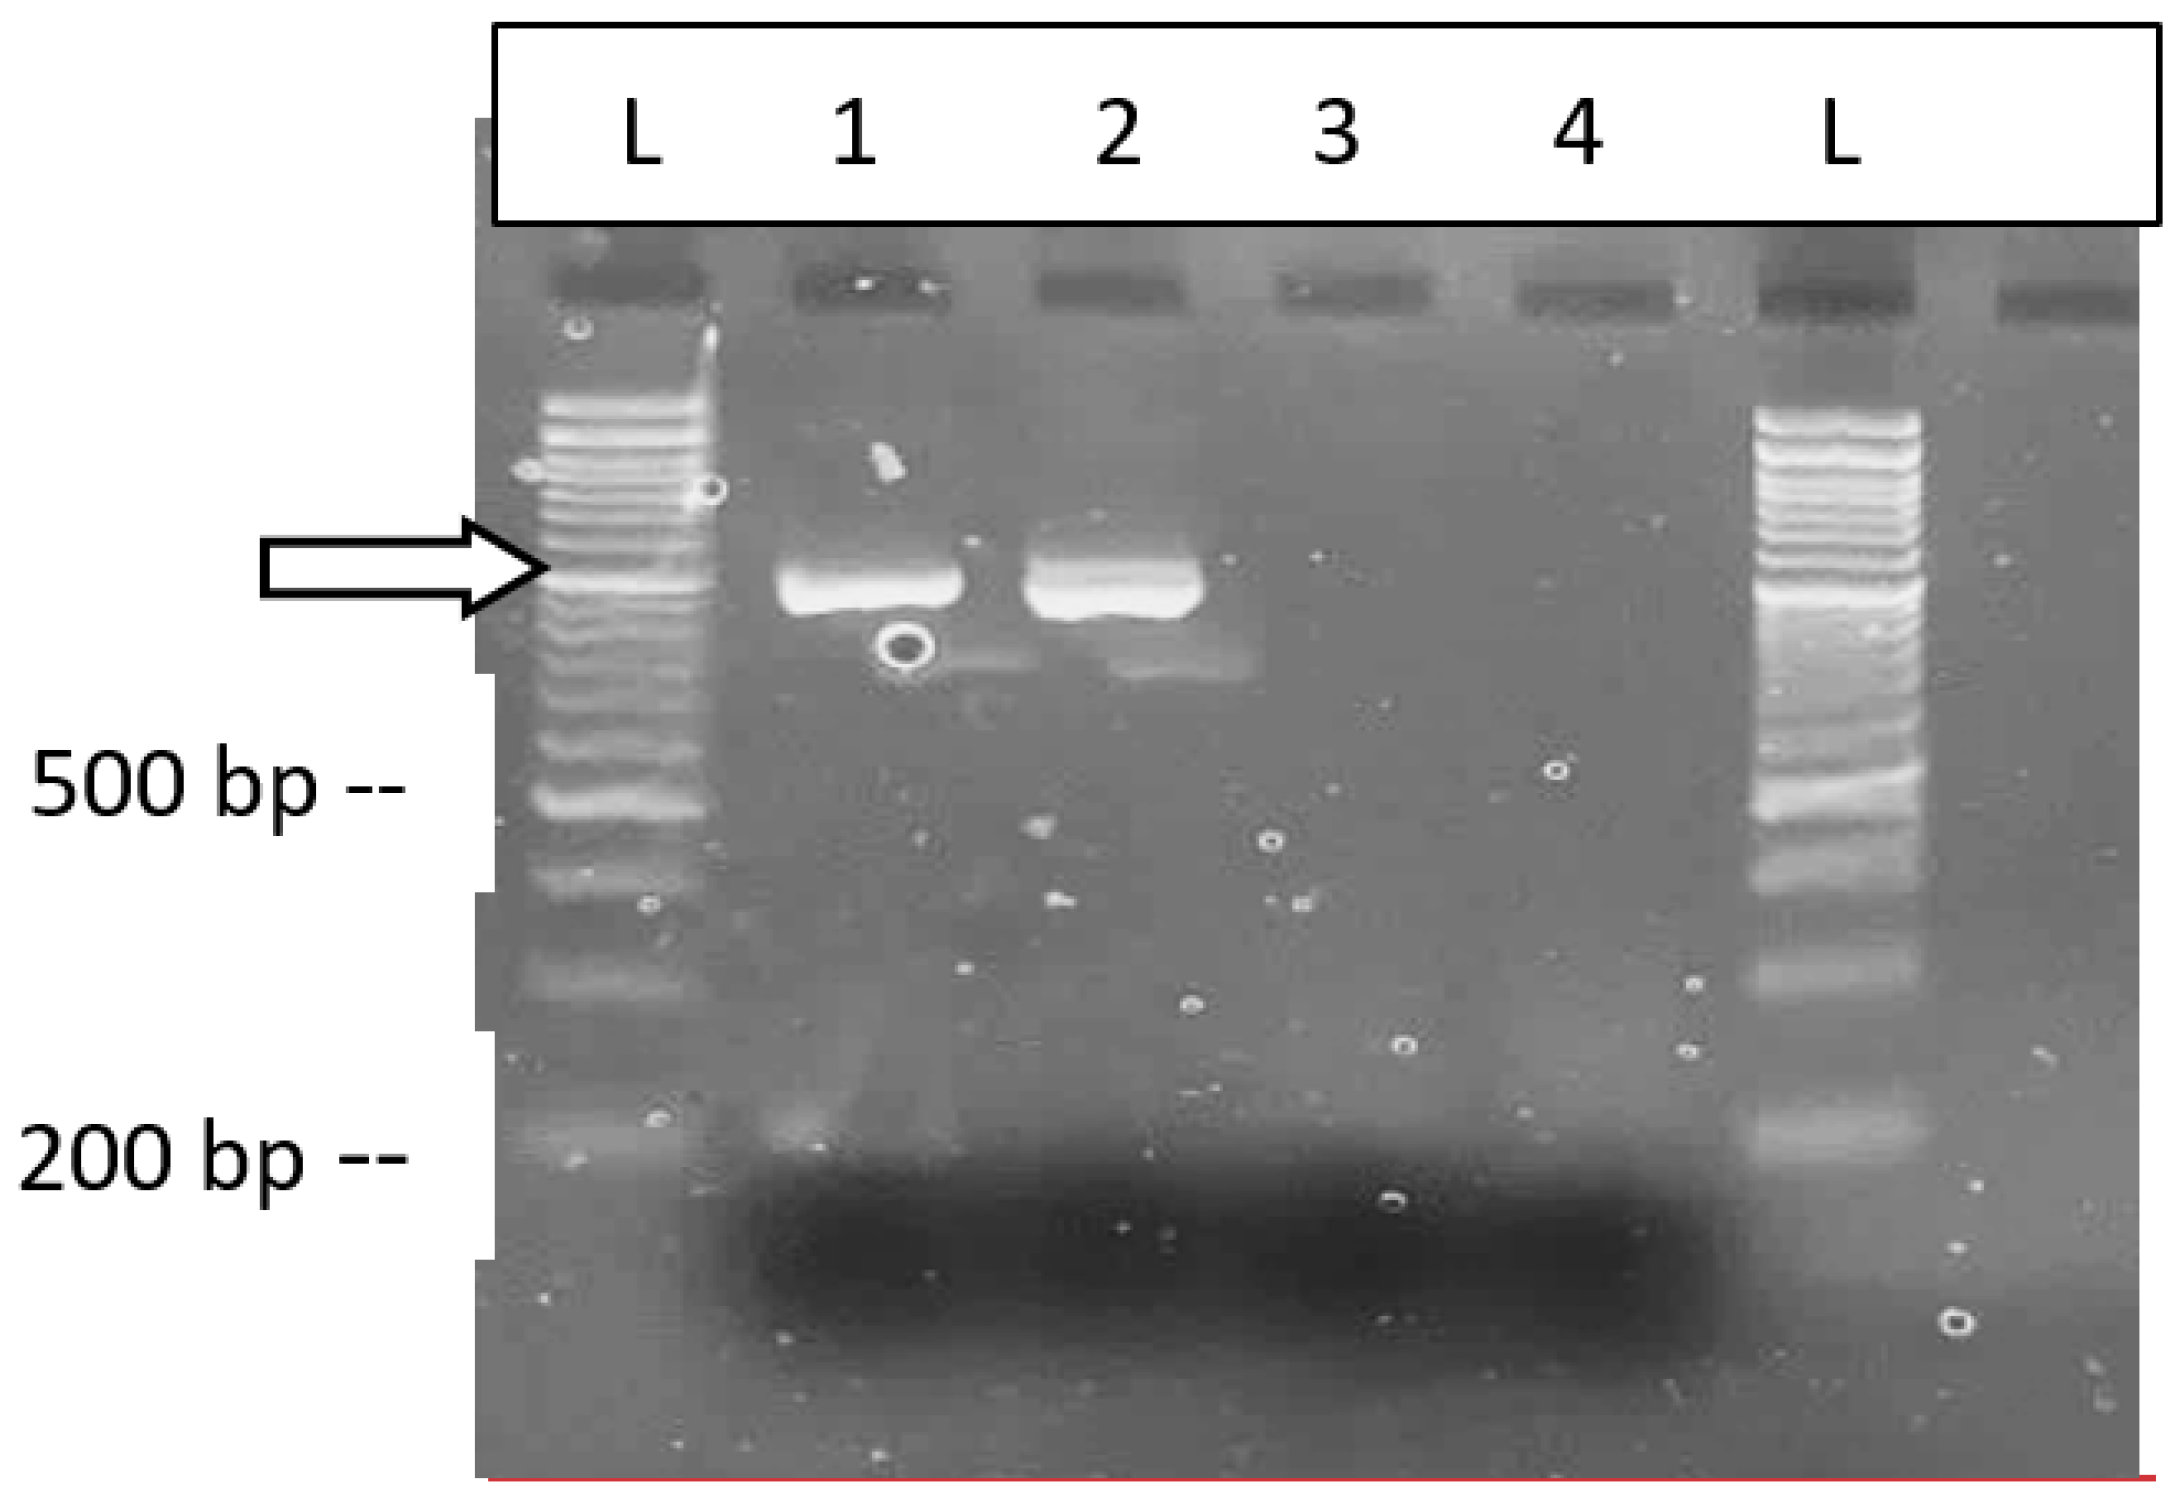
Analysis of cannabis leaf tissues for possible viruses using RT-PCR with specific primers and transmission microscopy. a) Primers for Tobacco mosaic virus produced a band at 800 bp (arrow) in the positive control (tobacco) with no corresponding bands in the cannabis leaf samples (Cs). The low MW bands at around 230 bp were found to be a ubiquitin protein. b) Primers for Alfalfa mosaic virus produced at 850 bp band (arrow) in the positive control but not in cannabis leaf tissues. c) Primers for TMV and the Tobamovirus group produced bands at 850 bp and 1650 bp, respectively, in the positive controls (arrows) but not in cannabis leaf samples. d) Transmission microscopy showed the presence of rod-shaped virus particles measuring 800-1,000 nm in the positive control tissue (arrow) but not in cannabis leaf samples (not shown).
Figure 6.
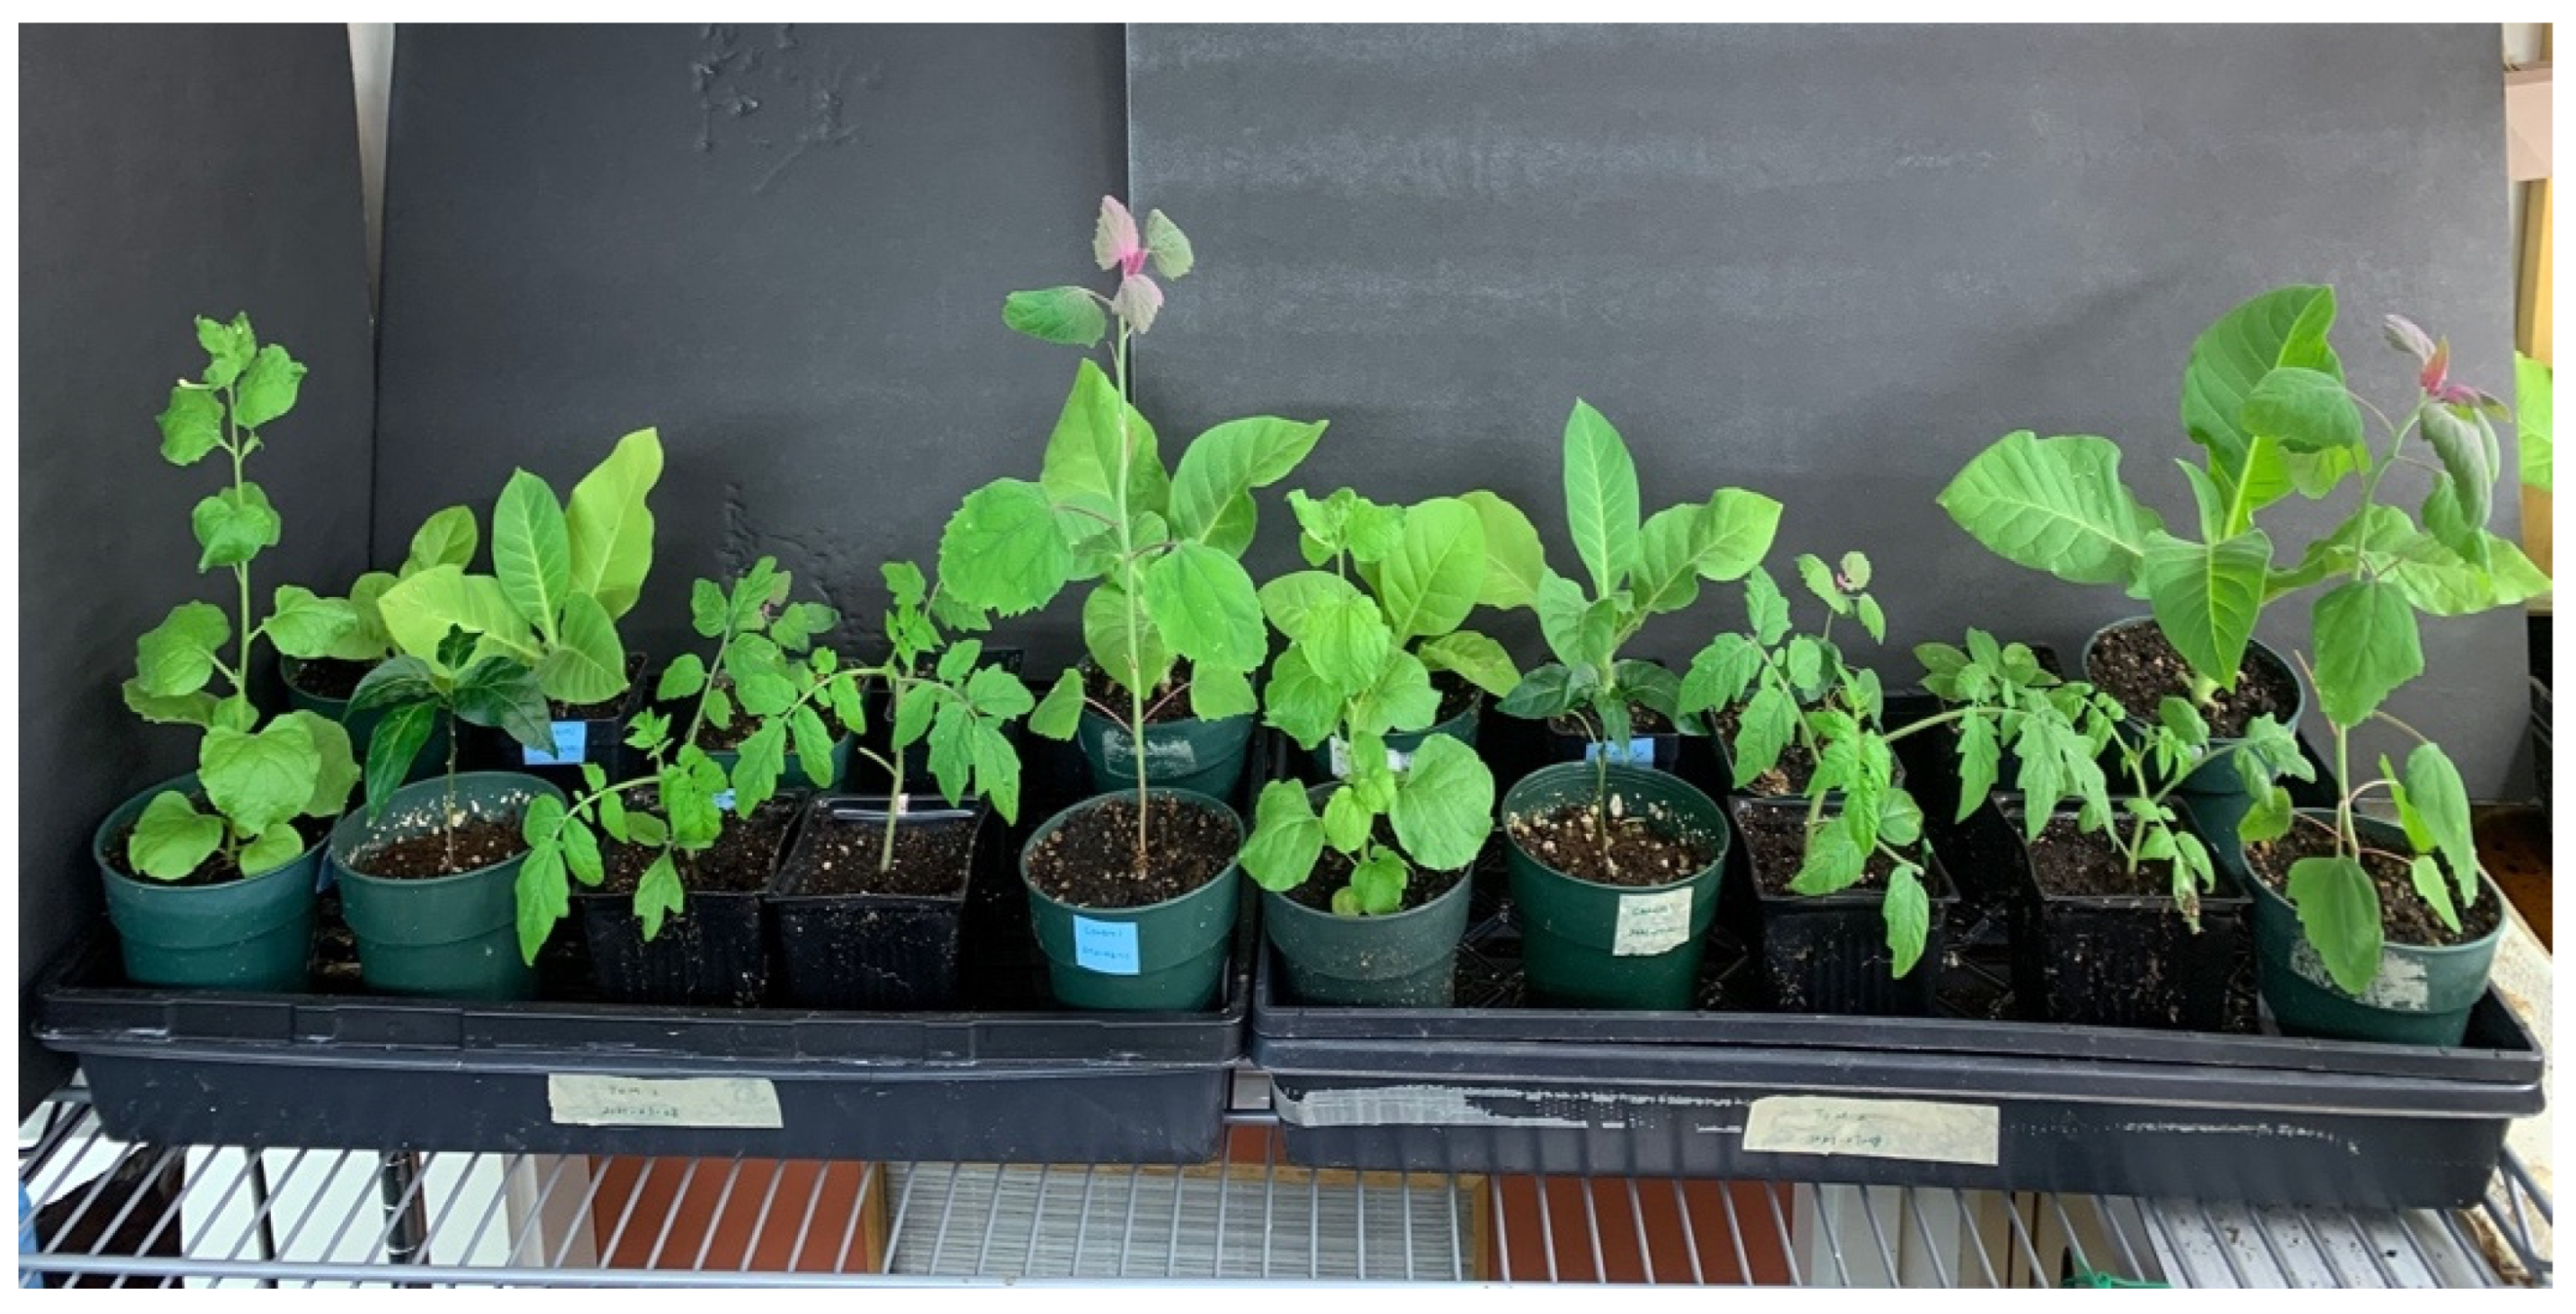
The host range study included Nicotiana clevelandii A. Gray (Cleveland’s tobacco), N. glutinosa L. (Peruvian tobacco), N. tabacum L. ‘Samsun’ (cultivated tobacco), Chenopodium quinoa Willd. (quinoa), C. amaranticolor (Coste & A.Reyn.) (goosefoot), Gomphrena globosa L. (globe amaranth), and Solanum lycopersicoides (tomato) as shown above. Plants were mechanically inoculated and observed for symptom development after 3 weeks.
Figure 7.
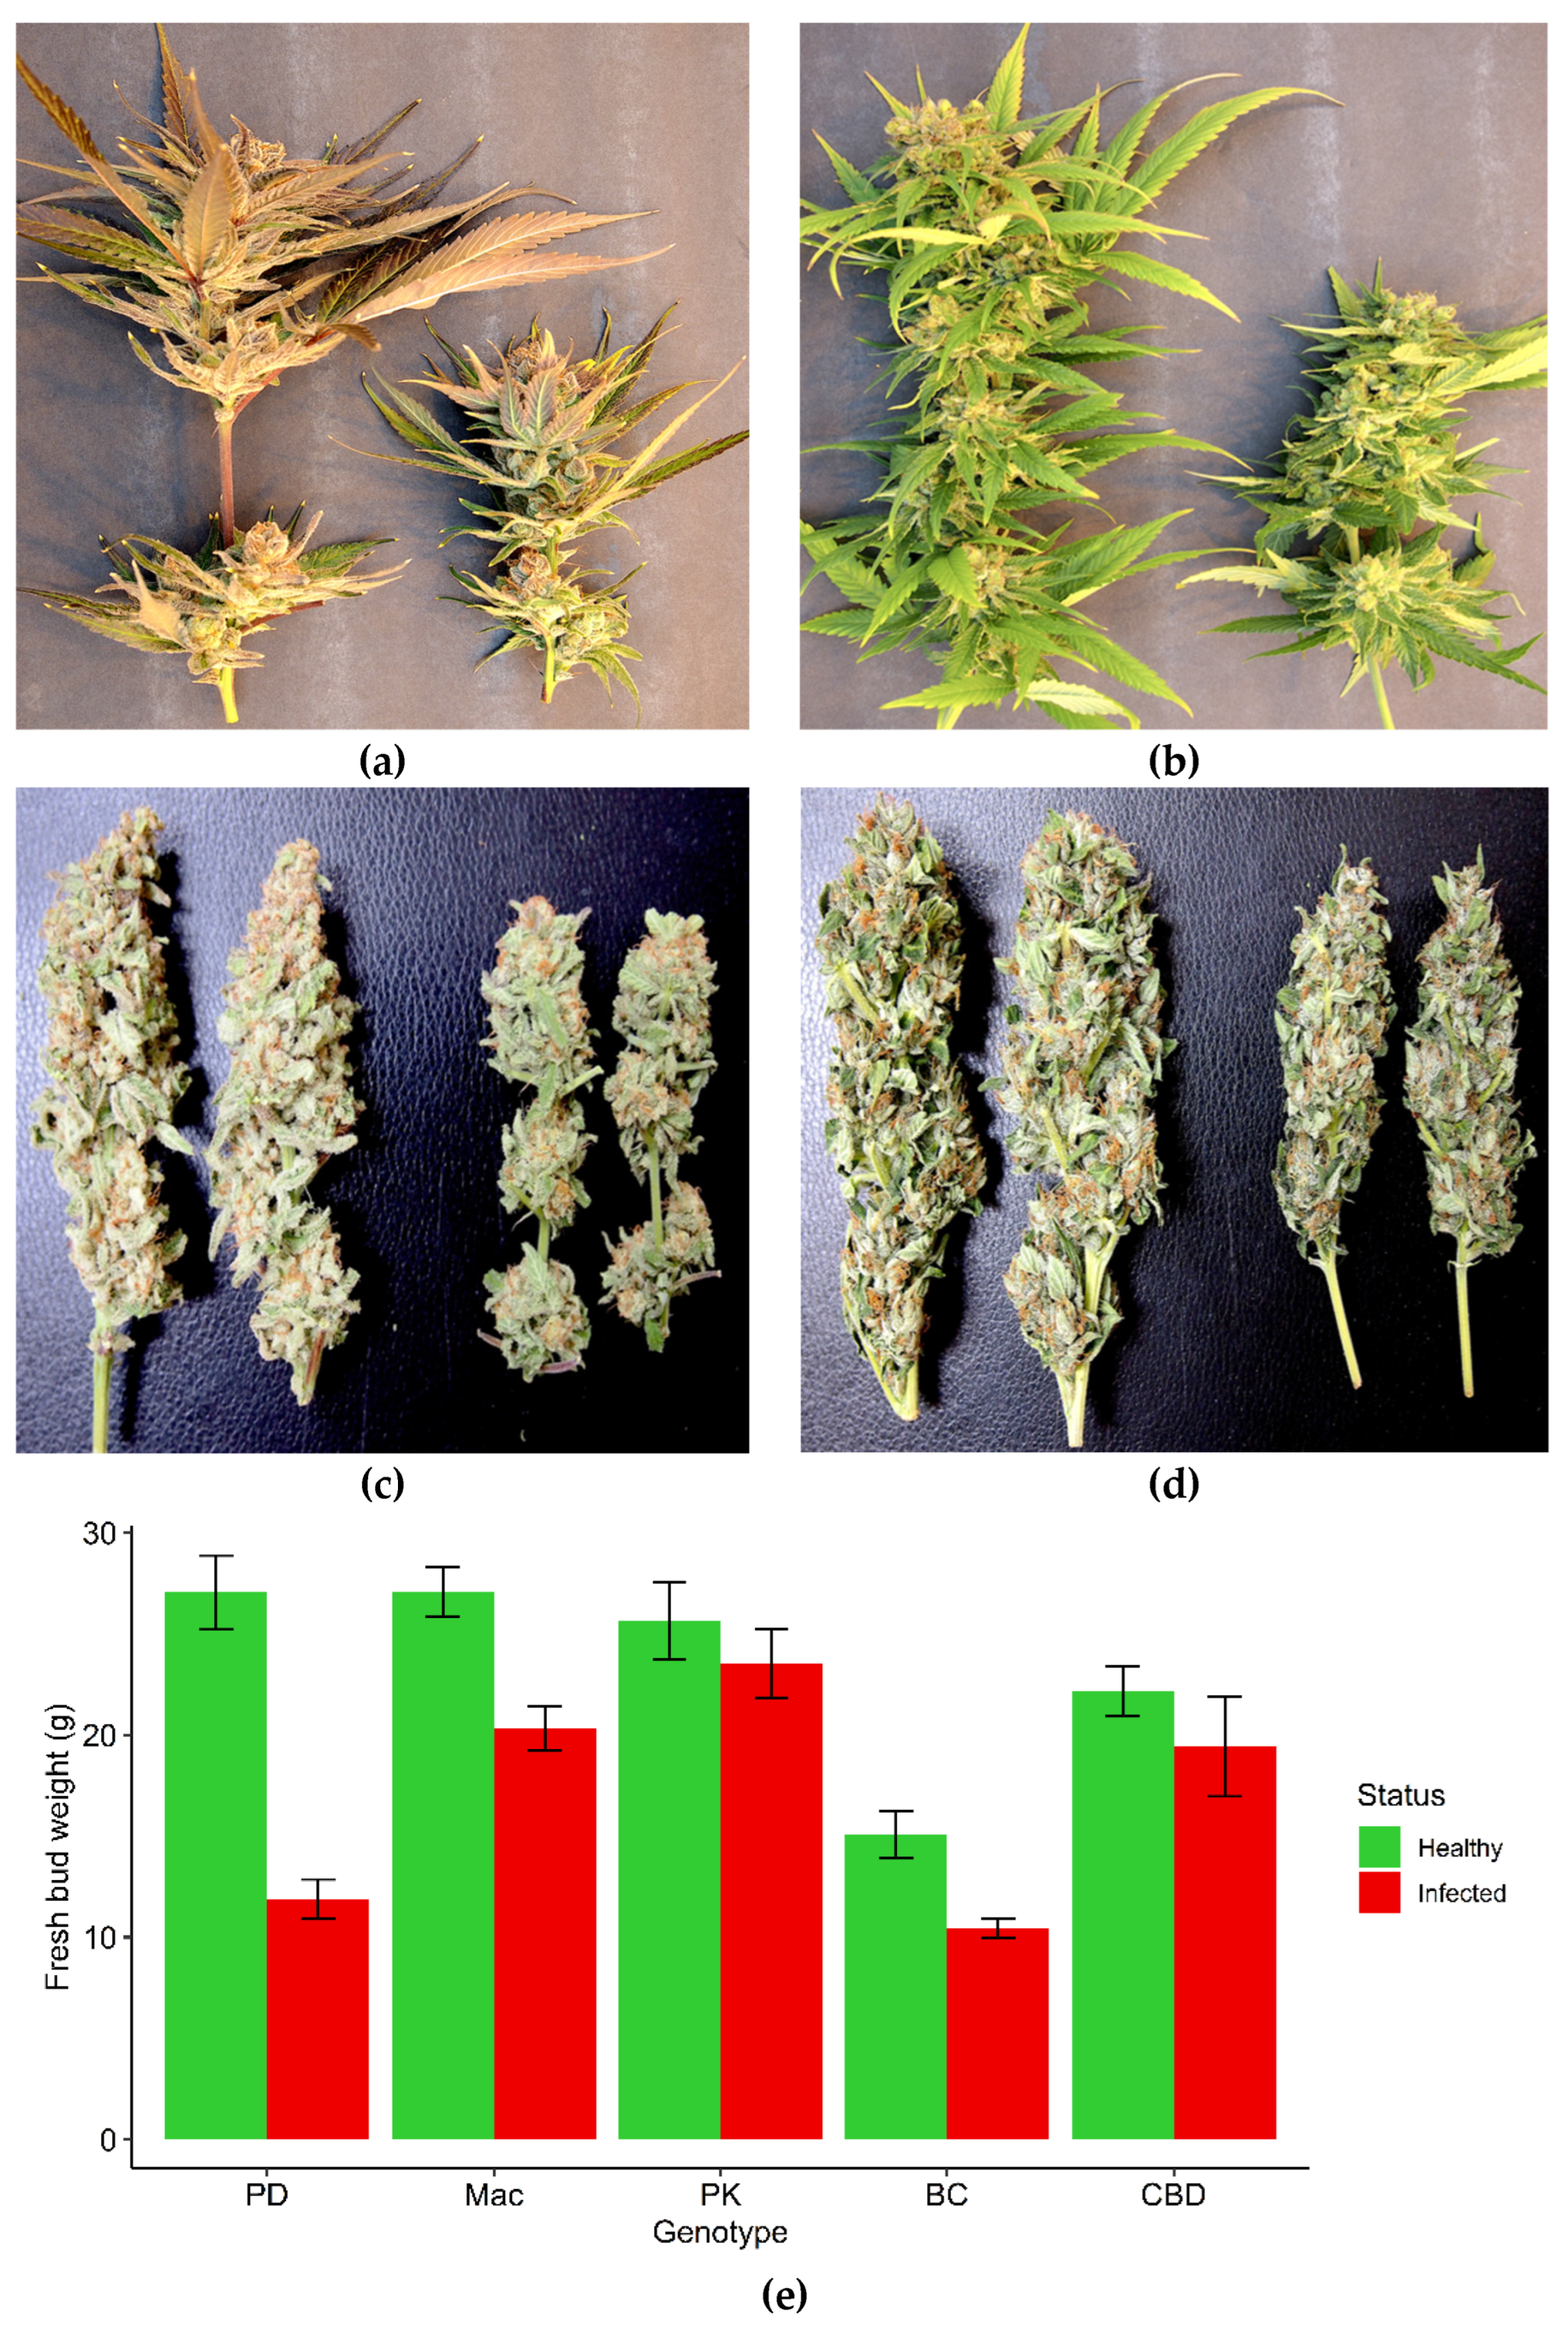
Symptoms of reduced inflorescence growth on two cannabis genotypes attributed to infection by Hop latent viroid, which was confirmed by high throughput sequencing (HTS). Stunted inflorescence growth can be seen on genotypes Mac-1 (a, c) and PD (b, d). In each photo, the healthy (asymptomatic) samples are shown on the left, the infected ones are shown on the right. The harvested and trimmed dried inflorescences of the same two genotypes (c, d) show a reduced size and volume of the tissues that was reflected in reduced weight. e) Fresh weight measurements of the inflorescences of five cannabis genotypes that were healthy (asymptomatic) (red columns) or affected by Hop latent viroid as confirmed by HTS (green columns). Measurements were made at harvest. Error bars show standard errors of the mean (n=5). There was no observable reduction of growth on genotypes PK and CBD, while PD, Mac and BC showed significantly reduced growth.
Figure 8.
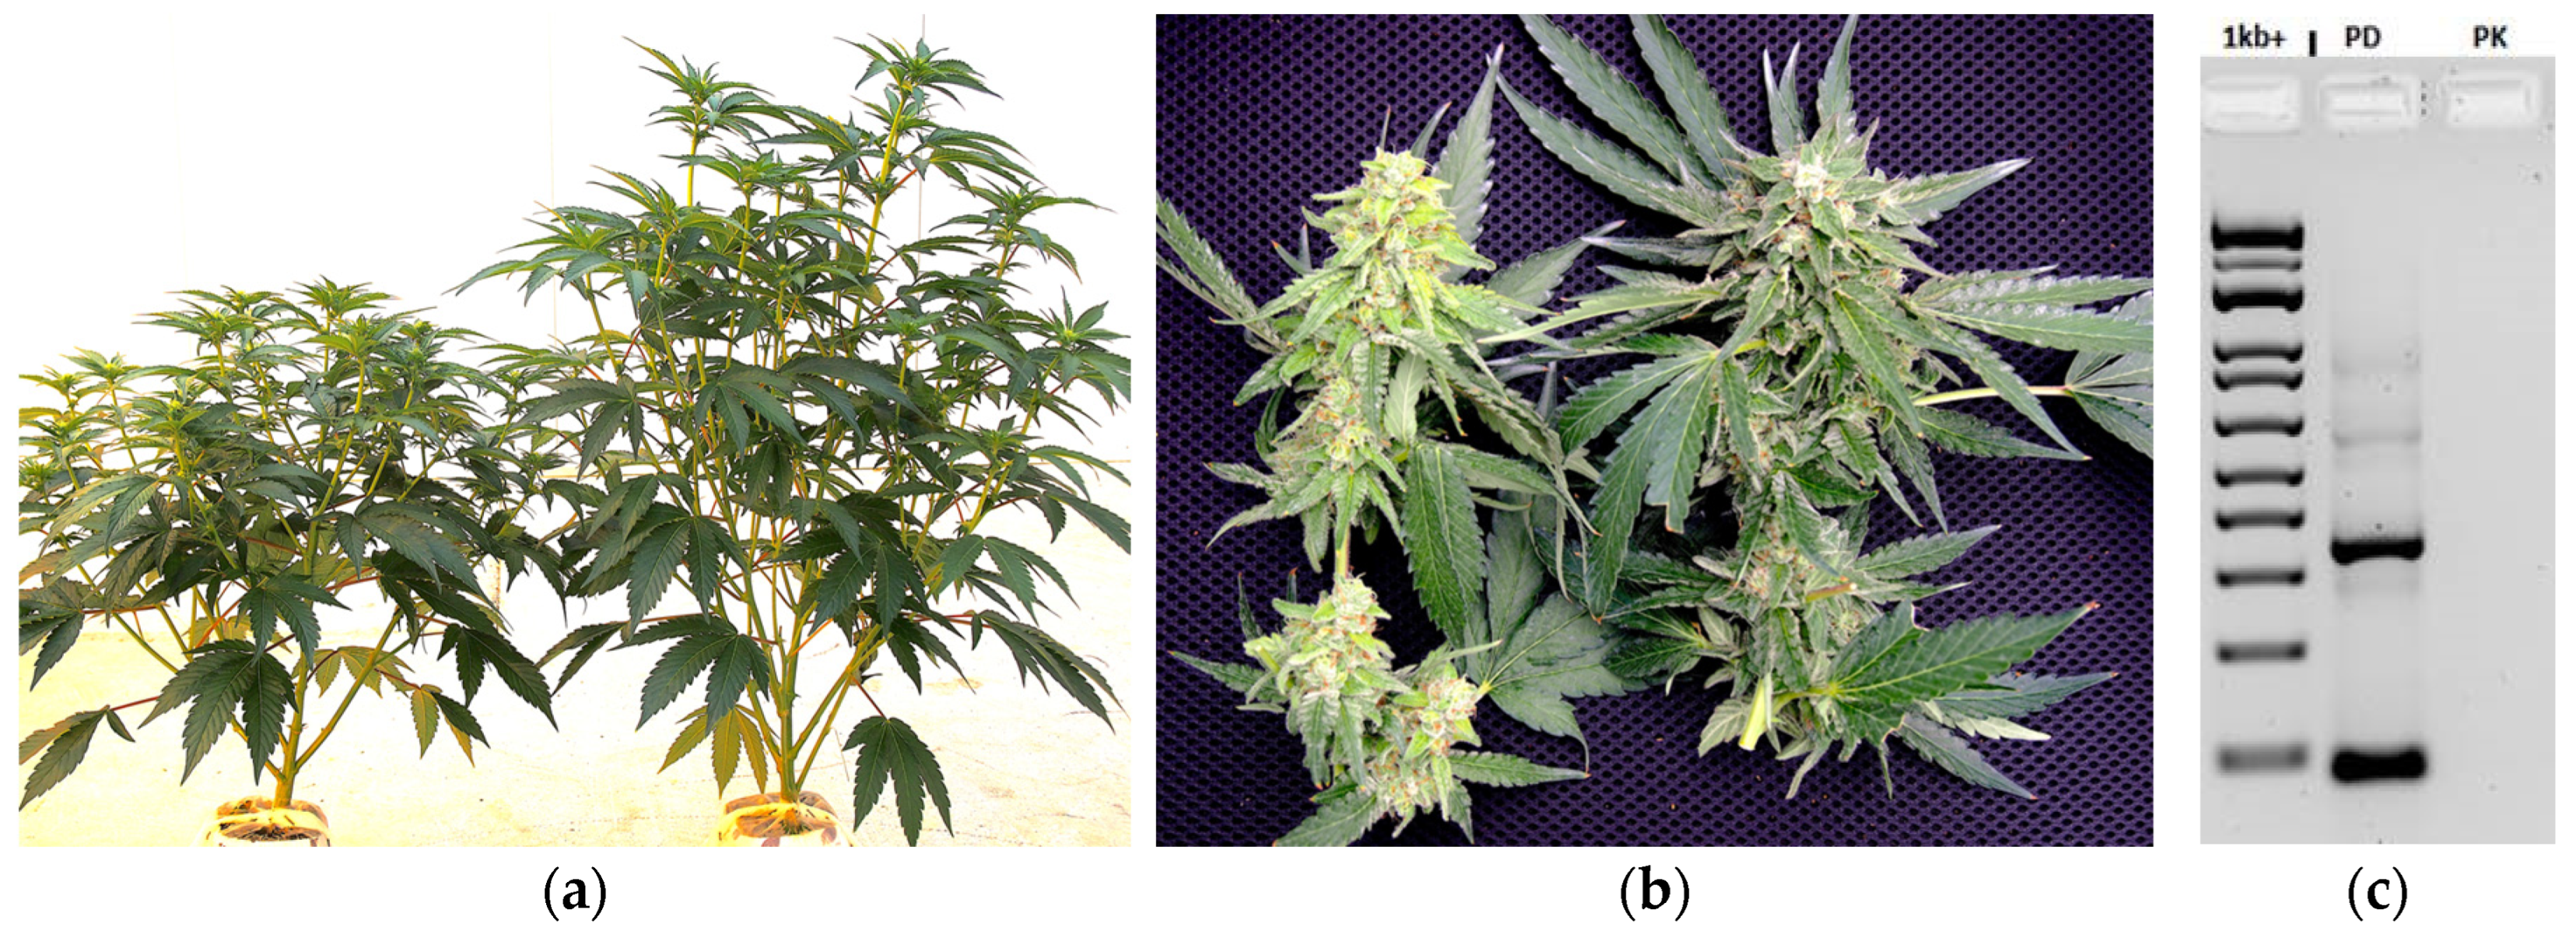
Symptoms of stunted plant growth (a) and reduced inflorescence development and chlorosis (b) on cannabis genotype PD (left plant in both photos) compared to an asymptomatic plant and healthy inflorescence (right plant in both photos). c) RT-PCR analysis showed the symptomatic sample contained HLVd. A second genotype PK that was asymptomatic did not show a band. All analyses were conducted on inflorescence tissues.
Figure 9.
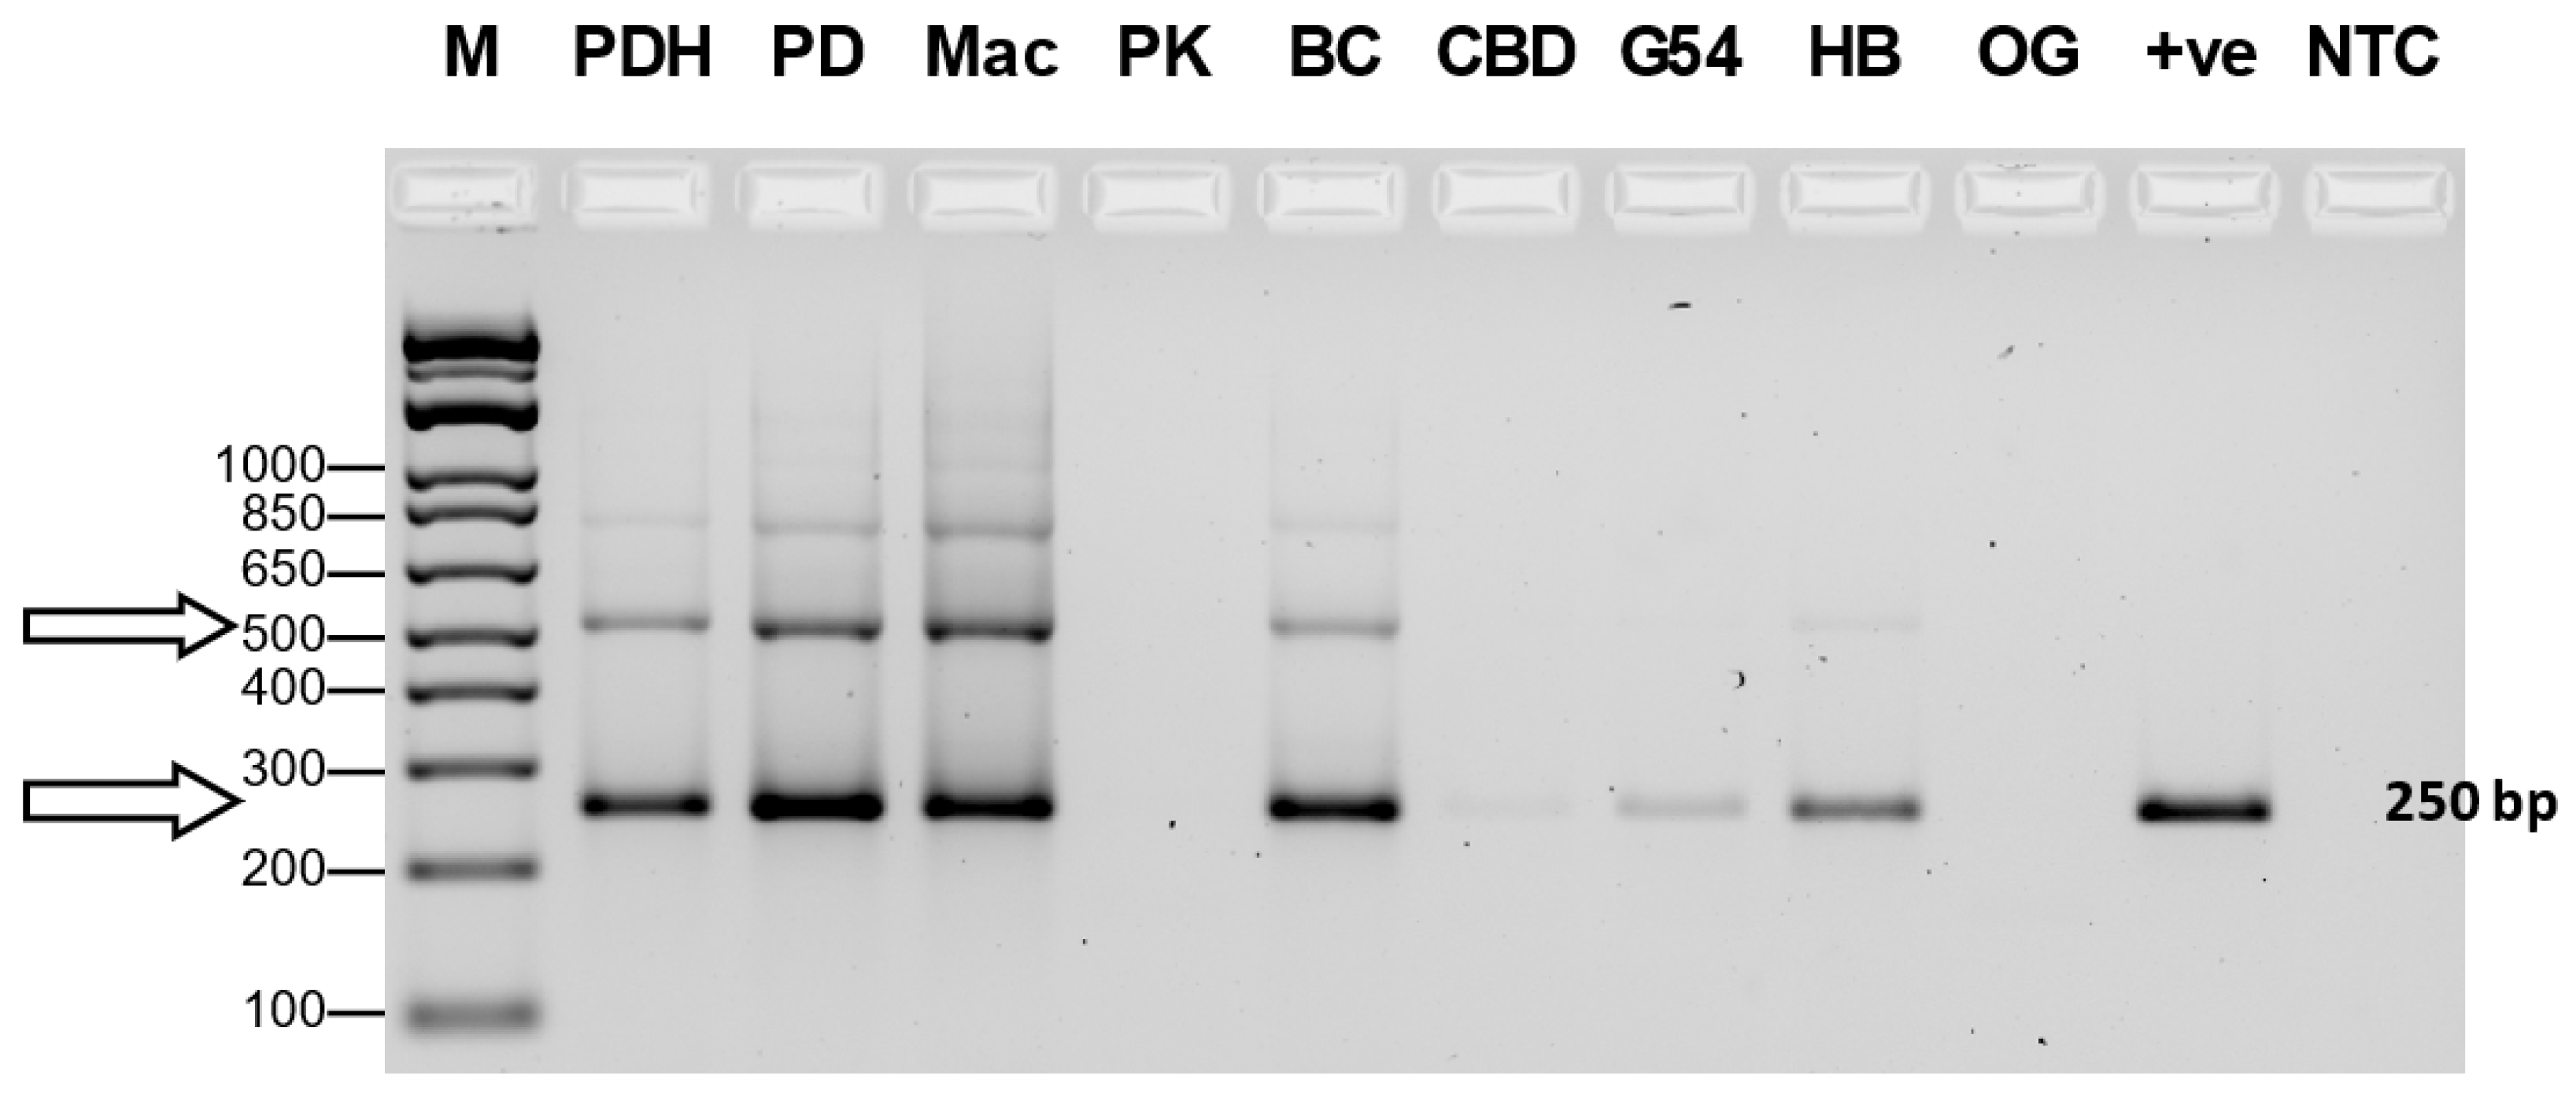
RT-PCR analysis using primers for HLVd shows the viroid was distinctively present in five cannabis genotypes out of nine tested. The bands at 256 bp (arrow) are characteristic for this viroid and represent the entire genome. The larger-sized bands (512 bp) are concatamers of the genome due to its circular nature and represent head-tail alignments. PDH was a healthy (asymptomatic) plant of genotype PD that was subsequently shown to be infected by HLVd as a band of 256 bp size was present. Genotypes PK and CBD did not show a band and a very faint band was seen in G54-2. All analyses were conducted on leaf tissues.
Figure 10.
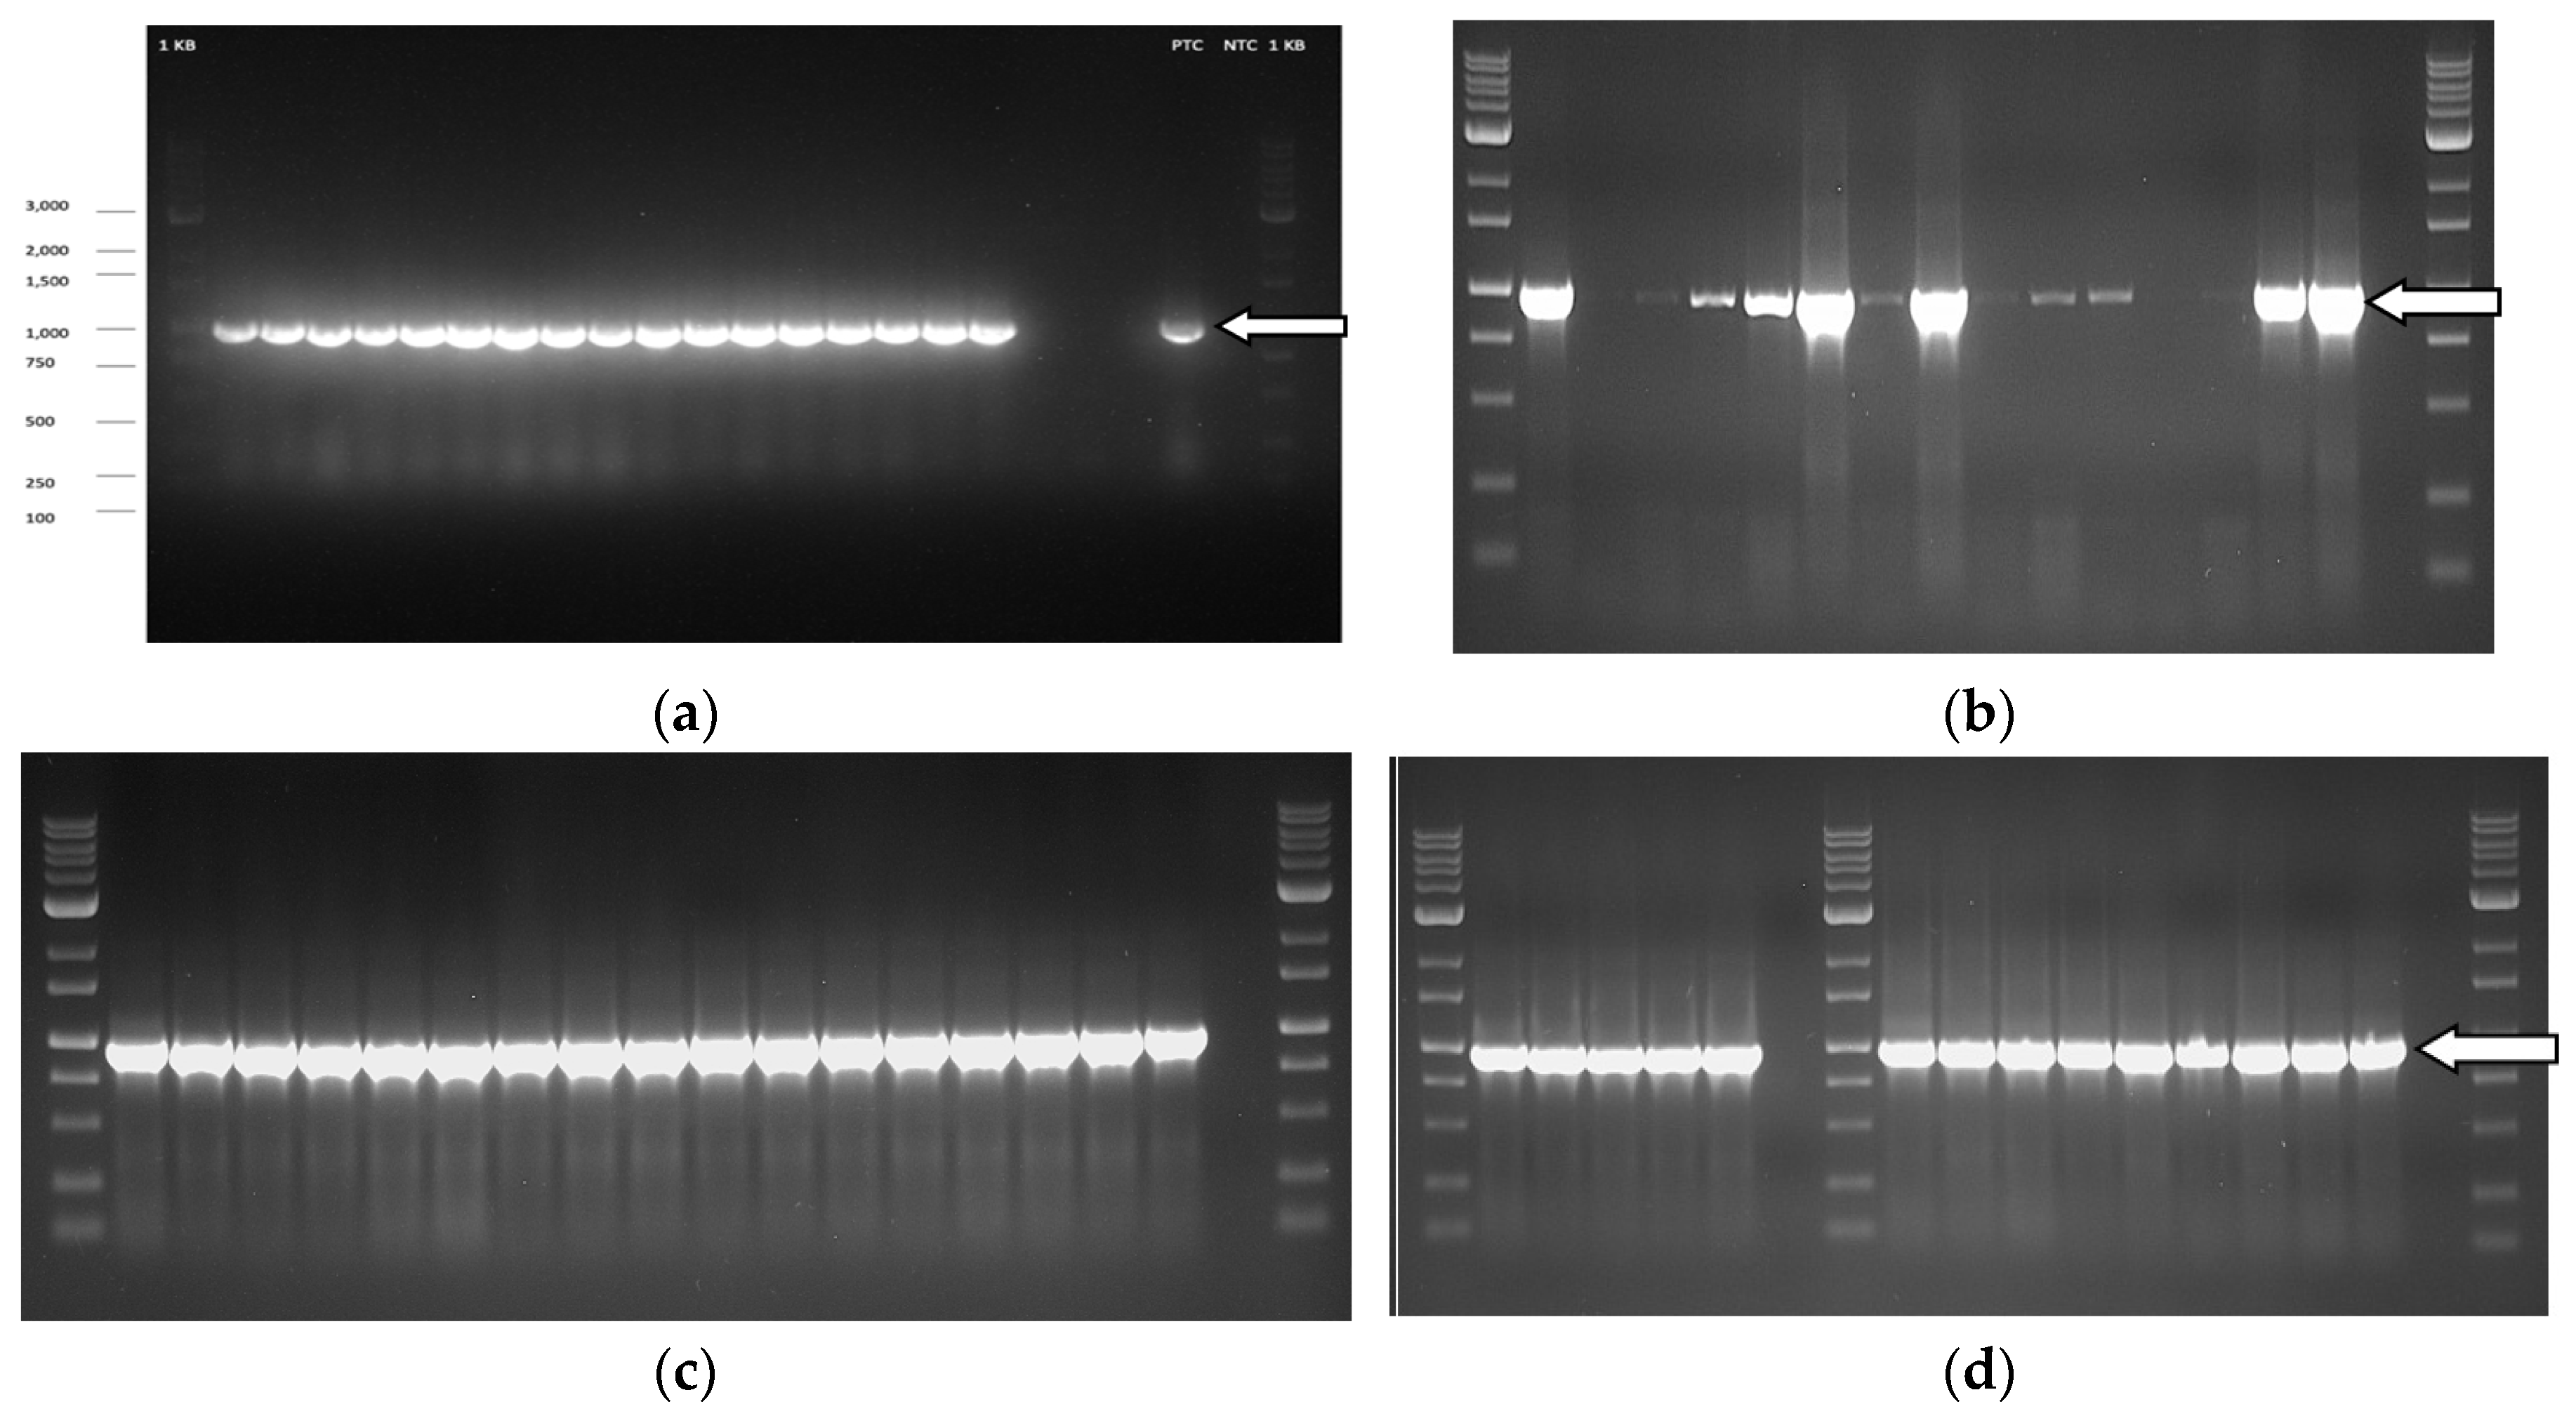
Detection of Cannabis sativa mitovirus 1 (CasaMV1) by RT-PCR using specific primers showing the 998 bp band (arrow) was present in leaves of 18 out of 20 genotypes grown indoors (a) and in 10 out of 14 genotypes grown outdoors (b). The intensity of the band varied across individual plants in outdoor samples representing four genotypes. In (c) and (d), the mitovirus was detected in all samples originating from four genotypes that consisted of roots, petioles, leaves and flower tissues grown indoors. The intensity of the bands was consistent across all samples. Blank lanes are water controls.
Figure 11.
a) Phylogenetic analysis of HLVd strains from cannabis, hemp and hops including sequences that were obtained from GenBank and from this study (shown in bold from Canada). The outgroup was PSTVd. b) An SNP was observed in sequences originating from cannabis genotypes ‘Mac’ and G54-2.
Figure 11.
a) Phylogenetic analysis of HLVd strains from cannabis, hemp and hops including sequences that were obtained from GenBank and from this study (shown in bold from Canada). The outgroup was PSTVd. b) An SNP was observed in sequences originating from cannabis genotypes ‘Mac’ and G54-2.
Figure 12.
Analysis of HLVd viroid genome copies in leaf tissues of eight cannabis genotypes as determined by ddPCR. The genotypes PD, Mac, BC and HB showed obvious symptoms of infection, including stunting and reduced inflorescence development, while genotypes PK, G54-2, CBD and OG did not display any obvious symptoms. All genotypes were grown adjacent to one another in a commercial greenhouse. Genotype PDH was a leaf sample collected from an asymptomatic, presumed healthy plant growing adjacent to PD in the same row of the greenhouse. The horizontal dashed line is the detection threshold of HLVd – samples measured at or below this threshold are presumed to be HLVd negative. HLVd measurements were normalized to the cannabis housekeeping gene EF1- and standardized to HLVd levels in the healthy genotype PK.
Figure 13.
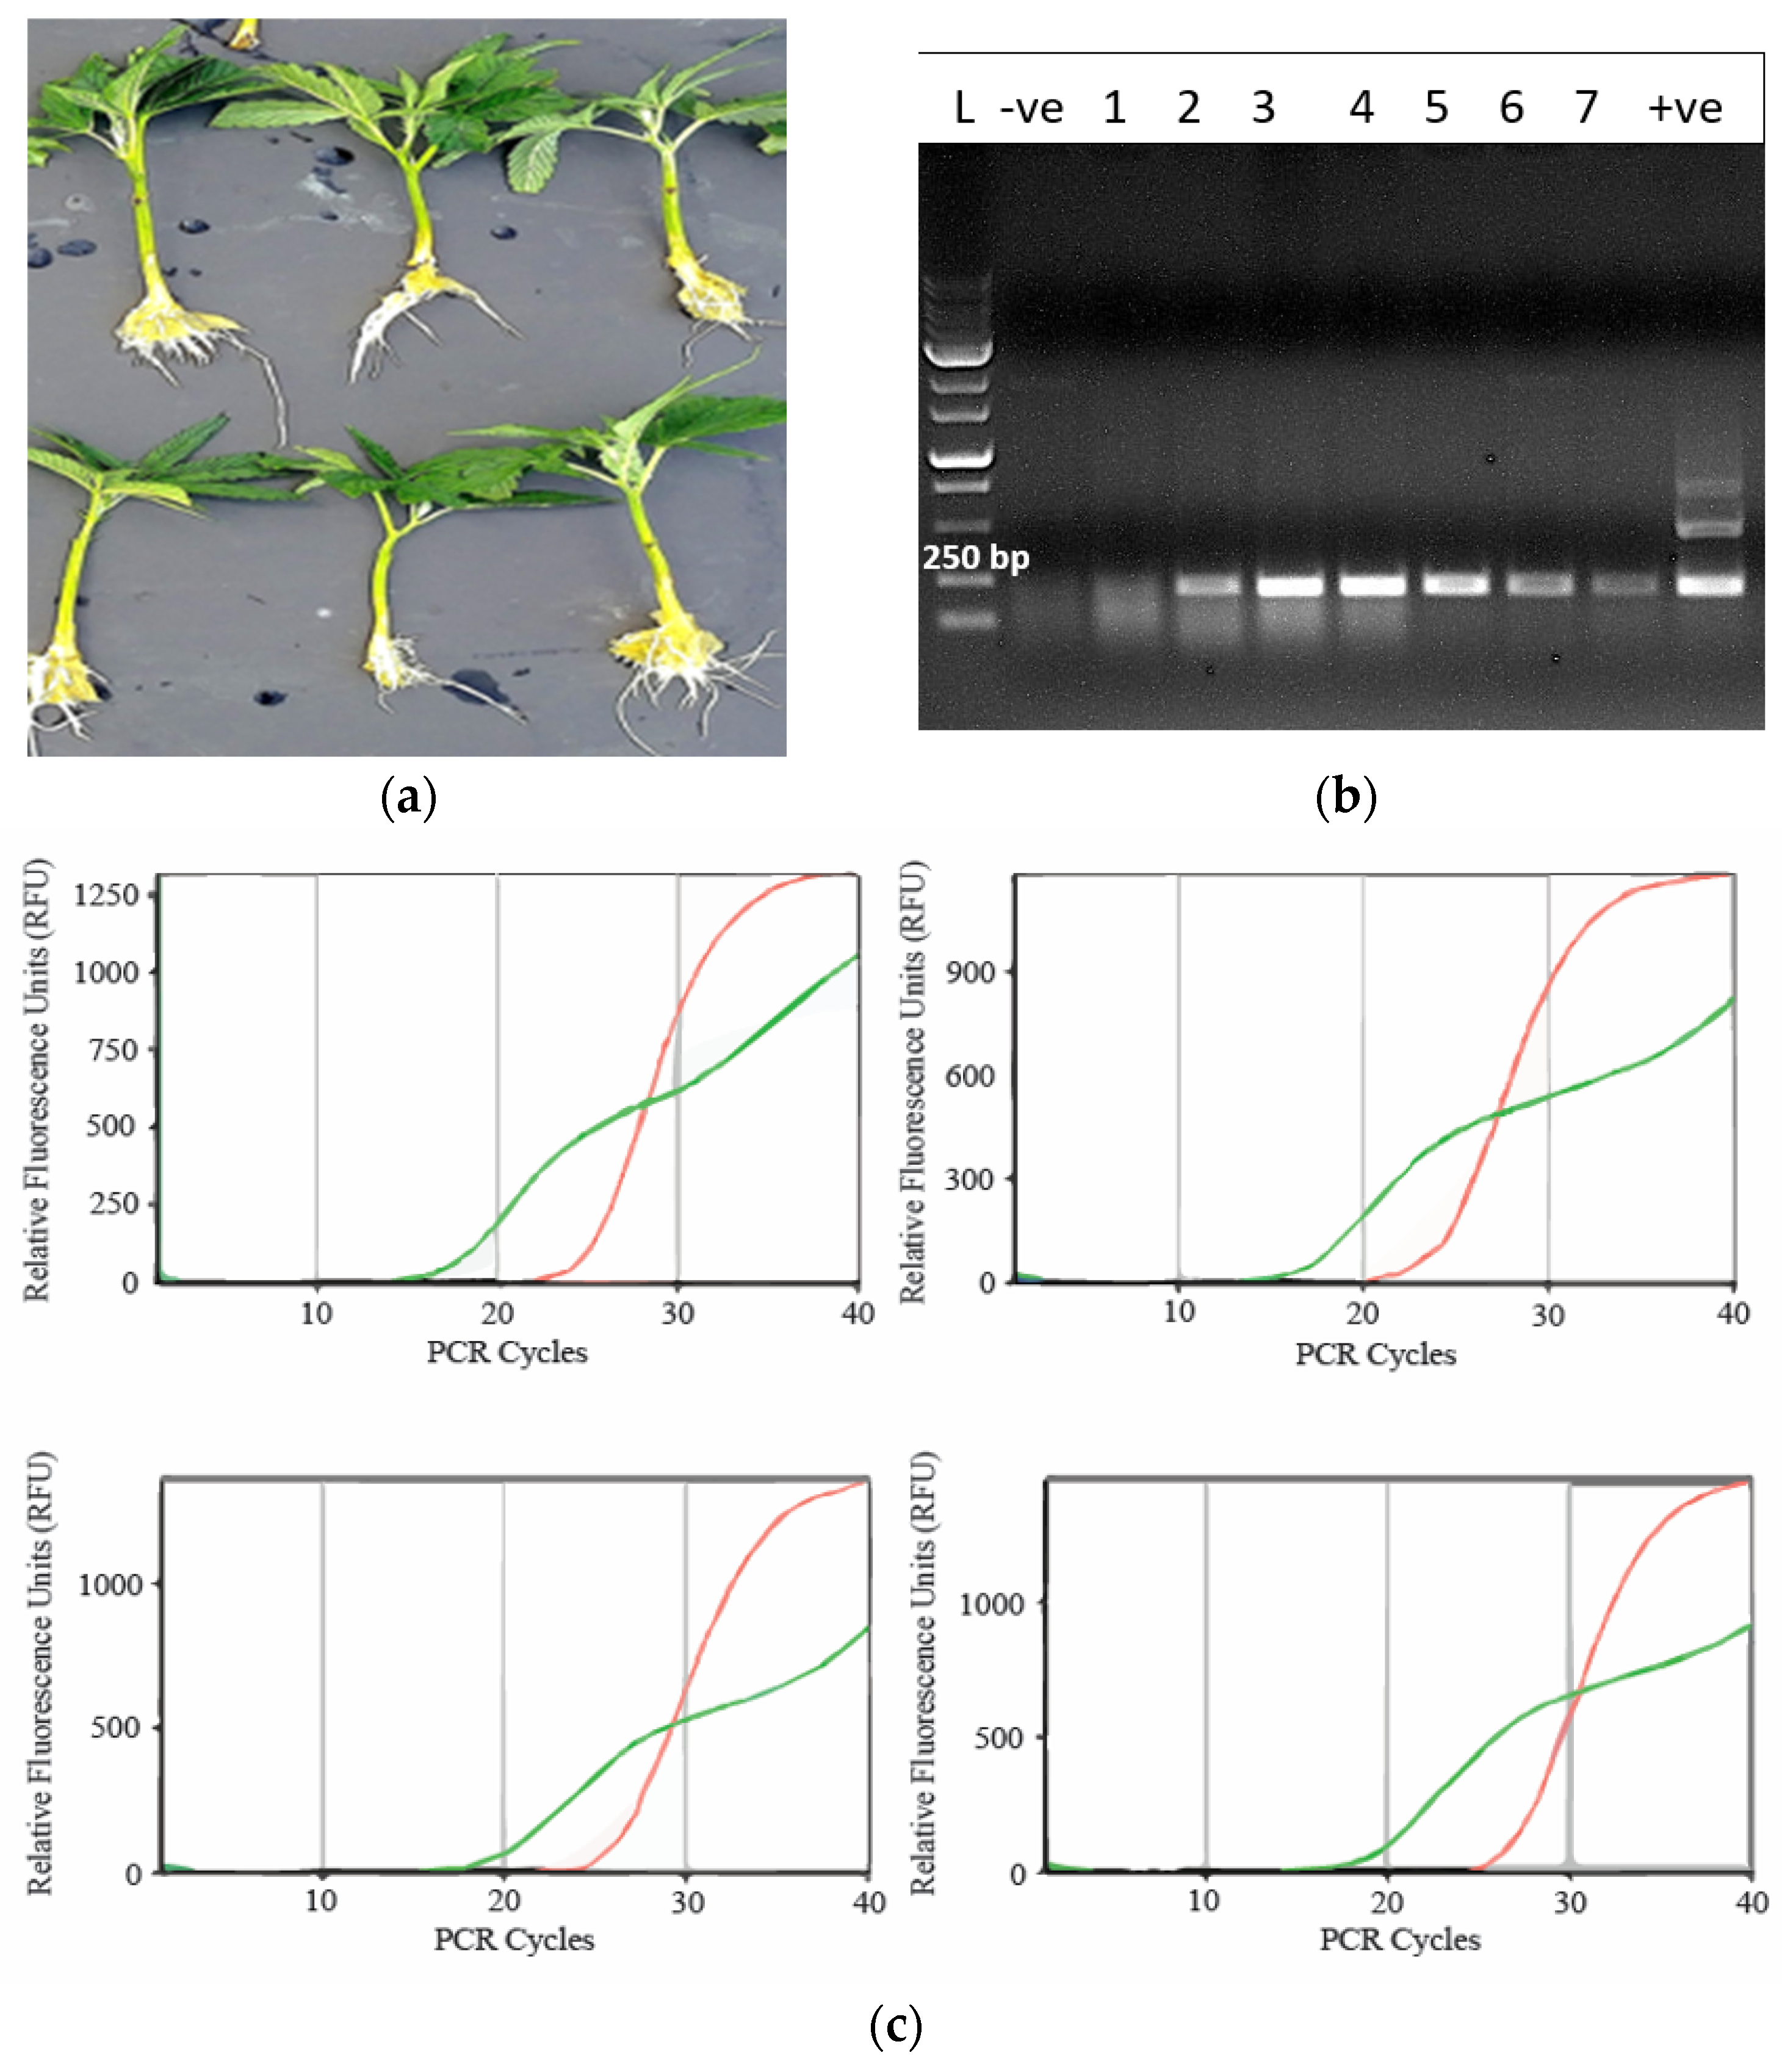
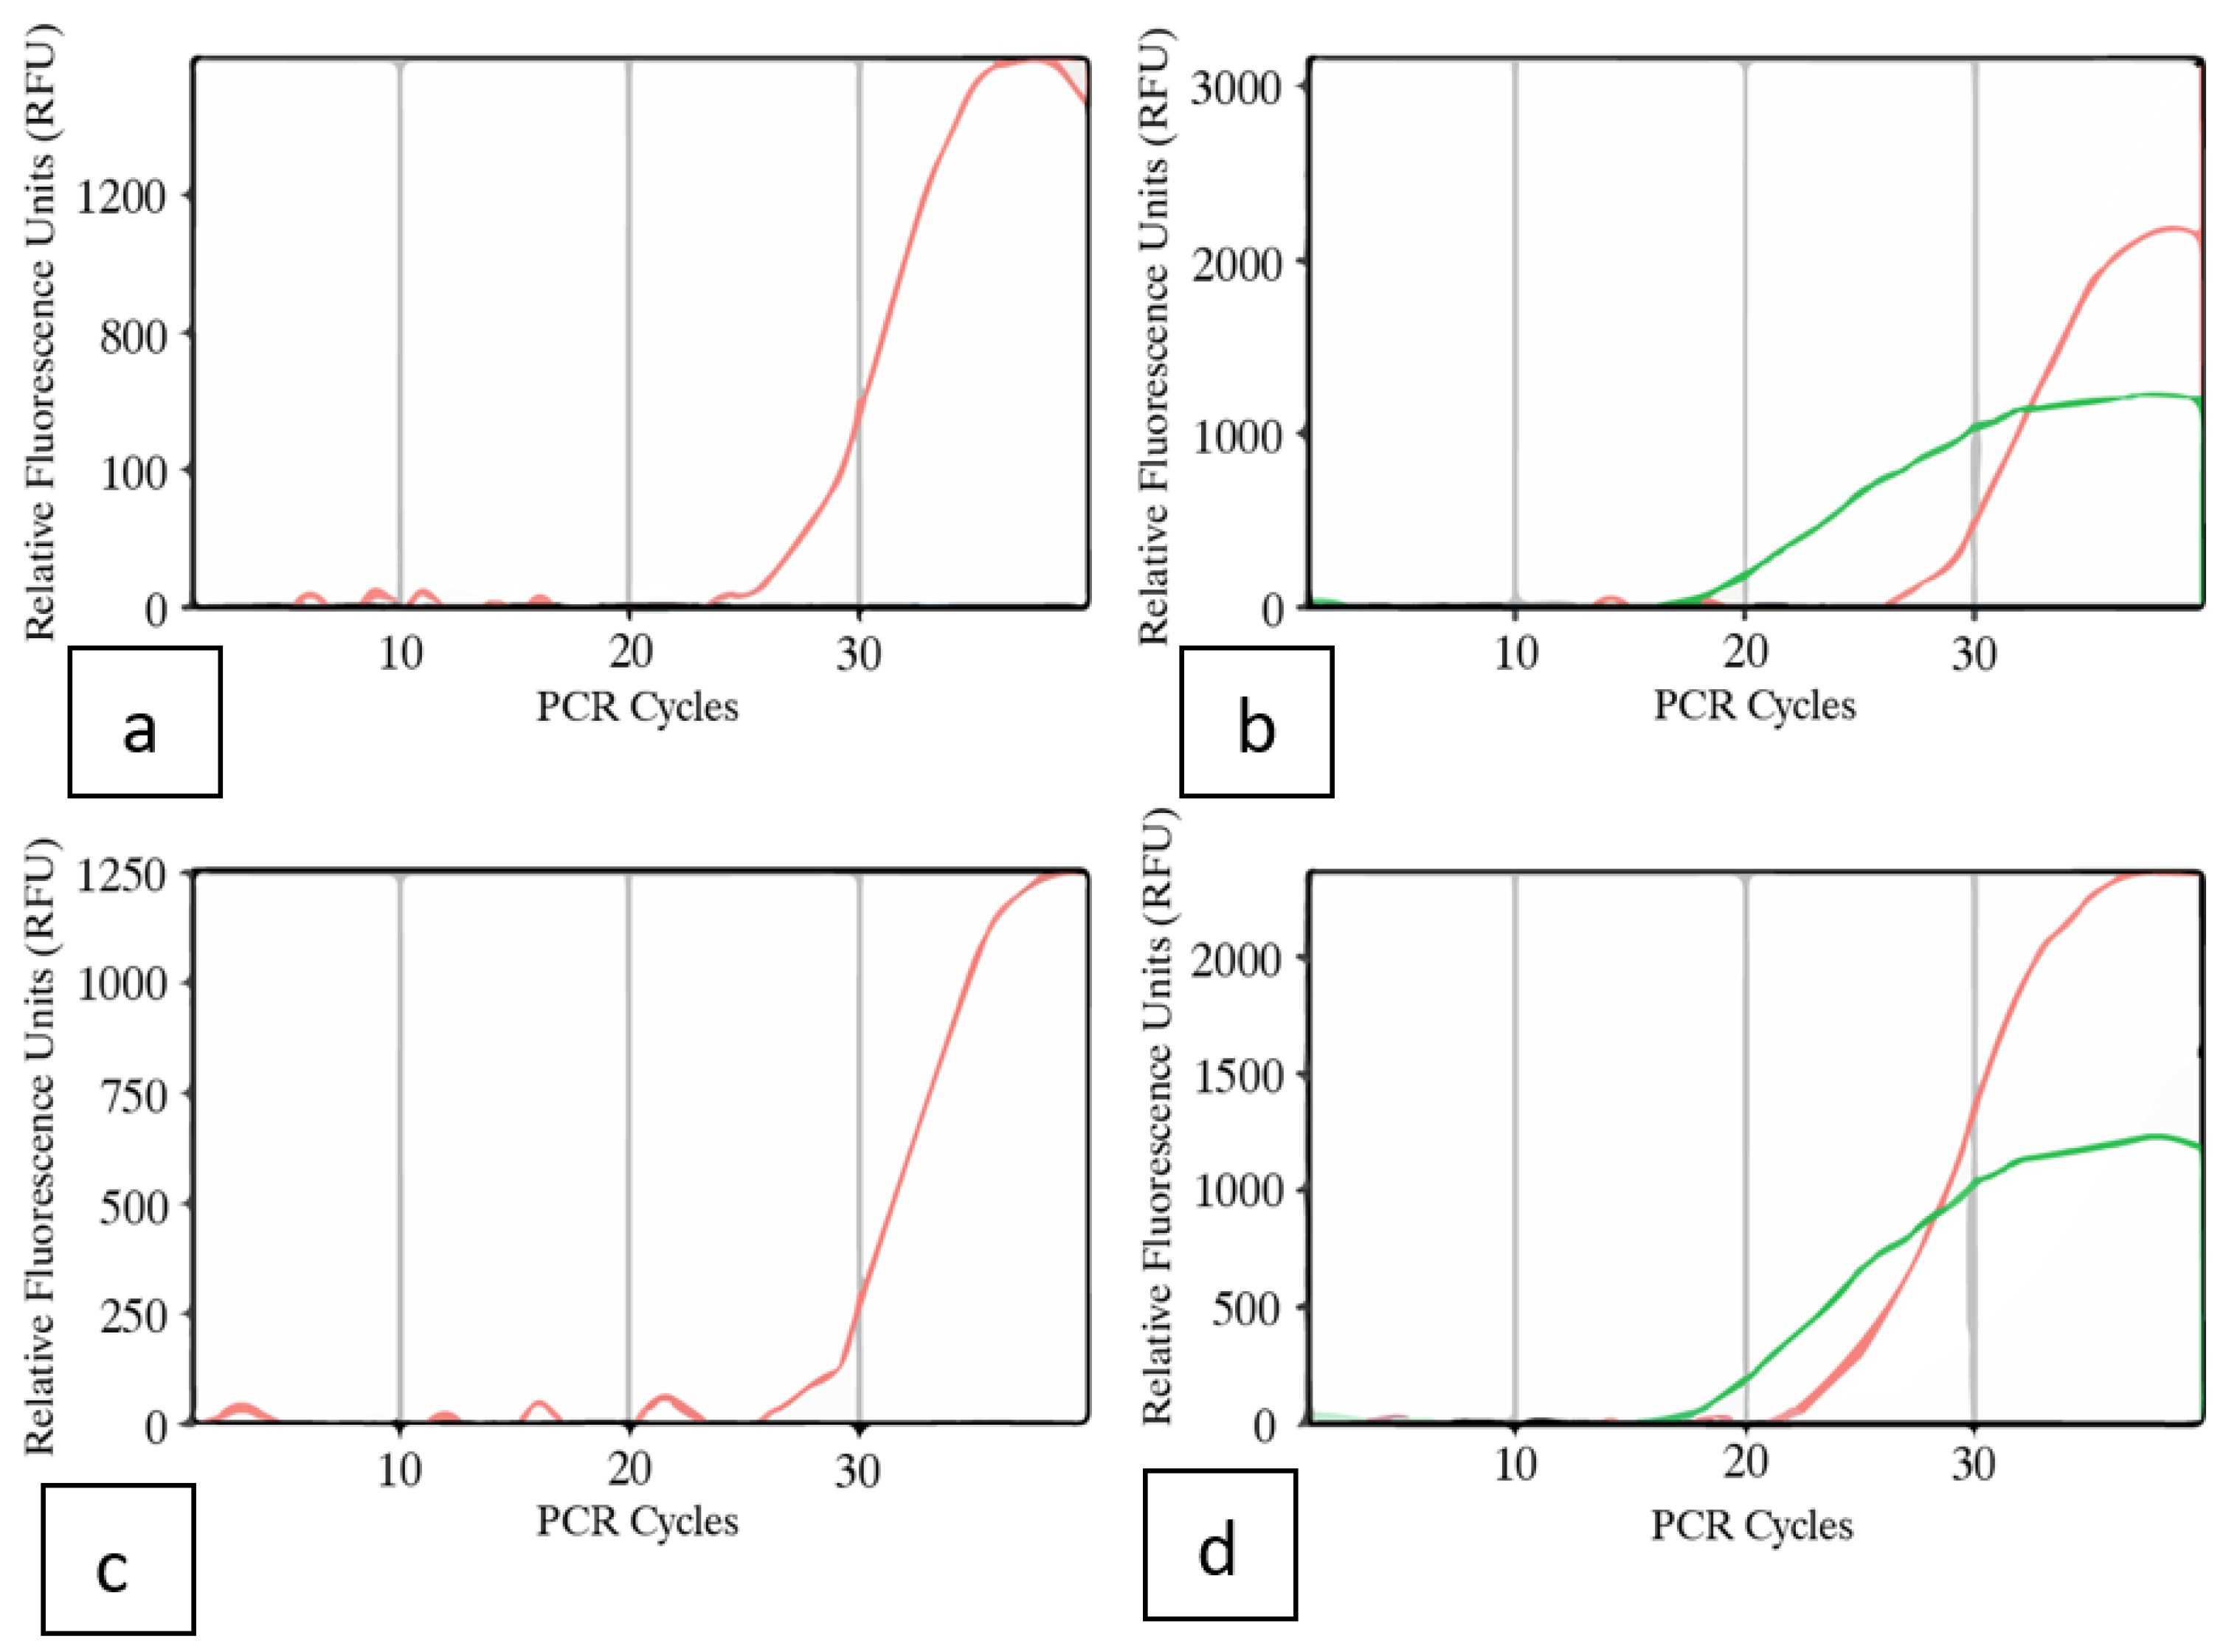
RT-qPCR results showing the relative fluorescence units as a function of PCR cycles (CT ) in inflorescence samples of two cannabis genotypes with and without visible symptoms. a) Asymptomatic PD; b) Symptomatic PD; c) Asymptomatic Mac-1; d) Symptomatic Mac-1. Primers used detected presence of HLVd in both symptomatic samples (b, d) (green line) compared to the asymptomatic control. Internal control gene cycles are shown with the red lines in each graph. In asymptomatic plants, there was no viroid detected. Positive controls for HLVd were also included in each reaction (not shown).
Figure 14.
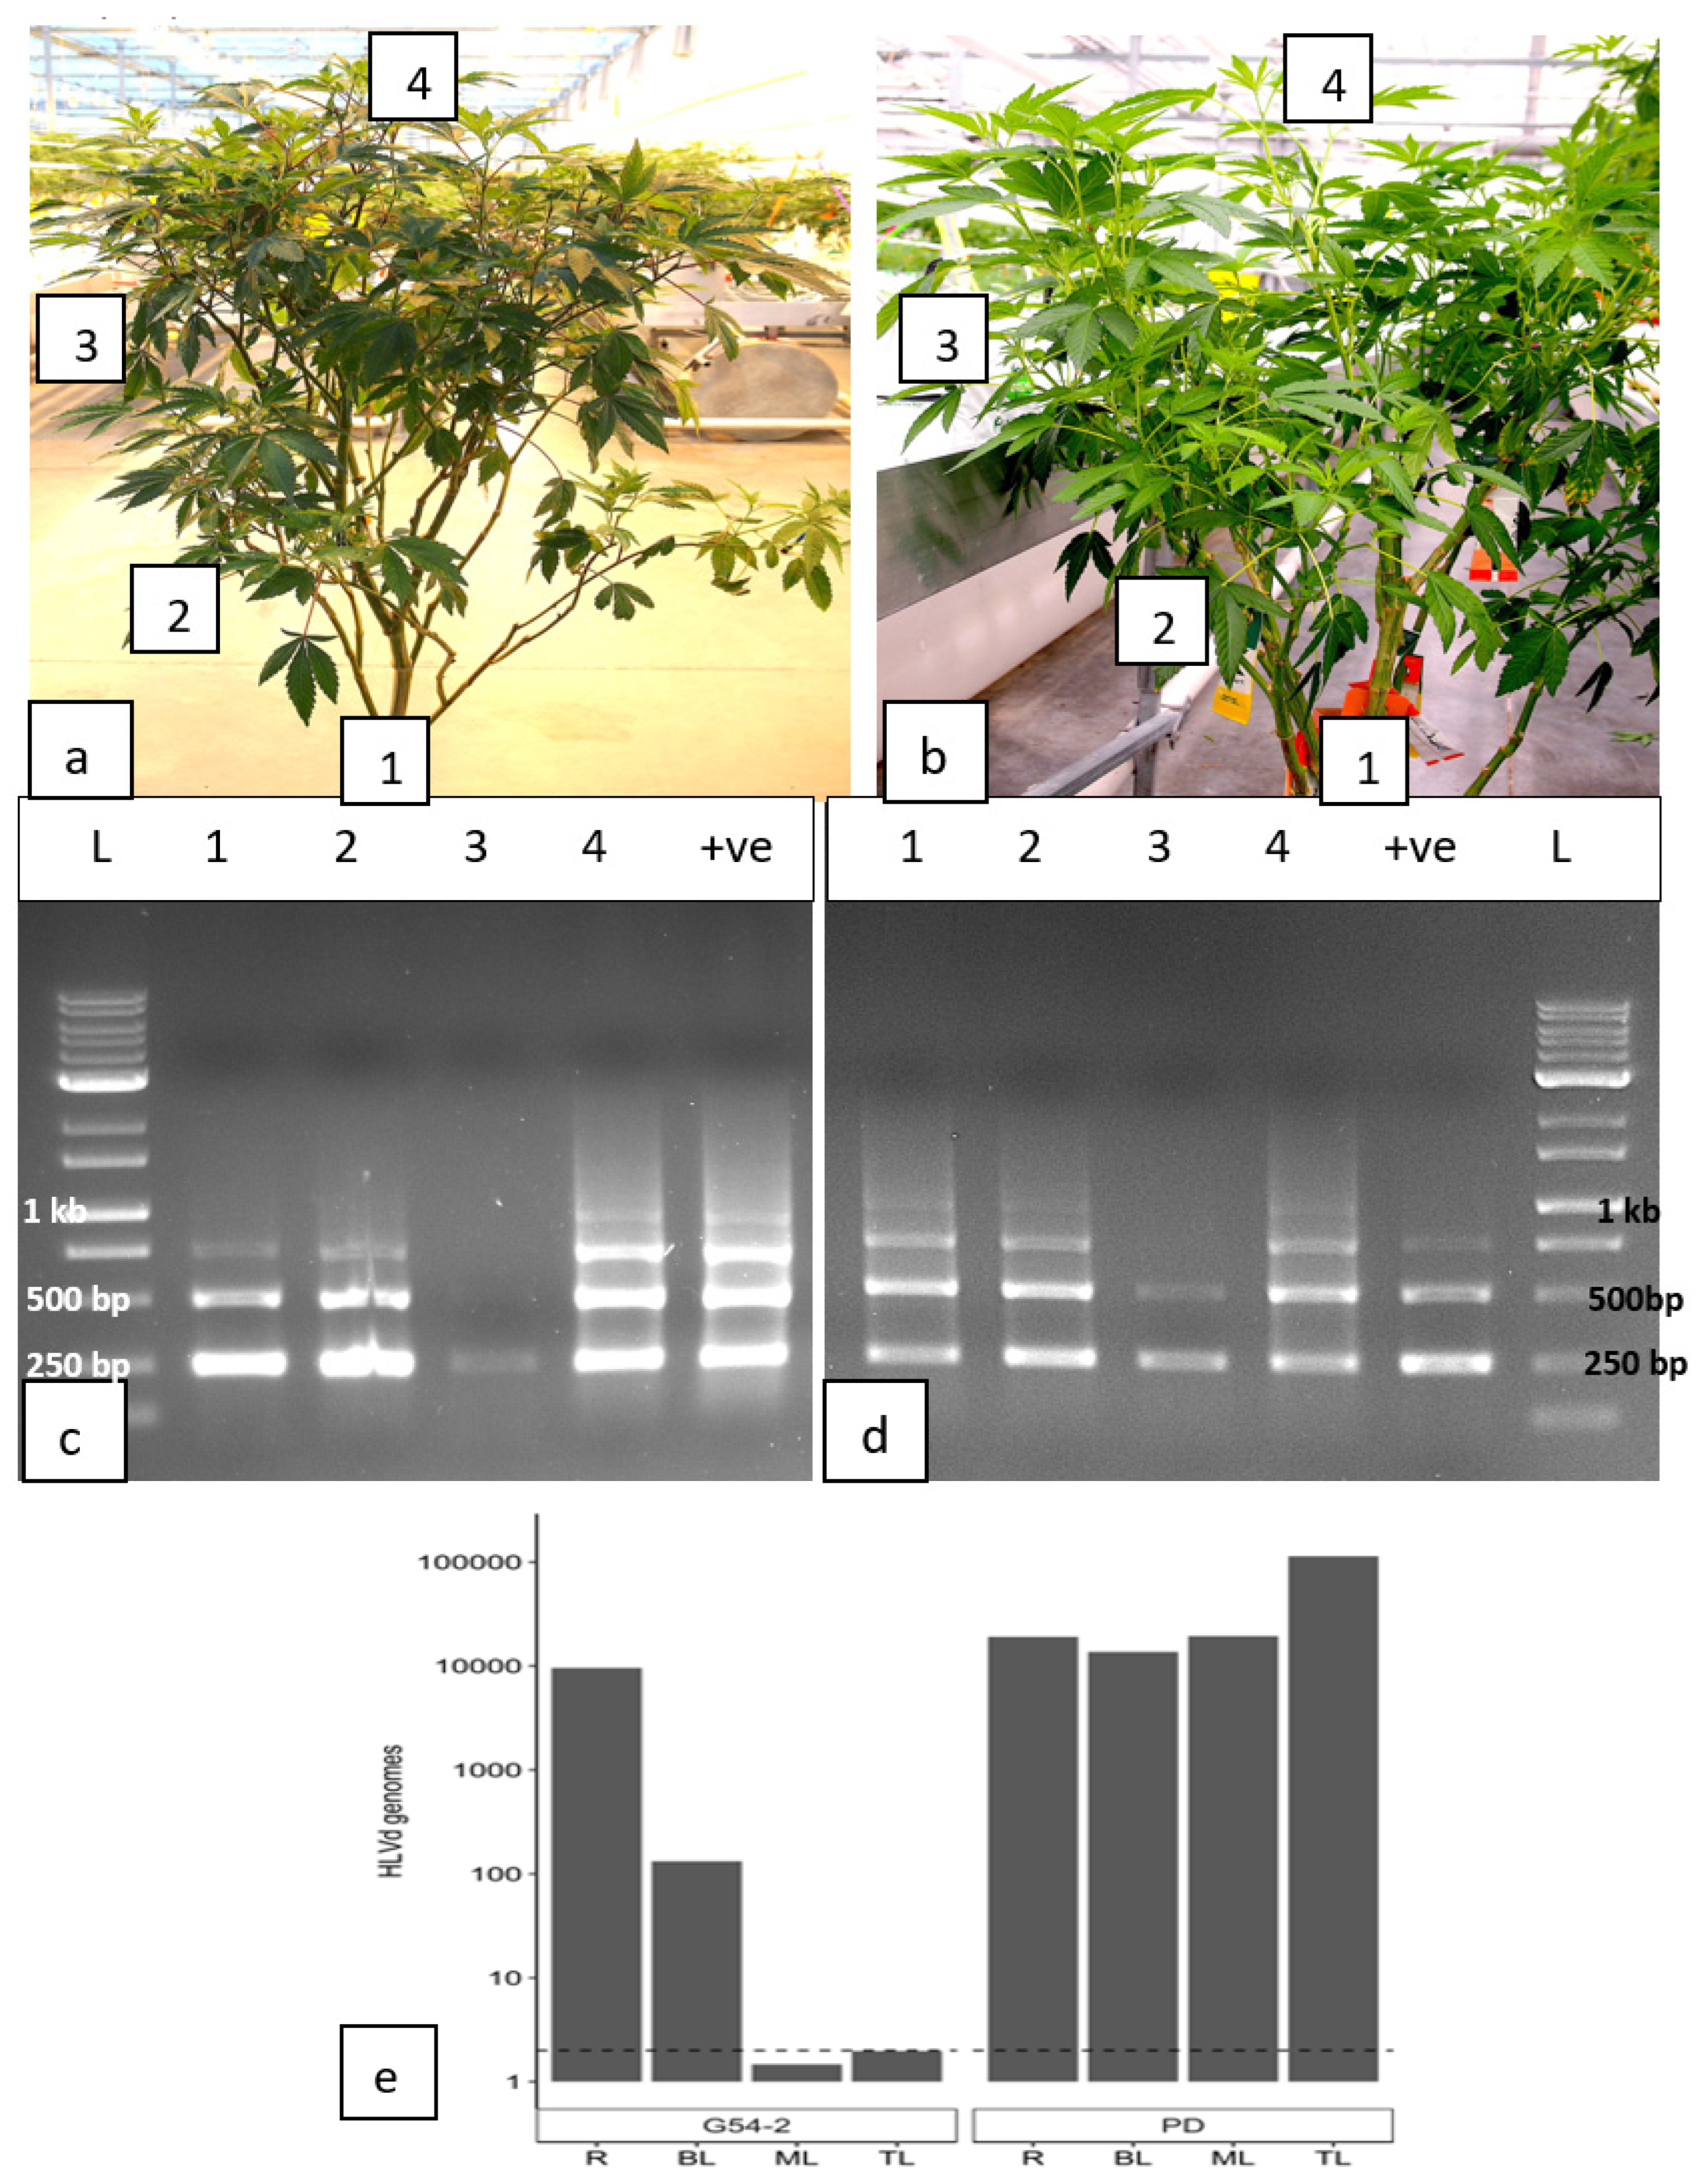
Analysis of 3-4 month old cannabis stock plants representing two genotypes for the presence of HLVd using RT-PCR and ddPCR. a) Samples of genotype G54-2 were taken from various positions in the canopy (labeled 1-3), as well as from roots (labeled 4). b) Sampling of genotype PD was conducted in the same manner. c) Genotype G54-2 shows presence of multiple bands corresponding to HLVd in samples of roots (1), bottom canopy leaves (2), and at the top of the plant (4). In the middle canopy leaves (3), only a very faint band was observed. d) Genotype PD shows HLVd presence in samples of roots (1), bottom canopy leaves (2), middle canopy leaves (3) and top canopy leaves (4). e) ddPCR of samples of roots (R), bottom canopy leaves (BL), middle canopy leaves (ML) and top canopy leaves (TL) of genotypes G54-2 (left) and PD (right). HLVd was detected in the roots and bottom leaves of G54-2, but not in the middle (ML) and top (TL) leaves. HLVd was present in all tissue samples from PD.
Figure 15.
Analysis of the distribution of HLVd in cannabis inflorescence tissues and estimation of viroid genome copies by ddPCR. a) Cannabis inflorescences of genotype ‘Mac-1’ displaying symptoms of infection due to HLVd (left) compared to an asymptomatic (healthy) inflorescence (right). b) The terminal inflorescences were dissected and a schematic drawing shows the distribution of the various tissue types that were sampled. c) Dissection of the fan leaves (FL) and inflorescence leaves (IL) shows the stripped inflorescence flower (SF). All dissected tissues and foliage leaves (PL) were analysed for HLVd by ddPCR. d) HLVd viroid genome copies seen in different inflorescences tissues shows highest accumulation in the SF tissues. The horizontal dashed line is the detection threshold of HLVd – samples measured at or below this threshold are presumed to be HLVd negative. HLVd measurements were normalized to the cannabis housekeeping gene EF1- and standardized to HLVd levels in the healthy genotype PK.
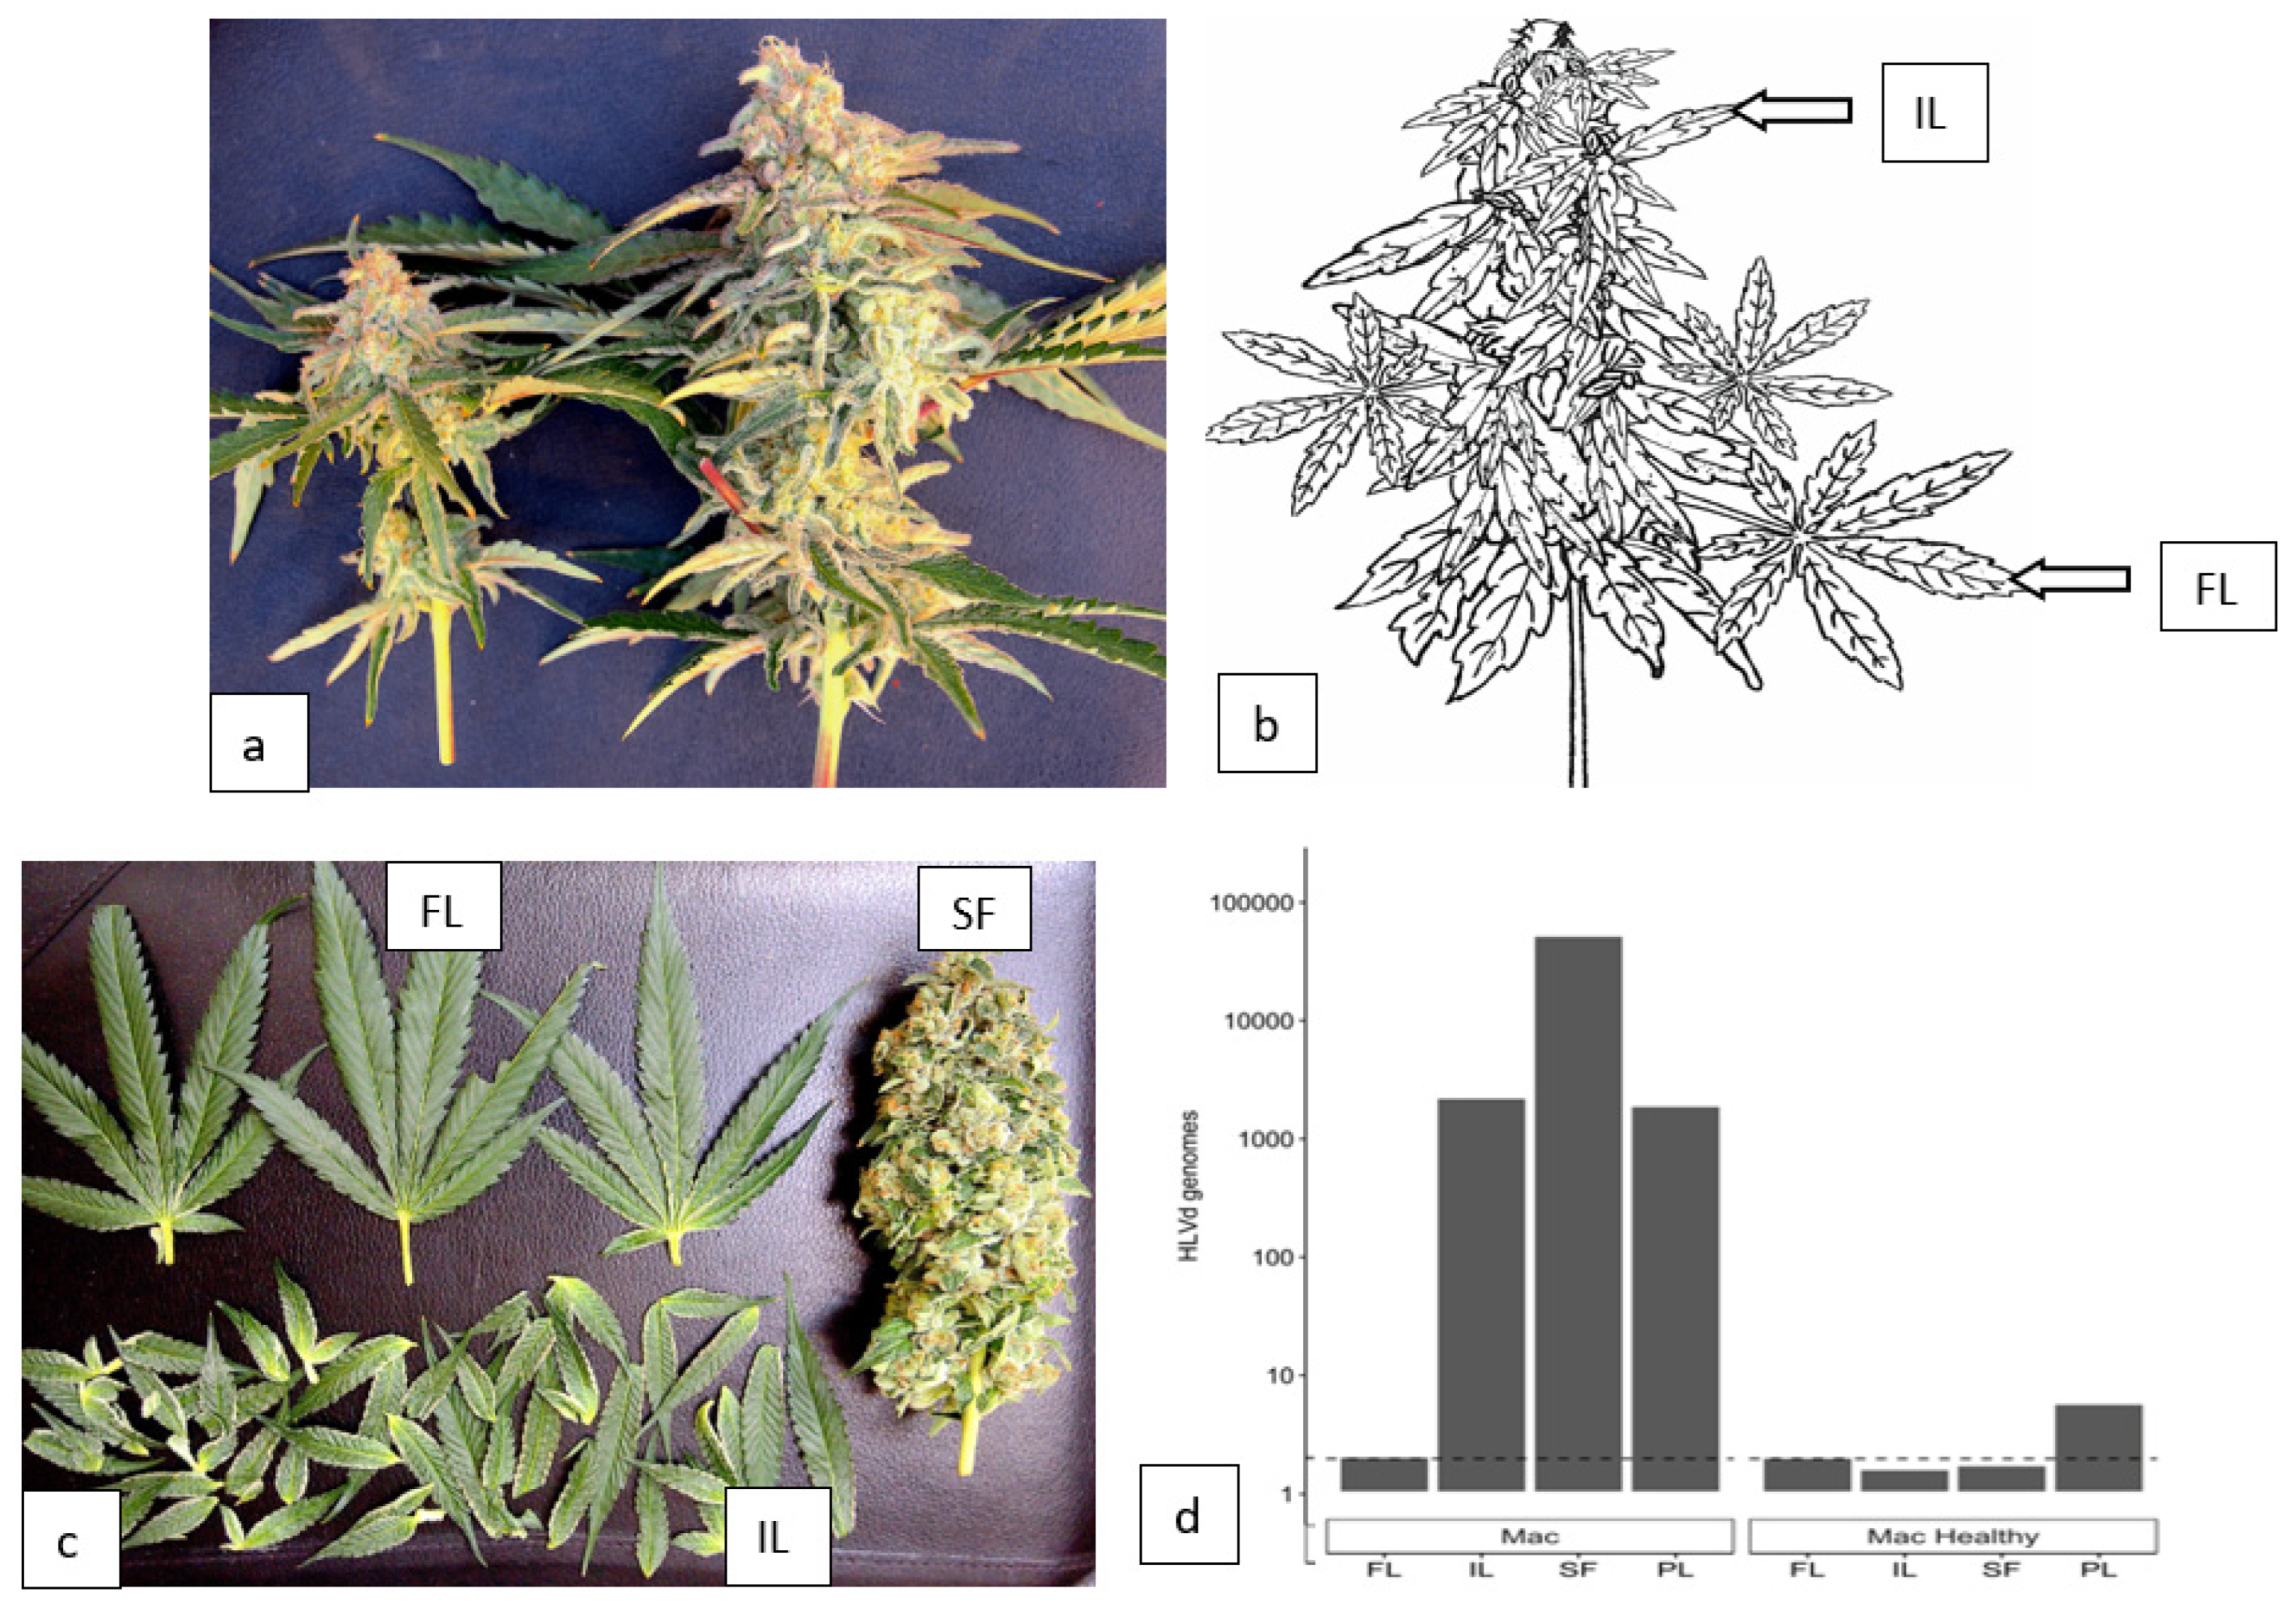
Figure 17.
a) Fresh (left) and dried (right) inflorescences from cannabis plants after harvest were subjected to molecular diagnostics in this study. b) From a total of 20 samples, 9 were shown to be infected by fungal pathogens and 7 by HLVd. c) RT-PCR analysis for HLVd presence in 10 dried cannabis samples shows 7 are positive. Multiple bands on the gels are characteristic for the viroid.
Figure 18.
RT-PCR analysis of individual seeds derived from a cross between an infected ‘Mac 1’ female cannabis plant and pollen from a male plant. a) Gel shows presence of HLVd in a majority of the seeds. Whole seeds were extracted so it was not determined if the viroid was present on the seed coat or borne internally. There are differences in the band intensity between different seeds, potentially reflecting variable viroid levels between seeds. b) Presence of CasaMV1 was detected in all seeds derived from an infected ‘Mac 1’ female parent that were tested.
Figure 19.
Cannabis plants with symptoms of Beet curly top virus infection were subjected to molecular diagnostics in this study. a, b) Indoor-grown plants. c-f) Outdoor plants of four different genotypes show varying symptoms attributed to BCTV. Confirmation of virus presence was achieved by RT-PCR with universal primers for BCTV.
Figure 20.
Confirmation of the presence of BCTV in samples of cannabis plants from indoor production. The BCTV-Wor strain was detected (lane 2). Lane 1 = BCTV universal primer, lane 3 = BCTV-Severe, Lane 4 = BCTV-Colorado.
Figure 20.
Confirmation of the presence of BCTV in samples of cannabis plants from indoor production. The BCTV-Wor strain was detected (lane 2). Lane 1 = BCTV universal primer, lane 3 = BCTV-Severe, Lane 4 = BCTV-Colorado.
Figure 21.
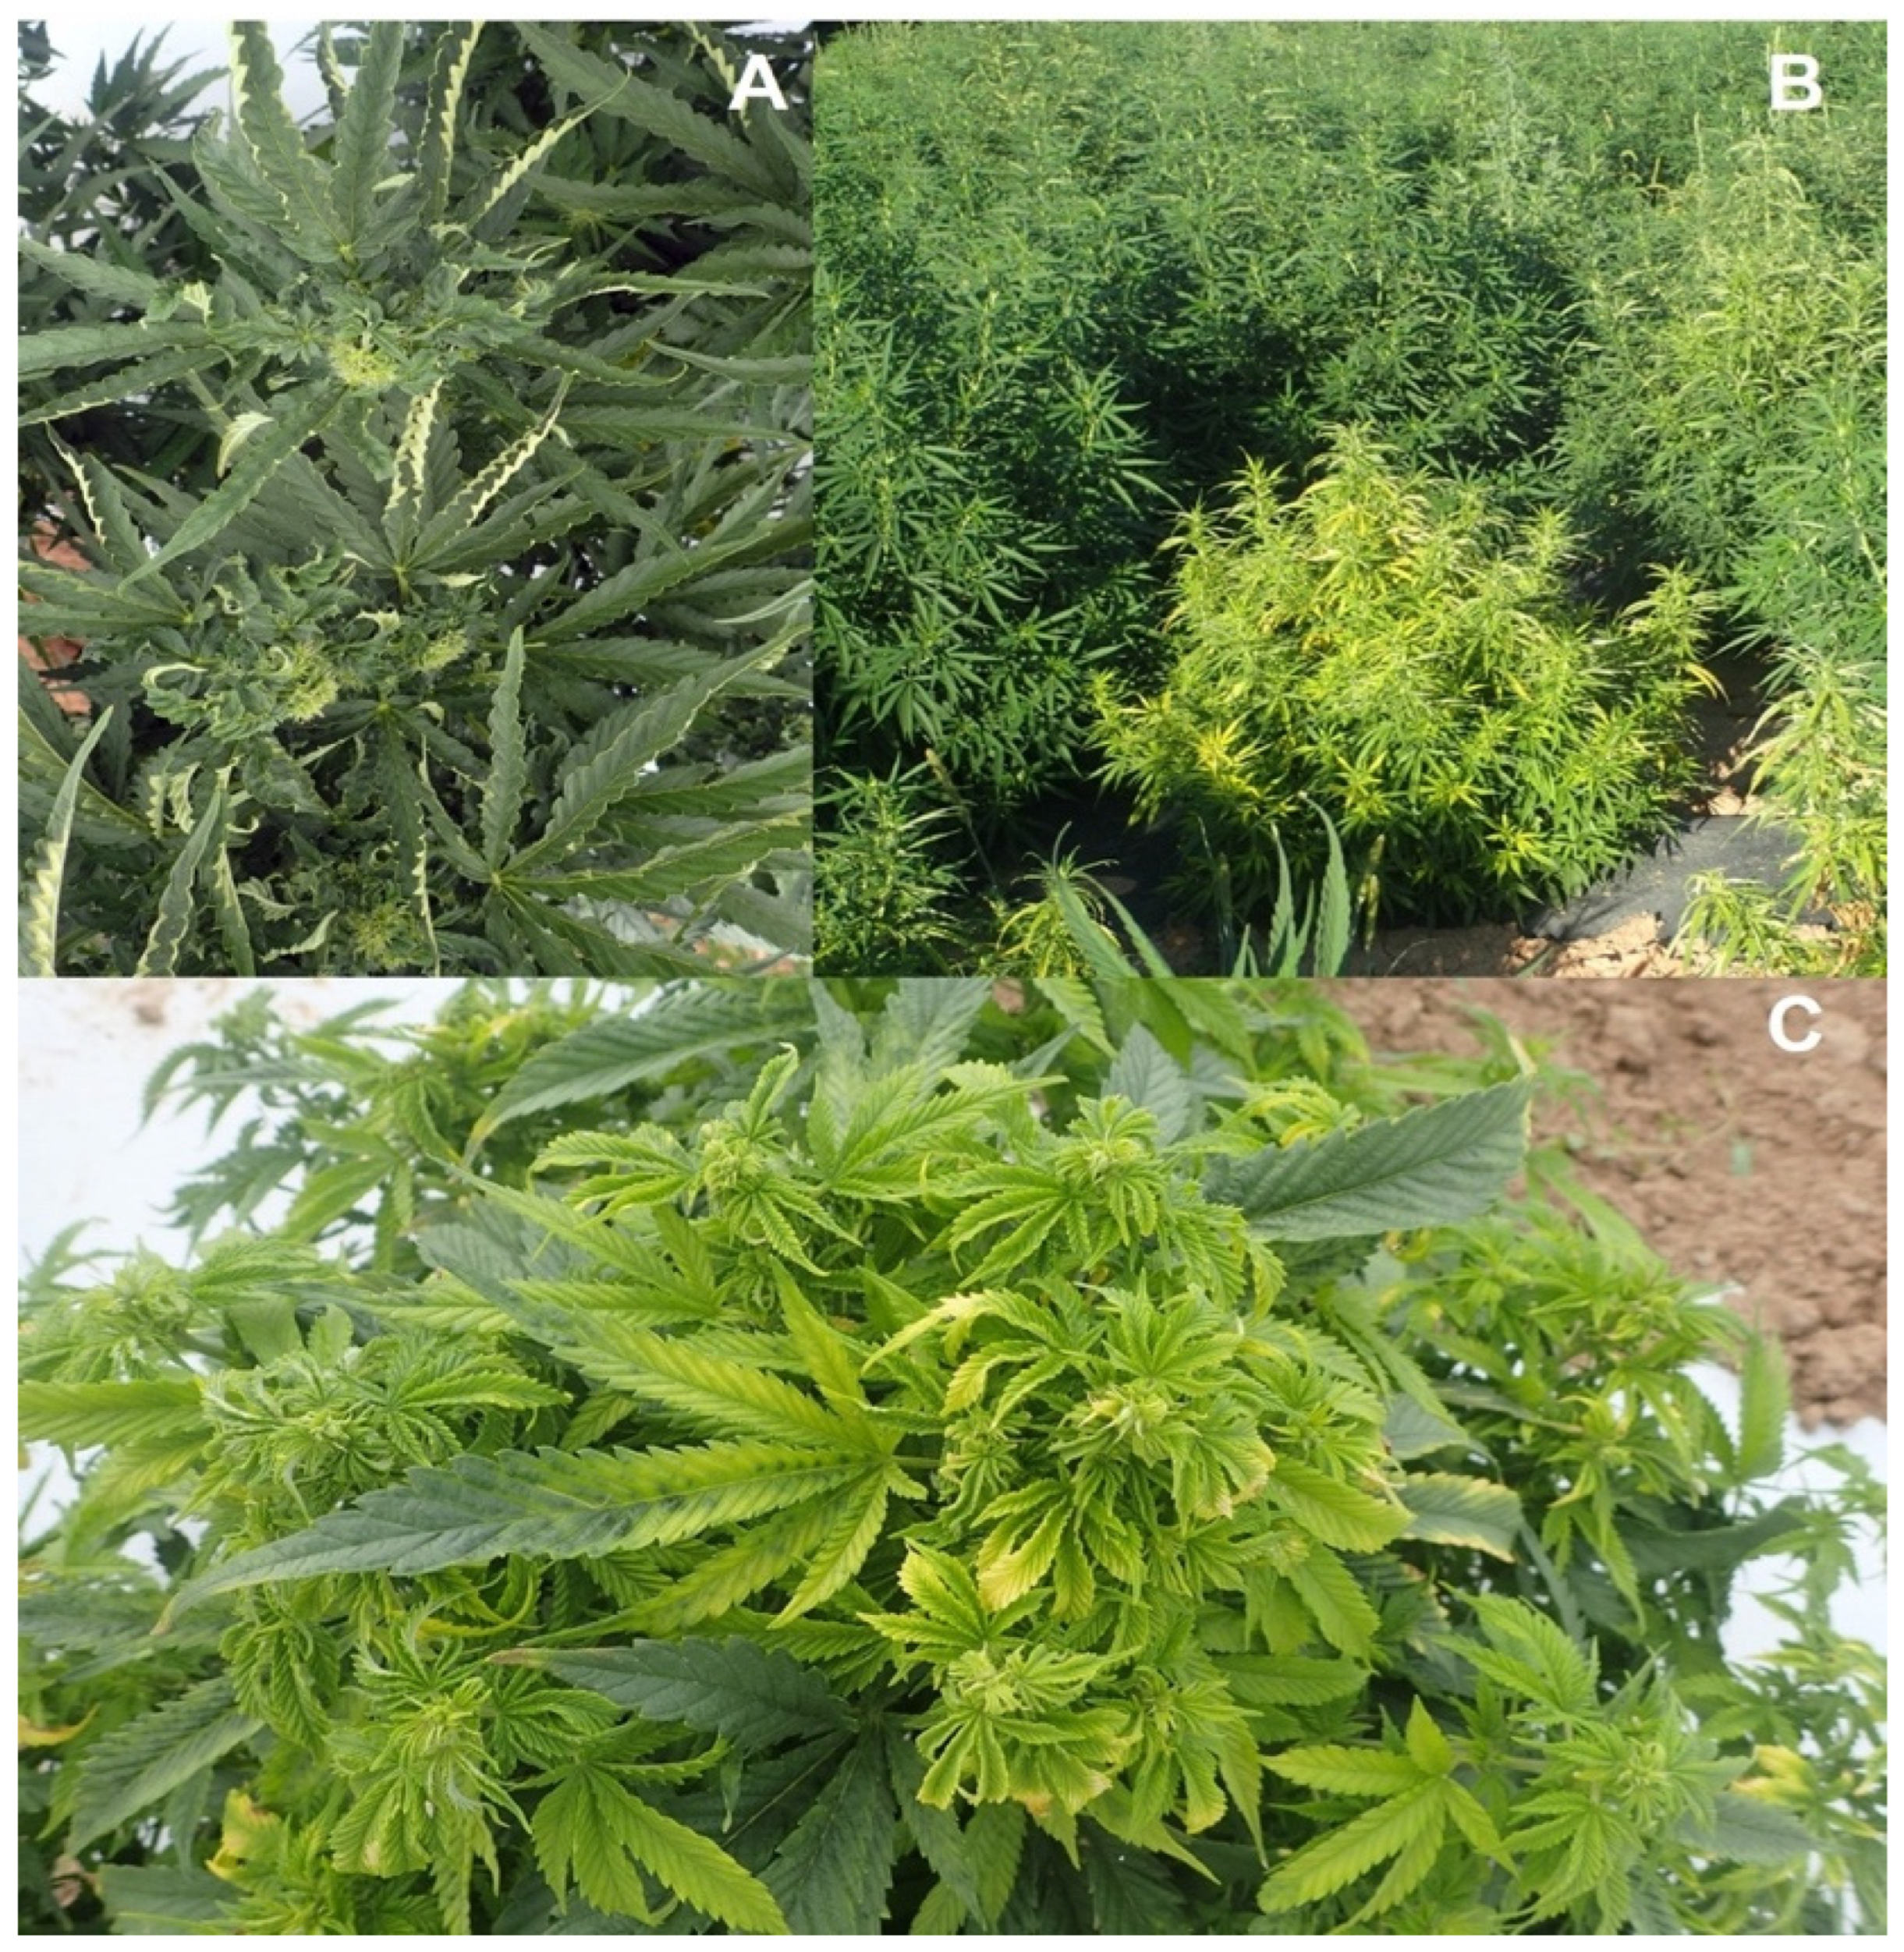
Symptoms of virus/viroid mixed infections on field-grown hemp plants sampled in this study. a) Curling and twisting of upper leaves on infected plants. b) Stunting and yellowing of infected plant. c) Chlorosis, twisting and mosaic on infected leaves. (Photo credit : Whitney Cranshaw). The symptoms likely reflect combinations of viruses due to mixed infections in these affected plants.
Figure 22.
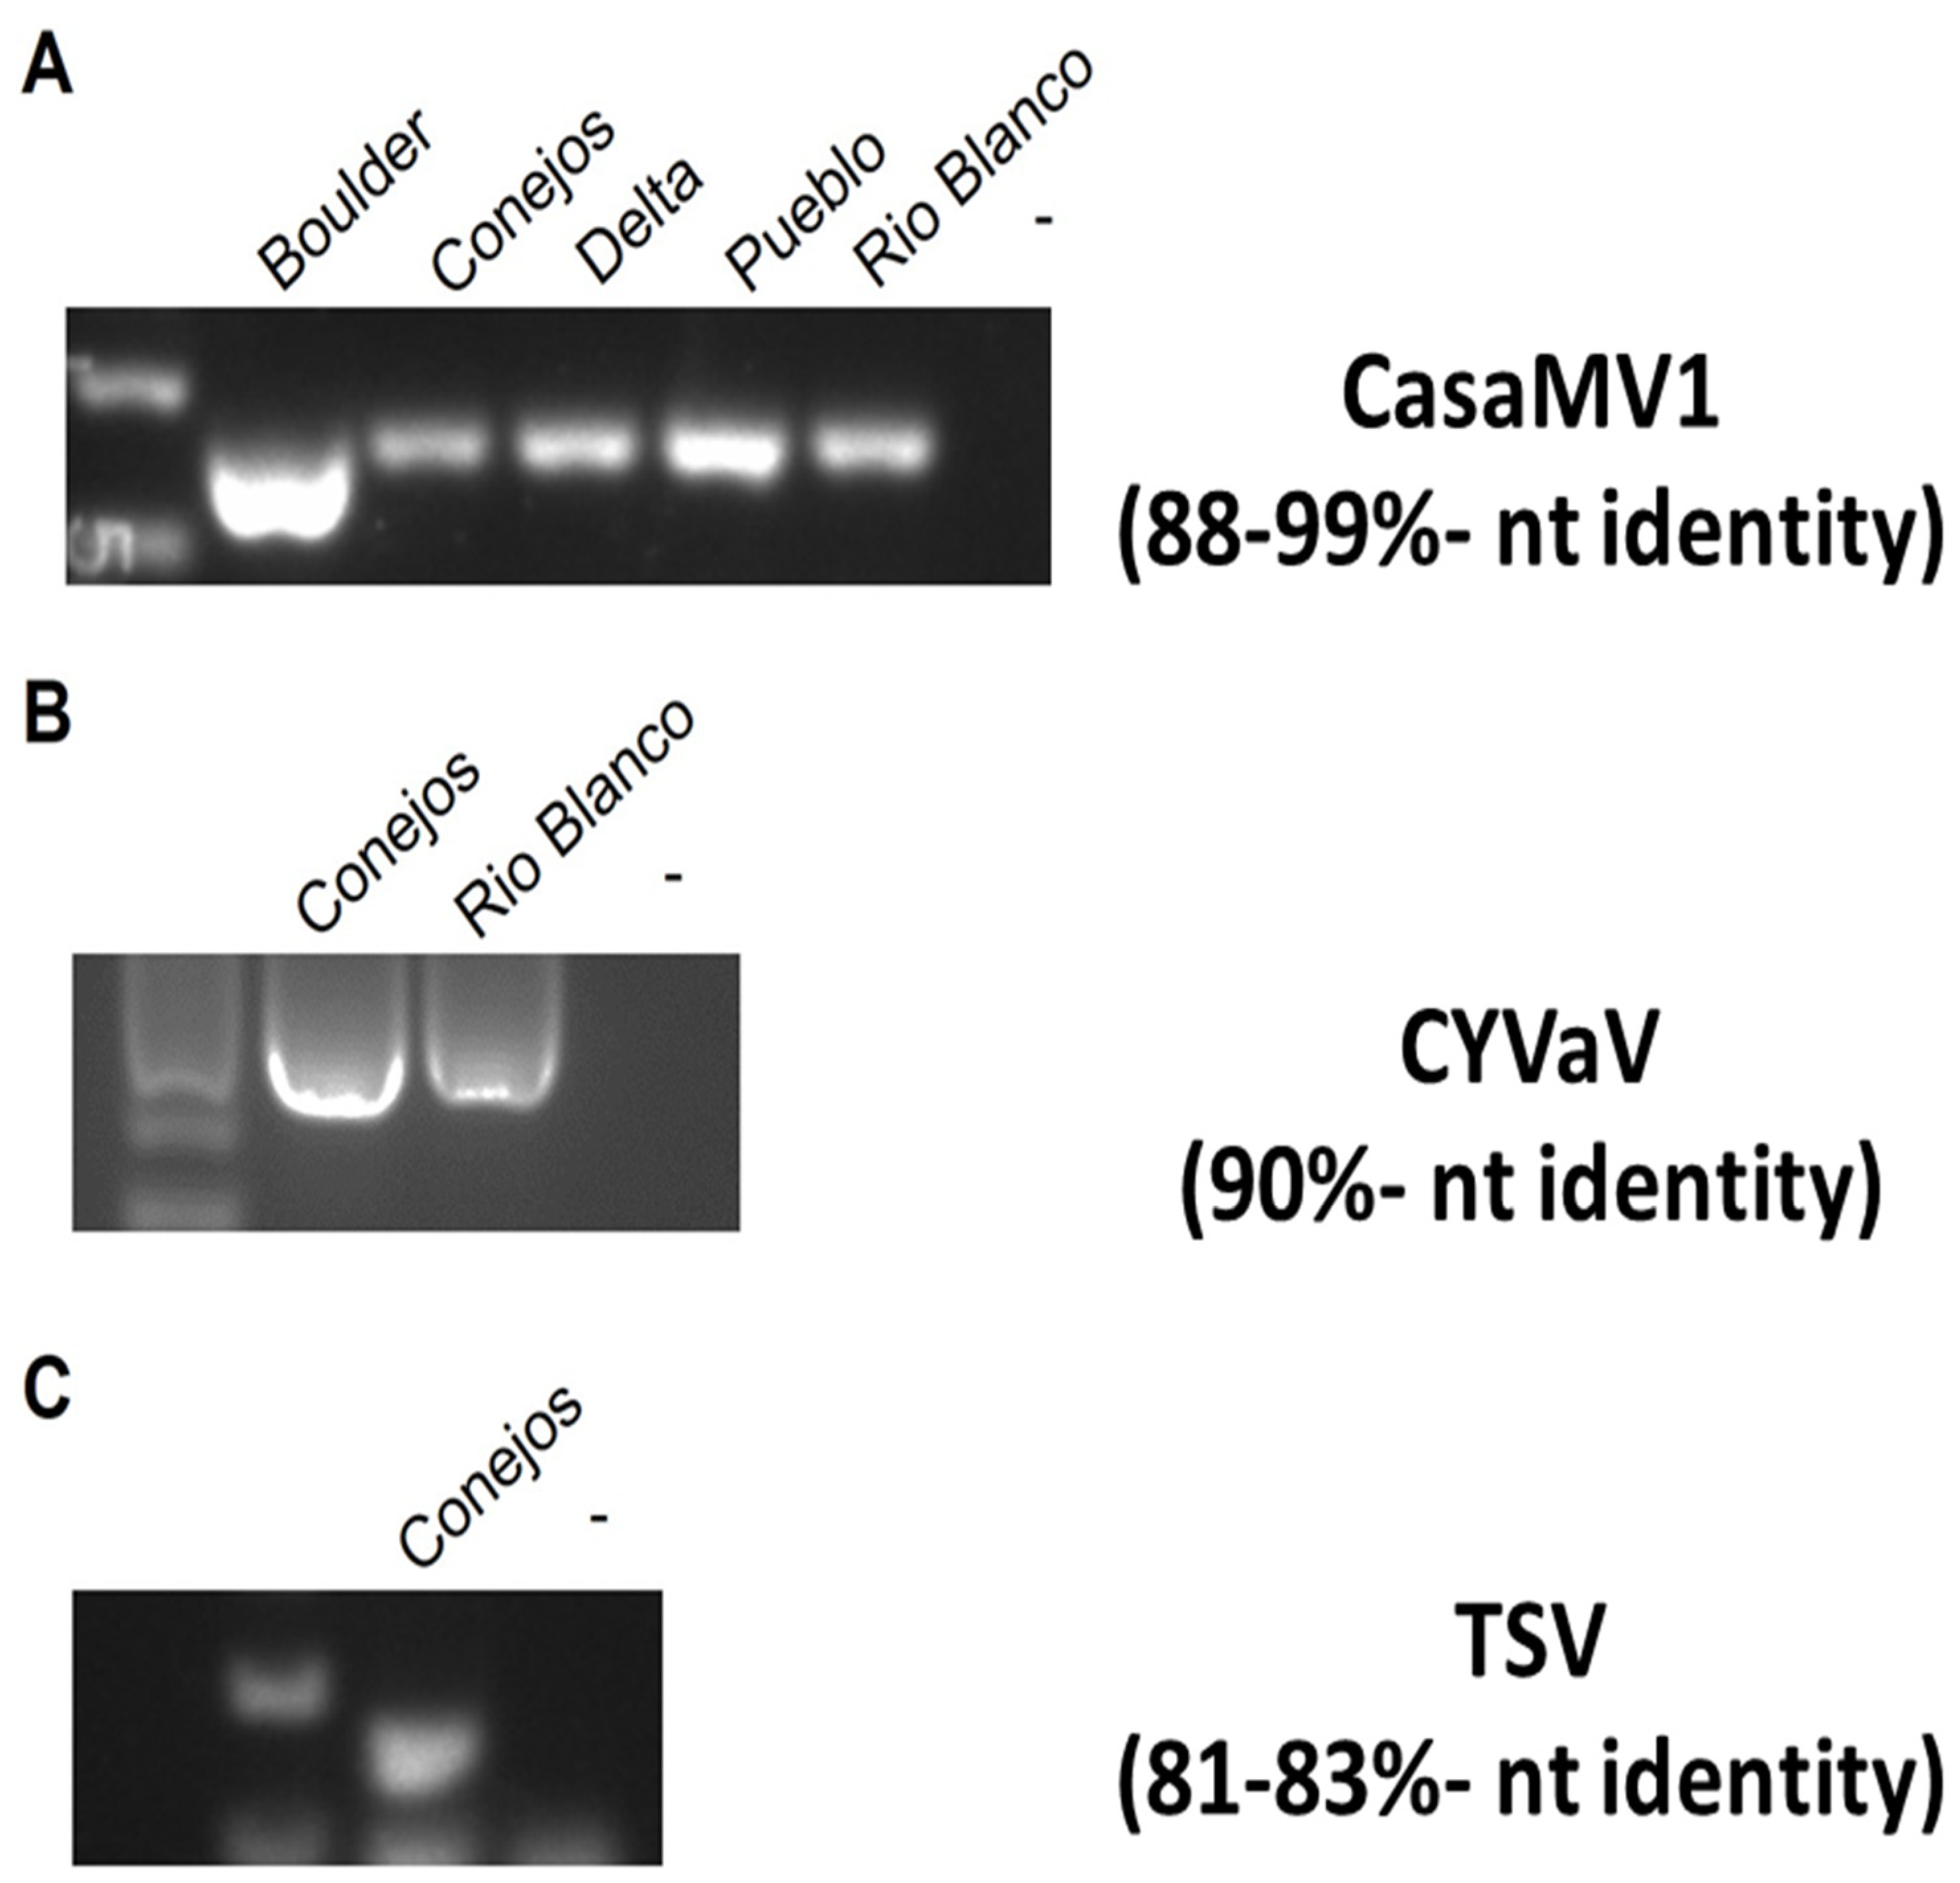
Detection of viruses in hemp plants in Colorado using RT-PCR with virus-specific primers. (a) Cannabis sativa mitovirus (CasaMV1). (b) Citrus yellow vein-associated virus (CYVaV). (c) Tobacco streak virus (TSV). Water (-) was used as a negative control. Modified from Chiginsky et al. [
23].
Figure 23.
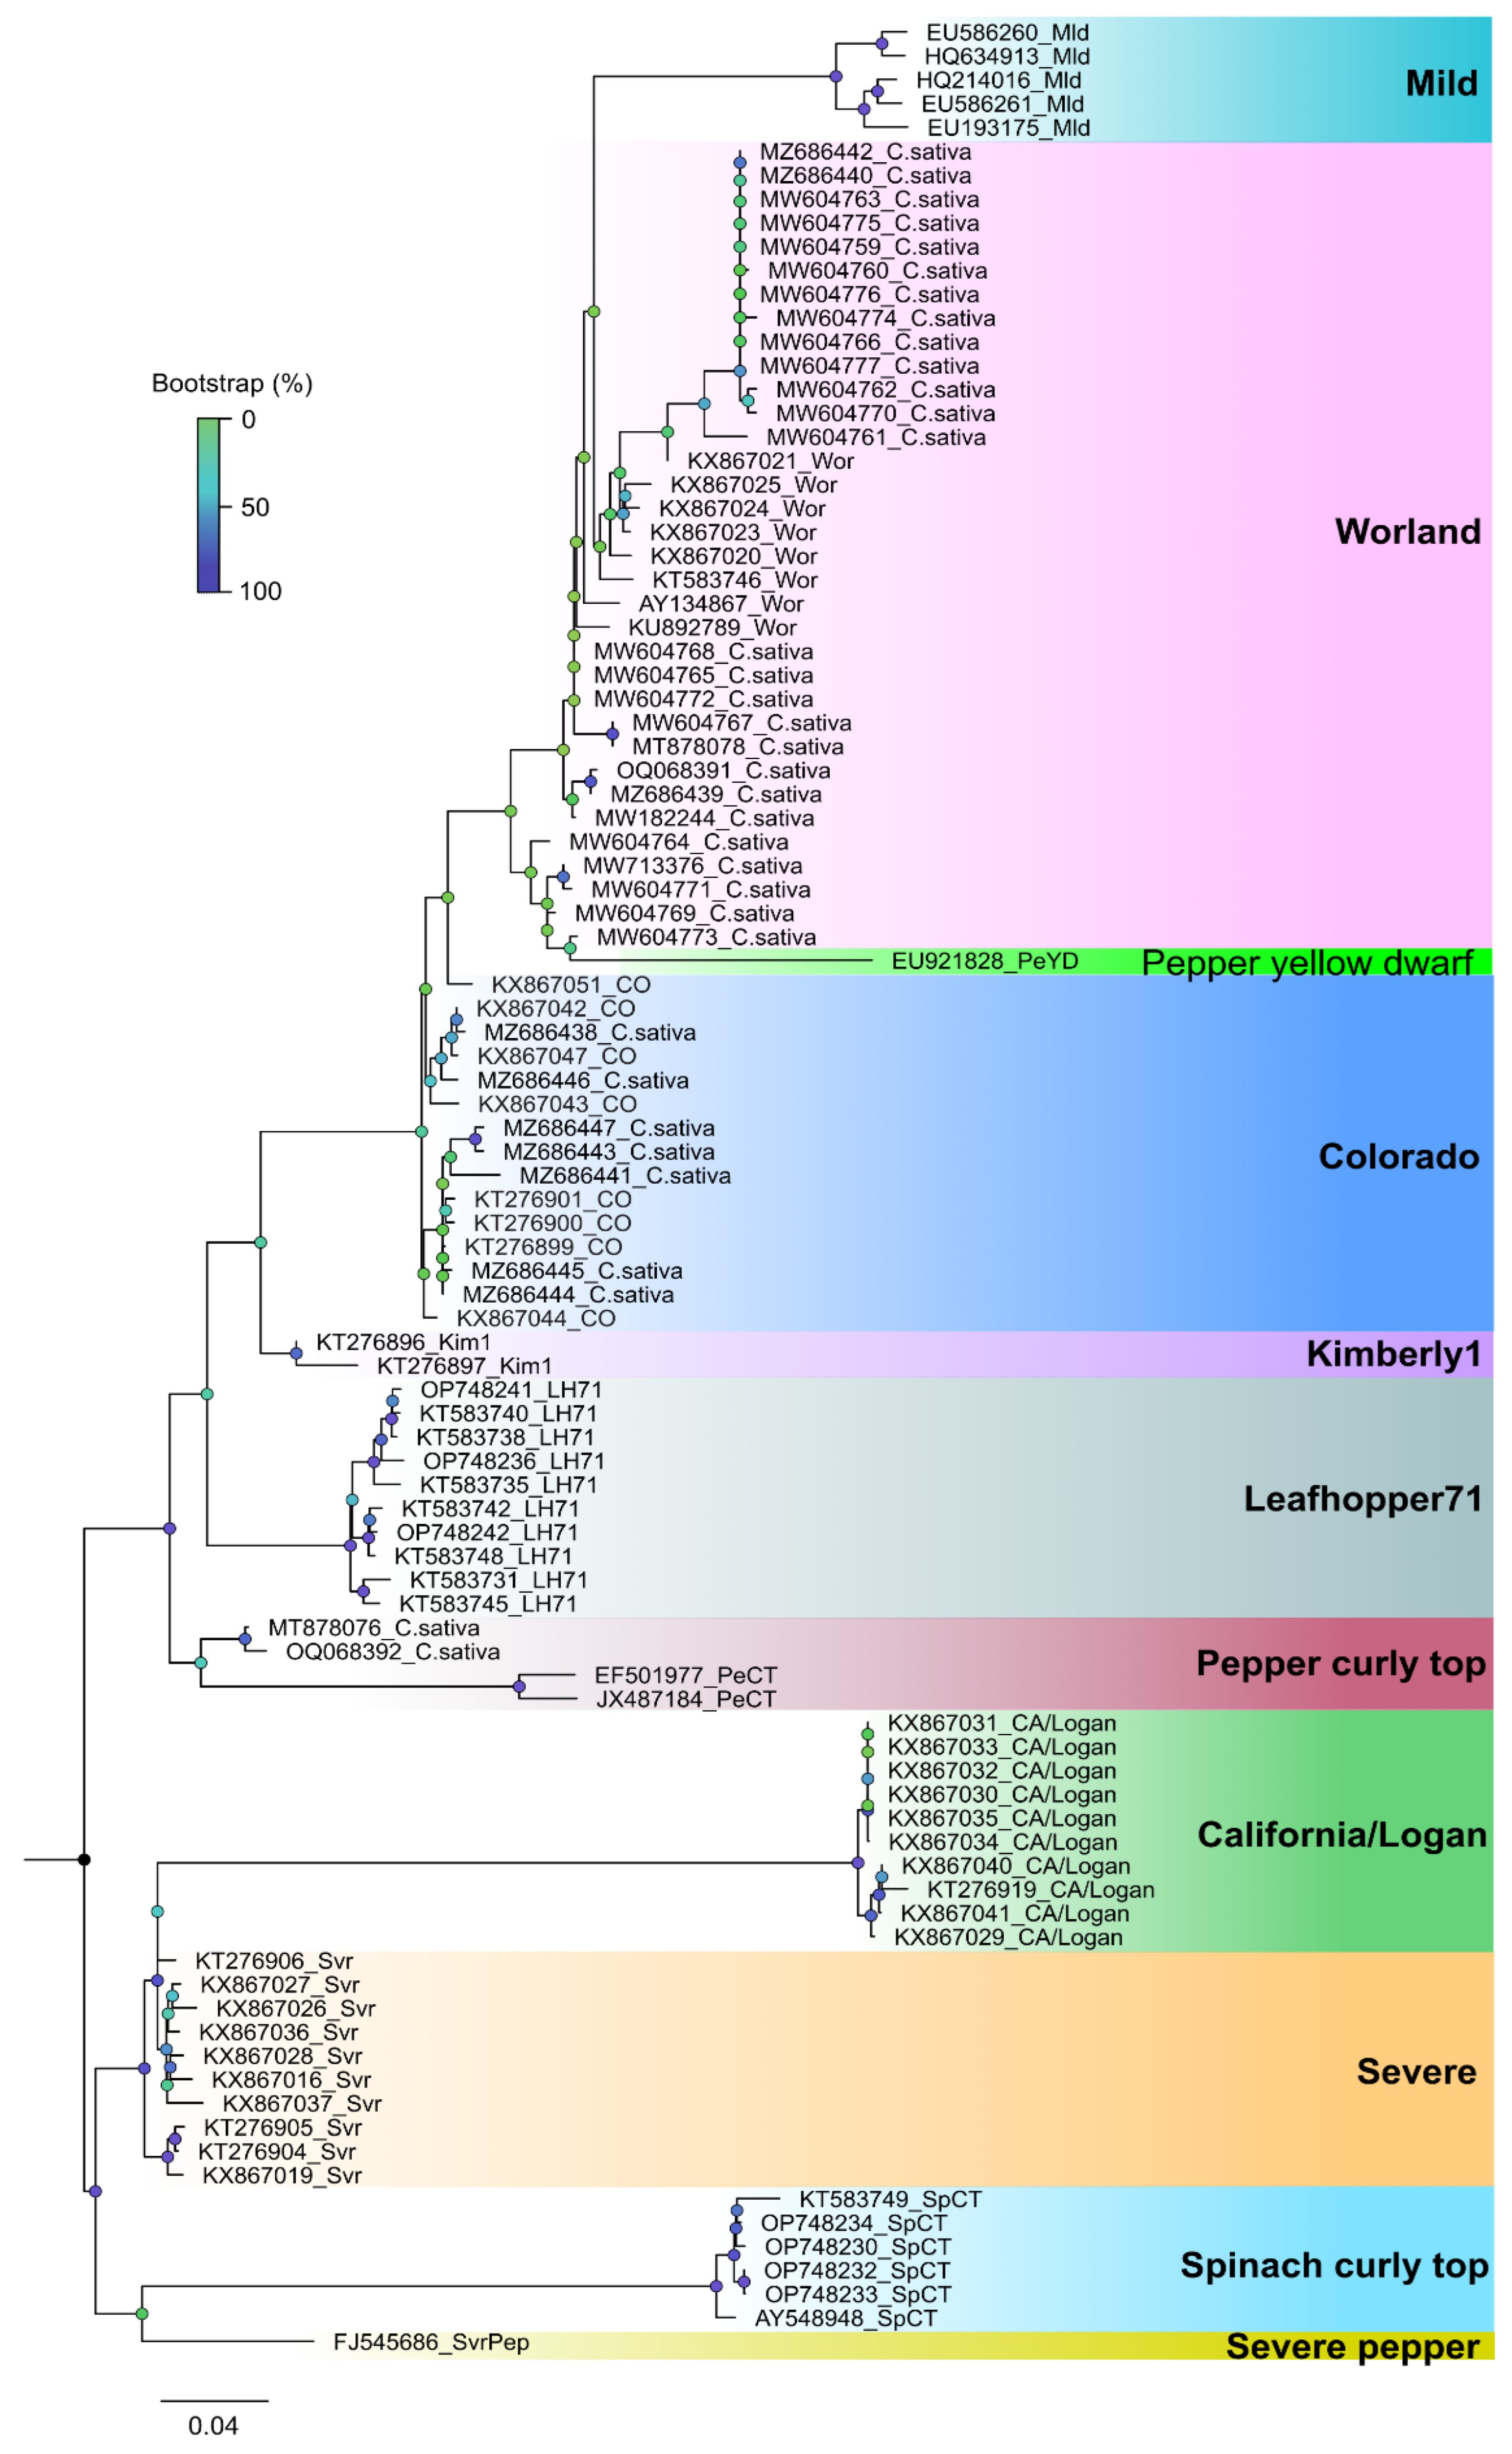
Phylogenetic analysis of partial coat protein sequences of beet curly top virus (BCTV) obtained from hemp samples and other BCTV sequences representing the 11 strains available in GenBank. Multiple sequence alignments were performed using MAFFT v7.505 and the poorly aligned regions were trimmed using TrimAI v1.2.59. The phylogenetic tree was constructed using the Maximum Likelihood method implemented in the RAxML v8.2.12 with GTR+G+I model for nucleotide substitution through the CIPRES Science Gateway Environment. BCTV strains, California/Logan; Colorado; Kimberly 1; Mild; Leafhopper 71; Pepper curly top; Pepper yellow dwarf; Severe; Severe pepper; Spinach curly top; Worland.
Figure 24.
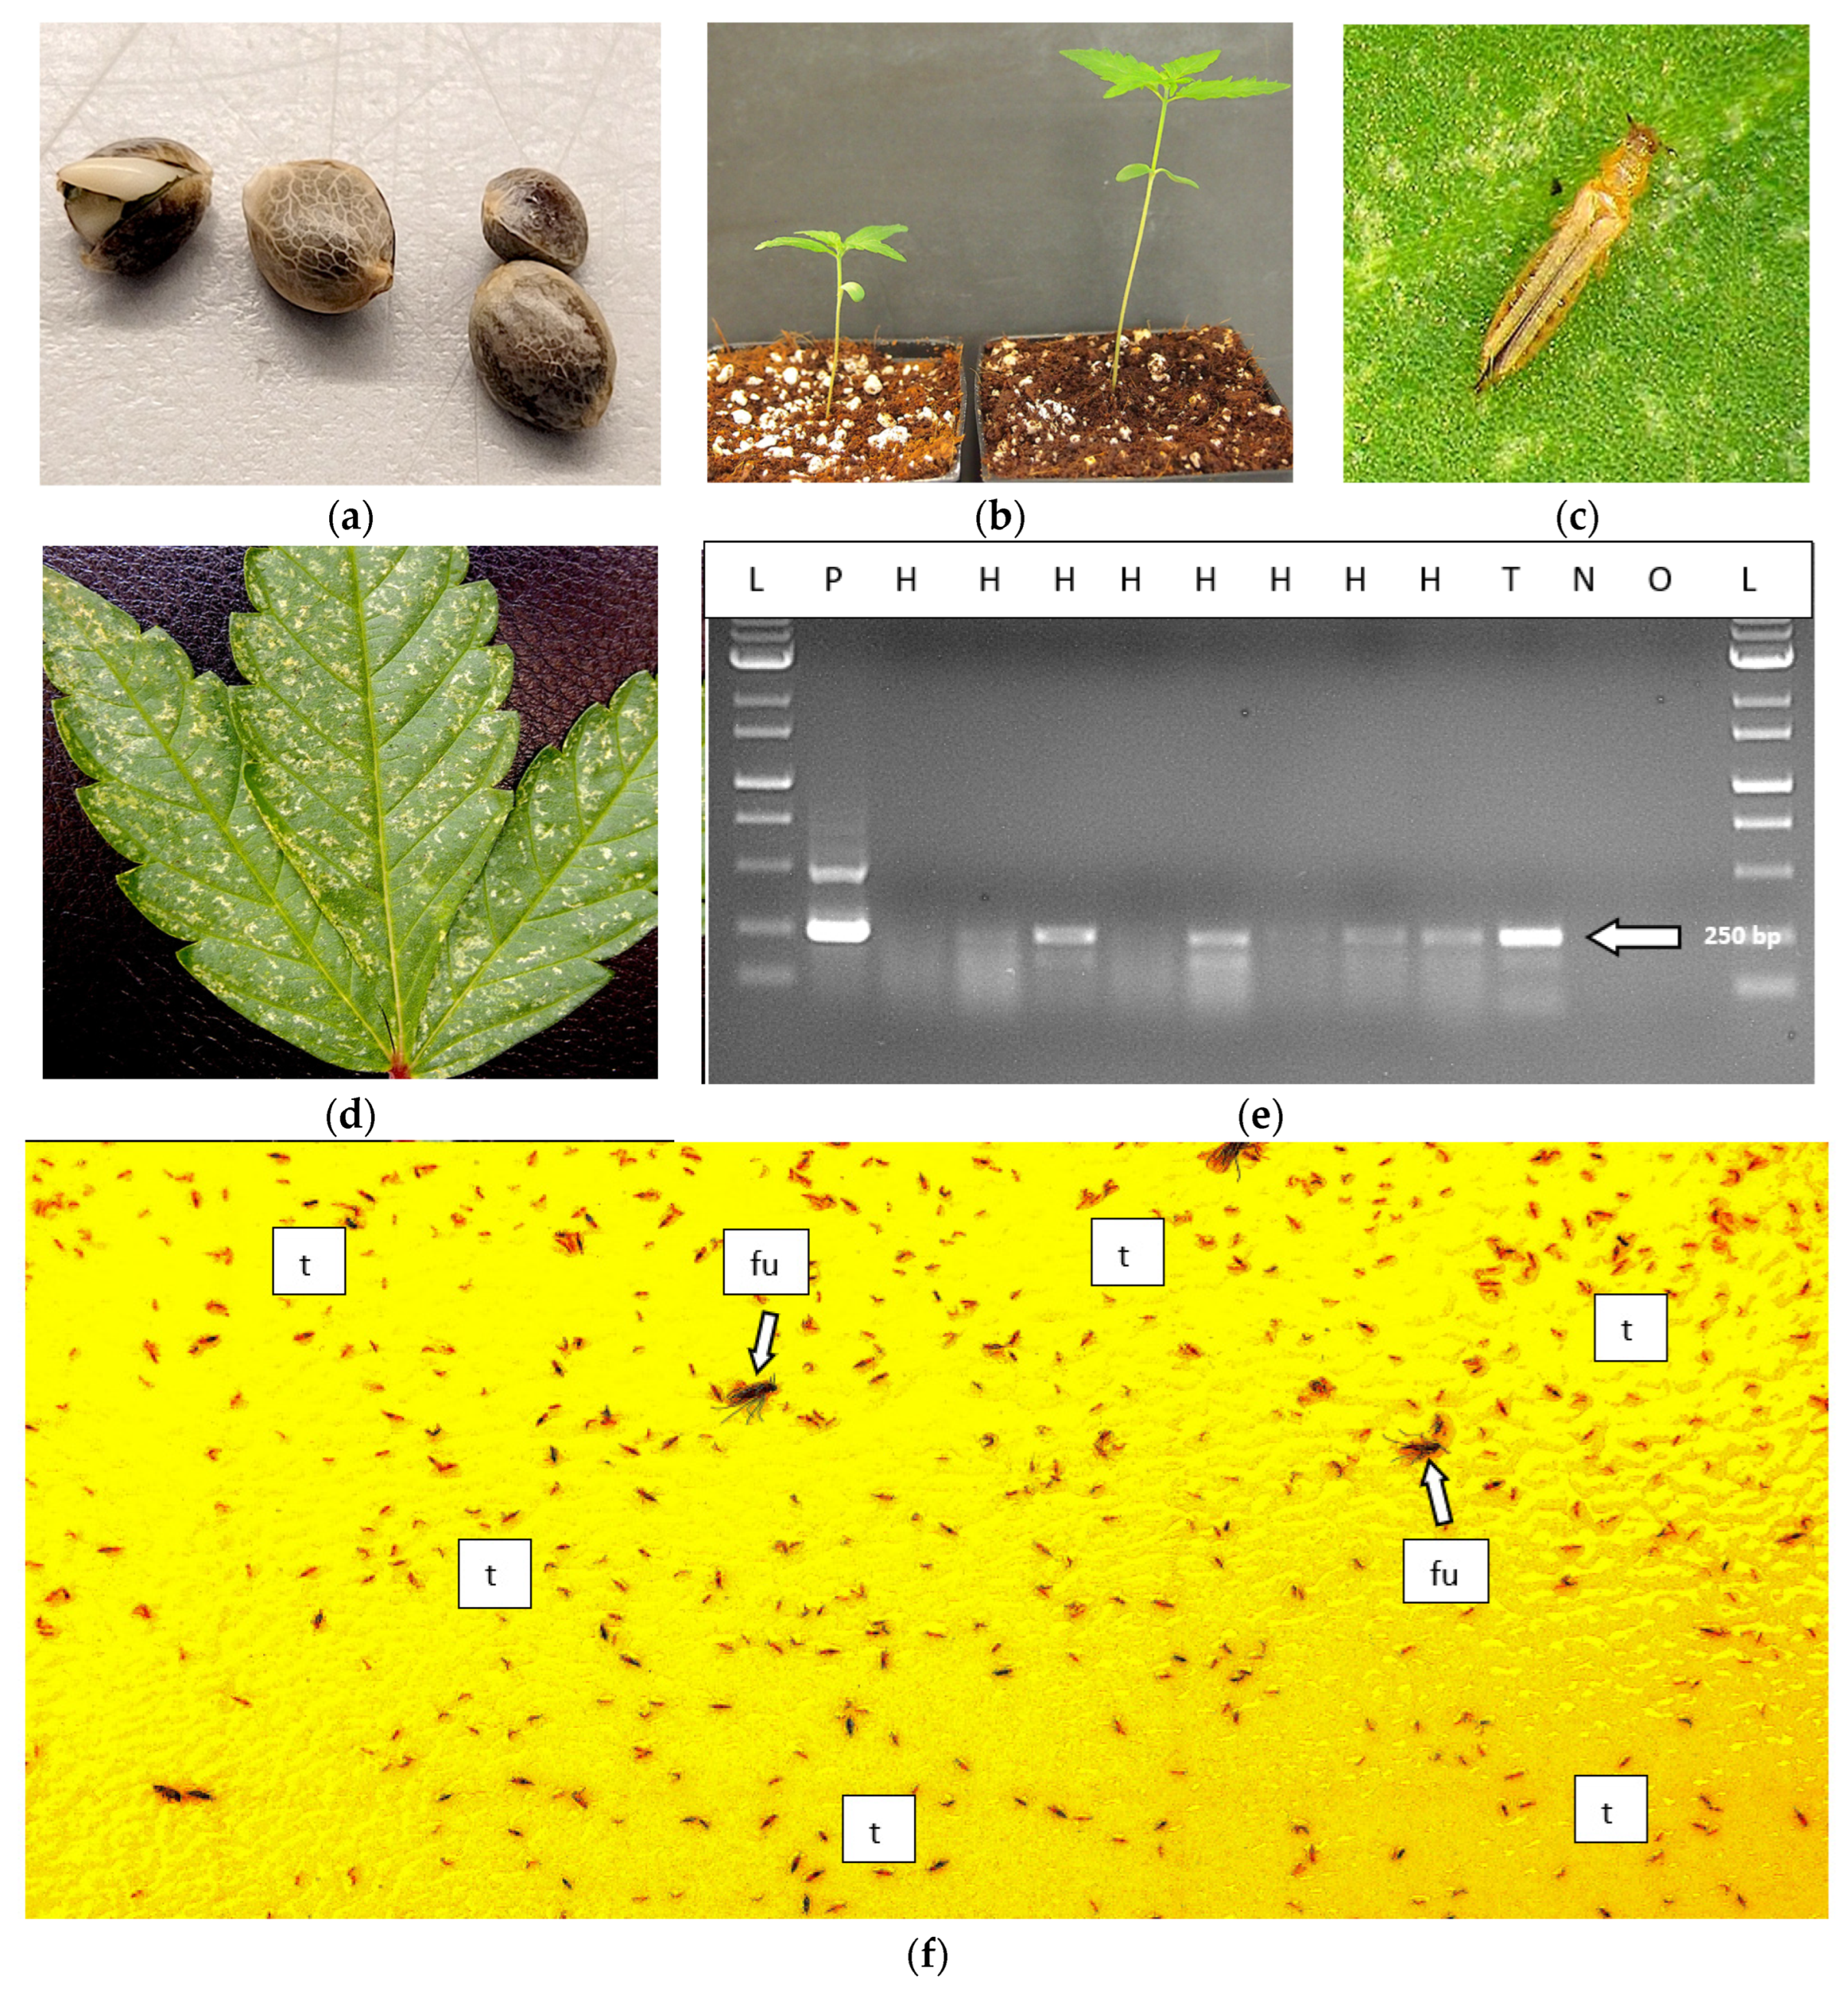
Detection of HLVd on seeds of hemp and on thrips feeding on infected hemp seedlings using RT-PCR. (a) Seeds were soaked for 24 hr and used in the analysis. (b) Growth of two seedlings from infected seeds after 2 weeks that both tested positive for HLVd. (c) Close-up image of an adult thrip on a hemp leaf (source: Trifecta Natural). (d) Extensive thrips damage on a cannabis leaf. e) RT-PCR results of hemp seeds showing that 4 out of 8 seeds tested positive for HLVd. Lanes H = hemp seed samples, T = thrips, L = molecular weight ladder, P = positive control for HLVd, N = negative control (no HLVd present), O = water. f) A yellow sticky trap placed in a greenhouse containing flowering cannabis plants shows the high numbers of thrips (t) that may be present. Also shown are fungus gnats (fu, arrow) which have not been implicated in transmission of HLVd but are commonly found in greenhouses.
Table 1.
Detection of a viroid and virus in cannabis genotypes HB and OG by high throughput sequencing.
Table 1.
Detection of a viroid and virus in cannabis genotypes HB and OG by high throughput sequencing.
| Cannabis |
Genotype HB |
Genotype HB |
Genotype OG |
Genotype OG |
| Pathogen |
HLVd |
CasaMV1 |
HLVd |
CasaMV1 |
| Genome size (kb) |
256 |
2,752 |
256 |
2,748 |
| Total reads in sample |
10,586 |
402,487 |
24,120 |
101,117 |
| Reads per million |
4,248 |
161,500 |
8,507 |
35,664 |
Reads per million per kb
Average sequencing depth |
16,593
4,549 |
58,685
19,775 |
33,231
10,241 |
12,978
4,912 |
Table 2.
Selected HLVd primers used for this study.
Table 2.
Selected HLVd primers used for this study.
| Target |
Primer |
Name |
Sequence 5’ – 3’ |
Source |
| HLVd |
Forward |
HLVd seq F1 |
ATACAACTCTTGAGCGCCGA |
Eastwell and Nelson [65] |
| Reverse |
HLVd seq R1 |
CCACCGGGTAGTTCCCAACT |
Eastwell and Nelson [65] |
| Reverse |
HLVd seq R2 |
AGGACGCGAACAAGAAGAAG |
This work |
| Forward |
HLVd quant F1 |
GTTGCTTCGGCTTCTTCTTG |
This work |
| Reverse |
HLVd quant R1 |
AGTTGTATCCACCGGGTAGT |
This work |
| Cannabis EF1α
|
Forward |
Cannabis EF1α F |
TGTTTTGCACGGATCAGTTTG |
Guo [66] |
| Reverse |
Cannabis EF1α R |
|
Guo [66] |
Table 3.
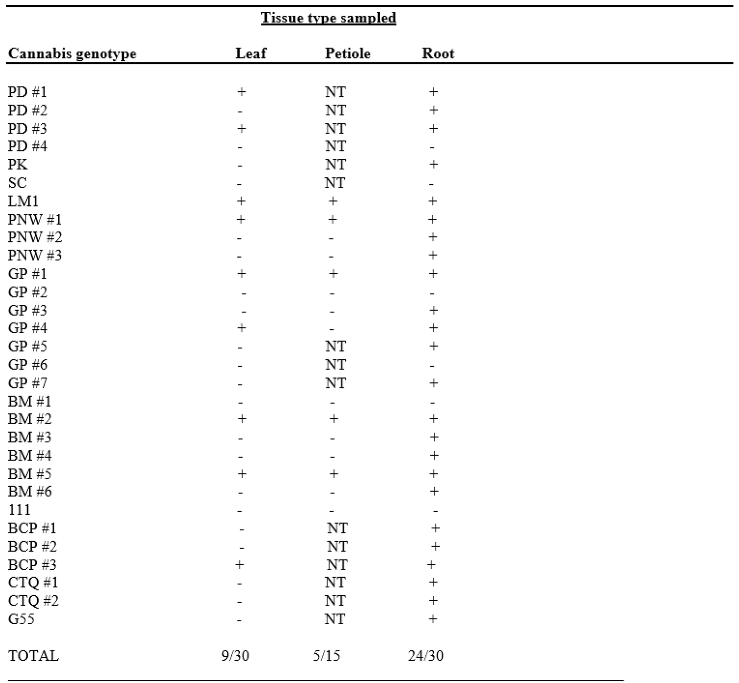
Comparative detection of Hop latent viroid in leaf, petiole and root samples of stock plants of 11 cannabis genotypesa.
Table 3.
Comparative detection of Hop latent viroid in leaf, petiole and root samples of stock plants of 11 cannabis genotypesa.
Table 4.
Summary of virus/viroid pathogens identified from hemp fields in Colorado during 2019-2022.
Table 4.
Summary of virus/viroid pathogens identified from hemp fields in Colorado during 2019-2022.
| 2019 |
2021 |
2022 |
| Cannabis sativa mitovirus 1 |
Cannabis sativa mitovirus 1 |
Cannabis sativa mitovirus 1 |
Beet curly top virus,
strains CO, BCTV-Wor |
Beet curly top virus,
strains CO, BCTV-Wor |
Beet curly top virus,
strains CO, BCTV-Wor |
| Hop latent viroid |
Alfalfa mosaic virus |
Tomato bushy stunt virus |
| Tobacco streak virus |
Cannabis cryptic virus |
Cannabis cryptic virus |
| Citrus yellow vein-associated virus |
|
|
Table 5.
Summary of the various pathogens detected on cannabis and hemp plants in this study using molecular diagnostic approaches.
Table 5.
Summary of the various pathogens detected on cannabis and hemp plants in this study using molecular diagnostic approaches.
| Molecular techniques |
Pathogen(s) detected |
Detection in various tissues |
| Universal fungal primers |
Fusarium, Pythium, Alternaria, Penicillium, Golovinomyces, Botrytis
|
Leaves, stem, root, flower (cannabis) |
| Virus-group primers |
None |
|
| NGS, HLVd specific primers |
Hop latent viroid |
Leaves, roots, flower, seeds (cannabis, hemp) |
| NGS, Mitovirus-specific primers |
Mitovirus |
Leaves (cannabis, hemp) |
| NGS, BCTV- specific primers |
Beet curly top virus |
Leaves (cannabis, hemp) |
| NGS, CYVaV-specific primers |
Citrus yellow vein-associated virus |
Leaves (hemp) |
| NGS, TSV-specific primers |
Tobacco streak virus |
Leaves (hemp) |
| NGS |
Alfalfa mosaic virus |
Leaves (hemp) |
| NGS |
Tomato bushy stunt virus |
Leaves (hemp) |
Table 6.
Multiplex Taqman RT-PCR primers and conditions for detection of HLVd in this study.
Table 6.
Multiplex Taqman RT-PCR primers and conditions for detection of HLVd in this study.
| Target |
Primer |
Name |
Sequence 5’ – 3’ |
Source |
| HLVd |
Forward |
HLVd F1 |
ATACAACTCTTGAGCGCCGA |
Hataya et al. [75] |
| Reverse |
HLVd R1 |
CCACCGGGTAGTTCCCAACT |
Hataya et al. [75] |
| Probe |
HLVd P1 |
TCTTCGAGCCCTTGCCACCA |
This work |
| Forward |
HLVd F2 |
AGTTGCTTCGGCTTCTT |
Lu et al. [76] |
| Reverse |
HLVd R2 |
CCATCATACAGGTAAGTCAC |
Lu et al. [76] |
| Probe |
HLVd P2 |
TGCGTGGAACGGCTCCTTCT |
This work |
| Cannabis UBQ
|
Forward |
Cannabis UBQ F |
TACTGCGCCAGCTAACAAAC |
Guo [64] |
| Reverse |
Cannabis UBQ R |
GCACCCGTCTGACCTGAATC |
Guo [64] |
| Probe |
Cannabis UBQ P |
ACAATGCAGCAAATGCTCACTCTACAGCAGTCA |
This work |
Table 8.
Primer sequences used for detection of Beet curly top virus in cannabis.
Table 8.
Primer sequences used for detection of Beet curly top virus in cannabis.
| Target |
Primer |
Name |
Sequence 5’ – 3’ |
Source |
| BCTV-Universal |
Forward |
BCTV2-F |
GTGGATCAATTTCCAGACAATTATC |
Strausbaugh et al. [77] |
| Reverse |
BCTV2-R |
CCCATAAGAGCCATATCAAACTTC |
| BCTV-Worland |
Forward |
BMCTVv2825 |
TGATCGAGGCATGGTT |
Chen et al. [78] |
| Reverse |
BGc396 |
CAACTGGTCGATACTGCTAG |
| BCTV-Severe |
Forward |
BSCTVv2688 |
GCTGGTACTTCGATGTTG |
Chen et al. [78] |
| Reverse |
BGc396 |
CAACTGGTCGATACTGCTAG |
| BCTV-Colorado |
Forward |
BCTVCO-F |
TGCGAGGACGCTTCTTGATT |
Chiginsky et al. [23] |
| Reverse |
BCTVCO-R |
GGGCCGACTCTTATTTTCGG |
Table 9.
Primers used to identify low percentage nucleotide identity viruses in hemp plants in 2019.
Table 9.
Primers used to identify low percentage nucleotide identity viruses in hemp plants in 2019.
| Target |
Sequence (5’ – 3’) |
Reference |
| Actin |
TTGCTGGTCGTGATCTTACTG
GTCTCCATCTCCTGCTCAAAG |
Mangeot-Peter et al. [82]. |
| BCTV universal |
GCTTGGTCAAGAGAAGT/
CAACTGGTCGATACTGCTAG |
Strausbaugh et al. [41] |
| CasaMV1 |
GACGTCTTCTTGTTGTGGCTAGTA
GTTCATAGGCAACTGAGGTTCTTT |
Chiginsky et al. [23] |
| CYVaV |
CCAGACAGGTGTTTCGAGCAT
CAATCACTGCAAATCGCG |
Kwon et al. [38] |
| TSV |
TGGTGTTGACGAGTAATCGTAGTT
GAAGCATTCATCAAACAATAGTCG |
Chiginsky et al. [23] |
