1. Introduction
Many years have passed since the first study of researchers on flow obstacles. The topic of flow around these objects and the phenomenon of vortex shedding caused by it is of great importance due to its practical applications in engineering. Some of the practical applications of these types of flows include flow around buildings and tall structures, around mountains, aircraft wings, blood flow in arteries, and many other cases. This type of flow often includes complex phenomena such as flow separation, wake, shock, vortex flow, and vortex shedding. At very low Reynolds numbers, the flow around these objects is completely attached to them and separation does not occur. With increasing Reynolds number, the flow separates from their surface and a vortex is formed behind them. With increasing Reynolds number, the size of the vortices also increases. With further increase in Reynolds number, the vortices become oscillatory and in the resulting flow, the flow changes from steady to unsteady. Flow over obstacles inside channels is of interest to many researchers in different fields of engineering.
Fadda and Raad [
1] conducted experimental and numerical studies of flow over triangular and semi-circular obstacles in an open channel. They found that the downstream Reynolds number increases with increasing obstacle height, while the upstream Reynolds number decreases linearly with increasing obstacle height. Rosales et al. [
2] investigated unsteady laminar flow over square obstacles in a channel. They calculated the average Nusselt number and aerodynamic properties such as drag coefficient, pressure coefficient, and Strouhal number. They found that the Nusselt and Strouhal numbers decrease when the obstacle is close to the channel walls. Okajima et al. [
3] conducted experiments on incompressible laminar flow around a square cylinder in the center of a channel for three different Reynolds numbers (150, 300, and 1500). Other relevant work includes Marquillie and Ehrenstein [
4] and Ehrenstein and Gallaire [
5], which investigated the separation of the boundary layer flow over an obstacle. This flow is subjected to many backflows.
Griffith et al. [
6] investigated the effects of a blockage on the instability of flow and wake behavior in a confined channel. They found that the separation and impact length and the three-dimensional instability structure are observed from blockage 0.5 by changing the Reynolds number from 25 to 3000 and the blockage rate from 0.05 to 0.9 of the channel. Mendonca and Sharif [
7] investigated the effects of surface roughness on the supersonic turbulent flow. They conducted experimental studies of the flow passing over a semi-circular obstacle with different heights in a channel and used different solvers such as k-ε and k-ω to investigate the shock phenomenon and skin friction coefficient. Their results show that the skin friction coefficient increases with increasing surface roughness and shock displacement. Wang et al. [
8] studied the effects of combined jets on the boundary layer separation point and vortex dynamics over a two-dimensional obstacle. They used hydrogen bubble flow visualization and two-dimensional PIV techniques to detect the phenomena. Their experiments showed the formation of a fully stretched and narrow separation bubble when the laminar boundary layer separates from behind the obstacle and there is no control on the flow. However, with combined jet control, the average time length of the separation bubble decreases with the excitation frequency when the excitation frequencies are in the range close to the natural frequency of vortex rolling up.
Lo and Kontis [
9] conducted experimental studies to investigate shock waves generated by an obstacle at Mach 1.3. They used oil flow and fluorescence to successfully detect and capture instantaneous images of the shock. Their experimental data showed that the normal shock generated is divided into a series of lambda shock wave structures by the obstacle. They also showed that the flow pattern of the generated shock waves in the upstream of the obstacle is strongly dependent on the location of the normal shock collision. In their study, an open channel with supersonic flow is investigated. In this channel, a barrier is initially placed up to a height of 10% of the width of the barrier, and it is tried to reveal the boundary layer separation, friction coefficient, and bubble formation using numerical simulation using the Fluent software, and compare it with the case where about 50% of the surface of the barrier is porous.
The wide and increasing application of porous surfaces in various fields of engineering, including acoustic wave attenuation in porous materials [
10], the use of porous medium rock masses to strengthen building materials [
11], the extensive use of the properties of porous surfaces in heat transfer [
12], and the wide range of applications in thermal insulation, energy storage units, heat exchangers, oil tanks, and many other cases cannot be denied. A porous material is a material that consists of a continuous network of voids and pores filled with air or other fluid. Many natural materials such as soil or body tissues such as cartilage, bone, and muscle are examples of porous materials. Voids and pores can be very large or very small. In general, voids and pores in a porous medium have irregular shapes in size and distribution throughout the porous network. The original idea for the passive control of shock and boundary layer interference using porous structures was proposed by Bahi et al. [
13]; this idea included a porous surface and a chamber below the location of shock and boundary layer interference. With the formation of a shock, a large pressure difference is created on the two sides of the shock [
14]. This method is based on the fact that the static pressure difference on the two sides of the shock will result in a flow inside the chamber from downstream of the shock to upstream of it. These effects lead to a decrease in the shock angle and its weakening.
In general, fluid flow in a porous medium is a very complex phenomenon and cannot be precisely defined as similar to internal fluid flows in pipes or channels. Fluid flow in pipes or channels, due to the known path of flow and their length, can simply be expressed as a function of pressure. While in porous media, often due to the ambiguity of the flow path, measuring the properties of the flow is particularly complex. In porous media, Darcy’s law is one of the fundamental equations, and the principles of fluid movement in porous media are based on this law. The law and in fact Darcy’s formula includes coefficients of inertial (K2) and viscous (K1) resistance of the flow in passing through the porous surface. In this formula, pressure changes and in fact pressure jumps in passing through the porous surface are calculated using viscous and inertial terms, and the simulation of flow passing through the porous surface is carried out.
The aim of the study is the use of porous structures to reduce shock waves caused by the compressibility of fluid flow and, in general, to reduce the effects of shock and boundary layer interference. This has not been done before, and the study has the potential to lead to new and innovative ways to control shock waves in a variety of applications, such as aircraft design, wind turbines, and power plants. Specifically, the study found that creating porosity on the surface of an obstacle can weaken the shock and reduce its effects. This is because the porous surface creates suction and blowing, which increases the cross-sectional area of the flow and reduces the effects of shock. The study also found that a porosity of around 50% is sufficient to weaken the shock and reduce the Mach number after it. Additionally, the study found that the area under the skin friction diagram is reduced by about 38% as a result of less interference between the shock and the boundary layer and blowing caused by the porous surface. Overall, the study provides new and valuable insights into the use of porous structures to control shock waves. The findings of the study have the potential to lead to new and innovative ways to design and operate a variety of engineering systems.
2. Geometry and Problem Formulation
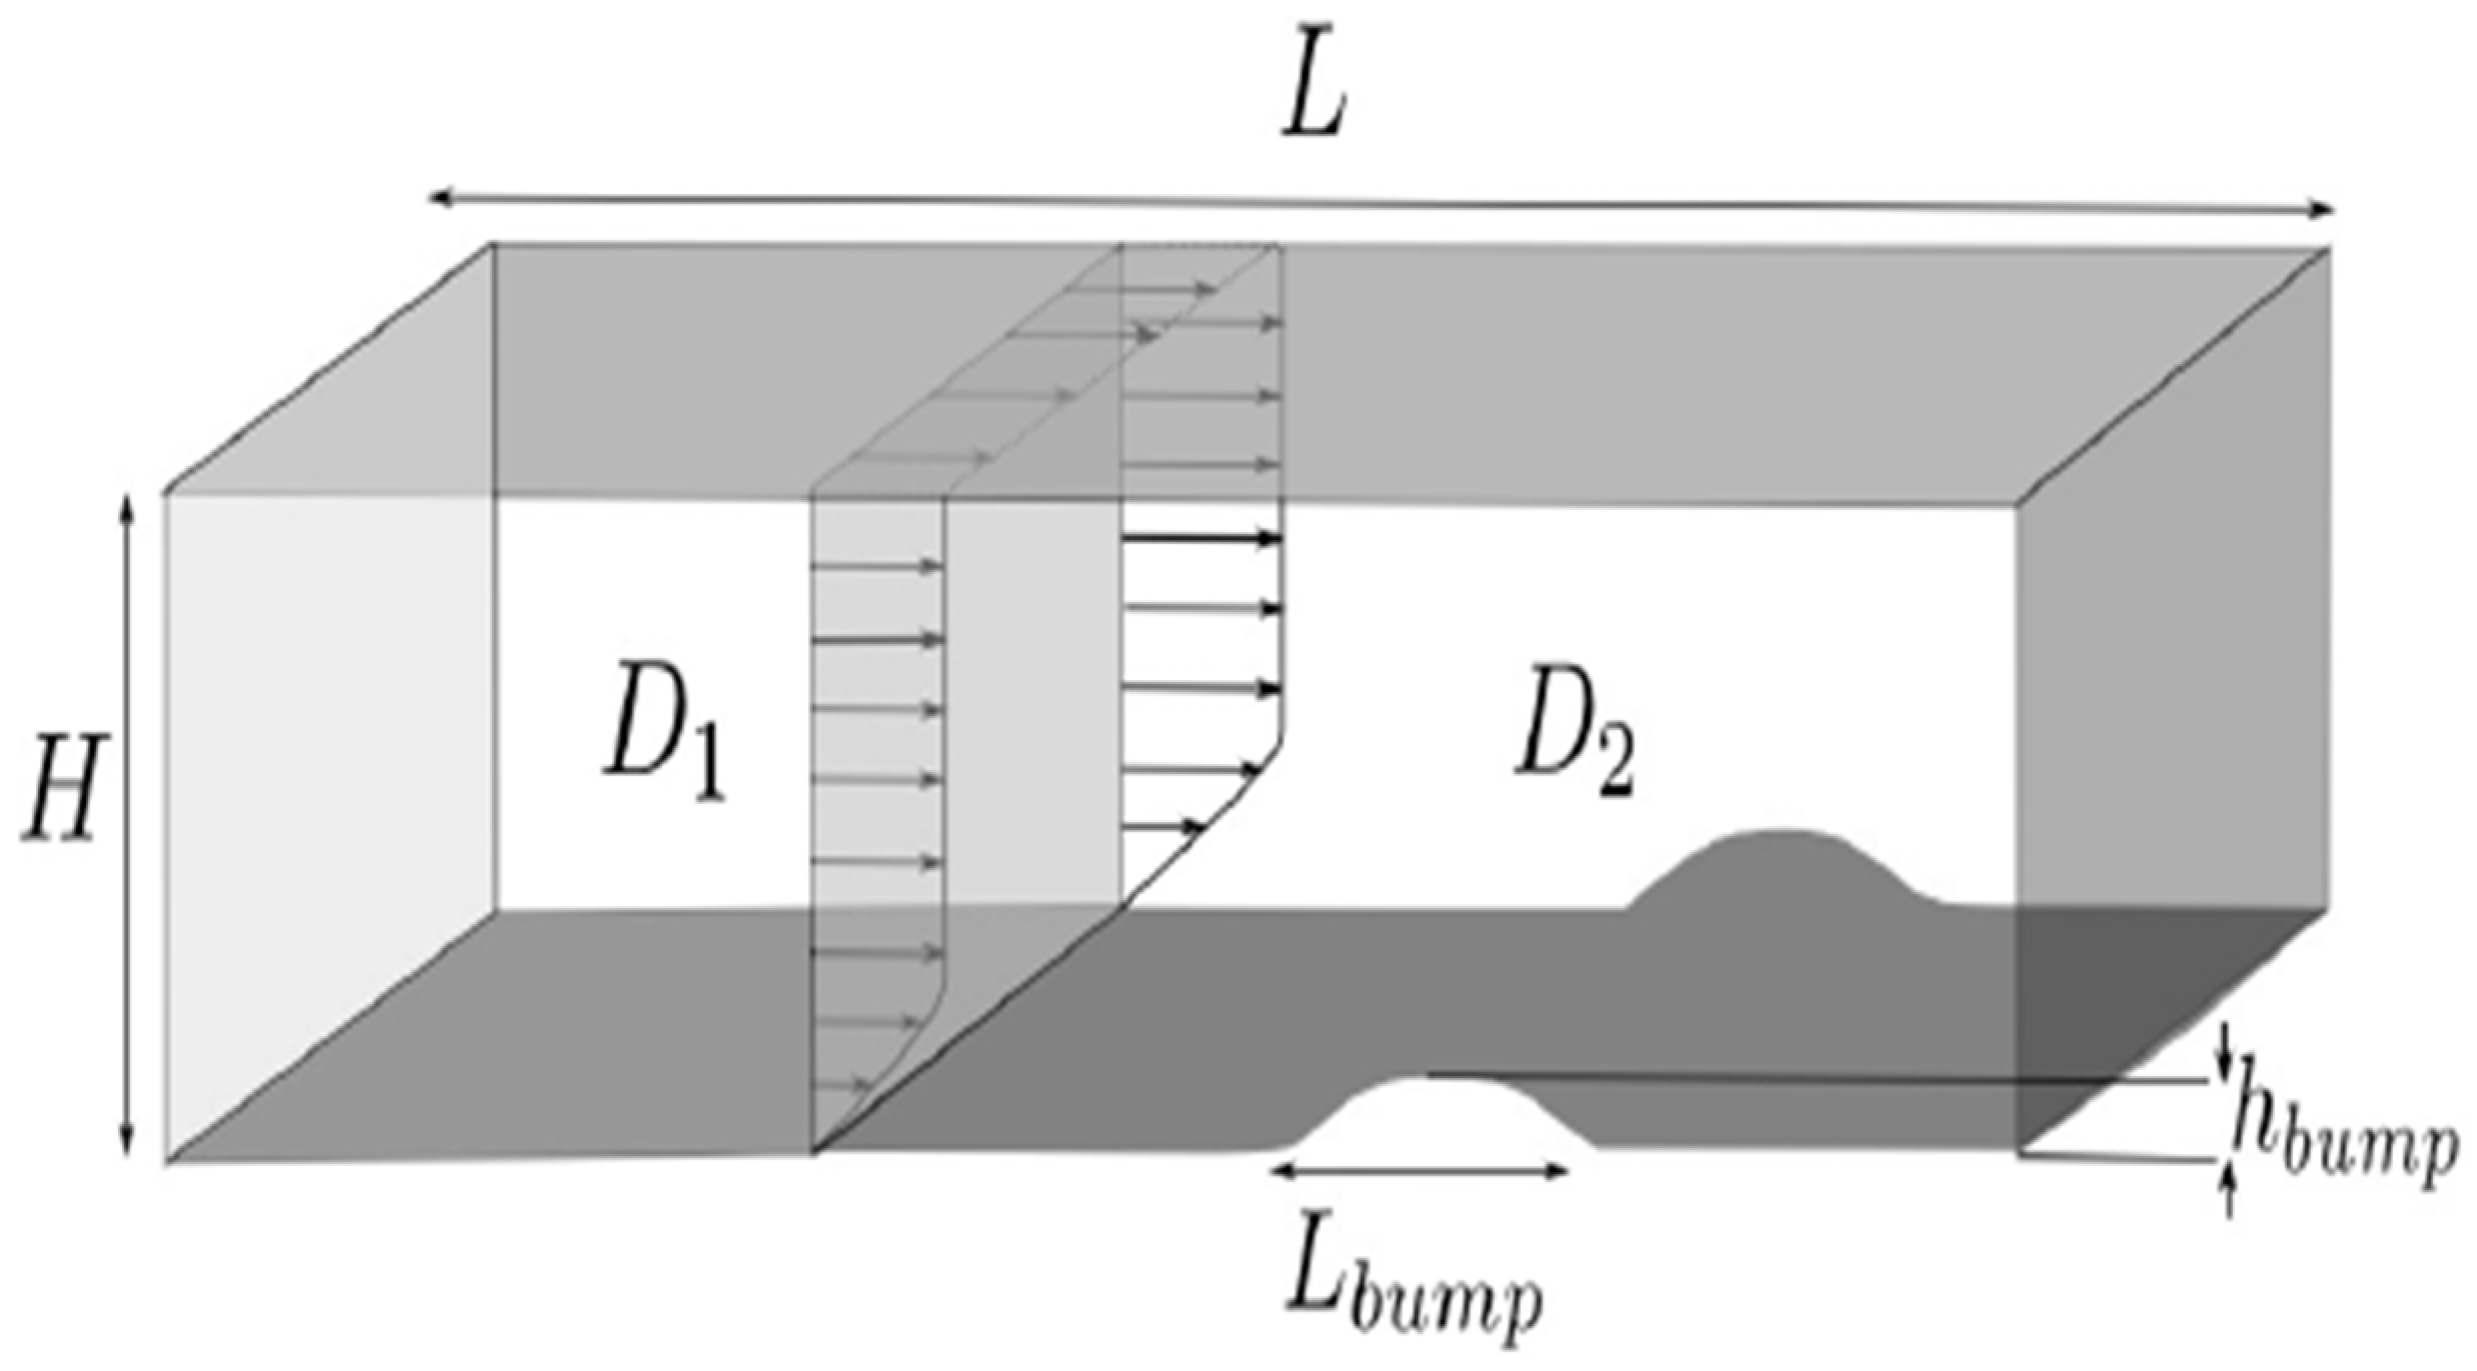
The basic geometry of the problem consists of a flat plate with a two-dimensional cylinder that is homogeneously stretched in the depth direction. To validate the study, we first implement the geometric conditions governing the reference problem [
15] and then implement the desired geometry in the problem. Newtonian fluid flow with zero pressure gradient is considered, the flow is compressible and its direction is from left to right as shown in
Figure 1. The schematic and boundary conditions for the base state calculation are given in
Figure 1. The computational domain dimensions are x ∈ [-1, 4] × y ∈ [0, 1.5] in millimeters. The dimensions of the circular arc of the protrusion are length L and height H in meters, which are measured using the dimensionless parameters of the obstacle length, temperature, velocity, density, and dynamic viscosity and with respect to the freestream value. The x-axis is in the flow direction, the y-axis is the normal to the wall, and the z-axis is in the depth direction. The computational domain is divided into two regions: region 1 and region 2 (according to
Figure 1). Non-viscous velocity and adiabatic temperature boundary conditions are considered in region 1, while viscous velocity and adiabatic temperature boundary conditions are considered in region 2. The freestream boundary condition is considered at the top and outer boundary. The figure shows the computational domain and boundary conditions for the problem.
The inlet boundary condition is Dirichlet, which means that the velocity at the inlet is specified. The top and right walls are freestream boundaries, which means that the flow conditions are the same as the freestream flow. The bottom wall in region 1 is adiabatic and no-slip, which means that the temperature is constant and the flow is not allowed to slip at the wall. The bottom wall in region 2 is adiabatic and slip, which means that the temperature is constant and the flow is allowed to slip at the wall [
16,
17].
The porous medium is located in the normalized interval between 0.25 and 0.75 of the unit width of the obstacle. The depth of the porous medium is from 0.3 to 0.4 of the local thickness of the obstacle. The porosity is 50% with fine particles with a diameter of 0.012 millimeters.
3. Governing Equations
As previously explained, the numerical simulation of the channel and porous medium will be performed using computational fluid dynamics. Therefore, the governing equations for the problem in the case of compressible flow will be as follows.
The governing equations for compressible flow are the Navier-Stokes equations, which are a set of partial differential equations that describe the motion of a fluid. These equations can be written in a variety of forms, but the following form is commonly used [
18,
19,
20]:
In the equations above:
u is the three-dimensional velocity vector,
p is the pressure,
T is the temperature, and
σ is the viscous stress tensor of the Newtonian fluid.
Here, and are the mean and fluctuating velocities in the x-direction. The fluid density is ρ and the dynamic pressure is P.
The dimensionless parameters used are the Reynolds number and the Mach number, which are defined as follows:
4. Validation
To validate the numerical modeling of flow through a channel with the desired geometry, experimental results were used. Pérez et al. used the open-source software OpenFOAM and the Roe-CentralFoam module to solve the two-dimensional compressible Navier-Stokes equations in this numerical work. This module is a density-based compressible solver and uses an unstructured grid with a finite volume method. A total of 221015 cells were used to solve the flow. The flow was steady with a Reynolds number of 1,380 and a Mach number of 0.675 at the inlet,
,
, and
.
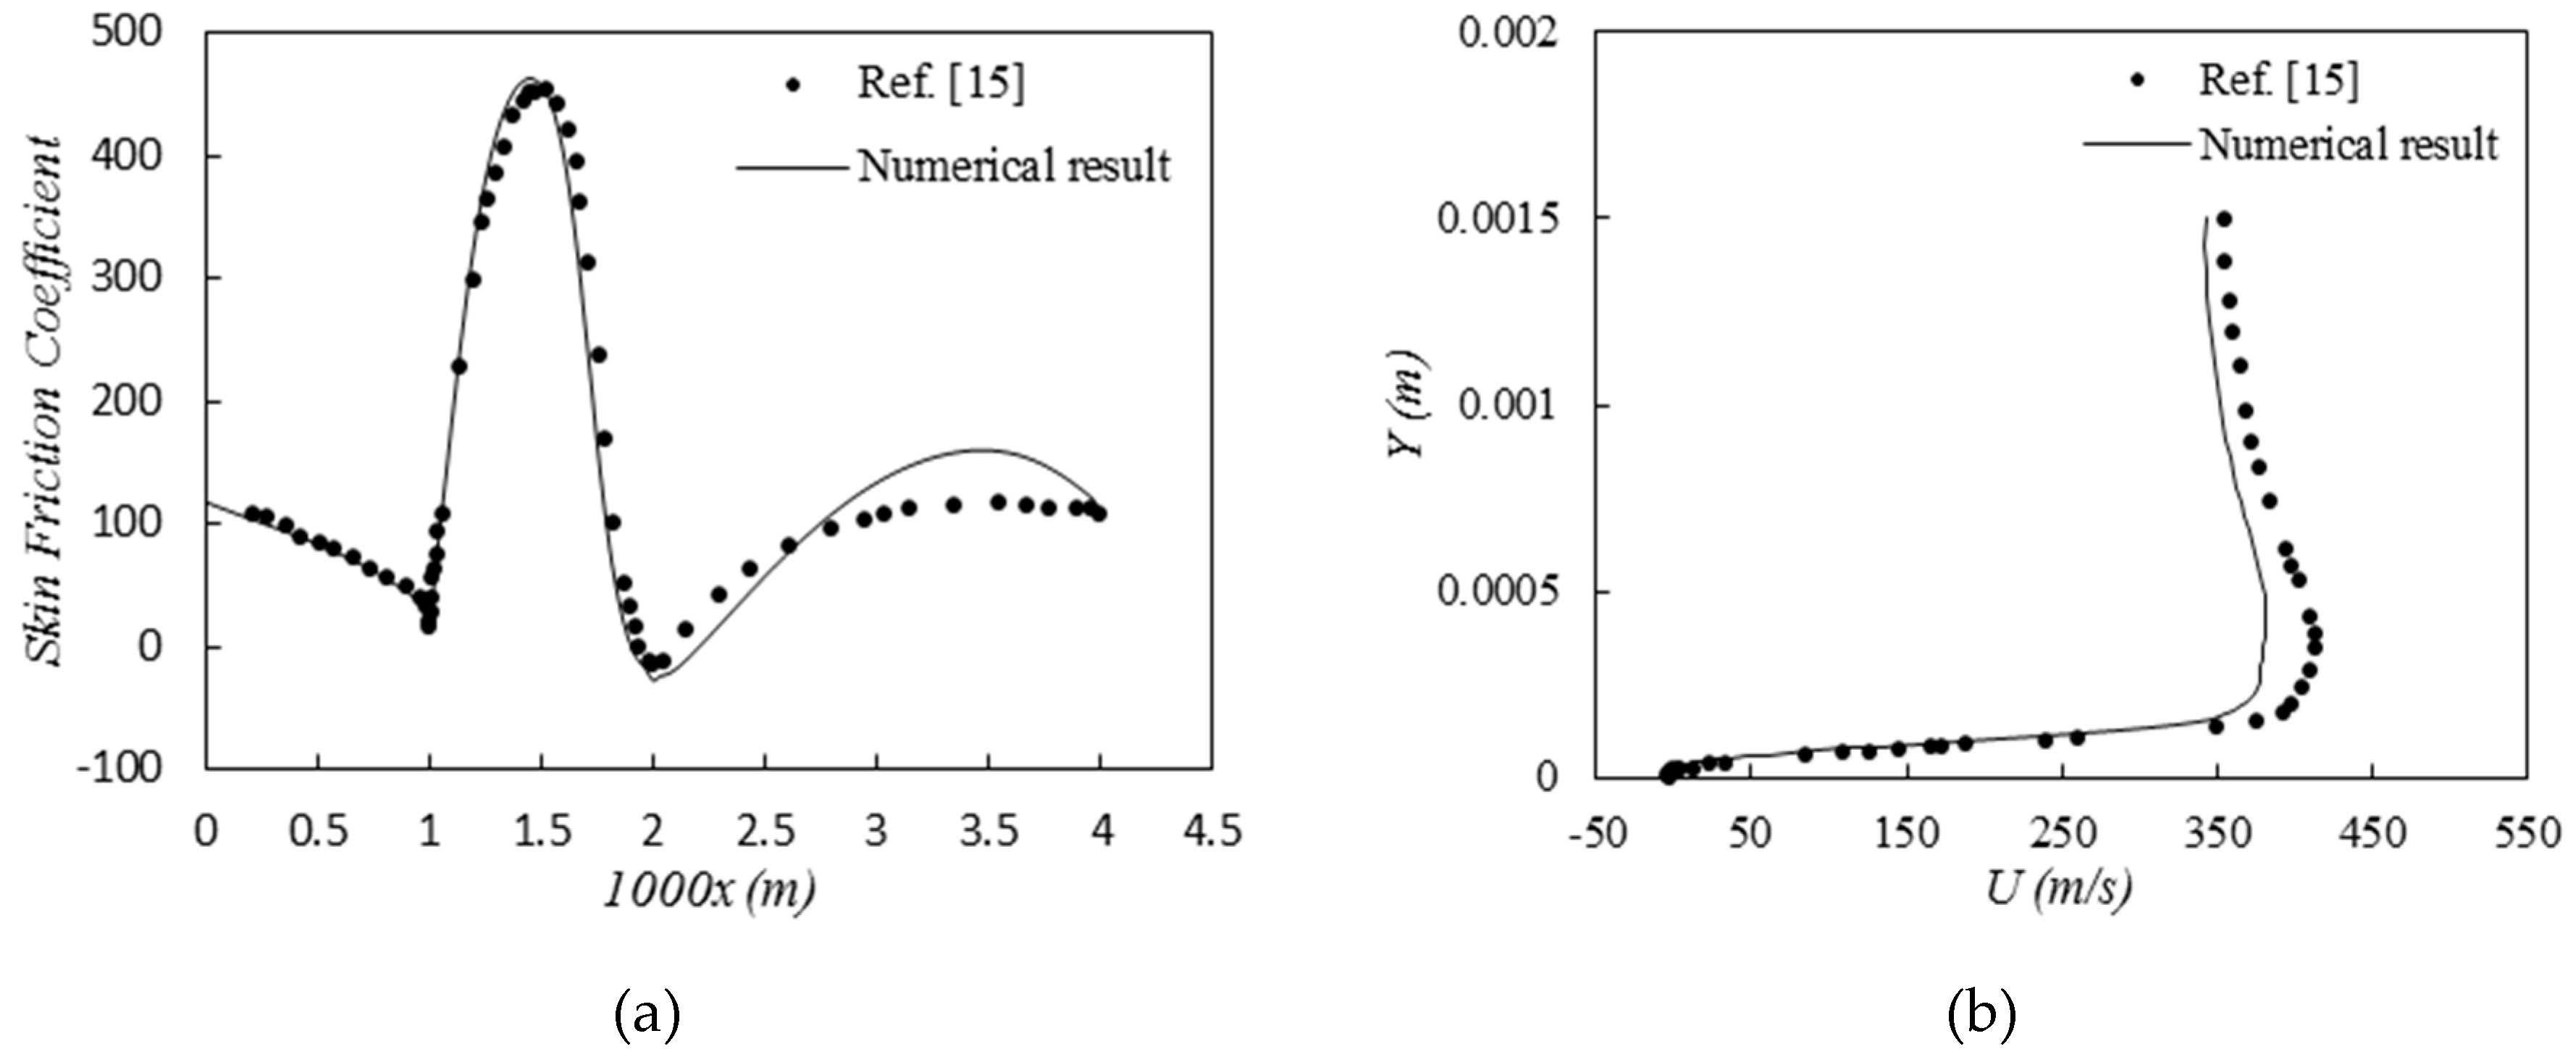
Figure 2 (a) shows the skin friction coefficient. The skin friction coefficient is highest on the obstacle and lowest near the obstacle (obstacle domain). To some extent, the skin friction coefficient at the inlet and outlet of the channel is similar.
Figure 2 (b) shows the velocity in the flow direction. With increasing channel length, the velocity increases in the vicinity of the obstacle. It is also important to note that there is a reverse flow near the obstacle with a negative flow velocity in this region. The simulation results show acceptable agreement with the work done by Pérez, which confirms the validity of the numerical modeling. With confidence in the accuracy of the numerical solution method, we proceed to the numerical study of shock wave and boundary layer interaction control using surface porosity.
5. Porous Media to Control Shock and Skin Friction
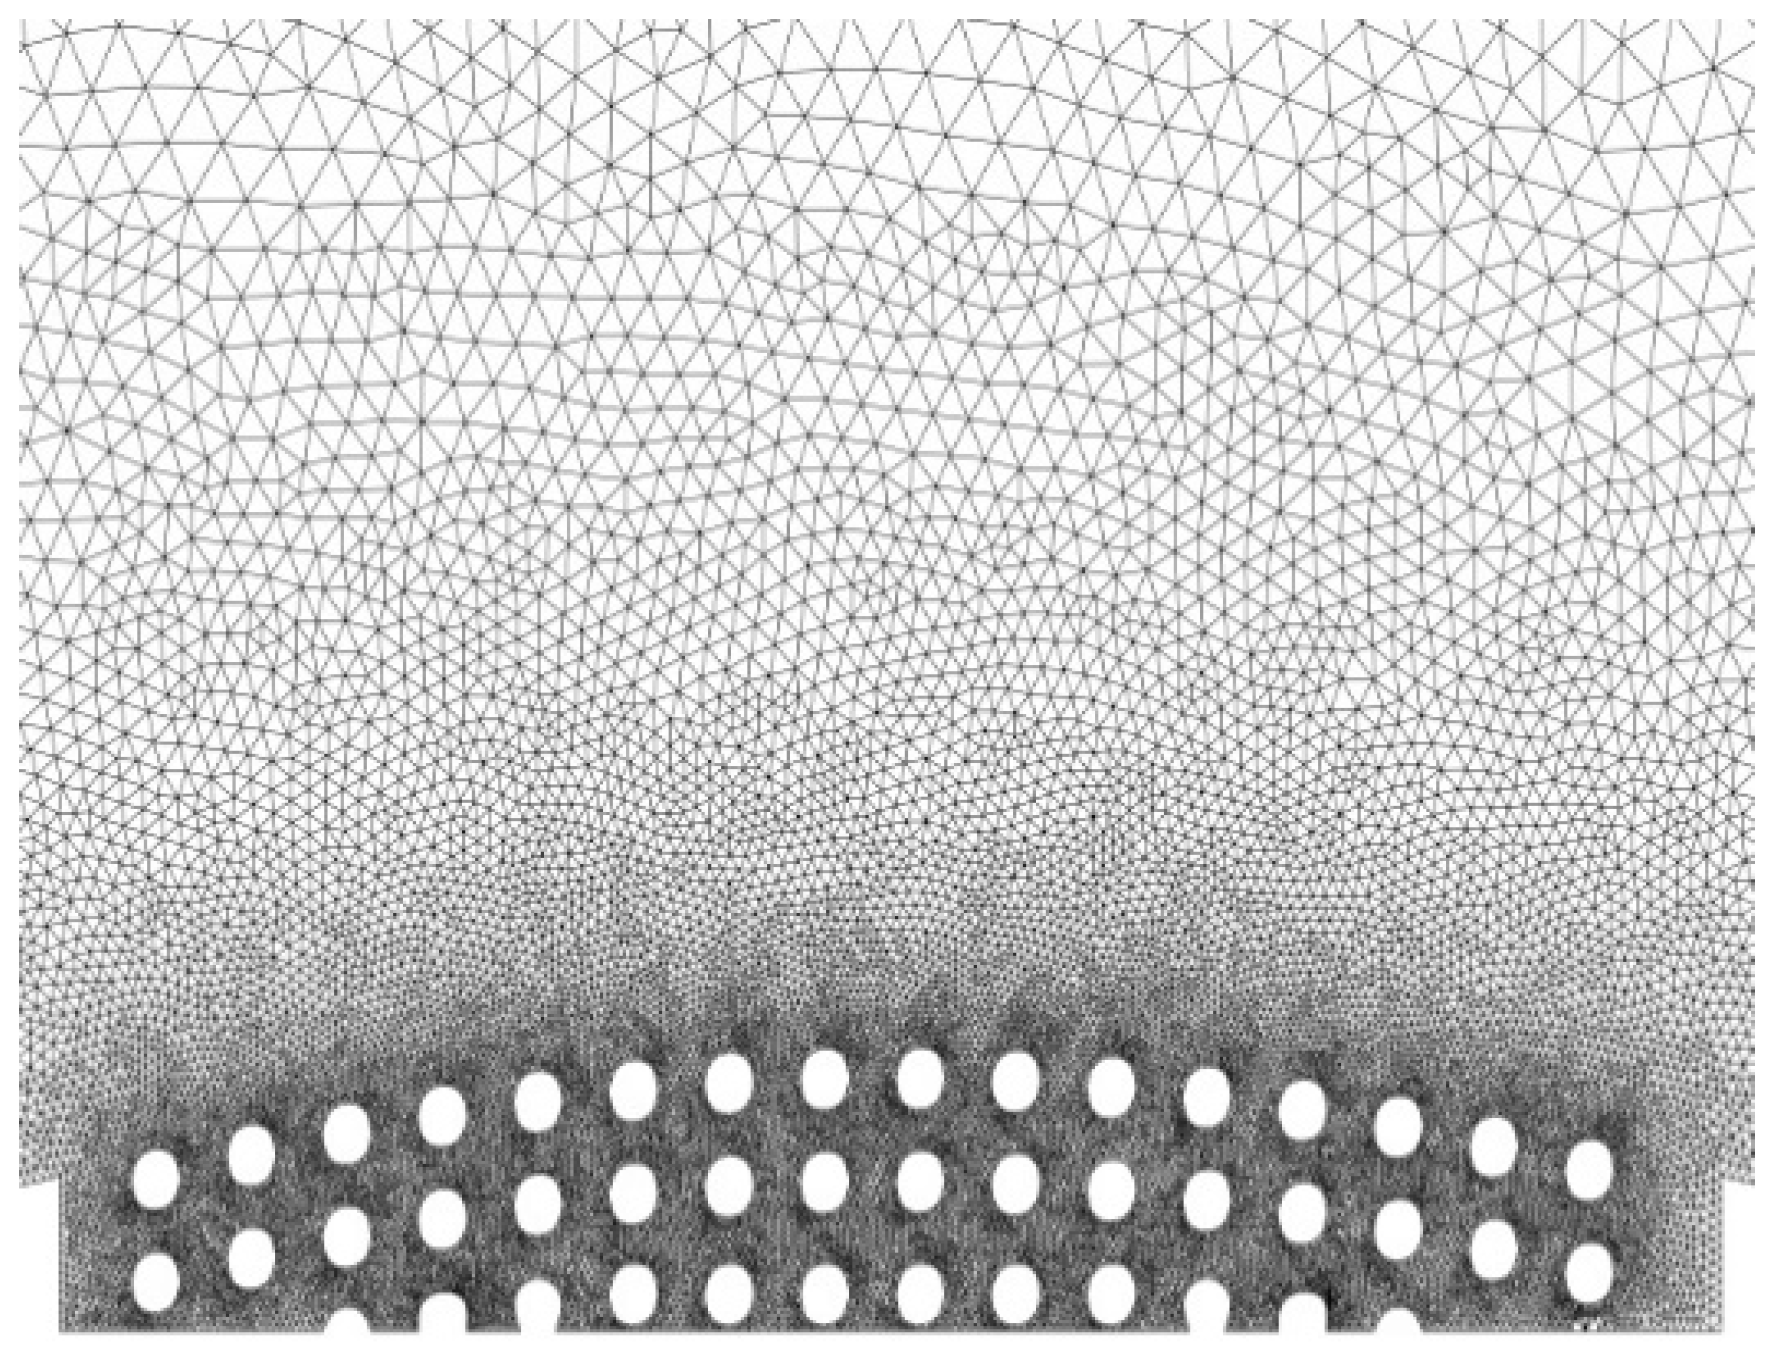
The geometry used to study the effects of porosity and skin friction is the same as that used in the experimental results, except that there is a depth of 30 to 40 percent of the obstacle’s local thickness created as porosity on the obstacle from 25 to 75 percent of its length and to a depth of 25 to 75 percent of its length (
Figure 3). Approximately 50% of the porosity is comprised of small particles with a diameter of 0.12, non-dimensionalized with the length of the obstacle. It is based on the results of that a two-dimensional porous medium is simulated. In an article, Nakayama et al. [
21] proposed equation (7) to calculate the equivalent diameter of different porous media structures.
In this equation,
k1 is the viscosity coefficient in the flow through the porous medium and
ɛ is the equivalent structure coefficient of the porous medium. The overall fluid properties are exactly the same as in the uncontrolled state, and 221,015 cells are used for unstructured gridding, which is clearly shown in the porous region of the grid in
Figure 3. To ensure the accuracy of the gridding, a grid independence test is used in such a way that 5 types of gridding with different cells are created and finally the best type of gridding is selected.
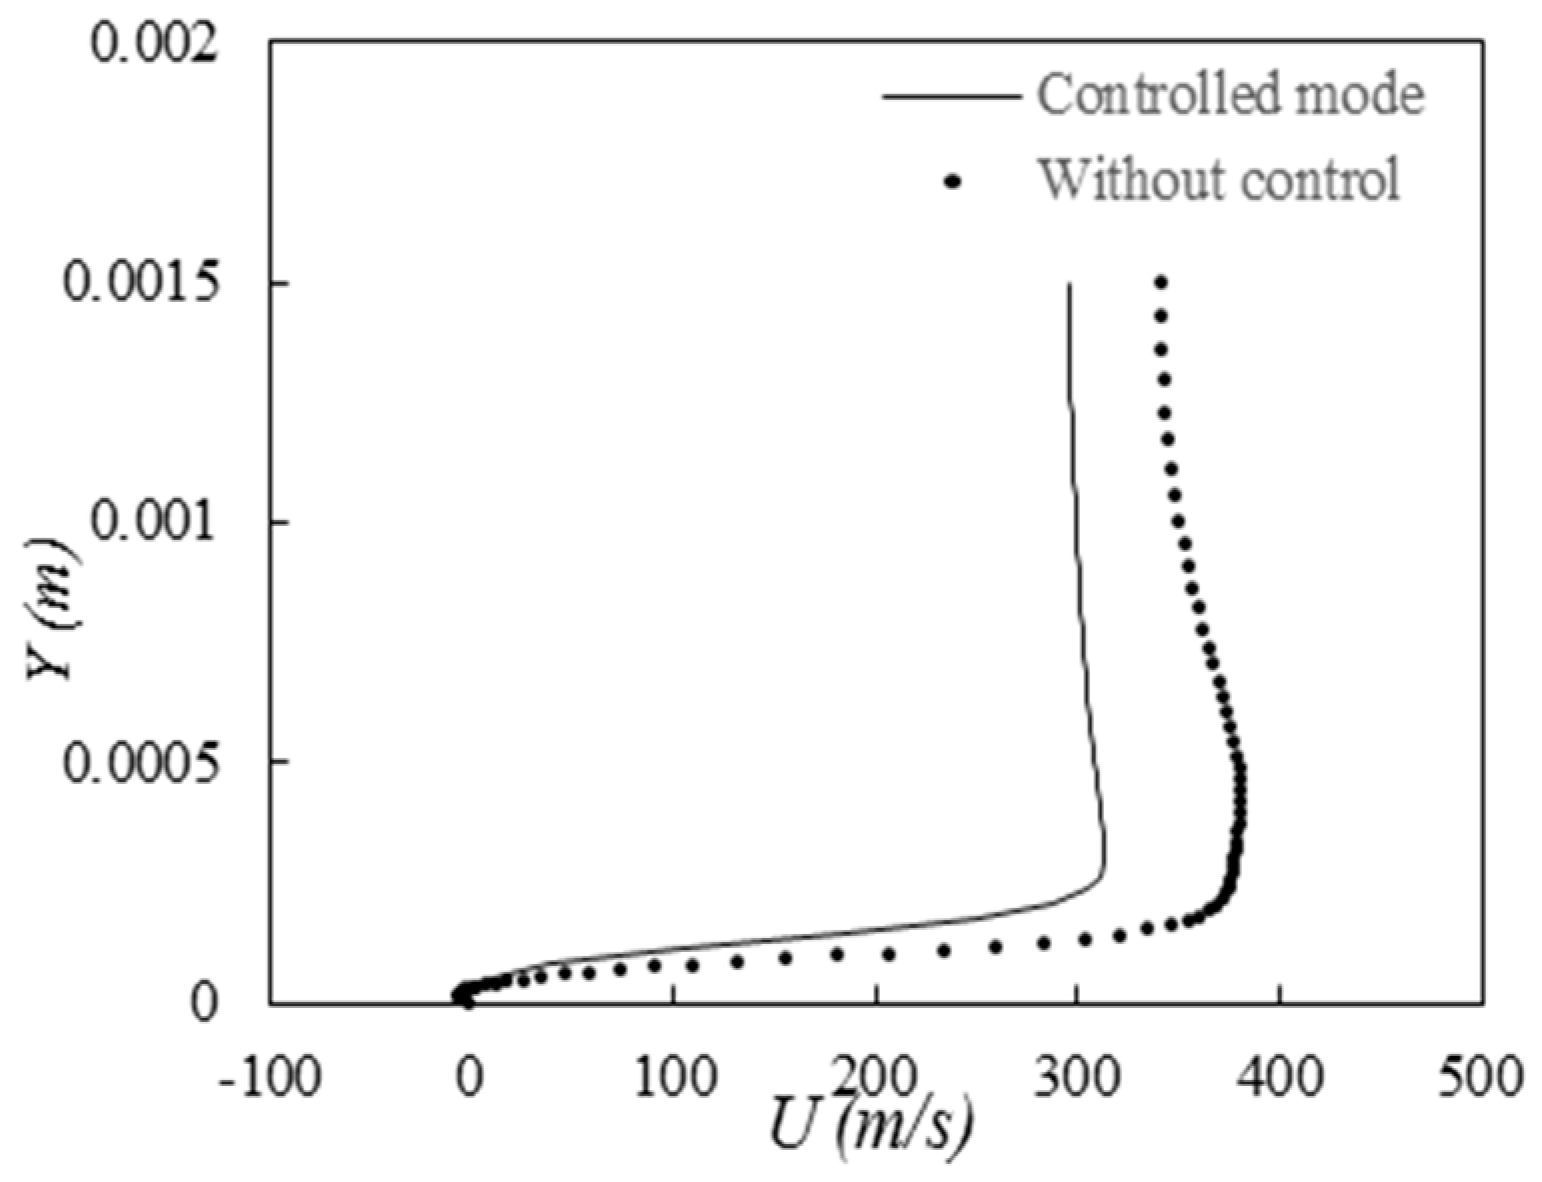
Figure 4 shows the velocity profile along the flow where the flow immediately passes the obstacle in two cases: with flow control and without flow control. As is clearly visible, with flow control, the velocity in the upstream flow decreases. The greatest difference is in the middle of the channel, which will cause the shock to be less severe and delayed. Flow control is a method of modifying the flow of a fluid in order to improve its performance or characteristics. In this case, flow control is used to reduce the velocity of the upstream flow. This can be done by using a baffle, a screen, or other device to obstruct the flow.
The reduction in upstream velocity has two main effects. First, it reduces the amount of energy that is available to create the shock. Second, it delays the formation of the shock. This is because the shock wave is generated when the upstream flow is forced to change direction. By reducing the upstream velocity, the flow is less likely to change direction abruptly, which reduces the severity of the shock. The results shown in
Figure 4 are consistent with these expectations. The velocity profile with flow control shows a clear reduction in velocity in the upstream flow. The greatest difference is in the middle of the channel, which is where the shock wave is most likely to form. The results of this study show that flow control can be an effective way to reduce the severity and delay the formation of shock waves. This can be beneficial in a variety of applications, such as reducing noise pollution and improving the efficiency of turbines [
22,
23,
24].
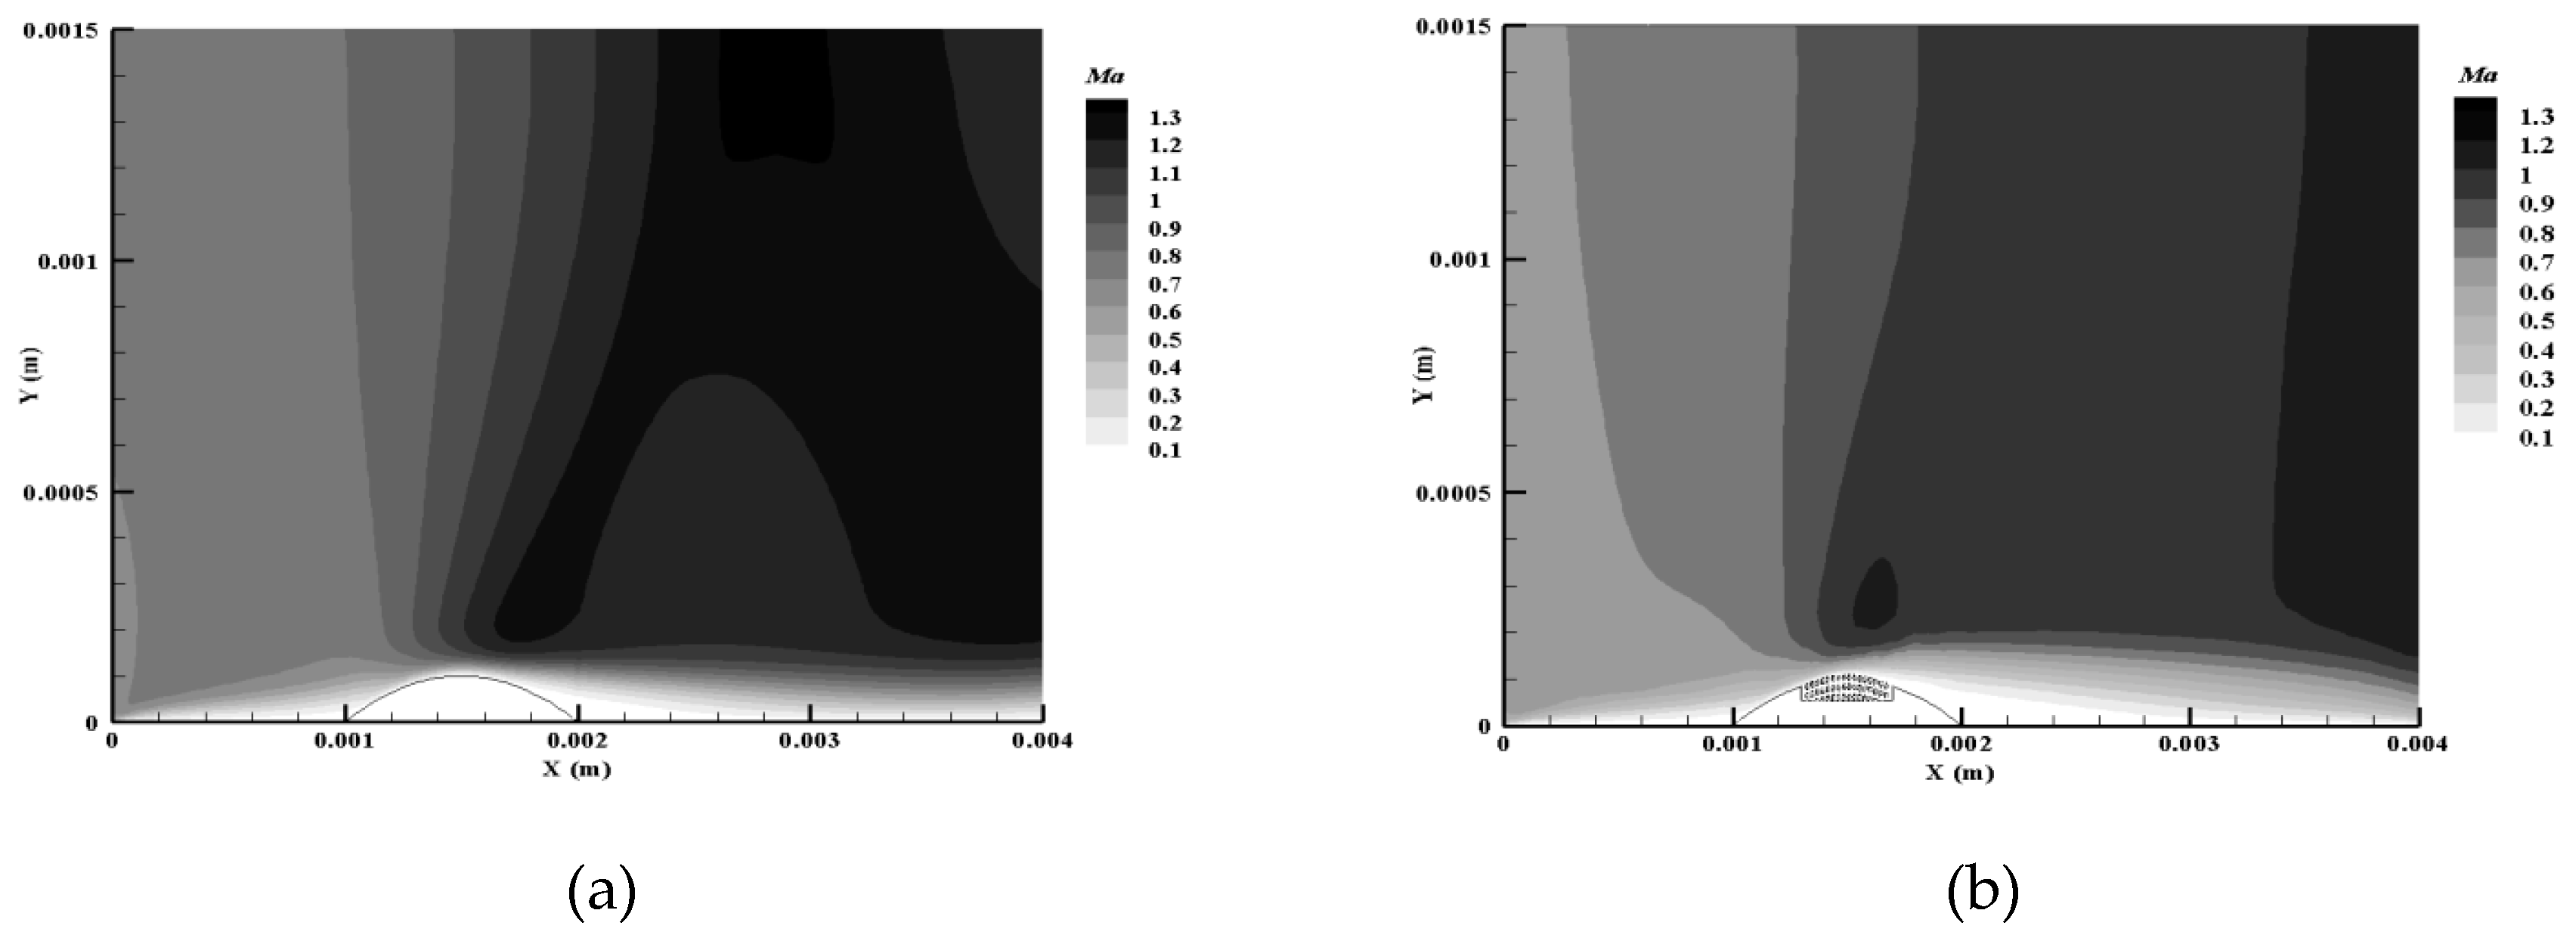
Mach number contours in two controlled and uncontrolled cases by a porous medium in the two-dimensional plane of passing through the obstacle are shown in Figure 6. As shown in
Figure 5, the start of the shock in both cases occurred on the obstacle. The main difference that can be seen in both cases is the reduction in the length of the shock in the controlled flow state with porosity, which is less and delayed compared to the uncontrolled state.
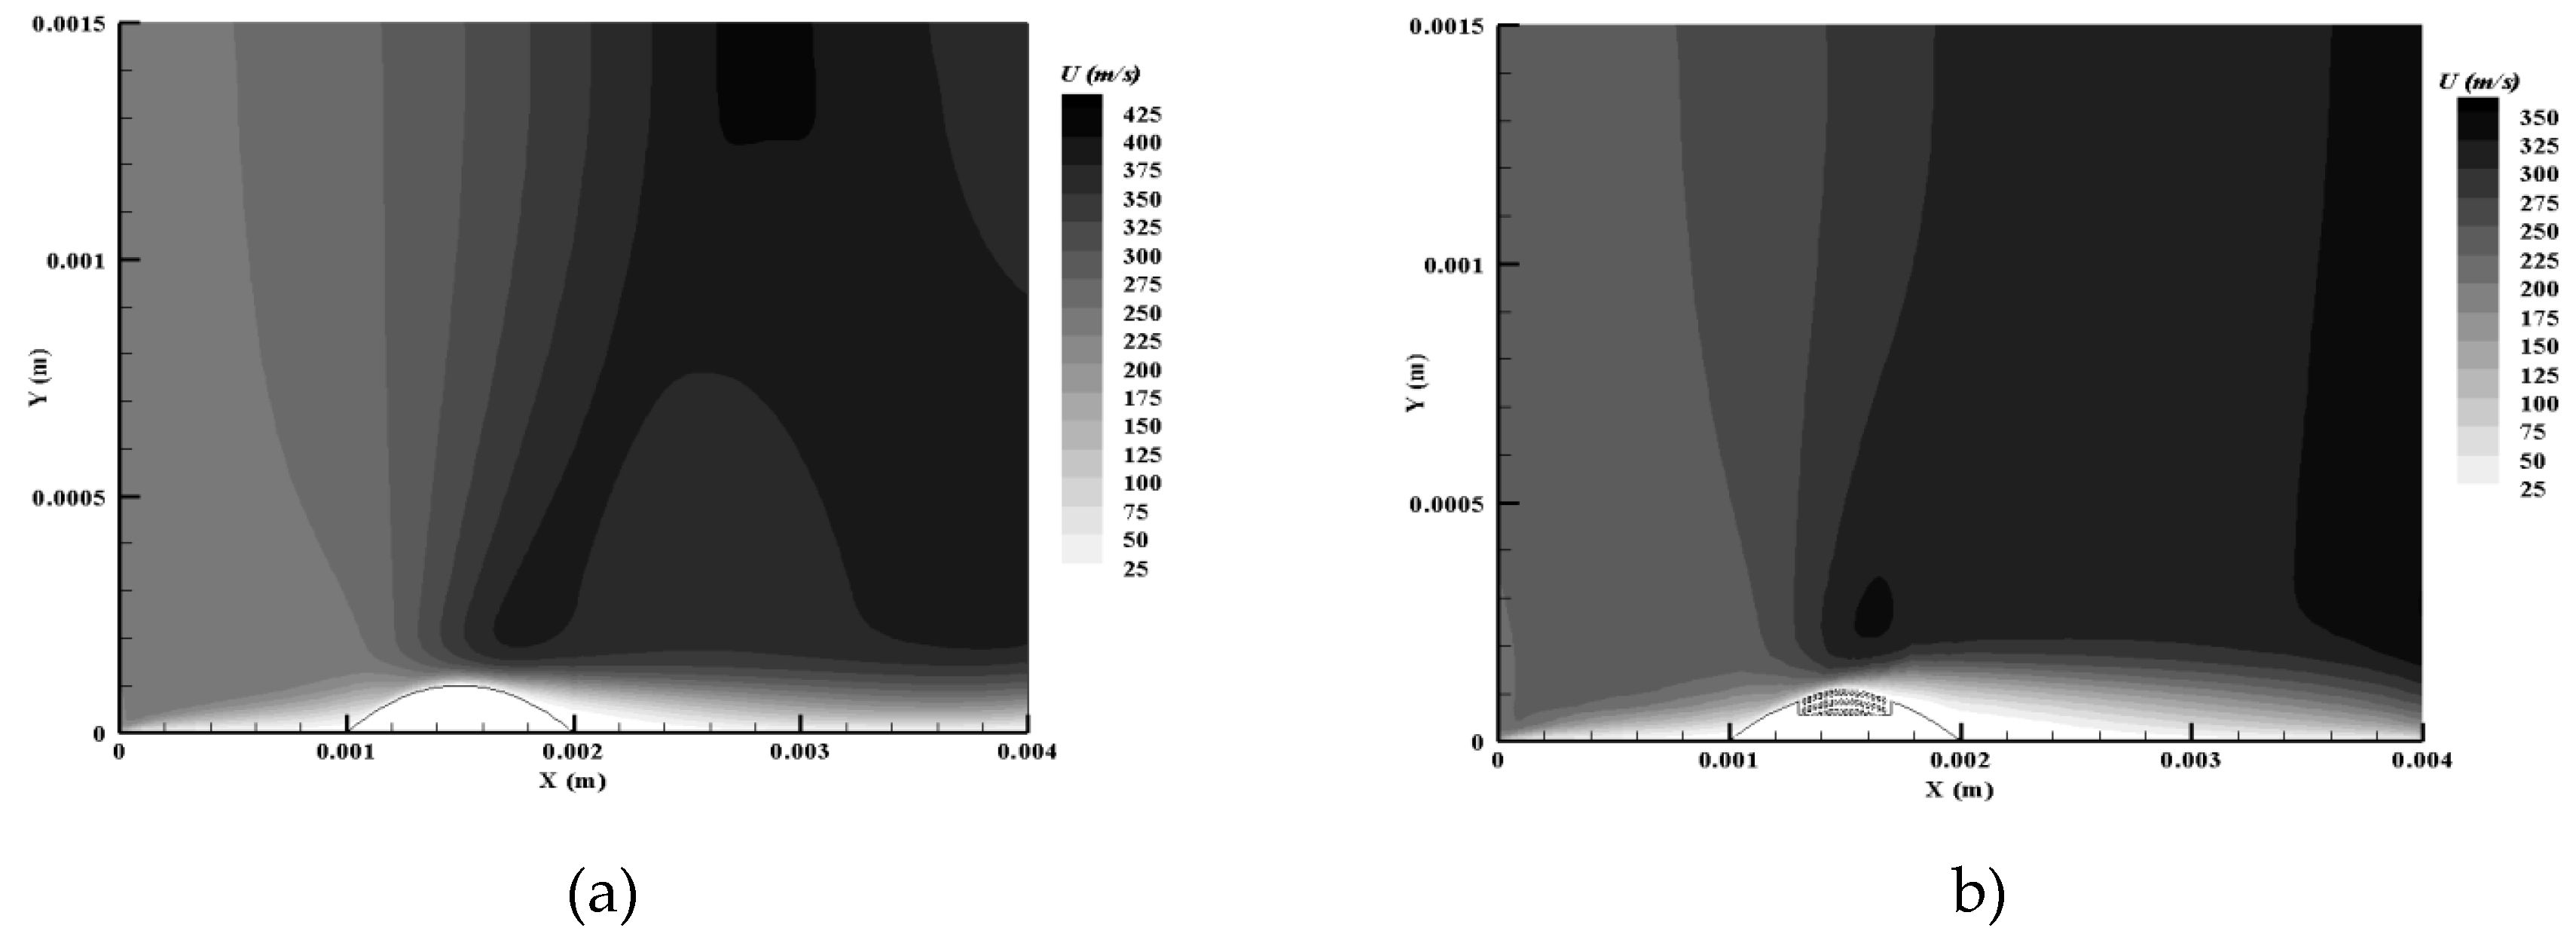
Velocity contours along the flow in the two controlled and uncontrolled cases with porosity are shown in
Figure 6. According to
Figure 6, it is quite clear that the shock generated is much weaker than the uncontrolled state and the Mach number after the shock has also decreased (
Figure 5). The boundary layer after the shock has also thickened, due to the suction before the shock and the blowing after it due to the presence of porosity. The blowing of the flow from the porous surface has caused the boundary layer after the shock to grow more and the size of the bubble formed has become larger than the uncontrolled state. The results shown in
Figure 6 are consistent with the expectations of the study. The reduction in the length of the shock wave in the controlled flow state with porosity is due to the reduction in the upstream velocity caused by the porous medium. This reduction in velocity makes it less likely that the flow will change direction abruptly, which reduces the severity of the shock wave.
The thickening of the boundary layer after the shock is also due to the presence of the porous medium. The porous medium creates a suction effect before the shock wave, which draws the fluid towards the surface. This suction effect helps to thicken the boundary layer. The blowing of the flow from the porous surface after the shock wave also helps to thicken the boundary layer. The blowing effect helps to mix the fluid in the boundary layer with the fluid in the freestream. This mixing helps to reduce the velocity gradient in the boundary layer, which also helps to thicken it.
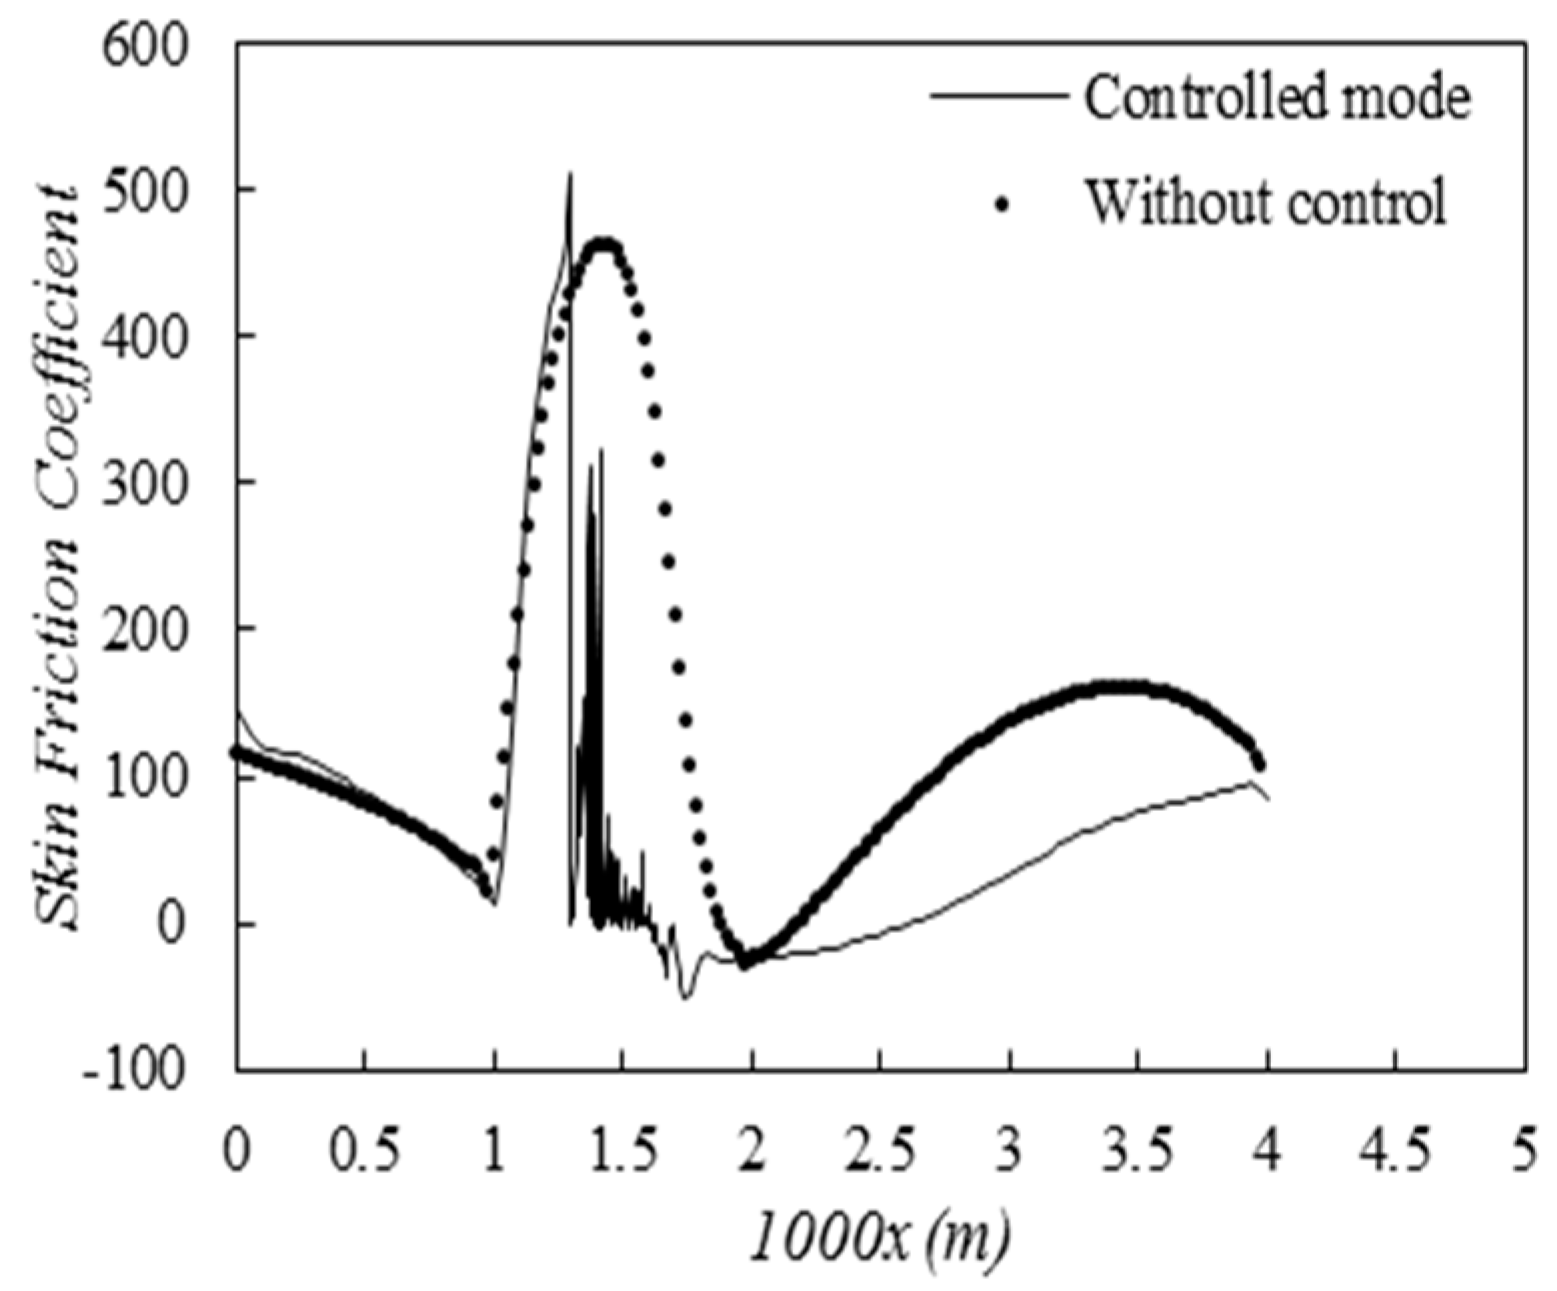
Figure 7 shows a graph of the friction coefficient in two uncontrolled and controlled states by a porous medium. According to
Figure 7, the skin friction coefficient has decreased significantly and the area under the graph has decreased by about 38%. The main reason for this is the reduction of the effects of shock interference with the boundary layer and the blowing created by the porous surface after the shock. The friction coefficient is a measure of the resistance of a fluid to flow over a surface. A lower friction coefficient indicates that the fluid flows more smoothly over the surface.
In the uncontrolled flow state, the friction coefficient is high. This is because the shock wave causes the boundary layer to thicken and become more turbulent. The thickening of the boundary layer increases the friction coefficient. In the controlled flow state, the friction coefficient is lower. This is because the porous medium reduces the severity of the shock wave. The reduction in the severity of the shock wave reduces the thickening of the boundary layer, which in turn reduces the friction coefficient. The blowing effect of the porous surface after the shock also helps to reduce the friction coefficient. The blowing effect helps to mix the fluid in the boundary layer with the fluid in the freestream. This mixing helps to reduce the velocity gradient in the boundary layer, which also helps to reduce the friction coefficient.
6. Conclusion
An open channel with a compressible fluid in it was studied in this study in order to develop a numerical model to simulate the behavior of an obstacle. The porosity of a portion of the obstacle surface was created, and the effects of the porosity on the shock wave, and the interaction between the shock wave and the boundary layer of the obstacle surface, were investigated as a result of the porosity. A significant weakening of the shock wave can be observed after the shock, while a decrease in the Mach number can be observed after the shock. Due to the reduction of the effects of shock waves and boundary layer interaction, the friction coefficient of the skin is also reduced by about 38%. After the shock, the porous surface may cause the skin to create a blowing effect, which contributes to the reduction in skin friction. Consequently, the boundary layer is thickened after an obstacle compared to when there is no porosity present, and the size of the bubble that forms behind the obstacle is also increased as a result of this blowing effect. Finally, it may be possible to reduce the severity and delay the formation of shock waves by using a porous medium, as well as to reduce the coefficient of friction between the skin and the medium. Various applications can benefit from this, including the reduction of noise pollution and the improvement of turbine efficiency.
Declarations Conflict of interest
The authors declare no competing interests.
References
- D. Fadda and P. E. Raad, “Open Channel Flow Over Submerged Obstructions: An Experimental and Numerical Study,” J. Fluids Eng., vol. 119, no. 4, pp. 906–910, Dec. 1997. [CrossRef]
- J. L. Rosales, A. Ortega, and J. A. C. Humphrey, “A NUMERICAL INVESTIGATION OF THE CONVECTIVE HEAT TRANSFER IN UNSTEADY LAMINAR FLOW PAST A SINGLE AND TANDEM PAIR OF SQUARE CYLINDERS IN A CHANNEL,” Numer. Heat Transf. Part A Appl., vol. 38, no. 5, pp. 443–465, 2000. [CrossRef]
- A. Okajima, H. Ueno, and H. Sakai, “Numerical simulation of laminar and turbulent flows around rectangular cylinders,” Int. J. Numer. Methods Fluids, vol. 15, no. 9, pp. 999–1012, Nov. 1992. [CrossRef]
- M. Marquillie and U. Ehrenstein, “On the onset of nonlinear oscillations in a separating boundary-layer flow,” J. Fluid Mech., vol. 490, pp. 169–188, Sep. 2003. [CrossRef]
- U. Ehrenstein and F. Gallaire, “Two-dimensional global low-frequency oscillations in a separating boundary-layer flow,” J. Fluid Mech., vol. 614, pp. 315–327, 2008. [CrossRef]
- M. D. Griffith, M. C. Thompson, T. Leweke, K. Hourigan, and W. P. Anderson, “Wake behaviour and instability of flow through a partially blocked channel,” J. Fluid Mech., vol. 582, pp. 319–340, Jul. 2007. [CrossRef]
- J. Mendonca and M. A. R. Sharif, “Effects of Surface Roughness on Turbulent Transonic Flow Over Circular Arc Bumps in a Channel,” Eng. Appl. Comput. Fluid Mech., vol. 4, no. 2, pp. 164–180, Jan. 2010. [CrossRef]
- J. J. Wang, Y. L. Ba, and L. H. Feng, “Experimental investigation on laminar separation control for flow over a two-dimensional bump,” J. Turbul., vol. 15, no. 4, pp. 221–240, Apr. 2014. [CrossRef]
- K. H. Lo and K. Kontis, “Flow visualisation of a normal shock impinging over a rounded contour bump in a Mach 1.3 free-stream,” J. Vis., vol. 20, no. 2, pp. 237–249, May 2017. [CrossRef]
- M. A. Biot, “Theory of Propagation of Elastic Waves in a Fluid-Saturated Porous Solid. II. Higher Frequency Range,” J. Acoust. Soc. Am., vol. 28, no. 2, pp. 179–191, Mar. 1956. [CrossRef]
- G. P. Tsinker, “Port engineering: planning, construction, maintenance, and security,” p. 881, 2004, Accessed: Sep. 30, 2023. [Online]. Available: https://books.google.com/books/about/Port_Engineering.html?id=kXaAKdwyJzYC.
- Z. Wu et al., “Experimental and numerical studies of the pressure drop in ceramic foams for volumetric solar receiver applications,” Appl. Energy, vol. 87, no. 2, pp. 504–513, Feb. 2010. [CrossRef]
- L. Bahi, J. M. Ross, and H. T. Nagamatsu, “PASSIVE SHOCK WAVE/BOUNDARY LAYER CONTROL FOR TRANSONIC AIRFOIL DRAG REDUCTION.,” AIAA Pap., 1983. [CrossRef]
- A. Khalghani, M. Pasandideh-Fard, and M. H. Djavareshkian, “Aerodynamic shape study of supersonic surface to surface missiles with continuous flexible nose,” J. Mech. Sci. Technol., vol. 30, no. 7, pp. 3183–3192, Jul. 2016. [CrossRef]
- J. M. Pérez, P. Paredes, and V. Theofilis, “Global Instability Analysis of Laminar Boundary Layer Flow Over a Bump at Transonic Conditions,” Procedia IUTAM, vol. 14, pp. 503–510, Jan. 2015. [CrossRef]
- S. E. Hosseini, O. Karimi, and M. A. AsemanBakhsh, “Experimental Investigation and Multi-objective Optimization of Savonius Wind Turbine Based on modified Non-dominated Sorting Genetic Algorithm-II,” Preprints, Aug. 2023. [CrossRef]
- J. Zare, S. E. Hosseini, and M. R. Rastan, “NREL Phase VI wind turbine in the dusty environment,” arXiv Prepr. arXiv2304.06285, Apr. 2023. [CrossRef]
- M. H. Shojaeefard, S. E. Hosseini, and J. Zare, “Numerical simulation and multi-objective optimization of the centrifugal pump inducer,” Modares Mech. Eng., vol. 17, no. 7, pp. 205–216, 2018.
- M. H. Shojaeefard, S. E. Hosseini, and J. Zare, “CFD simulation and Pareto-based multi-objective shape optimization of the centrifugal pump inducer applying GMDH neural network, modified NSGA-II, and TOPSIS,” Struct. Multidiscip. Optim., vol. 60, no. 4, pp. 1509–1525, May 2019. [CrossRef]
- S. E. Hosseini and A. Keshmiri, “Experimental and numerical investigation of different geometrical parameters in a centrifugal blood pump,” Res. Biomed. Eng., vol. 38, no. 5, pp. 423–437, 2022. [CrossRef]
- A. Nakayama, F. Kuwahara, and Y. Sano, “Concept of equivalent diameter for heat and fluid flow in porous media,” AIChE J., vol. 53, no. 3, pp. 732–736, Mar. 2007. [CrossRef]
- O. Karimi, M. K. Koopaee, A. reza Tavakolpour-Saleh, and S. E. Hosseini, “Investigating Overlap Ratio Effect on Performance of a Modified Savonius Wind Turbine: An Experimental Study,” Preprints, Aug. 2023. [CrossRef]
- J. Zare, S. E. Hosseini, and M. R. Rastan, “Airborne dust-induced performance degradation in NREL phase VI wind turbine: a numerical study,” Int. J. Green Energy, pp. 1–20, Aug. 2023. [CrossRef]
- S. E. Hosseini, O. Karimi, and M. A. AsemanBakhsh, “Multi-objective Optimization of Savonius Wind Turbine,” arXiv:2308.14648, Aug. 2023. [CrossRef]
|
Disclaimer/Publisher’s Note: The statements, opinions and data contained in all publications are solely those of the individual author(s) and contributor(s) and not of MDPI and/or the editor(s). MDPI and/or the editor(s) disclaim responsibility for any injury to people or property resulting from any ideas, methods, instructions or products referred to in the content. |
© 2023 by the authors. Licensee MDPI, Basel, Switzerland. This article is an open access article distributed under the terms and conditions of the Creative Commons Attribution (CC BY) license (http://creativecommons.org/licenses/by/4.0/).
