1. Introduction
Depopulation is a reality experienced by many countries in our modern world [
1,
2]. [
3] conceptualize depopulation as a combination of population decline, economic downturn, loss of employment numbers, and other social issues. Similarly, [
4] argues that depopulation stems from the interplay of multiple macro-processes at the local scale. The root causes of depopulation range from demographic [
5] to environmental [
6] and economic issues [
7]. Economic factors are considered the most crucial to resolving this issue since many depopulated areas are generally economically depressed [
8].
The long-term depopulation or “shrinkage” of rural areas deeply affects their development process in terms of economic, cultural, social, and environmental dimensions, resulting in a self-reinforcing vicious cycle of decreasing potential for maintaining their regional vitality [
9]. Such a population loss calls for regional adaptive policies to reverse this shrinkage and keep the region’s economy alive. Tourism development remains a promising option to balance the adverse effects of economic restructuring, specifically in rural areas [
10]. Tourism provides income and employment opportunities in host communities, motivating local-scale production, enhancing incomes in the local economy, and improving residents' material standard of living [
11]. From this perspective, it is crucial to investigate how tourism can help revive rural areas [
12] since rural tourism is one alternative that can prevent or reverse depopulation [
13]. Interestingly, [
14] claims that rural tourism profoundly supports socioeconomic regeneration and diversification.
Consequently, attention should be paid to advancing the local population's well-being and making the region a welcoming place to live [
15]. In addition, researchers have identified the growing interest of rural tourism enterprises in developing their services towards wellness offerings [
16].
The complexity of modern tourism markets requires destinations to consider different segments, seeing tourists as a heterogeneous pool of consumers [
17]. However, the preferences of wellness tourists who visit rural destinations and the mechanisms that shape their visitation patterns have been overlooked, even though the tourism literature has emphasized the importance of wellness products in developing targeted marketing plans and destination management [
18,
19]. [
20] argue that generating information about wellness tourism demand and the preferences of visitors who travel for wellness motives is necessary and essential.
In light of such concerns, this study investigates opportunities to re-develop depopulated rural areas by fostering wellness tourism products. We apply quantitative methods to decode visitors' preferences for wellness tourism products that can be used to design customer-driven wellness offers.
Therefore, the main research goal of this study is to identify the preference ranking of a bundle of attributes with different perceived values derived from conjoint analysis (CA) and elaborate on their monetary valuation in terms of visitors' WTP using the contingent valuation method (CVM).
The paper proceeds as follows. Section two presents the literature review, while section three develops the methodology and the econometric procedures used to analyze the survey data. Section four presents the empirical findings and interprets the results. Finally, section five discusses the findings' implications and offers the research endeavor's conclusions.
2. Literature Review
Many economically depressed rural areas have sought ways to embed tourism as a driver of economic development, conservation, and rehabilitation of the sociocultural and historical-artistic heritage and revitalization of local life [
21]. Therefore, to advance an area as a tourism destination, especially if it has undergone a high degree of depopulation, it is important to investigate the motivations of tourists, and how these motivations impact their choice of activities in relation to rural tourism [
13]. Rural wellness tourism is the combination of rural resources with wellness tourism offerings. Therefore, rural destinations may match wellness services with existing tourism resources to create social value [
22] and market success [
17].
Consistency in the literature regarding the definition of wellness tourism is lacking, and opinions on what forms the concept of wellness diverge significantly [
23]. Wellness tourism destinations provide visitors with good and welcoming natural environments and/or particular cultures to preserve or improve their health [
20,
24] without medical intervention during their stay at the destination [
25,
26,
27] conceptualize wellness tourism as a holistic process that directly involves the human need for physical health, beauty, longevity, consciousness-raising, spiritual sensibility, and connections with the community, the environment, or religion. Understanding the complexity and the significant number of perspectives and approaches to wellness, in the Global Spa & Wellness Summit, the concept of wellness tourism was defined as travel associated with the pursuit of maintaining or enhancing one's personal well-being [
28]. With increased economic growth, aging populations, and the advancement of human health consciousness, wellness tourism concerns a new tourism market segment promoting healthy, ecological, and green lifestyles [
29]. In the literature, it is common to see the terms health, wellness, and medical tourism used interchangeably, although there is a clear distinction among these concepts [
25,
30].
Wellness tourism is a growing niche worldwide, providing specific opportunities to businesses offering products that promote or maintain health [
31,
32]. As indicated by [
29], the current literature is either descriptive or focuses on particular aspects of wellness tourism's supply [
19,
33,
34]) or demand [
18,
35,
36]. Demand-focused trends are linked to the customer or the tourist and their wellness desires. In contrast, the supply-related trends relate to the wellness tourism providers and their response to the demand side expectations [
37].
Many studies see wellness holistically [
19,
38,
39,
40], pointing to the development of tourism that is increasingly oriented toward wellness [
41,
42]. Specifically, as reported by [
43], on the supply side, researchers have focused on the characteristics and potential of development strategies for the wellness tourism industry [
33,
44,
45,
46,
47]. On the demand side, researchers have focused on the sociodemographic and behavioral characteristics [
48,
49,
50], motivations [
31,
51,
52], and experiences [
53] of wellness tourists, along with the factors that enhance their well-being [
54,
36] and influence their travel decision-making [
55,
56]. However, the concept of visitors' preferences for wellness tourism products has not been adequately investigated and is less visible.
Thus far, empirical research efforts on wellness tourism do not clearly explain or characterize visitors' preferences in wellness destinations. Recognizing this gap in the literature, a more in-depth look at the preferences of wellness visitors is necessary to support the continuous improvement, planning, and management of this rapidly growing market. Therefore, it is necessary to develop studies that enable providers and managers to understand the preferences of visitors who perceive and use the wellness destination differently, approaching wellness tourism as a heterogeneous market rather than a homogenous entity. In addition, preferences have been acknowledged as core elements to explain traveler behavior at the destination [
57]. By investigating and understanding consumer preferences and their associated monetary value, we can develop marketing strategies that increase customer satisfaction, loyalty, and retention [
58], thus supporting the economic sustainability of tourism in rural areas. Notably, it is crucial to decode and incorporate visitors' preferences into tourism planning to enhance a destination's economic potential [
59].
Within the body of literature on wellness tourism, the majority of studies focused on issues such as motivations to travel for wellness [
60,
61,
56,
62,
18], market demand analysis [
63,
33,
64,
20,
65,
23], and the impact of wellness tourists on residential communities [
43]. [
30] suggest that empirical studies should be applied in the field of wellness tourism "to glean in-depth information about who these tourists are or exactly what they are looking for, and what it is worth to them" (p.16). In sum, the previous research has not sought to study preferences for wellness tourism, and many of the questions remain without an answer pertaining to visitors' preferences at wellness destinations. To address this literature gap, we first employ CA to determine the combination of characteristics that maximizes visitors' utility. In the context of tourism, CA has been used extensively to study visitors' preferences [
66,
67,
68,
69,
70,
71,
72,
73].
We go one step further and estimate how visitors value these preferred attributes of the proposed wellness product in monetary terms to develop a research-based approach that can be used for effective destination marketing. The significance of visitors' willingness to pay in tourism studies has been widely highlighted [
74,
75,
76,
77,
78,
79,
80,
81,
82,
83,
84,
85]. Nevertheless, to the best of our knowledge, no empirical research studies have shown the link between preferences elicited with CA and visitors' WTP for these preferred attributes.
The concept of WTP should be considered not merely as a monetary variable in the tourism category, but as a critical factor that can have multiplicative effects on a destination's performance. In other words, visitors' WTP should be seen as a determining factor that may generate positive externalities and multiplicative effects in destination economies [
86]. Our study also highlights the potential for wellness tourism-driven economic revitalization to scale back depopulation effects on rural places, a critical sustainability challenge of rural landscapes. This is a paramount contemporary issue in developed and developing worlds alike, resulting from the global trend of urbanization [
87].
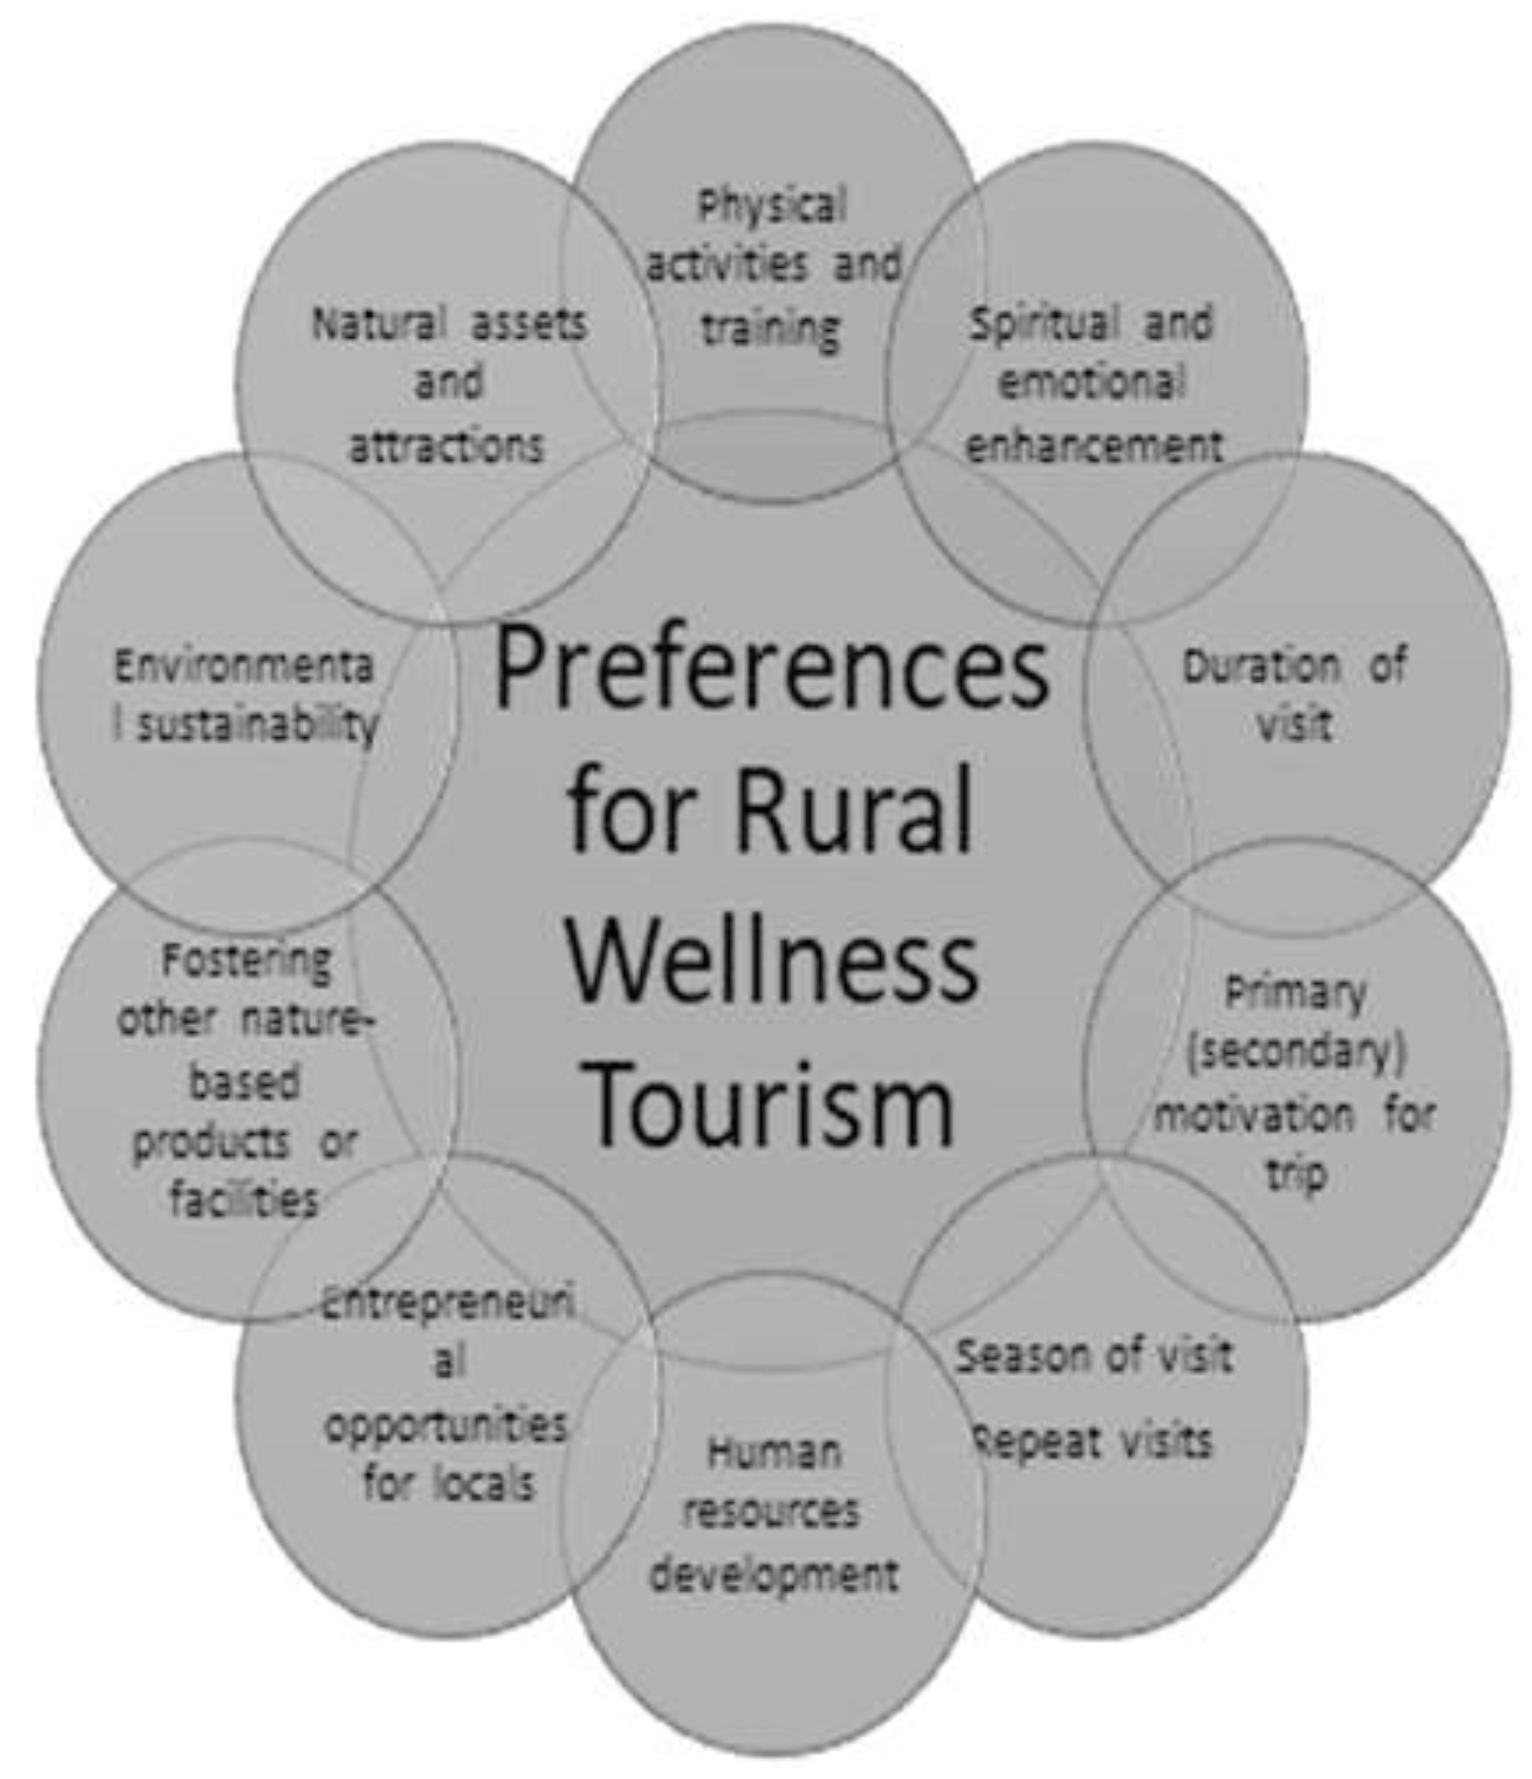
The key that can unlock the potential of wellness tourism to revitalize depressed rural areas is creating and establishing customer-driven tourism products that meet visitors’ needs and fulfill expectations. Doing so requires a better understanding of visitors’ preference structure, or the preferred attributes of the wellness offerings. Our framework considers the different attributes that could be part of a wellness tourist’s preference structure, such as duration of visit, whether wellness is the primary motivation for a trip, the season in which the trip is to take place, the type and focus of wellness activities, and the added benefits of wellness tourism, such as the development of human resources and environmental sustainability (
Figure 1). The final step is determining the willingness to pay for these preferred attributes.
Such a research perspective supports the formulation of customer-driven tourism products tailored to visitors' preferences, thereby developing a unique wellness tourism experience that provides 'value for money' and 'value for time’ spent for the delighted visitor. Supportively, the visitor’s changing preferences and needs are partial driving forces for the rise and fall of a destination [
88].
3. Methodology
3.1. Sudy Area
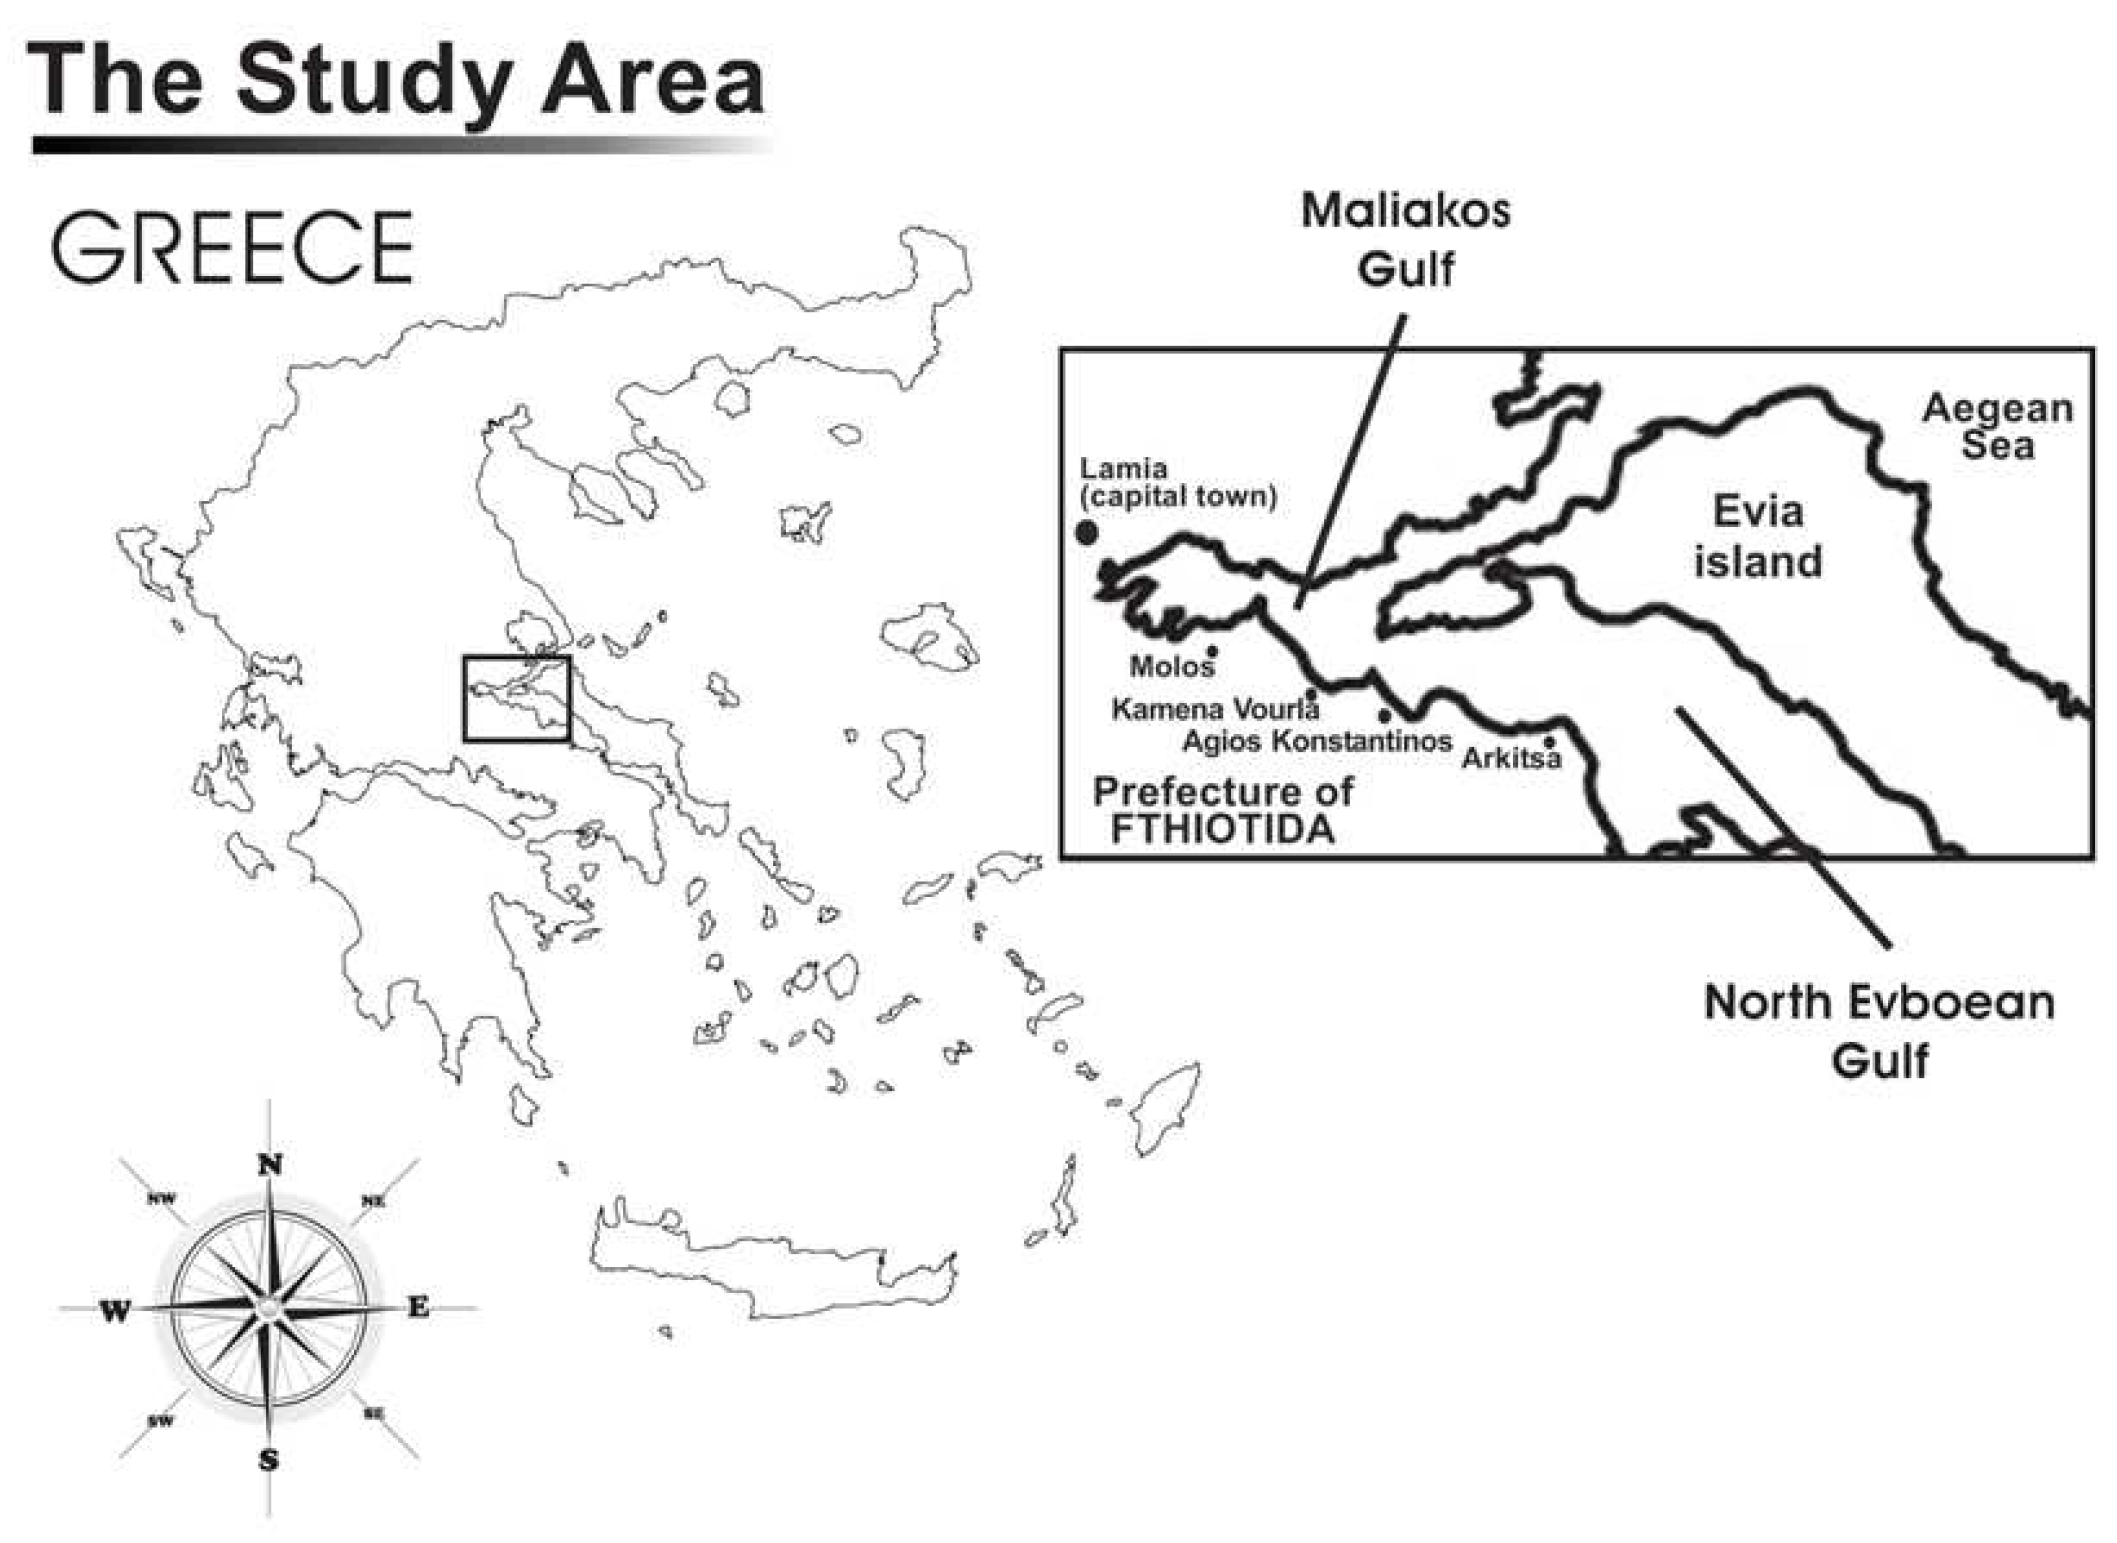
The empirical component of this study is centered around the existing but derelict thermal lagoons in the town of Kamena Vourla, in the Municipality of Molos – Agios Konstantinos, in the Prefecture of Fthiotida, in Central Greece.
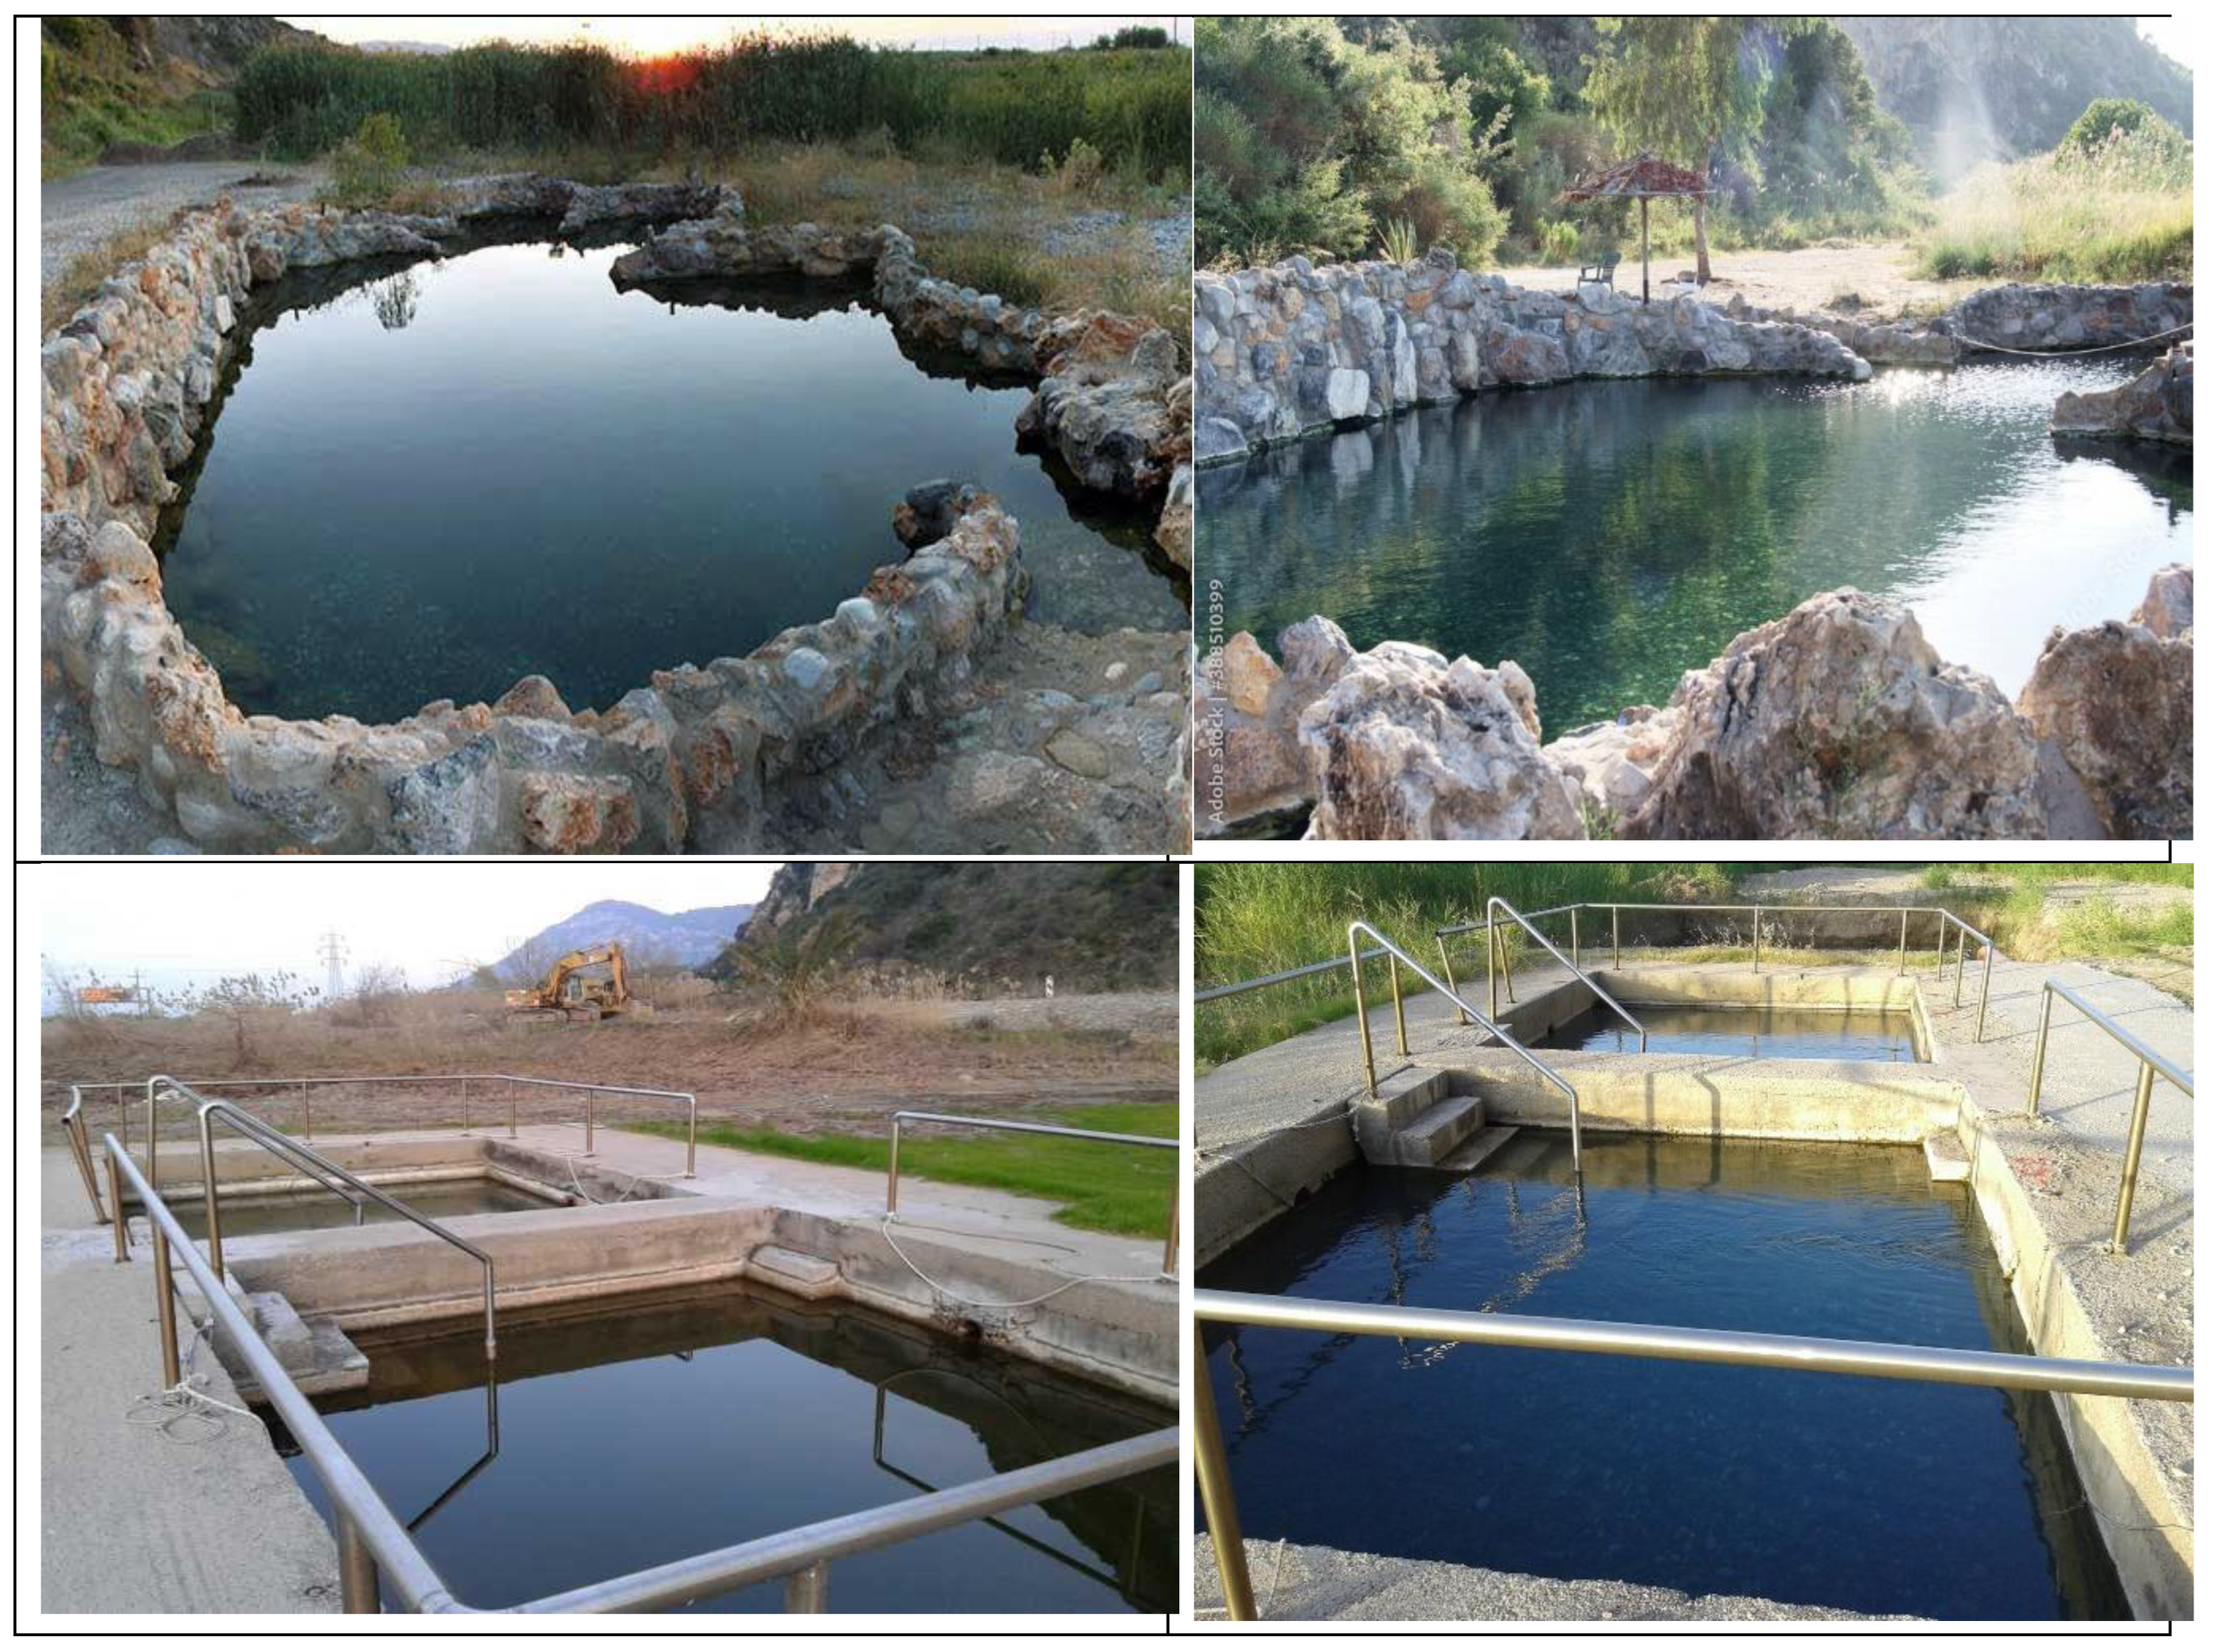
Figure 2 shows the location of Kamena Vourla in Greece and provides an overall glimpse of the wider region. Only a few hot thermal spring lagoons exist in the study area, known locally as ‘Koniavitis’ thermal springs (
Figure 3). This area was selected as a study site because it serves as an archetype of similar settings where the landscape's dominant feature is an interface between the rural environment and naturally occurring or pre-existing wellness resources.
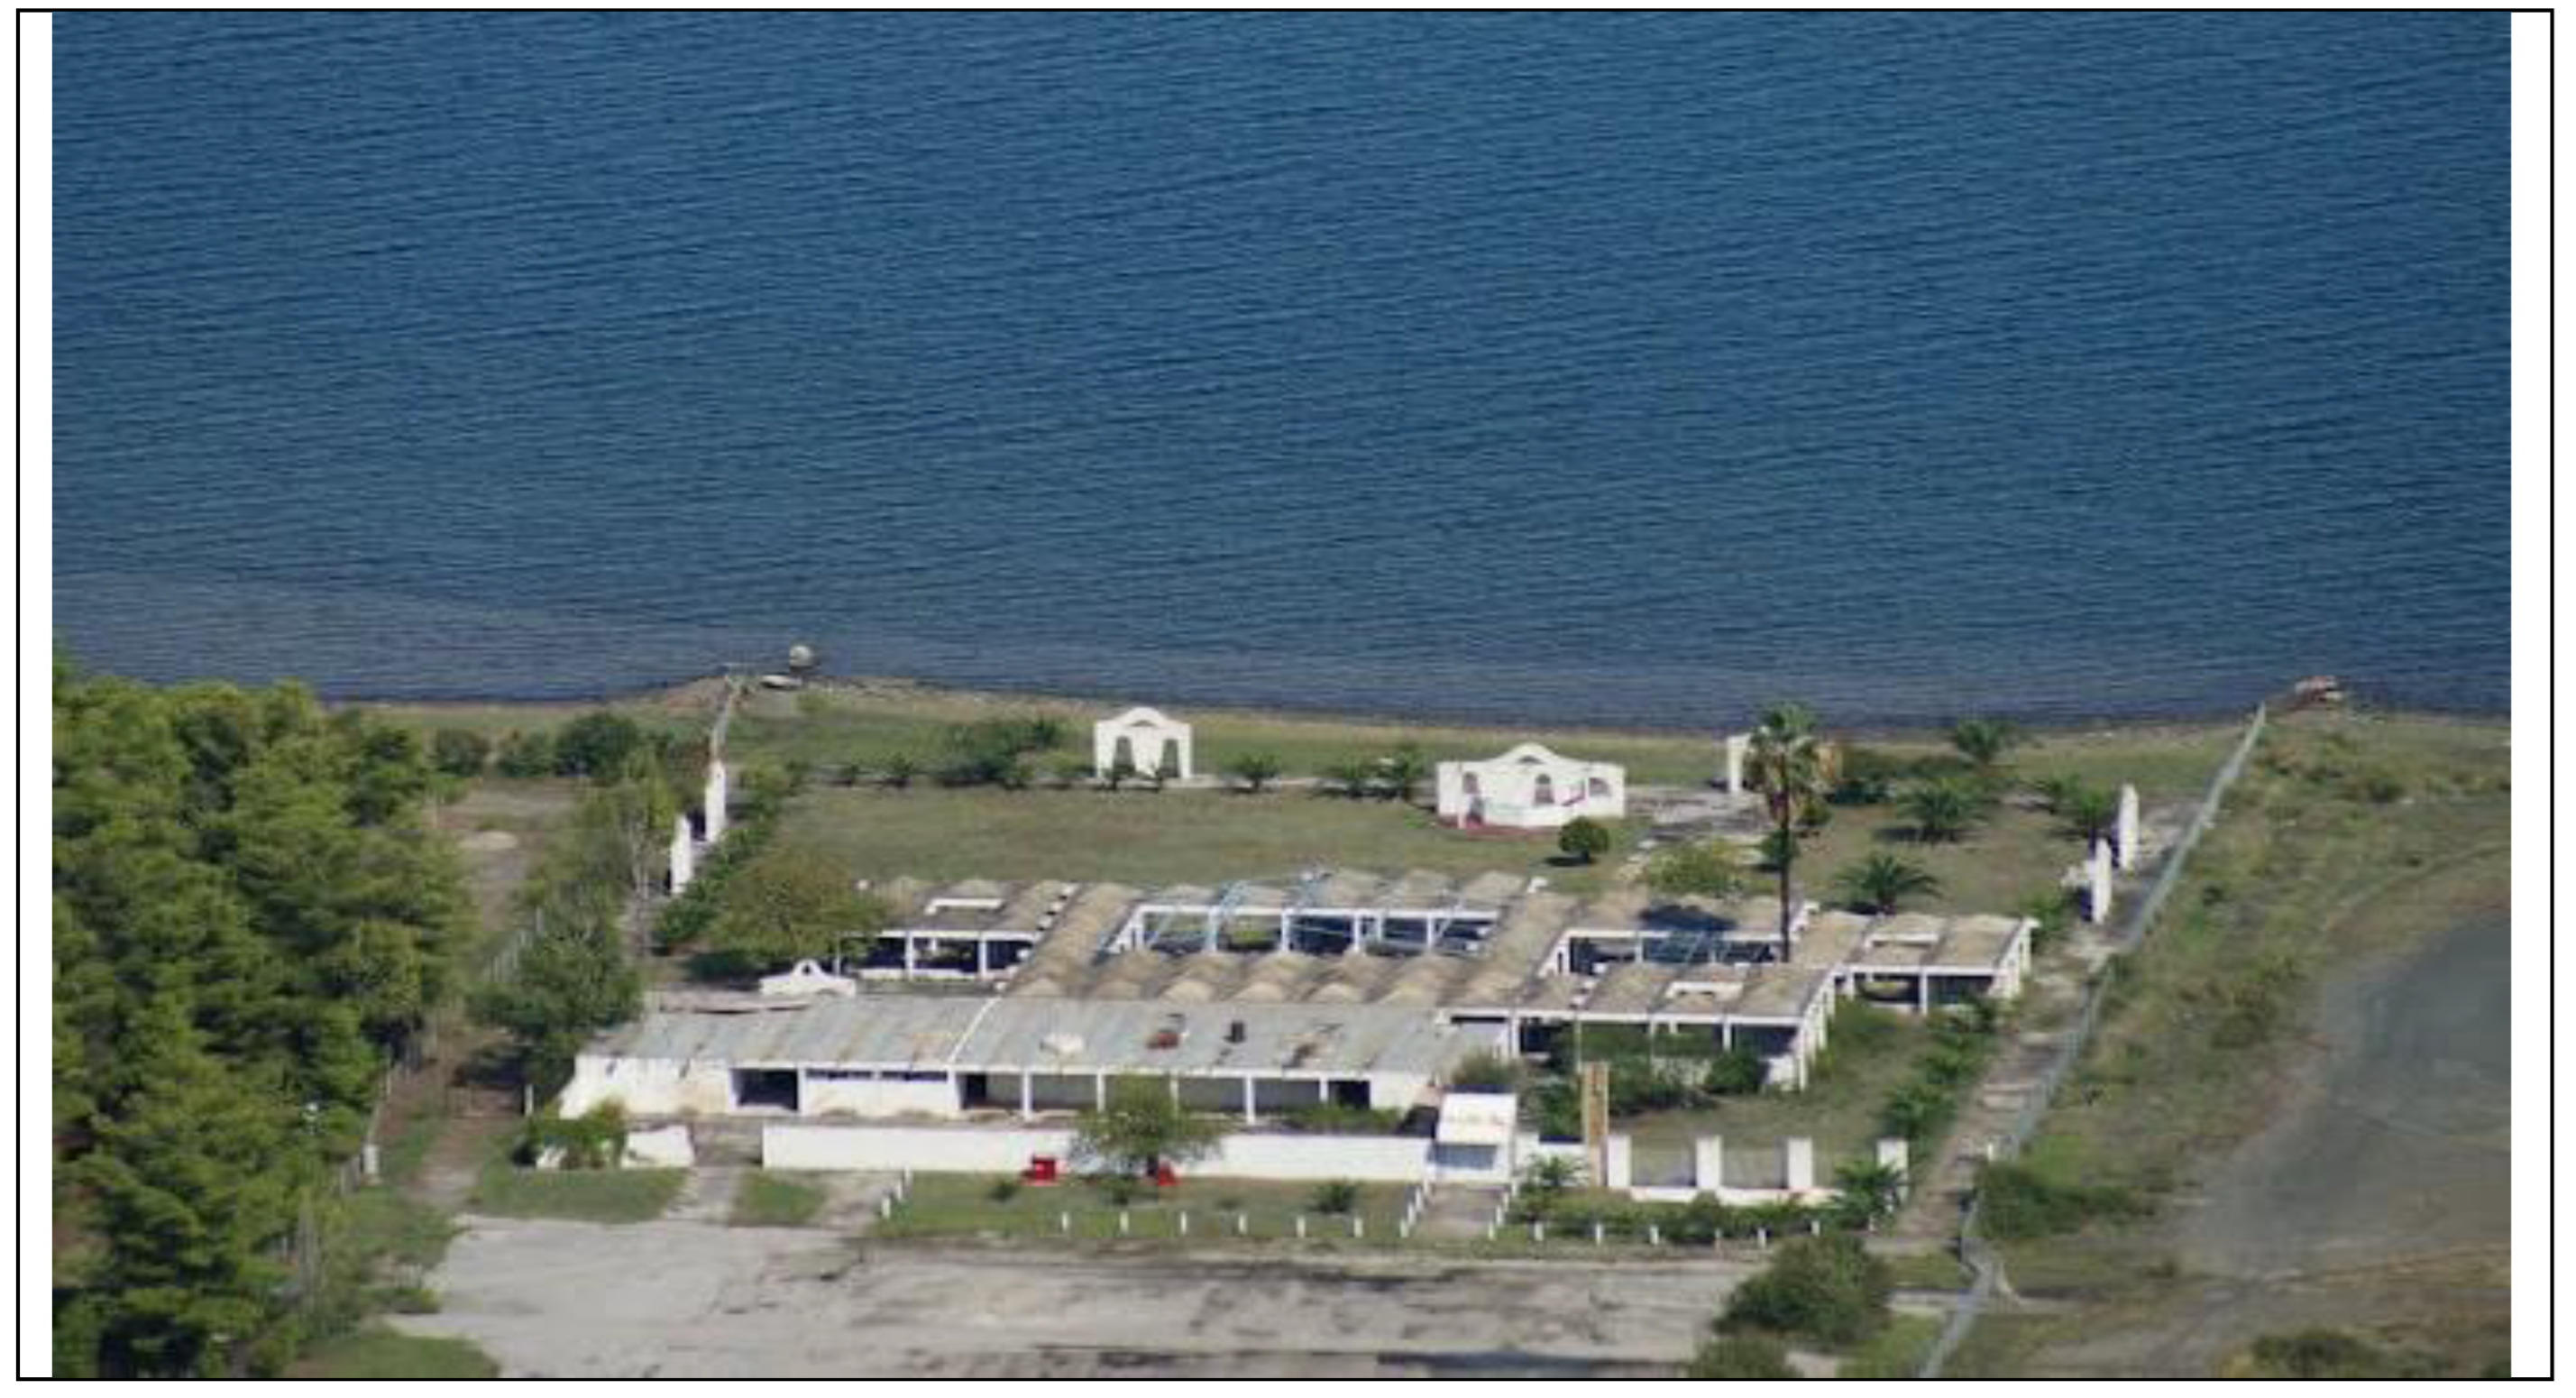
However, these lagoons are underdeveloped, meaning that no supportive facilities and relevant infrastructure are present in the area. For instance, buildings, treatment installations, and bathing facilities around and very close to the location of the thermal spring lagoons are out of use, derelict, or abandoned. The current capacity for visitors to bathe in the thermal water is very limited due to the size and shape of these lagoons and the derelict state of support infrastructure. In practice, it is an open-access resource. The face-to-face survey was conducted at Koniavitis springs to capture visitors’ judgments for further wellness development of the existing pools and re-development of the existing infrastructure, shown in
Figure 3. Tourists were intercepted at a point very close to the existing underdeveloped lagoons, between the site of the lagoons and the center of the town of Kamena Vourla. The distance between the site and the town center is approximately 1 kilometer. The interviews were conducted in the Greek language since most visitors were domestic.
3.2. Data Collection
We used a structured questionnaire to elicit respondents’ preference rankings and willingness to pay for an ideal wellness tourism product. The questionnaire was composed of an introductory section and four main sections. The introductory sections contained information about the research and its purpose. The first section included questions related to the travel behavior of respondents and their prior experience with wellness tourism products. Respondents stated if they had visited the research area in the past (Yes or No), the current duration of stay in the study area (days), and if they had received wellness tourism services in the past in any area (Yes or No). Furthermore, respondents were asked to state if they believe that the development of wellness tourism in the area can transmit to the visitor a message of: (i) the protection of the study area through their responsible behavior (Yes or No) and (ii) a relationship between sustainability and the use of the area’s natural resources, such as the thermal spring water (Yes or No). Respondents were also asked to state if they believe that the development of wellness tourism can contribute to: (i) developing new skills in terms of human resources (Yes or No); (ii) improving the quality of the overall tourism experience in the area (Yes or No); (iii) enriching the provided tourism product in regards to other forms of nature-based tourism such as fishery tourism (Yes or No); (iv) developing new tourism facilities such as marinas for cruise boats and yachts (Yes or No); and (v) developing entrepreneurship in fields such as the food and beverage sector or gastronomy (Yes or No).
The second section of the survey included the CA and the combinations of attributes of the proposed tourism product. The third section of the survey included the CVM to elicit respondents’ WTP to access or enjoy the preferred tourism product. Finally, in the fourth section of the survey, respondents were invited to answer questions concerning their socioeconomic and demographic characteristics. The final questionnaire was the output of a comprehensive literature review focusing on wellness tourism product attributes and formulating questions based on local peculiarities, specific needs, and the authors’ expert judgment. Data collection took place in the summer of 2021, from June 1st 2021, to October 31st 2021.
The cluster sampling technique was used as a sampling method since no pre-existing sample of tourists to the study region was available [
89]. Cluster sampling is a random sampling technique in which a cluster “constitutes the sampling unit, instead of a single element of the population” [
90], (p.2). The population of interest is divided into nonoverlapping populations called clusters [
91,
92]. The clusters (N) denote the sampling frame. After dividing the population into N clusters, a simple random sample of these clusters (n) is selected [
93,
90]. In our case, the N clusters denote the days between June 1st 2021, and October 31st 2021, namely 153 days. Then, from these N clusters (N=153 days), the researcher randomly selects n clusters (days) to conduct the on-site interviews (simple random sample). In our case, with the help of a random number table, 45 days (n clusters) were selected to deploy the survey. Each day of the 45 days of the research constitutes the sampling unit of the research [
94]. The term cluster denotes each particular day on which the research took place. According to the cluster sampling technique, the respondents are the elements or items of each day of the 45 days of data collection. The cluster sampling technique is more cost-effective and time-saving than other options [
95,
94,
89]. During the sampling period, 595 questionnaires appropriate for statistical analyses were collected out of a total of 688 responses. Ninety-three responses were deemed unsuitable for statistical analysis because of incomplete answers.
3.3. Conjoint Analysis (CA)
Conjoint Analysis (CA) incorporates the preferences ranked by the targeted users of a product and/or a service and is used to “decompose the holistic information about respondents’ reactions (e.g., statements or choices) to a set of stimuli into the relative importance of each level of each factor (or attribute) according to a pre-specified utility model” [
96] (p4). In other words, CA is based on the premise that a consumer’s utility from the consumption of a good can be decomposed into part-worth utilities or values regarding the benefits or attributes this good offer [
97,
98].
The first step in applying the method was determining the attributes of the proposed tourism product and the respective levels for each attribute. For the present study, four attributes were used, as indicated in
Table 1. The first attribute was the ‘Time of the visit’ (levels: November – March, April – June, July – August, September – October), and the second attribute was the ‘Duration of the visit’ in days (levels: 1-7; 8-15; 15+). The third attribute was the ‘Purpose of the visit’ (levels: The primary purpose is wellness tourism; The secondary purpose is wellness tourism), and the last attribute was the ‘Types of wellness activities’ (levels: Physical activities and training; Spiritual and emotional enhancement; Physical activities and training, and spiritual/emotional enhancement). The ‘Time of the visit’ was chosen to investigate if potential wellness visitors prefer the high or peak tourism season to enjoy wellness activities. The attribute ‘Duration of the visit’ was selected to understand how many days future visitors prefer to stay in the area, which can be integrated into potential wellness tourism packages. Finally, the ‘Purpose of the visit’ was included in terms of searching for the specific reason for the visit. The ‘Purpose of the visit’ is inherently tied to the prioritization of destination marketing and management efforts for placing wellness tourism at the core of the redevelopment of the area as a wellness destination or considering wellness tourism as a secondary development giving priority to other forms of tourism. The ‘Types of wellness activities’ were selected to understand if visitors prefer holistic physical and spiritual options to improve their wellness (
Table 1).
The first attribute is composed of 4 levels; the second is composed of three levels; the third one includes two levels; while the fourth encompasses three levels, resulting in 4 x 3 x 2 x 3 = 72 possible combinations of product attributes. In the context of CA, each combination of product attributes represents a profile of the proposed tourism product that the survey participants must rank. In practice, ranking 72 combinations is not feasible due to respondents’ potential confusion and fatigue. Therefore, to avoid dysfunctions and low completion rates of the questionnaire, a fractional factorial design was produced using the orthogonal main-effect plan resulting in sixteen combinations of attributes. The orthogonal design (orthogonal main-effect plan) ensures that the attributes’ levels are uncorrelated and that the estimate of one factor is unaffected by the estimates of the others [
99,
100]. Respondents were presented with all these 16 combinations of characteristics representing wellness tourism visits in the form of a profile. The profile presented to the respondents can be seen in Appendix 2. All survey respondents were visitors to the study area. Respondents were asked to rank these combinations of characteristics. The results were coded by assigning a value between 1 and 16: the most preferred combination took the value one (1), and the least preferred the value sixteen (16). This method can define the preference structure concerning the proposed tourism product based on respondents' judgments. The preference structure provides evidence of how important each attribute is in the overall decision and how the various levels within an attribute influence the overall preference, which is measured by a set of parameters called part-worth utilities (Cheung & Chang, 2008). Part-worth utilities represent the relative value respondents place on each product attribute’s levels [
101]. CA data are analyzed with Ordinary Least Square Regression (OLS) to estimate part-worth utilities [
102,
103]. The conjoint action of two or more attributes represents the independent variables, and the respondents’ preference rankings represent the dependent variables [
104]. Based on the same logic, all utility values for each of the sixteen profiles (combinations of attributes) can be calculated, determining the preference structure based on respondents’ judgments.
3.4. Contingent Valuation Method
The Contingent Valuation Method (CVM) is a stated preference method that considers both use and non-use values [
105]. In many empirical research, CVM defines what a natural resource worth [
106]. A CVM survey asks respondents to state their preference in a hypothetical or contingent market, allowing researchers to estimate demands for goods or services that are not traded in existing markets. Respondents undergo a survey-based choice experiment that elicits whether or not they are willing to pay (WTP) for a change in the provision of goods or services for a specified price [
107]. Common payment vehicles in CVM studies may be specific amounts of additional taxes or entrance fees. Analysing the data using regression methods that recognize the binary nature of the dependent variable, researchers can estimate the amount of money respondents are willing to pay for the hypothetical good or service.
In the present study, the hypothetical scenario presented to survey respondents involved a proposed wellness tourism product, the attributes of which were ranked by the CA according to respondents’ preferences. After the ranking process, respondents were presented with a single-bound dichotomous choice (i.e., yes or no) question. In the single-bound dichotomous choice framework, the amount of money respondents choose whether or not they are willing to pay (bid amount) is randomly pre-specified in the questionnaires. The payment vehicle selected was a hypothetical entrance fee to enhance and further develop the existing thermal springs, lagoons, and wellness infrastructure from the derelict status quo outlined in the study area section. The bid amount ranged from 5€ to 50€ with a step increase of 5€. The single-bound format more accurately imitates real-life market situations in which consumers decide if they want to pay a specific price for a commodity or not. Such an approach is preferred to the open-ended elicitation format, as it is considered to be more incentive-compatible [
108]. The single-bound dichotomous choice WTP question simulates to a great extent real market situations “in which the decision is a take-it or leave-it situation, and because it has better properties in terms of incentive compatibility (see NOAA panel report in Arrow et al. 1993), it is more widely used than the open-ended format” [
109].
The willingness to pay question was introduced by telling respondents that by developing a tourism product based on wellness tourism, we might be able to improve the offered tourism experience in terms of quality and sustainability. Respondents were further told that the financial support of such an endeavor would require the payment of an amount in the form of an entrance fee (ticket) per visitor per day. Then respondents were asked if they were willing to pay X (€) to enhance wellness tourism in the study area. Respondents could answer “Yes” or “No” to this question in a take-it-or-leave-it decision. Thus, the respondent’s acceptance of the bid amount reflects their willingness to pay that bid value.
An essential decision point in the analysis is the treatment of protest votes. For example, respondents may object (protest) to the principle of placing a monetary value on the commodity provided, or they may feel strongly that the responsibility for provision falls on another actor, such as the Government [
110]. Additionally, respondents may protest against some components of the CVM survey [
111]. For example, protest bidders often object to the imposed market structure in a CVM study [
112] by disagreeing in principle with the payment vehicle or the mechanism to provide the good or service. Therefore, protest votes should be discriminated from genuine “No” answers because the bid level is too high. Differentiating between genuine or true “No” answers and protest “No” responses is based on responses to a follow-up question requesting the selection of reason(s) for refusing the bid from a menu of options [
110]. However, there is no common agreement in the literature on the criteria for categorizing responses as a protest or true zero value [
112]. Debriefing questions to define the reasons behind refusing the bid is essential to applying the CVM [
113]. Therefore, following CVM practice, protest votes were excluded from the calculation of WTP [
111] if individuals indicated in their debriefing answers that they disagreed in principle with the payment vehicle or were not interested in wellness tourism.
3.5. Binary Logistic Regression (BLR)
Logistic regression models the probability of presence and absence given the observed values of the predictor variables [
114,
115]. In logistic regression models, the dependent variable can be either binary or categorical, whereas the independent variables can be a mixture of continuous and categorical or binary variables. In BLR models, the dependent variable has a binary value, namely “Yes” (accept bid amount) or “No” (reject bid amount). In the BLR model used in the present study, we coded with 1 the answers of respondents that accepted the bid amount and with 0 the responses related to No answers. The variables used in the BLR model are described in
Table 2.
4. Results
4.1. Sociodemographic characteristics
In the survey, 595 participants offered complete responses for further analysis. Descriptive analysis showed that there were 345 male visitors and 250 female visitors. A total of 311 respondents were in the age group of 31-40 years old. The mean age of the respondents was 39.7 years. Most survey participants (212 respondents) had a monthly income of 1501-2000€, while 182 respondents were found to be self-employed. Concerning their level of education, the largest proportion of the respondents was well-educated since they possess a university degree (183 respondents).
4.2. Results of Conjoint Analysis
The utility scores (estimates) or part-worth utilities and the respective standard errors for each level of each attribute are presented in
Table 3.
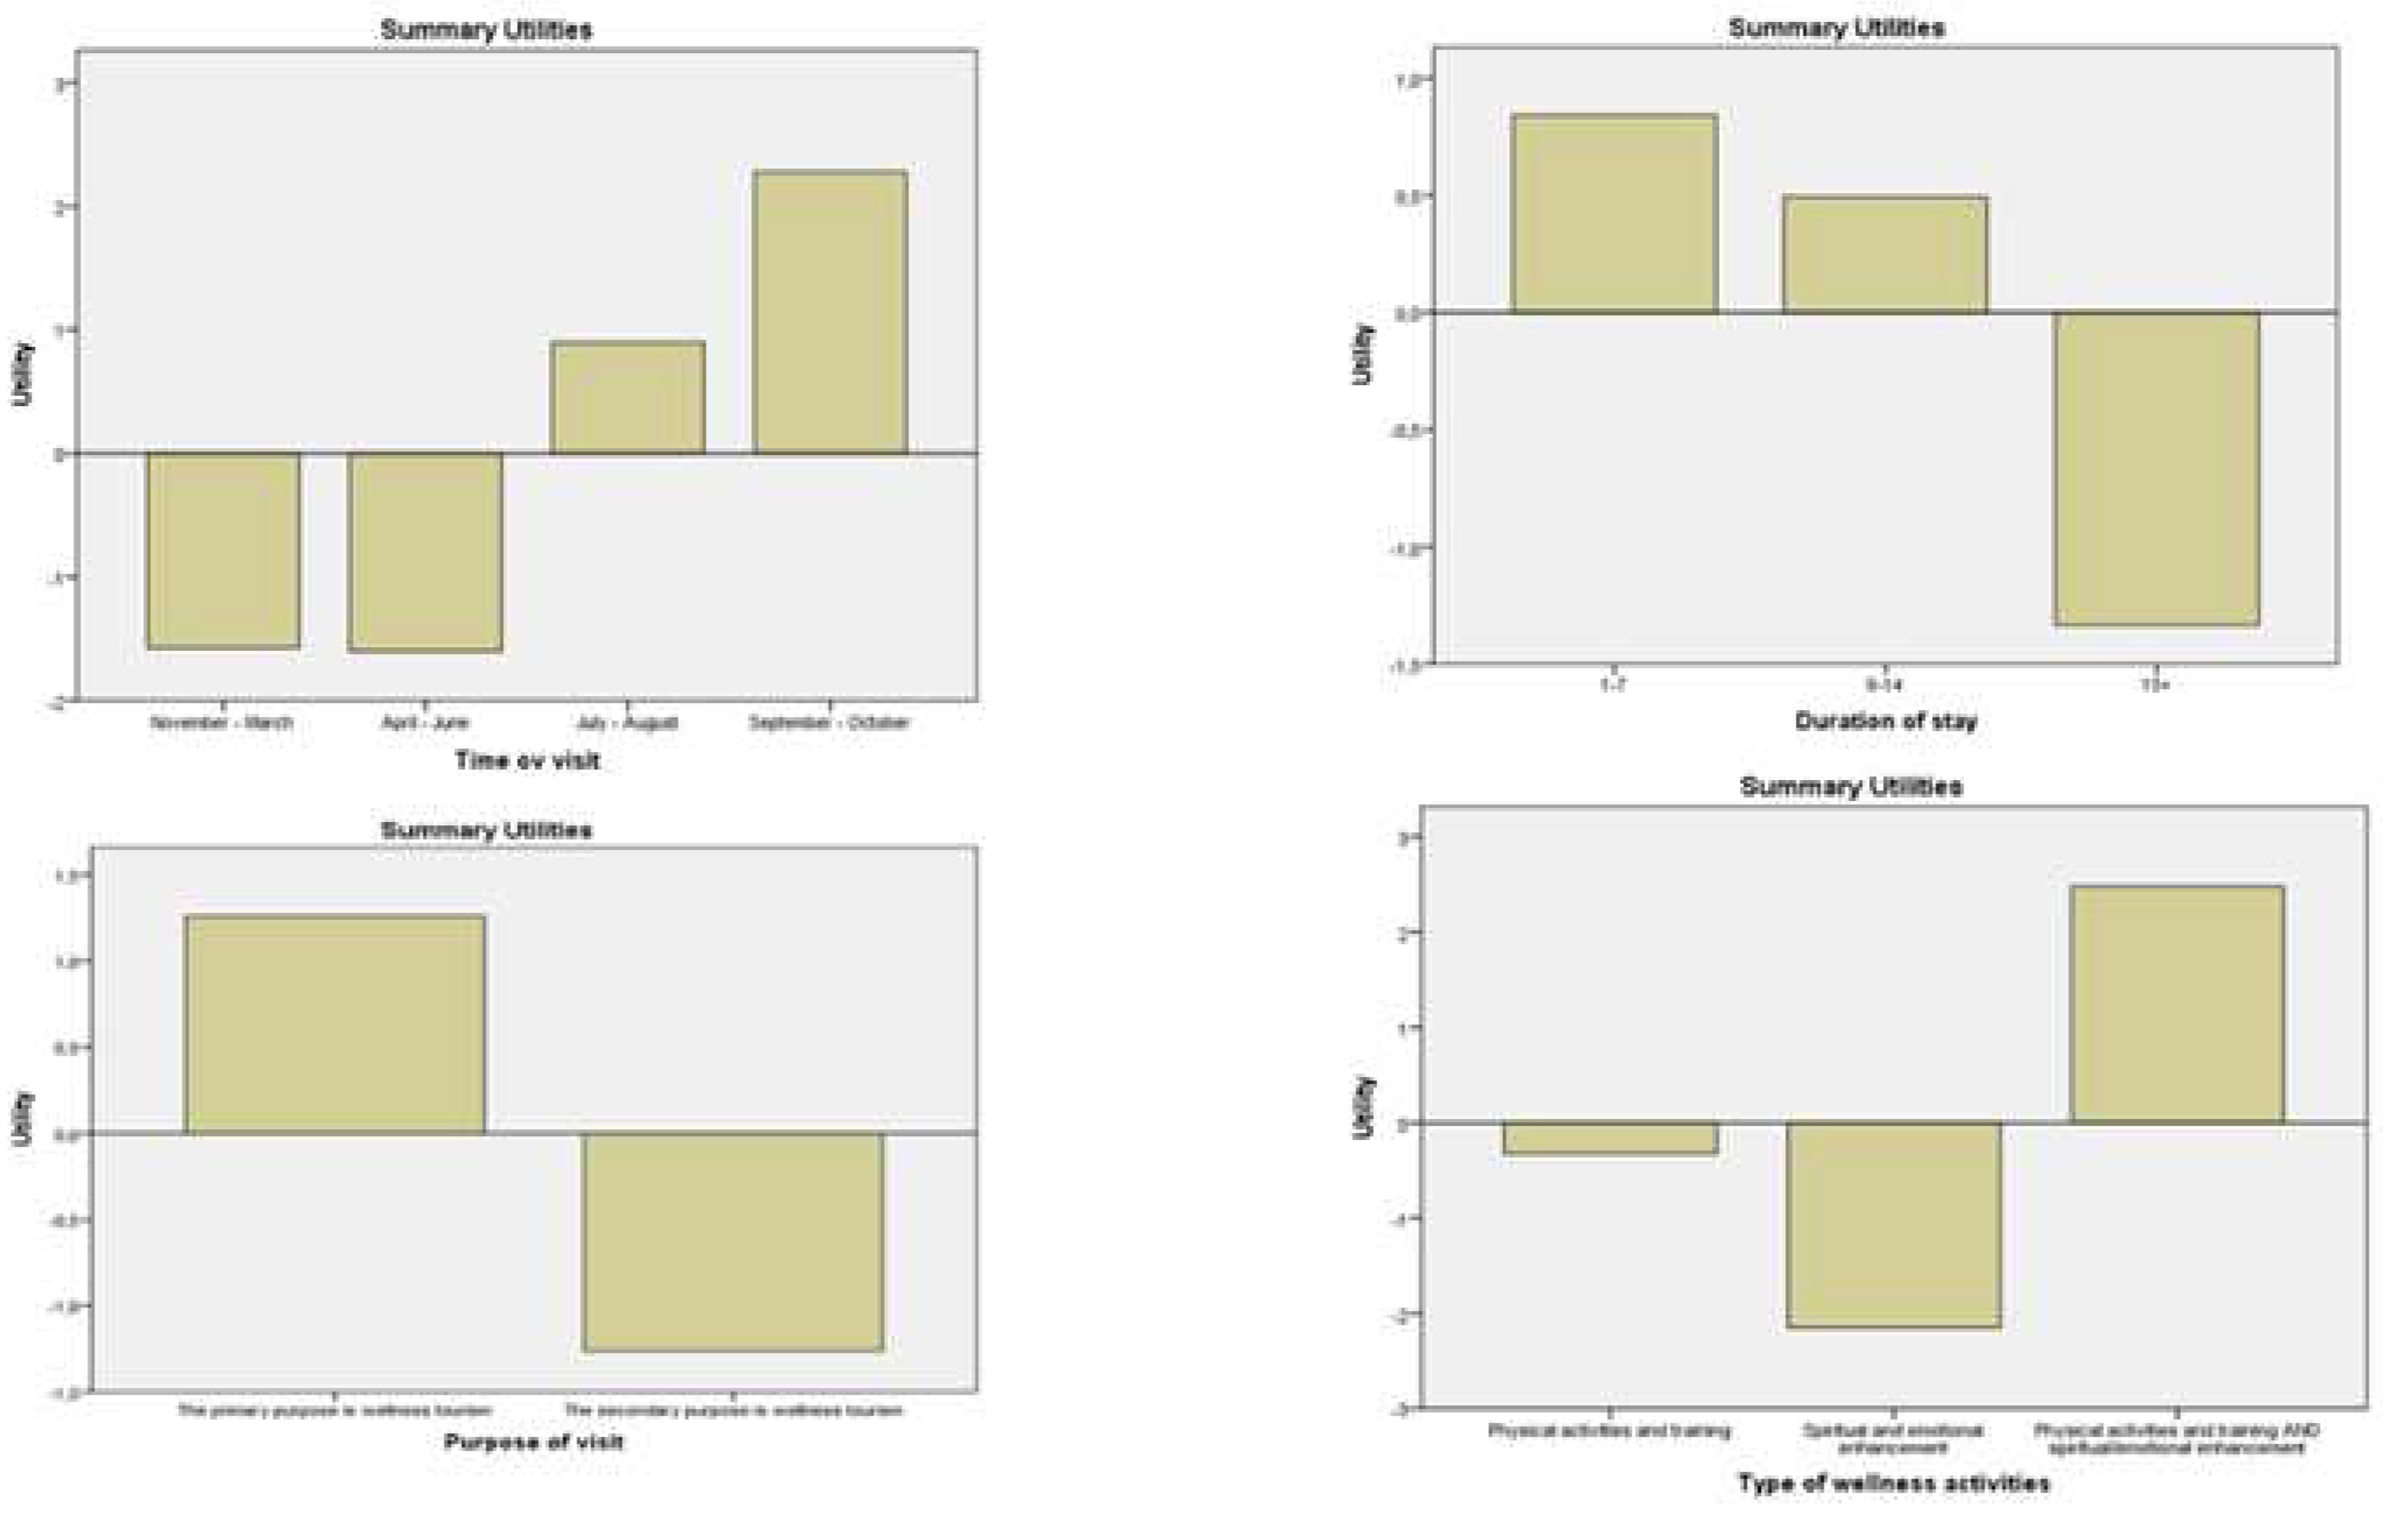
Figure 4 provides the graphical representation of the part-worth utilities, which measure the unique subjective judgment of preference. Part-worth utilities are used to determine the importance level of each attribute for that product and/or service [
116]. A low part-worth indicates less value; a high part-worth indicates more value for the specific level of the attribute. Negative values do not mean denial or rejection. The higher the utility values, the higher the preference, but higher negative values lead to lower utility. The total utility of the most preferred combination can be derived by adding the most preferred levels of each attribute in
Table 3. The constant value is also included in the calculations. As a result, the most preferred combination of the tourism product makes a total utility value of 15.232.
The importance values reflect the contribution of each factor to the overall preference of the good or service consisting of a bundle of attributes.
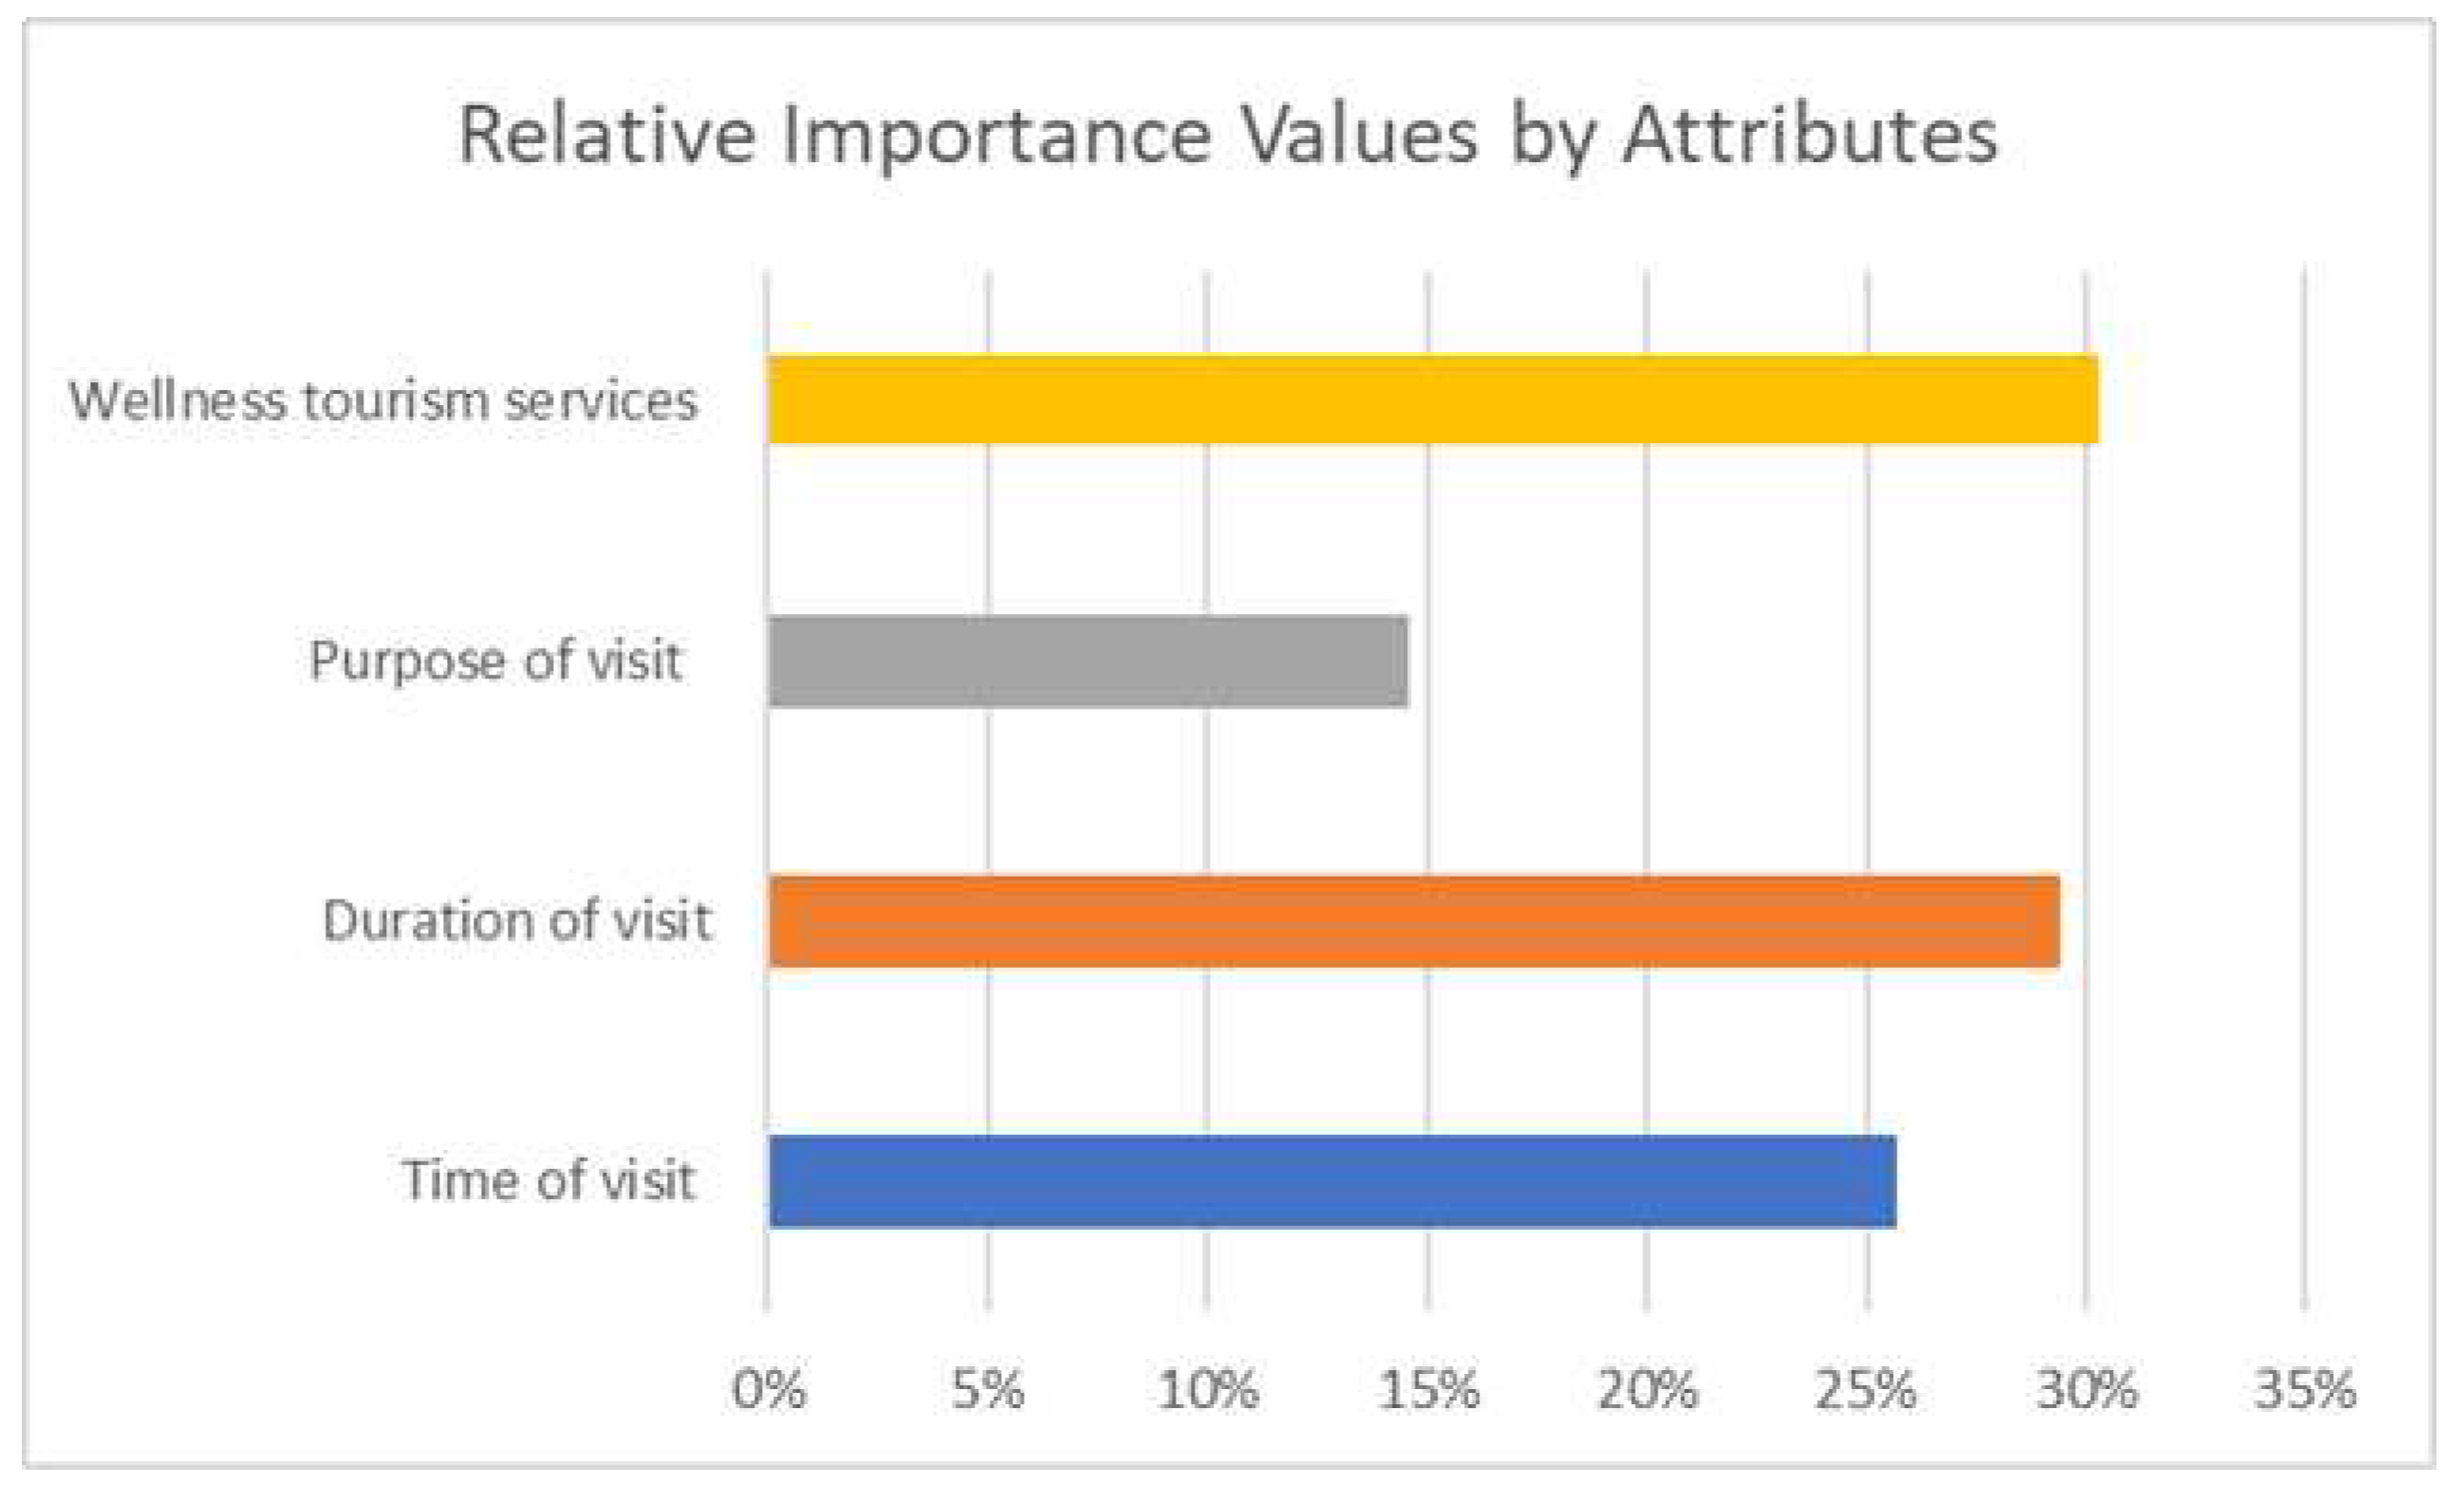
Table 4 presents the range of the importance values, while
Figure 5 graphically illustrates the importance summary regarding the attributes that compose the proposed wellness tourism product. Attributes with greater utility contribute more compared to those with lower utility. The relative importance of each attribute shows its importance relative to other attributes. These importance values sum up to 100%. For example, at 30.3%, the “Types of wellness activities” attribute is the most crucial attribute, with “Purpose of the visit” being the least important attribute. The Pearson’s R (0.881) and Kendall’s tau (0.717) statistics reflect the correlations concerning the observed and estimated preferences. Both statistics are high and significant.
The findings suggest that the combination of attributes that maximizes the preference structure of respondents is: time of visit from September to October, duration of the visit from 1 to 7 days, the primary purpose of the visit is wellness tourism, and the type of wellness activities include both physical activities and training and spiritual/emotional enhancement.
4.3. Results of the Contingent Valuation Method
In the survey, 344 participants stated a positive WTP answer, while 150 respondents expressed a ‘clear no’ answer (not protest votes). The classification results (
Table 5) reveal that the binary logistic regression correctly classified 89.5% of the responses. Overall, 261 respondents provided a No answer to the WTP question. Of these No answers, 101 were identified as protest votes and, consequently, were excluded from the analysis (Hanley et al., 2006). As a result, the total number of answers included in the binary logistic model was 494. Protest votes were categorized based choosing the following options as justification for ‘No’ votes: ‘although the development of a wellness tourism product is important to me, I am not willing to pay any amount’ (47 responses), ‘I disagree with the payment method for developing wellness tourism in the study area’ (23 responses), ‘I believe that my financial support will not be managed appropriately’ (19 responses), ‘It is an obligation of the state to provide the needed financial support’ (9 responses), ‘I do not have adequate information for the study area in terms of developing wellness tourism’ (3 responses).
The binary logistic regression results confirm that all coefficient signs had the expected and statistically significant signs (
Table 6). The bid amount coefficient had a negative sign, indicating that respondents were less willing to pay for higher bid amounts. This means that the higher the bid amount, the lower the likelihood (probability) of the respondent paying the offered amount. Respondents’ education level (‘edu’) significantly and positively impacted the probability of being willing to pay for the proposed wellness tourism product. The more educated the respondent, the more willing to pay for the improvement in wellness tourism products in the study area. In the case of ‘income’ level, the higher the income, the more willing the respondent was to pay. The negative sign of the variable ‘age’ indicates that the older the respondent, the less they are willing to pay for the proposed wellness tourism product. The same is true in the case of the duration of stay (‘stay’). The longer the duration, the lower the willingness to pay.
The positive sign of the coefficient associated with the ‘envirovar1’ variable indicates that respondents are more willing to pay for a wellness tourism product that transfers the environmental message to visitors. [
117] argue the importance of achieving the desired equilibrium concerning the socioeconomic system and nature’s dynamics. Likewise, the positive sign of ‘envirovar2’ suggests that respondents are more willing to pay if they recognize the relationship between sustainability and natural resource use (e.g., thermal spring water, seawater). Furthermore, results reveal that respondents’ willingness to pay increases if they consider that the offered tourism product can contribute to developing new skills in terms of human resources (‘skills’). In the same vein, respondents’ willingness to pay increases based on the quality of the offered tourism experience (‘quality’), the enrichment of the provided tourism product in regards to other nature-based forms of tourism (‘tour product), developing new tourism facilities such as marinas for cruise boats and yachts (‘facilities’), and developing entrepreneurship in the field of food and beverage sector – gastronomy (‘entrepreneurship’). Additionally, findings suggest that respondents who had visited the area before (‘loyal’) are more willing to pay. Moreover, respondents who had previously visited a wellness tourism destination and received relevant services were more willing to pay (‘well tour’).
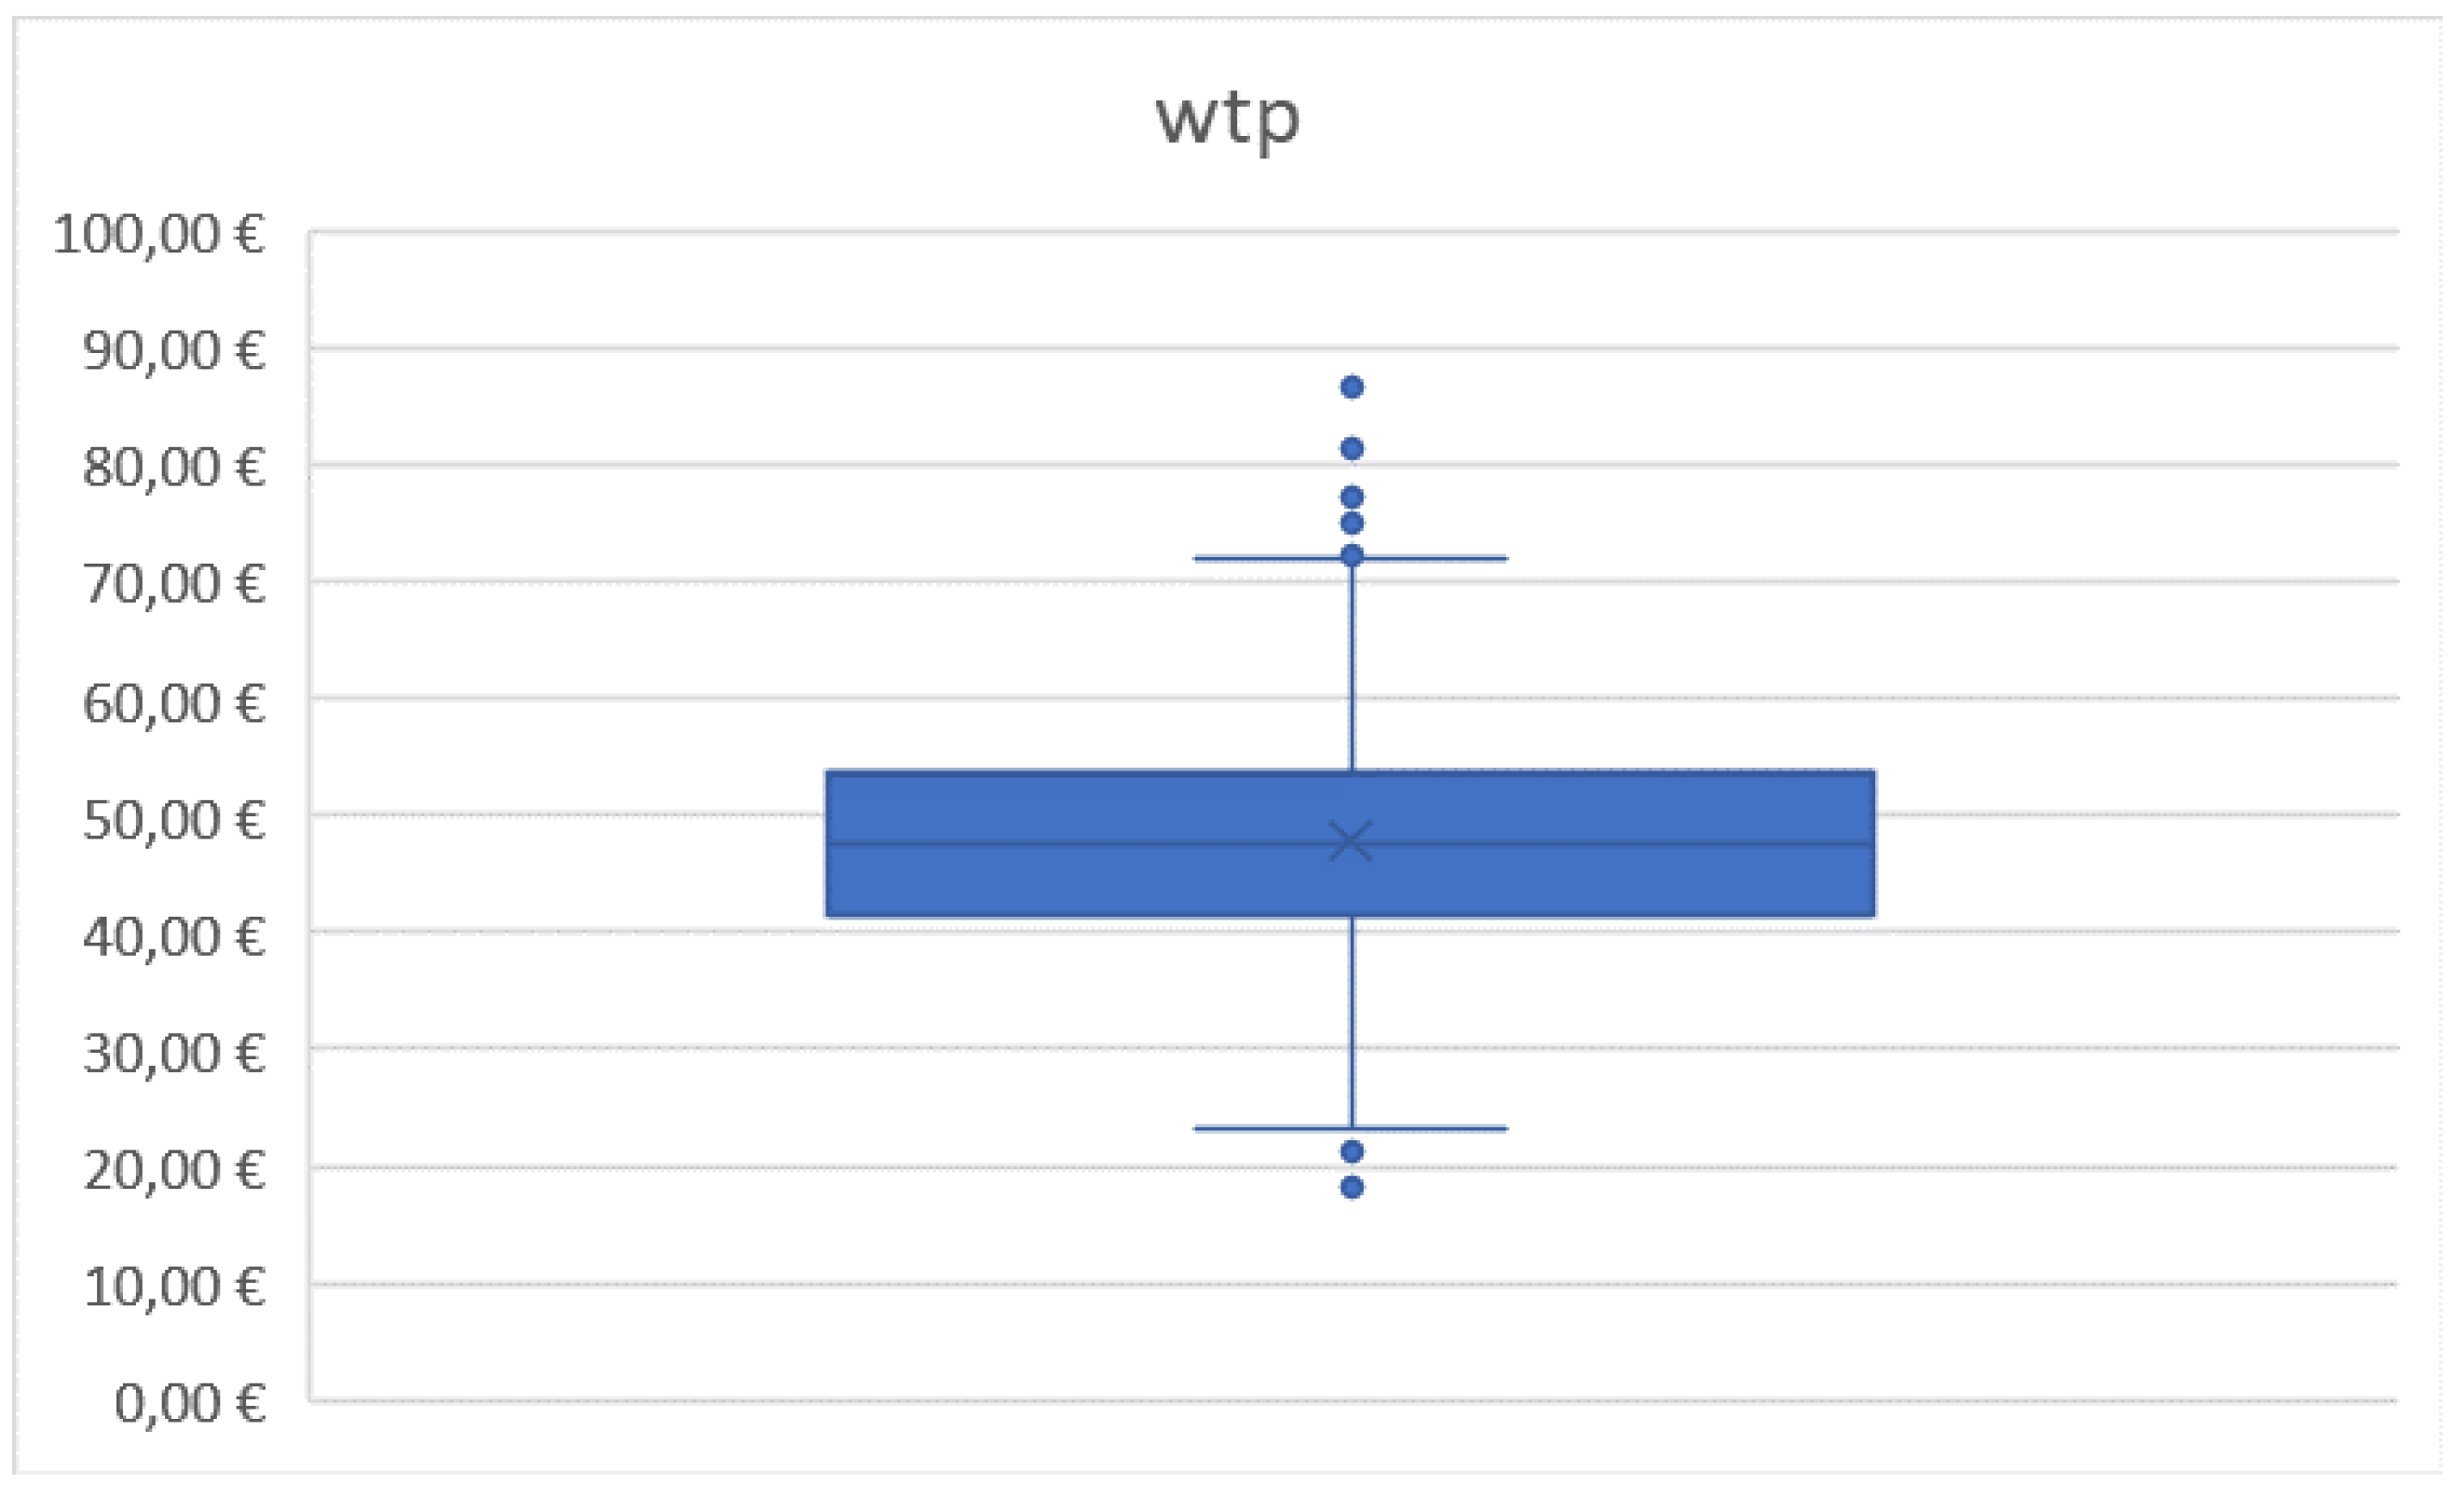
The mean WTP was calculated by adding all regression coefficients except the bid coefficient. Then the sum was divided by the bid regression coefficient. We concluded that the mean willingness to pay equals 47,33€. To ensure the validity of the outcome, we performed a Monte Carlo simulation with 1000 reiterations (
Figure 6) using the Krinsky-Robb procedure [
118]. The result of the Monte Carlo simulations complies with our point estimate of WTP calculated with the results of the logistic regression model.
5. Discussion
Depopulated rural areas need targeted plans to revive their economies and communities based on high-leverage tourism economic activities. On the other hand, in the aftermath of the COVID-19 pandemic, many questions have been raised about revitalizing tourism activities and the possibility of the tourism model evolving or transforming [
119]. The revitalization of wellness tourism attractions to develop customer-driven products constitutes a promising but also a challenging path to improve and promote currently depopulated and underdeveloped rural areas.
To this end, it is vital to understand wellness tourists’ preferences so that services and products can be designed to match customers’ expectations [
30]. Customers form their outcome satisfaction when making comparisons of product attributes and performance to their prior expectations [
120]. The set of attributes in this CA study included when to visit (time of visit), how many days (duration of visit), why (purpose of visit), and what to do (type of activity). Initially, this might be seen as a generic approach to the proposed attributes that might compose a wellness offer. However, all these attributes provide practical information about questions (or concerns) that potential visitors ask themselves (or consider) when selecting a destination (e.g., wellness destination).
We investigate if visitors prefer physical activities, spiritual activities, or both. The findings suggest that visitors prefer destinations that satisfy their need for wellness in various diverse arenas, from the physical to the psychological and spiritual to the cultural [
121]. The precise type of physical and spiritual activities to be implemented can be the subject of an additional research effort. Previous literature has documented wellness destinations that have developed products such as spa centers, massage, yoga retreats, new age events, scenic hikes, local fresh foods and flavors, full-body wellness treatments, and experiences built upon healing mind-body practices, such as meditation, or organize programs based on escapism and relaxation [
31,
38,
41]. However, including specific types or sets of activities in the context of CA when defining the term physical and/or spiritual activities would create many attributes and levels, potentially creating confusion among respondents of a rank and choice survey. Five or six attributes may be considered adequate and manageable, providing dependable results [
122]. Therefore, it may be necessary to examine preferences in a piecemeal manner if CA is to be used in such research endeavors.
We applied the CA and CVM to analyze the economic feasibility of revitalizing a depopulated rural destination by developing wellness value propositions based on tourists wants and needs for diversified and integrated wellness products.
In this study, we selected the time of visit as an attribute of the proposed wellness tourism product to identify if potential visitors prefer the high or low season. This attribute can provide evidence for the importance of developing year-round destinations. Such an attribute can be used in relevant studies and shape a picture of when visitors prefer to enjoy the offered tourism experiences. The same seems reasonable concerning the duration of the visit regarding carrying capacity and sustainable natural resource use. However, these sets of CA attributes have rarely been used in empirical studies, even though they are essential pieces of information to formulate offers or develop enhancements of existing tourism attractions and destination attributes.
On a local scale, research findings indicate that it is vital to offer a set of physical training activities, a wide range of options and alternatives for stress discharge, and spiritual enhancement, all of which are recognized as new customer-driven trends in the existing wellness market. Moreover, the mean age of visitors was 39.6 years old, meaning that the destination should focus on activities, facilities, and wellness attractions that are close to the age of visitors regarding appeal, use, and practical issues. These findings are crucial in expanding the study area's wellness appeal and redeveloping it with a reinvigorated potential and new focus based on the preferred attributes and visitors’ willingness to pay.
At a broader level, Destination Management Organizations (DMOs) should bring together a wide range of tourism stakeholders, to structure effective management plans for sustainable tourism development [
123]. Therefore, one alternative would be to formulate and advertise relevant tourism packages based on visitors’ preferences by considering all the preferred attributes derived from the application of CA and CVM. Another option could be to take these results into relevant decision-making processes in the broader context of effective destination marketing and management. This would help state or regional administration policies to become adaptive since these policies should reduce regional inequalities by funding tourist infrastructures and/ or retaining capital for tourism-related investments [
124].
Regarding the CVM, research findings indicate that visitors are more willing to pay for tourism wellness products that advance the concept of sustainability. Therefore, tourism products should provide wellness services that transfer the sustainability message to visitors as an integrated component. Nowadays, visitors seem to prefer destinations that respect the environment, and where the tourism experience serves to raise awareness about sustainability. The question that lies in the background is: Do we need more tourism, or do we need better tourism? This is a question that each tourism stakeholder should attempt to answer in the process of managing and marketing destinations. In our opinion, better tourism means an inclusive wellness tourism product that respects the environment, advances the offered tourism experience in terms of customer-driven preferences, and provides opportunities for destinations to experience self-sustaining (endogenous) development. For instance, re-developing a wellness tourism product can help secondary entrepreneurship develop (e.g., gastronomy tourism with local products, outdoor recreation alternatives, and relevant facilities) and advance the quality levels of the offered tourism experience. This is based on the fact that visitors are willing to pay more for wellness destinations that have the potential to meet customer demands and fulfill their expectations.
Furthermore, one would expect that a robust wellness tourism economy leaves margins for innovation and investments resulting in increased visitation rates. Increased willingness to pay will increase tourism consumption, translating into higher tourism receipts and expenditures in wellness destinations. In turn, it is expected that the contribution of wellness tourism to the overall economy will be positive and significant. Notably, this is the case for tourism-dependent economies, which constantly seek ways to increase tourism's direct and total contribution to the region’s GDP.
Research findings indicate that the wellness enhancement will offer opportunities to develop new skills and human resources expertise, increasing visitors’ willingness to pay. Additionally, research results suggest that wellness enhancements and developments enrich the provided tourism product (e.g., in regards to other forms of nature-based tourism), provide the basis to develop new tourism facilities (e.g., marinas for cruise boats and yachts) as well as help build entrepreneurship (e.g., in the field of food and beverage sector – gastronomy). These findings provide concrete evidence that wellness tourism can become a stimulus to develop the destination in a wide range of attributes since all these attributes increase visitors’ willingness to pay. These issues can be an example or the basis for further use by other wellness destinations worldwide since the attributes of this study’s proposed product may differ based on the destination's current situation or other specificities within the area of interest.
Translating customer preferences into destination attributes demands key measures that “put a strategy into language that everyone can understand” [
125] and help remain competitive by creating new high-value products. The process is continuous, with needs being triggered and satisfied by products that will stimulate future demand [
126]. In addition, academic research concludes that the pandemic will positively influence consumer behavior in favor of wellness tourism in the medium term [
127]. In this regard, destination readiness is crucial to alleviate the negative impacts of the pandemic and remain open to receiving visitors [
128] (Singh et al., 2021).
6. Conclusions
The present study aims to investigate development opportunities to revive depopulated rural areas in the context of wellness tourism. We applied relevant methodologies to this effort and defined relevant customer-driven tourism products. First, we applied CA to determine the preference structure of respondents and identify the combination of the most preferred attributes. To provide a holistic research perspective in the context of stated preference methods, we used CVM to calculate the mean WTP of participants. Research findings suggest that the combination of attributes that maximizes the preference structure of respondents is: time of visit from September to October, duration of a visit from 1 to 7 days, the primary purpose of the visit is wellness tourism, and the type of wellness activities experienced contain both physical activities and training as well as spiritual/emotional enhancement. The respondents’ WTP for these preferred attributes to further support the wellness developments in the study area, examined as a potential entrance fee to access the wellness offering, equals 47.33€ per visitor. Additionally, respondents’ answers provided evidence concerning a wide range of variables that impact their WTP.
Respondents’ preferences seem to be a sustainable foundation for implementing wellness tourism products. This destination management and marketing approach supports customer satisfaction and enhances the tourism system's performance status. Increased visitation rates, tourism season expansion, and host community improvement can be achieved through realistic goals and investment opportunities to meet visitors’ preferences. Although the variables chosen for this research were derived from the literature and specific features in the study area, a new set for a different destination could be selected using field checks and background information from various reports.
Author statement of contribution
George Ekonomou: Idea and Conceptualization, Methodology, Investigation, Formal analysis, Writing – original draft preparation, Writing - Reviewing and Editing. Sergio Alvarez: Methodology, Formal analysis, Writing – original draft preparation, Writing - Reviewing and Editing, Visualization. Angeliki Menegaki: Methodology, Formal analysis, Writing – original draft preparation, Writing - Reviewing and Editing. Dimitris Kallioras: Methodology, Formal analysis, Writing – original draft preparation, Writing - Reviewing and Editing.
Declaration of competing interest
The authors declare no conflict of interest.
Data availability
Data will be made available on reasonable request.
No Funding
No funding has been received for this paper.
Appendix A
The Koniavitis springs were created from the geological transformations of the Maliakos Gulf and the Kallidromos-Knimis Massif. They became famous due to their rare minerals, salts, and radon composition. Resort style properties that included hotels, spa springs, and a hydrotherapy center were built in the area during the 20th century, but today they are abandoned, and only a few outdoor thermal lagoons remain. Currently the outdoor pools-lagoons, with water temperatures between 33-35°C, are accessible to the public.
In recent times, only minor infrastructure improvements have been made by local authorities to protect the safety of visitors when they wish to get in or out of the lagoons, such as handrails. However, visitors can use these lagoons without paying any entrance fees, and their use is entirely unregulated.
Based on the [
129], the dejure population census in 2021 (151.036 permanent residents) compared to that in 2011 (165.066 permanent residents) indicates that the Prefecture of Fthiotida suffered a population decline of 9.29%.
According to the [
130], a population loss has also been recorded for the rural area of Kamena Vourla. Specifically, permanent residents have diminished by 8.66%, namely from 13.048 permanent residents, the population dropped to 12.008.
The thermal springs became known approximately in 1926 when the chemist Michail Pertesis discovered the exceptionally high radon concentration in the water, which is considered ever since of high value for people's health [
131].
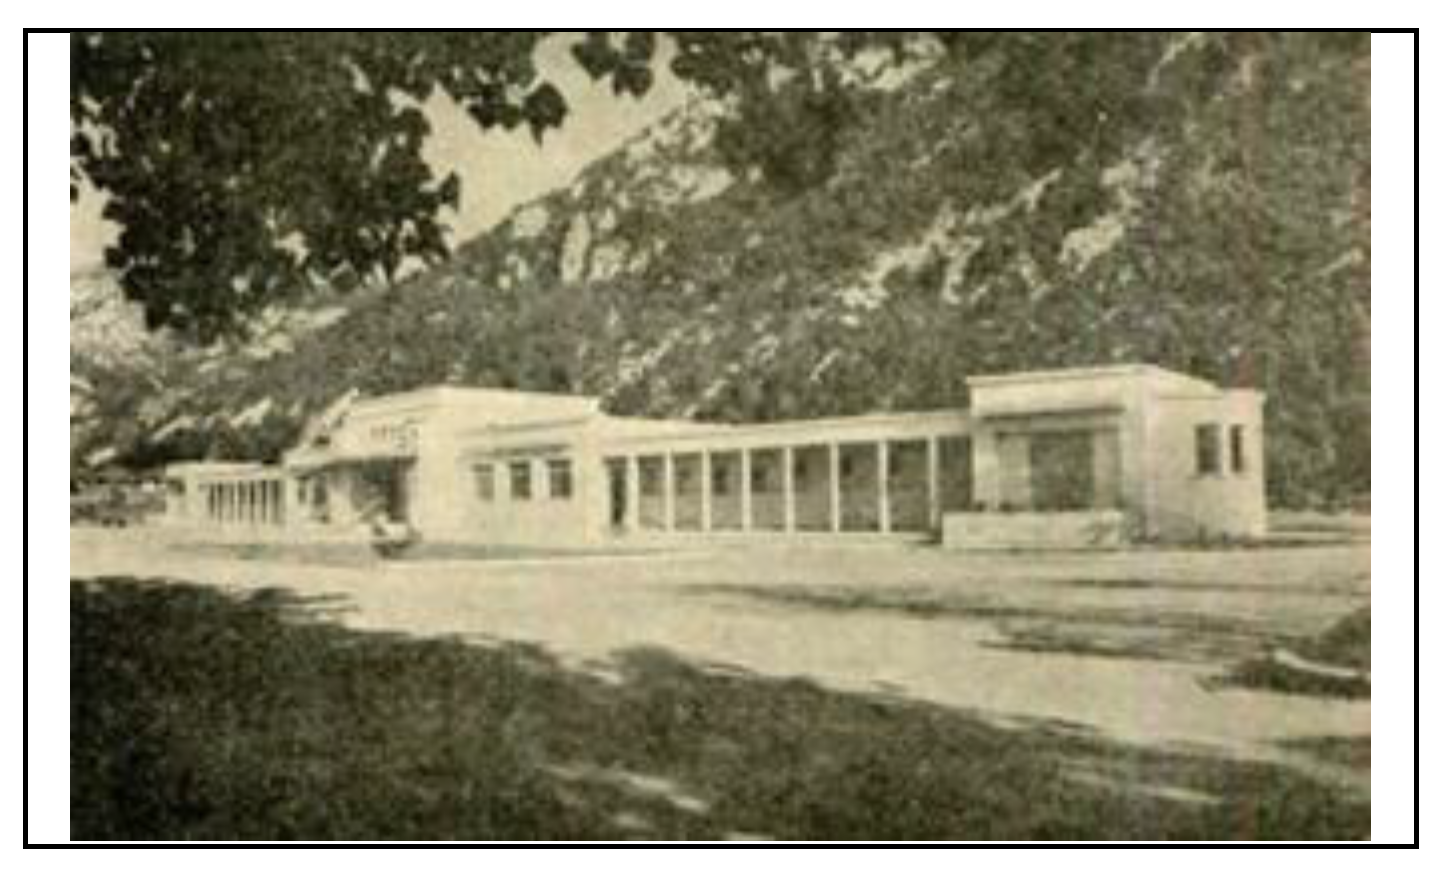
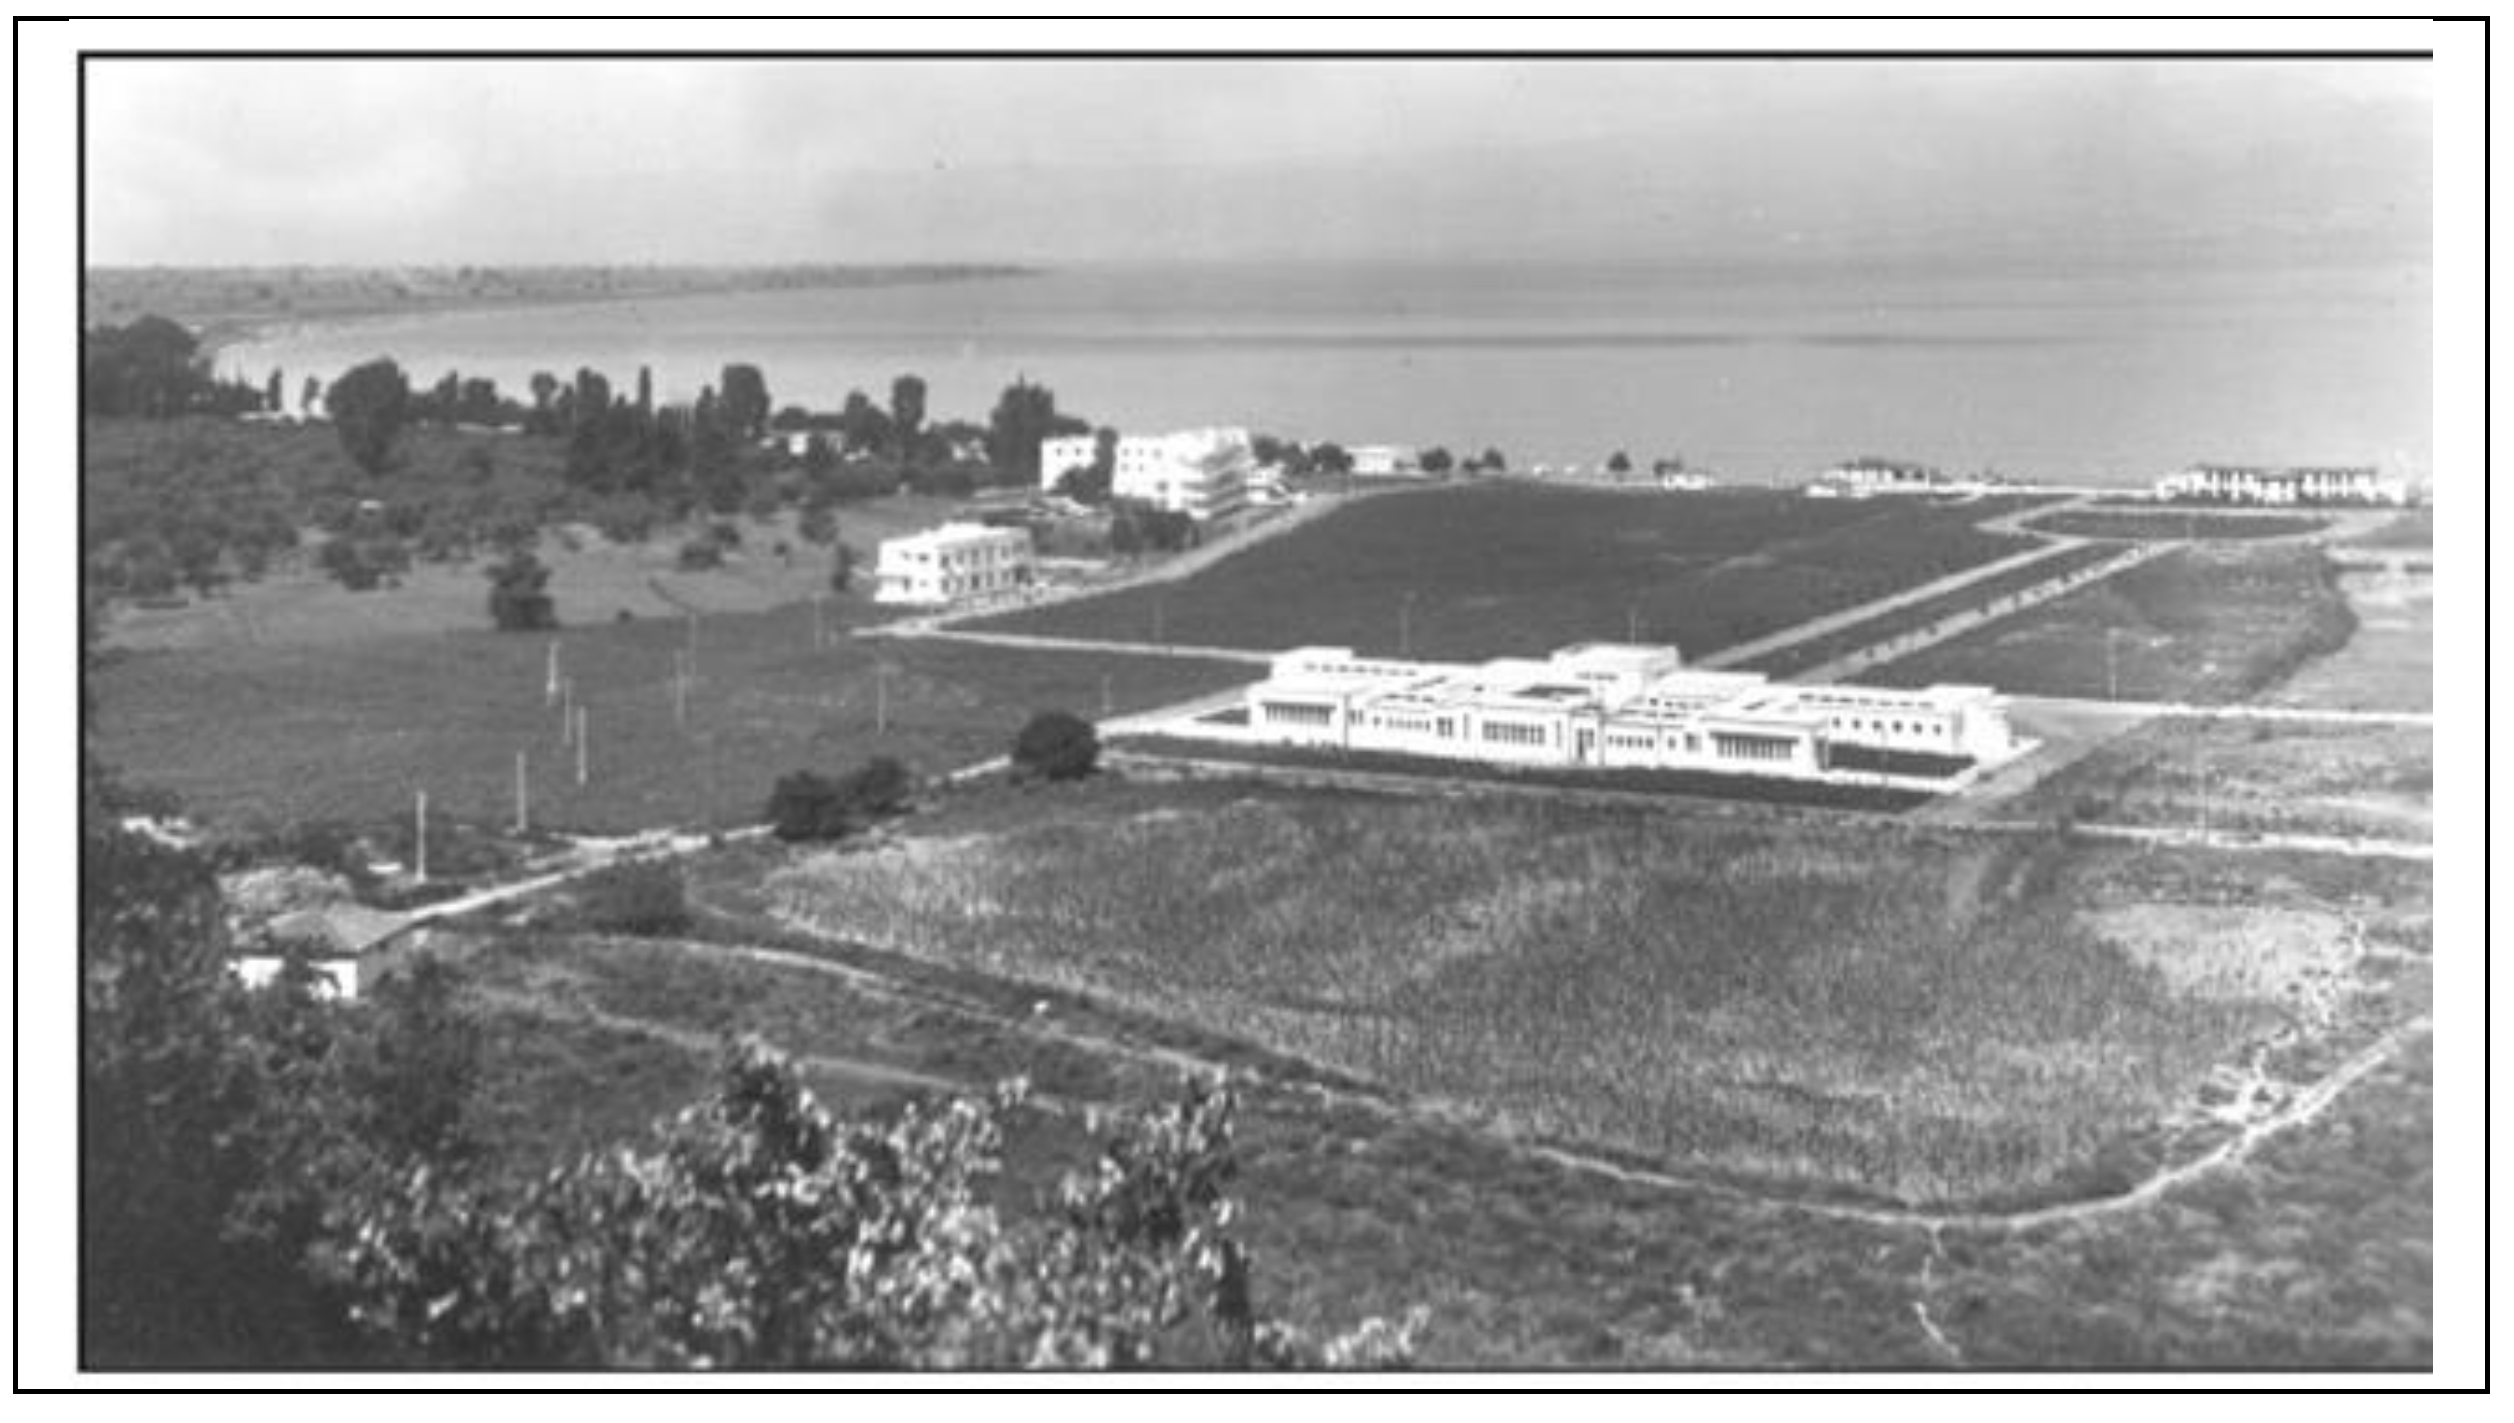
The set of pools used to be one of the most famous local attractions in the last decades since it could provide wellness services to visitors. The area’s development as a wellness destination started in the 1930s (
Figure 7) and continued to develop with additional infrastructure in the 1950s and 1960s. In the 1960s, the study area included the already existing wellness center “Asclepios”, plus two luxury hotels, RADION and THRONION.
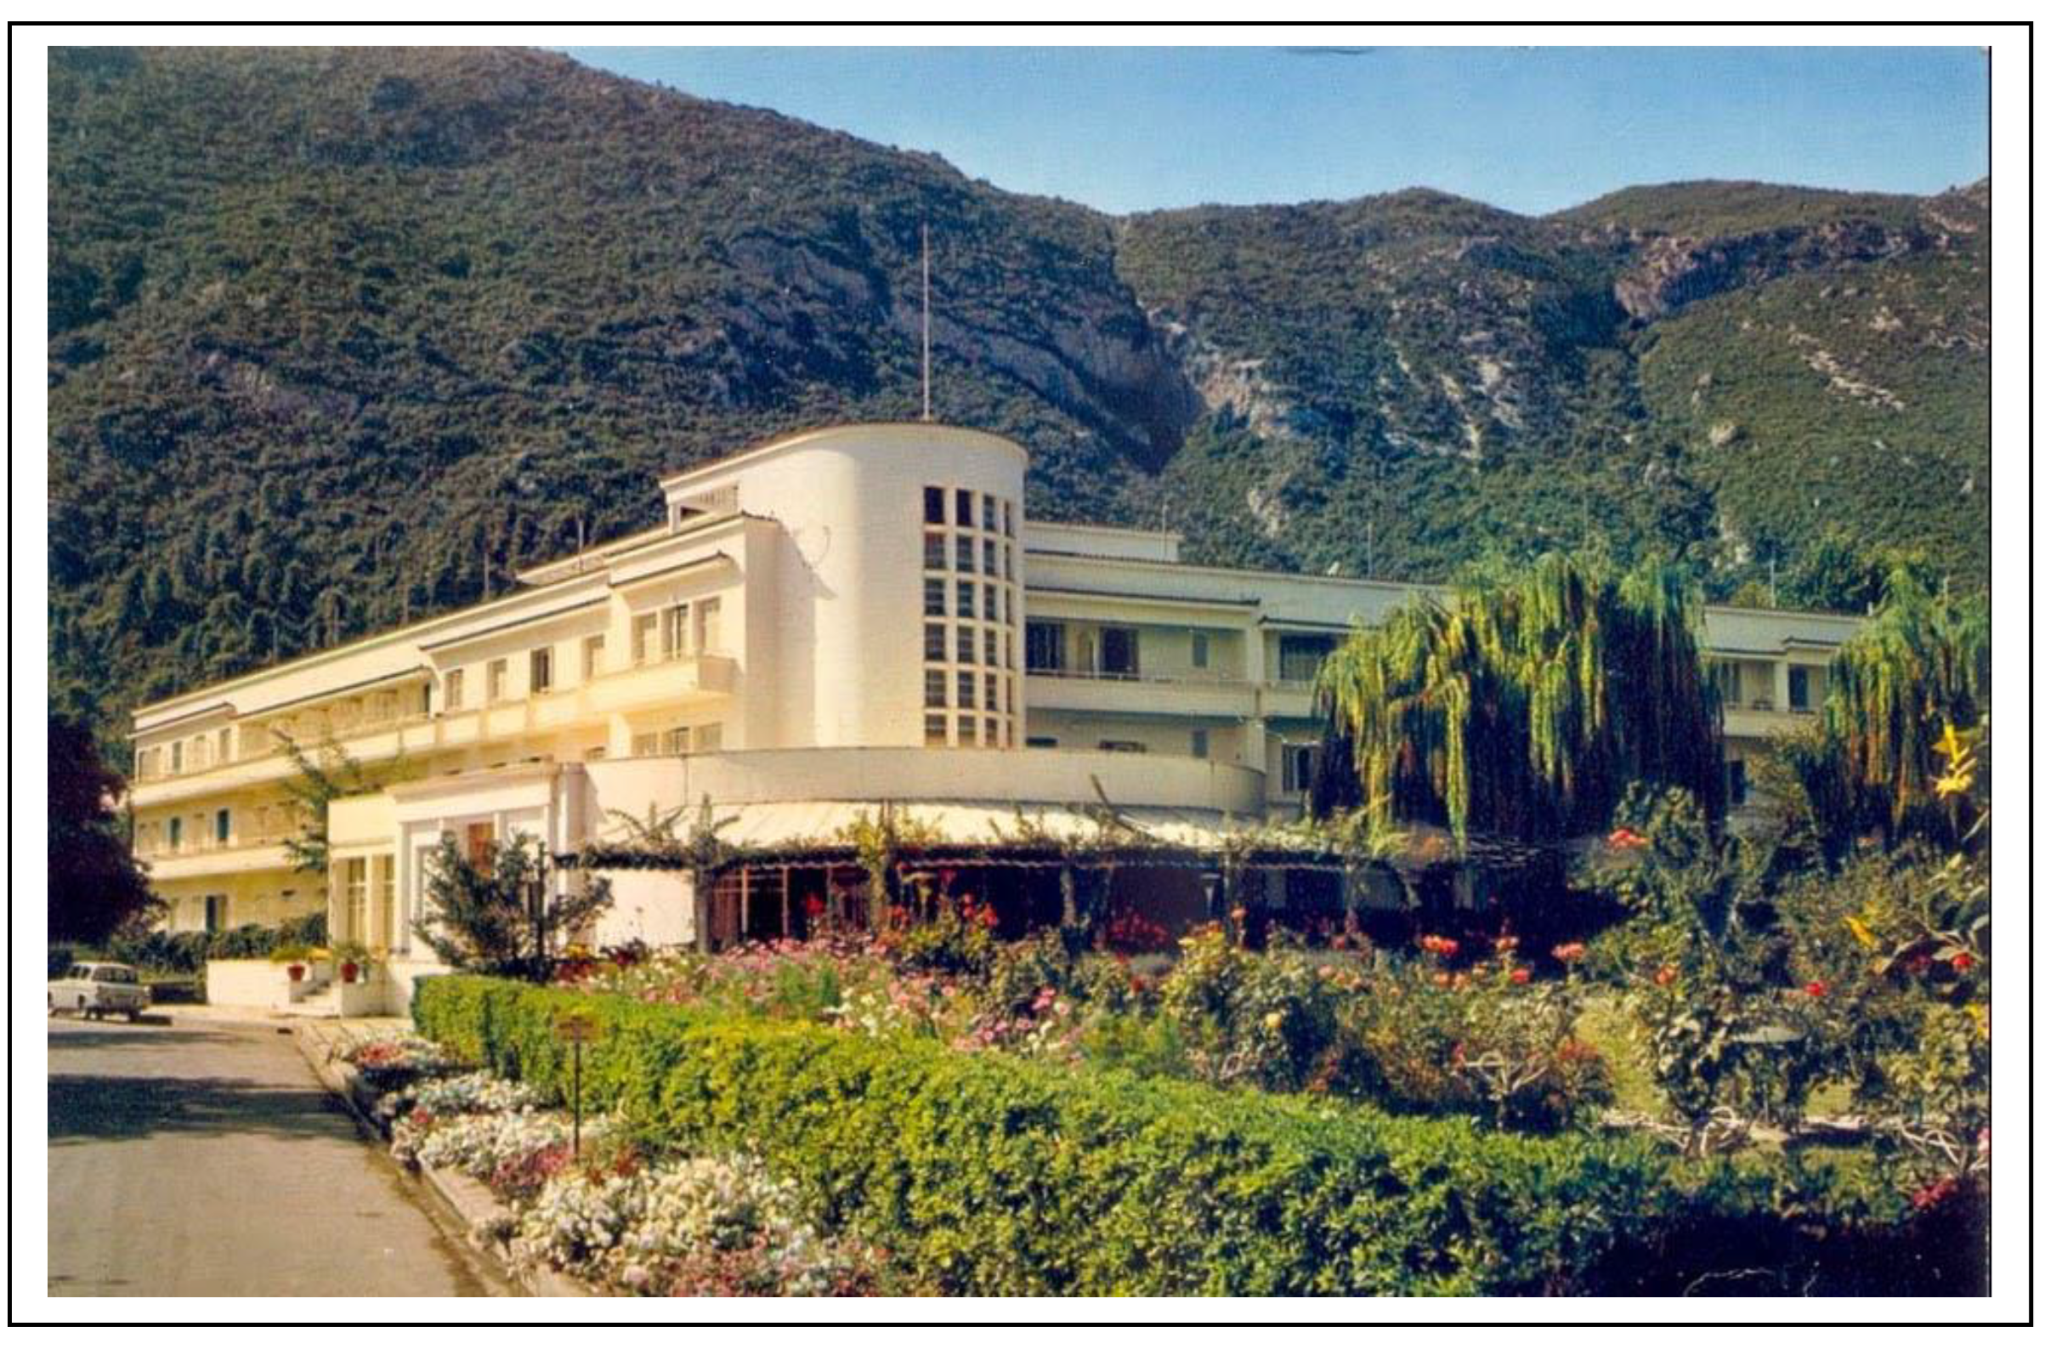
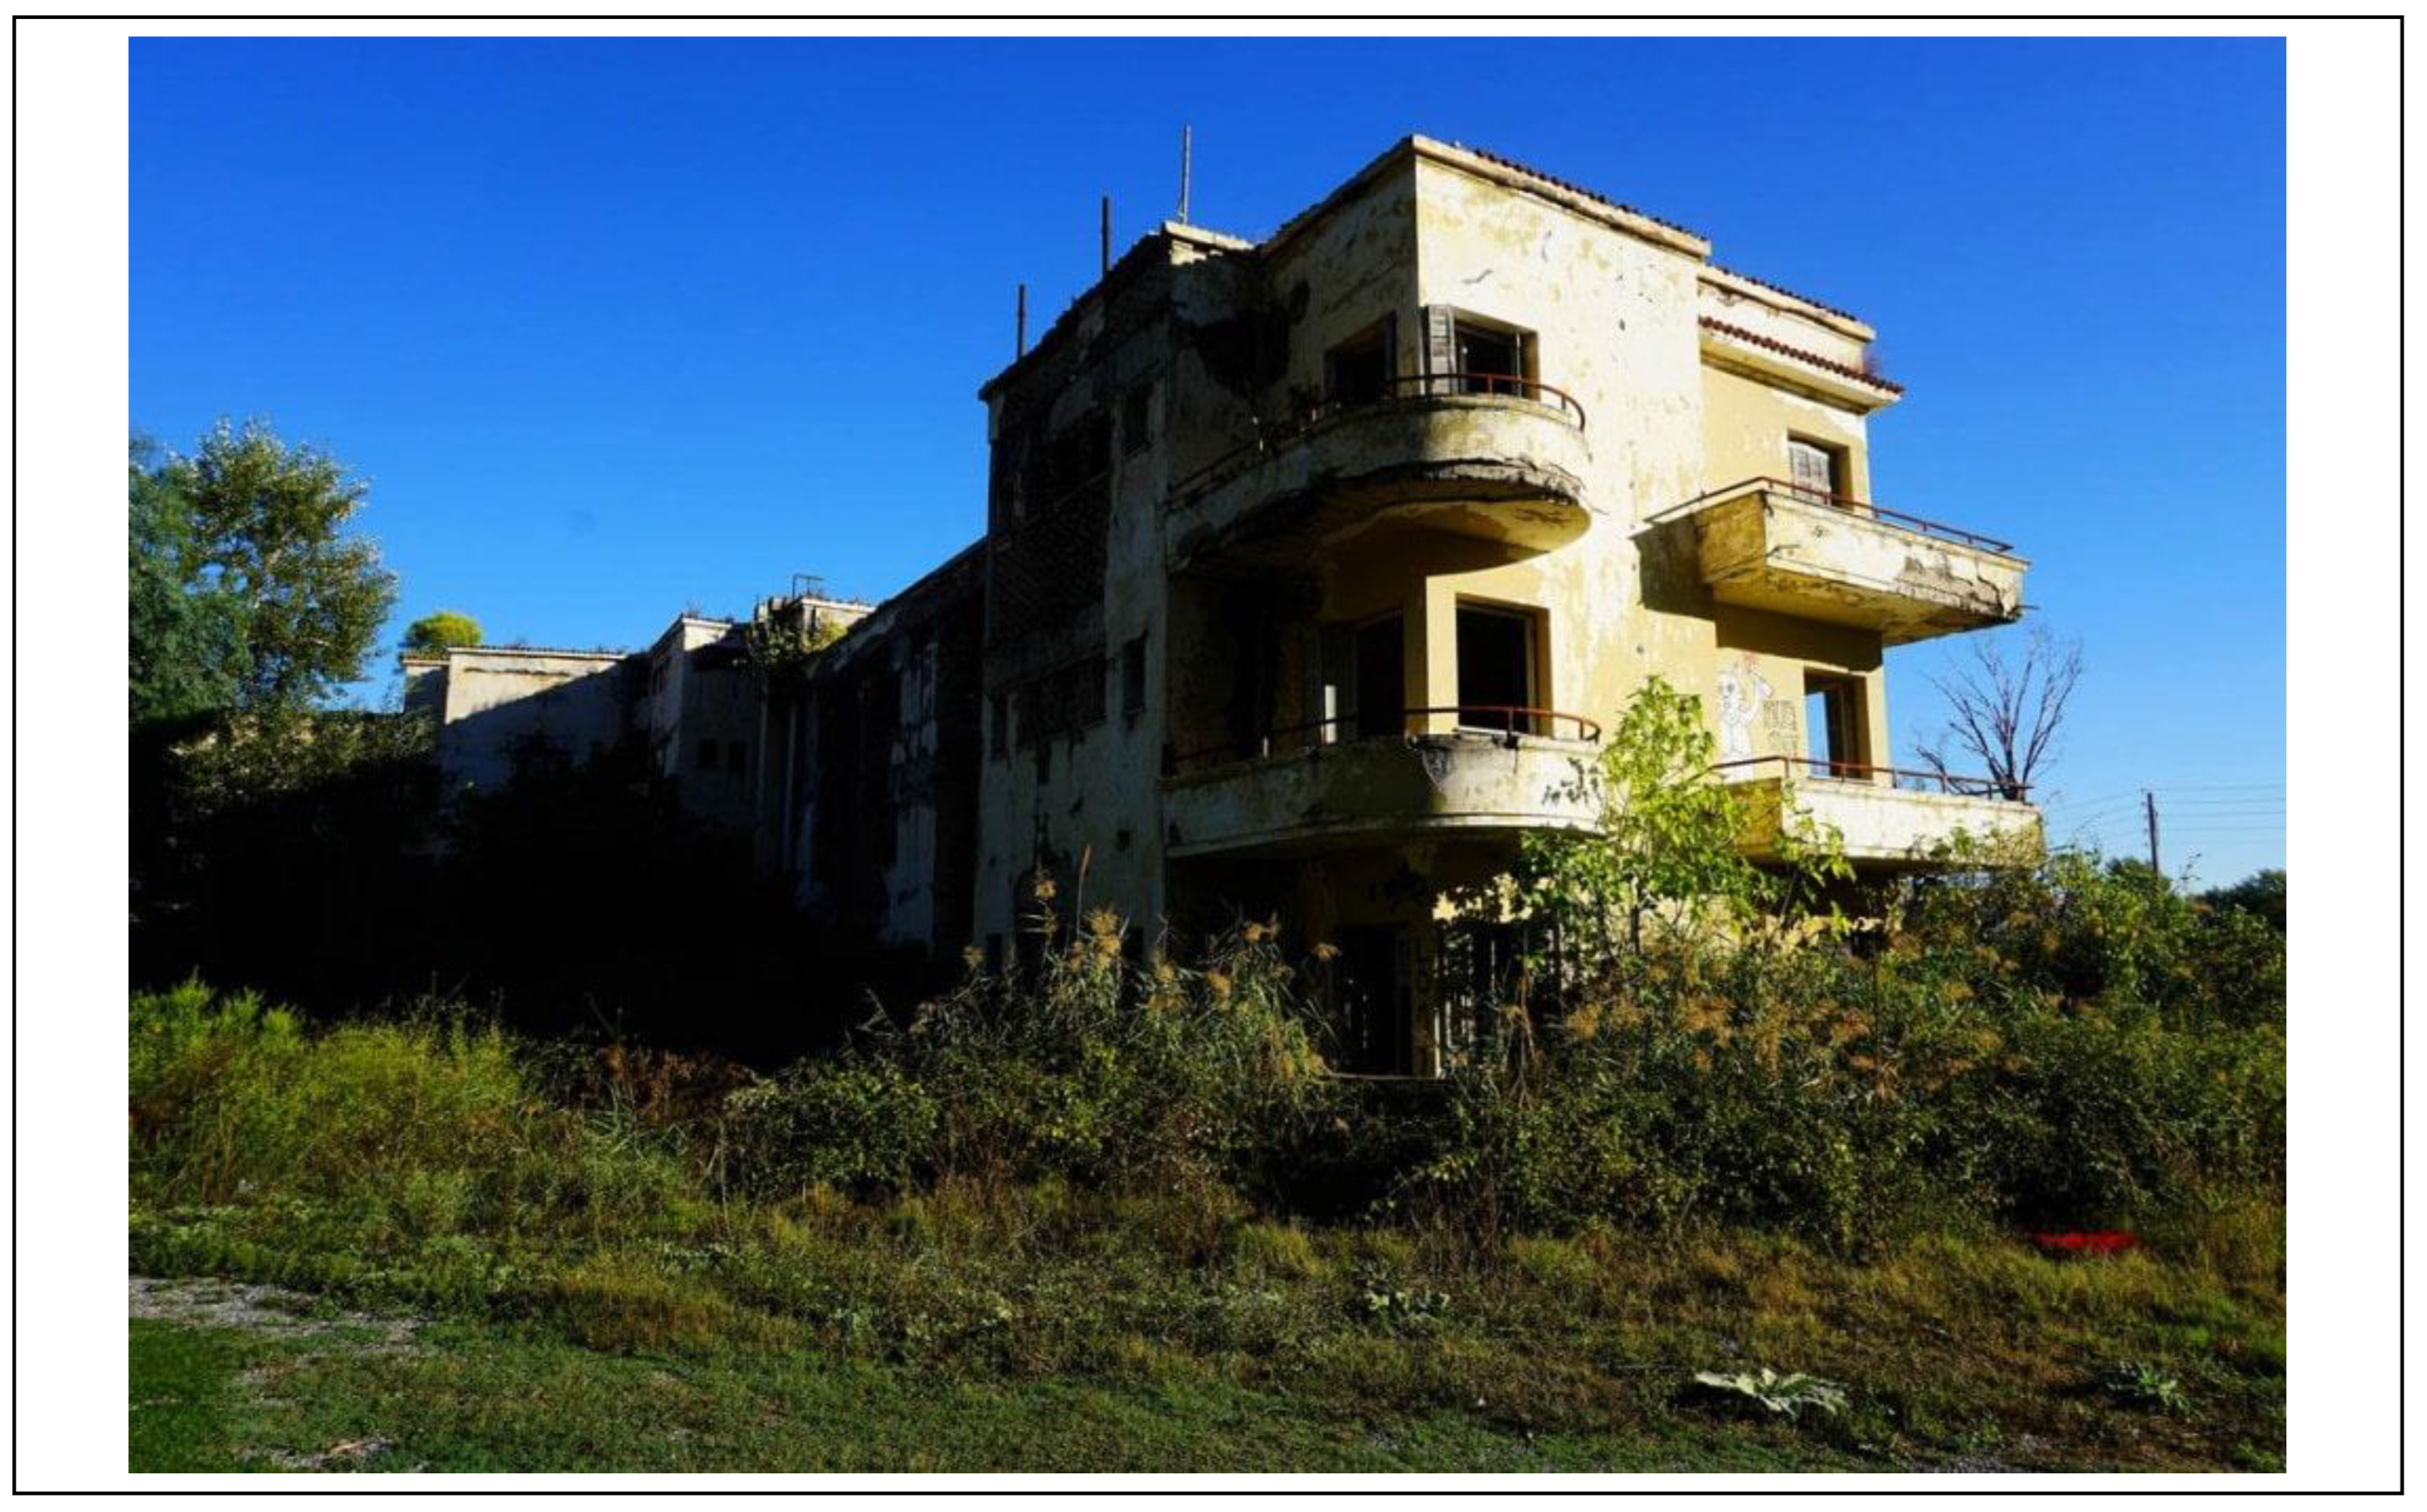
Figure 9 shows the hotel RADION as it was in 1960s. But as time passed, the bathing facilities and infrastructure became dysfunctional and are now surrounded by a downgraded environment [
132]. Unfortunately, throughout the years, all the relevant facilities were abandoned, and the severe financial crisis of the last ten years that Greece suffered made the situation even worse regarding development efforts. Nowadays, none of these facilities are appropriate to offer visitors wellness tourism services.
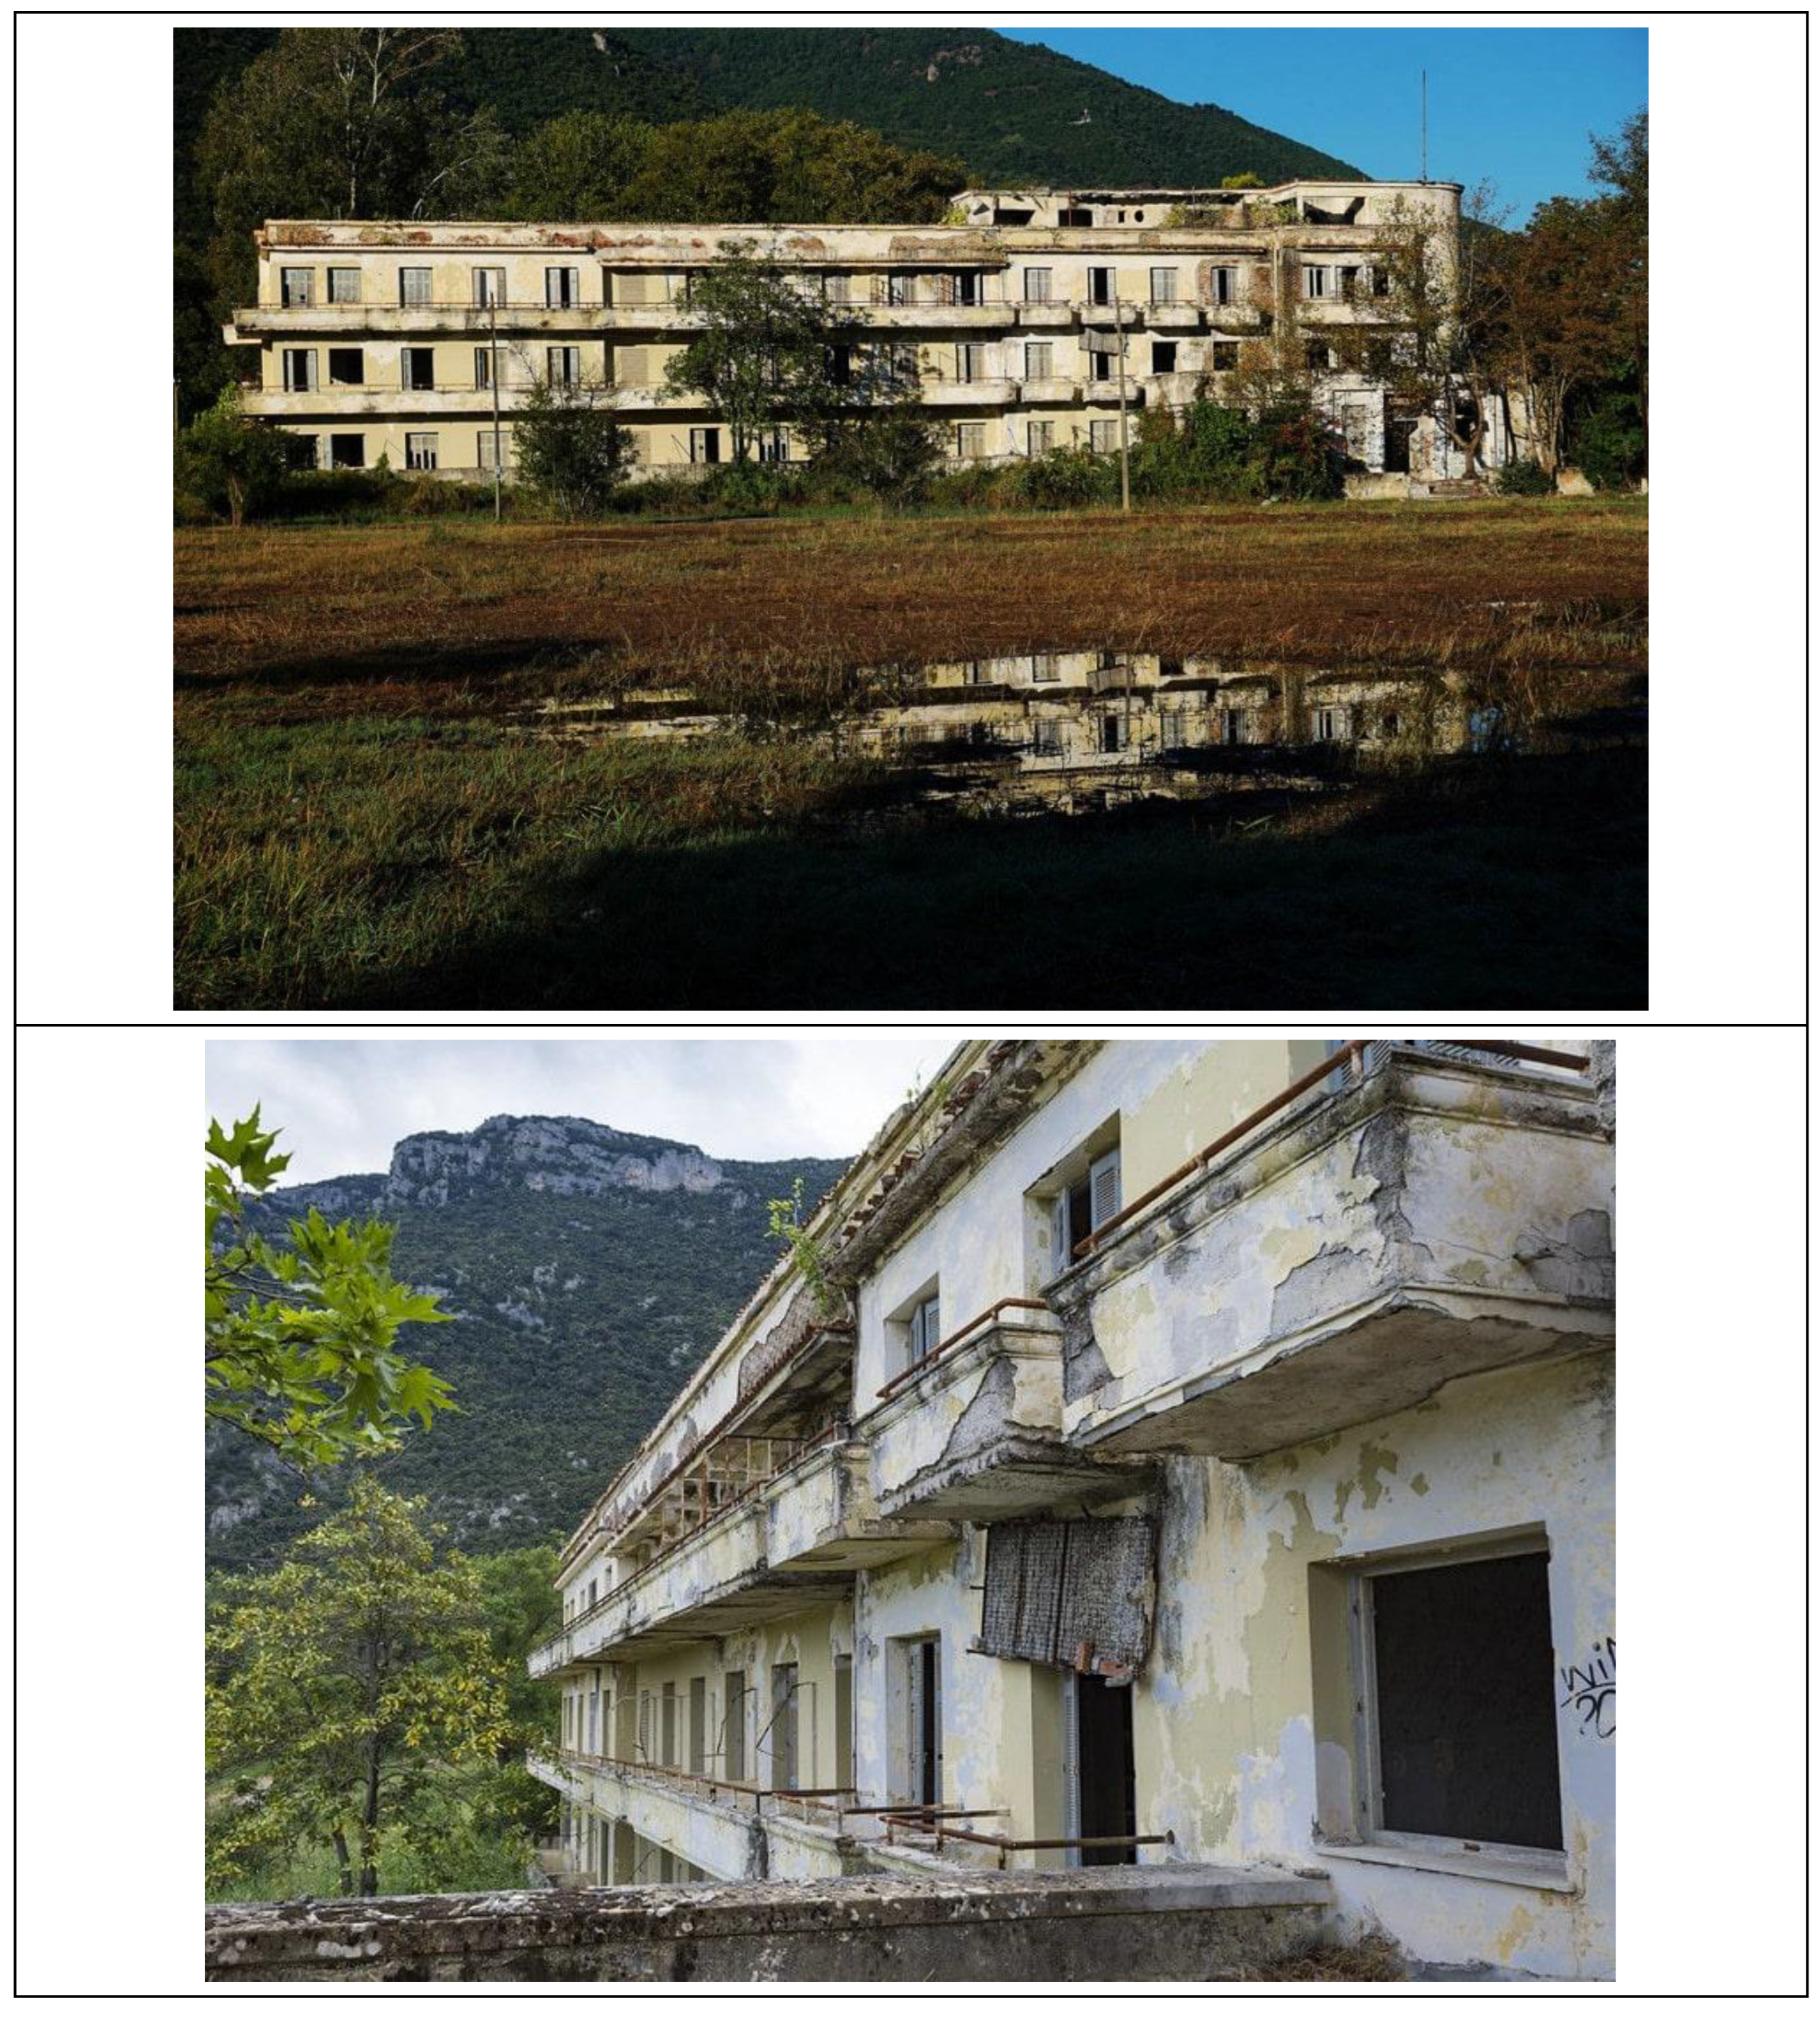
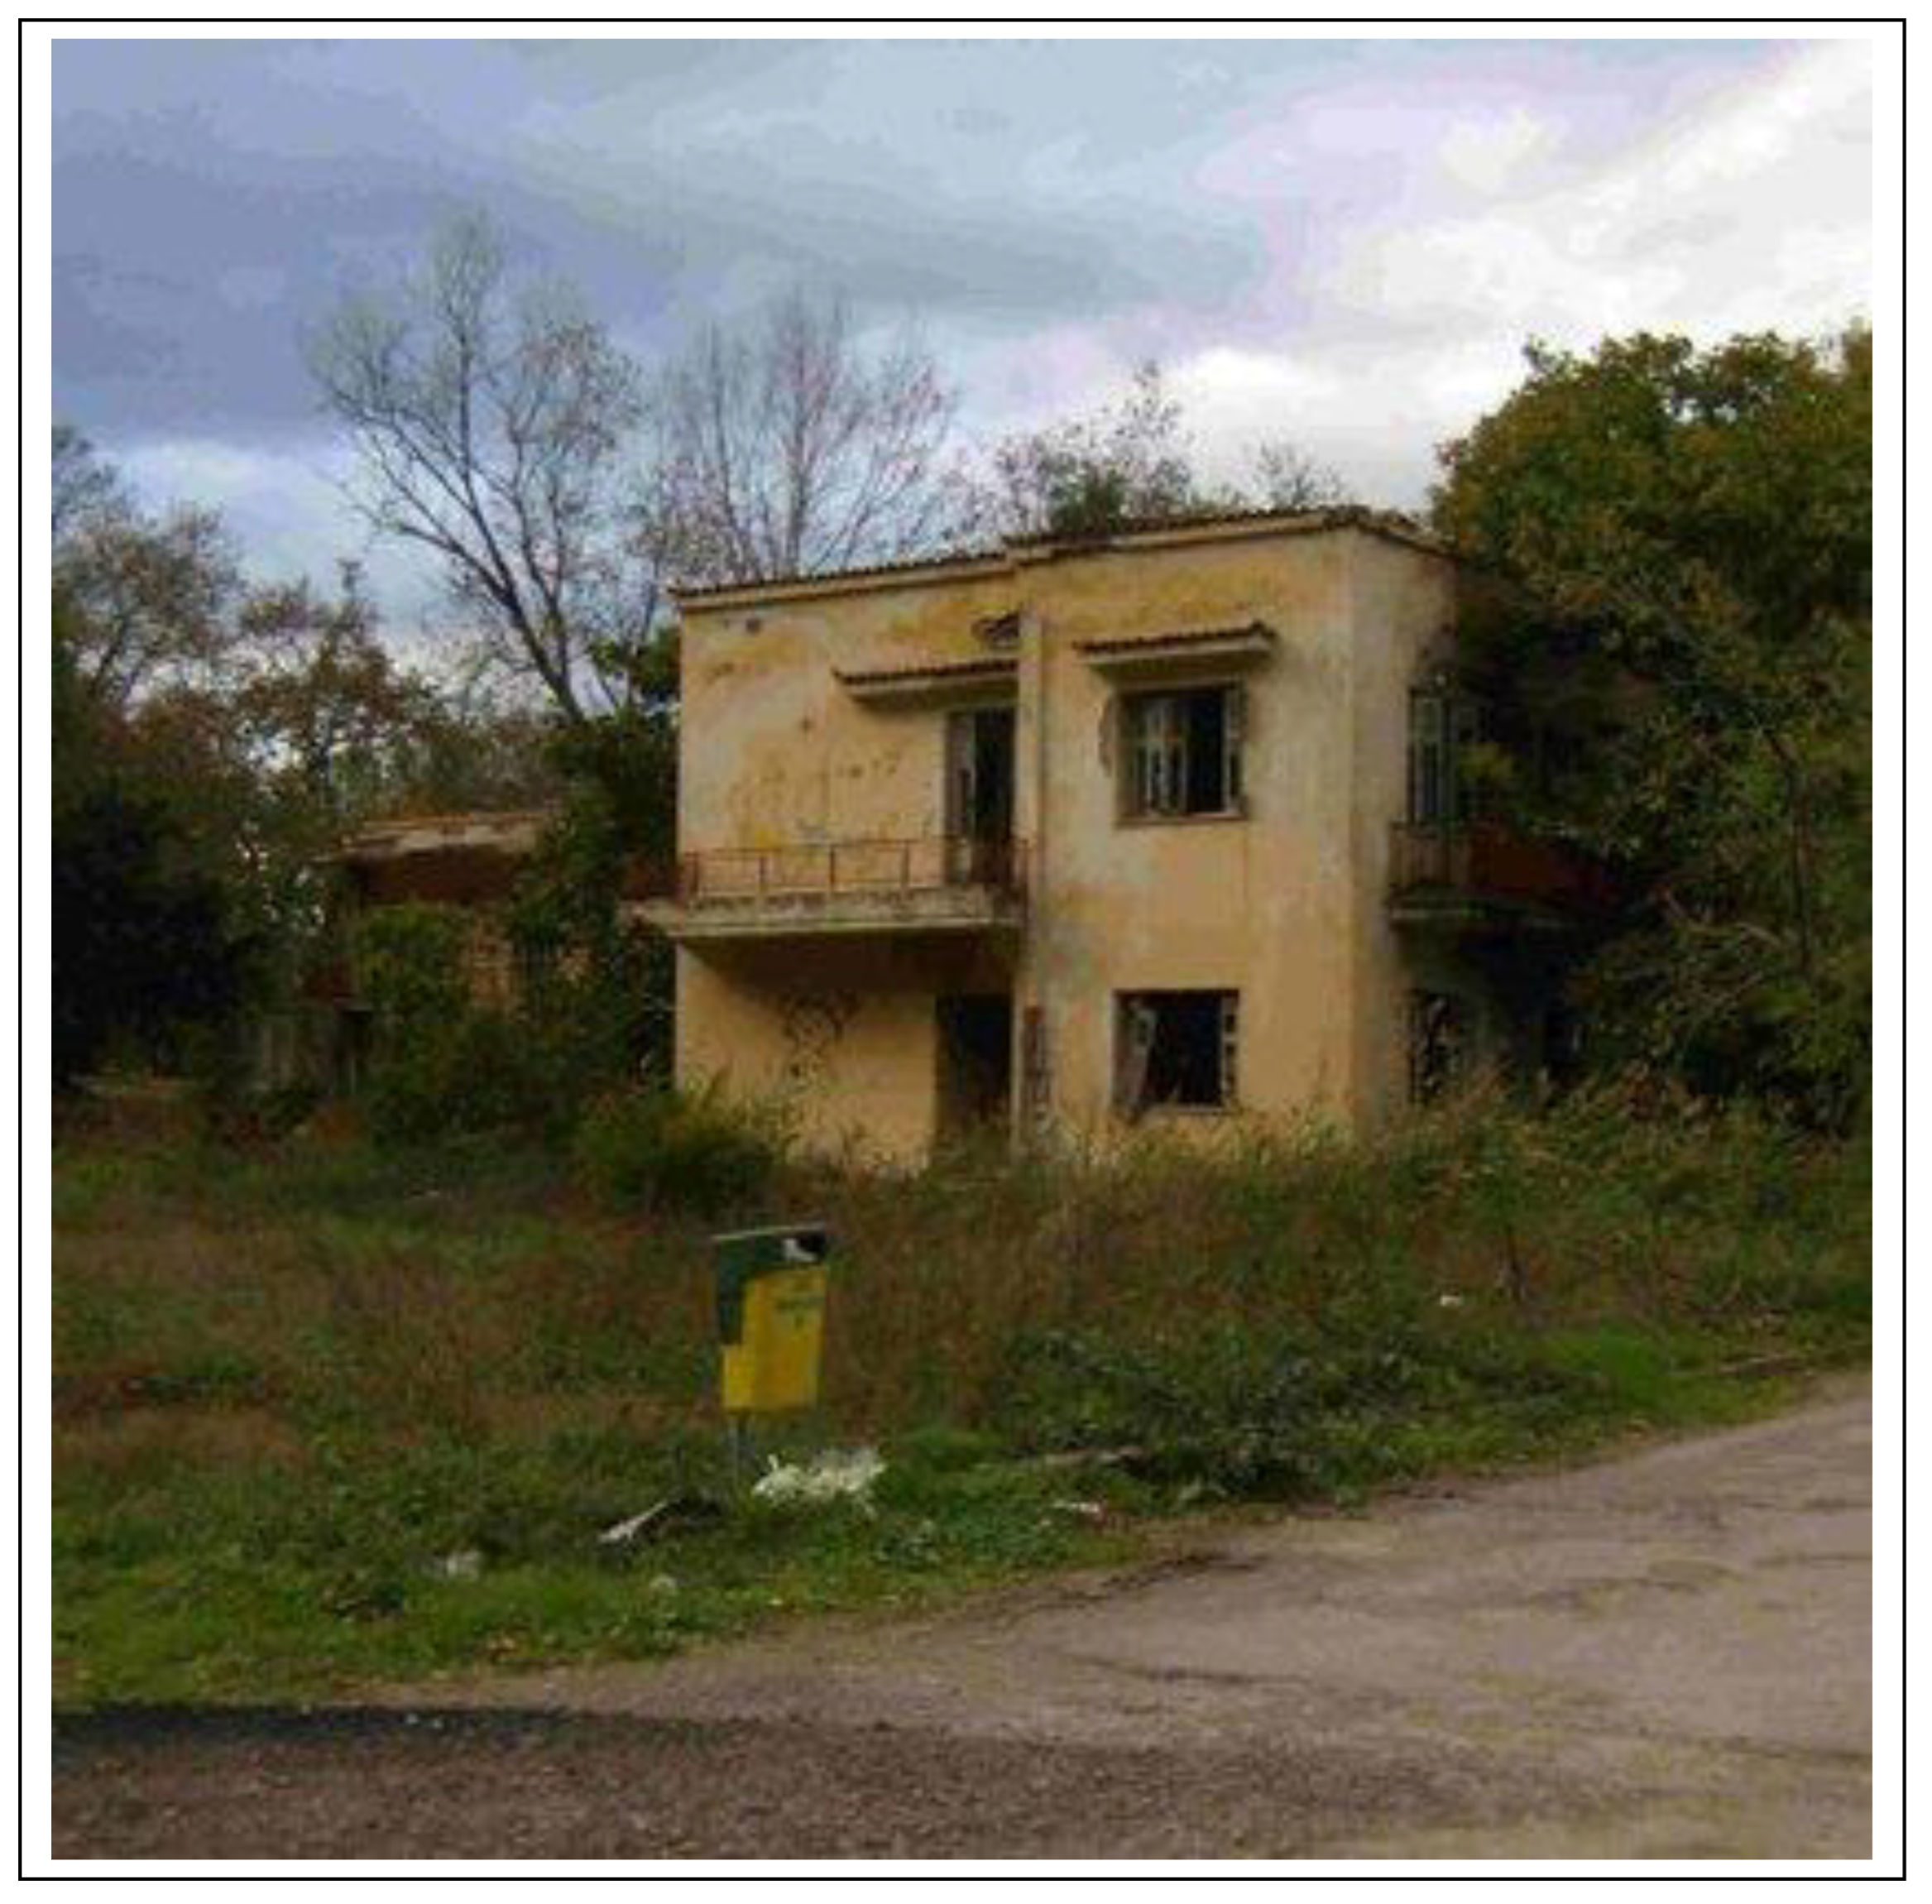
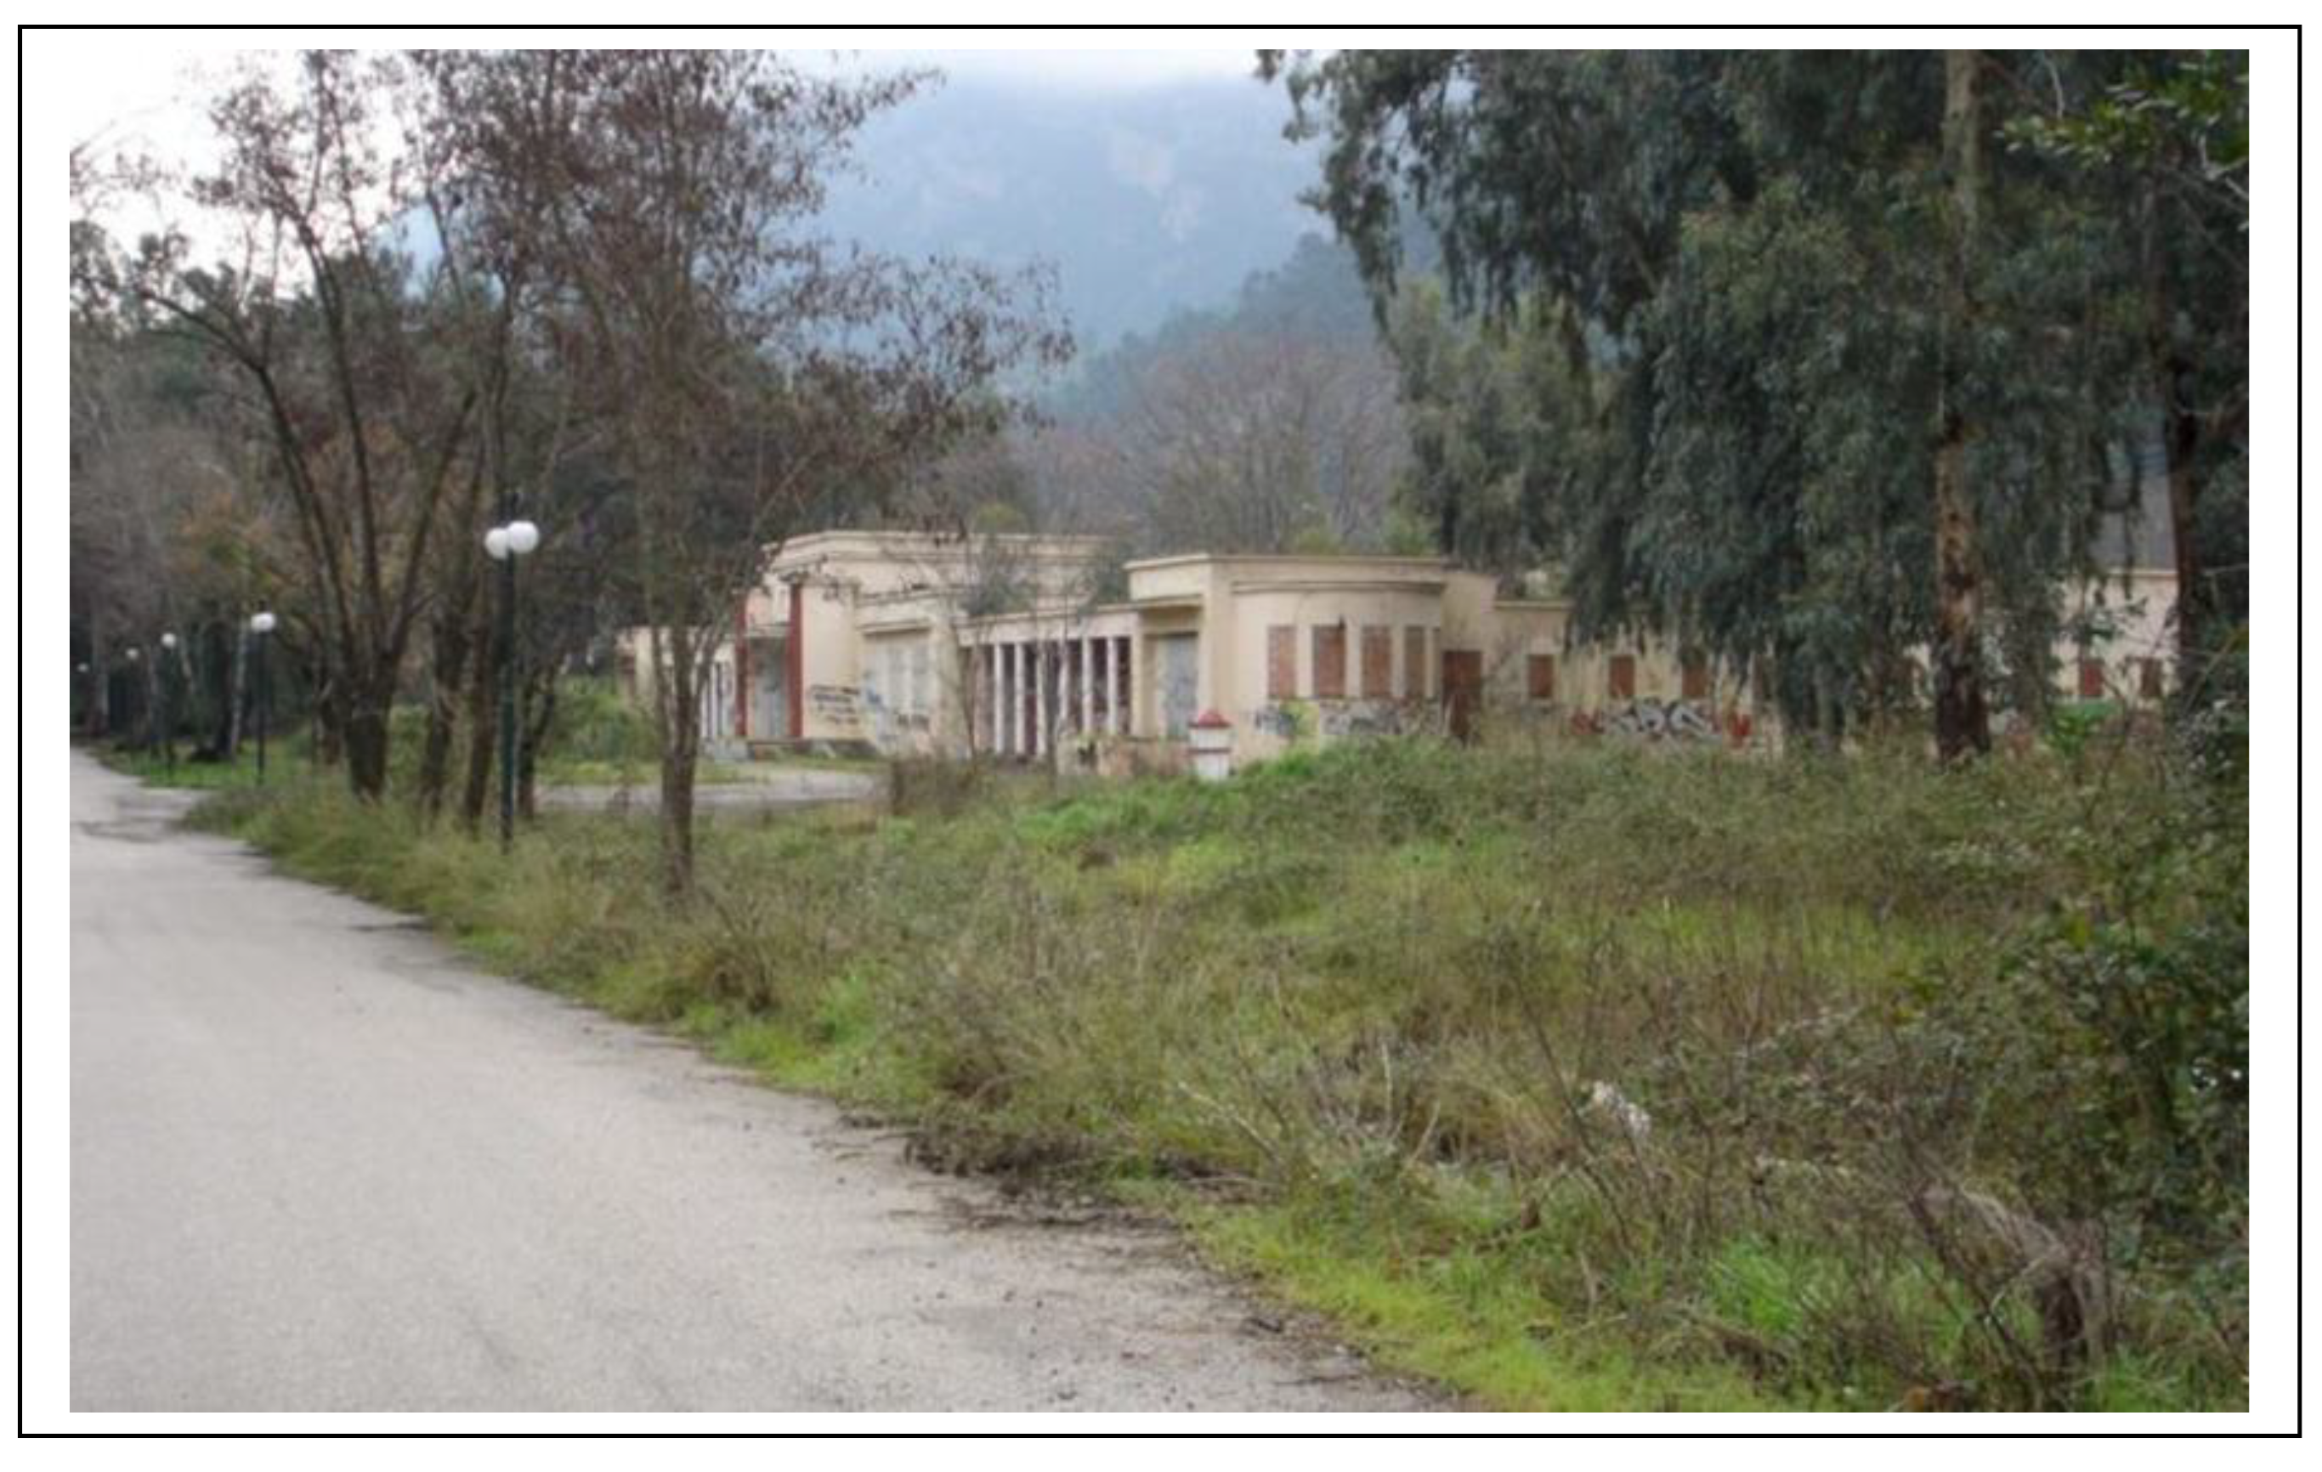
Figure 10,
Figure 11 and
Figure 12 present the current status of hotel RADION, hotel THRONION, and wellness center Asclepios. We present this visual information to provide the reader with a complete and precise picture of the current situation around ‘Koniavitis’ thermal springs and is unexploited potential so far.
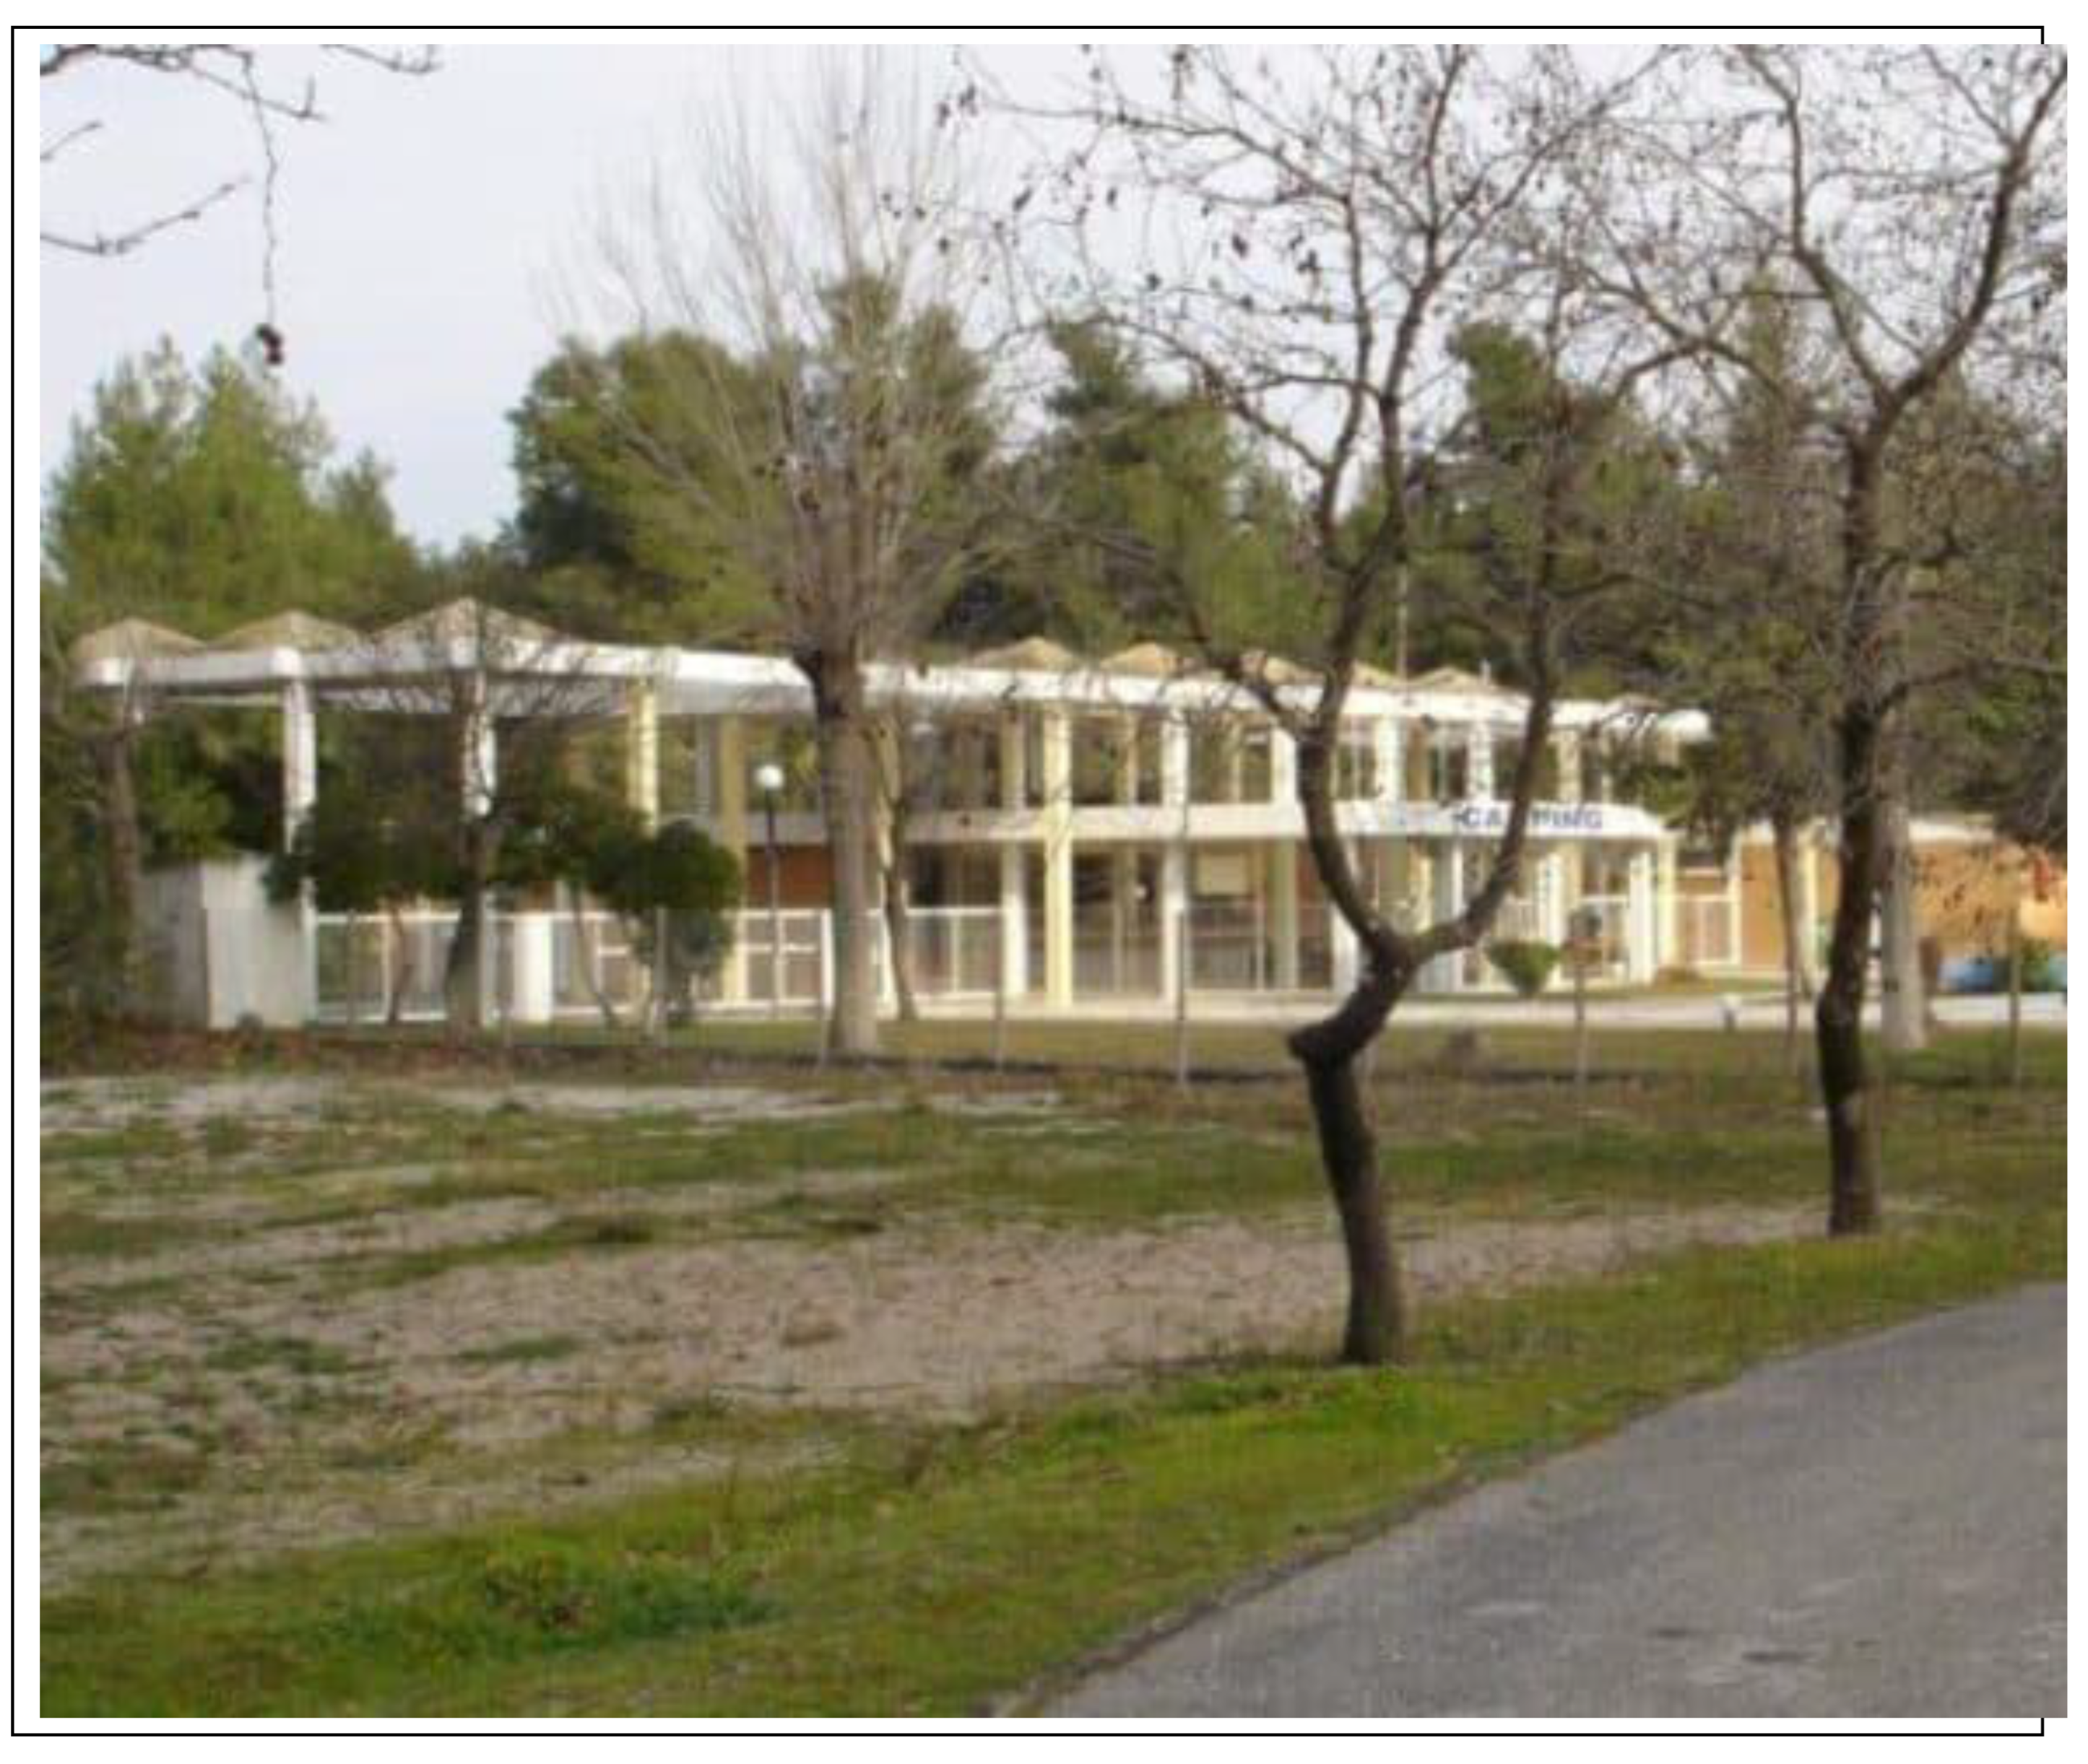
Figure 13 shows a campground located on the southern part of the Maliakos Gulf, west of Kamena Vourla. It included camping facilities with an infrastructure for 250 caravans, a reception building, 50 huts, 5 stores, and staff buildings. The thermal spring lagoons, the two former luxury hotels RADION and THRONION, the abandoned campground, and the hydrotherapy and wellness center with the surrounding areas belong to the Hellenic Republic Asset Development Fund (HRADF), whose role is to attract investments and enhance economic growth.
Another interesting aspect is that the location of the thermal springs is very close to the main highway that connects the south and the north part of Greece, which provides an additional strong advantage to attempt further developments and re-establish wellness tourism attractions and services. Access is direct via the new, improved routing of the Athens – Thessaloniki National Road (PATHE) and via the old road network of the local villages. Kamena Vourla is 175 km from Athens (2 hours by car from the Athens International Airport) and 40 km from Lamia, the capital town of Fthiotida Prefecture.
Figure 7.
The spa center as it was back in the 1930s
2.
Figure 7.
The spa center as it was back in the 1930s
2.
Figure 8.
The wellness center “Asclepios” as it was in the 1960s
3.
Figure 8.
The wellness center “Asclepios” as it was in the 1960s
3.
Figure 9.
Luxury hotel RADION in the 1960s
4.
Figure 9.
Luxury hotel RADION in the 1960s
4.
Figure 10.
The current situation of hotel Radion
5.
Figure 10.
The current situation of hotel Radion
5.
Figure 11.
The current situation of hotel THRONIO (Source: Beriatos & Papageorgiou, 2008).
Figure 11.
The current situation of hotel THRONIO (Source: Beriatos & Papageorgiou, 2008).
Figure 12.
Currently abandoned wellness center “Asclepios” in the study area
6.
Figure 12.
Currently abandoned wellness center “Asclepios” in the study area
6.
Figure 13.
The abandoned campground
7.
Figure 13.
The abandoned campground
7.
Appendix B
Profiles of the 16 combinations of attributes of wellness tourism used in the conjoint analysis.
| ID |
Time of visit |
Duration of visit (days) |
Purpose of visit |
Wellness tourism services |
| 1 |
July – August |
8-14 |
Wellness tourism is the main purpose of visit |
Physical activities and training |
| 2 |
November – March |
8-14 |
Wellness tourism is not the main purpose of tourism
(Wellness tourism is secondary for my visit) |
Physical activities and training and spiritual/emotional enhancement |
| 3 |
September – October |
8-14 |
Wellness tourism is not the main purpose of tourism
(Wellness tourism is secondary for my visit) |
Physical activities and training |
| 4 |
April – June |
1-7 |
Wellness tourism is not the main purpose of tourism
(Wellness tourism is secondary for my visit) |
Physical activities and training and spiritual/emotional enhancement |
| 5 |
July – August |
1-7 |
Wellness tourism is not the main purpose of tourism
(Wellness tourism is secondary for my visit) |
Physical activities and training |
| 6 |
April – June |
8-14 |
Wellness tourism is the main purpose of visit |
Physical activities and training and spiritual/emotional enhancement |
| 7 |
November – March |
15+ |
Wellness tourism is not the main purpose of tourism
(Wellness tourism is secondary for my visit) |
Physical activities and training |
| 8 |
November – March |
1-7 |
Wellness tourism is the main purpose |
Physical activities and training |
| 9 |
April – June |
15+ |
Wellness tourism is the main purpose of visit |
Physical activities and training |
| 10 |
April – June |
1-7 |
Wellness tourism is not the main purpose of tourism
(Wellness tourism is secondary for my visit) |
Physical activities and training |
| 11 |
September – October |
15+ |
Wellness tourism is not the main purpose of tourism
(Wellness tourism is secondary for my visit) |
Physical activities and training and spiritual/emotional enhancement |
| 12 |
July – August |
15+ |
Wellness tourism is the main purpose of visit |
Physical activities and training and spiritual/emotional enhancement |
| 13 |
July – August |
1-7 |
Wellness tourism is not the main purpose of tourism
(Wellness tourism is secondary for my visit) |
Spiritual/emotional enhancement - stress relief |
| 14 |
September – October |
1-7 |
Wellness tourism is the main purpose of visit |
Physical activities and training |
| 15 |
November – March |
1-7 |
Wellness tourism is the main purpose of visit |
Spiritual/emotional enhancement - stress relief |
| 16 |
September – October |
1-7 |
Wellness tourism is the main purpose of visit |
Physical activities and training and spiritual/emotional enhancement |
References
- Hospers, G-J.; Reverda, N. Managing Population Decline in Europe's Urban and Rural Areas. 2015. Springer.
- Johnson, K.M.; Lichter, D.T. Rural Depopulation: Growth and Decline Processes over the Past Century. Rural Sociol. 2019; 84, 3–27. [Google Scholar] [CrossRef]
- Martinez-Fernandez, C., Kubo, N., Noya, A., & Weyman, T. (Eds.). Demographic change and local development: Shrinkage, regeneration and social dynamics. 2012. Paris: OECD/LEED.
- Rink, D. Shrink Smart: The Governance of Shrinkage within a European Context. 2009.Leipzig: Helmholtz Centre for Environmental Research.
- Coleman, D.; Rowthorn, R. Who’s afraid of population decline? A critical examination of its consequences. Popul Dev Rev. 2011, 37, 217–248. [Google Scholar]
- Paniagua, A. The environmental dimension in the constitution of new social groups in an extremely depopulated rural area of Spain. Land Use Policy, 2008, 25(1), 17–29. [CrossRef]
- Pezzini, M. Rural policy lessons from OECD countries. Int. Reg. Sci. Rev., 2001, 24(1), 134–145. [CrossRef]
- Merino, F.; Prats, M.A. Why do some areas depopulate? The role of economic factors and local governments. Cities 2020, 97, 102506. [Google Scholar] [CrossRef]
- Makkonen, T.; Inkinen, T. Benchmarking the vitality of shrinking rural regions in Finland. J. Rural Stud. 2023, 97, 334–344. [Google Scholar] [CrossRef]
- Gao, C.; Cheng, L. Tourism-driven rural spatial restructuring in the metropolitan fringe: An empirical observation. Land Use Policy, 2020, 95(6), 1–12. [CrossRef]
- Dwyer, L. Tourism development and sustainable well-being: a Beyond GDP perspective. J. Sustain. Tour. 2020; 31, 2399–2416. [Google Scholar] [CrossRef]
- Deng, A.; Lu, J.; Zhao, Z. Rural destination revitalization in China: applying evolutionary economic geography in tourism governance. Asia Pacific J. Tour. Res., 2021, 26(2), 215-230. [CrossRef]
- López-Sanz, J.M.; Penelas-Leguía, A.; Gutiérrez-Rodríguez, P.; Cuesta-Valiño, P. Sustainable Development and Rural Tourism in Depopulated Areas. Land 2021, 10, 985. [Google Scholar] [CrossRef]
- Sharpley, R. and Sharpley, J. Rural Tourism: An Introduction. 1997. London: International Thomson Business Press.
- Panagopoulos, T.; Barreira, A.P. Shrinkage perceptions and smart growth strategies for the municipalities of Portugal. Built. Environ., 2012, 38 (2), 276–292.
- Pesonen, J.A.; Komppula, R. Rural Wellbeing Tourism: Motivations and Expectations. J. Hosp. Tour. Manag., 2010, 17(1), 150–157. [CrossRef]
- Vukovic, P., Cavlin, G., and Cavlin, M. Complementarity in the development of rural tourism with the development of thermal baths, spa and wellness tourism. Economics of Agriculture 2015, 1, 259–270. [CrossRef]
- Medina-Munoz, D.R.; Medina-Munoz, R.D. Determinants of expenditures on wellness services: the case of Gran Canaria. Reg. Stud., 2010, 46(3), 309–319. [CrossRef]
- Pyke, S.; Hartwell, H.; Blake, A.; Hemingway, A. Exploring well-being as a tourism product resource. Tour. Manag. 2016, 55, 94–105. [Google Scholar] [CrossRef]
- Mueller, H.; Kaufmann, E. L. Wellness tourism: Market analysis of a special health tourism segment and implications for the hotel industry. J. Vacat. Mark., 2001, 7(1), 5–17. [CrossRef]
- Aparicio, A.E. El turismo rural: Una de las alternativas al desarrollo rural en la Serranía de Cuenca. Cuad. Tur. 2004, 13, 73–89. [Google Scholar]
- Loehr, J.; Becken, S.; Nalau, J.; Mackey, B. Exploring the multiple benefits of ecosystem-based adaptation in tourism for climate risks and destination well-being. J. Hosp. Tour. Res., 2020, 46(3), 518-543. [CrossRef]
- Smith, M.; Kelly, C. Wellness Tourism. Tour. Recreat. Res. 2006, 31, 1–4. [Google Scholar] [CrossRef]
- Devereux, C.; Carnegie, E. Pilgrimage: Journeying beyond self. Tour. Recreat. Res., 2006, 31(1), 47–56. [CrossRef]
- Jolliffe, L.; Cave, J. Health and wellness tourism. In P. Robinson (Ed.), Tourism: The key concepts. 2012. London: Routledge.
- Bushell, R.; Sheldon, P. J. Wellness and tourism: Mind, body, spirit, place. 2009. New York, NY. Cognizant Communication.
- Steiner, C. J.; Reisinger, Y. Ringing the fourfold: A philosophical framework for thinking about wellness tourism. Tour. Recreat. Res., 2006, 31(1), 5–14. [CrossRef]
- SRI. Global Spa and Wellness Summit. The Global Wellness Tourism Economy. (2017). Travel and Tourism Research Association: Advancing Tourism Research Globally. 15. https://scholarworks.umass.edu/ttra/2013marketing/White_Papers/15.
- Huang, L, & Xu, H. (2018). Therapeutic landscapes and longevity: Wellness tourism in Bama. Soc. Sci. Med. 2018, 197, 24–32. [CrossRef]
- Voigt, C.; Brown, G.; Howat, G. Wellness tourists: In search of transformation. Tourism Review, 2011, 66(1/2), 16–30. [CrossRef]
- Kelly, C. Analysing wellness tourism provision: A retreat operators’ study. J. Hosp. Tour. Manag., 2010, 17(1), 108-116. [CrossRef]
- Rodrigues, A.; Kastenholz, K.; Rodrigues, A. Hiking as a wellness activity - an exploratory study of hiking tourists in Portugal. J. Vacat. Mark., 2010, 16(4), 331-343. [CrossRef]
- Heung, V. C.; Kucukusta, D. Wellness tourism in China: Resources, development and marketing. Int. J. Tour. Res., 2013, 15(4), 346–359. [CrossRef]
- Huijbens, E.H. Developing wellness in Iceland. Theming wellness destinations the Nordic way. Scand. J. Hosp. Tour., 2011, 11(1), 20–41. [CrossRef]
- Mak, A.H.N.; Wong, K.K.F.; Chang, R.C.Y. Health or self-indulgence? The motivations and characteristics of Spa-goers. Int. J. Tour. Res. 2009, 11, 185–199. [Google Scholar] [CrossRef]
- Voigt, C.; Howat, G.; Brown, G. Hedonic and eudaimonic experiences among wellness tourists: an exploratory enquiry. Ann. Leis. Res., 2010, 13(3), 541–562. [CrossRef]
- Hamed, H.M. Wellness Tourism: An Initiative for Comprising Wellness Tourism Vacations within the Corporate Wellness Strategy. Am. J. Tour. Res., 2015, 4(2), 52-67. [CrossRef]
- Dillette, A.K.; Douglas, A.C.; Andrzejewski, C. Dimensions of holistic wellness as a result of international wellness tourism experiences. Curr. Issues Tour., 2020, 24 (6), 1-17. [CrossRef]
- Global Wellness Institute. 2020 Compendium: Resetting the World with Wellness. 2020. GWI.
- Romao, J.; Machino, K.; Nijkamp, P. Integrative diversification of wellness tourism services in rural areas – an operational framework model applied to east Hokkaido (Japan). Asia Pac. J. Tour. Res., 2018, 23(7), 734-746. [CrossRef]
- Kazakov, S.; Oyner, O. Wellness tourism: a perspective article. Tourism Review, 2020, 76(1), 58-63. [CrossRef]
- Stara, J.; Peterson, C. Understanding the concept of wellness for the future of the tourism industry: a literature review. Journal of Tourism & Services, 2017, 8(4). https://www.vso.cz/pdf/journal-of-tourism_14-2017-final.pdf.
- Wang, K.; Xu, H.; Huang, L. Wellness tourism and spatial stigma: A case study of Bama, China. Tour. Manag. 2020, 78, 104039. [Google Scholar] [CrossRef]
- Goodarzi, M.; Haghtalab, N.; Shamshiry, E. Wellness tourism in Sareyn, Iran: Resources, planning and development. Curr. Issues Tour., 2016, 19(11), 1071–1076. [CrossRef]
- Kucukusta, D.; Heung, V. C. The problems of developing wellness tourism in China: From supply perspective. J. China Tour. Res., 2012, 8(2), 146–158. [CrossRef]
- Lee, C. F.; King, B. E. Using the Delphi method to assess the potential of Taiwan’s hot springs tourism sector. Int. J. Tour. Res., 2008, 10(4), 341–352. [CrossRef]
- Supapol, A. B.; Barrows, D.; Barrows, A. Canadian health and wellness tourism: Obstacles impeding international competitiveness. The Innovation Journal: The Public Sector Innovation Journal, 2007, 12(3), 1–18.
- Hallab, Z. Catering to the healthy-living vacationer. J. Vacat. Mark., 2006, 12(1), 71–91. [CrossRef]
- Sayadi, S.; Gonzales Roa, C.; Calatrava Requena, J. Ranking versus scale rating in conjoint analysis: evaluating landscapes in mountainous regions in southeastern Spain. Ecol Econ. 2005, 55, 539–550. [Google Scholar] [CrossRef]
- Williams, P. W.; Andestad, G.; Pollock, A.; Dossa, K. B. Health spa travel markets: Mexican long-haul pleasure travellers. J. Vacat. Mark., 1996, 3(1), 10–31. [CrossRef]
- Kim, E.; Chiang, L.; Tang, L. Investigating wellness tourists’ motivation, engagement, and loyalty: In search of the missing link. J. Travel Tour. Mark., 2017, 34(7), 867–879. [CrossRef]
- Lim, Y. J. Kim, H. K., & Lee, T. J. (2016). Visitor motivational factors and level of satisfaction in wellness tourism: Comparison between first-time visitors and repeat visitors. Asia Pacific J. Tour. Res., 21(2), 137–156. [CrossRef]
- Luo, Y.; Lanlung, C.; Kim, E.; Tang, L. R.; Song, S. M. Towards quality of life: The effects of the wellness tourism experience. J. Travel Tour. Mark., 2018, 35(4), 410–424. [CrossRef]
- Thal, K. I.; Hudson, S. A conceptual model of wellness destination characteristics that contribute to psychological well-being. J. Hosp. Tour. Res., 2017, 43(1), 41–57. [CrossRef]
- Hudson, S.; Thal, K.; Cardenas, D.; Meng, F. Wellness tourism: Stress alleviation or indulging healthful habits? Int. J. Cult. Tour. Hosp. Res., 2017, 11(1), 35–52. [CrossRef]
- Lehto, X. Y.; Brown, S.; Chen, Y.; Morrison, A. M. Yoga tourism as a niche within the wellness tourism market. Tour. Recreat. Res., 2006, 31(1), 25–35. [CrossRef]
- Suh, Y-K.; Gartner, W.C. Preferences and trip expenditures—a conjoint analysis of visitors to Seoul, Korea. Tour. Manag. 2004, 25, 127–137. [CrossRef]
- Tripathi, S.N.; Siddiqui, M.H. An empirical study of tourist preferences using conjoint analysis. Int. J. Bus. Sci. Appl. Manag., 2010, 5(2), 1-16. [CrossRef]
- Oh, H. C.; Uysal, M.; Weaver, P.A. Product Bundles and Market Segments Based on Travel Motivations: A Canonical Correlation Approach. Int. J. Hosp. Manag., 1995, 14(2), 123-37. [CrossRef]
- Chen, J. S.; Prebensen, N.; Huan, T. C. Determining the motivation of wellness travelers. Anatolia, 2008, 19(1), 103–115. [CrossRef]
- Hun Kim, B.; Batra, A. Healthy-living behaviour status and motivational characteristics of foreign tourists to visit wellness facilities in Bangkok. Proceedings from The 2nd Annual PSU Phuket Research Conference, Proceedings, Prince of Songkla University, Songkhla, Thailand, 1–8.
- Mak, A.H.N.; Wong, K.K.F.; Chang, R.C.Y. Health or self-indulgence? The motivations and characteristics of Spa-goers. Int. J. Tour. Res. 2009, 11, 185–199. [Google Scholar] [CrossRef]
- Gabor, M. R.; Oltean, F.D. Babymoon tourism between emotional well-being service for medical tourism and niche tourism. Development and awareness on Romanian educated women. Tour. Manag. 2019, 70, 170–175. [Google Scholar] [CrossRef]
- Laing, J. H.; Voigt, C.; Wray, M.; Brown, G.; Weiler, B.; Howat, G.; Tremath, R. Sand, surf, spa and spirituality? Examination of a scoping study of medical and wellness tourism in Australia. Proceedings of the Travel and Tourism Research Association European Chapter Conference Proceedings: Health wellness and tourism - healthy tourists, healthy business? 2010, 1–14.
- Pan, X.; Yang, Z.; Han, F.; Lu, Y.; Liu, Q. Evaluating potential areas for mountain wellness tourism: A case study of Ili, Xinjiang Province. Sustainability, 2019, 11(20), 5668. [CrossRef]
- Kreiger, B.; Mostokowitz, H.; Rabino, S. What Customers Want from a Cruise Vacation: Using Internet-Enabled Conjoint Analysis to Understand the Customer’s Mind. J. Hosp. Mark. Manag. 2005, 13, 83–111. [Google Scholar] [CrossRef]
- Won, D.; Hwang, S. Factors Influencing the College Skiers and Snowboarders Choice of a Ski Destination in Korea: A Conjoint Analysis. Managing Leisure 2009, 14, 17–27. [Google Scholar] [CrossRef]
- Hwang, S.; Won, D. A Conjoint Analysis Regarding Influencing Factors of Golfers’ Preferred Driving Ranges in Korea. J. Travel Tour. Mark. 2010, 1, 227–237. [Google Scholar] [CrossRef]
- Arenoe, B.; van der Res, J-P.I.; Kattuman, P. Game theoretic pricing models in hotel revenue management: An equilibrium choice-based conjoint analysis approach. Tour. Manag. 2015, 51, 96–102. [CrossRef]
- Carmichael, B. Conjoint analysis, tourism. In: Jafari, J., Xiao, H. (eds) Encyclopedia of Tourism. 2005, Springer, Cham. [CrossRef]
- Nuraeni, S.; Pradiva Arrub, A.; Novani, S. Understanding Consumer Decision-Making in Tourism Sector: Conjoint Analysis. The 6th Indonesia International Conference on Innovation, Entrepreneurship and Small Business, 12 – 14 August 2014 Procedia - Social and Behavioral Sciences, 169, 312 – 317.
- Li, J.; Hudson, S. Conjoint Analysis of Consumer Preferences to Destination Brand Attributes. Travel and Tourism Research Association: Advancing Tourism Research Globally. 2015, 22.
- Zhang, J., Wei, X., Fukuda, H., Zhang, Li, & Ji, X. A Choice-based conjoint analysis of social media picture posting and souvenir purchasing preference: A case study of social analytics on tourism. Inf Process Manag. 2021, 58, 102716. [CrossRef]
- Huang, J-C.; Haab, T.C.; Whitehead, J.C. Willingness to Pay for Quality Improvements: Should Revealed and Stated Preference Data Be Combined? Journal of Environmental Economics and Management 1997, 34, 240–255. [CrossRef]
- Ekstrand, R.E.; Loomis, J. Incorporating respondent uncertainty when estimating willingness to pay for protecting critical habitat for threatened and endangered fish. Water Resour. Res., 1998, 34(11), 3149-3155. [CrossRef]
- Machado, F.; Mourato, S. Improving the assessment of the water related health impacts: Evidence from coastal waters in Portugal. Paper Presented at the First World Congress on Environmental and Resource Economics. Venice. 1998, June 25-27.
- Blakemore, F.B.; Williams, A.T.; Ozhan, E. Tourist valuation of Olu Deniz beach, Turkey, using contingent valuation and travel cost approaches. Journal of World Leisure 2000, 4, 48–55. [Google Scholar] [CrossRef]
- Togridou, A.; Hovardas, T.; Pantis, J.D. (2006). Determinants of visitors; willingness to pay for the national marine park in Zakynthos. Ecological Economics 2006, 60, 308–319. [Google Scholar] [CrossRef]
- Ahmad, S. A. Visitors’ willingness to pay for an entrance fee: a case study of marine parks in Malaysia. PhD Dissertation, Department of Economics, Faculty of Law, Business and Social Science, University of Glasgow, UK, 2009. [Google Scholar]
- Halkos, G.; Matsiori, S. Economic valuation of coastal zone quality improvements. MPRA, 2011, 35395.
- Jurado-Rivas, C., & Sánchez-Rivero, M. Willingness to Pay for More Sustainable Tourism Destinations in World Heritage Cities: The Case of Caceres, Spain. Sustainability 2019, 11, 5880. [CrossRef]
- Vespestad, M. K.; Gressnes, T. Tourists’ willingness to pay for nature-based tourism experiences. Tourism Analysis, 2021, 26(4), 319-332. [CrossRef]
- Duran-Roman, J.L.; Cardenas-García, P.J.; Pulido-Fernandez, J.K.I. Tourists’ willingness to pay to improve sustainability and experience at destination. J. Dest. Mark. Manage. 2021, 19, 100540. [Google Scholar] [CrossRef]
- Xiao, J.; Wang, M.; Xue, G. Valuing tourists’ willingness to pay for conserving the nonuse values of marine tourism resources: a comparison of three archipelagic tourism destinations in China. J. Sustain. Tour., 2021, 29(4), 678-710. [CrossRef]
- Boto-Garcia, D., Mariel, P., Pino, J.B., & Alvarez, A. Tourists’ willingness to pay for holiday trip characteristics: A Discrete Choice Experiment. Tour. Econ., 2022, 28(2), 349– 370. [CrossRef]
- Anagostou, A.; Ekonomou, G.; Kallioras, D. The Nexus of Tourism Spending with Economic Performance: A Panel Data Analysis for the Eurozone Area. Geogr. Pannonica, 2021, 25(1), 35-44. [CrossRef]
- Ritchie, H., & Roser, M. (2018). Urbanization. Our world in data.
- Butler, R.W. Seasonality in tourism: issues and implication, In A.V. Seaton (Ed.). Tourism: a state of the art. Chichester, 1994, UK: Wiley, 332-339.
- Lohr, S. Sampling: Design and Analysis (Chapman & Hall/CRC Texts in Statistical Science) (2nd Edition). 2019.Routledge.
- Ahmed, S. Methods in sample surveys. Cluster sampling. John Hopkins Bloomberg. School of Public Health. 2009.
- Hoshaw-Woodard, S. Description and comparison of the methods of cluster sampling and lot quality assurance sampling to assess immunization coverage. Department of Vaccines and Biologicals. World Health Organization. 2001.
- Zelin, A.; Stubbs, R. Cluster Sampling: A False Economy? Int. J. Mark. Res., 2005, 47(5), 501-522. [CrossRef]
- Vallée, J.; Souris, M.; Fournet, F.; Bochaton, A.; Mobillion, V.; Peyronnie, K.; Salem, G. Sampling in health geography: Reconciling geographical objectives and probabilistic methods. An example of a health survey in Vientiane (Lao PDR). Emerging themes in epidemiology.2007.
- Jackson, S.L. Research Methods and Statistics: A Critical Approach. (4th edition). Cengage Learning. 2011.
- Leo, L. Role of cluster sampling in market research. Int. J. Mark. Res. 2009, 49, 306–321. [Google Scholar]
- Reutterer T, Kotzab HW. (2000). The use of conjoint-analysis for measuring preferences in Supply chain design. Ind. Mark. Manag. 2000, 29, 27–35. [CrossRef]
- Louviere, J.L., Flynn, T.N., & Carson, R.T. (2010). Discrete choice experiments are not conjoint analysis. J. Choice Model. 2010, 3, 57–72. [CrossRef]
- Alvarez-Farizo, B.; Hanley, N. Using conjoint analysis to quantify public references over the environmental impacts of wind farms. An example from Spain. Energy Policy 2002, 30, 107–116. [Google Scholar] [CrossRef]
- Danaher, P.J. Using conjoint analysis to determine the relative importance of service attributes measured in customer satisfaction surveys. J. Retail. 1997, 73, 235–260. [Google Scholar] [CrossRef]
- Huber, J. Conjoint analysis: how we got here and where we are (an update). Sawtooth Software, Research Papers Series. 2005.
- Green, P. E.; Krieger, A. M.; Wind, Y. Thirty years of conjoint analysis: Reflections and prospects (pp. 117-139). Springer US. 2004.
- Agarwal, M.K.; Green, P.E. Adaptive conjoint analysis versus self-explicated models: some empirical results. Int. J. Res. Mark. 1991, 8, 141–146. [Google Scholar] [CrossRef]
- Andersen, R.C.; Hansen, E.C. The impact of environmental certification preferences for wood furniture: a conjoint analysis approach. For. Prod. J. 2004, 54, 42–50. [Google Scholar]
- Sayadi, S.; Gonzales Roa, C.; Calatrava Requena, J. Ranking versus scale rating in conjoint analysis: evaluating landscapes in mountainous regions in southeastern Spain. Ecol Econ. 2005, 55, 539–550. [Google Scholar] [CrossRef]
- Milon, W.J.; Alvarez, S. The Elusive Quest for Valuation of Coastal and Marine Ecosystem Services. Water 2019, 11, 1518. [Google Scholar] [CrossRef]
- Polyzos, S.; Minetos, D. Valuing environmental resources in the context of flood and coastal defence project appraisal. A case-study of Poole Borough Council seafront in the UK. Management of Environmental Quality: An International Journal, 2007, 18(6), 694-710.
- Markandya, A.; R.A. Ortiz. Encyclopedia of Environmental Health. Reference work. Science Direct. 2011.
- Johnston, R. J.; Boyle, K. J.; Adamowicz, W. Bennett, J.; Brouwer, R., Cameron, T. A.; Vossler, C. A. Contemporary guidance for stated preference studies. J. Assoc. Environ. Resour. Econ., 2017, 4(2), 319-405.
- Genius, M., Hatzaki, E., Kouromichelaki, E.M., Kouvakis, G., Nikiforaki, S., & Tsagarakis, K. P. Evaluating consumers’ willingness to pay for improved potable water quality and quantity. Water Resour. Manag. 2008, 22, 1825–1834. [CrossRef]
- Pennington, M. Handling Protest Responses in Contingent Valuation Surveys. Medical Decision Making, August, 2017, 623-634. [CrossRef]
- Meyerhoff, J.; Liebe, U. Determinants of protest responses in environmental valuation: a meta-study. Ecol Econ., 2010, 70 (2), 366–374. [CrossRef]
- Jorgensen, B.S.; Syme, G.J.; Bishop, B.J.; Nancarrow, B.E. Protest responses in contingent valuation. Environ Resour Econ. 1999, 14, 131–50. [Google Scholar] [CrossRef]
- Strazzera, E.; Genius, M.; Scarpa, R.; Hutchinson, G. The Effect of Protest Votes on the Estimates of WTP for Use Values of Recreational Sites. Environ Resour Econ. 2003, 25, 461–476. [Google Scholar] [CrossRef]
- Lee, S. Application of logistic regression model and its validation for landslide susceptibility mapping using GIS and remote sensing data. Int. J. Remote Sens. 2005, 26, 1477–1491. [Google Scholar] [CrossRef]
- Ohlmacher, C.G.; Davis, C.J. Using multiple regression and GIS technology to predict landslide hazard in northeast Kansas, USA. Eng. Geol., 2003, 69(3), 331–343. [CrossRef]
- Cheung, H.D.; Chang, T.M. A study on subjective preference to daylit residential indoor environment using conjoint analysis. Build Environ. 2008, 43, 2101–2111. [Google Scholar] [CrossRef]
- Halkos, G.; Gkampoura, E.-C. Evaluating the effect of economic crisis on energy poverty in Europe. Renewable and Sustainable Energy Review 2021, 144, 110981. [Google Scholar] [CrossRef]
- Krinsky I, Robb AL. On approximating the statistical properties of elasticities. Rev Econ Stat., 1986; 68: 715-719. [CrossRef]
- Andreu, M.G.N-l.; Font-Barnet, A.; Roca, M.E. Wellness Tourism—New Challenges and Opportunities for Tourism in Salou. Sustainability 2021, 13, 8246. [CrossRef]
- Huang, R.; Sarigollu, E. Assessing satisfaction with core and secondary attributes. J. Bus. Res. 2008, 61, 942–949. [Google Scholar] [CrossRef]
- Sirgy, J.M. Promoting quality-of-life and well-being research in hospitality and tourism. J. Travel Tour. Mark., 2019, 36(1), 1-13. [CrossRef]
- Smith, S. Tourism analysis: A handbook (2nd ed.). Harlow: Longman.1995.
- Foris, D. Improving the Management of Tourist Destinations: A New Approach to Strategic Management at the DMO Level by Integrating Lean Techniques. Sustainability 2020, 12, 10201. [Google Scholar] [CrossRef]
- Arabatzis, G.; Polyzos, S. Contribution of natural and socio-cultural resources in tourism development of Mainland Greek prefectures: A typology. J. Environ. Prot. Ecol., 2008, 9(2), 446-464.
- Cochran, C. The continual improvement process: From strategy to the bottom line. Chico, CA. Patton Press LLC.2003.
- Crane, F.; Kerin, R. A.; Hartley, S. W.; Rudelius, W. Marketing 8th Canadian edition. Toronto, Ontario: McGraw-Hill Ryerson.2011.
- Wen, J., Kozak, M., Yang, S. and Liu, F. (2020). COVID-19: potential effects on Chinese citizens’ lifestyle and travel. Tourism Review, 76(1), 74-87. [CrossRef]
- Singh, S.; Nicely, A.; Day, J.; Cai, L.A. Marketing messages for post-pandemic destination recovery- A Delphi study. J. Dest. Mark. Manage. 2021, 23, 100676. [Google Scholar] [CrossRef]
- Hellenic Statistical Authority 2021. https://www.statistics.gr/en/2021-census-pop-hous (Accessed 19 October 2023).
- Hellenic Statistical Authority (2011). https://www.statistics.gr/2011-census-pop-hous (Accessed 19 October 2023).
- Wikipedia (2022). https://en.wikipedia.org/wiki/Kamena_Vourla (Accessed 19 October 2023).
- Beriatos, E.; Papageorgiou, M. Derelict building installations and infrastructures in Greek Spa Towns: the case of Kamena Vourla and Ypati. WIT Transactions on Ecology and the Environment 2008, 107, 149–158. [Google Scholar]
|
Disclaimer/Publisher’s Note: The statements, opinions and data contained in all publications are solely those of the individual author(s) and contributor(s) and not of MDPI and/or the editor(s). MDPI and/or the editor(s) disclaim responsibility for any injury to people or property resulting from any ideas, methods, instructions or products referred to in the content. |
© 2023 by the authors. Licensee MDPI, Basel, Switzerland. This article is an open access article distributed under the terms and conditions of the Creative Commons Attribution (CC BY) license (http://creativecommons.org/licenses/by/4.0/).
