Preprint
Review

Design of Photovoltaic System for Green Manufacturing by using Statistical Design of Experiments

Altmetrics

Downloads

194

Views

102

Comments

1

This version is not peer-reviewed

Submitted:

09 November 2023

Posted:

09 November 2023

You are already at the latest version

Alerts
Abstract
AbstractTo overcome the negative impacts on the environment and other problems associated with fossil fuels have forced many countries to inquire into and change to environmentally friendly alternatives that are renewable to sustain the increasing energy demand. Solar energy is one of the best renewable energy sources with the least negative impacts on the environment. Different countries have formulated solar energy policies to reduce dependence on fossil fuel and increasing domestic energy production by solar energy. According to the 2010 BP Statistical Energy Survey, the world cumulative installed solar energy capacity was 22928.9 MW in 2009, a change of 46.9% compared to 2008. In this study, a PV generation system has been modeled and installed considering uncertain whether based on the hourly wind speed data of New York City (NYC) of year 2014. Regression models has been used to forecast the hourly, weekly, and monthly wind speed of NYC year 2014. Design of experiment (DOE) has been used to determine the optimal panel size (area), the battery capacity size, and other levels of factors.
Keywords: 
Subject: Engineering  -   Civil Engineering

1. Introduction

Energy policy is a strategy in which the government decides to address the issues of energy development along with the development of the energy industry to sustain its growth, including energy production, distribution, and consumption [1,2]. The attributes of energy policy may include legislation, international treaties, and investment incentives [3]. It plays a vital role in mitigating the impacts of global warming and the crisis of energy availability [4].
Solar energy is one of the cleanest energy resources that does not compromise or add to global warming. The sun radiates more energy in one second than people have used since the beginning of time [5,6,7]. Solar energy is often called “alternative energy” to fossil fuel energy sources such as oil and coal [8]. The availability of cheap and abundant energy with minimum environmental and ecological hazards associated with its production and use is one of the important factors for desired improvement in the quality of life of the people [9,10]. The growing scarcity of fossil fuels has raised global interest in the harnessing of solar energy [11]. Solar power is a type of energy with great future potential though at present it covers merely a minor portion of global energy demands (0.05% of the total primary energy supply); now PV power generates less than 1% of the total electricity supply [12,13,14,15]. This is due to solar power still being considered the most expensive type of renewable energy. However, in remote regions of the earth, it may very well constitute today's best solution for a decentralized energy supply. According to the 2010 BP Statistical Energy Survey, the world cumulative installed solar energy capacity was 22928.9 MW in 2009, a change of 46.9% compared to 2008.
World primary energy demand is projected in the Reference Scenario to expand by almost 60% from 2002 to 2030, an average annual increase of 1.7% per year. Demand will reach 16.5 billion tons of oil equivalents (toe) compared to 10.3 billion toes in 2002 which is shown in Table 1. On the other hand, fossil fuels will continue to dominate global energy use. They will account for around 85% of the increase in world primary demand over 2002–2030. And their share in total demand will increase slightly, from 80% in 2002 to 82% in 2030. The share of renewable energy sources will remain flat at around 4%, while that of nuclear power will drop from 7% to 5% [16,17,18,19].
Solar photovoltaic technology could harness the sun's energy to provide large-scale, domestically secure, and environmentally friendly electricity [20,21,22]. In 2005, global solar markets reached US$ 11.8 billion, up 55% from 2004. Solar installations are expected to provide 15 GW in 2010 versus 2.7 GW in 2006. In April 2007, Photon Consulting forecasted 2010 revenues from sales of solar energy equipment of US$ 90 billion, up from US$ 20 billion in 2006. Demand for silicon for solar cells is expected to increase from 41,000 tons in 2006 to 120,000 tons in 2010 and 400,000 tons in 2014. Table 2 shows the expected development and installation of solar photovoltaic electricity in the USA, Europe, Japan as well as worldwide until 2030.
Figure 1. Solar PV Installation in the US from 2001 to 2019 (cumulative vs annual addition).
Preprints 90071 g001
With growing aspects of this emerging area, the future of solar energy technology promises a transition to greener, more sustainable, and energy-efficient manufacturing processes [23]. As solar technologies continue to evolve and become more accessible, manufacturers will have the tools and incentives needed to make a substantial positive impact on both the environment and their bottom lines [24,25,26]. This shift towards solar-powered manufacturing is not only a testament to the industry's commitment to sustainability but also a strategic move towards long-term economic competitiveness [27].
The modern industrial landscape is witnessing a paradigm shift towards more sustainable and environmentally conscious practices, with a growing emphasis on green manufacturing. In this context, the utilization of solar energy stands as a pivotal and transformative component in the pursuit of cleaner, more energy-efficient production processes [28,29]. Solar energy offers not only a renewable and abundant source of power but also aligns with the principles of green manufacturing, which prioritize reduced environmental impact, energy efficiency, and resource conservation [30].
In the realm of green manufacturing, the integration of circular economy principles offers a wealth of advantages by culminating in a holistic and sustainable approach [31,32,33,34,35]. Green manufacturing, grounded in its commitment to reducing environmental impact and conserving resources, harmoniously dovetails with the foundational principles of the circular economy [36]. By blending these two paradigms, manufacturers stand to benefit in multiple dimensions [37]. Through the infusion of manufacturing process improvement principles, operations are streamlined, leading to increased efficiency, cost savings, and minimized waste generation. Furthermore, the incorporation of additive manufacturing techniques introduces unprecedented levels of flexibility, enabling on-demand production of intricate, sustainable components, and reducing material waste [38,39,40,41]. Simultaneously, the synergy of human-robot collaboration optimizes production processes by enhancing precision and speed, ultimately leading to cost reductions and heightened product quality [41,42,43,44]. This amalgamation promotes the life extension of products, facilitated by eco-design principles, and reduces the demand for virgin materials. The adoption of circular economy practices also entails the establishment of closed-loop systems and partnerships with suppliers and customers, which further enhances the overall sustainability of the supply chain, while enabling manufacturers to extract value from their waste materials. The reintegration of these materials into production operations, through waste-to-energy or upcycling approaches, not only minimizes environmental impact but also bolsters the circular economy's commitment to reducing waste. Sustainability metrics and reporting are integral to tracking progress, and the shift toward sustainable packaging materials and practices completes this sustainable loop [37]. Ultimately, the integration of circular economy principles within green manufacturing exemplifies a win-win scenario: manufacturers benefit from enhanced operational efficiency, cost savings, and reduced environmental impact, while simultaneously contributing to global sustainability efforts by reducing waste and conserving resources. This dynamic synergy represents a pivotal step toward a greener, more responsible, and economically prosperous future for both businesses and society at large.
Particularly, the inclusion of Solar energy in the circular economy-based green manufacturing domain stands as an unequivocal environmental champion in the realm of sustainable development, serving as the linchpin of responsible energy generation [45,46,47,48]. Unlike conventional energy sources, it operates without depleting precious natural resources or releasing harmful gaseous emissions like CO2, NOx, SO2, or particulates, thus contributing to a reduction in greenhouse and toxic gases. Additionally, solar energy projects can play a vital role in land reclamation, breathing new life into previously degraded areas. Notably, the decentralized nature of solar energy production reduces the need for extensive electricity grid transmission lines, mitigating energy losses and infrastructure requirements [49]. Simultaneously, solar power systems can enhance the quality of local water resources by conserving water traditionally consumed by cooling processes in conventional power plants. Solar energy further fosters regional and national energy independence by diversifying the energy mix and reducing dependence on centralized power sources. In turn, this diversification bolsters energy supply security and accelerates rural electrification efforts in developing nations, extending the benefits of clean energy access to underserved communities.

2. Methodology

The hourly wind speed data of NYC from the year 2014 to 2016 has been provided for the project. We are working for the year 2014 on this project. We have used Minitab, Excel, and Python to complete project work. For cleaning the data, we have used Python. As output, we received CSV format data and then converted the data into excel format. Data where the last number was not 51 eliminated by python software. We got 8744 hours of data and the rest 16-hour missing data we have calculated and finally, we get 8760 hours of wind speed. For statistical distribution, we have used Minitab software.

3. Result and Discussion

3.1. Question 01

For determining the mean and standard deviation, by month filter was applied and then the average and standard deviation of every month was taken. For the yearly mean and standard deviation, 8760 data were analyzed to get the values for 2014, 2015, and 2016.
  • Mean speed for 2015 = 4.875 m/s
  • Mean speed for 2014 = 5.07 m/s
  • Mean speed for 2016 = 5.15 m/s
  • Standard Deviation for 2015 = 2.6585
  • Standard Deviation for 2014 = 2.73
  • Standard Deviation for 2016 = 2.79
For the yearly mean and standard deviation for the year 2014, the rand () function in Excel was used to create a random sample and then 1000 data points were collected from that group. From the 1000 random data points, the month wise mean and standard deviation for 2014 was calculated and they are as follows:
Month Mean (M/S) Standard Deviation
January 6.09 2.93
February 5.93 3.27
March 5.29 2.86
April 5.36 2.84
May 4.41 2.75
June 4.56 2.2
July 4.18 2.09
August 4.27 2.09
September 4.10 2.09
October 5.22 2.34
November 4.49 2.52
December 5.49 1.54

3.2. Question 02

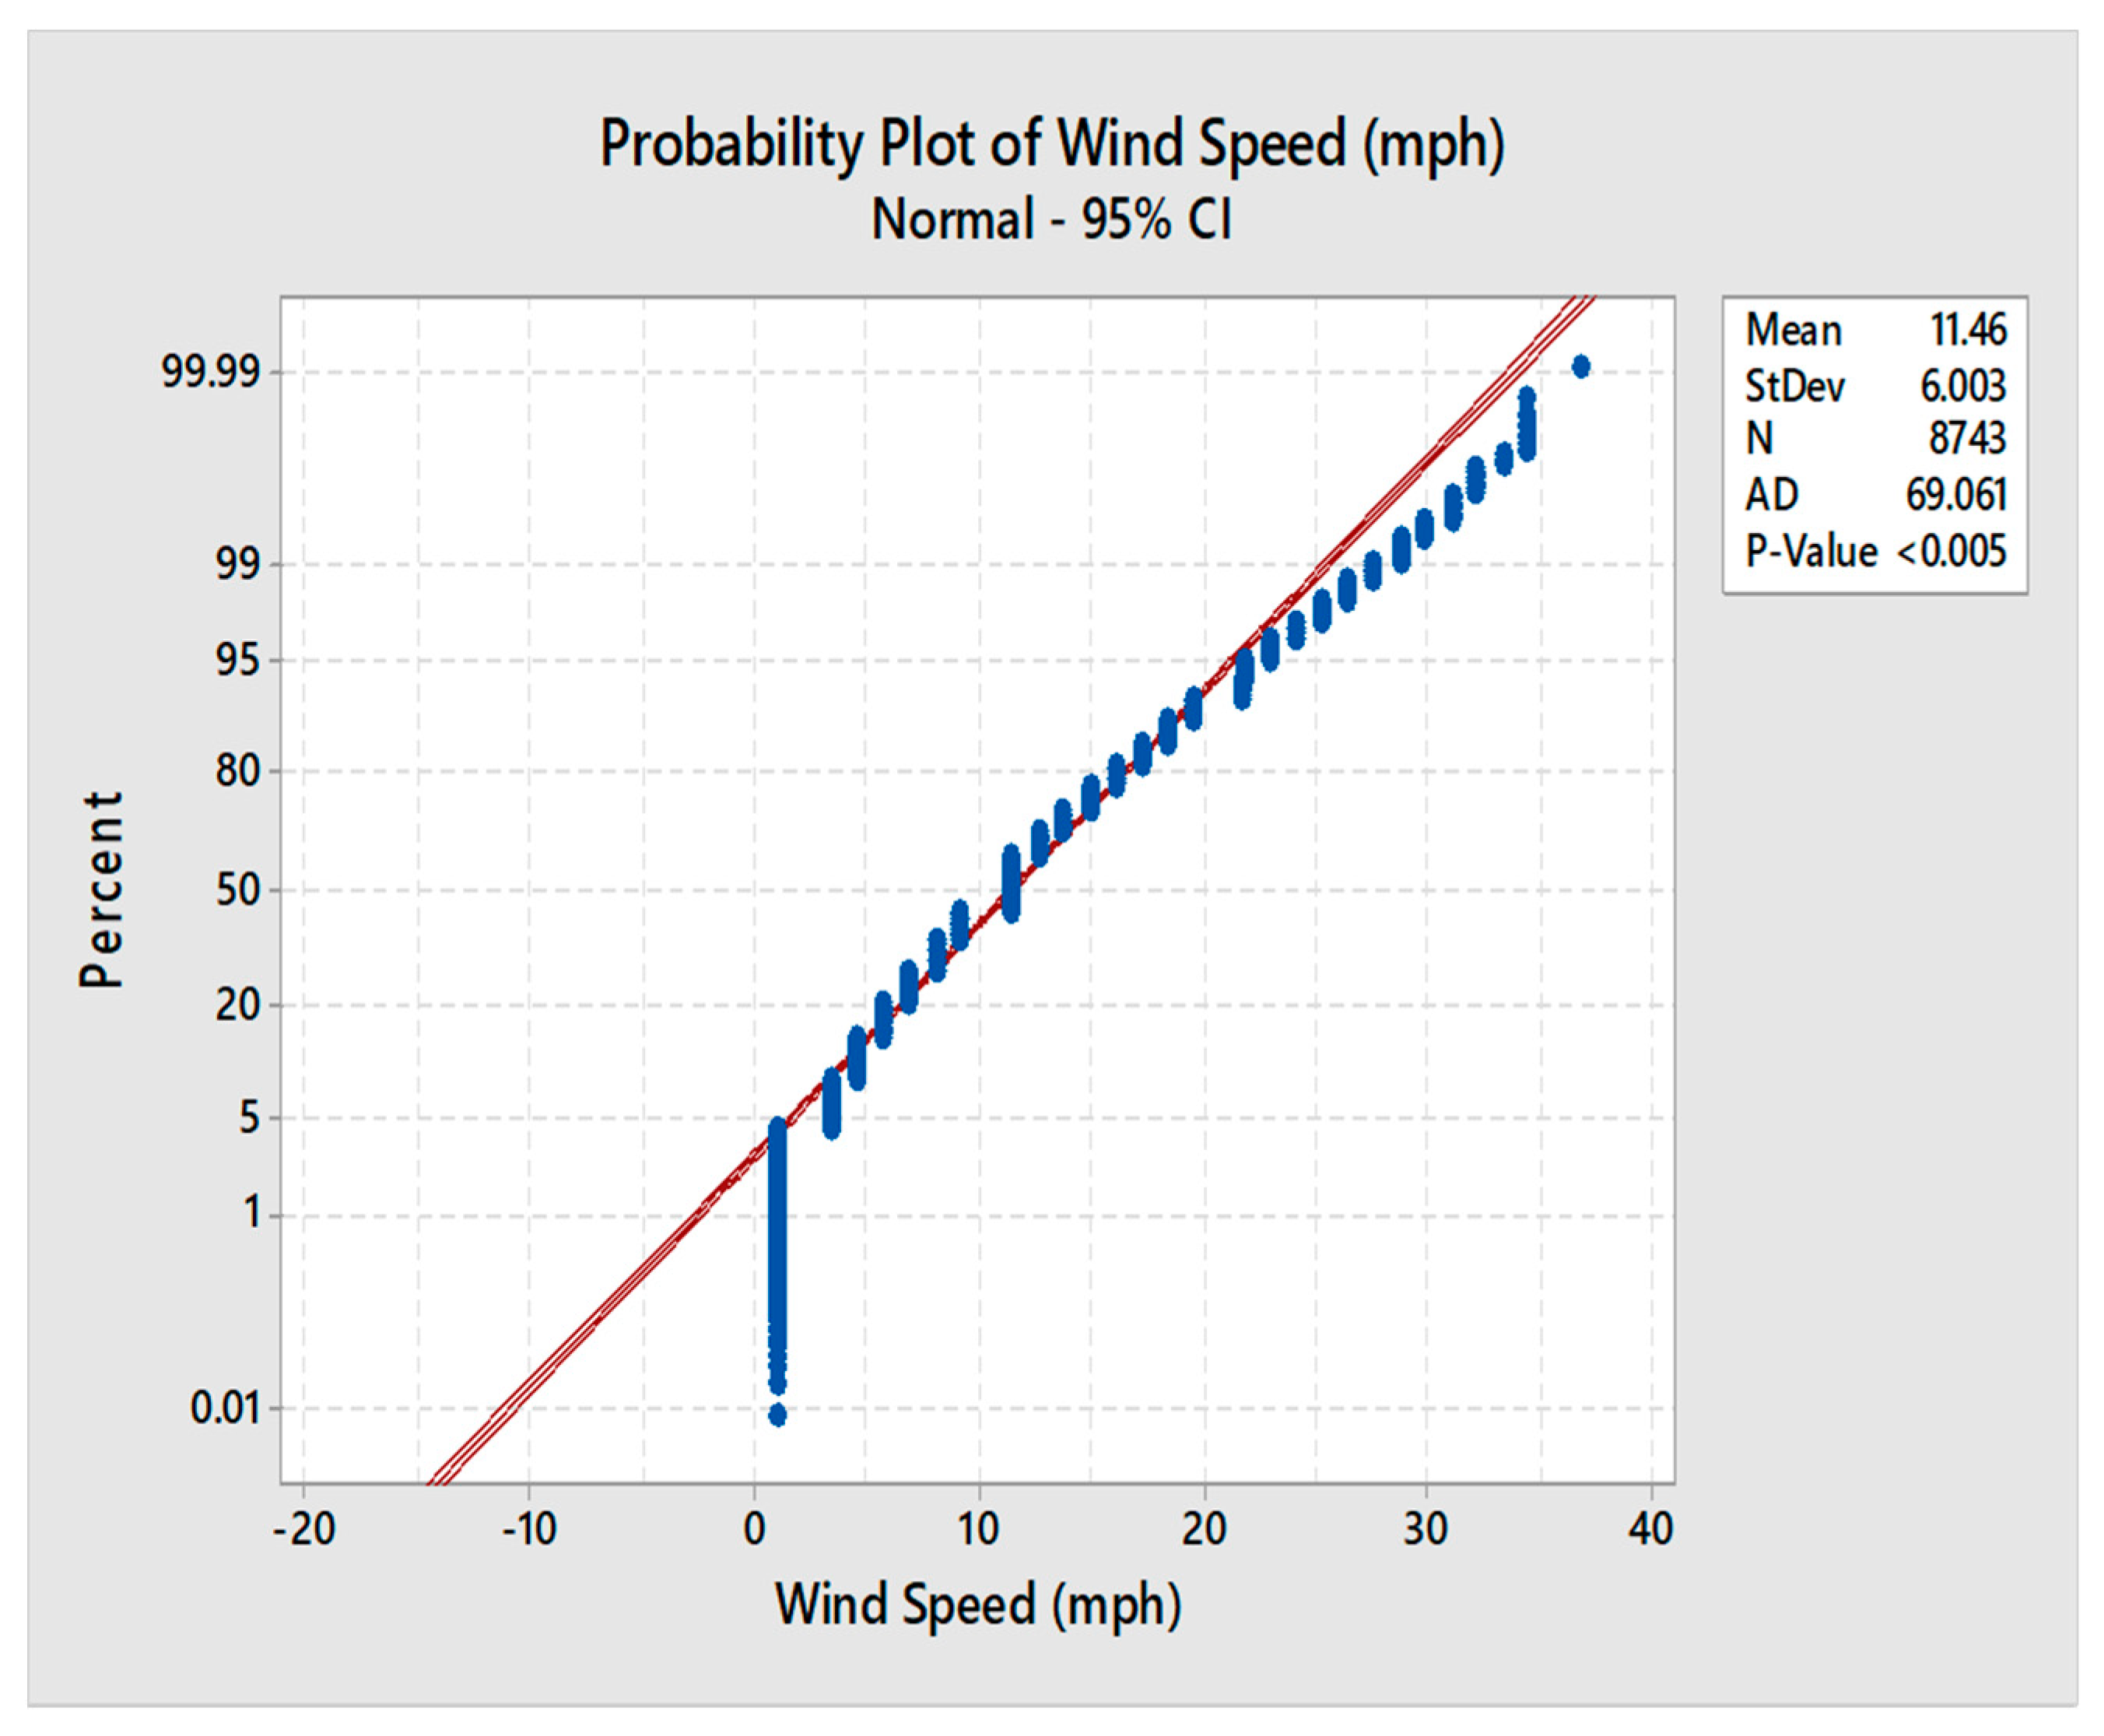
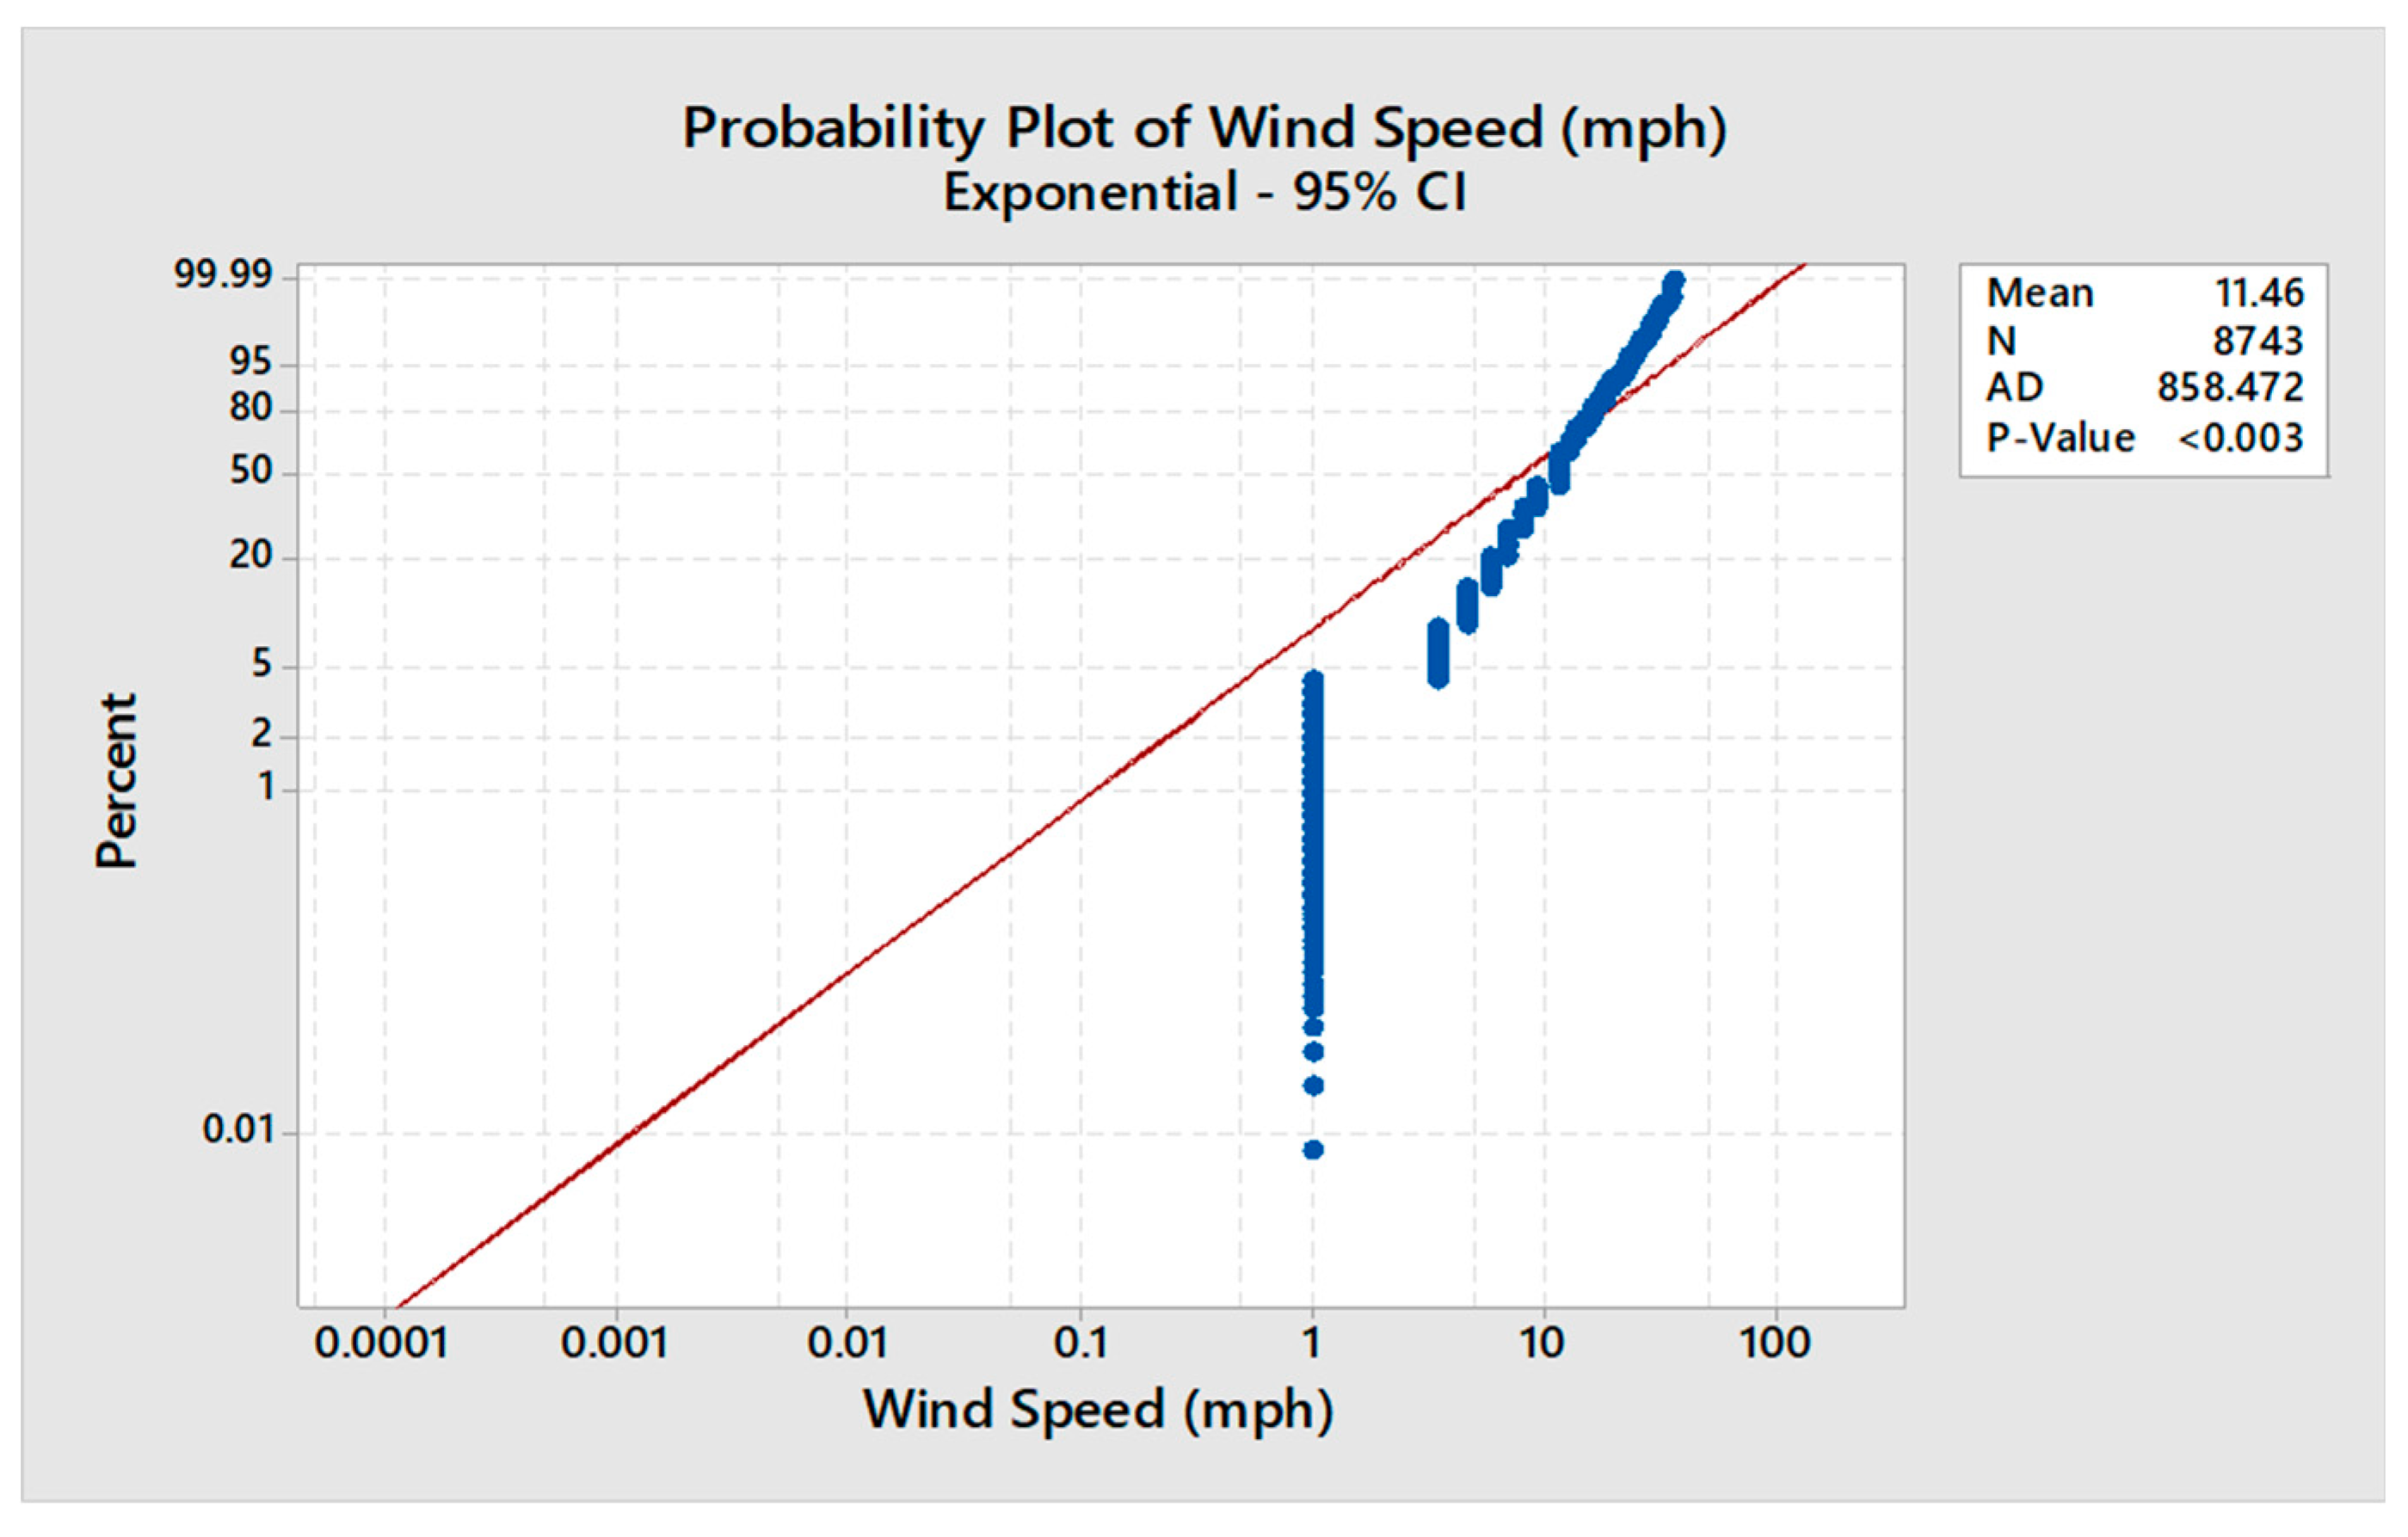
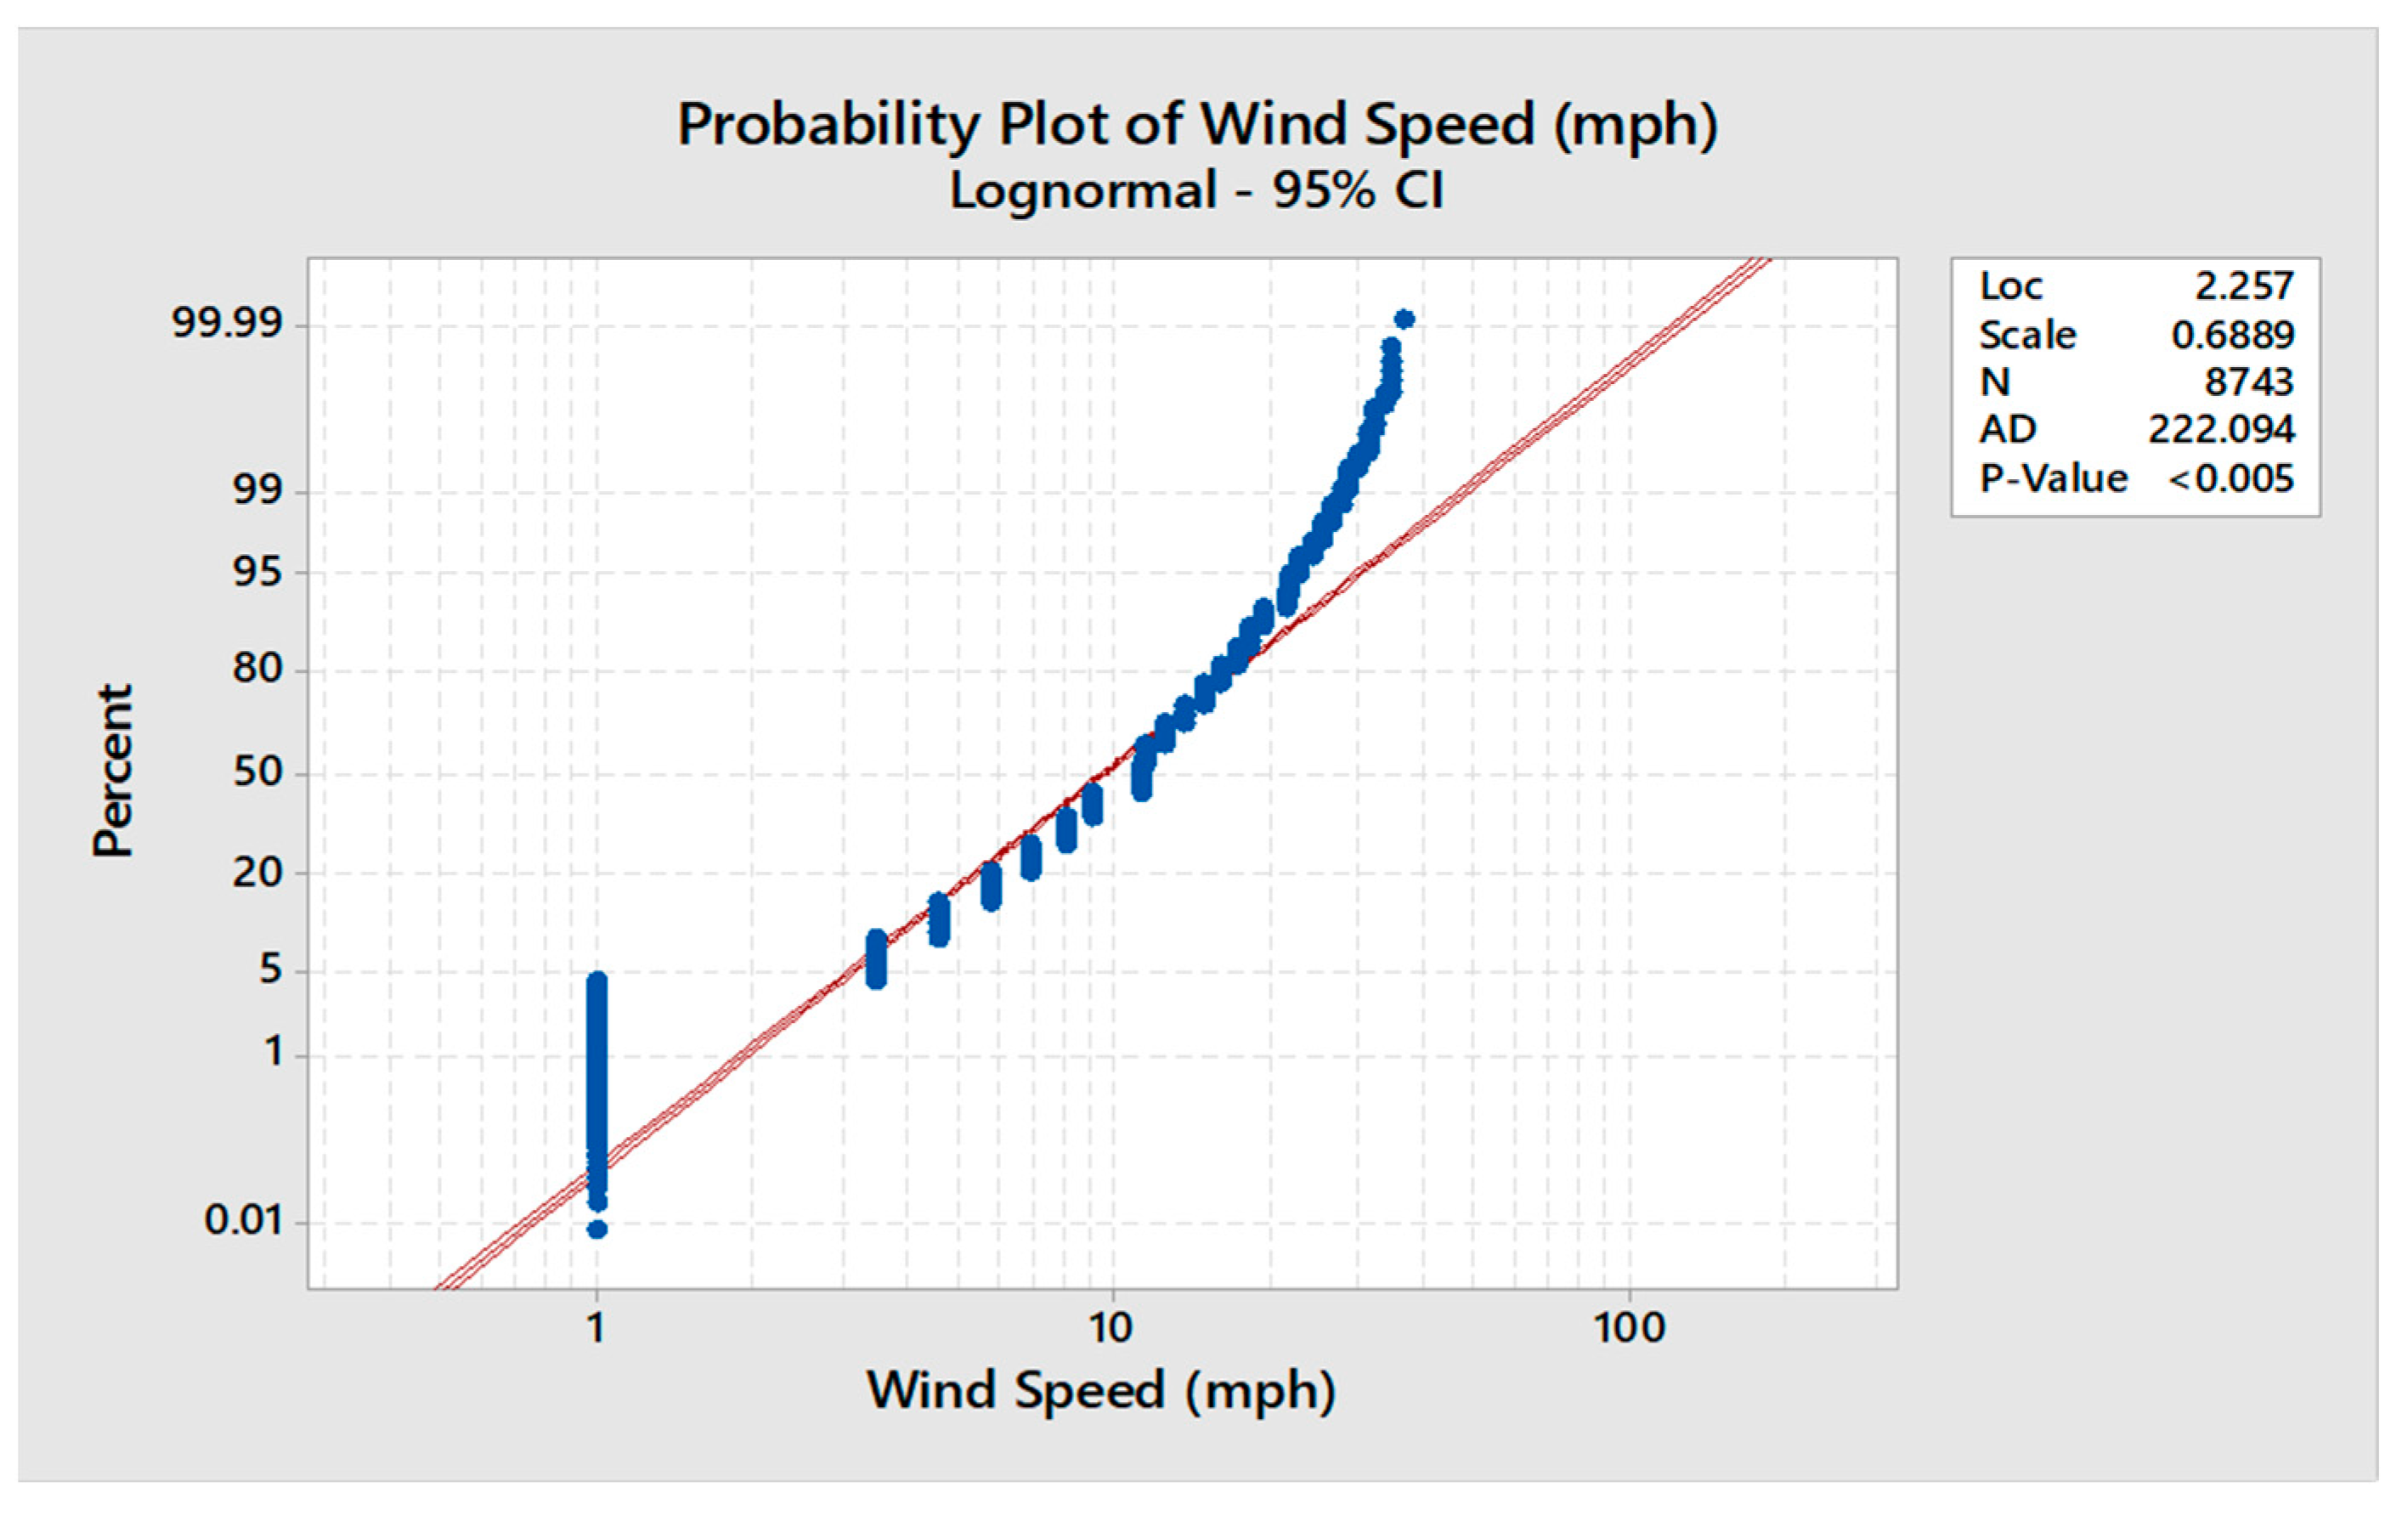
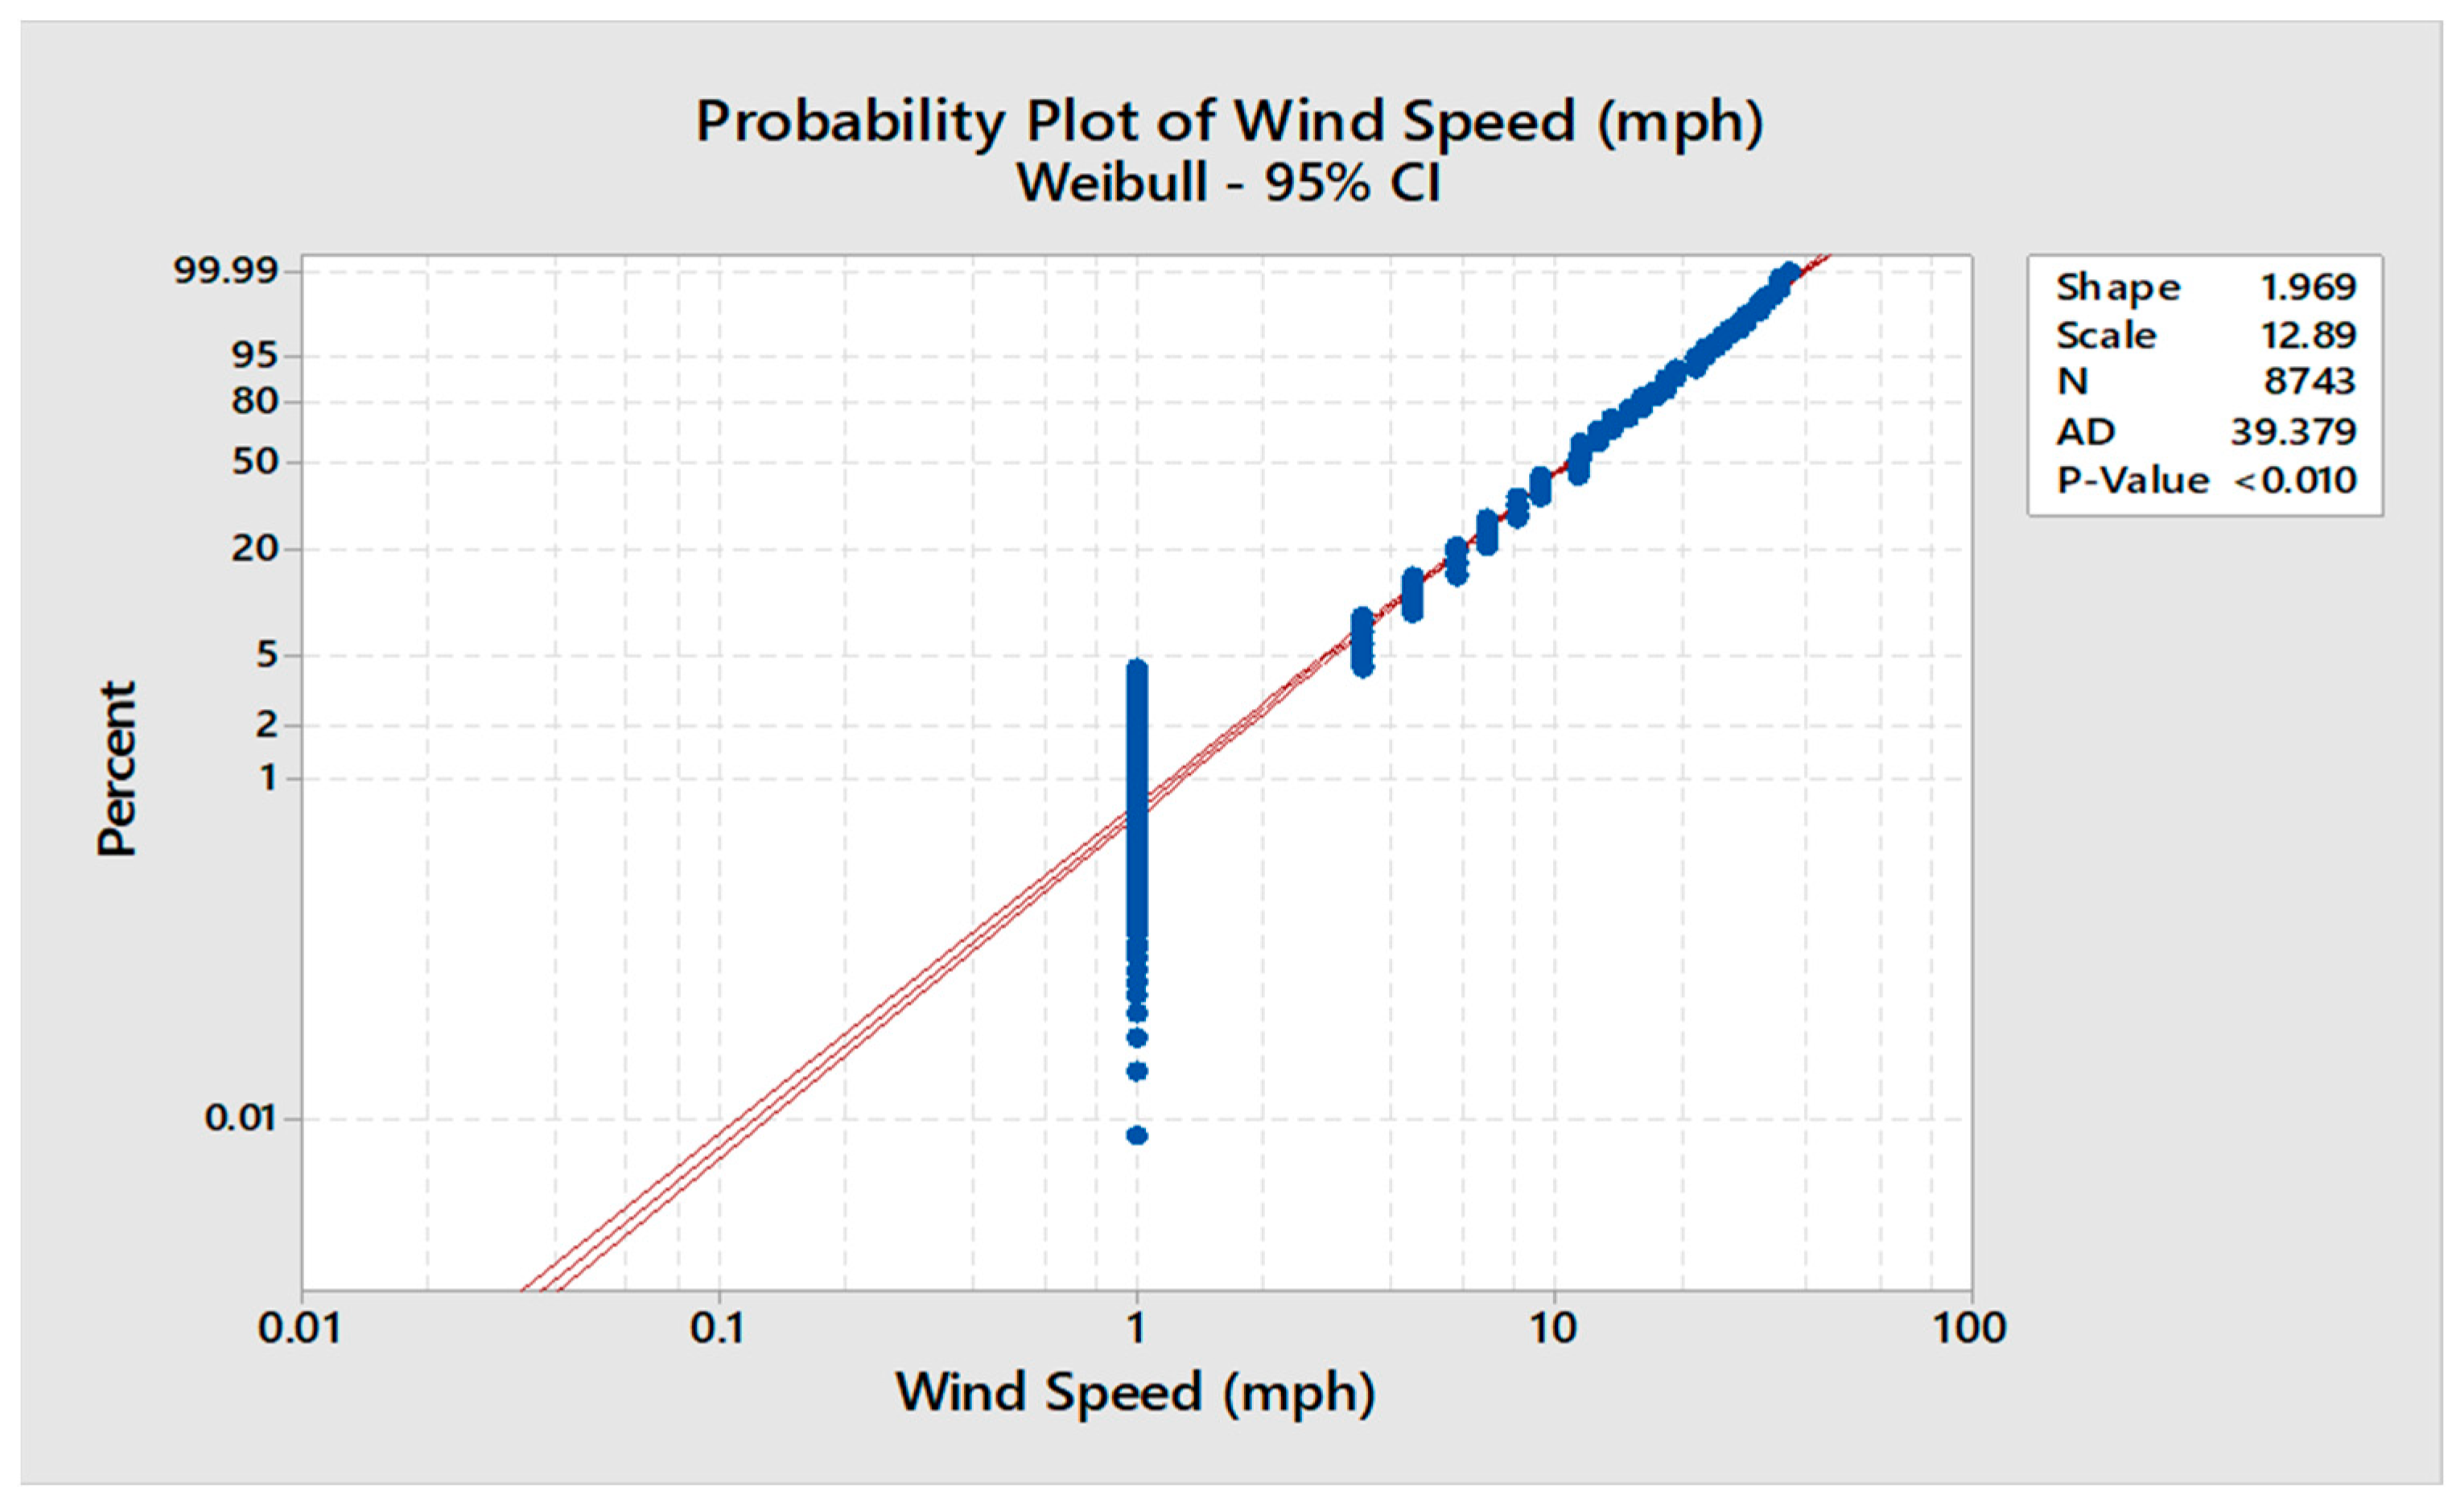
Using Minitab to fit a random sample of 1000, we concluded that the Weibull distribution is the best fit but still has a low p-value of <0.01. The second-best distributions were normal distribution with a p-value <0.005.
Figure 2. Probability plot of wind speed with normal distribution.
Preprints 90071 g002
Figure 3. Probability plot of wind speed with exponential distribution.
Preprints 90071 g003
Figure 4. Probability plot of wind speed with lognormal distribution.
Preprints 90071 g004
Figure 5. Probability plot of wind speed with Weibull distribution.
Preprints 90071 g005

3.3. Question 03

Hypothesis testing on windspeed means, Null Hypothesis: Ho: uo = u1
Alternative hypothesis: H1: uo≠u1
The mean of the 1000 random value of wind speed of 2015 is = 4.85 m/s
The variance of the 1000 random value of wind of 2015 speed is = 7.05
Standard deviation = 2.64
The mean of the 1000 random value of wind speed of 2016 is = 5.05m/s
The variance of the 1000 random value of wind of 2016 speed is = 7.78 m/s
Standard deviation = 2.78 m/s
Sp= 2.72
to = -0.51
to falls in between the range. Hence, we fail to reject the null hypothesis. So, the mean wind speed is not significantly different between two adjacent years.
Here, F value is less than the F critical value, so we fail to reject the null hypothesis using 95% confidence level.
Figure 6. F-test of two samples for variances.
Preprints 90071 g006

3.4. Question 04

We have taken 1000 sample data from the 8760 data to estimate the yearly wind speed. We have used Vh = Vg (80/8)3 to find the wind speed at turbine height. We have also removed the data which are unable to operate wind turbine. So, we have eliminated the wind speed less than 2m/s and greater than 25m/s. This gives us 330 data where wind turbine can operate between wind speed 12 m/s to 25 m/s.
The output will be = 2 MW/h*330 hrs. = 650 MWh. Between 0 to 2m/s numbers of samples = 32 Between 2 to 4m/s numbers of samples = 106 Between 4 to 6m/s numbers of samples = 134 Between 6 to 8m/s numbers of samples = 196 Between 8 to 10m/s numbers of samples = 150 Between 10 to 12m/s numbers of samples = 52
Wind Speed (m/s) 12-25 10-12 8-10 6-8 4-6 2-4
Power (MW) 2 1.75 1.5 1.25 0.75 0.25
  • From 1000 random data we have calculated total power =
  • (330Hrs x 2MWh) + (52Hrs x 1.75MWh) + (150Hrs x 1.5MWh) + (196Hrs x 1.25MWh) +
  • (134Hrs x .75MWh) + (106Hrs x .25MWh) = 1348 MWh total
  • For total 8760 data it will be = (1348/1000) *8760 = 11,808.48 MWh total
  • So, the number of homes wind turbine could power = (11,808.48*1000)/7300 = 1618 homes

3.5. Question 05
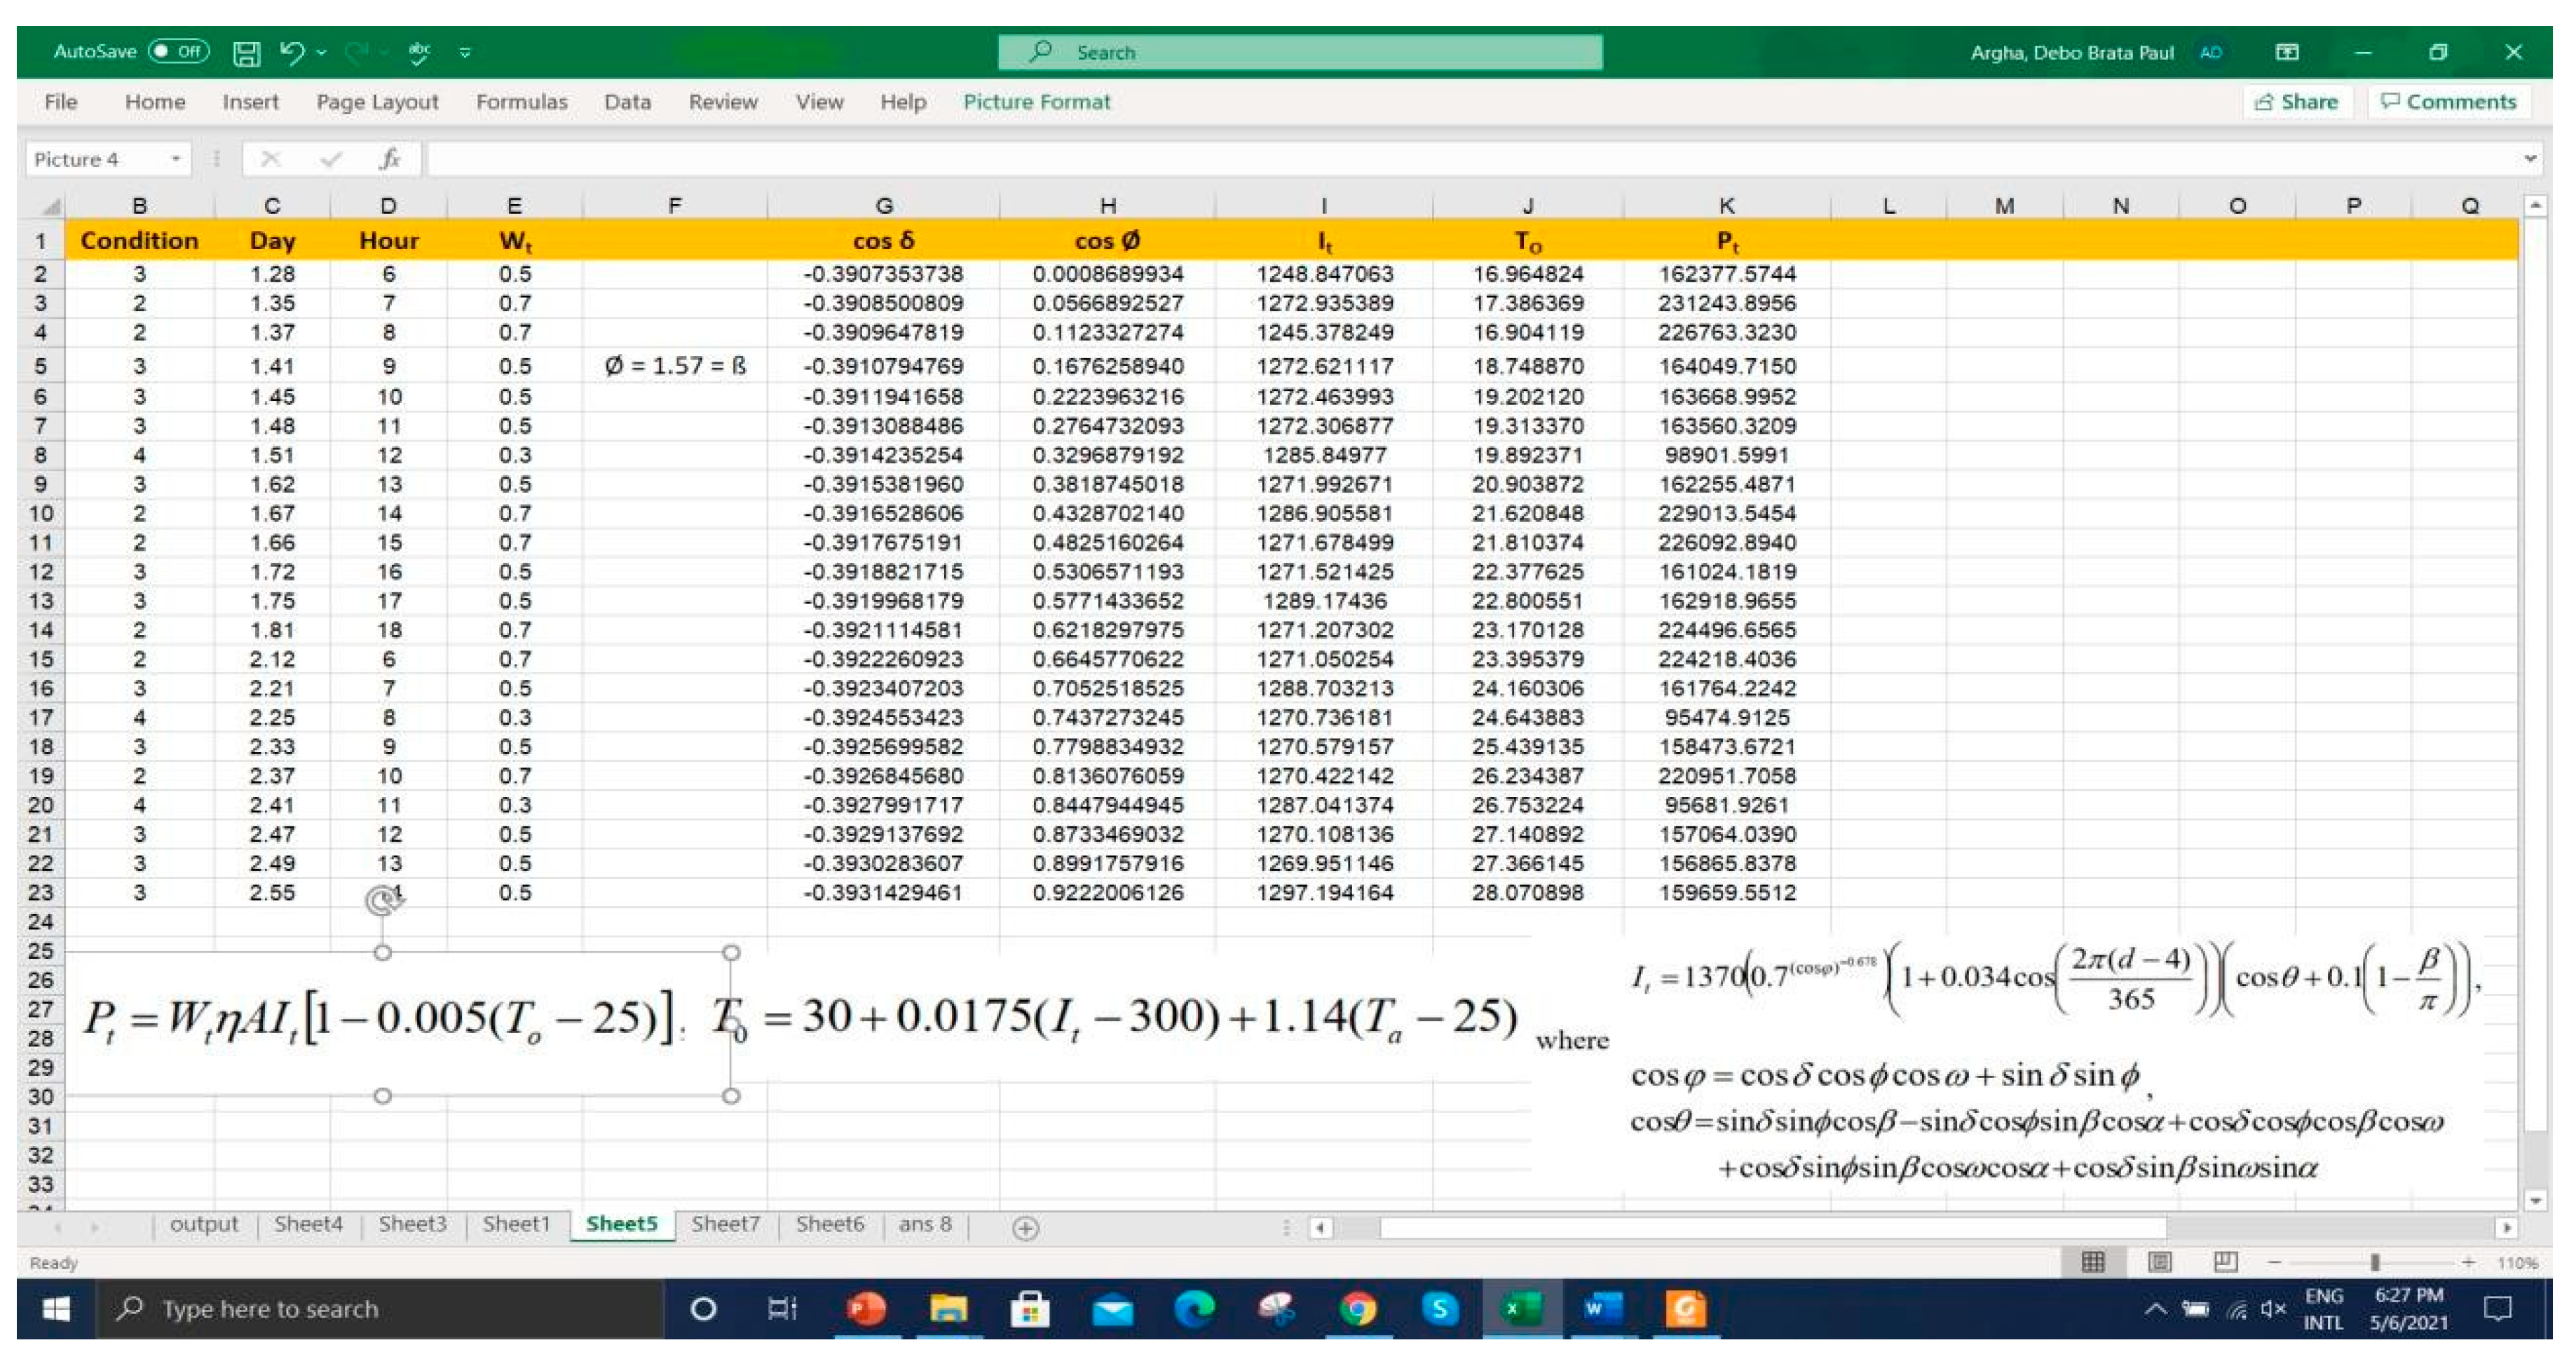
For PV output all-night data have been deleted and set the PV angle to the same as the latitude of NYC to maximize output. After calculating the sunrise and sunset time, excel was used to find solar irradiance at every hour. To find the power output I mapped the given data condition range of 1-9 to the required 1-0. Then the power output at every hour could be established for the panels. After power output at every hour was found the sum has been calculated and found the yearly power output.
In total, the solar panels generated 867.37 MWh.
Figure 7. Sample calculation for question 5.
Preprints 90071 g007

3.6. Question 06

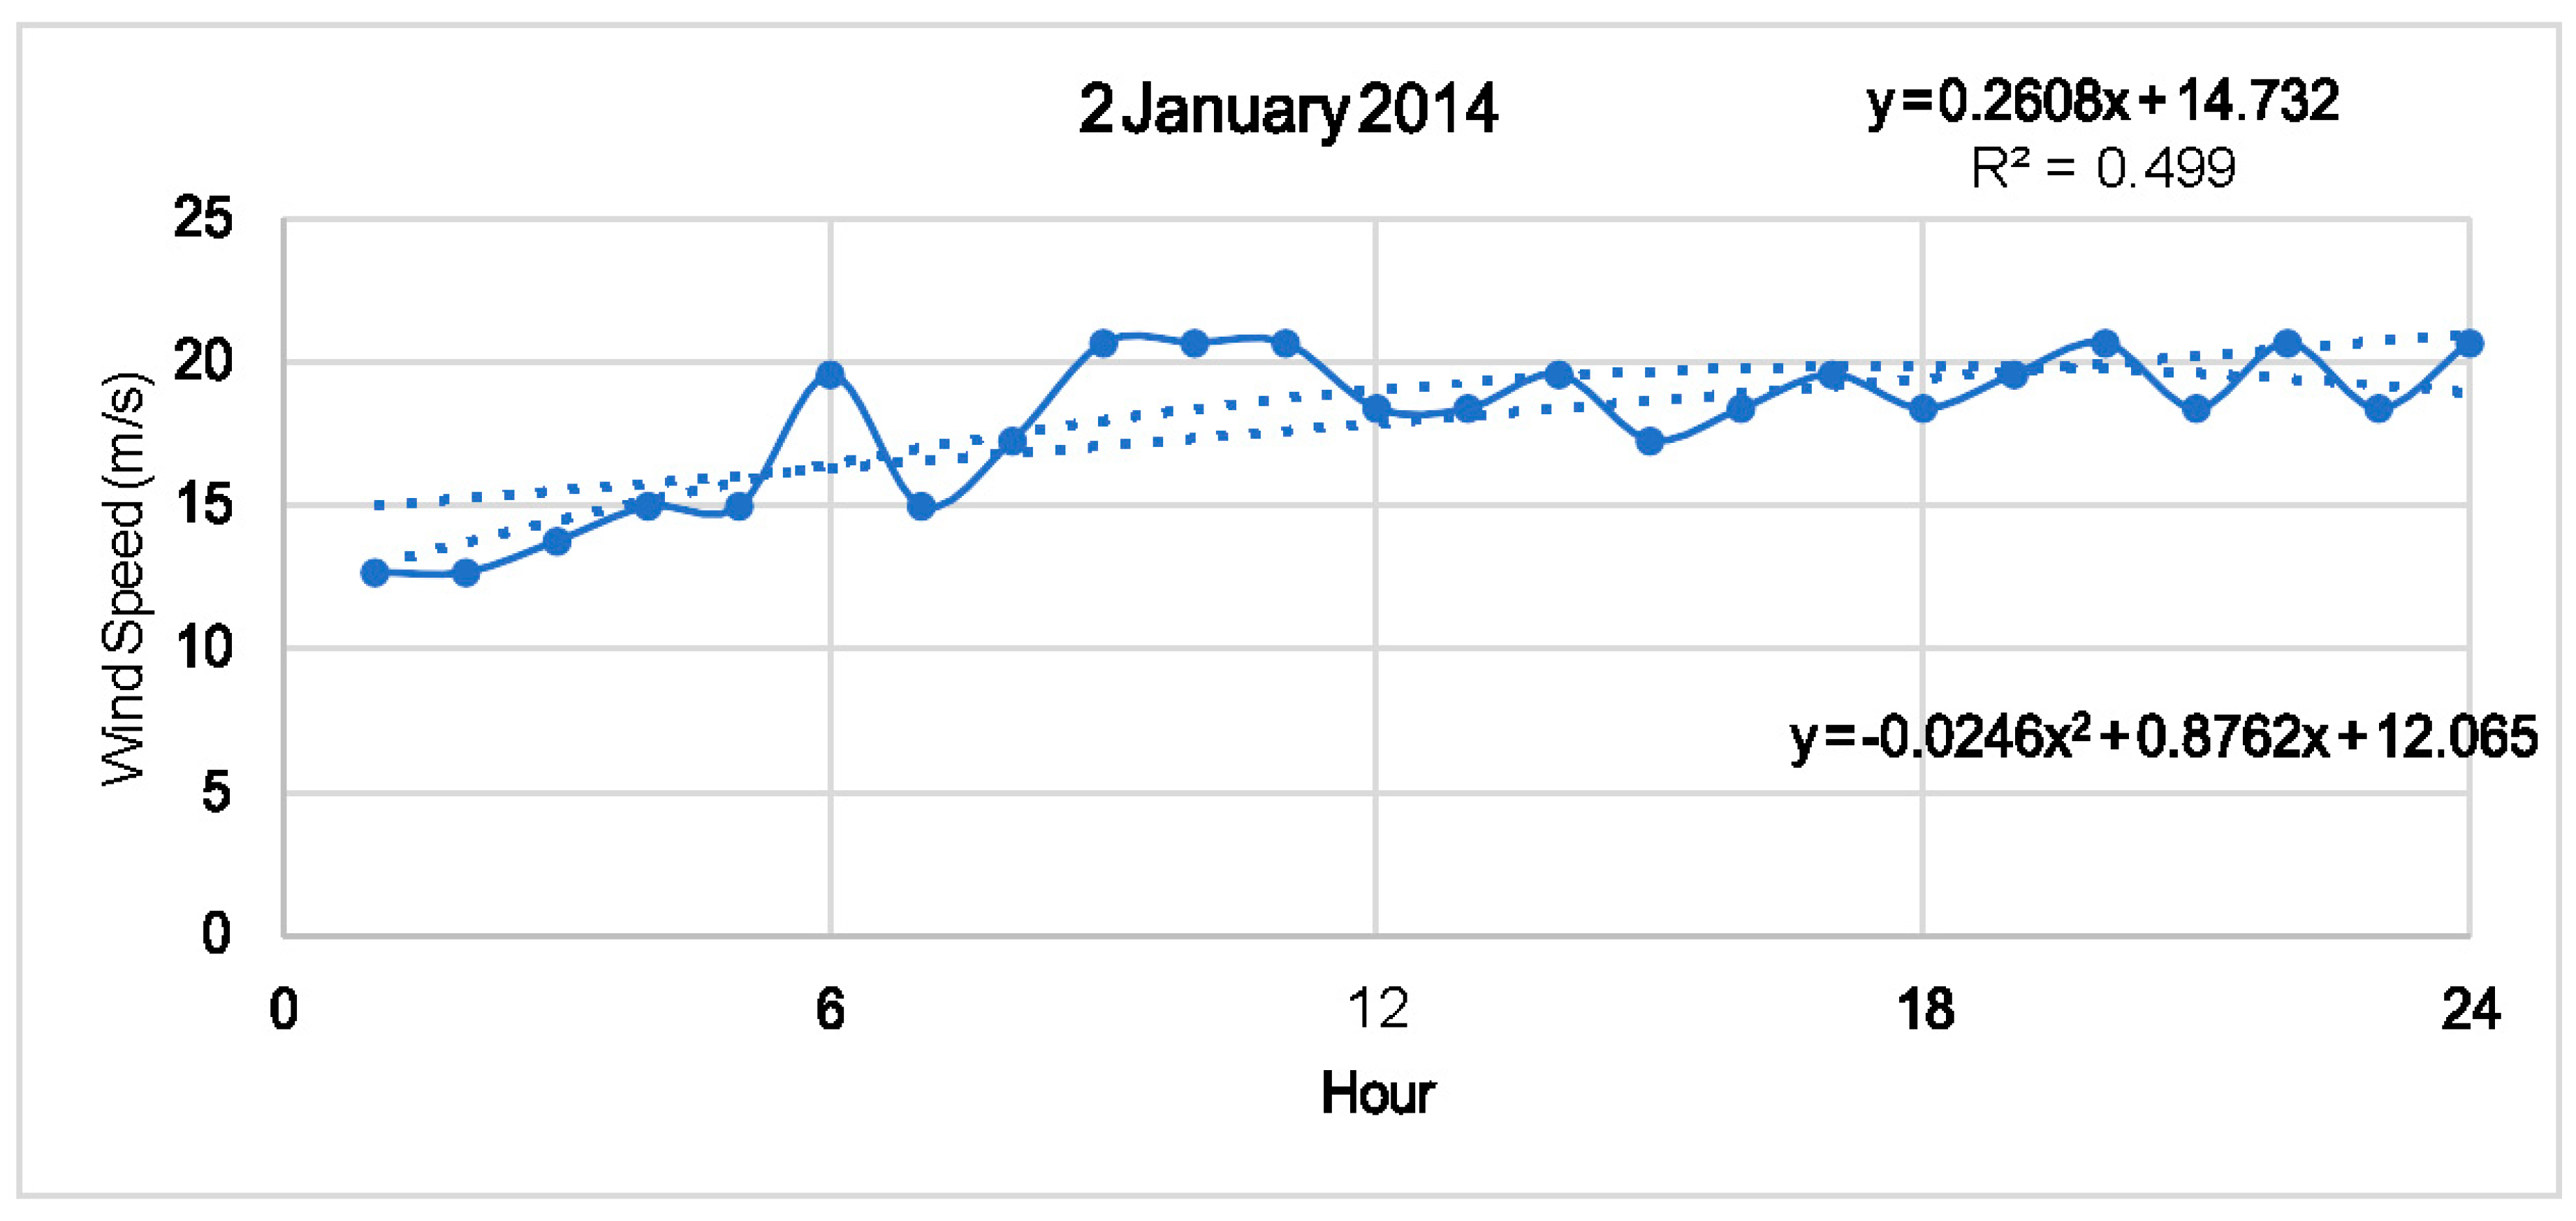
Using the second order of polynomial line, the equation for forecasting is:
y = -0.0246x2 + 0.8762x + 12.065
For the linear fit model, equation is, y = 0.2608x + 14.732.
Figure 8. Hourly wind speed forecasting for January 02, 2014.
Preprints 90071 g008
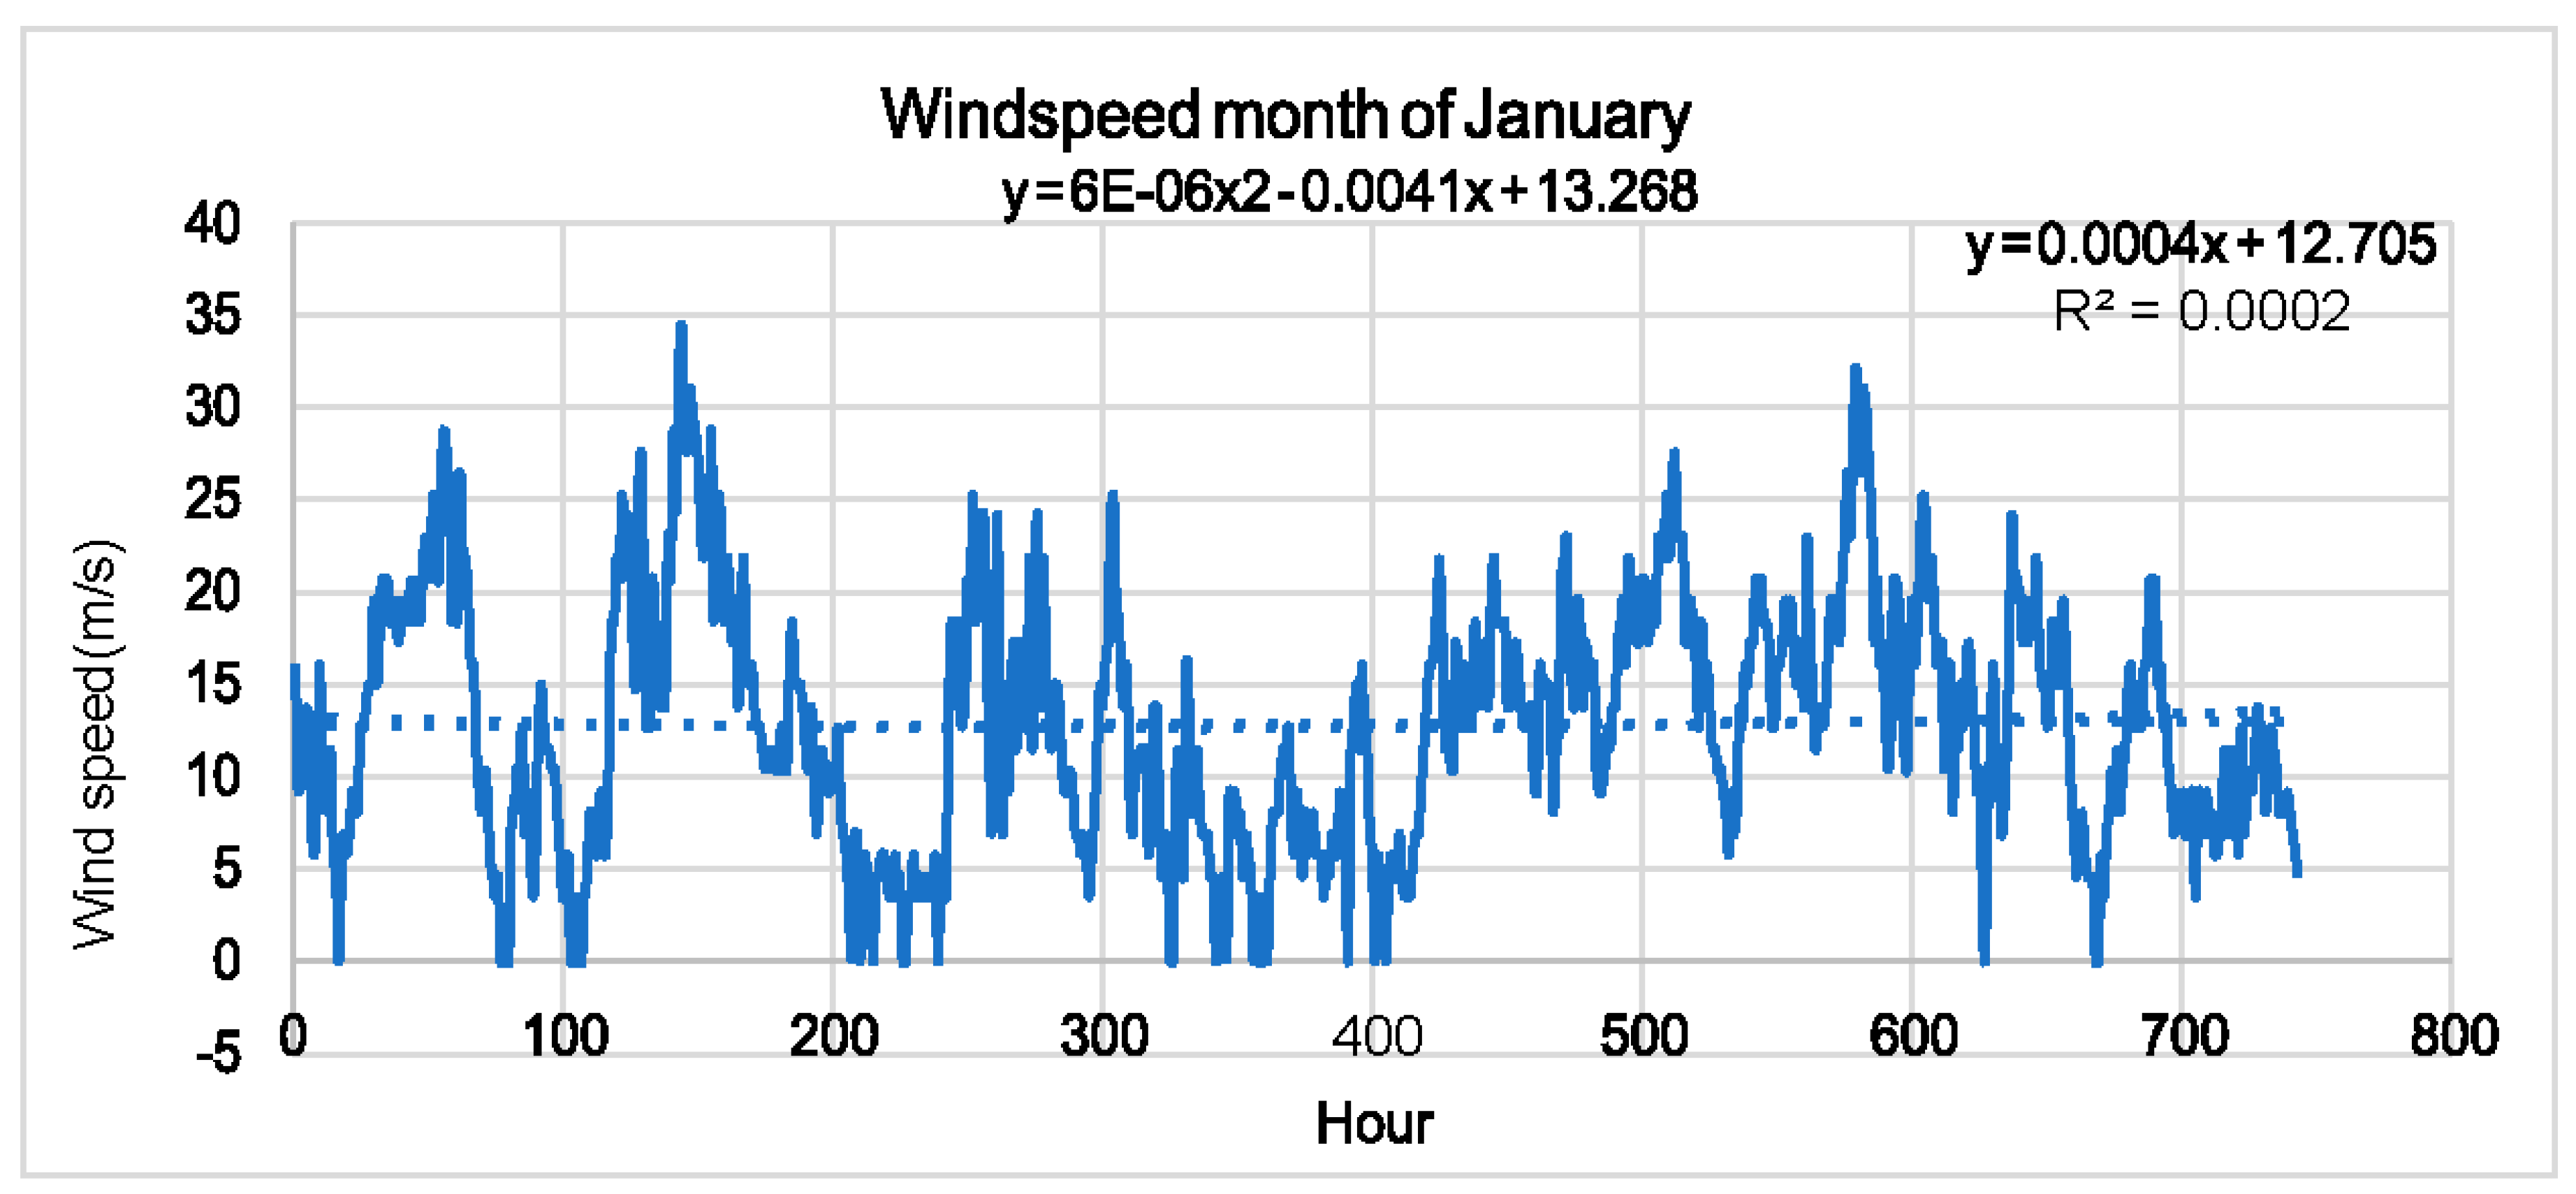
Figure 9. Monthly wind speed forecasting for January 2014.
Preprints 90071 g009
For monthly wind speed estimation, we averaged the daily windspeed for January 2014, using this data then plotted the daily windspeed average vs the day of the month. For a second-order polynomial trend line, the equation obtained is, y = 6E-06x2 - 0.0041x + 13.268
A linear trend line gives the equation: y = 0.0004x + 12.705.
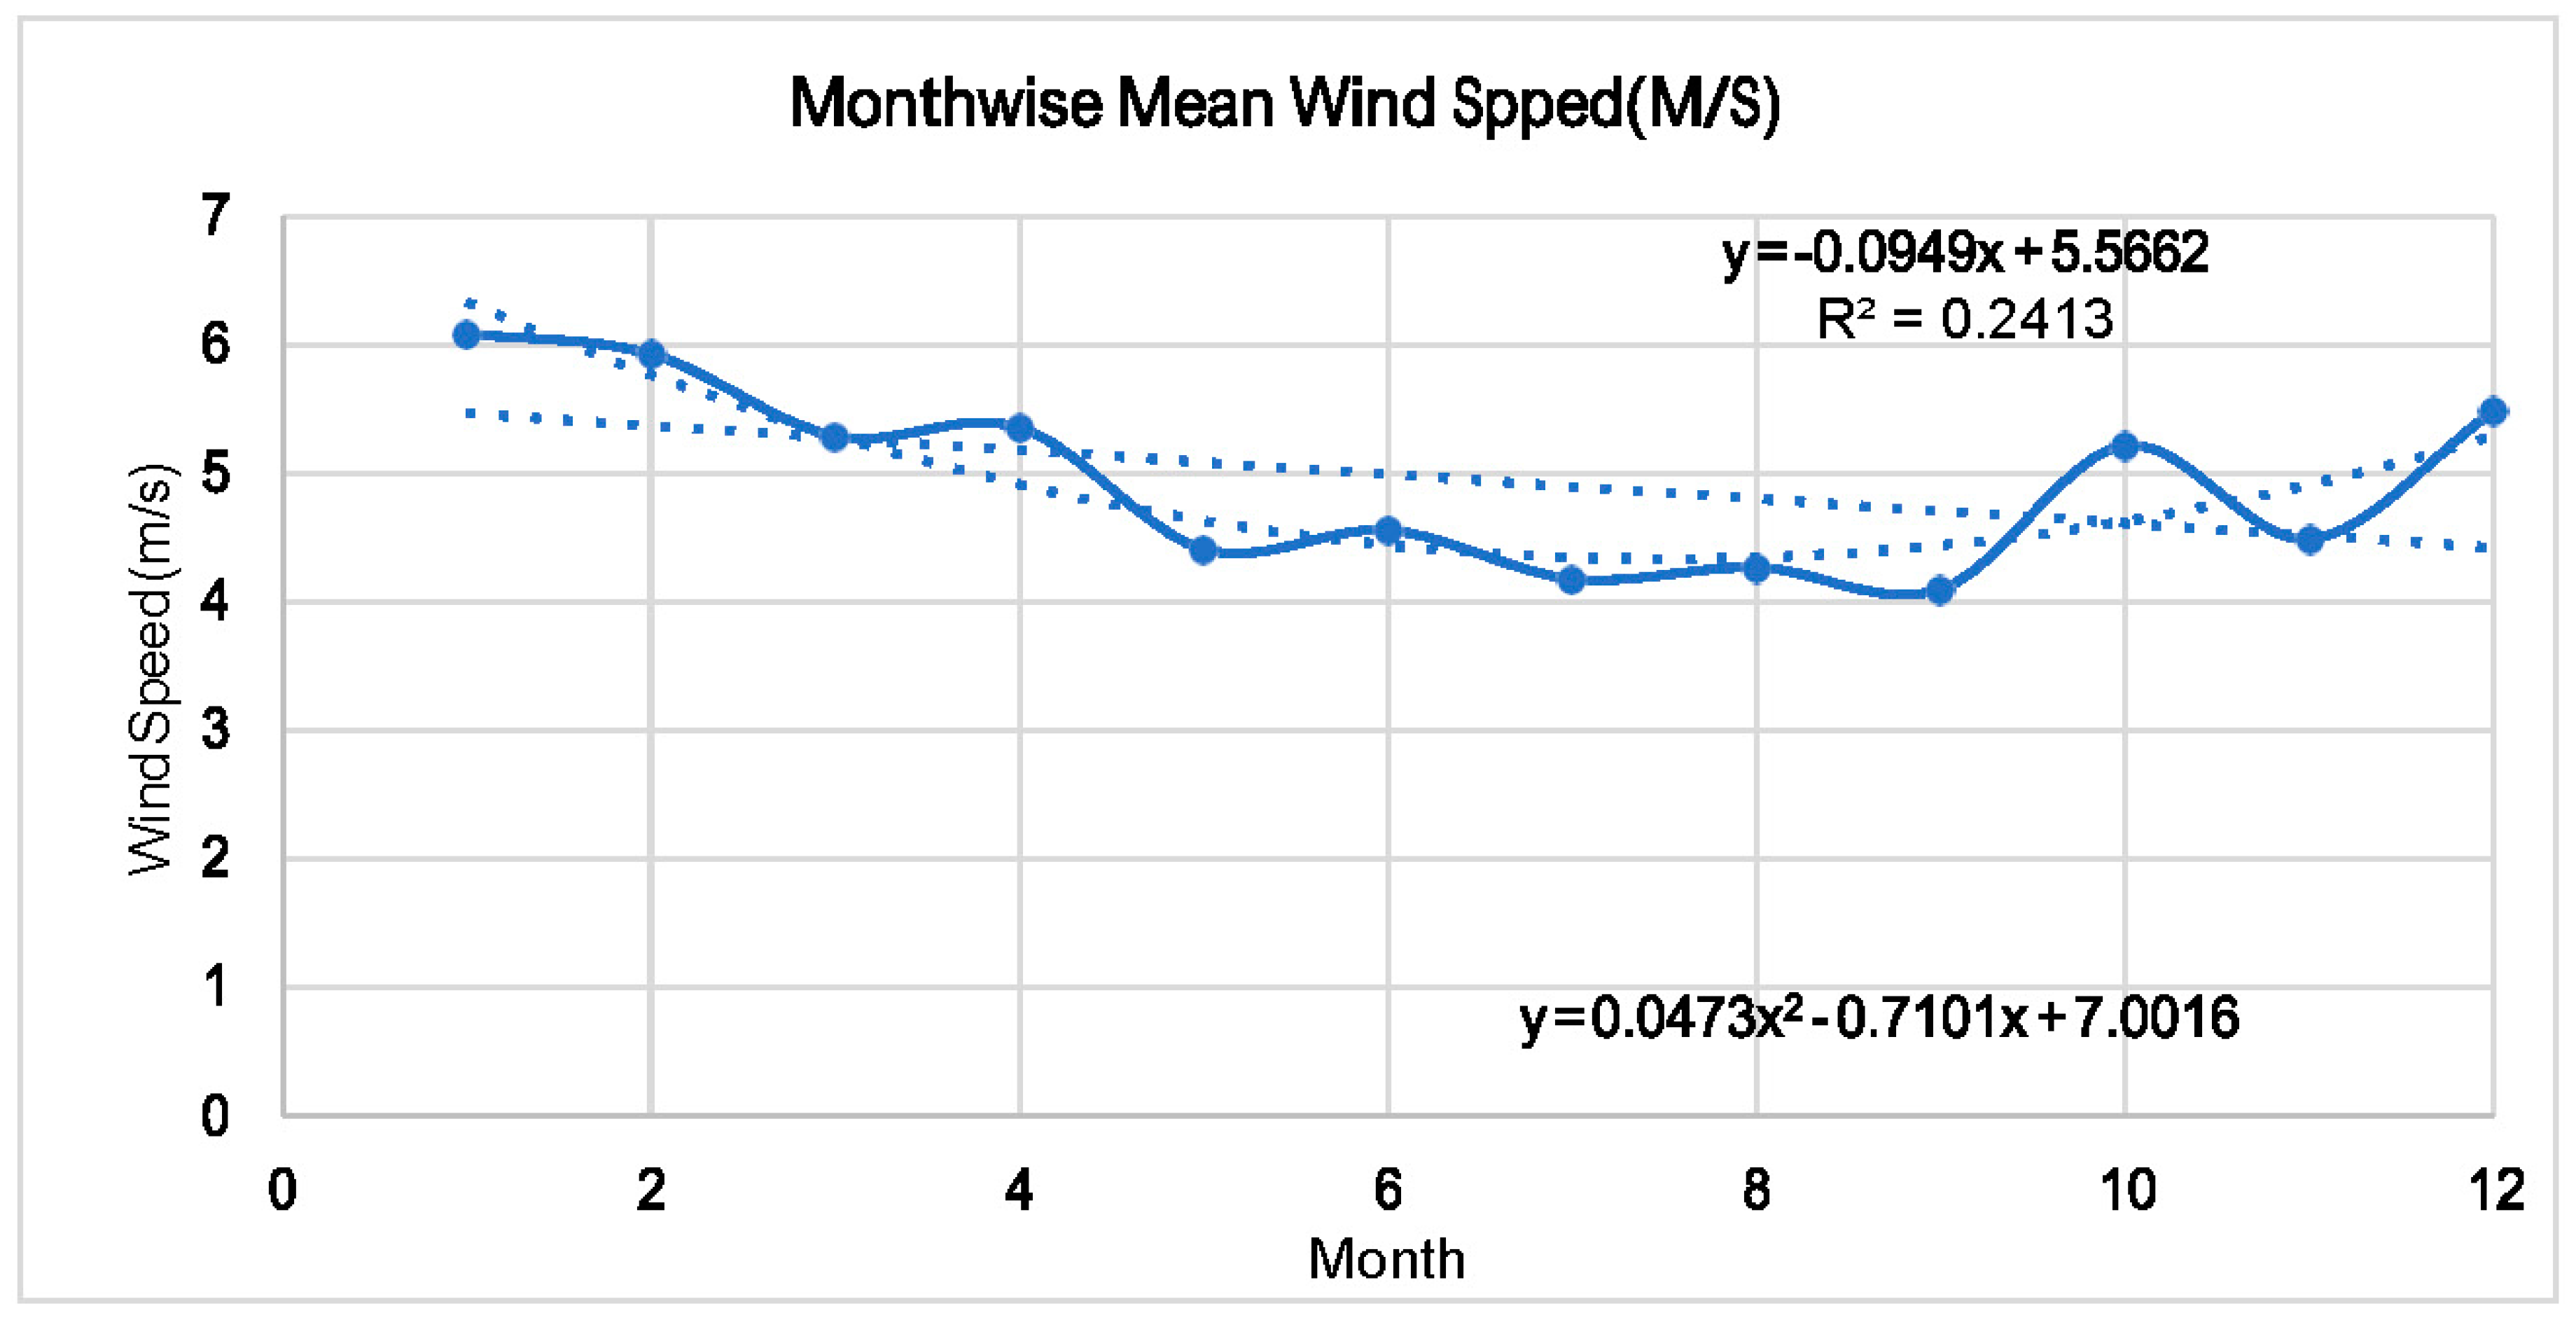
Figure 10. Yearly wind speed forecasting for January 2014.
Preprints 90071 g010
For yearly wind speed, the average wind speed for every month for the year 2014 was calculated and plotted vs the number of the month. The formula for the second-degree polynomial is y = 0.0473x2 - 0.7101x + 7.0016
Using a Linear line of fit we got, y = -0.0949x + 5.5662.

3.7. Question 07

Factors that are significant and/or correlated:
Factor 1. The Size of PV system: The size of the PV is one of the important factors. The energy generation will increase with the PV size.
Factor 2. PV Capacity Cost: The cost is the most important factor that can be calculated by the multiplication of the number of PV panels and the installation cost. The equation is 106x. Here, x
= PV size in MW.
Factor 3. PV Efficiency: The PV efficiency has been selected as maximum as 25%. If we don’t care much about cost, the efficiency can be increased in a limited size.
Factor 4. Weather Condition: In perfect weather conditions, the factory needs 100,000 m2 panels to handle roughly 27 MW assuming each panel generates 270 W/m2. The angle of the sun and weather conditions have a great effect on the fluctuation of power, on average in NYC is 130 W/m2.
In January 2014 average weather condition in New York is 0.412 representing the solar cells generate about 41% of their maximum output during the day in winter. Whereas in summer the value is 0.453 or 45% of maximum generation
Factor 5 and 6. Ambient Temperature and Wind Speed: Ambient temperature and wind speed have also an effect on panel efficiency. Both are helping to cool down the PV systems, making them run more efficiently.
Factor 7. Hour of a Day: The power can be generated in daytime, not at night and the maximum power can be found at noon. Based on the formula, in January (winter) it is 1274.76 W/m2 and in summer it is 1468.6 W/m2.
Factor 8 & 9. Utility Pricing Scheme and Government Incentives: Utility scheme could offer an income possibility if the PV system is generating more power than it is consuming, and Government incentives could drastically lower the upfront price of panel installation.
Factor 10. The batter capacity: battery capacity can reduce the size of the PV system by storing energy when power generation is over the factory power usage and discharging it during bad weather or at night.
In winter, the factory has a peak energy draw of 17.4 MW during hours 13 and 16. So the expected power generation in January 1274.76 W × 25% × 1m2 × 0.412 × 1.0309 (from temperature) = 135.4.
In summer, 1468.6 W × 25% × 1m2 × 0.453 × 0.8621 = 143.4.
In winter, factory draws an average of 14.78 MW with a peak of 17.4 MW. Minimum we need
17.4 × 10⁶/ 135.4 = 128,509 panels at 1 m2 each. In summer, minimum we need 22.6 × 10⁶/143.4
= 157,602 panels at 1 m2 each.
If the panels make an average of 17.4 MW during the daytime (from hour 7 to 17), we can create
17.4 × 10 = 174 MWh per day. The factory needs 14.78 × 24 = 354.8 MWh. So, the system would need an average of 35.48 MW/hour for 10 hours to generate enough energy for daytime power draw peaks and night usage.
If we use a 60 MW system, simulation gives us average excess energy storage of 62.3 MW/day.
If a 510 MW battery is installed, it would take 510/62.3 = 8.2 day to fully charge and can be capable of providing a little over one day of full power outage.

3.8. Question 08

Life cycle cost analysis Preprints 90071 i001
Cost of Electricity by source in US
Power Plant Type Cost (LCOE)
$/kW-hr
Coal with CCS $0.12-0.13
CC Natural Gas $0.04
CC with CCS $0.08
Nuclear $0.09
Wind onshore $0.04
Wind offshore $0.11
Solar PV $0.04
Solar Thermal $0.17
Geothermal $0.04
Biomass $0.09
Hydro $0.03
(Levelized cost of electricity, LCOE) Source: Adapted from US DOE

4. Conclusion

Solar power is an immense source of directly useable energy and ultimately creates other energy resources: biomass, wind, hydropower, and wave energy. Most of the Earth's surface receives sufficient solar energy to permit low-grade heating of water and buildings, although there are large variations with latitude and season. At low latitudes, simple mirror devices can concentrate solar energy sufficiently for cooking and even for driving steam turbines. The energy of light shifts electrons in some semiconducting materials. This photovoltaic effect is capable of large-scale electricity generation. However, the present low efficiency of solar PV cells demands very large areas to supply electricity demands. Direct use of solar energy is the only renewable means capable of ultimately supplanting the current global energy supply from non-renewable sources. It is cheaper compared to all other sources of source. In the coming days production will be less and solar energy will be more feasible comparative to the present days.

References

  1. Lund, P.D., Effects of energy policies on industry expansion in renewable energy. Renewable energy, 2009. 34(1): p. 53-64. [CrossRef]
  2. Worrell, E. and L. Price, Policy scenarios for energy efficiency improvement in industry. Energy policy, 2001. 29(14): p. 1223-1241. [CrossRef]
  3. Naill, R.F., et al., An analysis of the cost effectiveness of US energy policies to mitigate global warming. System Dynamics Review, 1992. 8(2): p. 111-128. [CrossRef]
  4. Lau, L.C., K.T. Lee, and A.R. Mohamed, Global warming mitigation and renewable energy policy development from the Kyoto Protocol to the Copenhagen Accord—A comment. Renewable and Sustainable Energy Reviews, 2012. 16(7): p. 5280-5284. [CrossRef]
  5. Kannan, N. and D. Vakeesan, Solar energy for future world:-A review. Renewable and sustainable energy reviews, 2016. 62: p. 1092-1105. [CrossRef]
  6. Kumar, C.M.S., et al., Solar energy: A promising renewable source for meeting energy demand in Indian agriculture applications. Sustainable Energy Technologies and Assessments, 2023. 55: p. 102905. [CrossRef]
  7. Şen, Z., Solar energy in progress and future research trends. Progress in energy and combustion science, 2004. 30(4): p. 367-416. [CrossRef]
  8. Devabhaktuni, V., et al., Solar energy: Trends and enabling technologies. Renewable and Sustainable Energy Reviews, 2013. 19: p. 555-564. [CrossRef]
  9. Chu, Y. and P. Meisen, Review and comparison of different solar energy technologies. Global Energy Network Institute (GENI), San Diego, CA, 2011. 1: p. 1-52.
  10. Rhodes, C.J., Solar energy: principles and possibilities. Science progress, 2010. 93(1): p. 37-112. [CrossRef]
  11. Hayati, M., et al., A Comparative Analysis of Solar Energy Strategies in Middle East with Rich Fossil Resources. Iranian (Iranica) Journal of Energy & Environment, 2023. 14(3): p. 271-288. [CrossRef]
  12. Mekhilef, S., R. Saidur, and A. Safari, A review on solar energy use in industries. Renewable and sustainable energy reviews, 2011. 15(4): p. 1777-1790. [CrossRef]
  13. Hossain, M.F., Solar energy integration into advanced building design for meeting energy demand and environment problem. International Journal of Energy Research, 2016. 40(9): p. 1293-1300. [CrossRef]
  14. Chowdhury, H. and M.T. Islam. Multiple Charger with Adjustable Voltage Using Solar Panel. in International Conference on Mechanical Engineering and Renewable Energy 2015 (ICMERE2015). 2015. Chittagong University of Engineering and Technology.
  15. Lewis, N.S. and D.G. Nocera, Powering the planet: Chemical challenges in solar energy utilization. Proceedings of the National Academy of Sciences, 2006. 103(43): p. 15729-15735. [CrossRef]
  16. Bilgen, S., Structure and environmental impact of global energy consumption. Renewable and Sustainable Energy Reviews, 2014. 38: p. 890-902. [CrossRef]
  17. De Cian, E. and I. Sue Wing, Global energy consumption in a warming climate. Environmental and resource economics, 2019. 72: p. 365-410. [CrossRef]
  18. Rode, A., et al., Estimating a social cost of carbon for global energy consumption. Nature, 2021. 598(7880): p. 308-314. [CrossRef]
  19. Holmberg, K. and A. Erdemir, Influence of tribology on global energy consumption, costs and emissions. Friction, 2017. 5: p. 263-284. [CrossRef]
  20. Kabir, E., et al., Solar energy: Potential and future prospects. Renewable and Sustainable Energy Reviews, 2018. 82: p. 894-900. [CrossRef]
  21. Ahmed, F.E., R. Hashaikeh, and N. Hilal, Solar powered desalination–Technology, energy and future outlook. Desalination, 2019. 453: p. 54-76. [CrossRef]
  22. Creutzig, F., et al., The underestimated potential of solar energy to mitigate climate change. Nature Energy, 2017. 2(9): p. 1-9. [CrossRef]
  23. Halabi, M.A., A. Al-Qattan, and A. Al-Otaibi, Application of solar energy in the oil industry—Current status and future prospects. Renewable and Sustainable Energy Reviews, 2015. 43: p. 296-314. [CrossRef]
  24. Hayat, M.B., et al., Solar energy—A look into power generation, challenges, and a solar-powered future. International Journal of Energy Research, 2019. 43(3): p. 1049-1067. [CrossRef]
  25. Sweeney, C., et al., The future of forecasting for renewable energy. Wiley Interdisciplinary Reviews: Energy and Environment, 2020. 9(2): p. e365. [CrossRef]
  26. Chowdhury, M.S., et al., An overview of solar photovoltaic panels’ end-of-life material recycling. Energy Strategy Reviews, 2020. 27: p. 100431. [CrossRef]
  27. Deshmukh, M.K.G., et al., Renewable energy in the 21st century: A review. Materials Today: Proceedings, 2023. 80: p. 1756-1759. [CrossRef]
  28. Jahanger, A., et al., Do technology and renewable energy contribute to energy efficiency and carbon neutrality? Evidence from top ten manufacturing countries. Sustainable Energy Technologies and Assessments, 2023. 56: p. 103084. [CrossRef]
  29. Gerarden, T.D., Demanding innovation: The impact of consumer subsidies on solar panel production costs. Management Science, 2023. [CrossRef]
  30. Liang, H. and F. You, Reshoring silicon photovoltaics manufacturing contributes to decarbonization and climate change mitigation. Nature Communications, 2023. 14(1): p. 1274. [CrossRef]
  31. Draghici, A. and L. Ivascu, Green Manufacturing in the Context of Circular Economy. Sustainability and Innovation in Manufacturing Enterprises: Indicators, Models and Assessment for Industry 5.0, 2022: p. 1-15. [CrossRef]
  32. Ciliberto, C., et al., Enabling the Circular Economy transition: A sustainable lean manufacturing recipe for Industry 4.0. Business Strategy and the Environment, 2021. 30(7): p. 3255-3272. [CrossRef]
  33. Kazakova, E. and J. Lee, Sustainable Manufacturing for a Circular Economy. Sustainability, 2022. 14(24): p. 17010. [CrossRef]
  34. Chowdhury, H. and B. Asiabanpour, A Smart Circular Economy for Integrated Organic Hydroponic-Aquaponic Farming. 2023, Texas State University, San Marcos, Texas.
  35. Chowdhury, H., Circular Economy Integration in Additive Manufacturing, in Preprints. 2023, Preprints.
  36. Viles, E., et al., Theorizing the Principles of Sustainable Production in the context of Circular Economy and Industry 4.0. Sustainable Production and Consumption, 2022. 33: p. 1043-1058. [CrossRef]
  37. Blunck, E. and H. Werthmann. Industry 4.0–an opportunity to realize sustainable manufacturing and its potential for a circular economy. in DIEM: Dubrovnik International Economic Meeting. 2017. Sveučilište u Dubrovniku.
  38. Colorado, H.A., E.I.G. Velásquez, and S.N. Monteiro, Sustainability of additive manufacturing: the circular economy of materials and environmental perspectives. Journal of Materials Research and Technology, 2020. 9(4): p. 8221-8234. [CrossRef]
  39. Omer, L., et al. Induction Initiated Curing of Additively Manufactured Thermoset Composites. in Solid Freeform Fabrication 2022: Proceedings of the 33rd Annual International Solid Freeform Fabrication Symposium – An Additive Manufacturing Conference. 2022.
  40. Sanchez, F.A.C., et al., Plastic recycling in additive manufacturing: A systematic literature review and opportunities for the circular economy. Journal of Cleaner Production, 2020. 264: p. 121602. [CrossRef]
  41. Sauerwein, M., et al., Exploring the potential of additive manufacturing for product design in a circular economy. Journal of Cleaner Production, 2019. 226: p. 1138-1149. [CrossRef]
  42. Chowdhury, H., Human-Robot Collaboration in Manufacturing Assembly Tasks, in Preprints. 2023, Preprints.
  43. Matheson, E., et al., Human–robot collaboration in manufacturing applications: A review. Robotics, 2019. 8(4): p. 100. [CrossRef]
  44. Hjorth, S. and D. Chrysostomou, Human–robot collaboration in industrial environments: A literature review on non-destructive disassembly. Robotics and Computer-Integrated Manufacturing, 2022. 73: p. 102208. [CrossRef]
  45. Taboada, H., et al. Exploring a solar photovoltaic-based energy solution for green manufacturing industry. in 2012 IEEE International Conference on Automation Science and Engineering (CASE). 2012. IEEE.
  46. Brock, A., B.K. Sovacool, and A. Hook, Volatile photovoltaics: green industrialization, sacrifice zones, and the political ecology of solar energy in Germany. Annals of the American Association of Geographers, 2021. 111(6): p. 1756-1778. [CrossRef]
  47. Chiou, R., et al. Developing VR-Based Solar Cell Lab Module in Green Manufacturing Education. in 2021 ASEE Virtual Annual Conference Content Access. 2021.
  48. Khan, S.A.R., et al., Technological revolution and circular economy practices: a mechanism of green economy. Sustainability, 2022. 14(8): p. 4524. [CrossRef]
  49. Yassin, A.M.M., M.A. Hassan, and H.M. Elmesmary, Key elements of green supply chain management drivers and barriers empirical study of solar energy companies in South Egypt. International Journal of Energy Sector Management, 2022. 16(3): p. 564-584. [CrossRef]
Table 1. World total final consumption.
1971 2002 2010 2030 2002–2030
(%)
Coal 617 502 516 526 0.2
Oil 1893 3041 3610 5005 1.8
Gas 604 1150 1336 1758 1.5
Electricity 377 1139 1436 2263 2.5
Heat 68 237 254 294 0.8
Biomass and
waste
641 999 1101 1290 0.9
Other
renewable
0 8 13 41 6.2
Total 4200 7075 8267 11, 176 1.6
Table 2. Development and installation of solar photovoltaic electricity in various countries.
Year USA (MW) Europe (MW) Japan (MW) Worldwide
(MW)
2000 140 150 250 1000
2010 3000 3000 5000 14,000
2020 15,000 15,00 30,000 70,000
2030 25,000 30,000 72,000 140,000
Table 3. World carbon dioxide emissions by region, 1990–2025.
Region 1990 2002 2010 2015 2020 2025
Mature
market economics
10,465 11,877 13,080 13,745 14,392 15,183
North America 5769 6701 7674 8204 8759 9379
Western Europe 3413 3549 3674 3761 3812 3952
Mature market
Asia
1284 1627 1731 1780 1822 1852
Transitiona
l economics
4894 3124 3643 3937 4151 4386
Emerging
economics
6101 9408 13,478 15,602 17,480 19,222
Asia 3890 6205 9306 10,863 12,263 13,540
Middle east 845 1361 1761 1975 2163 2352
Africa 655 854 1122 1283 1415 1524
Central and
south America
711 988 1289 1280 1639 1806
Total world 21,460 24,209 30,201 33,284 36,023 38,790
Disclaimer/Publisher’s Note: The statements, opinions and data contained in all publications are solely those of the individual author(s) and contributor(s) and not of MDPI and/or the editor(s). MDPI and/or the editor(s) disclaim responsibility for any injury to people or property resulting from any ideas, methods, instructions or products referred to in the content.
Copyright: This open access article is published under a Creative Commons CC BY 4.0 license, which permit the free download, distribution, and reuse, provided that the author and preprint are cited in any reuse.
Prerpints.org logo

Preprints.org is a free preprint server supported by MDPI in Basel, Switzerland.

Subscribe

© 2024 MDPI (Basel, Switzerland) unless otherwise stated