Preprint
Article

Epigenetic Signatures of In Vitro and In Vivo Experimental Models Employed in Non-small Cell Lung Cancer and the Unique miR-148b-3p/PVT1/ZBTB7A Regulatory Network Discriminating Large Cell Lung Carcinoma

Altmetrics

Downloads

142

Views

69

Comments

0

Submitted:

27 October 2023

Posted:

30 October 2023

You are already at the latest version

Alerts
Abstract
Abstract: Epigenetic approaches in direct correlation with assessment of critical genetic mutations in non-small cell lung cancer (NSCLC) are currently very intensive, as the epigenetic components in NSCLC development and progression have attained high recognition. In this level of research, established human NSCLC cell lines as well as experimental animals are widely used to detect novel biomarkers and pharmacological targets to treat NSCLC. The epigenetic background of NSCLC is highly complex and requires precise definition as these phenomena are variable between NSCLC subtypes and systems origin. We engaged an in-depth characterization of non-coding (nc)RNAs prevalent in human KRAS-mutant NSCLC cell lines A549 and H460 and mouse KRAS-mutant NSCLC tissue by Next Generation Sequencing (NGS) and quantitative Real Time PCRs (qPCRs). Also, the effect of transcription factor (TF) LRF, a known epigenetic silencer, was examined on the epigenome modulation. Finally, interacting networks underlying epigenetic variations in NSCLC subtypes were created. Data derived from our study highlights the divergent epigenetic profiles of NSCLC of human and mouse origin, as well as the significant contribution of 12qf1: 109,709,060-109,747,960 mouse chromosomal region to micro-RNA upregulated species. Fur-thermore, the novel epigenetic miR-148b-3p/PVT1/ZBTB7A axis was identified, which differentiates lung adenocarcinoma from large cell lung carcinoma, two characteristic NSCLC subtypes. The detailed recording of epigenetic events in NSCLC and combinational studies including networking between ncRNAs and TFs validate the identification of significant epigenetic features, prevailing in NSCLC subtypes and among experimental models. Our results enrich knowledge in the field and empower research on the epigenetic prognostic biomarkers of the disease and patient-tailored treatments.
Keywords: 
Subject: Biology and Life Sciences  -   Life Sciences

1. Introduction

Non-small cell lung cancer (NSCLC) is a leading cause for high morbidity and mortality rates worldwide. NSCLC can be further divided into three major histological subtypes: lung adenocarcinoma (LUAD), large cell carcinoma, and squamous cell carcinoma with distinct phenotypes (1). On the genetic level, coexistence of activating mutations of the Kirsten rat sarcoma viral oncogene homologue (KRAS) is a common NSCLC hallmark (2). The molecular signatures of candidate genes, epigenetically regulated by differential DNA methylation profiles have also been implicated in NSCLC as complements to already known driver mutations. Among reported epigenetically modified DNA gene loci, genes encoding non-coding RNAs (ncRNAs) are also included and represent features of high importance for the NSCLC progression and response to drugs [3], as available therapies are challenging and upon administration offer extended life just by a few months. Platinum-containing drugs such as cisplatin and carboplatin are typically used as the first-line chemotherapeutic agents for the treatment of NSCLC, sometimes in combination with surgical excision and chest radiotherapy [4]. Nevertheless, advanced stages of the disease often evolve resistance to chemotherapeutics and within this frame strong research efforts and innovative approaches are necessary to improve patients’ quality of life and survival, since the efficacies of current therapies are limited. So far, extensive research associated with the NSCLC therapeutics has employed human samples, established human malignant cell lines and mainly mice as experimental system models. However, investigation in living cells (cell lines and mouse models) that display unique genetic/epigenetic characteristics should be cautiously interpreted for the specificity of imprinted results and efficacy of recommended treatments for humans.
Apart from driver mutations characterized as a leading cause of NSCLC, subtle combinations of epigenetic events with hereditary potential are also associated with NSCLC progression and chemotherapeutic resistance development. Aberrant epigenetic signatures have a realistic prospect and can serve as a pragmatic approach towards the identification of functional epigenetic events and potential circuits guiding cancer development and progression. Epigenetic marks include histone code and DNA modifications simultaneously with non-coding RNA (ncRNA) tissue-specific production, accounting for the active epigenome of human tissues and playing fundamental roles in cancer [5]. These biochemical events, contrary to the established genetic mutations, sometimes represent only a snapshot of cellular life during the cell cycle and can be reversible, justifying their importance as promising therapeutic targets.
Epigenetically altered chromatin supports positively or negatively ncRNAs’ transcription depending on the conditions prevailing across genetic loci coding for the various ncRNA species. Aberrant micro-RNA (miRNA) expression has been extensively studied and miRNAs are proposed as lung cancer subtype classifiers [6], prognostic and drug-response biomarkers [7,8] and as targets for novel miRNA-based treatment approaches [9]. Clinical implementation strategies and potential of lncRNAs in NSCLC have also been extensively reported [10]. MiRNA clusters and lncRNAs are considered mainly as products of RNA polymerase II and therefore, the transcription of these primary transcripts is regulated by general TFs and signal transduction pathways. Deregulation of TFs’ expression and consequent tissue-imbalanced lncRNA expression is often sufficient for the development of several human disorders and for malignant cell transformation [11]. In addition to sharing certain characteristics with “ordinary” genes, such as splicing, polyadenylation etc., many genetic loci transcribing miRNAs and lncRNAs include CpG islands with conditional regulatory role on their expression. Also, genetic loci of lncRNAs encompass miRNA genes with contingent coregulation of both species by the same elements. A well-known epigenetically motivated TF, the lymphoma/Leukemia related factor (LRF) belongs to an evolutionarily conserved family of TFs with zinc finger domains, which have been assigned with regulatory properties concerning gene expression and binding preference at CG-rich and CpG island containing promoters. LRF derives from ZBTB7A gene and recently we investigated its capability of regulating lncRNAs [12] on the transcriptional level during erythropoiesis while, it has been also involved in various cancer types development [13]. Herein, all above mentioned epigenetic components constitute a network underlying critical alterations that deceitfully function in NSCLC.
Lung cancer research in living cells relies largely on experimental models consisting of human and mouse established malignant cell lines with specific characteristics and animal experimental models, mainly mice. In this study, we have analyzed and compared epigenetic features exhibited by different NSCLC experimental models, to determine and characterize significant epigenetic signatures. We have comprehensively studied miRNA profiles in two KRAS-mutant NSCLC human cell lines (A549 and H460) and in Kras-mutant NSCLC mouse lung malignant and adjacent normal tissue. Additionally, we have assessed methylation and expression profiles of human lncRNAs with known altered patterns in NSCLC. Our results strongly point out different mechanisms of carcinogenesis evolution between mouse NSCLC tissue and human NSCLC cell lines (A549 and H460), simultaneously with considerable epigenetic diversity among the human cell lines, reflecting distinct malignant histological subtype-dependent behaviors. Also, our results support the existence of a miRNA/lncRNA/ZBTB7A epigenetic network in human large-cell lung carcinoma H460 cell line, leading to the suppression of LRF/ZBTB7A expression. The present study provides comprehensive and elaborate information on the epigenetic features prevailing in each tested experimental model defined as NSCLC. This kind of information is considered critical during selection of appropriate biological models for studies and drug discovery and offers new knowledge in the field of biomarkers investigation.

2. Materials and Methods

2.1. Cell culture

The A549 (KRASG12S) and H460 (KRASQ61H) NSCLC cell lines of human origin as well as HEK293 (human embryonic kidney cells) were cultured in a humidified atmosphere with 5% CO2 at 37°C in Dulbecco's Modified Eagle Medium (DMEM, Sigma). The medium was supplemented with 10% fetal bovine serum (FBS, Gibco—Thermo Fisher Scientific Inc., Grand Island, NE, USA), 100 units/mL penicillin, and 100 μg/mL streptomycin (Sigma -Aldrich Pty Ltd, An affiliate of Merck KGaA, Darmstadt, Germany). The cells were passaged every two days. A549 and H460 cell lines have the KRAS mutations c.34G>A (ClinVar=VCV000012584) and c.183A>T (ClinVar=VCV000045117) respectively, of the most prevalent mutations verified in NSCLC [14].
Human bronchial epithelial cell line BEAS-2B was cultured in Bronchial Epithelial Cell Growth Medium (BEGM) consisting of Bronchial Epithelial Cell Basal Medium (BEBM, Lonza Group AG, Basel, Switzerland Catalog No.: CC-3171), supplemented with 0.4% Bovine Pituitary Extract (BPE), 0.1% Insulin, 0.1% Hydrocortisone, 0.1% GA-1000, 0.1% Retinoic Acid, 0.1% Transferrin, 0.1% Triiodothyronine, 0.1% Epinephrine, 0.1% human Epidermal Growth Factor (hEGF) (BEGM SingleQuots kit, Lonza Group AG, Basel, Switzerland, Catalog No.: CC-4175) and 100 units/mL penicillin and 100 ug/mL streptomycin (Sigma -Aldrich Pty Ltd, An affiliate of Merck KGaA, Darmstadt, Germany). Gentamicin/Amphotericin-B, present as GA-1000 in the BEGM SingleQuots kit, was added 3 days after culture starting date, to minimize excessive cell stress originating from cryopreservation. The cells were passaged every 2 days. Upon confluency, genomic DNA and total RNA were extracted for downstream analysis.

2.2. Mouse models of NSCLC

In our experimental design 6-week-old FVB/NJ (FVB; #001800) mice from Jackson Laboratories (Bar Harbor, MN) were introduced. Mice were bred at the Center for Animal Models of Disease of the University of Patras, maintained on a regular light-dark cycle (lights on from 8:00 a.m. to 8:00 p.m.) at an ambient temperature of 22 ± 1°C and allowed free access to standard rodent chow diet and water.
All mice received 1 g/Kg BW urethane via one intraperitoneal injection and were euthanized 6 months after urethane administration. Urethane is a chemical carcinogen contained in tobacco smoke and this regime is successful in triggering NSCLC (notably LUAD with KRASQ61R mutations) in mice, as previously described [15,16]. After euthanasia, tissues of interest (liver, spleen and lung, including both lung tumors and matching adjacent normal tissue) were collected, washed in cold PBS, snap frozen in liquid nitrogen and stored for subsequent analysis. For histological confirmation of malignancy, lung samples, both malignant and normal were inflated and fixed with 10% formalin overnight and were initially inspected macroscopically under a Stemi DV4 stereoscope equipped with an AxiocamERc 5s camera (Zeiss, Jena, Germany) in trans-illumination mode. Lung samples were then embedded in paraffin, and five-mm-thick paraffin sections were counterstained with hematoxylin and eosin (Sigma, St. Louis, MO) and mounted with Entellan New (Merck Millipore, Darmstadt, Germany). Bright-field images were captured with an AxioLab.A1 microscope connected to an AxioCamERc 5s camera (Zeiss, Jena, Germany).
All animal experiments were approved a priori by the Veterinary Administration of the Prefecture of Western Greece (approval numbers 3741/16.11.2010, 60291/3035/19.03.2012, and 118018/578/30.04.2014) and conducted according to Directive 2010/63/EU (http://eur-lex.europa.eu/legal-content/EN/TXT/?qid=1486710385917&uri=CELEX:32010L0063).

2.3. Selection of human lncRNAs implicated in lung cancer

Human lncRNAs selected for the present study have been previously related to lung cancerous state in humans. The study was limited to human tissues because there is no evolutionary conservation between human and mice lncRNAs. Among selected lncRNAs, HOXA Antisense RNA (HOTAIRM1), Maternally Expressed 3 (MEG3), Differentiation Antagonizing Non-Protein Coding RNA (DANCR), Plasmacytoma Variant Translocation 1 (PVT1), Metastasis Associated Lung Adenocarcinoma Transcript 1 (MALAT1) and Imprinted Maternally Expressed Transcript H19 [17,18,19,20,21,22] are annotated by several databases (ENA, LncBook, Ensembl, LNCipedia, Ensembl/GENCODE, GeneCards). Sequences and chromosomal locations of CpG islands, mainly at transcriptional start site (TSS) of lnc-RNA sequences, were tracked from UCSC Genome browser (https://genome-euro.ucsc.edu/cgi-bin/hgGateway) (Table 1).

2.4. CpG methylation analysis of human origin lncRNAs assessed by Pyrosequencing

Pyrosequencing methylation assay was utilized to assess DNA methylation status across CpG islands located at 5’ prime ends of lncRNAs’ genetic loci. Genomic DNA was extracted from human A549, H460 and BEAS-2B cell lines with phenol:chloroform:isoamyl alcohol in a 25:24:1 ratio following standard protocol (Sigma-Aldrich Pty Ltd, An affiliate of Merck KGaA, Darmstadt, Germany) [23]. 1.5μg of isolated genomic DNA was bisulfite converted, PCR amplified and sequenced with PyroMark® technology (QIAGEN GmbH, Hilden, Germany), according to manufacturer’s instructions and as previously described [24]. Briefly, the biotinylated strand of the PCR products was immobilized by streptavidin-coated sepharose beads (Streptavidin Sepharose™ High Performance, GE HealthCare), and subsequently annealed with a Pyrosequencing primer. Pyrosequencing process was performed using the PyroMark® Gold Q24 Reagents (QIAGEN GmbH, Hilden, Germany) and PyroMark Q24 instrument. Primer sets are listed in Supplementary Table S1 and every reaction was performed in duplicate.

2.5. Expression profiles of human origin lncRNAs assessed by qPCRs

Total RNA was extracted from A549, H460, HEK293 and BEAS2B cultivated cells using the miRNeasy Mini kit (74104), Qiagen GmbH, Hilden, Germany) according to the manufacturer’s instructions. 1μg of total RNA was converted to cDNA by miScript II RT kit (218161, Qiagen GmbH, Hilden, Germany). LRF/ZBTB7A and lncRNAs expression levels were assessed by qPCRs with sequence specific primer sets (Supplementary Table S1), designed to support detection of the main transcripts of each lncRNA genetic loci. Reactions performed in Rotor-Gene Q instrument (QIAGEN GmbH, Hilden, Germany) using the PowerTrack SYBRGreen Master Mix (A46012, Thermo Fisher Scientific, Waltham, MA, USA). Each reaction was performed in triplicate. The 2−ΔΔCT method or Pfaffl equation with PCR efficiency correction was used for data analysis [25,26]. Fold changes in gene expression were normalized to the GAPDH reference gene and calculated relatively to either BEAS-2B or HEK293 cell line calibrator sample. Undetectable expression levels were assigned to lncRNAs with Cq values above acceptable limits (above 32-33 PCR cycles). SPSS software version 20.0 was used for data analysis. One way-Anova with Tukey’s multiple comparisons post hoc tests or t-test were applied to compare expression levels between the different groups. P-values < 0.05 were considered statistically significant.

2.6. Human and mouse miRNA NSCLC profiles determined by Next Generation sequencing (NGS)

Total RNA including microRNA species was purified from A549, H460 and BEAS-2B human cultivated cells, as well as from three NSCLC lung tumors (LUAD) and matching adjacent normal tissues from FVB mice treated with urethane. Libraries were constructed from RNA samples using the QIAseq miRNA library kit (QIAGEN GmbH, Hilden, Germany). As an initial step, adapters were ligated to the 3’ and 5’ ends of miRNAs and subsequently, universal cDNA synthesis with Unique Molecular Indices (UMI) assignment, cDNA cleanup, library amplification and library cleanup were performed. Downstream RNA sequencing reactions were performed in Illumina iSeq 100 instrument (Illumina, Inc., US) in single-ended mode with 75 bp sequence length and total reads ranging from 1.0 to 1.5 million per sample. FastQC version 0.11.9 [27] was used for quality assessment of the sequenced libraries, before downstream FASTQ file analysis. UMIs present in each sample were extracted using UMI-tools version: 1.1.2 [28] and are to be later used for deduplicating counts. The extraction pattern follows a regular expression pattern (RegEx) that searches each sequence for the 3’ adapter and extracts the following 12 bases as UMI and discarding any nucleotides after that, using the parameters “ extract-method=regex--bc-pattern='.+(?P<discard_1>AACTGTAGGCACCATCAAT){s<=2}(?P<umi_1>.{12})(?P<discard_2>.+)'“. UMI-extracted sequencing reads with lengths lower than 18 nucleotides were discarded using Cutadapt version 4.2 (29). Subsequently, hairpin and mature miRNAs were mapped to their corresponding genomes using Bowtie2 version 2.5.1 [30]. Homo sapiens miRNA FASTA files were obtained from miRBase release 22.1 [31]. We performed three rounds of alignment, one for precursor miRNAs, also known as hairpin miRNA, one for mature miRNA and one for genome aligned mature miRNA. Firstly, the hairpin miRNA sequencing reads were aligned to the hairpin miRNA miRBase genome using the parameters “--local --very-sensitive --no-unal -N 0 -k 1 --threads 16”. Reads were later processed to obtain mature miRNA counts using the same Bowtie2 parameters as before. Unaligned mature miRNA sequencing reads were re-aligned to the human reference genome (GRCh38) with Bowtie2 using the parameters “--local --very-sensitive --no-unal -N 1 -k 1 --threads 16”, allowing now for single [1] mismatch rather than the strict no mismatch used in the original alignment round.
Original count files for the miRBase aligned sequencing reads were created with the use of Samtools version 1.16 [32] using the sort and index tools. For the GRCh38 aligned reads we used the htseq-count tool from the HTSeq version 2.0.2 package [33] with the parameters “-f bam -m union -s yes -r name -t miRNA -i product”. Finally, both miRBase and GRCh38 aligned count files were deduplicated, in order to minimize falsely overestimated counts, with the use of UMI-tools dedup tool and the option “--method=unique”. Mature miRNA miRBase counts were combined with the GRCh38 mature miRNA counts using custom in-house Python scripts.
The same pipeline was implemented for the analysis of the NSCLC mouse samples. The alignment of the miRNAs was performed on the GRCm38 mouse reference genome. Differentially expressed hairpin and mature miRNAs were identified with the R package DESeq2 [34], where counts lower than 1000 were discarded and a log fold-change cutoff of ±1 and an adjusted p-value cutoff of 0.05 were applied. Total miR reads displayed by NGS analysis are listed in Supplementary Tables S2 A-D (human) and S3 (mouse).

2.7. Analysis workflow

To investigate the epigenetic landscape of human and mouse NSCLC, we have initially assessed the differential expression patterns of ZBTB7A human and zbtb7a mouse genes in KRAS-mutant NSCLC, compared to the human bronchial epithelial cell line BEAS-2B (normal) and to normal mouse lung tissue respectively. Subsequently, we performed methylation screening in CpG islands flanking lncRNAs and correlated methylation with expression levels of 6 selected lncRNAs that are confirmed for their implication in human lung cancer. LncRNAs are not conserved between humans and mice contrary to miRNA families, which are highly conserved among mammals and other organisms and thus, mouse samples were subjected only to miRNA qualitative and quantitative analysis. Both mouse and human samples were subjected to NGS analysis to determine miRNAs differentiated in NSCLC and normal tissue and a network of potential interrelationships was built. An experimental outline, as well as processing workflow are given in Figure 1.

2. Results

3.1. Differential expression profiles of LRF/ZBTB7A and methylation/expression profiles of lncRNAs
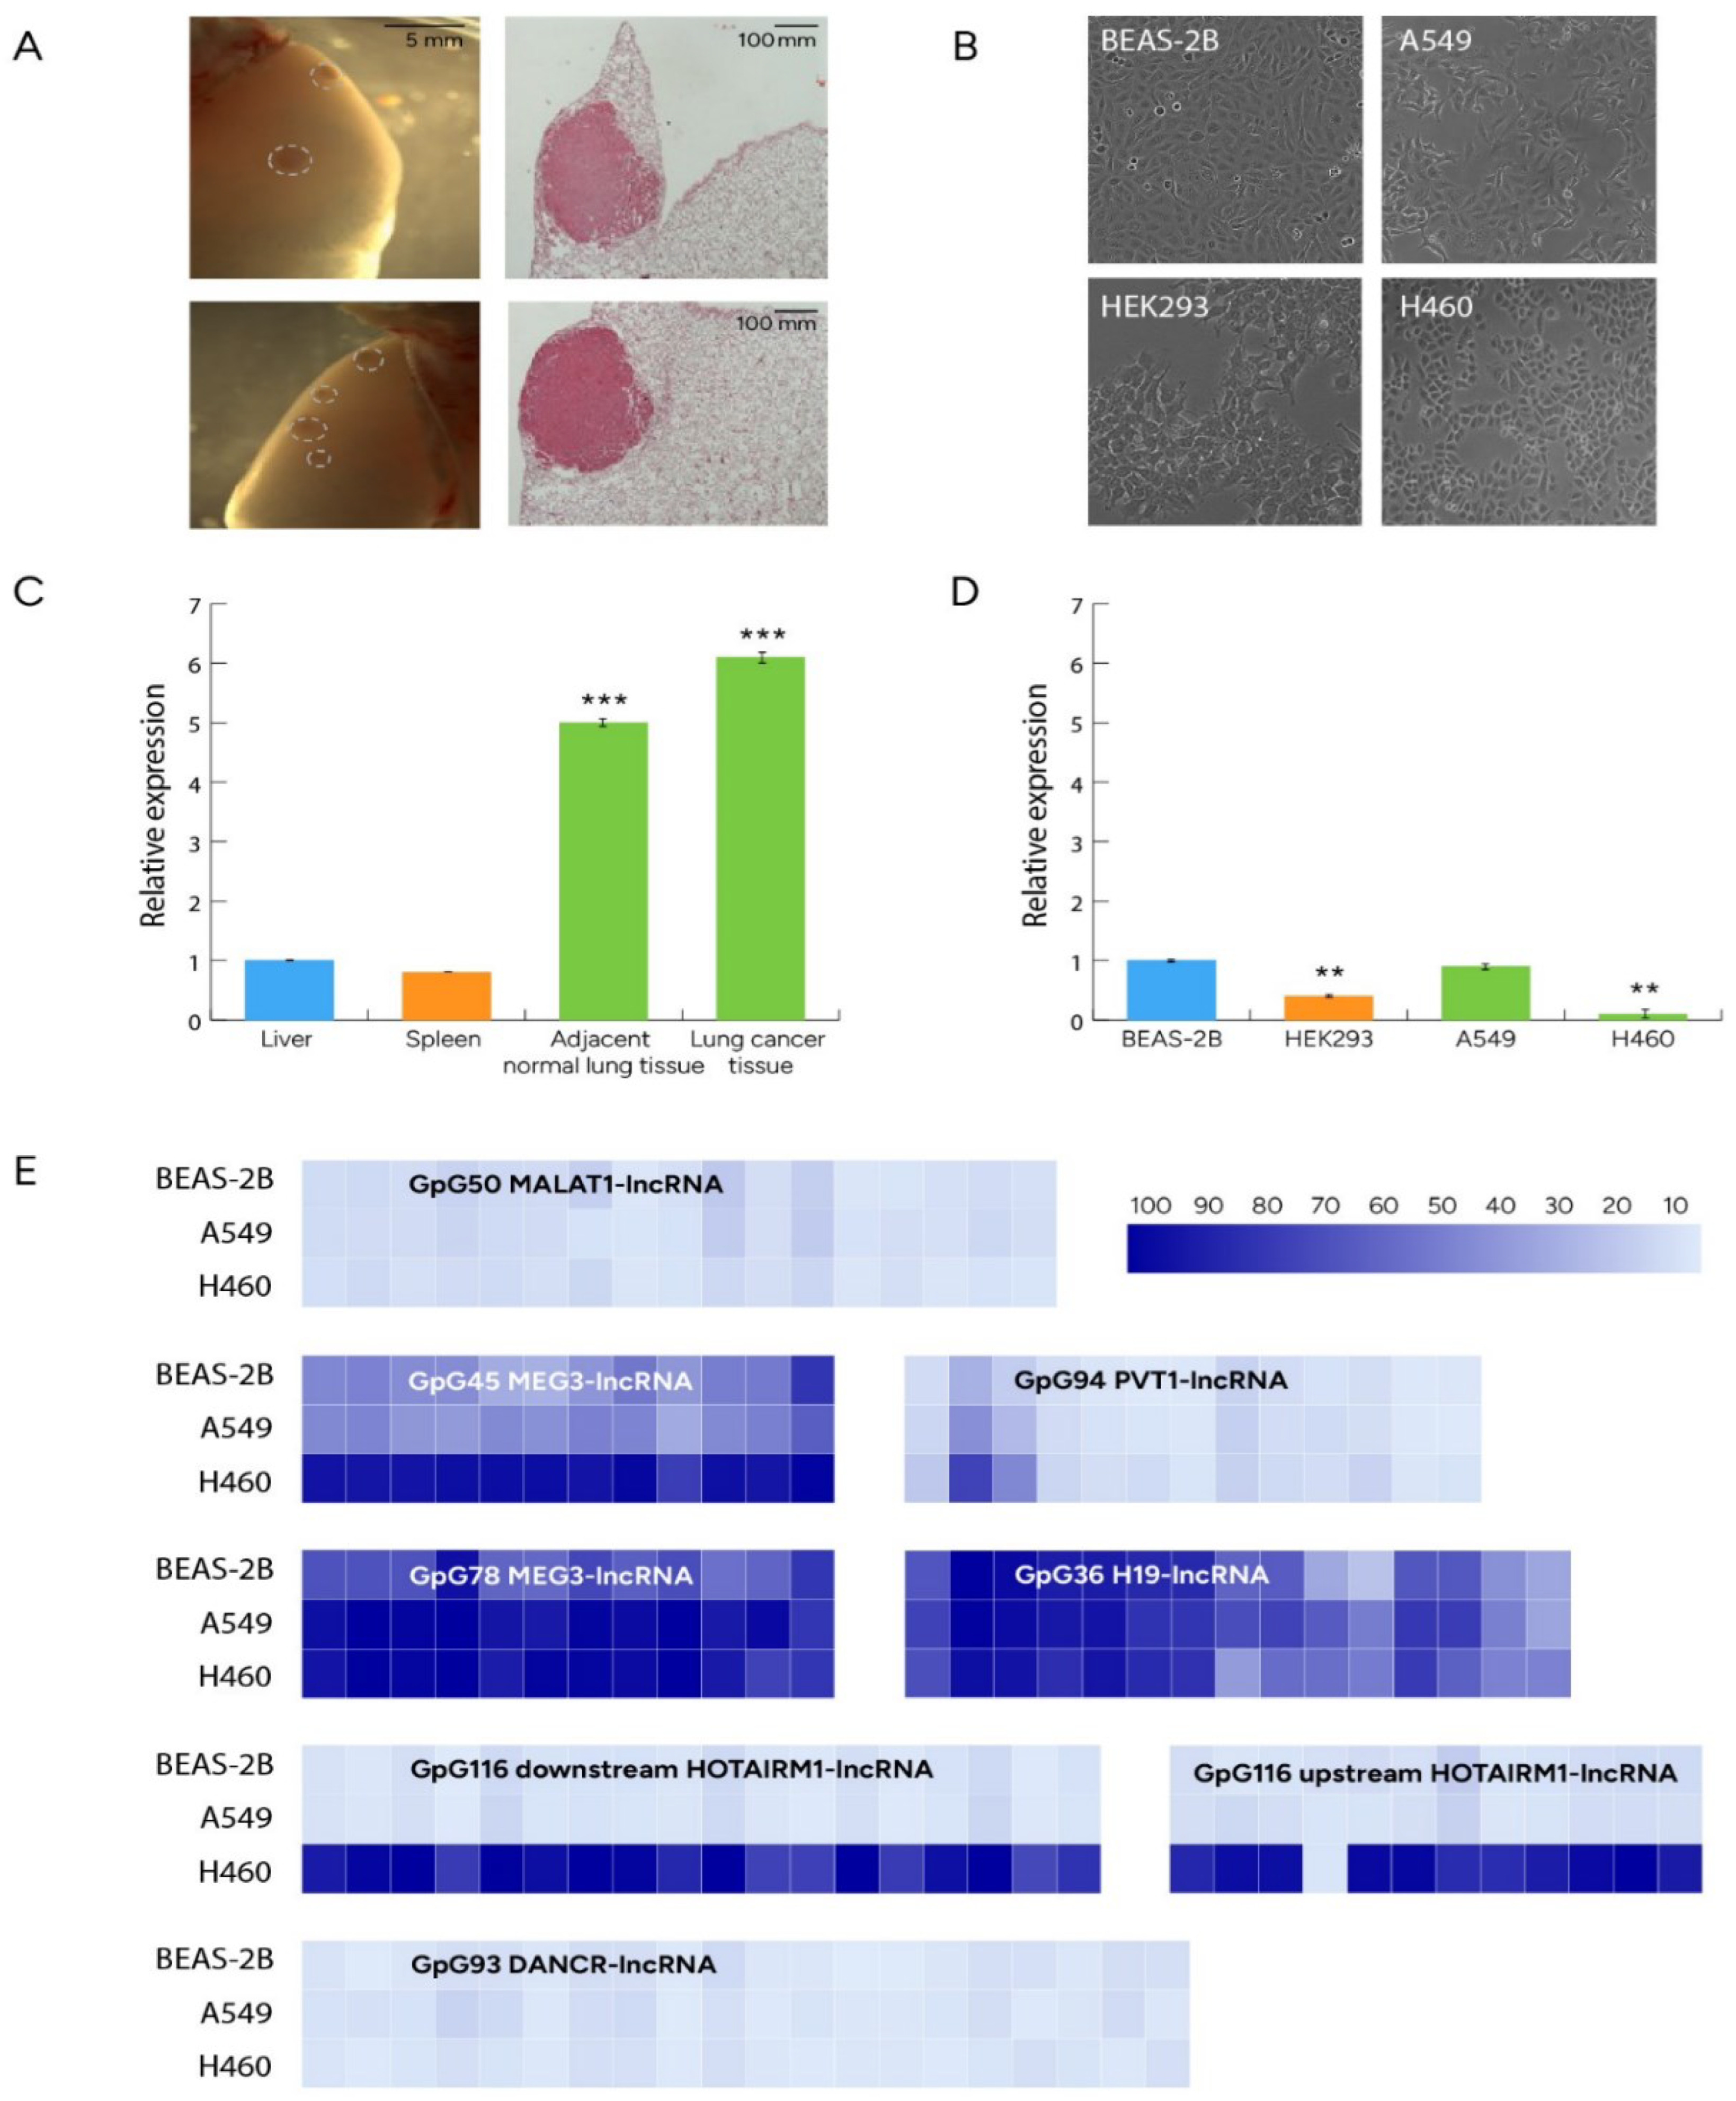
Comparisons of mouse lrf/zbtb7a expression levels between lung and other tissues (liver and spleen) showed a significant upregulation of lrf/zbtb7a expression in mouse lung. Similarly, LRF/ZBTB7A was significantly overexpressed in human BEAS-2B cells compared to HEK293 immortalized human embryonic kidney cells. When we questioned lrf/zbtb7a expression in NSCLC samples of FVB mice treated with urethane compared to adjacent normal lung tissue, we found similar expression levels between malignant and normal lung tissue (Figure 2A,C); this was further corroborated in human samples, as BEAS-2B and A549 LUAD cells expressed same levels of LRF/ZBTB7A (Figure 2B,D). Interestingly however, H460 large cell carcinoma cell line exhibited significantly reduced levels of LRF/ZBTB7A expression compared to both BEAS-2B and A549 cells, possibly indicating a differential pathway of LRF/ZBTB7A expression in this subtype of NSCLC.
Methylation and expression assays were performed in six [6] selected human lncRNAs (Table 1) to reveal correlations between methylation and expression levels (heatmaps of Figure 2E). CpGs 93 and 50 of DANCR- and MALAT1-lncRNAs respectively, were unmethylated representing full accessibility for the transcriptional machinery although, A549 cells displayed 70% reduced levels of expression for DANCR-lncRNA. MALAT1-lncRNA was not detected in any of the cell lines tested with qPCR, as well as HOTAIRM1-lncRNA. Among the rest of lncRNAs analyzed, decreased expression levels of each lncRNA were analogous to the elevation of methylation status across CpG island. CpGs 36, 116, 45, 78 and 94 of H19-, HOTAIRM1, MEG3-, MEG-3 and PVT1-lncRNAs respectively, were mainly hypermethylated in H460 cell line (Figure 2E). Methylation status of MEG3 CpG 45 directly upstream CpG 78, exhibited half values of methylation 45%) in BEAS-2B and A549 cells compared to CpG 78, which can be attributed to the CTCF insulator protein binding site, residing between these two rich CpG sequences [UCSC genome browser (https://genome-euro.ucsc.edu/cgi-bin/hgGateway)] and obstructing hypermethylation spreading. LncRNA methylation and expression levels are further discussed in the last paragraph of “results” section in direct correlation with results from miRNA expression and within the frame of potential interconnection of their functions.
Figure 2. (A) Representative stereoscopic images of whole lungs (left panel) and microscopic images of hematoxylin/eosin-stained sections (right panel) of lung adenocarcinomas (LUAD) induced in FVB mice by 1 intraperitoneal injection of 1 g/Kg urethane (six months latency). Dashed circles outline tumors. (B) Human cell lines subjected to analysis (C) lrf/zbtb7a was significantly overexpressed in normal mouse lung tissue compared to other physiological tissues (liver and spleen) and comparable between mouse NSCLC and adjacent normal lung tissue. *** p<0.001 (D) LRF/ZBTB7A levels were significantly lower in human HEK293 compared to BEAS-2B cells. Human BEAS-2B and A549 LUAD cells exhibited equal LRF/ZBTB7A expression levels, in contrast to H460 large cell carcinoma human cell line which presented significantly lower expression of LRF/ZBTB7A. ** p<0.01 (E) Methylation profiles of CpG islands flanking TSS of lncRNAs in A549, H460 and BEAS-2B human cell lines. Each box corresponds to a Cytosine followed by Guanosine across the CpG island sequence. Data are presented as mean percentage methylation.
Preprints 88927 g002

3.2. Sets of mouse miRs differentially expressed between NSCLC and normal lung tissue

To identify miRs of mouse origin (mmu-miRs) that are differentially expressed in NSCLC, RNA samples from six different NSCLC tumors (experimentally developed according to [16]) and four RNA samples from adjacent normal mouse lung tissues, were utilized for miR library development, next generation sequencing and subsequent bioinformatics analysis.
Table 2 lists distinguished miRs either overexpressed or underexpressed in mouse NSCLC tissue. Both hairpin and mature forms of miRs were determined. Reads with counts lower than 1000 were discarded. Differentially expressed miRNAs were considered those with an adjusted p-value <0.05 and a log2fold change cutoff of ±1. Also, mmu-miR families indicating other miR members with seed sequence of close similarity implying same gene targeting and chromosomal locations of mmu-miR clusters (when applicable) indicating chromosomal locations with altered transcriptional regulation upon malignant development, are also listed in the table.
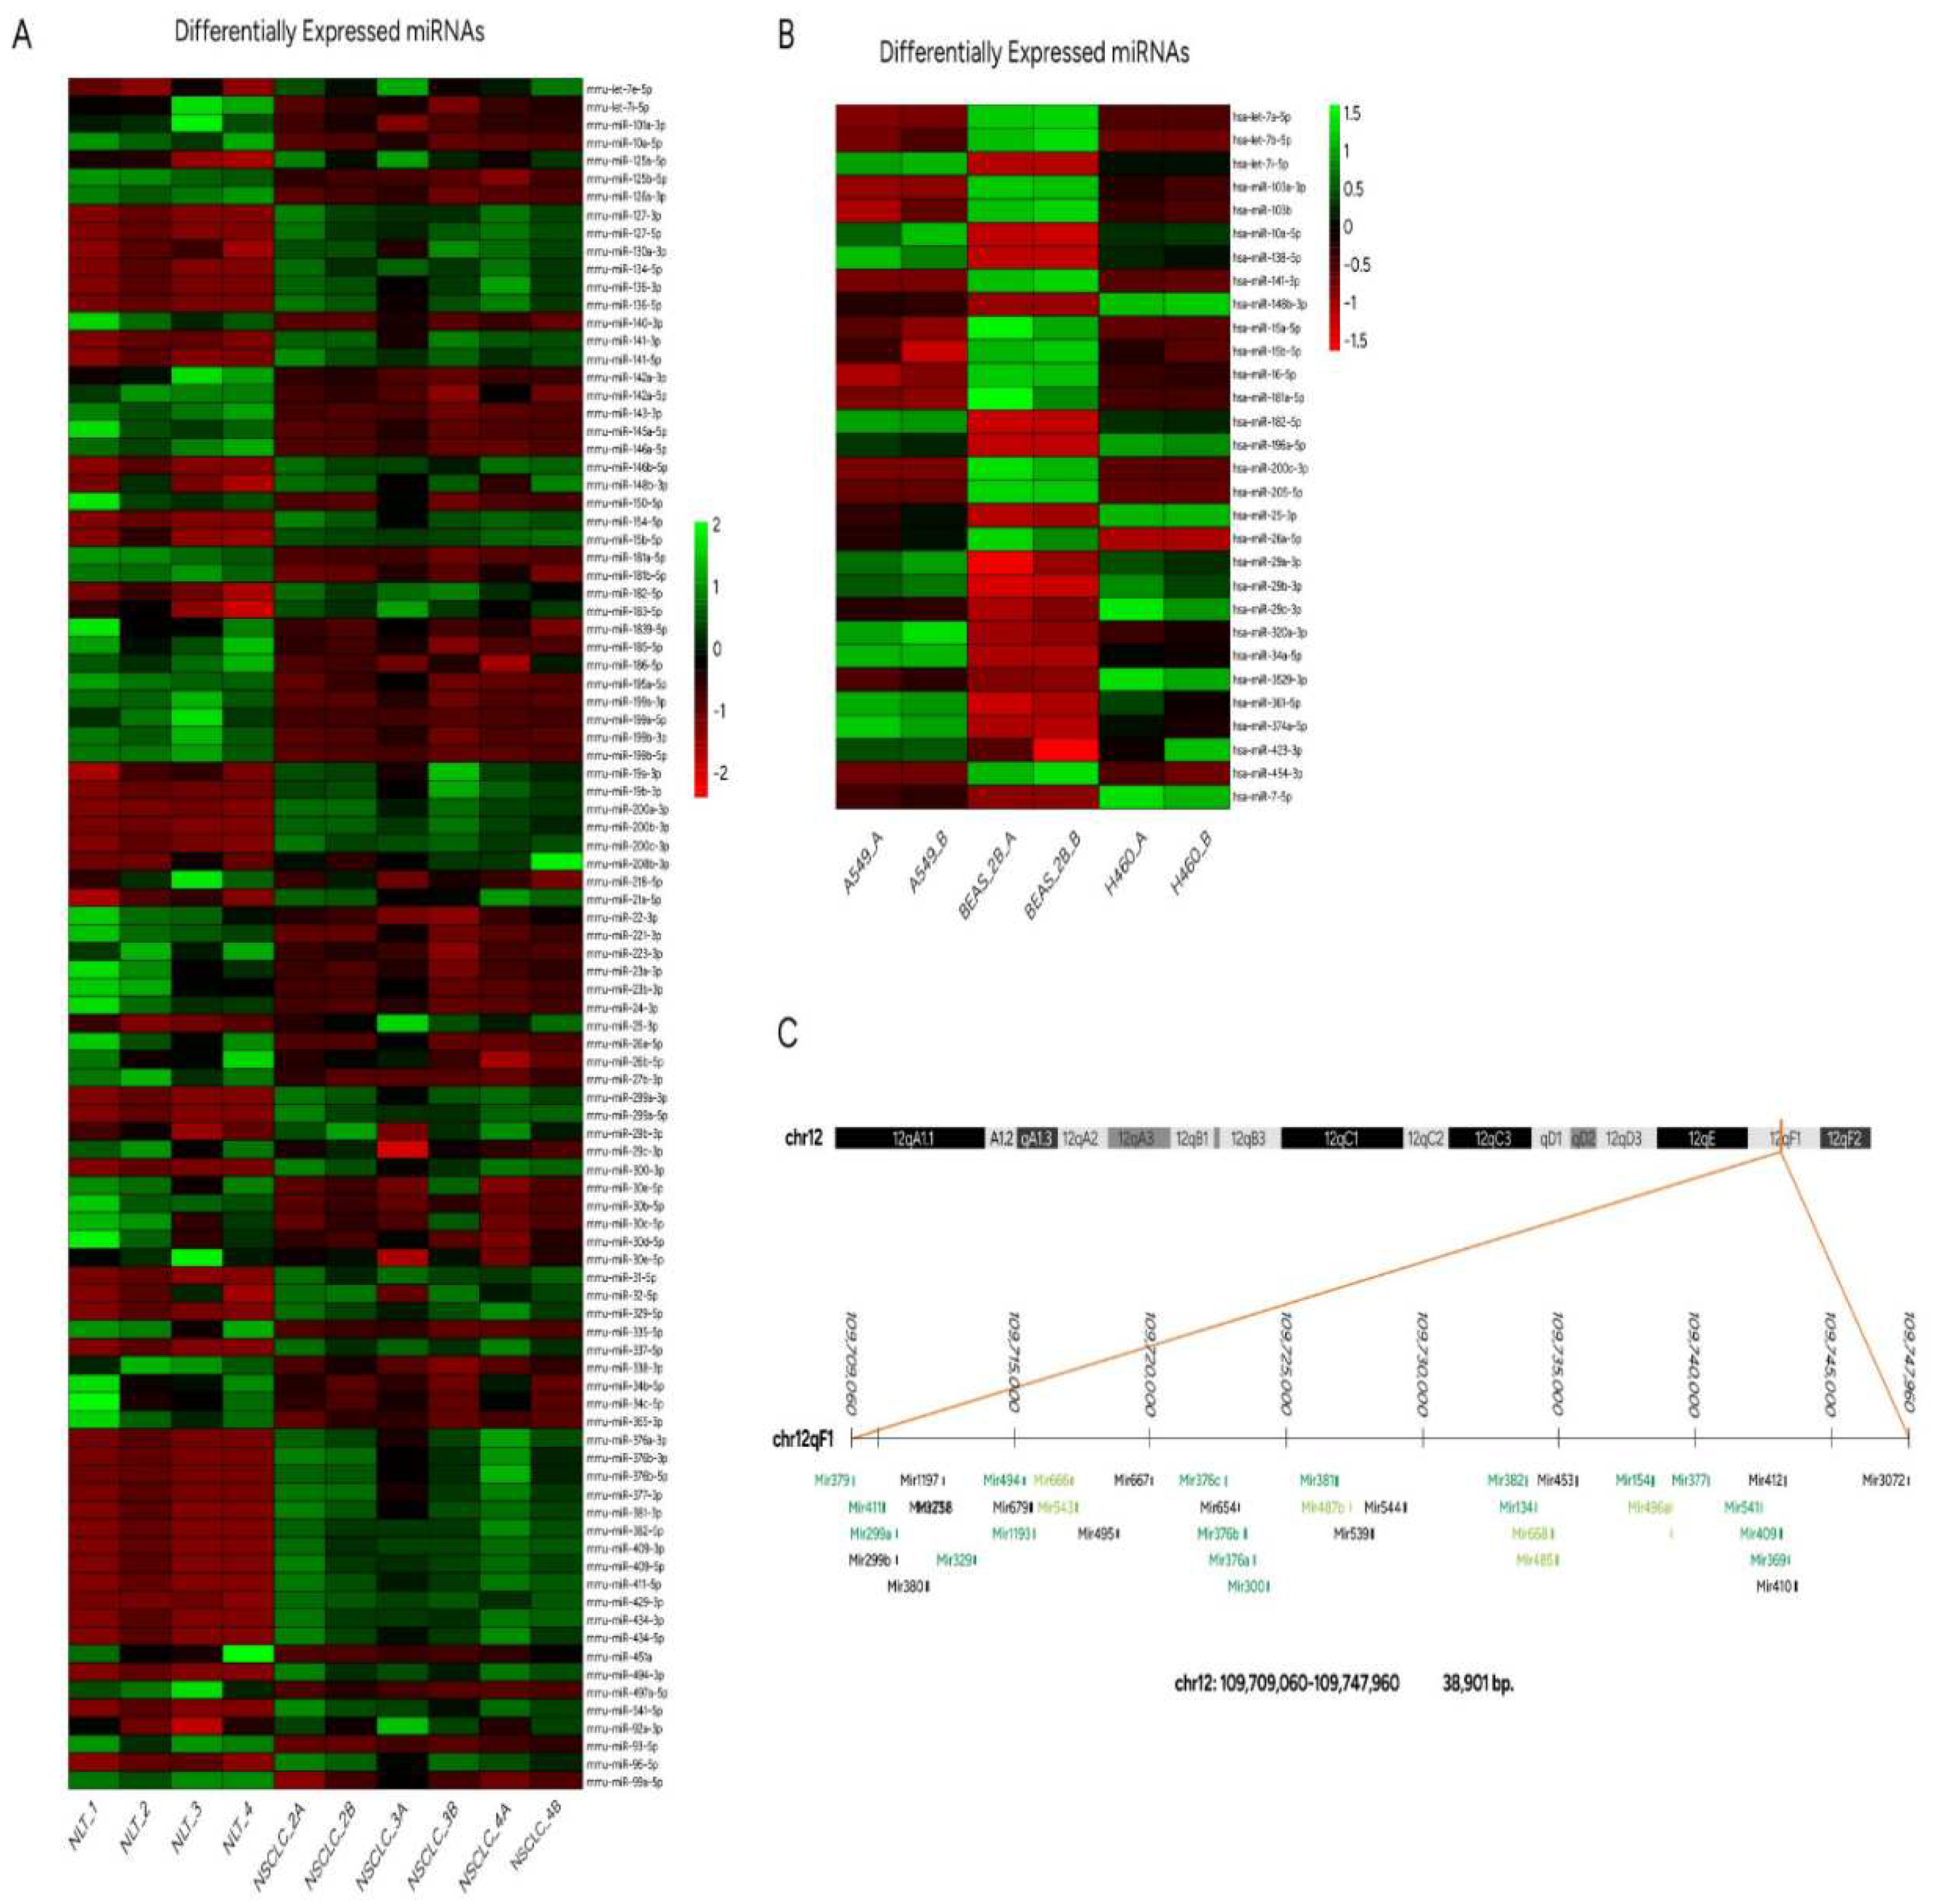
A heatmap of deregulated miRs outlining expression profiling in mouse NSCLC tissues is illustrated in Figure 3A. 73 hairpin forms of premature miRs distinguished NSCLC from normal lung tissue in mice, which are considered useful markers in correlation tests between human and mouse NSCLC biological models.
Of great interest was the fact that the vast majority of upregulated mmu-miR species were assigned to a specific area of mouse chromosome 12 [(UCSC genome browser on Mouse (GRCm38/mm10), 12qf1: 109,709,060-109,747,960] (Figure 3C), suggesting a genomic expansion of this chromosomal region or exceptional deregulation of transcription across this genomic area. More distant regions of chromosome 12 were also found to produce higher levels of miR species (chr12: 109585789-109595388 and chr12:109611500-109618336, Table 2) in mouse NSCLC tissue (not shown in Fig. 3C). Relative quantification of miRs derived from this chromosomal location, suggest that transcription starts from miR promoter regions across the forward strand of DNA however, RNA polymerase attenuates transcriptional efficiency since miR counts of each cluster are with a descending order. This phenomenon is color-coded and presented in Figure 3C, where miRs with the highest and significantly differentiated expression are highlighted in dark green, gradation to light green represents miRs upregulated but not statistically significant and finally black-colored miRs were not detected by NGS analysis.

3.3. Altered expression profiles of human miRs not related to LRF/ ZBTB7A transcription factor

Human miR (hsa-miR) expression levels were derived from NGS and up/downregulated species were analyzed by bioinformatics analysis as presented in materials and methods. A heatmap of the differentially expressed miRs in NSCLC cell lines (A549 and H460) is illustrated in Figure 3B and summarized in Table 3. Reads with counts lower than 1000 were discarded. Differentially expressed miRNAs were considered those with an adjusted p-value <0.05 and a log2fold change cutoff of ±1. Additionally, hsa-miR families, with similar seed sequences and chromosomal locations of hsa-miR clusters lying within the same genomic region are listed in Table 3. Families of commonly upregulated miRs between A549 and H460 were miR-34, let-7 and miR-374, and accordingly downregulated families were miR-205 and miR-8. Moreover, miR-10 family members were upregulated in A549 and downregulated in H460 cells. Common members of miR-8 family, detected in both mouse and human NSCLC samples were up- or downregulated in reverse way. MiR-10 family in mice was downregulated, presenting the same trend as H460 cell line.
Significantly deregulated miRs of the human NSCLC cell lines compared to the human bronchial epithelial cell line BEAS-2B, were the following:
MiR-let-7i hairpin and mature hsa-let-7i-5p were overexpressed in NSCLC cell lines. In particular, hairpin and mature forms of hsa-let-7e and hsa-let-7e-5p were overexpressed in A549, and hsa-let-7c and hsa-let-7c-5p were overexpressed in H460. On the contrary, A549 cells were characterized by downregulation of hsa-let-7c-5p and hsa-let-7d-5p. Hairpin hsa-miR-374a and its corresponding mature form (hsa-miR-374a-5p) were also overexpressed in both A549 and H460 cell lines. Another essential miRNA, miR-34a, the first miRNA investigated in a clinical trial for solid tumors restoration [35], was upregulated as hairpin and mature (hsa-miR-34a-5p) in both A549 and H460 cells. Hairpin hsa-miR-200a, hsa-miR-200c and hsa-miR-141 along with mature forms of hsa-miR-200a-3p, hsa-miR-200c-3p and hsa-141-3p (members of mir-8 mammalian family), showed decreased levels of expression in both A549 and H460 cell lines. Finally, both human NSCLC cell lines (A549 and H460) showed a significant decrease in hsa-miR-205 (hairpin form) and hsa-miR-205-5p (mature form). Other miR molecules detected in this study either in mouse or human cells are within the list of compiled validated miRs with important diagnostic value [36].
A cluster encompassing hsa-miR-99b-5p, hsa-miR-125a-5p and hsa-let-7e-5p, located on chromosome 19, was found to be elevated only in A549 cells. These miR species derive from the same precursor RNA and although belong to the same cluster, are in separate miR families with diverse biological functions.
The same observation regarding the presence of miR species constituting a cluster applies to human samples as well as observed in mouse upregulated miR clusters of chromosome 12. All members of the same miR cluster are present (Supplementary Tables S2 A-D), but only subsets of the each miR cluster reach a statistical significance of deregulation. Only miR species that were depicted by bioinformatics analysis are presented in Table 3.

3.4. Human and mouse miRs targeting LRF/ZBTB7A

Abnormal levels of Zinc-Finger/BTB-Domain-Containing Protein family members, such as LRF/ZBTB7A in malignant cell lines and tissues provide valuable insights into upstream signaling pathways/molecules and molecular mechanisms underlying their roles in genome integrity, cell cycle checkpoint obstruction and interacting partners. LRF/ZBTB7A has been characterized as an epigenetic regulator and a contingent factor orchestrating expression of non-coding RNA species [12,13]. In our analysis, ZBTB7A expression levels were found comparable and equally elevated in lung adenocarcinoma of mouse and human origin, while significantly lower ZBTB7A expression levels were obtained in H460 large cell lung carcinoma cells. Table 4 lists mouse and human miRs either predicted with miRDB [37] or reported in literature to target ZBTB7A; results obtained from our study are also included.
Among members of the miR-10 mammalian family, our results showed downregulation of hsa-miR-100-5p (Table 3), considered as a direct suppressor of ZBTB7A as well as decreased ZBTB7A-mRNA levels in H460 cell line. Among mouse NSCLC samples, mmu-miR-10a-5p (Table 2) was significantly downregulated. Some more distant miR species of the same family, namely miR-99a/b, miR-100 and miR-125, are encoded from other genetic loci than Hox clusters [38] and imply potential mutual gene targets. Human A549 showed upregulation of hsa-miR-99b-5p and hsa-miR-125a-5p. All mentioned miR species belong to miR-10 family sharing similar seed sequences and implying similar functions and gene targets. Supportive evidence comes from studies in mice which report that Zbtb7a is identified as a direct target for mmu-miR-125a [39].
Moreover, A549 human cell line displayed downregulation of hsa-miR-20a-5p (Table 3), member of the miR-17 mammalian family and miR17/92 cluster, which has been reported to support development and progression of lung cancer in humans [40], whereas in mouse embryonic cells mmu-miR-20a overexpression contributes to cell senescence assisted by the direct ZBTB7A and E2F1 downregulation accompanied by p16 upregulation [41]. Another cooperation of miR-15a (member of miR-15 mammalian family) and ZBTB7A that has been predicted by miRDB [37], was also supported by our analysis, since hsa-miR-15a-5p was downregulated in both A549 and H460 cell lines (Table 3). In mouse NSCLC samples, mmu-miR-195a-5p, member of the same family (miR-15) was also downregulated. Another downregulated miR, namely mmu-miR-181a-5p was predicted to target zbtb7a and was also detected in our sets of deregulated mmu-miR species (Table 2). Hsa-miR-148b-3p, is upregulated only in H460 cells in the present study and has also been predicted to target ZBTB7A (Table 3). MiR-148b-3p belongs to the miR-148/-152 family members (miR-148a, miR-148b, and miR-152), which have been associated with poor overall survival in NSCLC. Drug cocktails including metformin and cisplatin promote upregulation of miR-148/-152 family suggesting these molecules as potential targets for therapy of lung cancer [42].
Other interesting associations between miRNA species and ZBTB7A are presented in Table 4, which are highlighted in relevant literature but neither were apparent among significantly altered miR species in our study nor they were predicted by miRDB [37]. Hsa-miR-577 has been shown to be suppressed in NSCLC and this reduction was associated with sponge effects of the elevated circular non-coding RNA circ_0016760, derived from the same human tissues. Circ_0016760 was also predicted to modulate hsa-miR-577 expression and downregulation via employment of starBase 3.0 bioinformatics tool, further promoting expression of the ZBTB7A (target of hsa-miR-577) gene and NSCLC progression [43]. Quantitative PCR analysis from total RNA derived from NSCLC tumor and paired adjacent normal lung tissues showed increased levels of hsa-miR-520e in NSCLC. Hsa-miR-520e was suggested to target the 3′UTR of ZBTB7A-mRNA and to be implicated in tumor cell growth, invasion and migration via modulation of Wnt signaling in A549 cells [44]. Another mammalian miR, hsa-miR-106b was shown to directly target the 3’ UTR of ZBTB7A-mRNA and to alleviate its expression levels in HEK-293T cells [45]. Finally, the 3ʹUTR of ZBTB7A-mRNA sequence encompasses a putative binding site for miR-144-3p. In bladder cancer miR-144-3p suppresses malignancy via targeting and decreasing ZBTB7A, having an inverse correlation with HIC1/ZBTB29 (Hypermethylated in cancer 1/Zinc Finger And BTB Domain-Containing Protein 29) gene expression [46], another member of the Zinc-Finger/BTB-Domain-Containing Proteins. In lung cancer increased expression of ZBTB7A has been shown to inactivate the TP53 (Tumor Protein P53) by increasing the levels of MDM2 (MDM2 Proto-Oncogene, E3 Ubiquitin Protein Ligase), frequently overexpressed in this type of malignancy. In addition, a significant number of NSCLC tissues examined displayed 2-5-fold amplification of ZBTB7A chromosomal locus 19p13.3, accompanied by increased mRNA and protein levels strongly suggesting that the amplification process may have functional consequences [47].
Table 4. Targeting of ZBTB7A by miRs, predicted with respective scores by miRDB or reported in literature.
Chromosome Family miRNA Gene target interaction with 3'UTR Score/REF Results from our study
13 miR-17 hsa-miR-20a-5p ZBTB7A at 912, 1205, 1230, 4309 bp 96 A549 downregulated
19 miR-10 hsa-miR-125a-5p ZBTB7A at 547, 803, 1667, 4210 bp 81/
[39]
A549 upregulated
12 miR-148 hsa-miR-148b-3p ZBTB7A at 1877, 2071 bp 50 H460 upregulated
13 miR-15 hsa-miR-15a-5p ZBTB7A at 3305 bp 65 A549 and H460 downregulated
19 miR-10 hsa-miR-100-5p ZBTB7A [48] H460 downregulated
4 miR-577 hsa-miR-577 ZBTB7A [43] -
7 miR-17 hsa-miR-106b ZBTB7A [49] -
17 miR-144 hsa-miR-144-3p ZBTB7A [46] -
19 miR-520e hsa-miR-520e ZBTB7A [44] -
19 miR-10 mmu-miR-10a-5p Zbtb7a 68 NSCLC mouse tissue downregulated
13 miR-15 mmu-miR-195a-5p Zbtb7a NSCLC mouse tissue downregulated
1 and 2 miR-181 mmu-miR-181a-1-5p and mmu-miR-181a-2-5p Zbtb7a at 2907 bp 87 NSCLC mouse tissue downregulated

3.5. Deregulated lncRNA expression and methylation levels, and lncRNA/miR functional axes in cancer state

The constant clinical needs for reliable markers of cancer development and progression places emphasis on established high-throughput approaches and molecular networking assessment, composed of molecules that either compete or jointly cooperate in cancer state. Following this route, we examined the literature for double or triple epigenetic biomarkers with the aim to unravel epigenetic networks underlying NSCLC. Our results support several previously reported and a novel combination of lncRNA/miRNA molecules with regulatory control on LRF/ZBTB7A expression.
MEG3-lncRNA has been detected significantly downregulated in NSCLC and reported to exhibit regulatory properties during cisplatin treatment through the control of p53 and Bcl−xl expression [50]. On the other hand, overexpression of MEG3-lncRNA is suggested to positively regulate tumor suppressor PTEN expression levels by suppressing hsa-miR-21-5p, which directly attacks PTEN. By an in vitro strategy MEG3 overexpression suppressed the migration and invasion abilities of human NSCLC PC9 and H1299 cell lines [51]. We observed upregulated levels of hsa-miR-21 hairpin structure as well as mature forms of hsa-miR-21-5p and hsa-miR-21-3p only in A549 cells combined with hypermethylation status (above 90%) of CpG island 78 suppressing the transcription of MEG3-lncRNA.
Other studies including NSCLC human samples, have shown a positive correlation between increased H19-lncRNA and hsa-miR-21 expression with increased tumor size and advanced tumor-node-metastasis stage, but not classification [52], providing an improved diagnostic value as a double-molecular biomarker. In our study, elevated expression of hsa-miR-21-5p was limited only in A549 cells and was accompanied by the hypermethylation status of CpG36 located upstream of H19-lncRNA, promoting transcriptional repression of the lncRNA.
Altered expression of HOTAIRM1-lncRNA has been reported in human cancers as well as its capability to promote treatment resistance [53]. HOTAIRM1 gene is located adjacent and antisense to the transcription start site of HOXA1 and between the neighboring HOXA2 gene. Its transcription is initiated from the shared promoter segment embedded in CpG island 116. HOTAIRM1-lncRNA is highly expressed in lenvatinib-resistant hepatocellular carcinoma leading to hsa-miR-34a downregulation and autophagy activation via regulation of beclin-1 marker molecule [54]. Relevant results from our study showed undetectable levels of HOTAIRM1-lncRNA expression, followed by upregulation of hsa-miR-34a (harpin and mature forms) in both A549 and H460 cells, although HOTAIRM1 CpG island 116 was inversely methylated in human cell lines (Figure 2E) implying different regulatory transcriptional mechanisms rather than methylation status for this particular lncRNA.
Several other studies have revealed more pathways of cooperation between lncRNA and miRNAs. MALAT1-lncRNA was shown to regulate proliferation, apoptosis, migration and invasion via the miR-374b-5p/SRSF7 and hsa-miR-200a/ZEB-1 axis in NSCLC [55], 56). In the present study, we failed to detect any level of expression for MALAT1-lncRNA, although TSS of this lncRNA transcript resides within CpG island 50 and displayed hypomethylated levels below 10%, implying an accessible promoter for transcription (Figure 2E). At the same time, hsa-miR-374a-5p was upregulated in both A549 and H460 cell lines, results that are in line with observations by J. Song et al [56] leading to other regulatory parameters that control MALAT1-lncRNA expression, apart from methylation status of CpG island 50. On the contrary, hairpin structure of hsa-miR-200a and mature hsa-miR-200a-3p were suppressed in A549 and H460 cells.
In a chronic inflammatory disease (endometriosis), high levels of MALAT1-lncRNA sponged hsa-miR-141-3p and promoted NLRP3 (NLR Family Pyrin Domain Containing 3) gene expression functioning towards pyroptosis and fibrosis, characteristic signs of endometriosis [57]. Both A549 and H460 NSCLC cell lines in our investigation demonstrated repressed hsa-miR-141-3p, although MALAT1-lncRNA was undetectable, suggesting the existence of alternative regulatory networks relevant to different kinds of human disorder and/or alternative TSSs for MALAT1 gene that substitute the targeted promoter. Related comprehensive studies also report that MALAT1-lncRNA is not detectable in A549 and H460 cells [58] confirming our results.
Upregulation of another lncRNA, DANCR-lncRNA, has been shown to have an oncogenic function in NSCLC by regulating hsa-miR-214-5p/CIZ1 axis [59]. CpG island 93 at the 5’ end of DANCR-lncRNA promoter was found hypomethylated (4-15%) in A549, H460 and BEAS-2B cells lines respectively (Figure 2E), but expression levels were decreased (by about 70%) only in A549 cells. Also, hsa-miR-214-5p was not detected in any of the NSCLC samples tested in this study.
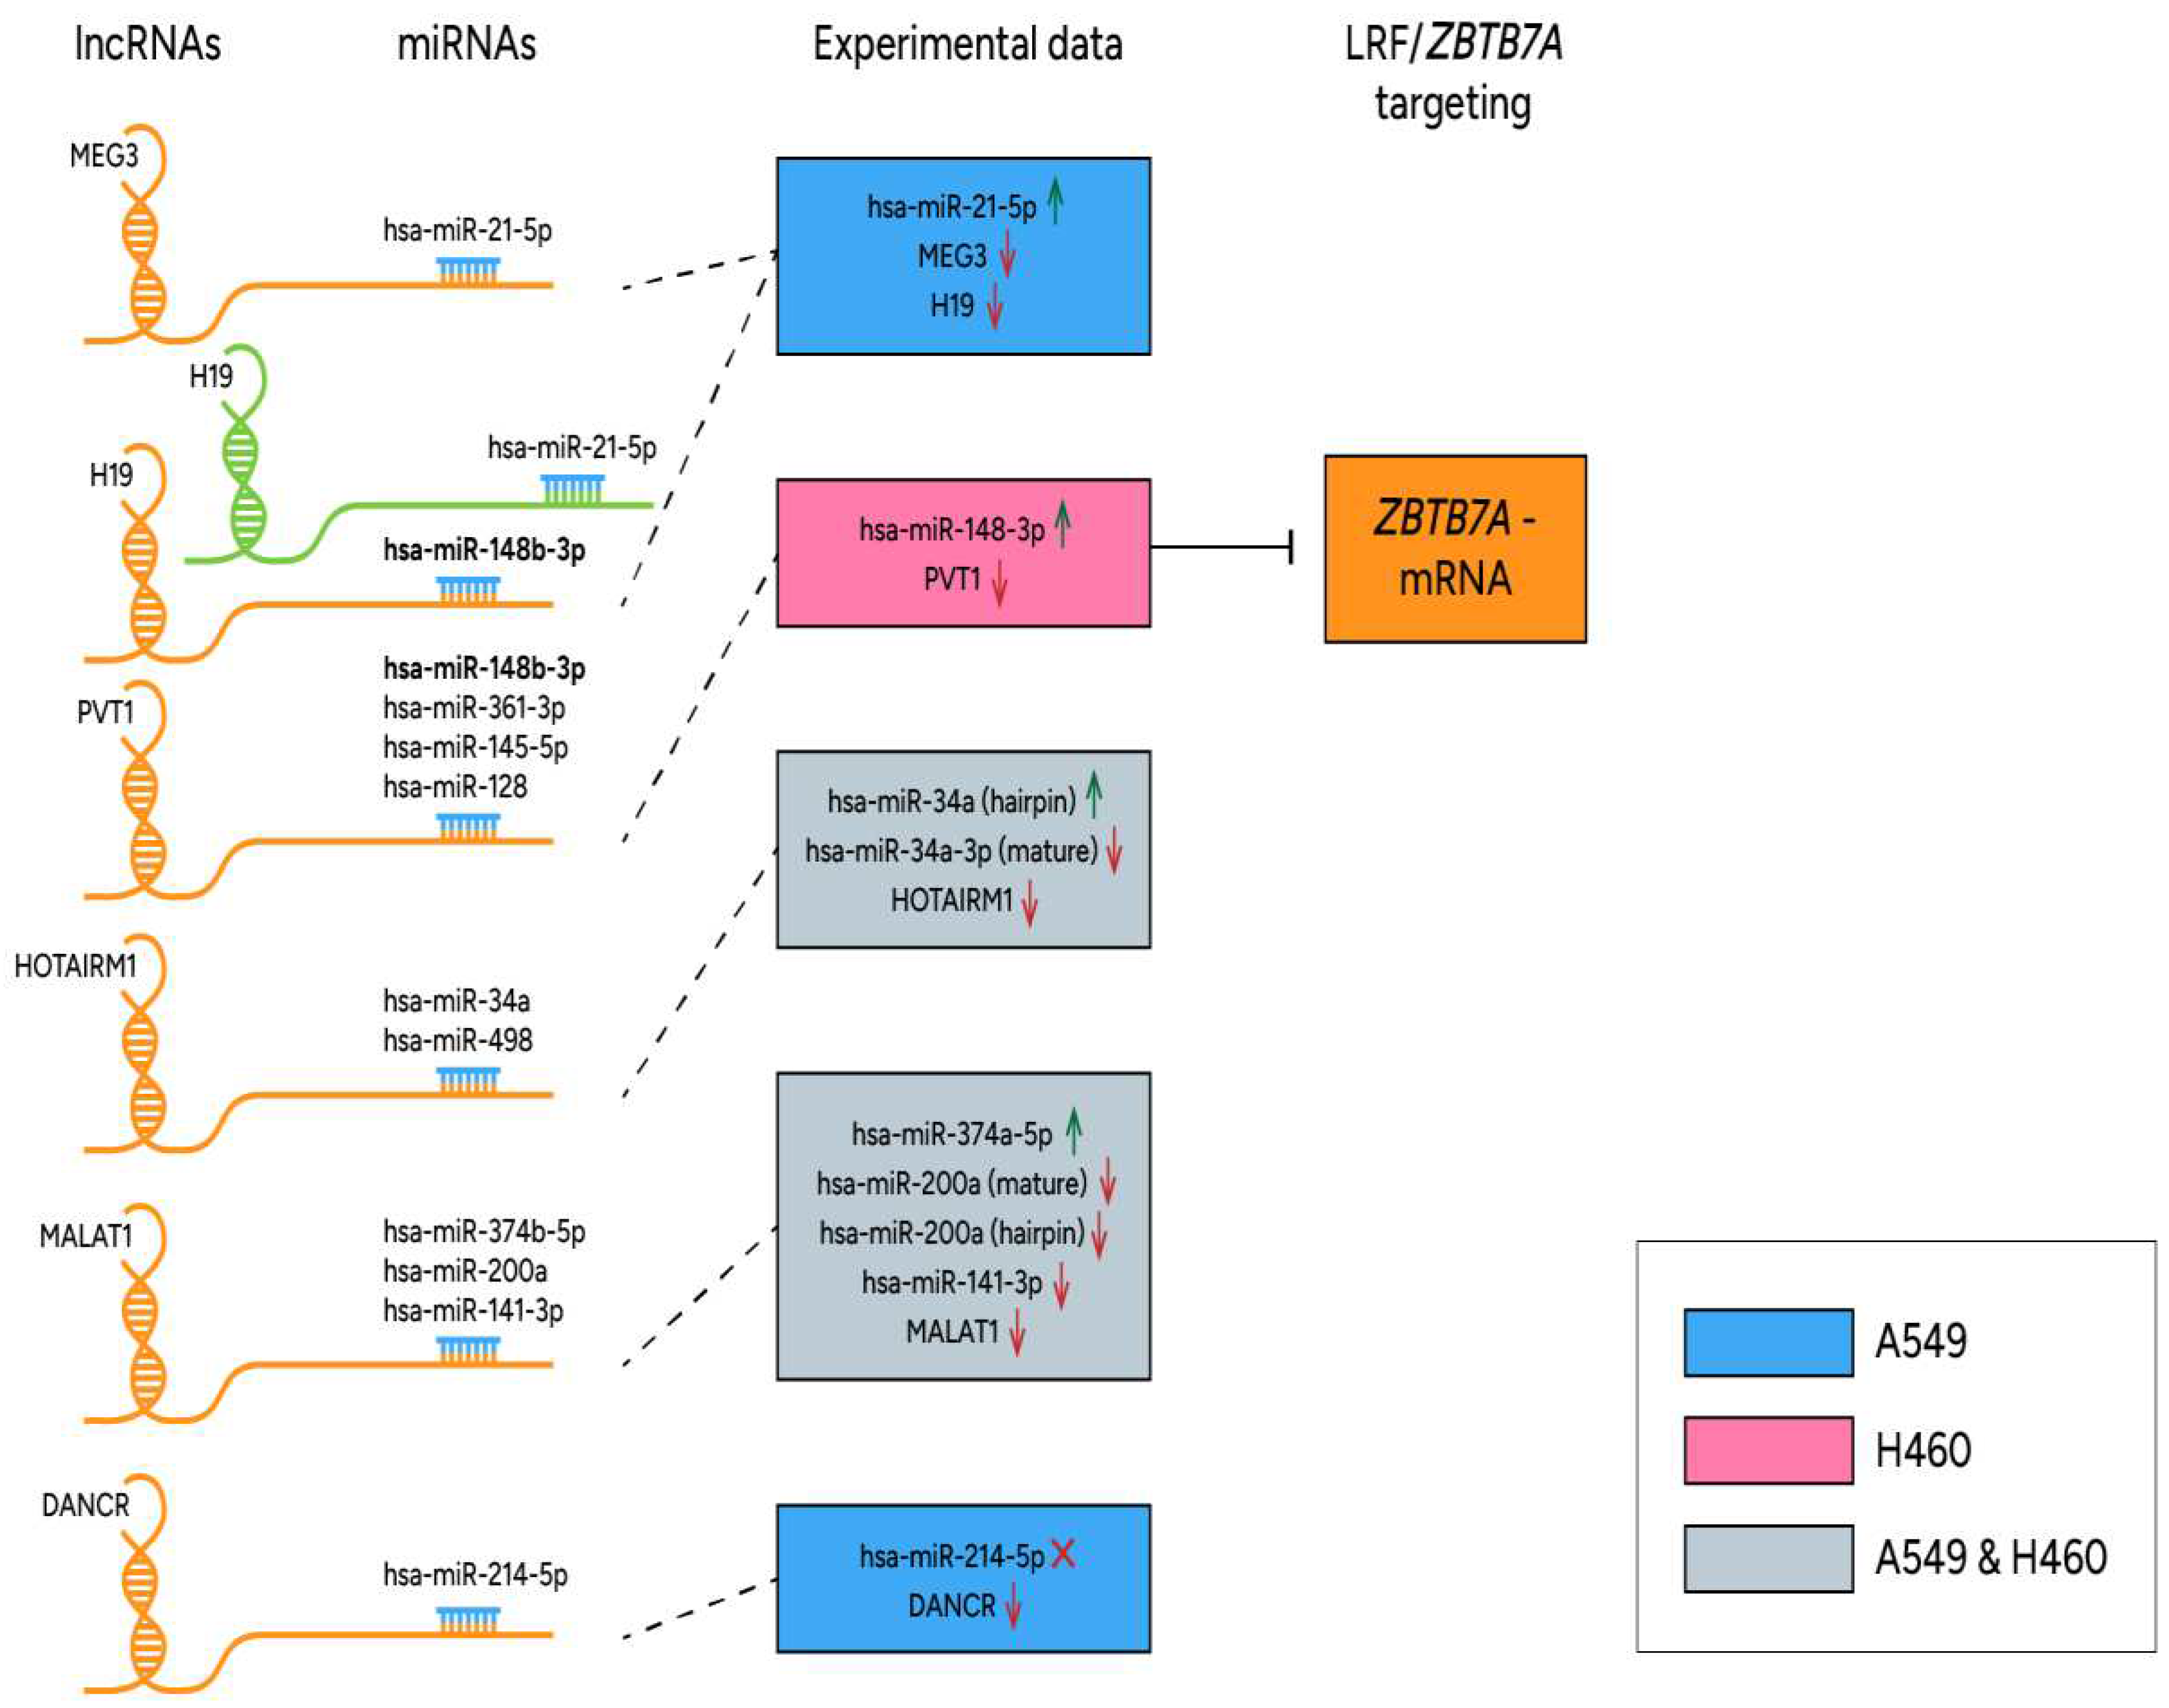
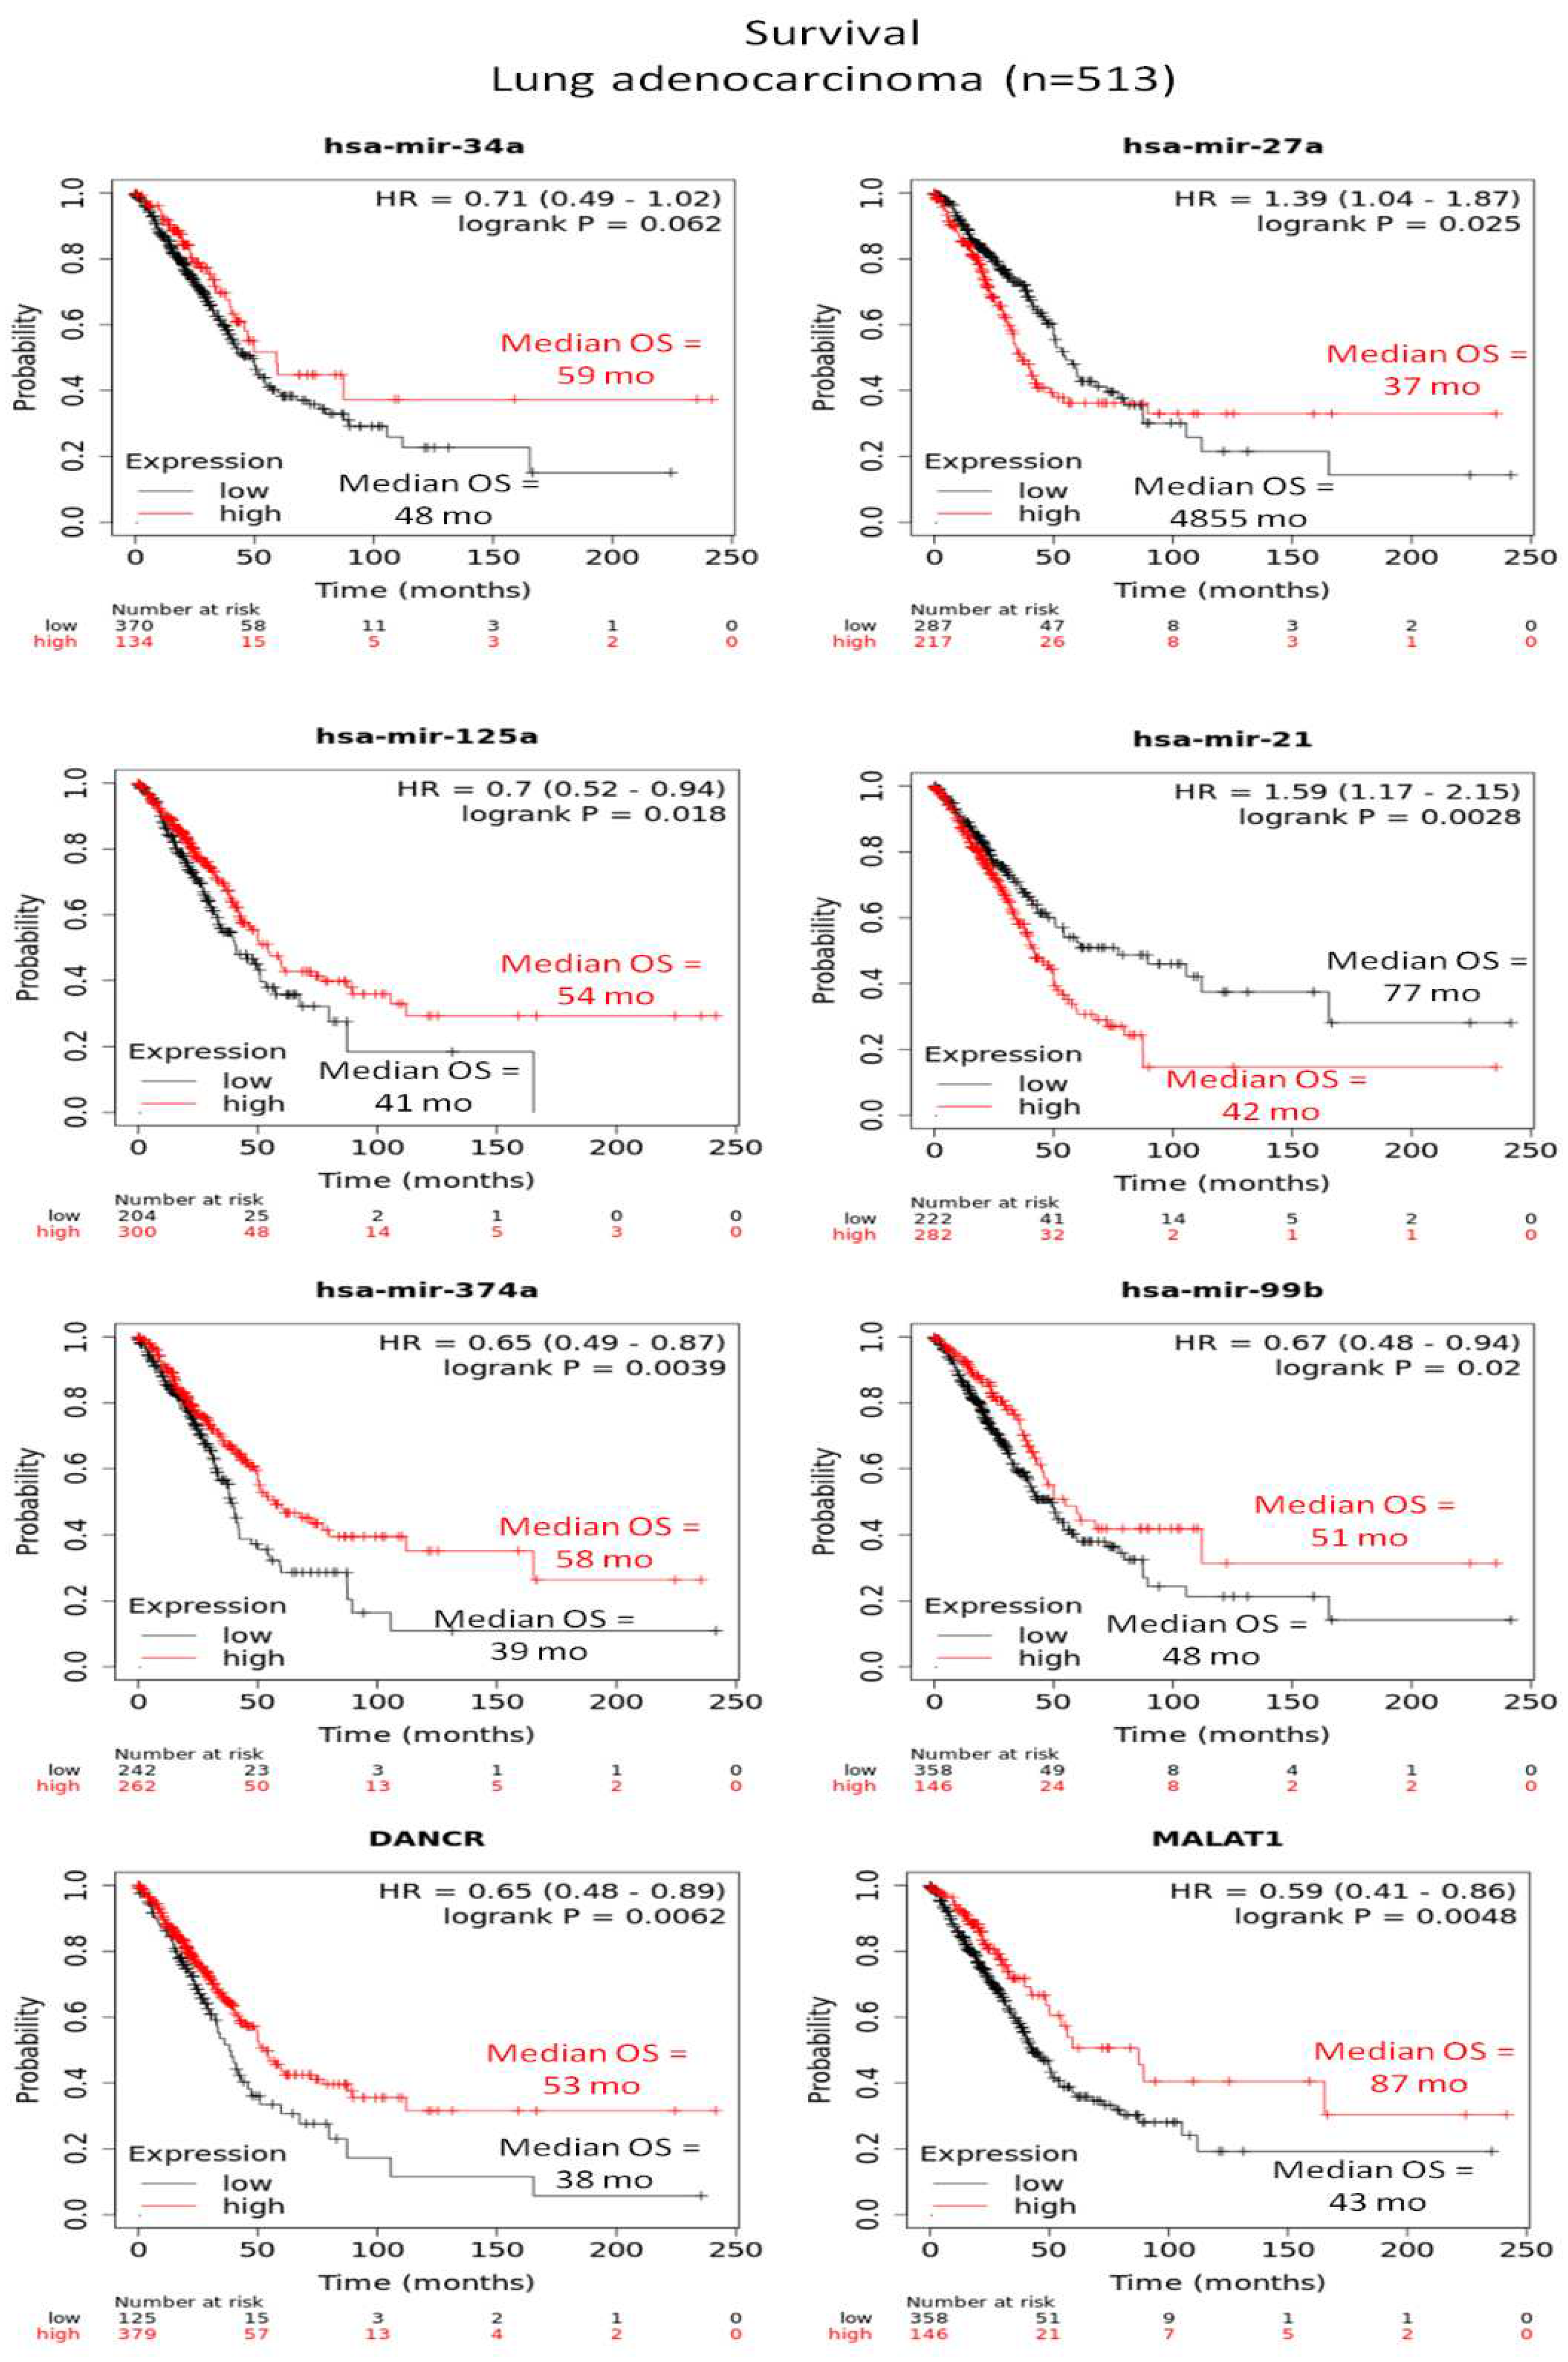
Another interesting regulatory circuit between PVT1-lncRNA, let-7 miR family, hsa-miR-128 and the highly conserved RNA-binding oncoprotein, Lin28 responsible for posttranscriptional inhibition of let-7 biogenesis, was investigated in colorectal cancer. Upregulation of PVT1-lncRNA was inversely correlated with miR-128 expression and moreover, PVT1-lncRNA targeted the Lin28/let-7 axis to promote tumorigenesis [60]. However, in our study different members of let-7 miR family were either up or downregulated in human NSCLC cell lines and furthermore, hsa-miR-128 was not detected among deregulated miR species. Also, PVT1-lncRNA has been reported to promote cancer proliferation, invasion and migration in NSCLC via regulating several human miR species. Among them hsa-miR-148/RAB34, hsa-miR-145-5p/ITGB8 (Integrin Subunit Beta 8) and hsa-miR-361-3p/SOX9 (SRY-Box Transcription Factor 9) axis are known to be modulated by PVT1-lncRNA [61,62,63], providing evidence for combinational function of epigenetic mechanisms underlying NSCLC progression. In the present study hsa-miR-148b-3p was upregulated only in H460 cells combined with high (up to 70%) methylation profiles of CpG island 94 of PVT1-lncRNA and downregulation of its expression. Related results from A549 cells displayed lower methylation status (below 40%) for CpG island 94 along with upregulated expression signatures of PVT1-lncRNA and undetectable levels of hsa-miR-148b-3p. Apparently, hsa-miR-148b-3p/PVT1-lncRNA/ZBTB7A-mRNA represents an interesting network derived from our study, which is introduced for the first time in literature. Furthermore, describes the significantly repressed ZBTB7A levels in H460 (large cell lung carcinoma) cell line in contrast to all other NSCLC (adenocarcinoma) human and mouse samples tested. All reported interactions in human samples between ZBTB7A and non-coding RNAs (miRs and lncRNAs) are illustrated in Figure 4. Also, Differentially expressed miRs and lncRNAs derived from the present study could be used as diagnostic markers for LUAD, as shown in Figure 5 using data from the KMplot pan-cancer miR dataset (http://kmplot.com) [64].

4. Discussion

Our study is an attempt to deepen our understanding of epigenetic events discriminating NSCLC subtypes on the epigenetic level and inspire new directions for the design and testing of agents interfering with the cell epigenome.
To that end, we have comprehensively mapped the functional miRNA and lncRNA landscape of human (A549 and H460) and mouse (experimentally developed LUAD) NSCLC models and correlated current results with LRF/ZBTB7A expression. LRF is a BTB-ZF (broad-complex, tramtrack and bric-à-brac-zinc finger) protein, strongly implicated in epigenetic regulation of human genes including ncRNAs [3, 4]. Interestingly, ZBTB7A gene (transcribing LRF) was found to be differentially expressed in the two NSCLC subtypes that we studied: ZBTB7A was overexpressed in human A549 and mouse lung adenocarcinoma samples, but significantly underexpressed in H460 large cell carcinoma cell line (Figure 2C-D), suggesting an exceptional role of ZBTB7A expression signature in the large cell lung carcinoma. Another important result was also the upregulation of hsa-miR-148b-3p only in H460 cell line, which is predicted to target ZBTB7A-mRNA (Table 4) among other gene targets, and it is sponged by the H19- and PVT1-lncRNAs [48-50]; these traits render hsa-miR-148b-3p an attractive candidate regarding the differential regulation of ZBTB7A expression in lung large cell carcinoma. Its capability of attacking also DNMTs with other members of the miR-148/-152 family makes this molecule an essential epigenetic regulator and a novel potential target for lung cancer treatment [50]. The repressed PVT1-lncRNA levels that were detected in H460 cells are suggested to contribute to the observed hsa-miR-148b-3p upregulation and ZBTB7A downregulation, signifying the regulatory axis miR-148b-3p/PVT1-lncRNA/ZBTB7A-mRNA, that merits further research (Figure 4) and verification in human samples.
With the view of deregulated miR families associated with LRF TF (all listed in Table 4), our results showed downregulation of both hsa-miR-100-5p, member of the mammalian miR-10 family (Table 3) and ZBTB7A-mRNA levels in H460 cell line (Figure 2D). Relative lower expression of hsa-miR-100, a direct suppressor of ZBTB7A, has been positively correlated with lymph node metastasis and lager tumor size in gastric cancer implying another emerging cooperation between miRs and transcription factors [43]. Also, A549 human cell line displayed downregulation of hsa-miR-20a-5p (Table 3), member of the miR-17 mammalian family and miR17/92 cluster, implicated in lung cancer in humans [46]. Hsa-miR-15a-5p, member of miR-15 mammalian family was downregulated in both A549 and H460 cell lines (Table 3) and mmu-miR-195a-5p, member of the same family was also downregulated (Table 2). Hsa-miR-148b-3p, was upregulated only in H460 cells, which belongs to the miR-148/-152 family members (miR-148a, miR-148b, and miR-152), and its overexpression has been associated with longer overall survival of patients with NSCLC [48, 49]. Other, deregulated miR families and species either reported in research studies or predicted by miRDB [42], are discussed in the results section.
Expanding on this track, relevant lncRNA transcripts produced in NSCLC human cell lines against the physiological human cells BEAS-2B, were retrieved. MEG3- and PVT1-lncRNAs levels of expression were reduced, mainly in H460 cell line. H19-lncRNA showed insignificant differences in expression levels, DANCR-lncRNA was reduced only in A549, whereas MALAT1- and HOTAIRM1-lncRNAs were undetected in all cell lines tested. Methylation levels in CpG islands flanking 5’ end of lncRNA genes were very high (over 80%) in all lncRNAs tested in H460 cells except from MALAT1- and DANCR-lncRNAs. A549 and BEAS-2B cells displayed comparable methylation levels (Figure 3E) among CpG islands studied. A detailed discussion of our findings in relation to the literature and to the miRs detected is presented in the corresponding paragraph of the results section.
Significantly deregulated miR families between human and mouse NSCLC samples, detected by NGS and consequent bioinformatics analysis, were members of the mammalian family miR-21 namely, mmu-miR-21a and mmu-miR-21a-5p as well as hsa-miR-21 and hsa-miR-21-3p hairpin and mature forms, which were found upregulated in both NSCLC mouse tissue and A549 cell line (Figure 3A,B, Table 2 and Table 3). MiR-21 involvement in NSCLC tumorigenesis and drug resistance has already been documented in humans [26, 27]. On the other hand, members of mammalian families miR-221, miR-222 and miR-27 (hairpin and mature structures) were significantly reduced in mouse NSCLC and human H460 cells. In humans, hsa-miR-221 has been proposed as a marker for early diagnosis and NSCLC screening [28], the HMGA1/miR-222 signaling axis to regulate AKT and to act as an effective tumor suppressor pathway in lung cancer cells [29], whereas miR-27a has been shown to negatively regulate EGFR in NSCLC [30]. Other identified miR subgroups with differential expression patterns between NSCLC samples of human and mouse origin were members of family miR-34 (mmu-miR-34b and mmu-miR-34c), which were found downregulated in mouse NSCLC, while in both human NSCLC cell lines hsa-miR-34a and hsa-miR-34a-5p species, were upregulated. Furthermore, in mouse NSCLC samples, all members of the family miR-8, namely mmu-miR-141, mmu-miR-200a, mmu-miR-200b, mmu-miR200c and mmu-miR-429 were upregulated; however, all corresponding hsa-miRs of the same family, apart from miR-200b and miR-429, were downregulated in both A549 and H460 cell lines. MiR-8 family includes highly conserved miRs and some particular species are reported to be implicated in tumor growth and progression [31, 32].
Conclusevily, miR collections among human and mouse samples were highly divergent, suggesting variability in NSCLC stage and subtype, and highlighting the diverse pathways disrupted in NSCLC, further to the extended biological variations existing between origins of these mammals. A prominent connection between human NSCLC cell lines and mouse NSCLC tissue samples was the detection of deregulated miRs comprising the mammalian miR-8, miR-10 and miR-15 family members, encompassing miR species with identical seed sequences and mutual mRNA targets. In this context, deregulated expression levels of miR-10 and miR-15 family members represent a very interesting observation since they typically target ZBTB7A-mRNA (Table 4). Another important observation was that the upregulated miR species in mouse NSCLC were mainly transcribed from the 12qf1 chromosomal region encompassing a large number of miR clusters (Table 2, Figure 3C). Quantification analysis on miRs’ expression levels based on read counts per miR led to an interesting result. Mmu-miR clusters transcribed from this chromosomal area displayed gradually decreased read counts which can be attributed to the attenuation effect of RNA polymerase during transcriptional elongation but raised also intriguing research perspectives for the transcriptional regulation of this chromosomal area during the NSCLC development and progression in mice.
Direct comparisons of deregulated miR sets between human NSCLC cell lines and the physiological human bronchial epithelial cell line BEAS-2B, showed overexpressing values for miR-let-7i (hairpin and mature forms), known to have as direct target BAG-1 (Bcl−2 associated athanogene-1)-mRNA, a member of the BAG-family of co-chaperones, with motility, differentiation and apoptosis properties. However, high levels of XIST- lncRNA represses hsa-miR-let-7i expression, thus preventing BAG-1 inhibition in A549 cells [33]. Other miR-let-7 family members were significantly deregulated also, which have been reported to regulate the expression of genes involved in cell proliferation and cell cycle and to modulate GTPase-KRAS expression in malignancy [34, 35] but nevertheless, showed uncommon patterns of expression between A549 and H460 cell lines. Hsa-miR-374a-5p and hsa-miR-34a-5p were also overexpressed in both A549 and H460 cell lines. Hsa-miR-374a-5p has been associated with the TGFA (transforming growth factor-alpha) gene silencing, leading to significant inhibitory effects on proliferation, migration and invasion of malignancy [36], whereas high expression of hsa-miR-34a and hsa-miR-34c in plasma and tumor tissue of 196 NSCLC patients has been associated with prolonged overall survival and disease-free survival [38].
Decreased levels of expression in both A549 and H460 cell lines compared to BEAS-2B cells showed members of the mir-8 and mir-205 mammalian families. MiR-8 family consists of evolutionarily conserved miRNAs in two human genomic loci, miR-200b/200a/429 on chromosome 1 and miR-200c/141 on chromosome 12 and acquires significant tumor-suppressive roles in a wide array of human cancers [39]. MiR-200c/141 species deficiency promotes tumor growth and progression and also increases the metastasis frequency by recapitulating the desmoplastic lung tumor microenvironment [32]. Concerning mir-205 family members, hsa-miR-205-5p has been recently characterized as a specific prognostic biomarker, mainly for squamous cell lung carcinoma, whereas serum levels of this miR have been documented as a valuable biomarker for lung cancer diagnosis [40]. Kaplan Meier plotting tool revealed strong correlation between some of the miR and lncRNA species detected by this study and median overall survival (Figure 5) in LUAD.

5. Conclusions

This study offered a unique opportunity to study the various epigenetic aspects of KRAS-mutant NSCLC in established biological models, comprised of immortalized human cell lines (A549 and H460) and urethane-treated FVB mice.
Our study highlighted variable epigenetic features and uncovered significant relationships between different epigenetically motivated molecular biomarkers, mainly ncRNAs and TFs. Several TFs have been proved to control ncRNAs’ expression in a tissue-specific and highly-selective manner; LRF encoded by ZBTB7A gene holds an outstanding position previously documented. Results presented highlight considerations and limitations arising from the variation displayed by the experimental models utilized in NSCLC research and prospects for new applications deriving from the epigenetic view.

Supplementary Materials

The following supporting information can be downloaded at the website of this paper posted on Preprints.org, Supplementary table S1: Primer sets for Pyrosequencing (CpG) assays and qPCRs; Supplementary excel tables 2A-2D: Hairpin and mature miRs derived from A549 and H460 human cell lines; Supplementary excel table 3S: Hairpin and mature miRs derived from mouse tissues.

Author Contributions

Magda Spella: Investigation, Data curation, Writing original draft. Eleftherios Bochalis, Katerina Athanasopoulou: NGS performance, Validation, Data curation. Argyri Chroni, Irene Dereki, Giannoula Ntaliarda: Cell cultures, mice manipulations, qPCRs, Data curation. Ifigeneia Makariti, Georgios Psarias, Caterina Constantinou: Methodology, Formal analysis, Investigation. Vasiliki Chondrou: Supervision, experimental design. Argyro Sgourou: Project administration, Writing – review & editing, Funding acquisition. All authors have read and agreed to the published version of the manuscript.

Funding

This work was supported by the 80250 (ELKE_EAP) grant of the Hellenic Open University (A.S.) and the General Secretariat for Research and Innovation and Hellenic Foundation for Research and Innovation grant (M.S.).

Institutional Review Board Statement

All animal experiments were approved a priori by the Veterinary Administration of the Prefecture of Western Greece (approval numbers 3741/16.11.2010, 60291/3035/19.03.2012, and 118018/578/30.04.2014) and conducted according to Directive 2010/63/EU (http://eur-lex.europa.eu/legal-content/EN/TXT/?qid=1486710385917&uri=CELEX:32010L0063).

Informed Consent Statement

Not applicable.

Data Availability Statement

Data supporting reported results are provided as Supplementary Material.

Conflicts of Interest

Ifigeneia Makariti is financially supported by BioAnalytica SA, Biotechnology supplier company and also a member of the research team of biology HOU lab. The authors declare that they have no known competing financial interests or personal relationships that could have appeared to influence the work reported in this paper.

References

  1. Travis, W.D.; Brambilla, E.; Nicholson, A.G.; Yatabe, Y.; Austin, J.H.M.; Beasley, M.B.; et al. The 2015 World Health Organization Classification of Lung Tumors: Impact of Genetic, Clinical and Radiologic Advances Since the 2004 Classification. J Thorac Oncol 2015, 10, 1243–1260. [Google Scholar] [CrossRef] [PubMed]
  2. Cascetta, P.; Marinello, A.; Lazzari, C.; Gregorc, V.; Planchard, D.; Bianco, R.; et al. KRAS in NSCLC: State of the Art and Future Perspectives. Cancers 2022, 14. [Google Scholar] [CrossRef] [PubMed]
  3. Horie, M.; Kaczkowski, B.; Ohshima, M.; Matsuzaki, H.; Noguchi, S.; Mikami, Y.; et al. Integrative CAGE and DNA Methylation Profiling Identify Epigenetically Regulated Genes in NSCLC. Mol Cancer Res 2017, 15, 1354–1365. [Google Scholar] [CrossRef] [PubMed]
  4. Chang, A. Chemotherapy, chemoresistance and the changing treatment landscape for NSCLC. Lung Cancer 2011, 71, 3–10. [Google Scholar] [CrossRef] [PubMed]
  5. Jones, P.A.; Baylin, S.B. The fundamental role of epigenetic events in cancer. Nat Rev Genet 2002, 3, 415–428. [Google Scholar] [CrossRef] [PubMed]
  6. Sherafatian, M.; Arjmand, F. Decision tree-based classifiers for lung cancer diagnosis and subtyping using TCGA miRNA expression data. Oncol Lett 2019, 18, 2125–2131. [Google Scholar] [CrossRef] [PubMed]
  7. Chen, B.; Gao, T.; Yuan, W.; Zhao, W.; Wang, T.H.; Wu, J. Prognostic Value of Survival of MicroRNAs Signatures in Non-small Cell Lung Cancer. J Cancer 2019, 10, 5793–5804. [Google Scholar] [CrossRef] [PubMed]
  8. Hu, S.; Yuan, Y.; Song, Z.; Yan, D.; Kong, X. Expression Profiles of microRNAs in Drug-Resistant Non-Small Cell Lung Cancer Cell Lines Using microRNA Sequencing. Cell Physiol Biochem 2018, 51, 2509–2522. [Google Scholar] [CrossRef] [PubMed]
  9. Cortez, M.A.; Valdecanas, D.; Zhang, X.; Zhan, Y.; Bhardwaj, V.; Calin, G.A.; et al. Therapeutic delivery of miR-200c enhances radiosensitivity in lung cancer. Mol Ther 2014, 22, 1494–1503. [Google Scholar] [CrossRef]
  10. Ginn, L.; Shi, L.; Montagna, M.; Garofalo, M. LncRNAs in Non-Small-Cell Lung Cancer. Noncoding RNA 2020, 6. [Google Scholar] [CrossRef]
  11. Guo, Q.; Wang, J.; Gao, Y.; Li, X.; Hao, Y.; Ning, S.; Wang, P. Dynamic TF-lncRNA Regulatory Networks Revealed Prognostic Signatures in the Development of Ovarian Cancer. Front. Bioeng. Biotechnol. 2020, 8, 460. [Google Scholar] [CrossRef]
  12. Chondrou, V.; Shaukat, A.-N.; Psarias, G.; Athanasopoulou, K.; Iliopoulou, E.; Damanaki, A.; et al. LRF Promotes Indirectly Advantageous Chromatin Conformation via BGLT3-lncRNA Expression and Switch from Fetal to Adult Hemoglobin. Int. J. Mol. Sci. 2022, 23, 7025. [Google Scholar] [CrossRef] [PubMed]
  13. Gupta, S.; Singh, A.K.; Prajapati, K.S.; Kushwaha, P.P.; Shuaib, M.; Kumar, S. Emerging role of ZBTB7A as an oncogenic driver and transcriptional repressor. Cancer Lett. 2020, 483, 22–34. [Google Scholar] [CrossRef] [PubMed]
  14. Ferrer, I.; Zugazagoitia, J.; Herbertz, S.; John, W.; Paz-Ares, L.; Schmid-Bindert, G. KRAS-Mutant non-small cell lung cancer: From biology to therapy. Lung Cancer 2018, 124, 53–64. [Google Scholar] [CrossRef] [PubMed]
  15. Kanellakis, N.I.; Giannou, A.D.; Pepe, M.A.A.; Agalioti, T.; Zazara, D.E.; Giopanou, I.; et al. Tobacco chemical-induced mouse lung adenocarcinoma cell lines pin the prolactin orthologue proliferin as a lung tumour promoter. Carcinogenesis 2019, 40, 1352–1362. [Google Scholar] [CrossRef] [PubMed]
  16. Spella, M.; Lilis, I.; Pepe, M.A.; Chen, Y.; Armaka, M.; Lamort, A.S.; et al. Club cells form lung adenocarcinomas and maintain the alveoli of adult mice. eLife 2019, 8. [Google Scholar] [CrossRef]
  17. Aftabi, Y.; Ansarin, K.; Shanehbandi, D.; Khalili, M.; Seyedrezazadeh, E.; Rahbarnia, L.; et al. Long non-coding RNAs as potential biomarkers in the prognosis and diagnosis of lung cancer: A review and target analysis. IUBMB Life 2021, 73, 307–327. [Google Scholar] [CrossRef] [PubMed]
  18. Chen, Z.; Lei, T.; Chen, X.; Gu, J.; Huang, J.; Lu, B.; Wang, Z. Long non-coding RNA in lung cancer. Clin. Chim. Acta; Int. J. Clin. Chem. 2020, 504, 190–200. [Google Scholar] [CrossRef] [PubMed]
  19. Entezari, M.; Ghanbarirad, M.; Taheriazam, A.; Sadrkhanloo, M.; Zabolian, A.; Goharrizi, M.; et al. Long non-coding RNAs and exosomal lncRNAs: Potential functions in lung cancer progression, drug resistance and tumor microenvironment remodeling. Biomed. Pharmacother. Biomed. Pharmacother. 2022, 150, 112963. [Google Scholar] [CrossRef]
  20. Fang, C.; Wang, L.; Gong, C.; Wu, W.; Yao, C.; Zhu, S. Long non-coding RNAs: How to regulate the metastasis of non-small-cell lung cancer. J. Cell. Mol. Med. 2020, 24, 3282–3291. [Google Scholar] [CrossRef]
  21. Guo, T.; Li, J.; Zhang, L.; Hou, W.; Wang, R.; Zhang, J.; Gao, P. Multidimensional communication of microRNAs and long non-coding RNAs in lung cancer. J. Cancer Res. Clin. Oncol. 2019, 145, 31–48. [Google Scholar] [CrossRef] [PubMed]
  22. Liu, T.; Han, C.; Fang, P.; Zhu, H.; Wang, S.; Ma, Z.; et al. Long non-coding RNAs in lung cancer: implications for lineage plasticity-mediated TKI resistance. Cell. Mol. Life Sci. : CMLS 2021, 78, 1983–2000. [Google Scholar] [CrossRef] [PubMed]
  23. Albarino, C.G.; Romanowski, V. Phenol extraction revisited: a rapid method for the isolation and preservation of human genomic DNA from whole blood. Mol. Cell. Probes 1994, 8, 423–427. [Google Scholar] [CrossRef] [PubMed]
  24. Vlaikou, A.M.; Kouroupis, D.; Sgourou, A.; Markopoulos, G.S.; Bagli, E.; Markou, M.; et al. Mechanical stress affects methylation pattern of GNAS isoforms and osteogenic differentiation of hAT-MSCs. Biochim. Et Biophys. Acta Mol. Cell Res. 2017, 1864, 1371–1381. [Google Scholar] [CrossRef] [PubMed]
  25. Livak, K.J.; Schmittgen, T.D. Analysis of relative gene expression data using real-time quantitative PCR and the 2(-Delta Delta C(T)) Method. Methods 2001, 25, 402–408. [Google Scholar] [CrossRef]
  26. Pfaffl, M.W. A new mathematical model for relative quantification in real-time RT-PCR. Nucleic Acids Res. 2001, 29, e45. [Google Scholar] [CrossRef]
  27. Andrews, S. FastQC: A Quality Control Tool for High Throughput Sequence Data [Online] Available online at:2010. Available online: http://www.bioinformatics.babraham.ac.uk/projects/fastqc/.
  28. Smith, T.; Heger, A.; Sudbery, I. UMI-tools: modeling sequencing errors in Unique Molecular Identifiers to improve quantification accuracy. Genome Res. 2017, 27, 491–499. [Google Scholar] [CrossRef] [PubMed]
  29. Martin, M. Cutadapt removes adapter sequences from high-throughput sequencing reads. EMBnet. J. 2011, 17, 3. [Google Scholar] [CrossRef]
  30. Langmead, B.; Salzberg, S.L. Fast gapped-read alignment with Bowtie 2. Nat. Methods 2012, 9, 357–359. [Google Scholar] [CrossRef]
  31. Kozomara, A.; Birgaoanu, M.; Griffiths-Jones, S. miRBase: from microRNA sequences to function. Nucleic Acids Res. 2019, 47, D155–D62. [Google Scholar] [CrossRef]
  32. Danecek, P.; Bonfield, J.K.; Liddle, J.; Marshall, J.; Ohan, V.; Pollard, M.O.; et al. Twelve years of SAMtools and BCFtools. GigaScience 2021, 10. [Google Scholar] [CrossRef] [PubMed]
  33. Anders, S.; Pyl, P.T.; Huber, W. HTSeq--a Python framework to work with high-throughput sequencing data. Bioinformatics 2015, 31, 166–169. [Google Scholar] [CrossRef] [PubMed]
  34. Love, M.I.; Huber, W.; Anders, S. Moderated estimation of fold change and dispersion for RNA-seq data with DESeq2. Genome Biol. 2014, 15, 550. [Google Scholar] [CrossRef] [PubMed]
  35. Hong, D.S.; Kang, Y.K.; Borad, M.; Sachdev, J.; Ejadi, S.; Lim, H.Y.; et al. Phase 1 study of MRX34, a liposomal miR-34a mimic, in patients with advanced solid tumours. Br. J. Cancer 2020, 122, 1630–1637. [Google Scholar] [CrossRef]
  36. Zhong, S.; Golpon, H.; Zardo, P.; Borlak, J. miRNAs in lung cancer. A Syst. Rev. Identifies Predict. Progn. Mirna Candidates Precis. Med. Lung Cancer. Transl. Res. 2021, 230, 164–196. [Google Scholar]
  37. Chen, Y.; Wang, X. miRDB: an online database for prediction of functional microRNA targets. Nucleic Acids Res. 2020, 48, D127–D31. [Google Scholar] [CrossRef] [PubMed]
  38. Tehler, D.; Høyland-Kroghsbo, N.M.; Lund, A.H. The miR-10 microRNA precursor family. RNA Biol. 2011, 8, 728–734. [Google Scholar] [CrossRef]
  39. Hojo, N.; Tatsumi, N.; Moriguchi, N.; Matsumura, A.; Morimoto, S.; Nakata, J.; et al. A Zbtb7a proto-oncogene as a novel target for miR-125a. Mol. Carcinog. 2016, 55, 2001–2009. [Google Scholar] [CrossRef]
  40. Zhang, X.; Li, Y.; Qi, P.; Ma, Z. Biology of MiR-17-92 Cluster and Its Progress in Lung Cancer. Int. J. Med. Sci. 2018, 15, 1443–1448. [Google Scholar] [CrossRef]
  41. Pitto, L.; Ripoli, A.; Cremisi, F.; Simili, M.; Rainaldi, G. microRNA(interference) networks are embedded in the gene regulatory networks. Cell Cycle 2008, 7, 2458–2461. [Google Scholar] [CrossRef]
  42. Lee, B.B.; Kim, D.; Kim, Y.; Han, J.; Shim, Y.M.; Kim, D.H. Metformin regulates expression of DNA methyltransferases through the miR-148/-152 family in non-small lung cancer cells. Clin. Epigenetics 2023, 15, 48. [Google Scholar] [CrossRef]
  43. Hao, Y.; Xi, J.; Peng, Y.; Bian, B.; Hao, G.; Xi, Y.; Zhang, Z. Circular RNA Circ_0016760 Modulates Non-Small-Cell Lung Cancer Growth Through the miR-577/ZBTB7A Axis. Cancer Manag. Res. 2020, 12, 5561–5574. [Google Scholar] [CrossRef] [PubMed]
  44. Zhijun, Z.; Jingkang, H. MicroRNA-520e suppresses non-small-cell lung cancer cell growth by targeting Zbtb7a-mediated Wnt signaling pathway. Biochem. Biophys. Res. Commun. 2017, 486, 49–56. [Google Scholar] [CrossRef] [PubMed]
  45. Liang, X.; Zhao, Q.; Geng, T.; Luo, S.; He, Q. MiR-106b regulates the apoptosis and tumorigenesis of hepatocellular carcinoma via targeting Zinc finger and BTB domain-containing protein 7A (Zbtb7a). J. Biochem. Mol. Toxicol. 2018, 32, e22169. [Google Scholar] [CrossRef]
  46. Liu, J.; Chou, Z.; Li, C.; Huang, K.; Wang, X.; Li, X.; et al. ZBTB7A, a miR-144-3p targeted gene, accelerates bladder cancer progression via downregulating HIC1 expression. Cancer Cell Int. 2022, 22, 179. [Google Scholar] [CrossRef] [PubMed]
  47. Apostolopoulou, K.; Pateras, I.S.; Evangelou, K.; Tsantoulis, P.K.; Liontos, M.; Kittas, C.; et al. Gene amplification is a relatively frequent event leading to ZBTB7A (Pokemon) overexpression in non-small cell lung cancer. J. Pathol. 2007, 213, 294–302. [Google Scholar] [CrossRef] [PubMed]
  48. Shi, D.B.; Wang, Y.W.; Xing, A.Y.; Gao, J.W.; Zhang, H.; Guo, X.Y.; Gao, P. C/EBPα-induced miR-100 expression suppresses tumor metastasis and growth by targeting ZBTB7A in gastric cancer. Cancer Lett. 2015, 369, 376–385. [Google Scholar] [CrossRef] [PubMed]
  49. Jiao, D.; Yan, Y.; Shui, S.; Wu, G.; Ren, J.; Wang, Y.; Han, X. miR-106b regulates the 5-fluorouracil resistance by targeting Zbtb7a in cholangiocarcinoma. Oncotarget 2017, 8, 52913–52922. [Google Scholar] [CrossRef] [PubMed]
  50. Liu, J.; Wan, L.; Lu, K.; Sun, M.; Pan, X.; Zhang, P.; et al. The Long Noncoding RNA MEG3 Contributes to Cisplatin Resistance of Human Lung Adenocarcinoma. PloS ONE 2015, 10, e0114586. [Google Scholar] [CrossRef]
  51. Lv, D.; Bi, Q.; Li, Y.; Deng, J.; Wu, N.; Hao, S.; Zhao, M. Long non-coding RNA MEG3 inhibits cell migration and invasion of non-small cell lung cancer cells by regulating the miR-21-5p/PTEN axis. Mol. Med. Rep. 2021, 23. [Google Scholar] [CrossRef]
  52. Zhou, Y.; Sheng, B.; Xia, Q.; Guan, X.; Zhang, Y. Association of long non-coding RNA H19 and microRNA-21 expression with the biological features and prognosis of non-small cell lung cancer. Cancer Gene Ther. 2017, 24, 317–324. [Google Scholar] [CrossRef] [PubMed]
  53. Zhao, Y.; Wang, W.; Guan, C.; Hu, Z.; Liu, L.; Li, W.; Jiang, X. Long noncoding RNA HOTAIRM1 in human cancers. Clin. Chim. Acta; Int. J. Clin. Chem. 2020, 511, 255–259. [Google Scholar] [CrossRef] [PubMed]
  54. Gu, D.; Tong, M.; Wang, J.; Zhang, B.; Liu, J.; Song, G.; Zhu, B. Overexpression of the lncRNA HOTAIRM1 promotes lenvatinib resistance by downregulating miR-34a and activating autophagy in hepatocellular carcinoma. Discov. Oncol. 2023, 14, 66. [Google Scholar] [CrossRef] [PubMed]
  55. Feng, C.; Zhao, Y.; Li, Y.; Zhang, T.; Ma, Y.; Liu, Y. LncRNA MALAT1 Promotes Lung Cancer Proliferation and Gefitinib Resistance by Acting as a miR-200a Sponge. Arch. De Bronconeumol. 2019, 55, 627–633. [Google Scholar] [CrossRef] [PubMed]
  56. Song, J.; Su, Z.Z.; Shen, Q.M. Long non-coding RNA MALAT1 regulates proliferation, apoptosis, migration and invasion via miR-374b-5p/SRSF7 axis in non-small cell lung cancer. Eur. Rev. Med. Pharmacol. Sci. 2020, 24, 1853–1862. [Google Scholar] [PubMed]
  57. Xu, Y.; Liu, H.; Xiong, W.; Peng, Y.; Li, X.; Long, X. A novel mechanism regulating pyroptosis-induced fibrosis in endometriosis via lnc-MALAT1/miR-141-3p/NLRP3 pathway. Biology of reproduction. 2023. [Google Scholar] [CrossRef]
  58. Esposito, R.; Polidori, T.; Meise, D.F.; Pulido-Quetglas, C.; Chouvardas, P.; Forster, S.; et al. Multi-hallmark long noncoding RNA maps reveal non-small cell lung cancer vulnerabilities. Cell Genom. 2022, 2, 100171. [Google Scholar] [CrossRef]
  59. Chen, Y.R.; Wu, Y.S.; Wang, W.S.; Zhang, J.S.; Wu, Q.G. Upregulation of lncRNA DANCR functions as an oncogenic role in non-small lung cancer by regulating miR-214-5p/CIZ1 axis. Eur. Rev. Med. Pharmacol. Sci. 2020, 24, 2539–2547. [Google Scholar]
  60. He, F.; Song, Z.; Chen, H.; Chen, Z.; Yang, P.; Li, W.; et al. Long noncoding RNA PVT1-214 promotes proliferation and invasion of colorectal cancer by stabilizing Lin28 and interacting with miR-128. Oncogene 2019, 38, 164–179. [Google Scholar] [CrossRef]
  61. Qi, G.; Li, L. Long non-coding RNA PVT1 contributes to cell growth and metastasis in non-small-cell lung cancer by regulating miR-361-3p/SOX9 axis and activating Wnt/β-catenin signaling pathway. Biomed. Pharmacother. = Biomed. Pharmacother. 2020, 126, 110100. [Google Scholar] [CrossRef]
  62. Wei, C.M.; Zhao, X.F.; Qiu, H.B.; Ming, Z.; Liu, K.; Yan, J. The long non-coding RNA PVT1/miR-145-5p/ITGB8 axis regulates cell proliferation, apoptosis, migration and invasion in non-small cell lung cancer cells. Neoplasma 2020, 67, 802–812. [Google Scholar] [CrossRef] [PubMed]
  63. Xi, Y.; Shen, W.; Jin, C.; Wang, L.; Yu, B. PVT1 Promotes the Proliferation and Migration of Non-Small Cell Lung Cancer via Regulating miR-148/RAB34 Signal Axis. OncoTargets Ther. 2020, 13, 1819–1832. [Google Scholar] [CrossRef] [PubMed]
  64. Győrffy, B. Discovery and ranking of the most robust prognostic biomarkers in serous ovarian cancer. GeroScience 2023. [Google Scholar] [CrossRef] [PubMed]
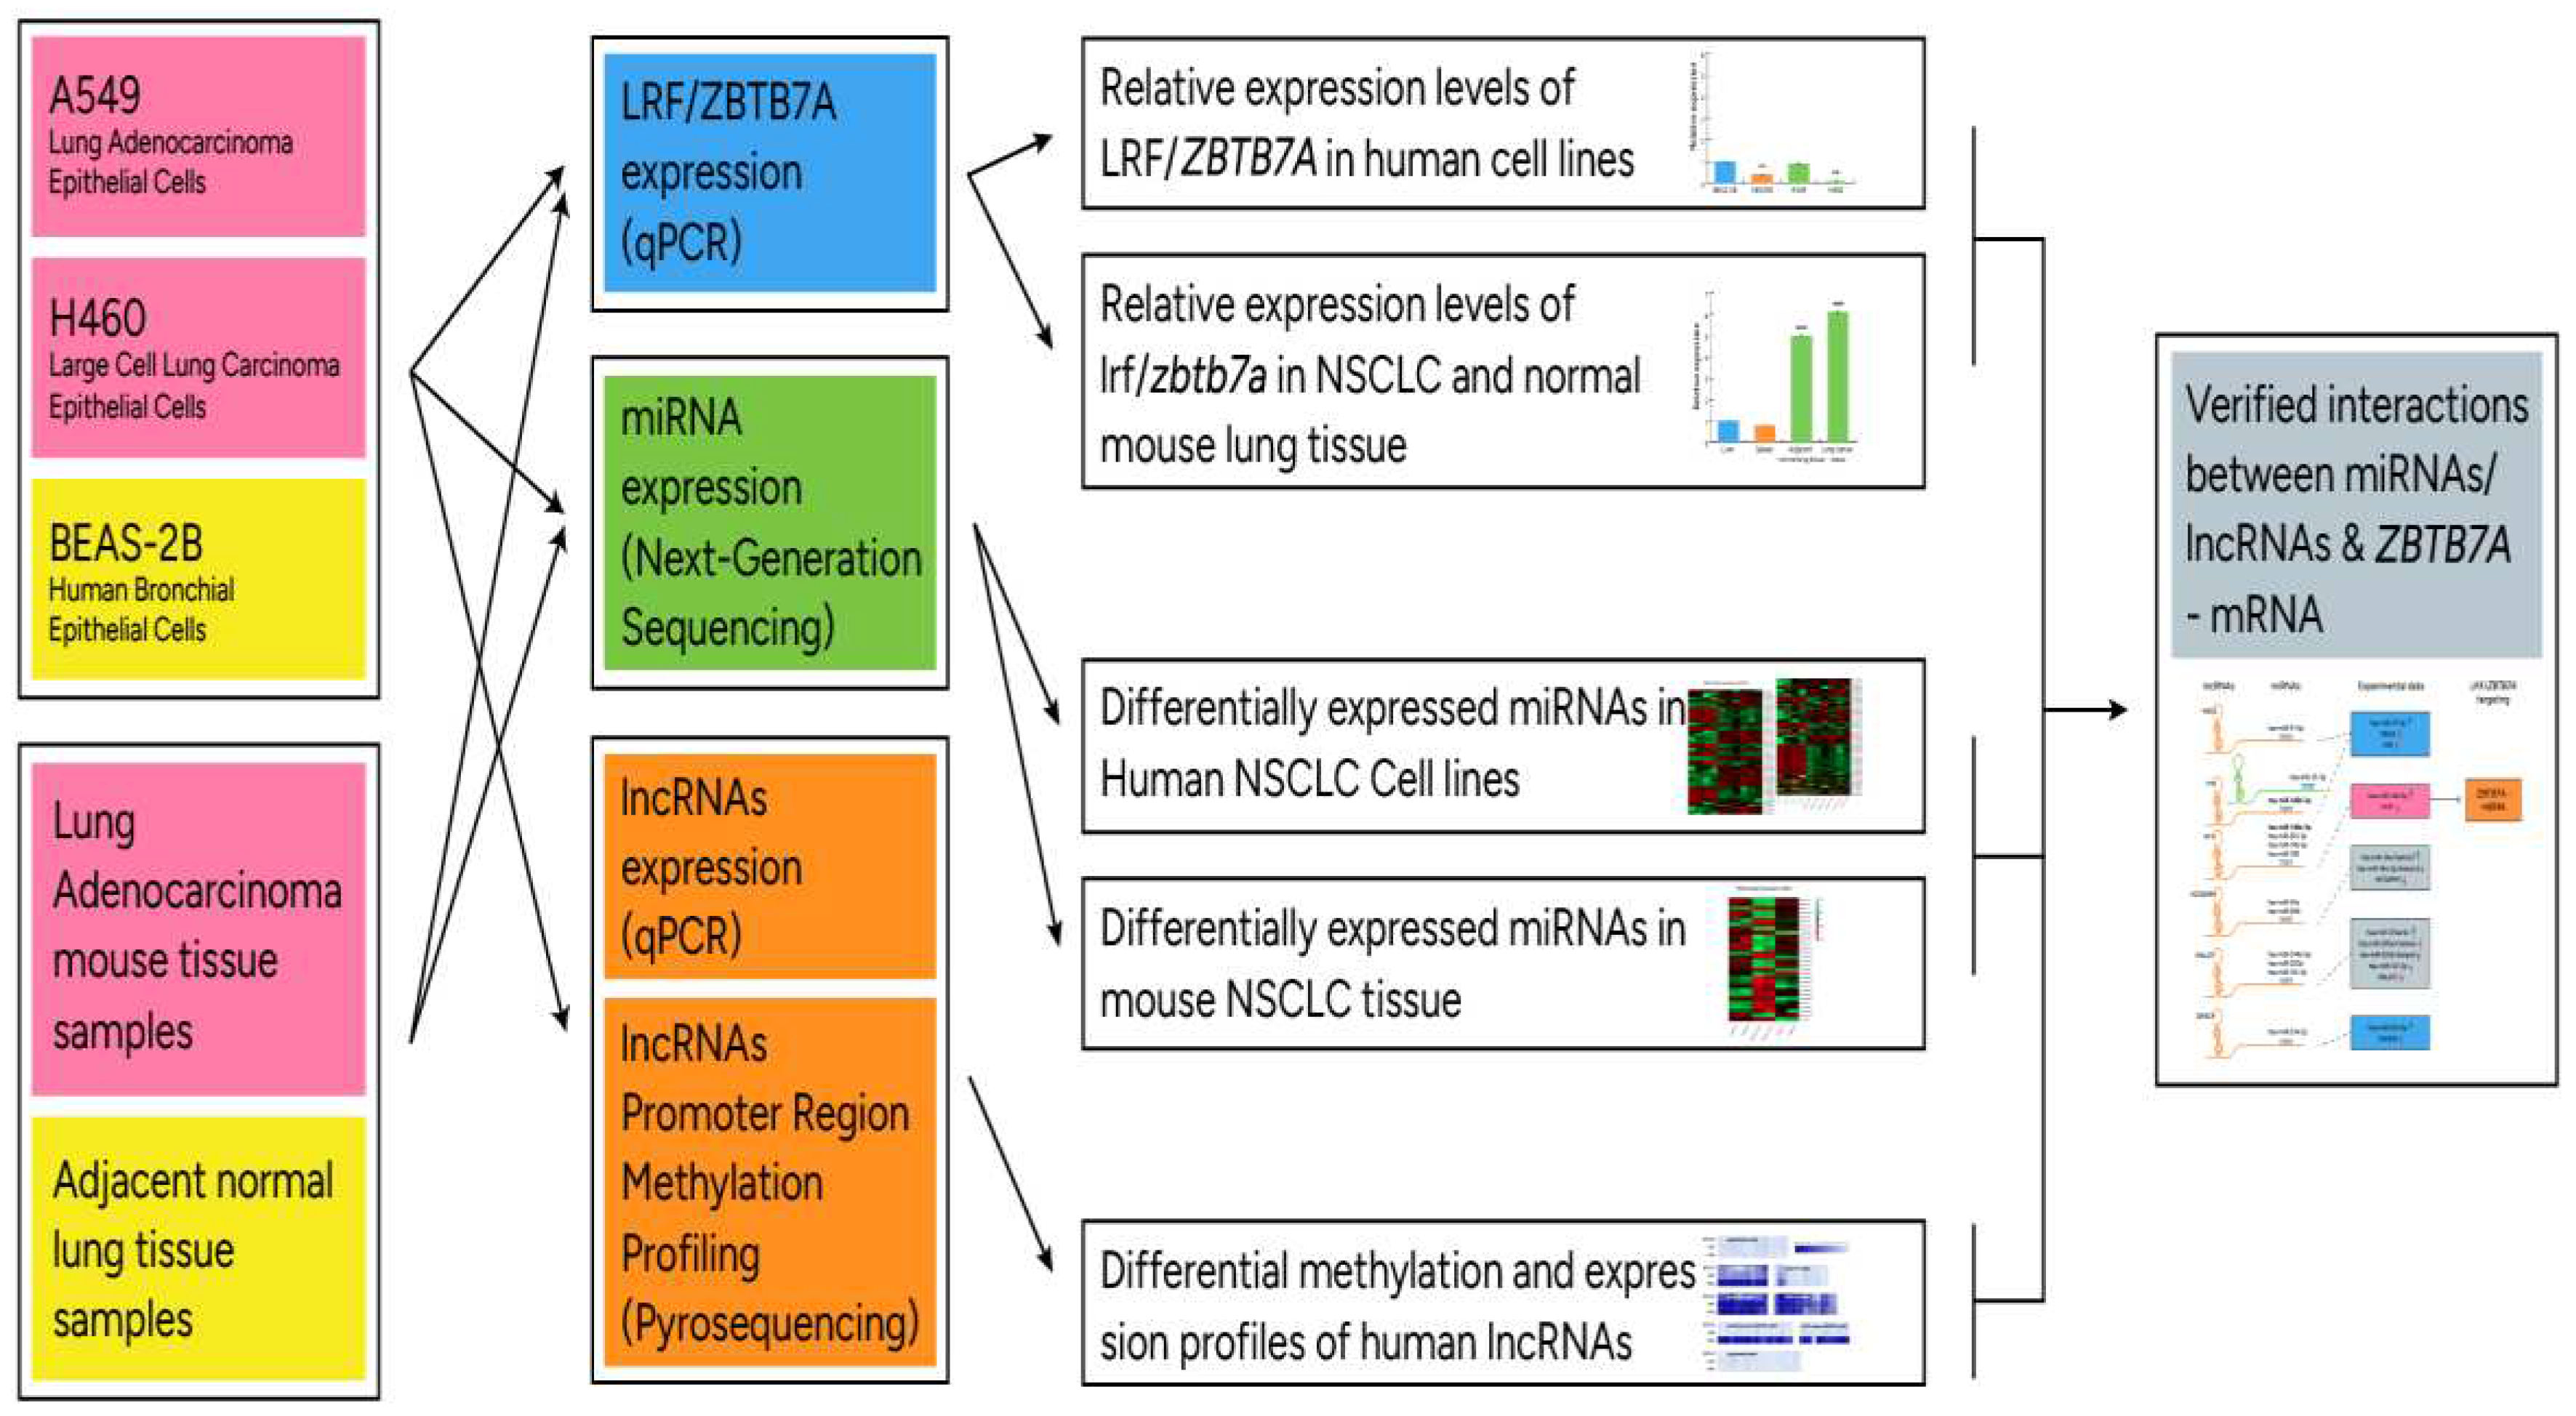
Figure 1. Flow diagram of experimental processes performed with different experimental models of the study.
Preprints 88927 g001
Figure 3. (A) Heatmap of mature mmu-miR profile comparisons between mouse NSCLC and normal lung tissue. Each column represents an RNA sample, and each row represents a single miR. NLT: Normal Lung Tissue (Sample 1 to 4), NSCLC_2A-4B: RNA samples originating from different mice with Non-Small Cell Lung Carcinoma (NSCLC). (B) Heatmap presenting differentially expressed mature forms of hsa-miRs derived from human cell lines A540 and H460 compared to normal epithelial cells BEAS-2B. The A and B sample types refer to the technical replicates used in the NGS analysis. The color scale in both heatmaps shows the relative miR expression level in certain slide: green indicates high relative expression levels; red indicates low relative expression levels. (C) Mouse chromosomal location 12qf1 [UCSC genome browser on Mouse (GRCm38/mm10)] encompassing miR clusters overexpressed in NSCLC tissue (Table 2). miRs in dark green are detected in our study as significantly upregulated, miRs in light green are detected but not differentially expressed with statistical significance (compared to normal lung tissue) and black are miR species below limit of detection.
Preprints 88927 g003
Figure 4. Interplay of lncRNA/miRNAs and ZBTB7A- mRNA in human NSCLC KRAS mutant cell lines A549 and H460, derived from the present study.
Preprints 88927 g004
Figure 5. miR and lncRNA species produced by this study as biomarkers of lung adenocarcinoma. Kaplan-Meier survival plots with median overall survival (OS), hazard ratios (HR) with 95% confidence interval, and univariate log-rank probability values (P) from 513 patients with lung adenocarcinoma, stratified into low (black) and high (red) miRs and lncRNAs expression by the optimal cut-offs indicated. Data from Kmplot (http://kmplot.com).
Preprints 88927 g005
Table 1. Human lncRNAs and CpG chromosomal locations analyzed.
lncRNA gene CpG island Region analyzed
DANCR 93 Chr4: 52712612-52712726
H19 36 Chr11:1996329-1996211
HOTAIRM1
upstream
116 Chr7:27095663-27095791
HOTAIRM1
downstream
116 Chr7: 27096410-27096495
MALAT1 50 Chr11:65497584-65497709
MEG3 45 Chr14:100826116-100826218
MEG3 78 Chr14:100827449-100827521
PVT1 94 Chr8:127794107-127794229
Table 2. Hairpin and mature deregulated mouse miRs found by NGS analysis with the respective family and cluster, according to miRBase. Chromosomal locations refer to miR clusters.
miR hairpin Mature miR Gene family miR cluster Chromosomal location
UPREGULATED mmu-mir-200b mmu-mir-200b-3p mir-8 mmu-mir-200b
mmu-mir-200a
mmu-mir-429
chr4: 156055681-156055750 [-]
chr4: 156054896-156054985 [-]
chr4: 156053905-156053987 [-]
mmu-mir-200a mmu-mir-200a-3p
mmu-mir-429 mmu-mir-429-3p
mmu-mir-200c mmu-mir-200c-3p mmu-mir-200c
mmu-mir-141
chr6: 124718322-124718390 [-]
chr6: 124717914-124717985 [-]
mmu-mir-141 mmu-mir-141-5p
mmu-mir-141-3p
mmu-mir-379 mmu-mir-379-5p mir-379 *mmu-mir-379
mmu-mir-411
mmu-mir-299a
mmu-mir-299b
mmu-mir-380
mmu-mir-1197
mmu-mir-323
mmu-mir-758
mmu-mir-329
mmu-mir-494
mmu-mir-679
mmu-mir-1193
mmu-mir-666
mmu-mir-543
mmu-mir-495
mmu-mir-667
mmu-mir-376c
mmu-mir-654
mmu-mir-376b
mmu-mir-376a
mmu-mir-300
mmu-mir-381
mmu-mir-487b
mmu-mir-539
mmu-mir-544
mmu-mir-382
mmu-mir-134
mmu-mir-668
mmu-mir-485
mmu-mir-453
mmu-mir-154
mmu-mir-496a
mmu-mir-377
mmu-mir-541
mmu-mir-409
mmu-mir-412
mmu-mir-369
mmu-mir-410
mmu-mir-3072
chr12: 109709060-109709125 [+]
chr12: 109710175-109710256 [+]
chr12: 109710638-109710700 [+]
chr12: 109710645-109710693 [-]
chr12: 109711803-109711863 [+]
chr12: 109712317-109712436 [+]
chr12: 109712508-109712593 [+]
chr12: 109712810-109712890 [+]
chr12: 109713481-109713577 [+]
chr12: 109715318-109715402 [+]
chr12: 109715577-109715650 [+]
chr12: 109715671-109715791 [+]
chr12: 109717085-109717183 [+]
chr12: 109717258-109717333 [+]
chr12: 109718754-109718816 [+]
chr12: 109720006-109720097 [+]
chr12: 109722718-109722803 [+]
chr12: 109723218-109723301 [+]
chr12: 109723458-109723539 [+]
chr12: 109723781-109723848 [+]
chr12: 109724313-109724391 [+]
chr12: 109726822-109726896 [+]
chr12: 109727333-109727414 [+]
chr12: 109728129-109728202 [+]
chr12: 109729325-109729402 [+]
chr12: 109733771-109733846 [+]
chr12: 109734139-109734209 [+]
chr12: 109734732-109734797 [+]
chr12: 109734902-109734974 [+]
chr12: 109735619-109735700 [+]
chr12: 109738433-109738498 [+]
chr12: 109739119-109739197 [+]
chr12: 109740510-109740577 [+]
chr12: 109742409-109742498 [+]
chr12: 109743158-109743236 [+]
chr12: 109743289-109743368 [+]
chr12: 109743418-109743496 [+]
chr12: 109743715-109743795 [+]
chr12: 109747878-109474960 [+]
mmu-mir-411 mmu-mir-411-5p
mmu-mir-299a mmu-mir-299a-5p
mmu-mir-299a-3p
mir-299
mmu-mir-376c mmu-mir-376c-3p mir-367
mmu-mir-376b mmu-mir-376b-5p
mmu-mir-376b-3p
mmu-mir-376a mmu-mir-376a-3p
mmu-mir-134 mmu-mir-134-5p mir-134
mmu-mir-300 mmu-mir-300-3p mir-154
mmu-mir-381 mmu-mir-381-3p
mmu-mir-382 mmu-mir-382-5p
mmu-mir-154 mmu-mir-154-5p
mmu-mir-377 mmu-mir-377-3p
mmu-mir-369 mmu-mir-369-5p
mmu-mir-369-3p
mmu-mir-409 mmu-mir-409-5p
mmu-mir-409-3p
mmu-mir-494 mmu-mir-494-3p
mmu-mir-541 mmu-mir-541-5p mir-541
mmu-mir-329 mmu-mir-329-5p
mir-329
mmu-mir-1193 mmu-mir-1193-3p mir-1193
mmu-mir-337 mmu-mir-337-5p
mmu-mir-337-3p
mir-337 mmu-mir-337
mmu-mir-3544
mmu-mir-540
mmu-mir-665
mmu-mir-3070-1
mmu-mir-3070-2
mmu-mir-431
mmu-mir-433
mmu-mir-127
mmu-mir-434
mmu-mir-432
mmu-mir-3071
mmu-mir-136
chr12: 109585789-109585885 [+]
chr12: 109585813-109585873 [-]
chr12: 109586080-109586146 [+]
chr12: 109586314-109586407 [+]
chr12: 109587943-109588031 [+]
chr12: 109588592-109588680 [+]
chr12: 109590447-109590537 [+]
chr12: 109591715-109591838 [+]
chr12: 109592846-109592915 [+]
chr12: 109594506-109594599 [+]
chr12: 109594956-109595030 [+]
chr12: 109595318-109595397 [-]
chr12: 109595327-109595388 [+]
mmu-mir-3544 mir-3544
mmu-mir-540
mir-540
mmu-mir-127 mmu-mir-127-5p
mmu-mir-127-3p
mir-127
mmu-mir-434 mmu-mir-434-5p
mmu-mir-434-3p
mir-434
mmu-mir-431 mmu-mir-431-5p mir-431
mmu-mir-136 mmu-mir-136-3p
mmu-mir-136-5p
mir-136
mmu-mir-3071 no family
mmu-mir-19b-1
mmu-mir-19b-2
mmu-mir-19b-3p miR-19 mmu-miR-17
mmu-miR-18a
mmu-miR-19a
mmu-miR-20a
mmu-miR-19b-1
mmu-miR-92a-1
chr14: 115043671-115043754 [+]
chr14: 115043851-115043946 [+]
chr14: 115044000-115044081 [+]
chr14: 115044157-115044263 [+]
chr14: 115044305-115044391 [+]
chr14: 115044427-115044506 [+]
mmu-mir-31 mmu-mir-31-5p mir-31 mmu-mir-31 chr4: 88910557-88910662 [-]
mmu-mir-146b mmu-miR-146b-5p mir-146 mmu-miR-146b chr19: 46342762-46342870 [+]
mmu-mir-21a mmu-miR-21a-5p mir-21 mmu-miR-21a chr11: 86584067-86584158 [-]
mmu-mir-32 mmu-mir-32-5p mir-32 mmu-mir-32 chr4: 56895226-56895298 [-]
mmu-mir-96 mmu-mir-96-5p mir-96 mmu-mir-183
mmu-mir-96
mmu-mir-182
chr6: 30169668-30169737 [-]
chr6: 30169446-30169551 [-]
chr6: 30165918-30165992 [-]
mmu-mir-208b mmu-mir-208b-3p mir-208 mmu-mir-208b chr14: 54975700-54975776 [-]
mmu-mir-341 mmu-mir-341-3p mir-341 mmu-mir-341
mmu-mir-1188
mmu-mir-370
chr12: 109611500-109611595 [+]
chr12: 109611822-109611941 [+]
chr12: 109618258-109618336 [+]
mmu-mir-674 mmu-mir-674-5p mir-674 mmu-mir-674 chr2: 117185127-117185226 [+]
mmu-mir-184 mmu-mir-184-3p mir-184 mmu-mir-184 chr9: 89802260-89802328 [-]
DOWNREGULATED mmu-mir-126a mmu-mir-126a-3p mir-126 mmu-mir-126a
mmu-mir-126b
chr2: 26591357-26591429 [+]
chr2: 26591363-26591420 [-]
mmu-mir-126a-5p
mmu-mir-126b mmu-mir-126b-3p
mmu-mir-126b-5p
mmu-mir-142a mmu-mir-142a-3p
mmu-mir-142a-5p
mir-142 mmu-mir-142a
mmu-mir-142b
chr11: 87756864-87756927 [+]
chr11: 87756841-87756955 [-]
mmu-mir-143 mmu-mir-143-3p
mmu-mir-143-5p
mir-143 mmu-mir-143
mmu-mir-145a
chr18: 61649196-61649258 [-]
chr18: 61647825-61647894 [-]
mmu-mir-145a mmu-mir-145a-5p
mmu-mir-145a-3p
mir-145
mmu-mir-199b mmu-mir-199b-3p
mmu-mir-199b-5p
mir-199 mmu-mir-3154
mmu-mir-199b
chr2: 32318265-32318343 [+]
chr2: 32318460-32318569 [+]
mmu-mir-199a-1
mmu-mir-199a-2
mmu-mir-199a-3p
mmu-mir-199a-5p
mmu-mir-199a-2
mmu-mir-214
chr1: 162217814-162217923 [+]
chr1: 162223368-162223477 [+]
mmu-mir-10a mmu-mir-10a-5p mir-10 mmu-mir-10a chr11: 96317165-96317274 [+]
mmu-mir-146a mmu-mir-146a-5p mir-146 mmu-mir-146a chr11: 43374397-43374461 [-]
mmu-mir-497a mmu-mir-497a-5p mir-497 mmu-mir-497b
mmu-mir-497a
mmu-mir-195a
chr11: 70234692-70234816 [-]
chr11: 70234717-70234800 [+]
chr11: 70235042-70235135 [+]
mmu-mir-497b
mmu-mir-195a mmu-mir-195a-5p mir-15
mmu-mir-335 mmu-mir-335-5p mir-335 mmu-mir-335 chr6: 30741299-30741396 [+]
mmu-mir-365-1
mmu-mir-365-2
mmu-mir-365-3p mir-365 mmu-mir-193b
mmu-mir-365-1
chr16: 13449523-13449601 [+]
chr16: 13453840-13453926 [+]
mmu-mir-150 mmu-mir-150-5p mir-150 mmu-mir-150
mmu-mir-5121
chr7: 45121757-45121821 [+]
chr7: 45126918-45126991 [-]
mmu-mir-181a-1
mmu-mir-181a-2
mmu-mir-181a-5p mir-181 mmu-mir-181a-1
mmu-mir-181a-2
chr1: 137966455-137966541 [+]
chr2: 38852735-38852810 [+]
mmu-mir-23a mmu-mir-23a-3p mir-23 mmu-mir-23a
mmu-mir-27a
mmu-mir-24-2
mmu-mir-3074-2
chr8: 84208518-84208592 [+]
chr8: 84208672-84208758 [+]
chr8: 84208815-84208921 [+]
chr8: 84208825-84208907 [-]
mmu-mir-27a mmu-mir-27a-3p mir-27
mmu-mir-3074-5p mir-3074
mmu-mir-144
mmu-mir-451a
mmu-mir-451b
mmu-mir-144-3p
mmu-mir-451a
mir-451 mmu-mir-144
mmu-mir-451b
mmu-mir-451a
chr11: 78073005-78073070 [+]
chr11: 78073170-78073241 [-]
chr11: 78073170-78073241 [+]
mmu-mir-222 mmu-mir-222-3p mir-221 mmu-mir-222
mmu-mir-221
chrX: 19146893-19146971 [-]
chrX: 19146294-19146388 [-]
mmu-mir-221 mmu-mir-221-3p
mmu-mir-223 mmu-mir-223-3p mir-223 mmu-mir-223 chrX: 96242817-96242926 [+]
mmu-mir-34b
mmu-mir-34c
mmu-mir-34b-5p
mmu-mir-34c-5p
mir-34 mmu-mir-34b
mmu-mir-34c
chr9: 51103562-51103645 [-]
chr9: 51103034-51103110 [-]
mmu-mir-3065 mir-3065 mmu-mir-3065
mmu-mir-338
chr11: 120014767-120014853 [+]
chr11: 120014765-120014862 [-]
mmu-mir-338-3p mir-338
mmu-mir-140 mmu-mir-140-3p
mmu-mir-140-5p
mir-140 mmu-mir-140 chr8: 107551244-107551313 [+]
mmu-mir-187-3p mir-187 mmu-mir-187 chr18: 24429110-24429170 [-]
* Clusters of upregulated miRs are almost entirely included within 40kb chromosomal area 12qf1: 109,709,060-109,747,9 (also illustrated in Figure 3C).
Table 3. Hairpin and mature deregulated human miRs found by NGS analysis with the respective family and cluster, according to miRBase. Chromosomal locations refer to miR clusters.
A549 vs BEAS-2B H460 vs BEAS-2B
miR hairpin Mature miR miR family miR cluster Chromosomal location miR hairpin Mature miR miR family miR cluster Chromosomal location
UPREGULATED hsa-mir-34a hsa-mir-34a-5p mir-34 hsa-mir-34a chr1: 9151668-9151777 [-] hsa-mir-7-1
hsa-mir-7-2
hsa-mir-7-3
hsa-mir-7-5p mir-7 hsa-mir-7-5p chr9: 83969748-83969857 [-]
hsa-mir-23b mir-27 hsa-mir-23b
hsa-mir-27b
hsa-mir-3074
hsa-mir-24-1
chr9: 95085208-95085304 [+]
chr9: 95085445-95085541 [+]
chr9: 95086014-95086094 [-]
chr9: 95086021-95086088 [+]
hsa-mir-182 hsa-mir-182-5p mir-182 hsa-mir-183
hsa-mir-96
hsa-mir-182
chr7: 129774905-129775014 [-]
chr7: 129774692-129774769 [-]
chr7: 129770383-129770492 [-]
hsa-mir-27b hsa-mir-27b-3p hsa-mir-3529 hsa-mir-3529-3p mir-3529 hsa-mir-3529
hsa-mir-7-2
hsa-mir-1179
chr15: 88611847-88611924 [-]
chr15: 88611825-88611934 [+]
chr15: 88608107-88608197 [+]
hsa-mir-21 hsa-mir-21-5p
hsa-mir-21-3p
mir-21 hsa-mir-21 chr17: 59841266-59841337 [+] hsa-mir-155 hsa-mir-155-5p mir-155 hsa-mir-155 chr21: 25573980-25574044 [+]
hsa-mir-374a hsa-mir-374a-5p mir-374 hsa-mir-374a
hsa-mir-545
chrX: 74287286-74287357 [-]
chrX: 74287104-74287209 [-]
hsa-mir-374a hsa-mir-374a-5p mir-374 hsa-mir-374a
hsa-mir-545
chrX: 74287286-74287357 [-]
chrX: 74287104-74287209 [-]
hsa-mir-99b hsa-mir-99b-5p mir-10 hsa-mir-99b
hsa-let-7e
hsa-mir-125a
chr19: 51692612-51692681 [+]
chr19: 51692786-51692864 [+]
chr19: 51693254-51693339 [+]
hsa-mir-148b hsa-mir-148b-3p mir-148 hsa-mir-148b chr12: 54337216-54337314 [+]
hsa-mir-125a hsa-mir-125a-5p hsa-let-7i hsa-let-7i-5p let-7 hsa-let-7i chr12: 62603686-62603769 [+]
hsa-let-7e hsa-let-7e-5p let-7 hsa-let-7c hsa-let-7c-5p hsa-let-7c chr21: 16539828-16539911 [+]
hsa-let-7i hsa-let-7i-5p hsa-let-7i chr12: 62603686-62603769 [+] hsa-mir-34a hsa-mir-34a-5p mir-34 hsa-mir-34a chr1: 9151668-9151777 [-]
hsa-mir-182 hsa-mir-182-5p mir-182 hsa-mir-183
hsa-mir-96
hsa-mir-182
chr7: 129774905-129775014 [-]
chr7: 129774692-129774769 [-]
chr7: 129770383-129770492 [-]
hsa-mir-126 mir-126 hsa-mir-126 chr9: 136670602-136670686 [+]
hsa-mir-25 mir-25 hsa-mir-106b
hsa-mir-93
hsa-mir-25
chr7: 100093993-100094074 [-]
chr7: 100093768-100093847 [-]
chr7: 100093560-100093643 [-]
hsa-mir-1307 mir-1307 hsa-mir-1307 chr10: 103394253-103394401 [-]
hsa-mir-423 mir-423 hsa-mir-423
hsa-mir-3184
chr17: 30117079-30117172 [+]
chr17: 30117086-30117160 [-]
hsa-mir-3184
hsa-mir-138-5p mir-138 hsa-mir-138 chr3: 44114212-44114310 [+]
hsa-mir-196a-5p mir-196 hsa-mir-196a chr17: 48632490-48632559 [-]
DOWNREGULATED hsa-mir-205 hsa-mir-205-5p mir-205 hsa-mir-205 chr1: 209432133-209432242 [+] hsa-mir-205 hsa-mir-205-5p mir-205 hsa-mir-205 chr1: 209432133-209432242 [+]
hsa-mir-200a hsa-mir-200a-3p mir-8 hsa-mir-200b
hsa-mir-200a
hsa-mir-429
chr1: 1167104-1167198 [+]
chr1: 1167863-1167952 [+]
chr1: 1169005-1169087 [+]
hsa-mir-221 hsa-mir-221-3p mir-221 hsa-mir-222
hsa-mir-221
chrX: 45747015-45747124 [-]
chrX: 45746157-45746266 [-]
hsa-mir-200c hsa-mir-200c-3p hsa-mir-200c
hsa-mir-141
chr12: 6963699-6963766 [+]
chr12: 6964097-6964191 [+]
hsa-mir-222 hsa-mir-222-3p
hsa-mir-141 hsa-mir-141-3p hsa-mir-141 hsa-mir-141-3p mir-8 hsa-mir-200c
hsa-mir-141
chr12: 6963699-6963766 [+]
chr12: 6964097-6964191 [+]
hsa-let-7c hsa-let-7c-5p let-7 hsa-mir-99a
hsa-let-7c
chr21: 16539089-16539169 [+]
chr21: 16539828-16539911 [+]
hsa-mir-200c hsa-mir-200c-3p
hsa-mir-200a hsa-mir-200a-3p
hsa-mir-100 hsa-mir-100-5p mir-10 hsa-mir-100
hsa-mir-10526
hsa-let-7a-2
chr11: 122152229-122152308 [-]
chr11: 122152103-122152156 [-]
chr11: 122146522-122146593 [-]
hsa-let-7d hsa-let-7d-5p hsa-let-7a-1
hsa-let-7f-1
hsa-let-7d
chr9: 94175957-94176036 [+]
chr9: 94176347-94176433 [+]
chr9: 94178834-94178920 [+]
hsa-mir-15a-5p mir-15 hsa-mir-15a
hsa-mir-16-1
chr13: 50049119-50049201 [-]
chr13: 50048973-50049061 [-]
hsa-mir-20a-5p mir-17 hsa-mir-17
hsa-mir-18a
hsa-mir-19a
hsa-mir-20a
hsa-mir-19b-1
hsa-mir-92a-1
chr13: 91350605-91350688 [+]
chr13: 91350751-91350821 [+]
chr13: 91350891-91350972 [+]
chr13: 91351065-91351135 [+]
chr13: 91351192-91351278 [+]
chr13: 91351314-91351391 [+]
hsa-mir-27a mir-27 hsa-mir-23a
hsa-mir-27a
hsa-mir-24-2
chr19: 13836587-13836659 [-]
chr19: 13836440-13836517 [-]
chr19: 13836287-13836359 [-]
hsa-mir-130a hsa-mir-130a-3p mir-130 hsa-mir-130a chr11: 57641198-57641286 [+]
hsa-mir-21-3p mir-21 hsa-mir-21 chr17: 59841266-59841337 [+]
hsa-mir-15a hsa-mir-15a-5p mir-15 hsa-mir-15a
hsa-mir-16-1
chr13: 50049119-50049201 [-]
chr13: 50048973-50049061 [-]
hsa-mir-454-3p mir-454 hsa-mir-454 chr17: 59137758-59137872 [-]
hsa-mir-378a-3p mir-378 hsa-mir-378a chr5: 149732825-149732890 [+]
Disclaimer/Publisher’s Note: The statements, opinions and data contained in all publications are solely those of the individual author(s) and contributor(s) and not of MDPI and/or the editor(s). MDPI and/or the editor(s) disclaim responsibility for any injury to people or property resulting from any ideas, methods, instructions or products referred to in the content.
Copyright: This open access article is published under a Creative Commons CC BY 4.0 license, which permit the free download, distribution, and reuse, provided that the author and preprint are cited in any reuse.
Prerpints.org logo

Preprints.org is a free preprint server supported by MDPI in Basel, Switzerland.

Subscribe

© 2024 MDPI (Basel, Switzerland) unless otherwise stated