1. Introduction
Sea ice cover in Arctic regions can provide a stable platform for deploying geophones that can measure three-component (3C) particle motion. There is a long history of deploying a single geophone or multiple geophones on the ice surface for wave signal detection. Some studies have investigated the characterization of elastic waves in sea ice (Brook and Ozard, 1989; Yang and Giellis, 1994; Stein et al., 1998), including the types and speeds of wave propagation in a floating ice sheet. Some studies have been reported in source bearing or location, and Miller and Schmidt (1991) located the acoustic source using a set of geophones and hydrophone arrays. Becklehimer (1991) used the geophone array to conduct beamforming experiments and simulated and calculated the azimuth response. Arvelo (2012) believed that the range to an acoustic source can be estimated using the arrival-time differences of seismic waves at an ice-mounted geophone and proposed that mammals could be monitored and tracked using ice-mounted geophones. The location of acoustic sources beneath the Arctic ice was studied using ice-mounted geophones, and the approach of source bearing was presented by maximizing the radial signal power as a function of the horizontal look angle; for frequencies up to 250 Hz, the average absolute error of bearing estimation to the source was within 10° (Dosso et al., 2002; Dosso et al., 2003; Dosso, 2014). By combining passive seismology approaches with specific array processing methods, Moreau et.al(Moreau et al., 2020) demonstrate that the multimodal dispersion curves of sea ice can be calculated without an active source, and then used to infer sea ice properties. From the previous abovementioned studies, we can see that by deploying geophones mounted on ice, much acoustic information about ice and underwater acoustic sources can be obtained. However, it is also found that the frequency band of signals received by geophones was mostly within 200 Hz.
Verrall and Ganton (1977) noticed that the reflectivity at a given angle was strongly influenced by the pulse frequency for frequencies above 1 kHz. Yang et al. (1981) measured sonic reflectivity below 1 kHz beneath large smooth ice floes in the Arctic Ocean and found that the reflectivity was strongly dependent on frequency as well as grazing angles. Hobæk and Sagen (2016) computed the reflection coefficient as a function of incidence angle and frequency and found that at some incidence angles and frequencies, the reflection coefficient had very low values and was related to the generation of Lamb waves in ice. From these studies, we know that Arctic ice often has different responses to acoustic waves with different frequencies. There have been many studies on signals with frequencies under 200 Hz using ice-mounted geophones. The effect on source bearing estimation when the signals received by geophones are in the frequency bands that are above 200 Hz is not well known. Which frequency band is better for source bearing estimation is also unknown.
In this study, cross-ice detection experiments with underwater acoustic sources for bearing by an ice-mounted geophone were performed during the 11th Chinese National Arctic Research Expedition. Section II introduces the experiments in detail. A 3C geophone was used for bearing estimation. Section III briefly describes methods for source bearing. In Sec. IV, the bearing estimation results are compared with the peak displacements received by the ice-mounted geophone. The relationship between the errors of bearing estimation and the horizontal peak displacement is studied. The relationship between the Lamb waves and the horizontal peak displacement and bearing estimation error is also studied. Finally, Sec. V summarizes the results.
2. Experimental description
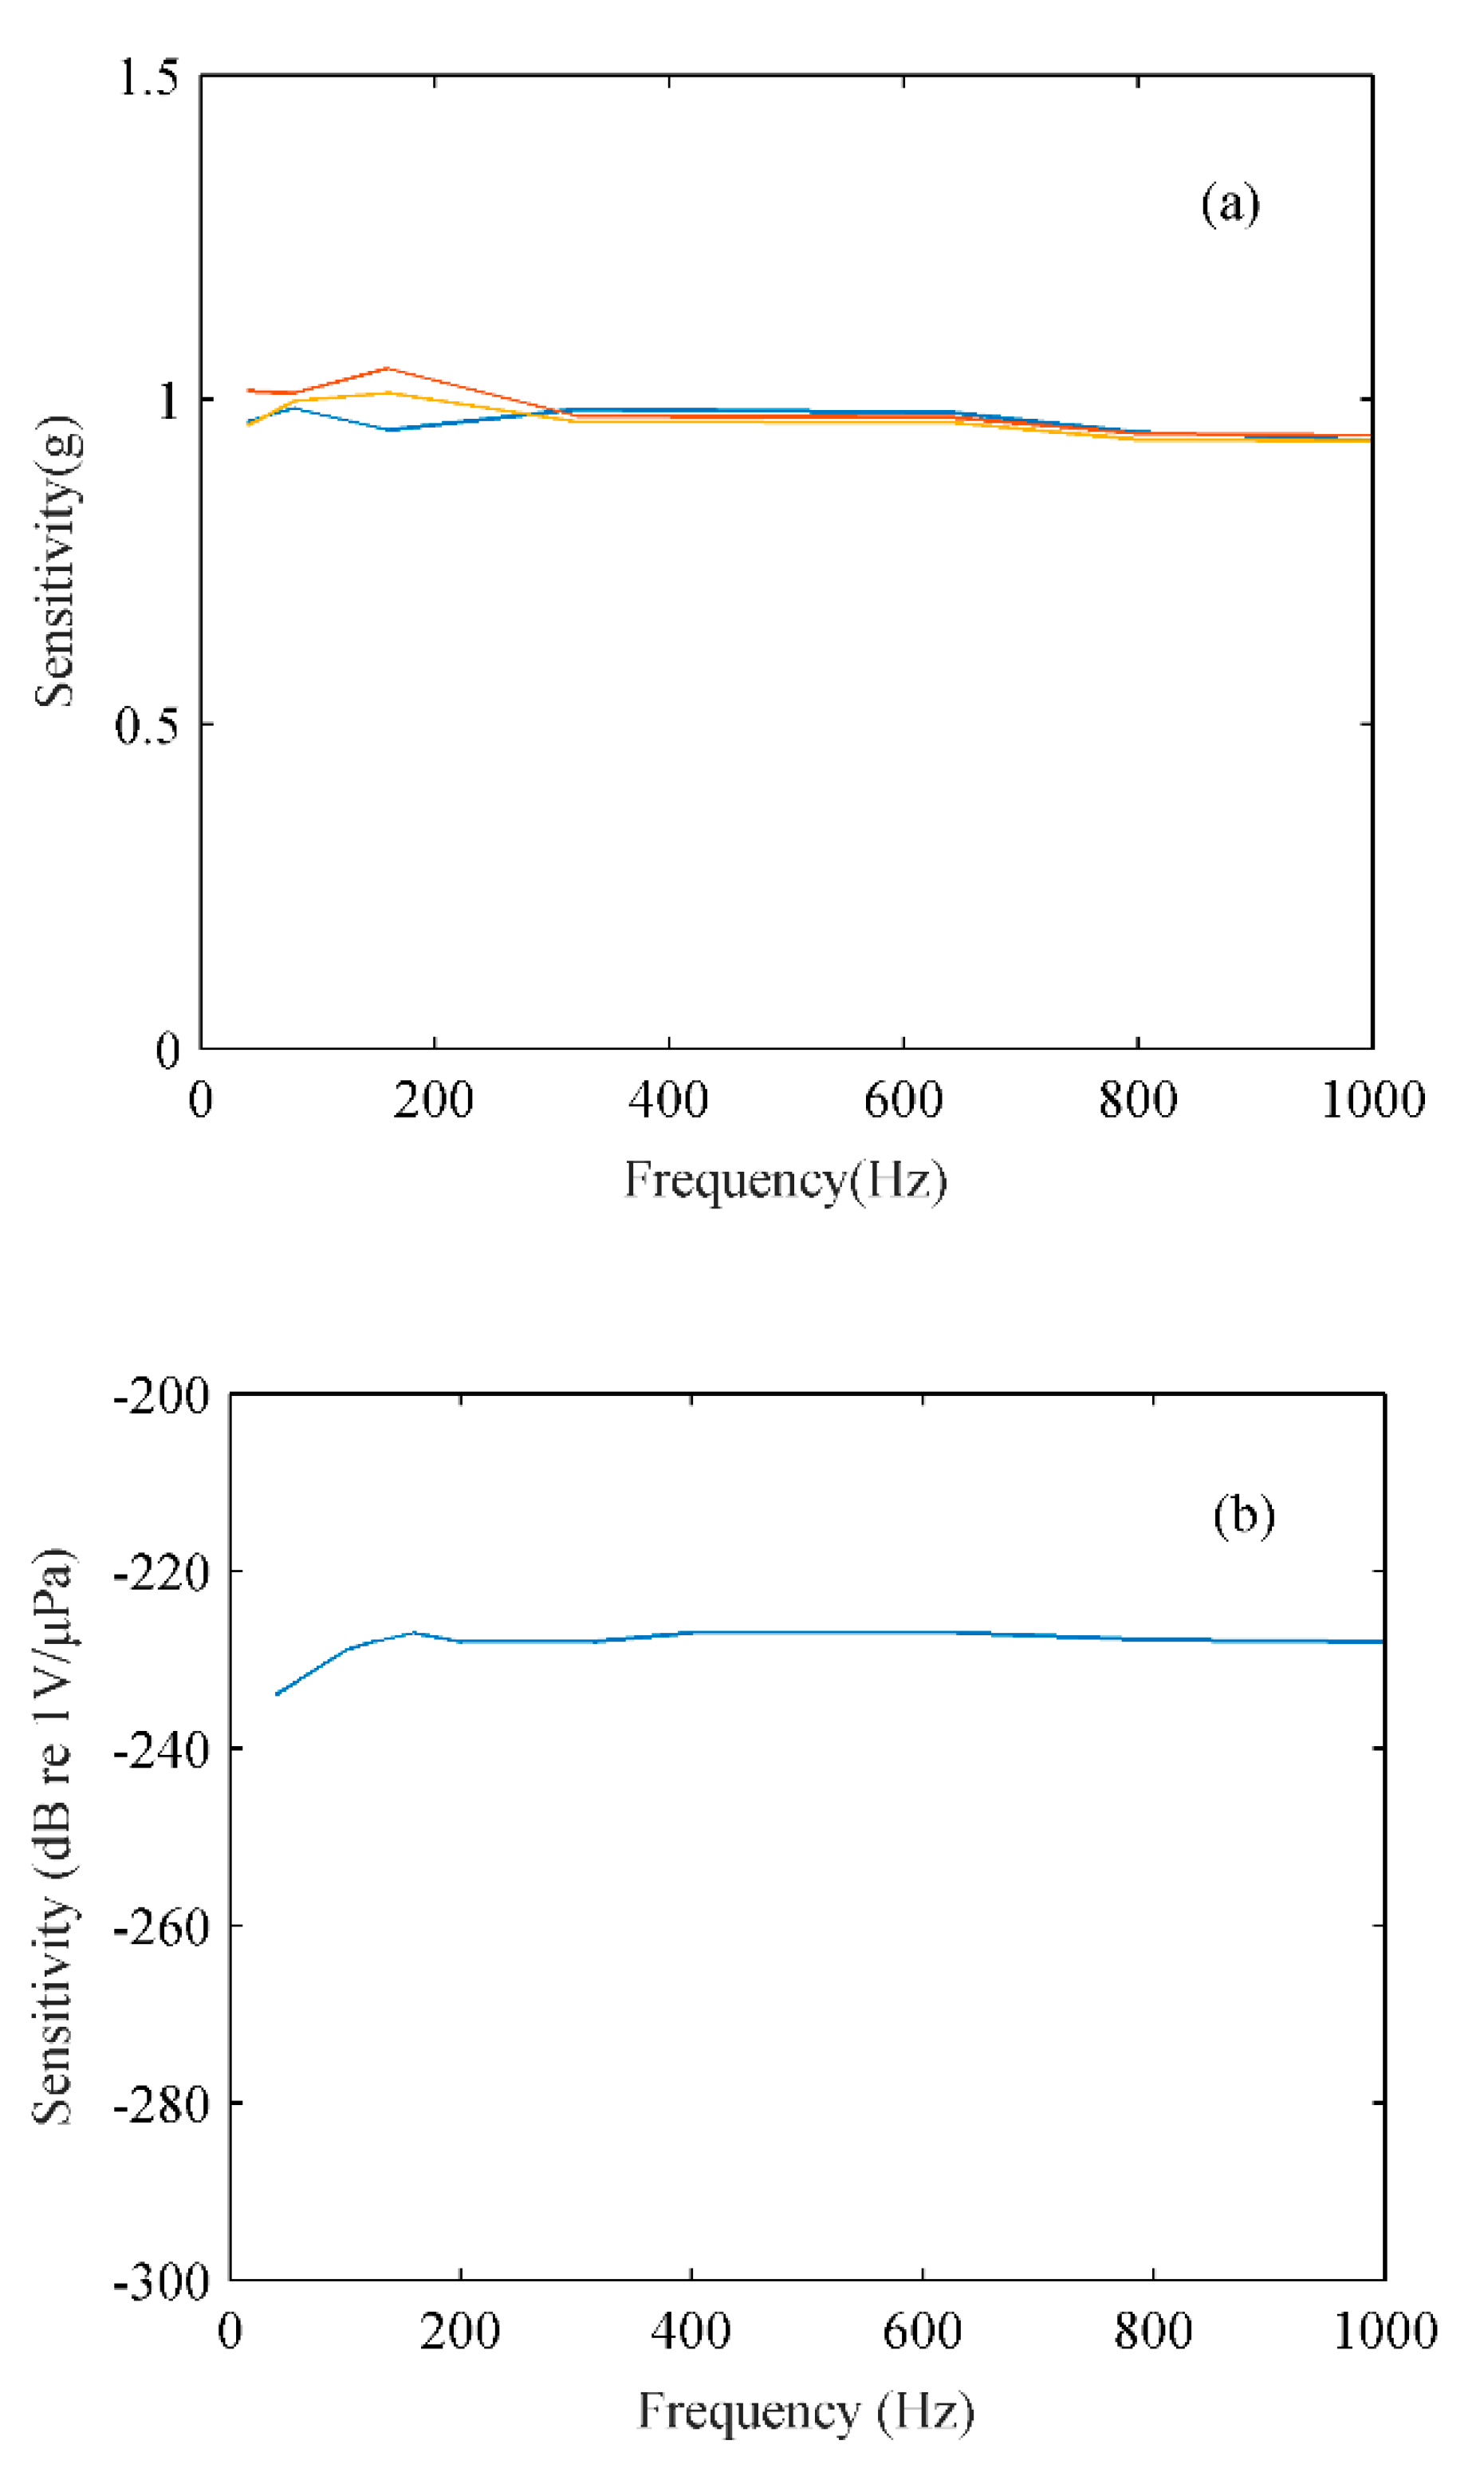
Bearing estimation experiments with an underwater acoustic source are performed at three floating ice cap sites (named S1, S2 and S3) in the central Arctic Ocean. During the experiment, at each site, a 3C geophone (named G1) mounted on the ice was used to receive the cross-ice signals. G1 is a wireless vibration sensor, and the brand is iSensor. Its ID number is 701. It is self-contained and can directly measure the vibration velocity and acceleration for particle motion in three dimensions. The receiving frequency band of G1 is 0.01–1000 Hz, and the A/D resolution is 20 bits. The working temperature range is -20–60 ℃. During the experiment, the sampling frequency of G1 was set to 4 kHz. In addition, an underwater signal recorder (USR) beneath the ice was used to receive the acoustic pressures in water at the same time. The USR was manufactured by the Institute of Acoustics of the Chinese Academy of Sciences. The model used (USR-2000) has a maximum operating depth of 2000 m. The sampling frequency of USR was set to 24 kHz, and the analog-to-digital (A/D) resolution was 24 bits. The sensitivity responses to the frequency of G1 and the USR are shown in
Figure 1.
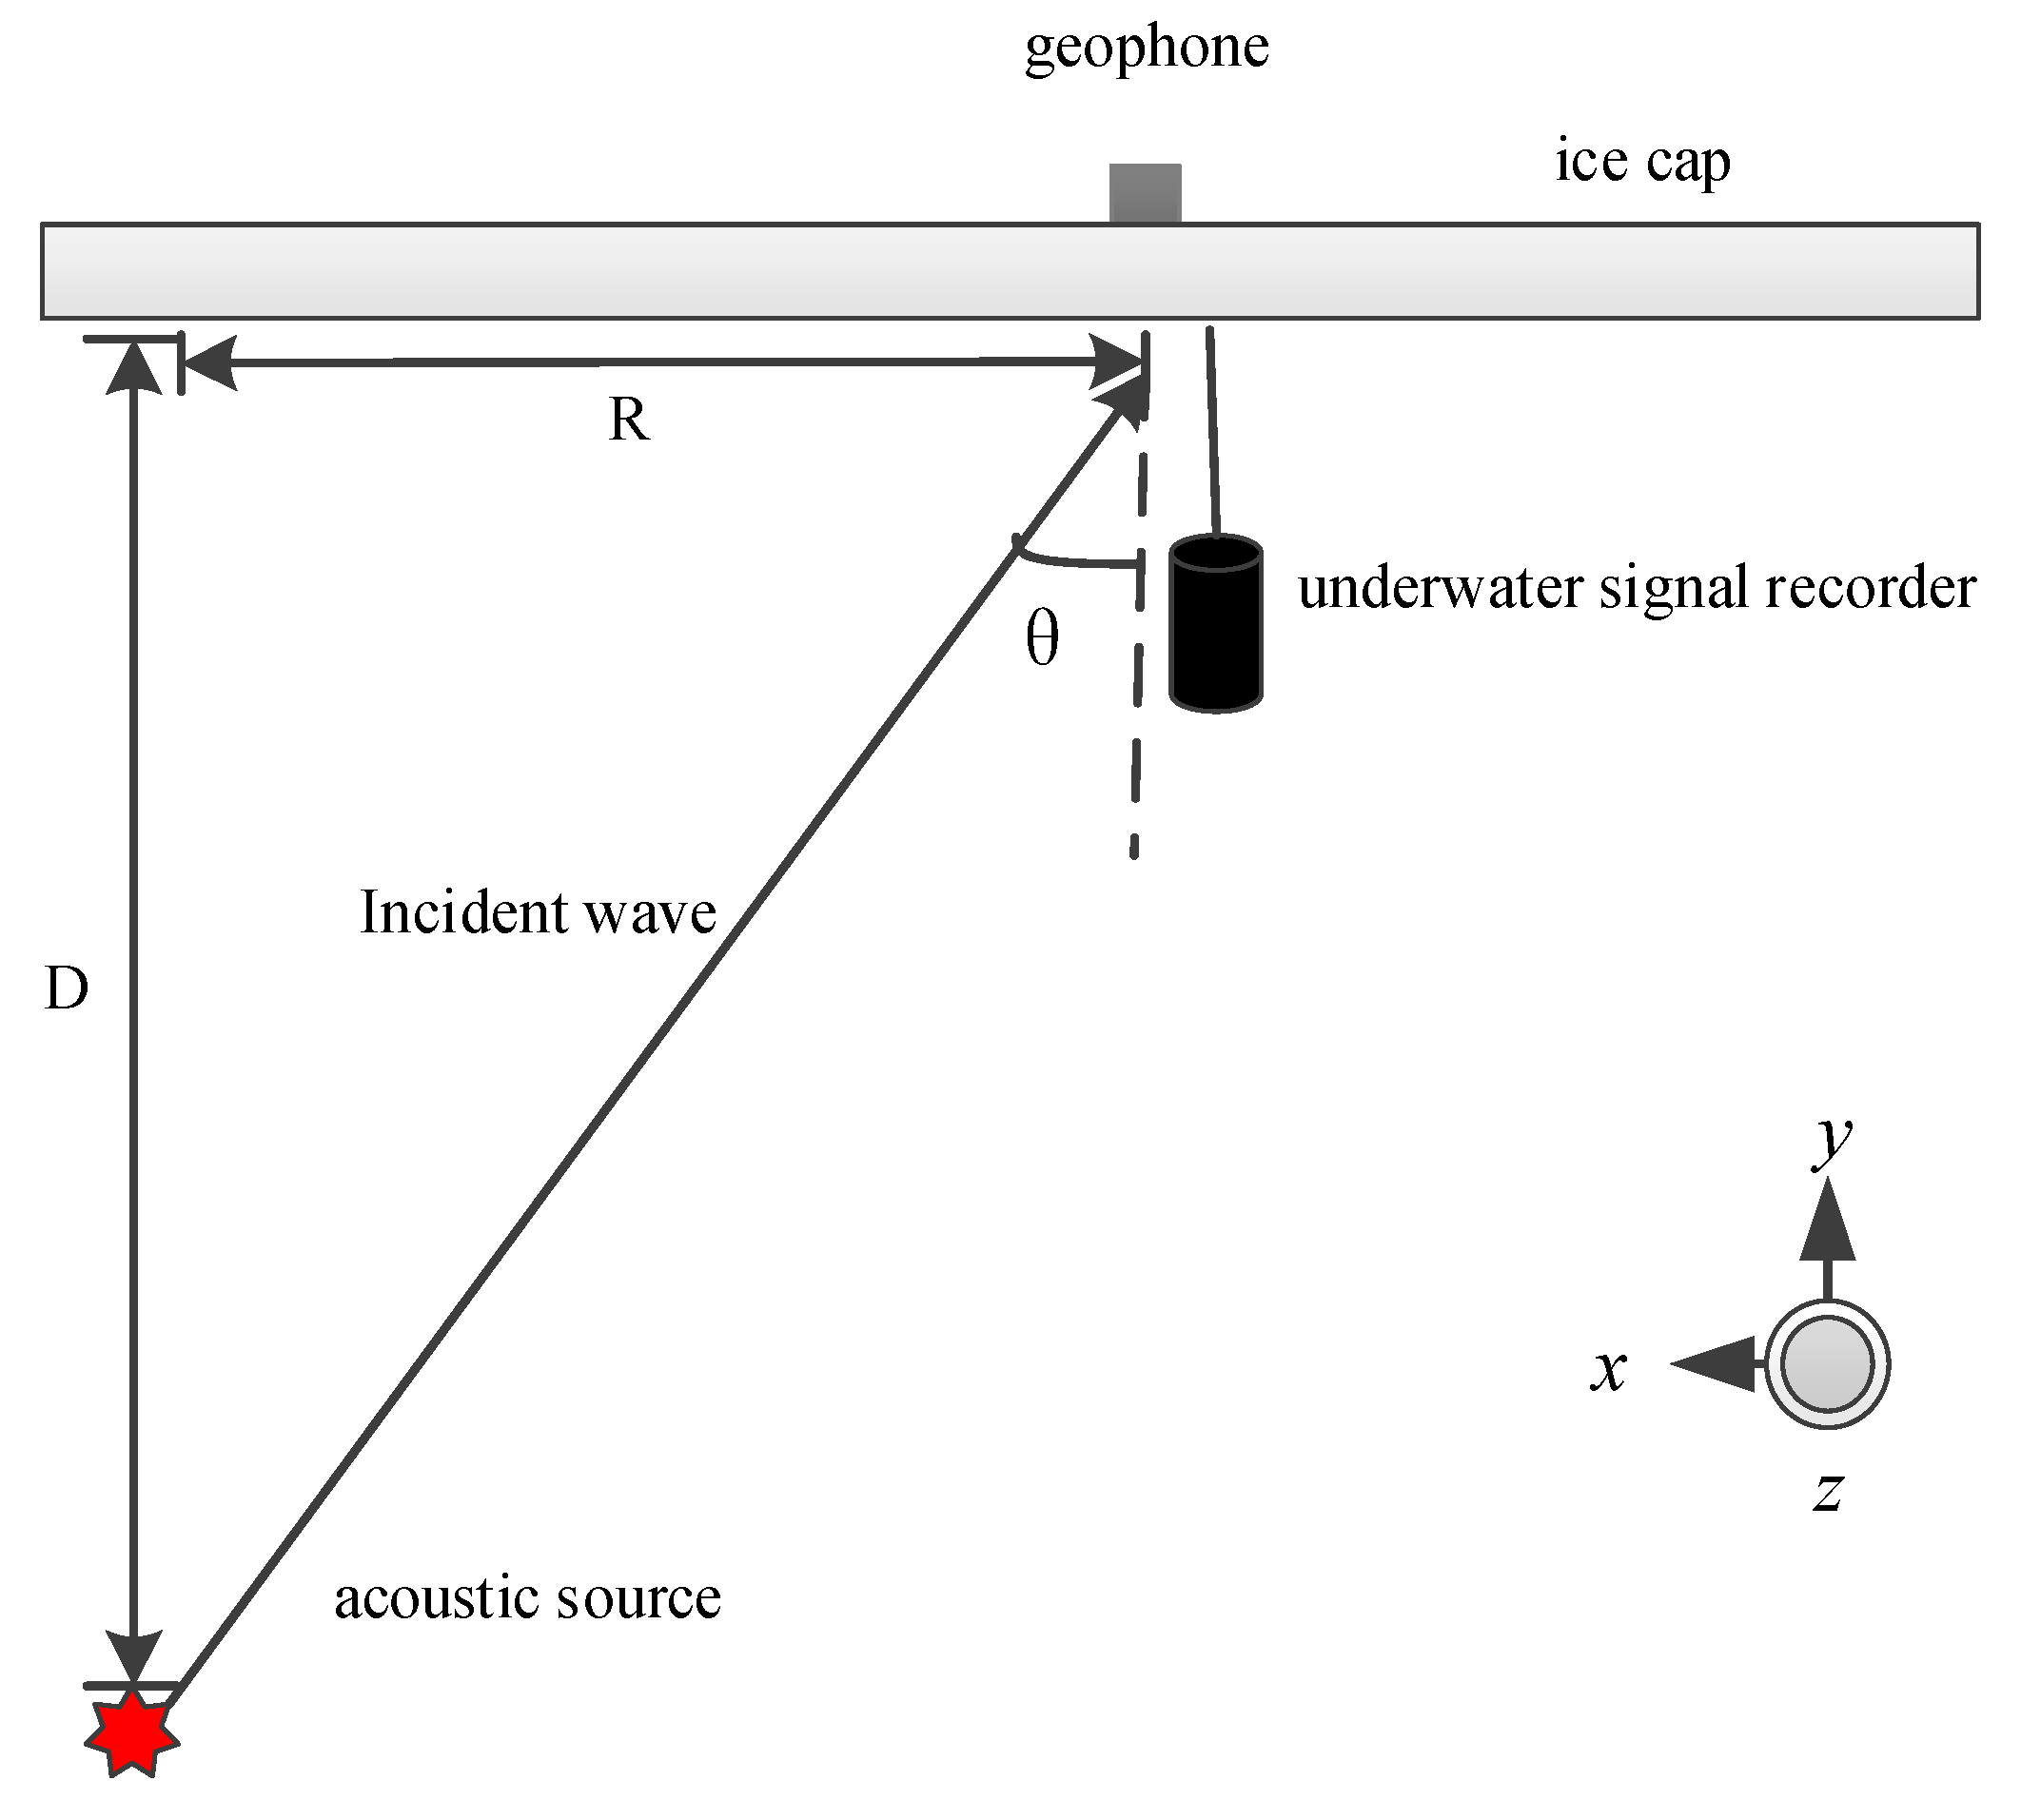
The field trial geometry is shown in
Figure 2. In
Figure 2, D is the depth of the acoustic source, and R is the horizontal distance between the acoustic source and the geophone. The acoustic source used is a fixed depth explosion source, which is used to generate broadband signals. The source depth D is 100 m at every site, and the horizontal distance R between the source and the geophone is 70, 340 and 100 m at the three floating ice-cap sites. According to the depth D and horizontal distance R of the source, the incident anglesθof the acoustic source can be calculated as 35°, 73.6° and 45°. The ice thicknesses of the three ice cap sites were roughly measured by a meter ruler; they were mainly 1–2 m, and the thickness of the ice at site S1 was relatively thin. During the experiment, the
x direction of the geophone is toward the source, and the value of the bearing is 0°. The basic information of the site coordinate, experimental time and true bearing of each experimental site are shown in
Table 1.
3. Bearing estimation methods
When an acoustic wave is incident on a planar water/ice interface, ice seismic waves propagate in three fundamental models, including LP wave (longitudinal plate wave), SH wave (horizontally polarized shear wave) and FL wave (flexural wave), if the frequencies are low and the wavelengths are greater than the ice thickness (Dosso et al., 2002). The LP wave and FL wave are composed of the P wave (compressional wave) and SV wave (vertically polarized shear wave), i.e., P-SV wave. The particle motion of the LP wave and FL wave mainly exists in the vertical radial plane parallel to the incident wave, while the particle motion of the SH wave is perpendicular to this vertical radial plane. According to these characteristics of seismic waves in ice, a rotational analysis for source-bearing estimation based on maximizing the radial signal power has been developed (Dosso et al., 2002). White (1964) developed a straightforward and effective set of polarization filters that can be adapted to bearing estimation. The approaches are briefly introduced as follows.
3.1. Rotation method of maximum radial power
The rotational method of maximum radial power is based on measuring ice seismic waves for which the direction of particle motion is oriented radially outward from the source (Dosso et al., 2002). Therefore, the maximum radial signal power as a function of the horizontal look angle has been built. By continuously rotating the horizontal azimuth from 0° to 360°, the maximum value is obtained. The angle of maximum power provides the optimal estimate of the source bearing. The maximum radial power function (Dosso et al., 2002) is:
In Equation (1),
θ is the incident angle in the horizontal plane,
t stands for a certain time, and
xt or
yt denotes the discrete time series of particle displacement recorded on the
x- or
y-direction of a geophone, respectively.
rt is the horizontal (radial) particle motion at the time. By calculating the derivative of the maximum radial power function, the maximum value is obtained when the derivative is zero. The angle
θ of maximum power, as shown in Equation (2), is the estimated bearing (Dosso et al., 2002).
3.2. Vertical polarization filtering method
The vertical polarization filtering method uses the phase difference between the vertical and horizontal components for various wave types. Using the vertical-component signal and/or its time derivative as time-domain filters for the horizontal signals, the horizontal polarization
SH waves and noise will be suppressed (White, 1964). The vertical polarization
P waves and shallow-angle
SV waves will be enhanced, which provides primary information regarding source bearing. Applying the vertical polarization filter on the rotational analysis, the maximum radial power obtained by vertical filtering is as follows (Dosso et al., 2002).
4. Results and discussion
4.1. Acoustic signals received and particle displacement
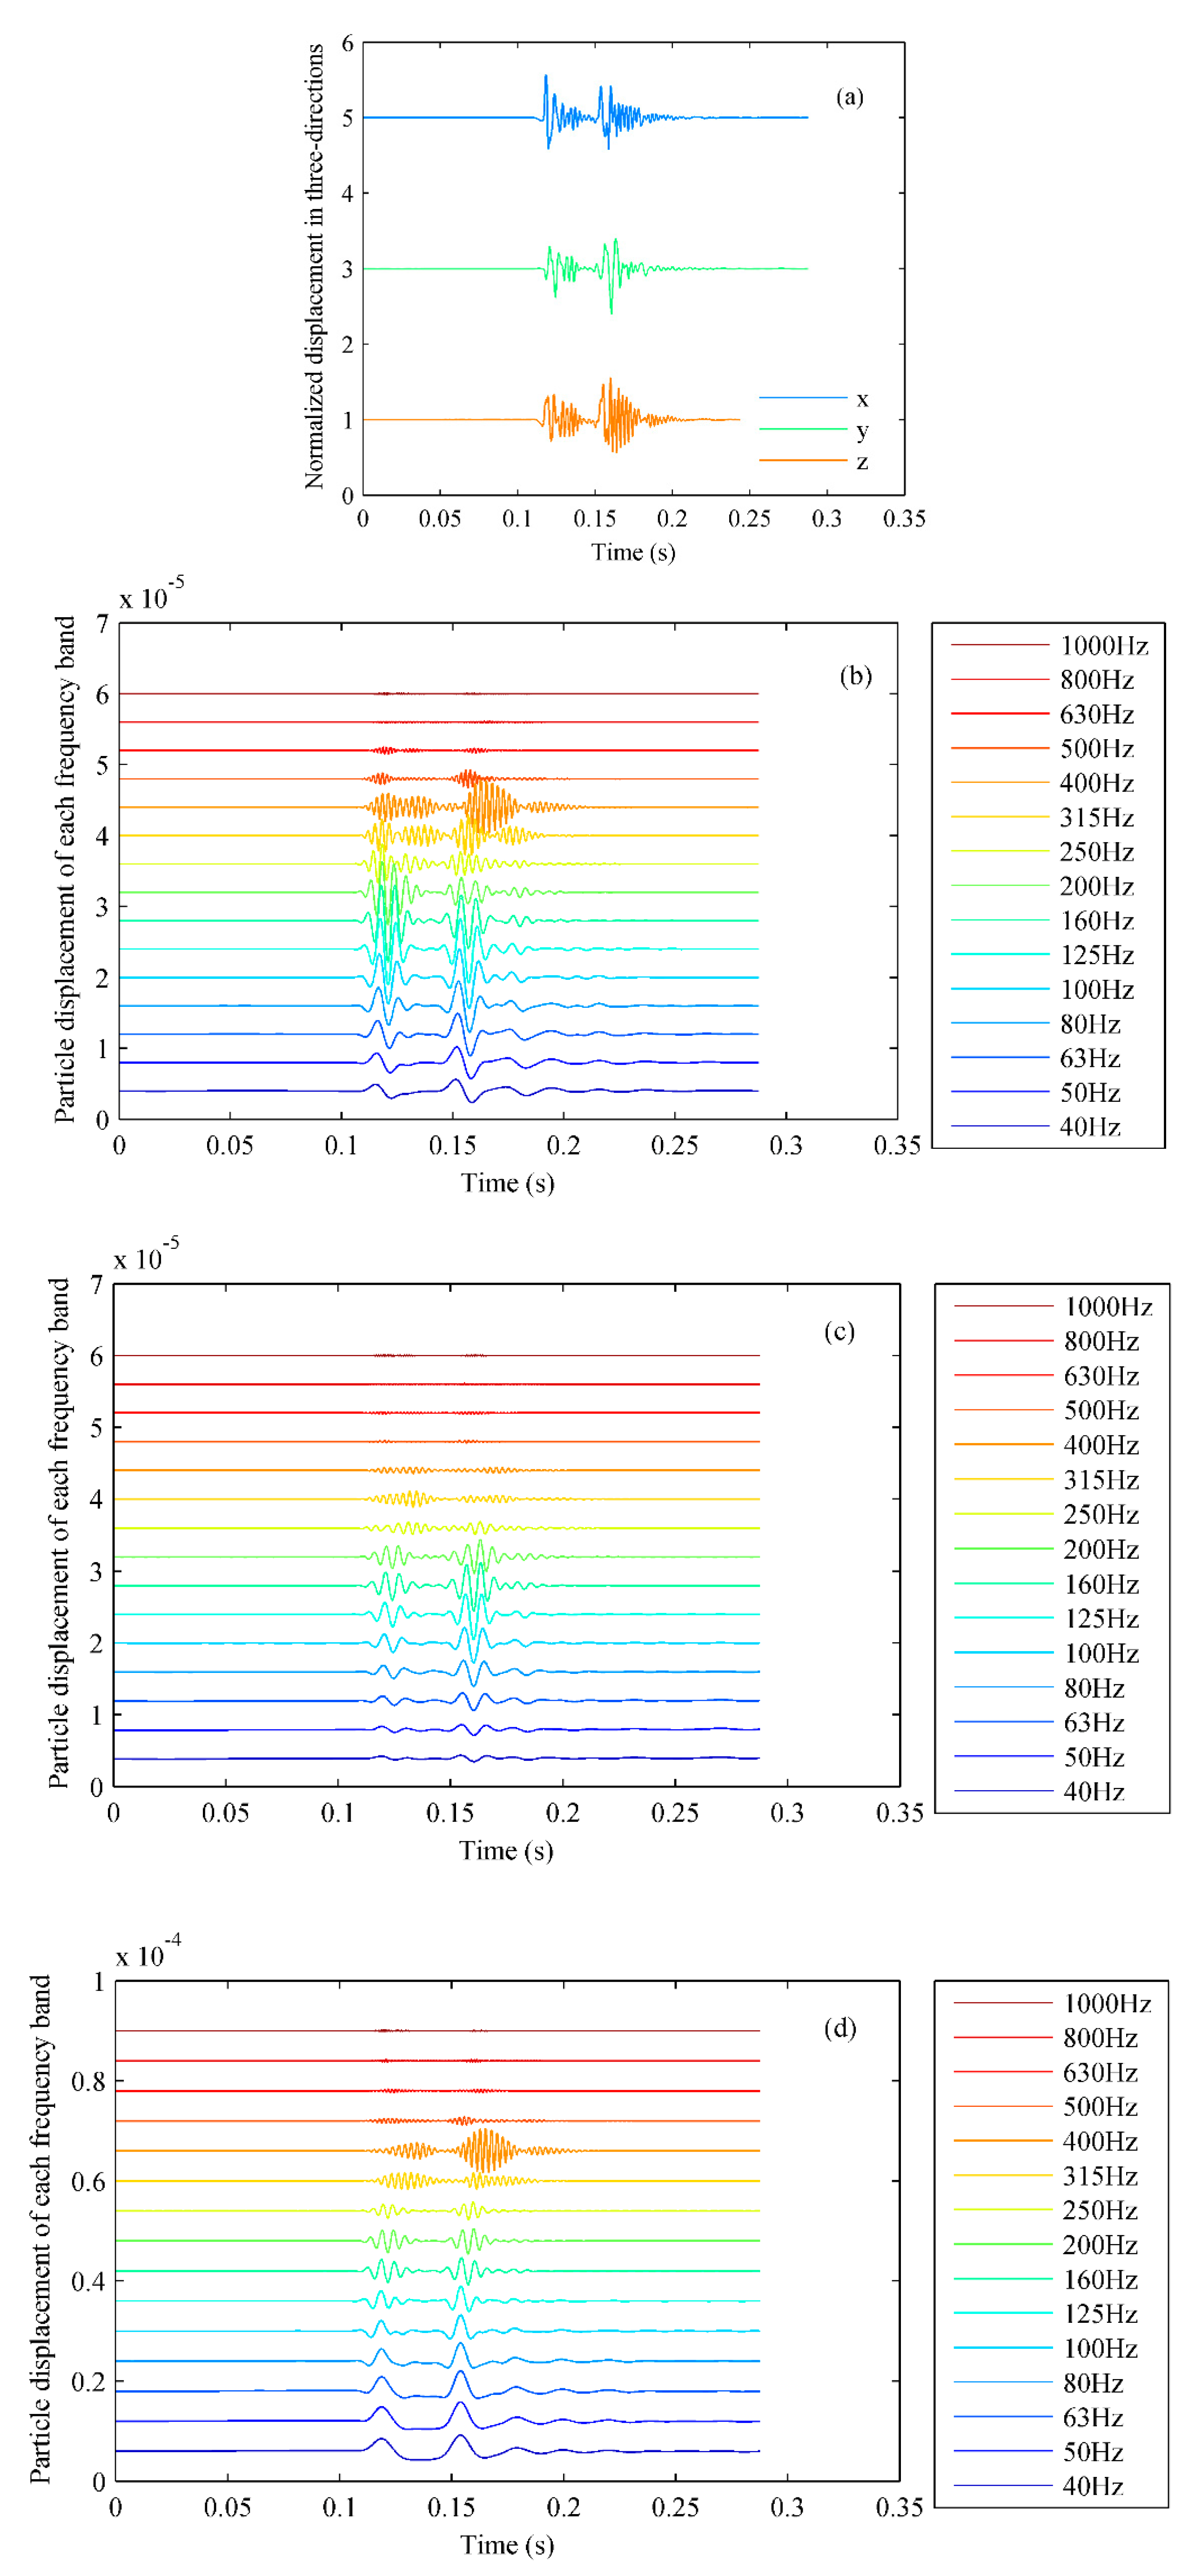
At site S1, after an explosion source worked, the cross-ice acoustic signals were received by an ice-mounted geophone, and the particle displacements normalized in three directions are shown in
Figure 3(a), with some translation in the vertical coordinate direction for a better view. As shown in
Figure 3(a), the signals generated by the explosion source have significant impact characteristics in the time domain (Mitchell, et al., 2002). To study the bearing estimation on cross-ice acoustic signals in different frequency bands, the signals are filtered in the frequency domain according to the 1/3 octave. Fifteen signals in the 1/3 octave frequency band centered at frequencies from 40 Hz to 1000 Hz are obtained. The particle displacement caused by the signal wave in each frequency band received by the geophone in the
x-,
y- or
z-direction can be obtained, and the results are shown in Figs. 3(b), (c) and (d), with some translation in the vertical coordinate direction. The unit of particle displacement is meter.
The peak displacements at each center frequency of the 1/3 octave in three directions of received signals at site S1 are shown in
Table 2.
As shown in Figs. 3(b) – (d) and
Table 2, the particle peak displacements in each frequency band are different at site S1. When the frequency band is below 630 Hz (i.e.,
f < 630 Hz), the value of the
x-direction peak displacement is higher and greater than 10×10
-7 m. When the frequency is greater than or equal to 630 Hz (i.e.,
f ≥ 630 Hz), the value of the
x-direction peak displacement is lower and less than 10×10
-7 m, as shown in
Figure 3(b). The
y- or
z-direction peak displacement in each frequency band also has similar characteristics, as shown in Figs. 3(c) – (d) and
Table 2. Therefore, the value of the peak displacement in the
x-
, y- or
z-direction is related to the frequency band of the received signals. Similarly, this feature can also be found at sites S2 and S3.
4.2. Source bearing estimation results in each division frequency band
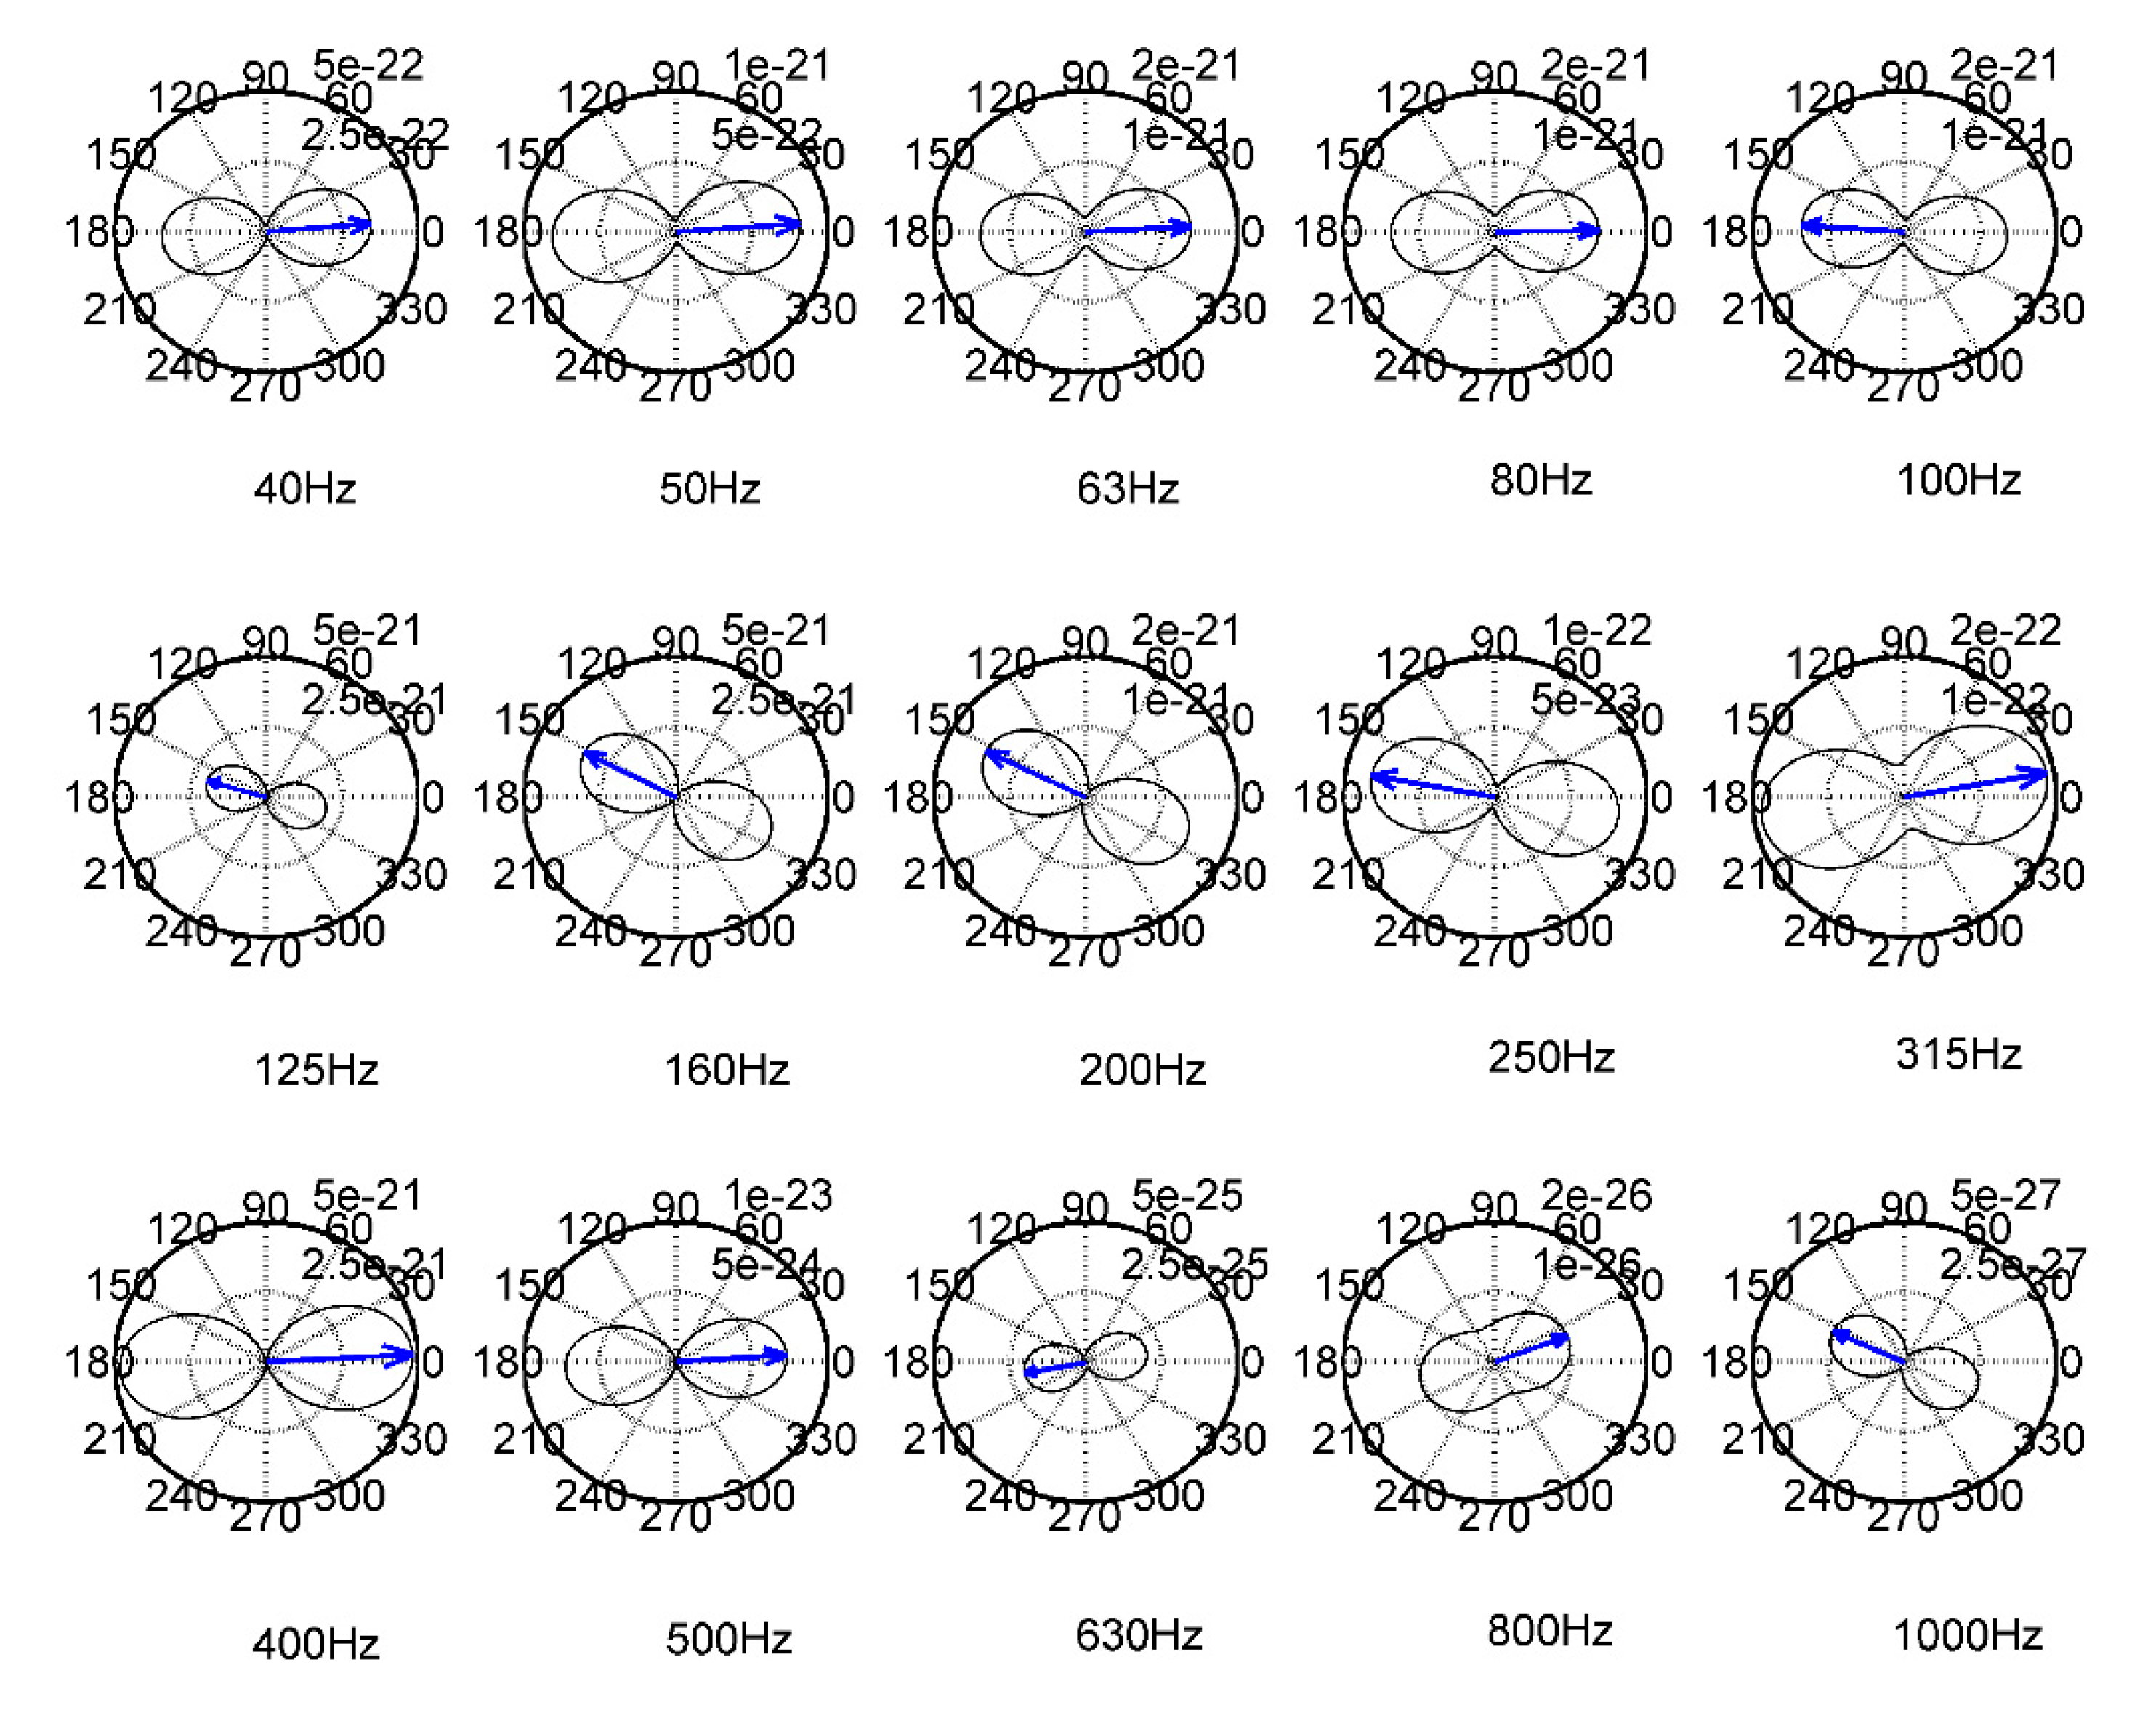
According to the bearing estimation method described in Sec. III, the maximum power rotation method combined with the vertical filtering method is used. At site S1, the estimated bearing of 15 different frequency bands of the first explosion acoustic source is shown in
Figure 4.
As shown in
Figure 4, the estimated bearing of the 15 frequency bands to the same acoustic source at the same site is not completely consistent. The true bearing value of the site is -5° as shown in
Table 1. By considering prograde particle motion in the vertical–radial plane, the 180° bearing ambiguity can be solved (Dosso et al., 2002), but it can still be found that some bearing-estimation errors are large and some slightly changed with the frequency band of the acoustic signal. Combined with the previous three-direction displacements, which are shown in Figs. 3(b) – (d), it is found that the bearing-estimation error of the frequency band corresponding to small displacement is large (
f ≥ 630 Hz), and the error of the frequency band corresponding to large displacement is small (
f < 630 Hz). It seems that the bearing-estimation error of different frequency bands is related to the peak displacement in the same frequency band. More details will be provided in the next section.
4.3. Relationship between bearing-estimation error and horizontal peak displacement
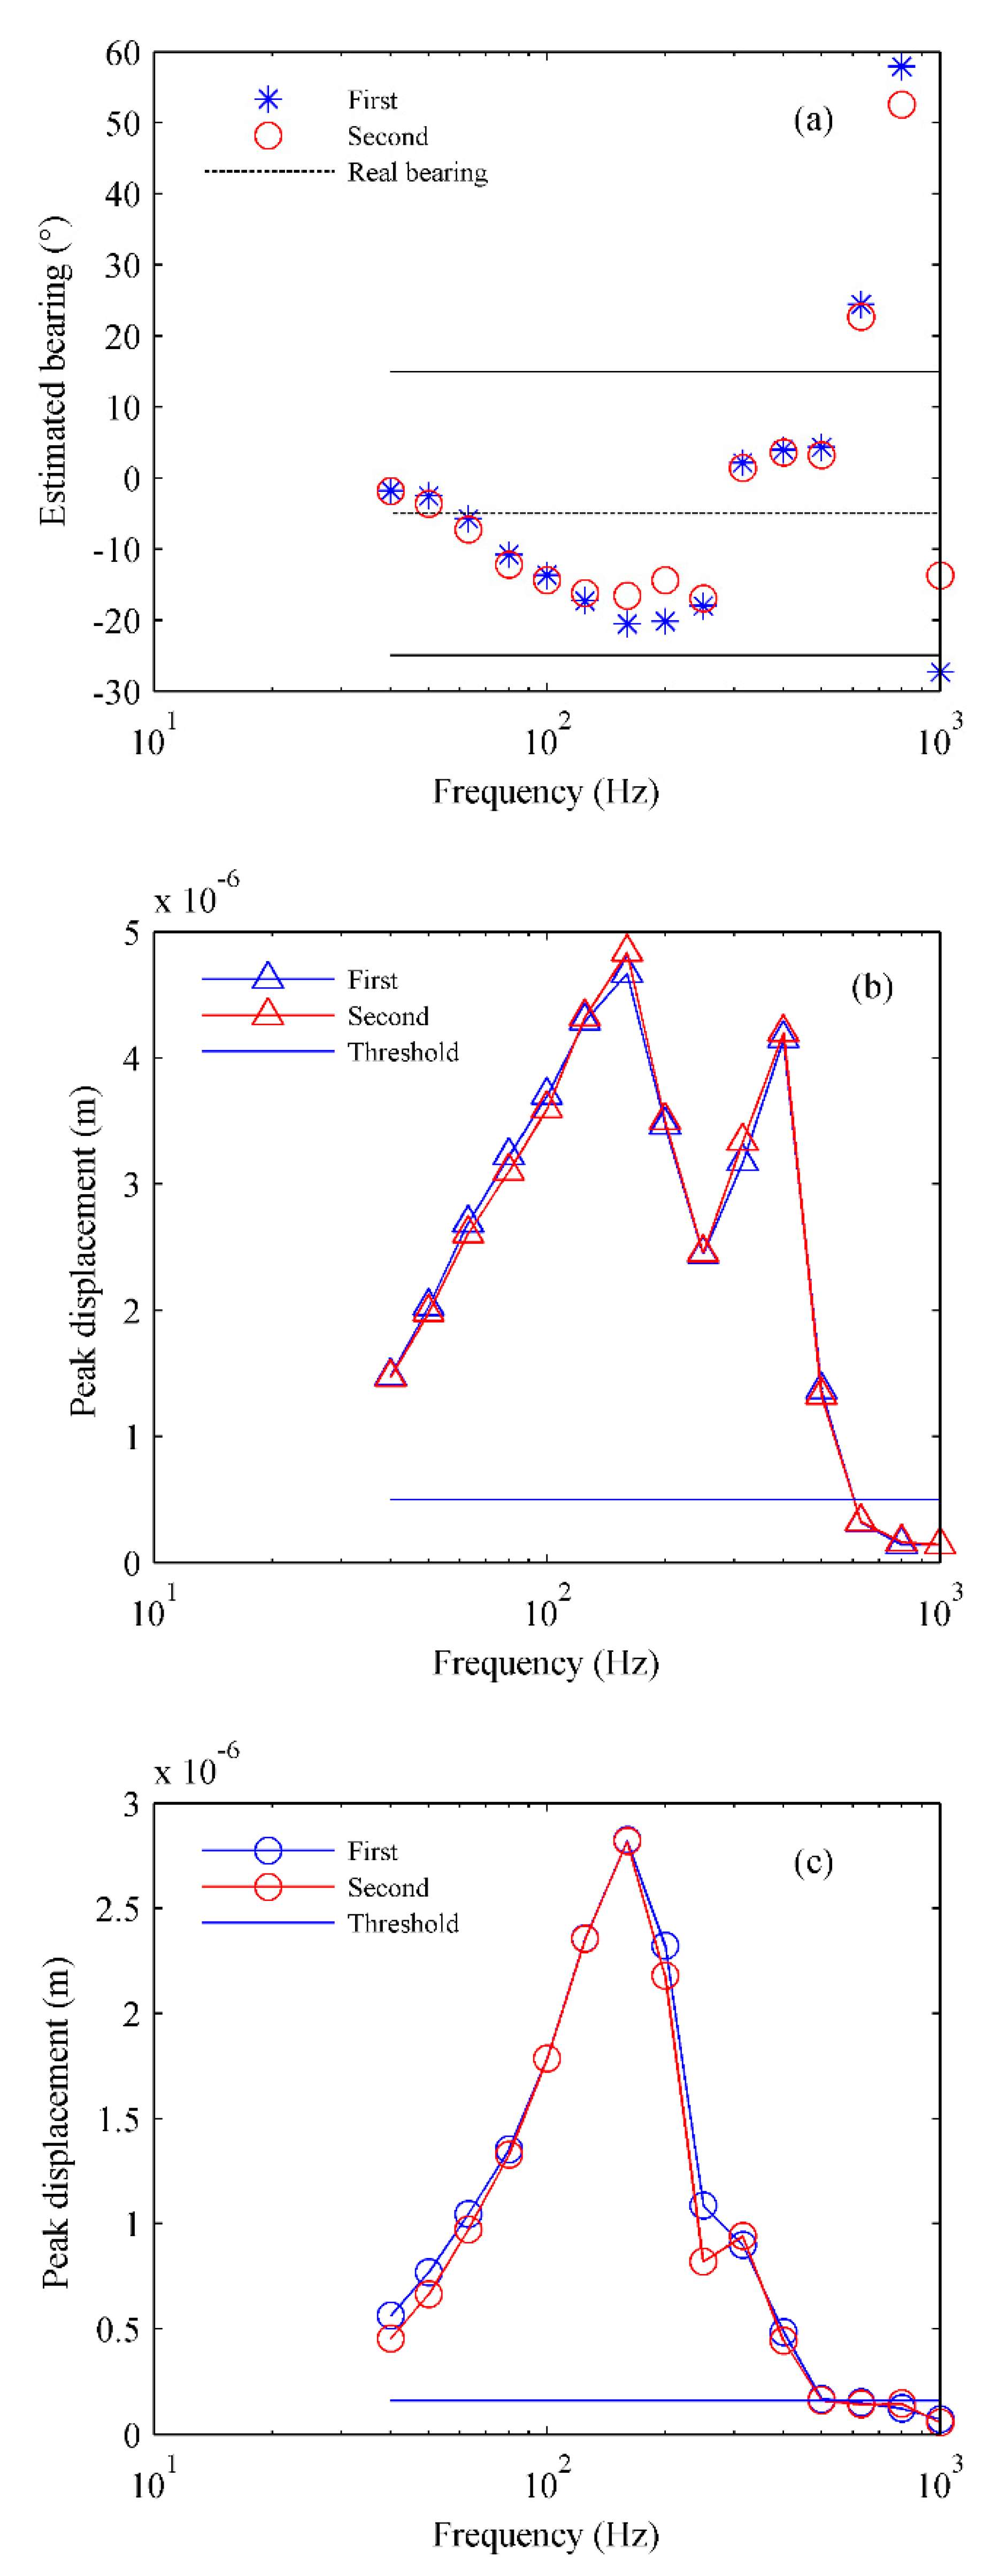
At site S1, the results of the bearing estimation of each 1/3 octave frequency band average centered at frequencies 40–1000 Hz for two acoustic sources are shown in
Figure 5(a). Where the asterisks indicate the bearing estimation by each frequency band for the first source, the circles indicate the bearing estimation by each frequency band for the second source, the dotted line represents the real bearing angle of -5°, and the upper and lower solid lines represent the bearing angle that deviates from the real value by 20°. If the bearing estimation errors exceed 20°, they will fall outside these two lines. Combined with the previous analysis on the relationship between bearing-estimation error and peak displacement, the horizontal
x- or
y-direction peak displacements in different frequency bands are extracted. The relationship between the
x-direction peak displacements and 1/3 octave frequencies is shown in
Figure 5(b), and the relationship between the
y-direction peak displacements and 1/3 octave frequencies is shown in
Figure 5(c).
As shown in
Figure 5(a), when the frequencies are in the 630–1000 Hz band, the bearing-estimation errors significantly increase, almost greater than 20°. A threshold line is drawn near the value of the
x- or
y-direction peak displacement at 630 Hz in Figs. 5(b) and (c), and the threshold values are
x=5.3×10
-7 m and
y=1.63×10
-7 m, respectively. The
x- and
y-direction peak displacements in the 630–1000 Hz frequency band are all near or below the threshold. Comparing
Figure 5(a) to Figs. 5(b) and (c), it can be found that in the frequency band of 630–1000 Hz, the
x- and
y-direction peak displacements are small and lower than the threshold, while the bearing estimation errors clearly increase and are almost greater than 20°.
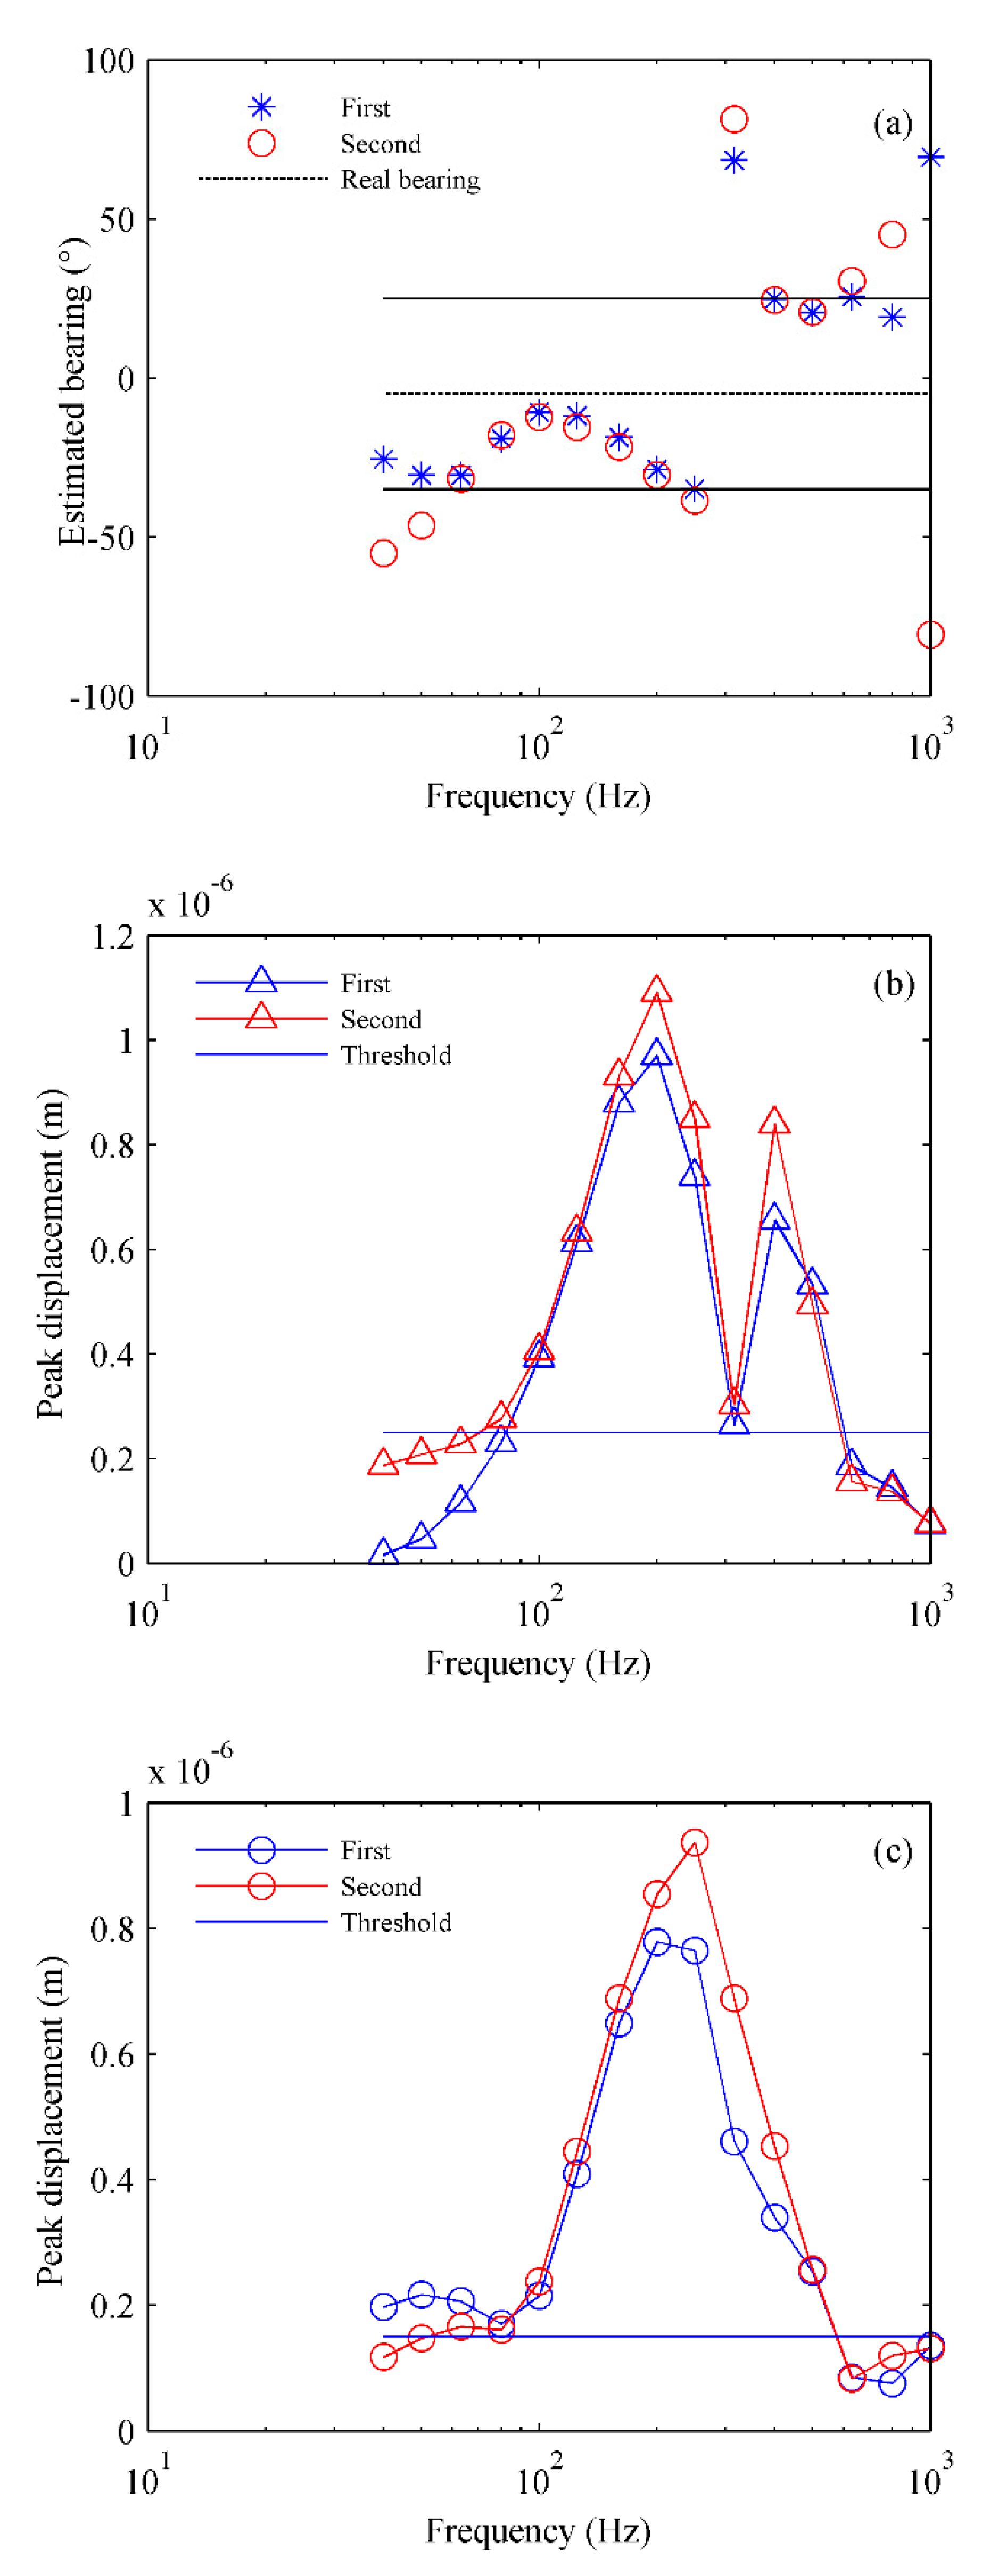
At site S2, the results of the bearing estimation for each 1/3 octave frequency band for two acoustic sources are shown in
Figure 6(a). Where the dotted line represents the real bearing of - 5°, and the upper and lower solid lines represent the bearing angle that deviates from the real value by 25°. Because the horizontal distance between the source and the geophone is larger and exceeds 300 m, the bearing estimation error range set in
Figure 6(a) is increased by 5° compared to that in
Figure 5(a). Similarly, the relationship between the
x- or
y-direction displacement peaks and 1/3 octave frequencies is shown in Figs. 6(b) and (c); the threshold value is
x=2.5×10
-7 m in
Figure 6 (b) and
y=1.5×10
-7 m in
Figure 6 (c).
As shown in
Figure 6(a), the bearing-estimation errors in the two frequency bands, 40–63 Hz and 630–1000 Hz, are mostly greater than 25°. Furthermore, the bearing estimation error at the frequency of 315 Hz is greater than 25°. Similarly, it can be seen in Figs. 6(b) and (c) that in the same two frequency bands, 40–63 Hz and 630–1000 Hz, the
x- or
y-direction peak displacements are small, mostly near or lower than the threshold, and the
x-direction peak displacement at 315 Hz is near the threshold.
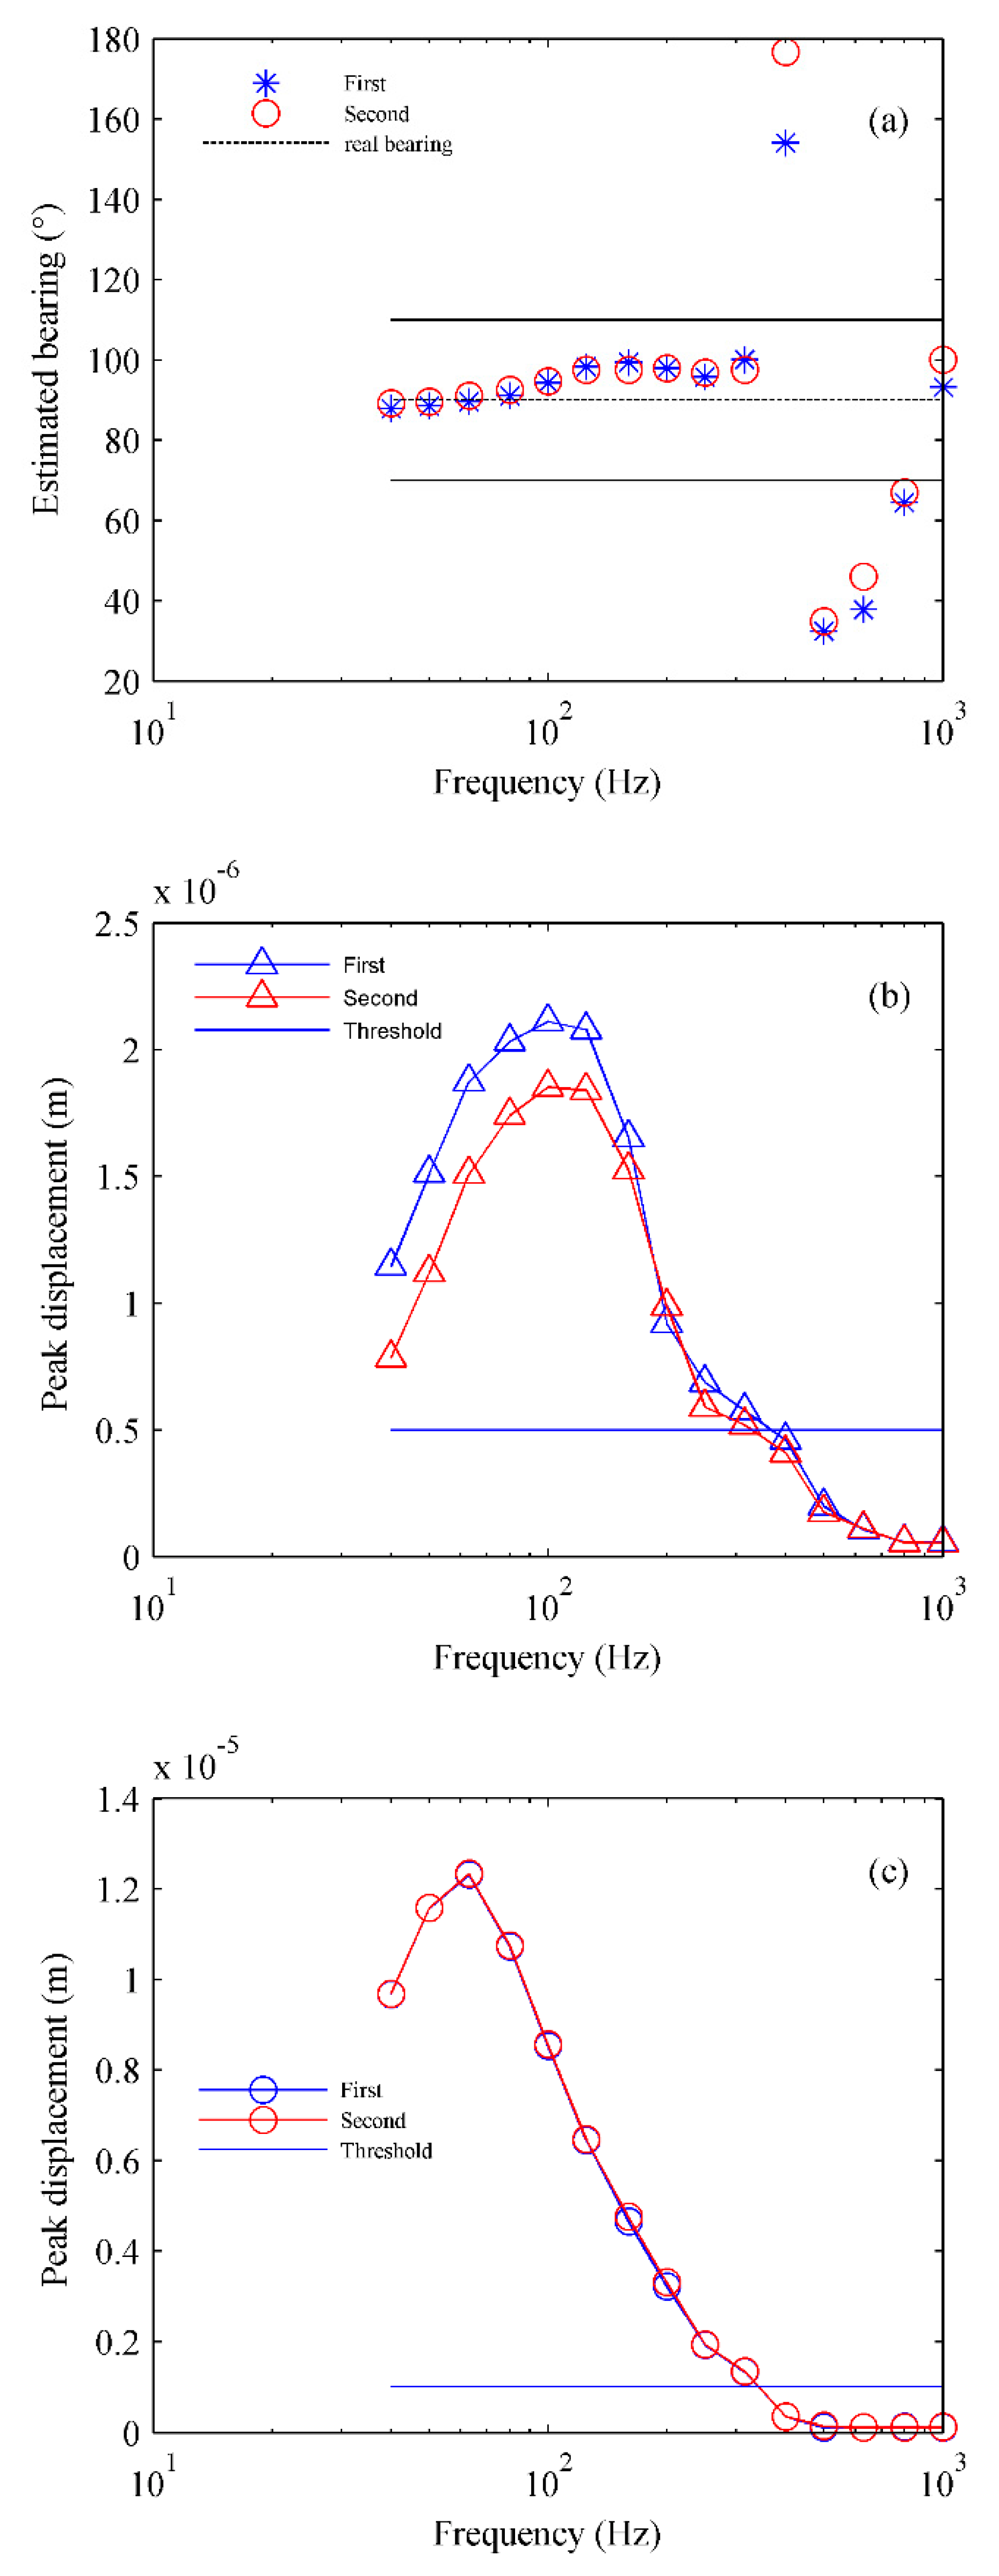
At site S3, the results of the bearing estimation in each frequency band for two acoustic sources are shown in
Figure 7(a). Where the dotted line represents the real bearing of 90°, and the upper and lower solid lines represent the bearing that deviates from the true value by 20°. The relationship between the
x- or
y-direction peak displacements and 1/3 octave frequencies is shown in Figs. 7 (b) and (c). The threshold value is
x=5×10
-7 m in
Figure 7 (b) and
y=1×10
-6 m in
Figure 7(c).
As shown in
Figure 7, when the frequency is in the range of 400 Hz to 1000 Hz, the bearing estimation errors significantly increase and are almost greater than 20°, except at 1000 Hz. Similarly, in the same frequency band, the
x- or
y-direction peak displacements are small and lower than the threshold. In the case of small peak displacement, the bearing estimation error at 1000 Hz is still small and remains to be further studied.
By comparing the experimental results of the peak displacement and bearing estimation error in different frequency bands at the three sites, it can be found that the bearing estimation error in different frequency bands is different, and the error is related to the x- or y-direction peak displacement. When the x- or y-direction peak displacements in some frequency bands are lower than a certain threshold, the errors of the bearing estimation in the corresponding frequency band significantly increase, most of which exceed 20°. This occurs because in the bearing-estimation method mentioned in Sec. III, the maximum radial power in Equation (1) is closely related to the horizontal displacement in the x- and y-directions of the particle motion. The low value of the x- or y-direction peak displacements means that the maximum radial power is small, which increases the bearing estimation errors in this frequency band. Therefore, if the horizontal peak displacements of the received signal in some frequency bands are too low, the reliability of the bearing estimations for the corresponding frequency band will be reduced.
4.4. Lamb wave and bearing estimation
4.4.1. Relationship between the Lamb wave and x-direction peak displacement
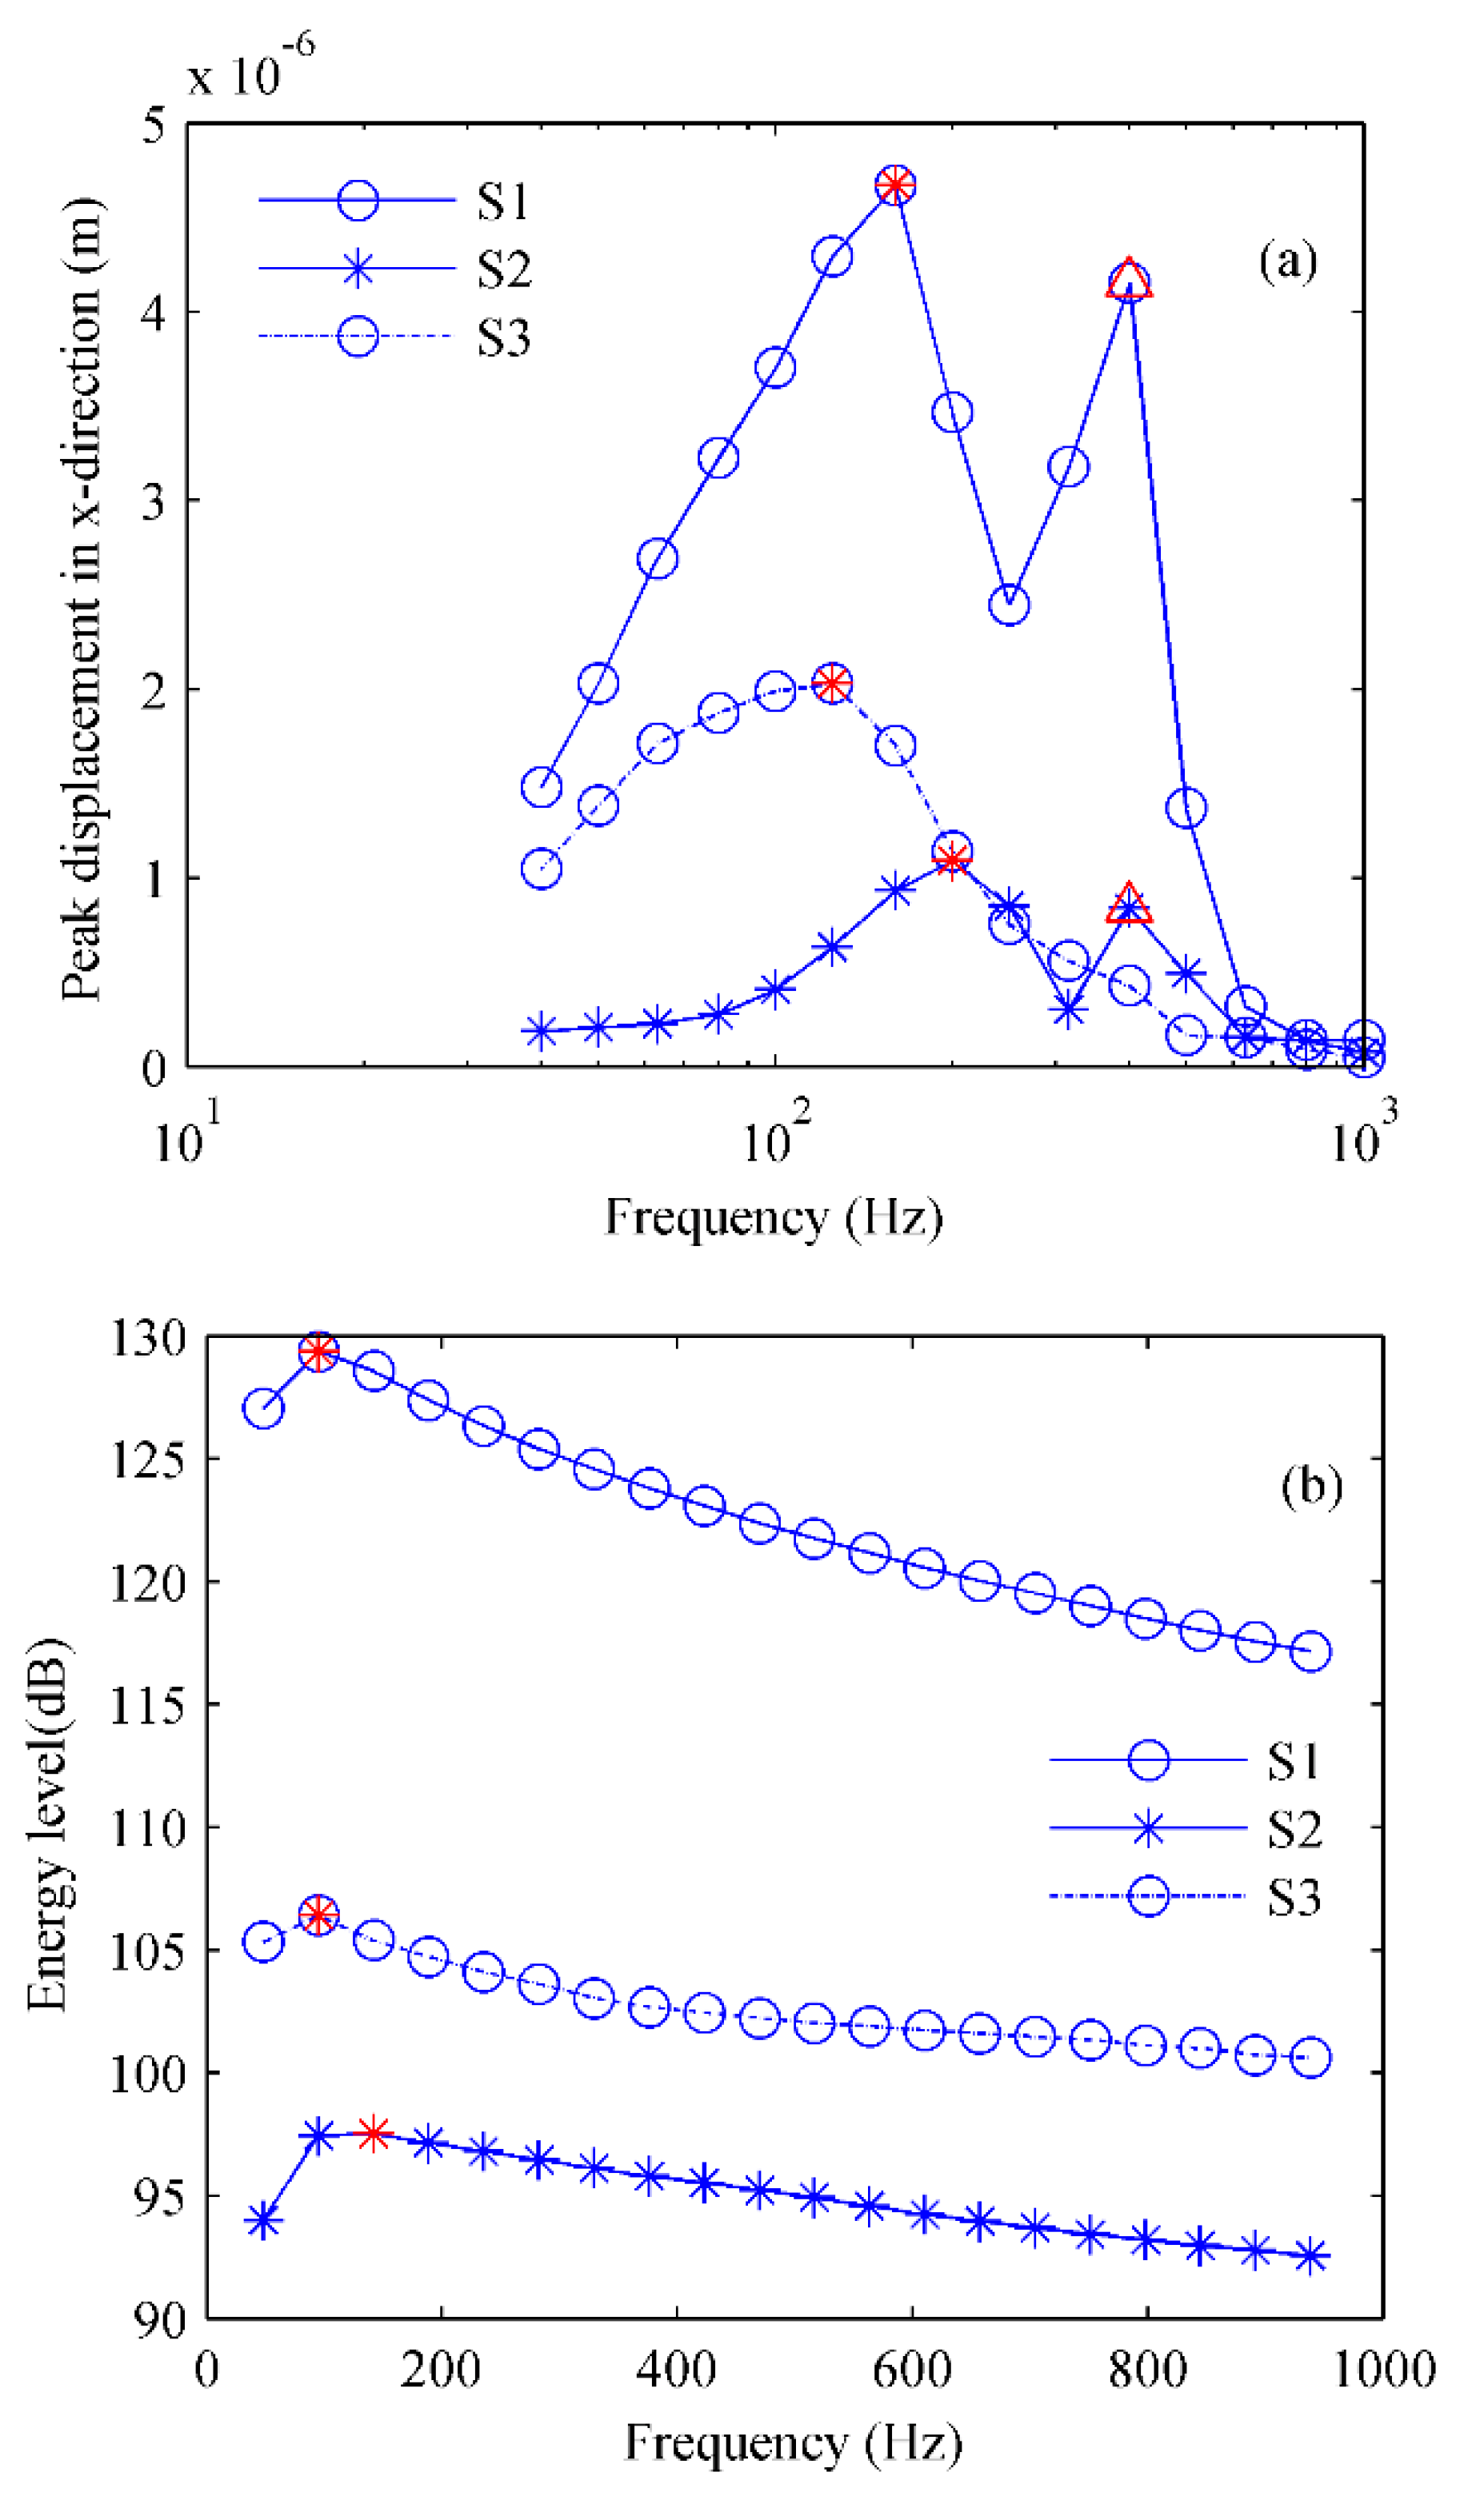
The relationship between the
x-direction peak displacements and frequencies at the three sites is shown in
Figure 8 (a). Simultaneously, taking the frequency band width Δ
f = 47.875 Hz as the processing interval, the energy level of the acoustic sources recorded by the USR was calculated at three sites, and the results are shown in
Figure 8 (b).
As shown in
Figure 8(a), the peak displacement distribution structure shows a bimodal distribution at sites S1 and S2, while it shows a single peak distribution at site S3. In
Figure 8(b), the energy level received by USR shows a single peak distribution at sites S1, S2 and S3, and there is no second peak at any site. By comparing
Figure 8 (a) to
Figure 8 (b), it can be found that the peak distribution structure is changed for the same source at site S1 or S2 from the singlet structure to the bimodal structure but maintains the same singlet structure at site S3. Why is the peak distribution changed at site S1 or S2 but remains unchanged at site S3? This may be attributed to the Lamb wave. If an acoustic source is in the sea water beneath the ice, given an incident angle, certain frequencies of the Lamb modes can be excited (Yang, et al., 1981). When some Lamb mode of the ice plate was excited at sites S1 and S2, the horizontal displacement in the frequency band of the mode was higher, and the second peak was produced in the peak distribution structure. When the Lamb mode of the ice plate was not excited at site S3, the horizontal displacement in the frequency band of the mode was not higher, and there was no second peak in the displacement distribution structure. This idea will be further confirmed below.
4.4.2. Relationship between the Lamb wave and the second peak
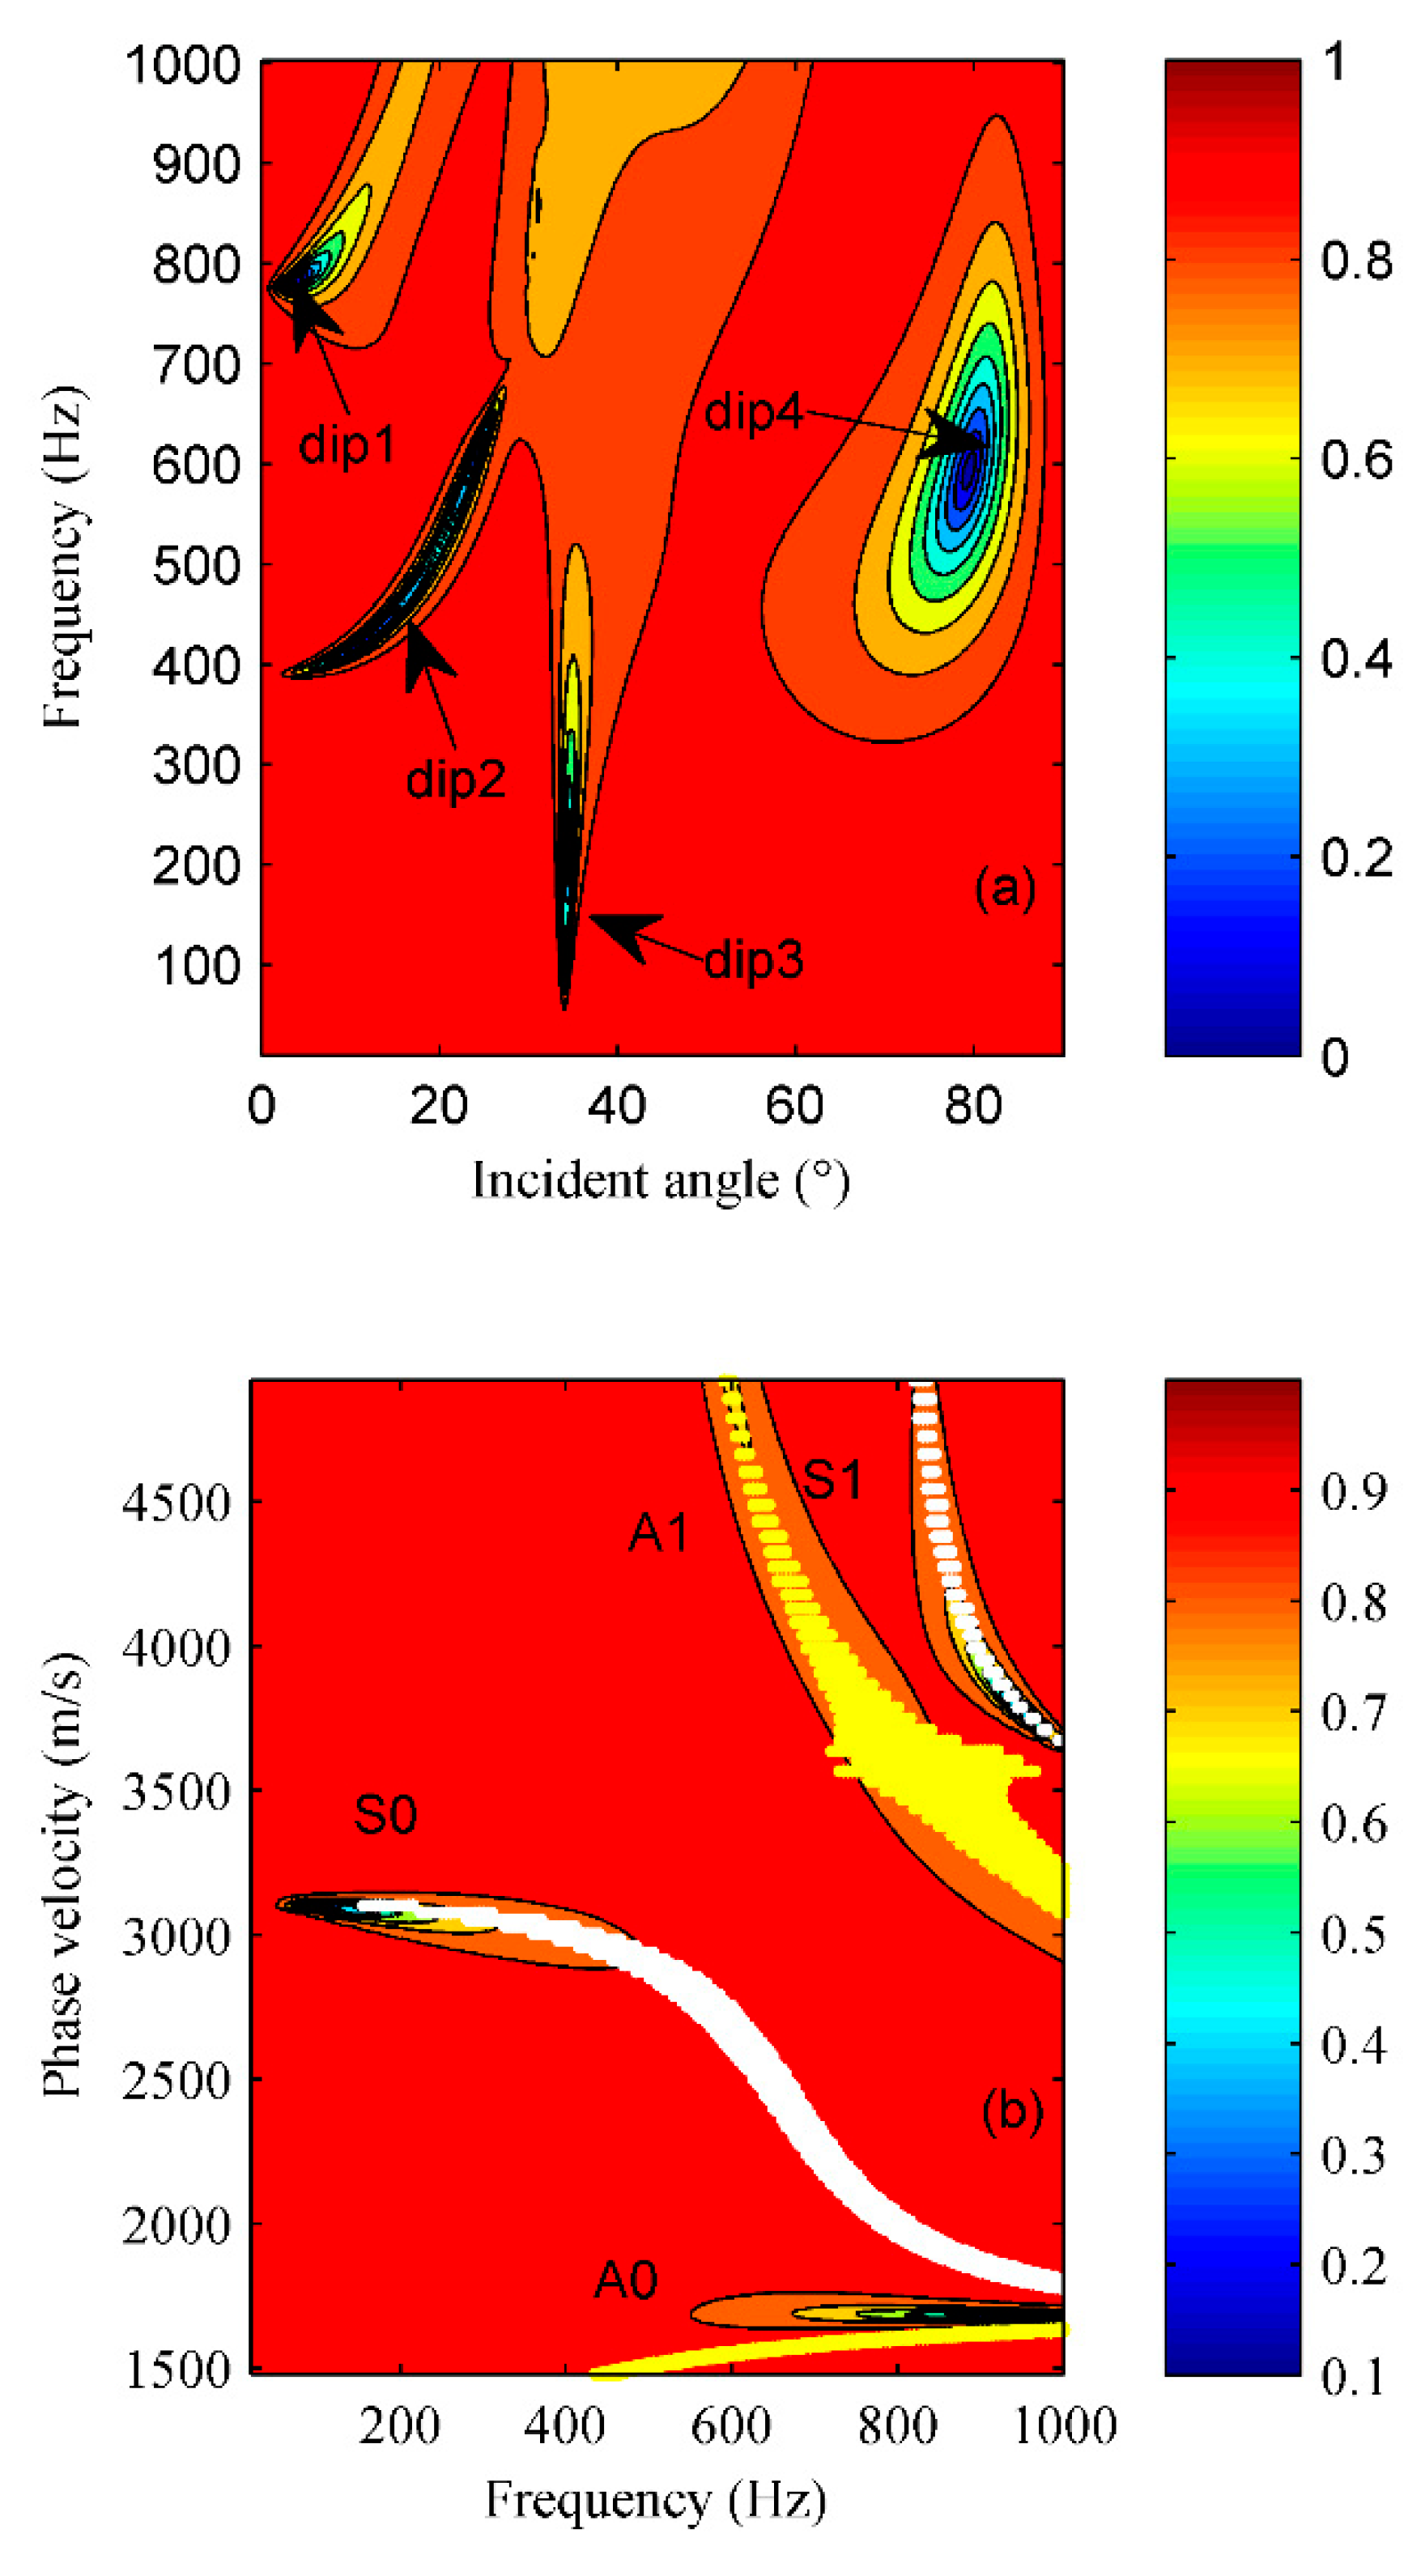
When a Lamb wave is excited, it takes away energy from the incident beam in certain frequency bands, which induces a resonance structure in reflectivity, and the dips in the reflection coefficient diagram correspond to some Lamb mode of the ice plate (Hobæk et al., 2016). By the full wave integration model OASES, let the longitudinal wave velocity c
p of the ice layer be 3600 m/s, the shear wave velocity c
s be 1800 m/s, the density ρ be 0.9 g/cm
3, the longitudinal wave attenuation coefficient α
p be 0.216 dB/λ (λ is wavelength), the shear wave attenuation coefficient α
s be 0.648 dB/λ (Hope et al., 2017), the density of seawater be 1000 kg/m
3, the sound velocity of seawater be 1480 m/s, and the frequency band be 10–1000 Hz. The reflection coefficient is calculated for the water/ice interface with 2 m smooth sea-ice, as shown in
Figure 9(a). By Snell’s Law, the incident angle can be changed to phase velocity, the reflection coefficient can be showed by the phase velocity and frequency. The Lamb modes of the ice plate are calculated(Schock et al., 1952). The reflection coefficient and the Lamb modes can be shown in
Figure 9 (b).
In
Figure 9(a), four obvious dips with low reflection coefficient are marked. The dips in the reflection coefficient diagram corresponds to some mode of Lamb wave of ice plate (Hobæk et al., 2016). It can also be found in
Figure 9 (b).That mean, the vibration frequency of the Lamb wave is connected with the incident angle(phase velocity) of the acoustic wave and the thickness of the ice layer.
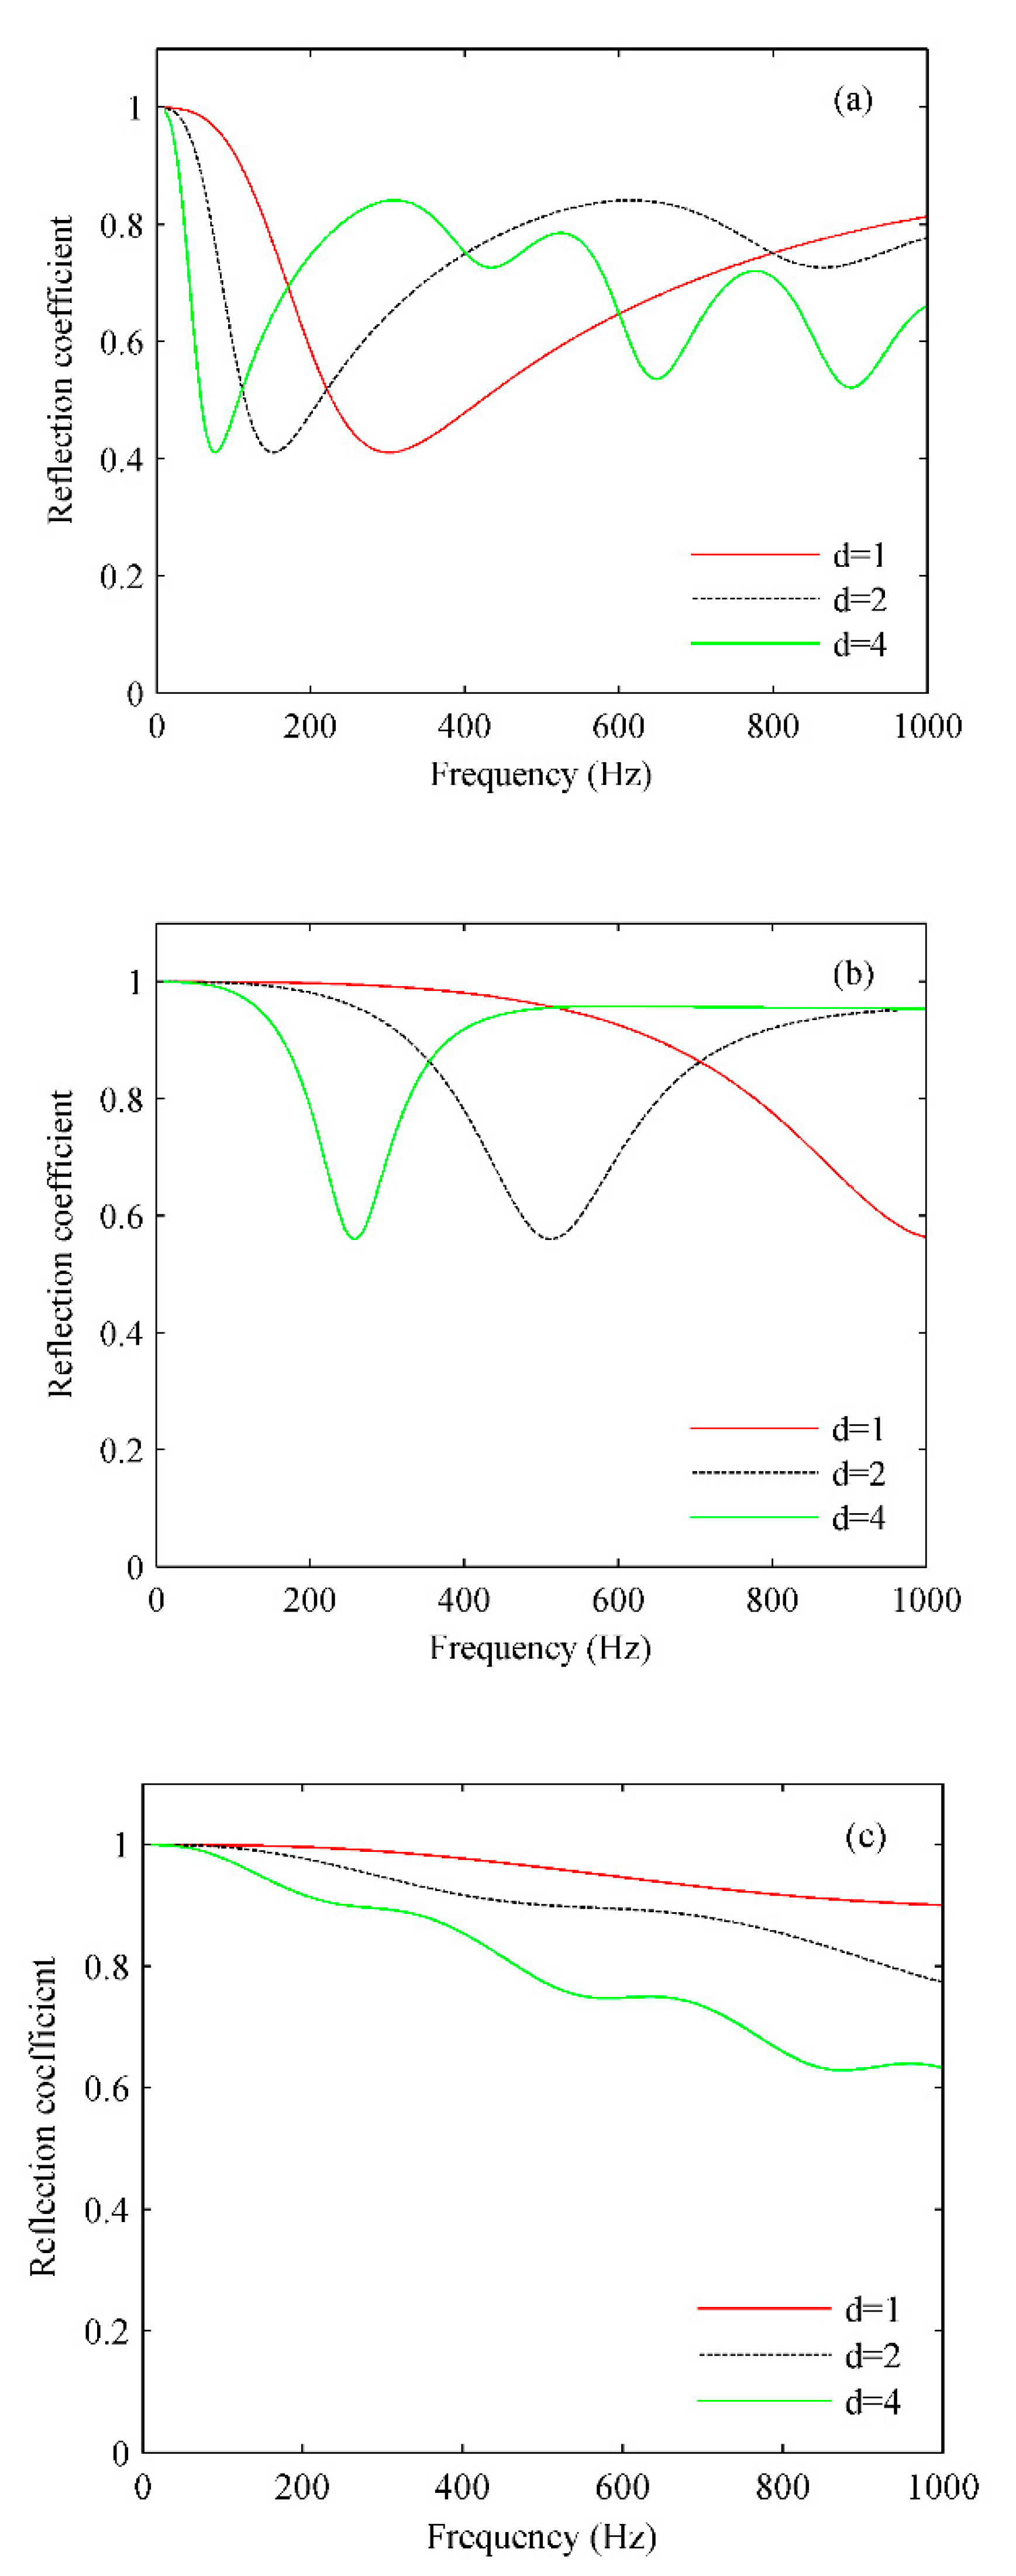
When the ice thickness is 1, 2, and 4 m, the incident angles are 35°, 73.6° and 45°, respectively, in the Arctic experiment at the three sites, and the computed reflection coefficients are shown in Figs. 10 (a) – (c).
At site S1, the incident angle is 35°, the ice thickness d is relatively small, near 1 m, and the obvious dip in the reflection coefficient diagram is in the frequency band of 200–400 Hz, as shown in
Figure 10 (a). Comparing
Figure 10 (a) to
Figure 8 (a), the frequency corresponding to the second peak at site S1 is near 400 Hz. Therefore, the frequency band corresponding to the peak is consistent with the frequency band corresponding to the dip in the diagram of the reflection coefficient. This is also consistent with the hypothesis that at site S1, some mode of the Lamb wave was excited, and the second peak was produced.
At site S2, the incident angle is 73.6°, the ice thickness d is near 2 m, and the obvious dip in the reflection coefficient diagram is in the frequency band of 400–600 Hz, as shown in
Figure 10 (b). Comparing
Figure 10 (b) to
Figure 8 (a), the frequency corresponding to the second peak at site S2 is near 400 Hz. Therefore, the frequency band corresponding to the peak is also consistent with the frequency band corresponding to the dip in the diagram of the reflection coefficient. This is also consistent with the hypothesis that at site S2, some mode of the Lamb wave in the ice was excited, and the second peak was produced.
At site S3, the incident angle is 45°, the ice thickness d is near 2 m, and there is no obvious dip in the reflection coefficient diagram, as shown in
Figure 10 (c). This means that no mode of the Lamb wave of the ice plate is excited at the site. As we can see from
Figure 8 (a), at site S3, there is no bimodal structure but a single peak structure, which is consistent with the fact that Lamb is not excited in the ice layer; thus, the second peak cannot be generated.
4.4.3. Relationship between the Lamb wave and bearing-estimation error
At sites S1 and S2, in the excitation frequency band near 400 Hz, which corresponds to the second peak, the error is relatively smaller, within 25°, as shown in Figs. 5 (a) and 6 (a), and the bearing estimation is efficient. At site S3, there is no excited second peak, the bearing estimation errors in the frequency band near 400 Hz are larger, more than 25°, as shown in
Figure 7 (a), and the bearing estimation is bad. According to the previous analysis in this study, the bearing-estimation errors are connected with the value of peak displacement, and the excited mode of Lamb waves are connected with the excited second peak in
Figure 8 (a). Thus, it can be presumed that if some mode of the Lamb wave of the ice plate is excited, the bearing-estimation error in the frequency band of the excited peak would be relatively smaller, and the frequency band for the bearing-estimation would be efficient. In other words, if some mode of the Lamb wave is excited, the efficient frequency band for the bearing estimation would be widened.
Normally, the thickness of the ice layer cannot be changed. If the ice thickness is constant, the excitation of the Lamb wave is related to the incident angle. Therefore, the bearing-estimation error is related to the incident angle. However, we can adjust the incident angle by moving the received distance to excite some mode of the Lamb wave so that more energy can enter the ice layer and the frequency band with a good bearing estimation effect will be widened.
If the incident angle is constant and some mode of the Lamb wave is excited, there would be a dip in the reflection coefficient diagram, as shown in Figs. 10 (a). The thinner is the ice layer, the higher is the frequency of the dip. That is, if the ice layer is thinner, the Lamb wave will be excited at a higher frequency, which means that a relatively higher and wider frequency band of acoustic signals may be obtained for good bearing estimation. Therefore, if we want to bear an acoustic source in a higher frequency band, a thinner ice layer would be selected, and some mode of the Lamb wave can be excited, letting more energy enter into the ice layer, which is conductive to the bearing.
4.5. Better bearing estimation and some questions
Through the analysis of the relationship between the bearing-estimation error and the value of the horizontal peak displacement, it can be seen that to obtain a good bearing estimation of the source, it is necessary to select an appropriate frequency band of the acoustic source. It is better to avoid some frequency bands with low horizontal displacement peaks. If the value of the horizontal peak displacement is too small, the acoustic energy entering the ice is often too small, which is unfavorable to the bearing estimation for the underwater acoustic source, and the bearing estimation error would be larger. Second, it is necessary to make good use of the Lamb wave. When the incident angle and ice thickness meet certain conditions, some mode of the Lamb wave of the ice plate will be excited, and the acoustic energy entering the ice will be increased, which is conducive to bearing estimation of the source.
In the results of the experiments, we also find that some peak displacements are larger, but the bearing estimation errors are also slightly larger in the corresponding frequency bands. For example, at site S1, when the frequency is 200 Hz, the value of the
x-direction peak displacement is greater than the threshold, but the bearing estimation error is close to 20°, as shown in
Figure 5 (a). In addition, during the experiments at sites S1 and S2, no obvious bimodal distribution was observed in the
y-direction displacement. This may be caused by the ice being inhomogeneous or that the real bearing is too small (the real bearing is -5° at sites S1 and S2), which makes the y component of the corresponding angle relatively small; thus, the
y-direction peak displacement is too small to be observed. These problems will be further explored in future research work.
5. Conclusions
Using an ice-mounted geophone and an USR, source bearing estimation experiments are performed at three ice cap sites in the central Arctic Ocean during the 11th Chinese National Arctic Research Expedition, and the relationship between the errors of bearing estimation and frequency bands is studied. The bearing-estimation errors to an acoustic source in different frequency bands are related to the x- or y-direction peak displacements received by the ice-mounted geophone. The higher is the peak displacement, the smaller is the bearing estimation error. When the value of the x- or y-direction peak displacement in some frequency band is lower than a certain threshold, the bearing estimation error corresponding to the frequency band becomes larger, almost larger than 25°.
When the incident angle of the acoustic source and the thickness of the ice meet certain conditions, some mode of the Lamb wave in the ice layer will be excited, and the peak distribution structure of the horizontal displacement will be changed. The bearing estimation errors in the frequency band corresponding to the Lamb wave are reduced, and the efficient frequency band of the signal for the bearing estimation will be widened.
Considering that there are still some problems with source bearings caused by the anisotropy of the ice layer or small real bearing angle in the experiment, Arctic acoustic experiments and research will need to be continuously performed. Underwater acoustic source bearing estimation and the coupling propagation mechanism of underwater acoustic signals across ice to ice surfaces will be further studied.
Acknowledgements
This work was supported by the National Key R&D Program of China (2021YFC2801202), the Natural Science Foundation of Fujian Province of China (2023J011382), the National Nature Science Foundation of China (42276192, 42076236), and the Scientific Research Foundation of Third Institute of Oceanography, MNR (No.2022020). We thank the officers and crew of RV Xue Long 2 during the Eleventh Chinese National Arctic Research Expedition.
References
- Arvelo, J. I., 2012. “Arctic marine mammal passive monitoring and tracking with a single acoustic sensor,” J. Acoust. Soc. Am. 132(3): 1949. [CrossRef]
- Becklehimer, J. L., 1991. “A Fortran program for computing beam patterns for geophone arrays,” Comput Geosci. 17(5), 633–640. [CrossRef]
- Brook, G. H., Ozard, J. M., 1989. “In situ measurement of elastic properties of sea ice,” Underwater Acoustic Data Processing, Kluwer Academic, Dordrecht, The Netherlands,:113-118.
- Dosso, S. E., 2014. “Three-dimensional localization of transient acoustic sources using an ice-mounted Geophone,” J. Acoust. Soc. Am.135(1): 124-133. [CrossRef]
- Dosso, S. E., Heard, G. J., Vinnins, M., 2002. “Source bearing estimation in the Arctic Ocean using ice-mounted geophones,” J. Acoust. Soc. Am.112(6): 2721-2734. [CrossRef]
- Dosso, S. E., Heard, G. J., Vinnins, M., 2003. “Arctic field trials of source bearing estimation using ice-mounted geophones (L),” J. Acoust. Soc. Am.113(6): 2980-2983. [CrossRef]
- Hobæk, H., Sagen, H., 2016. “On underwater sound reflection from layered ice sheets,” In Proceedings of the 39th Scandinavian Symposium on Physical Acoustics, Geilo, Norway, arXiv:1604.02247.
- Hope, G., Sagen, H., Storheim, E., Hobæk, H., Freitag, L., 2017. “Measured and modeled acoustic propagation underneath the rough Arctic sea-ice,” J. Acoust. Soc. Am. 142(3):1619-1633. [CrossRef]
- Miller, B. E., Schmidt, H., 1991. “Observation and inversion of seismoacoustic waves in a complex Arctic ice environment,” J.Acoust.Soc.Am. 89(4):1668-1685. [CrossRef]
- Mitchell, S. K., Bedford, N. R., Ellis, G. E., 1980. “Multipath analysis of explosive source signals in the ocean,” J. Acoust. Soc. Am. 67(5): 1590-1597. [CrossRef]
- Moreau, L., Boue, P., Serripierri, A.,et.al, 2020. “Sea ice thickness and elastic properties from the analysis of multimodal guided wave propagation measured with a passive seismic array,” J. Geophys. Res:Oceans,1-24. [CrossRef]
- Moreau, L., Weiss, J., Marsan, D., 2020. “Accurate estimations of sea-ice thickness and elastic properties from seismic noise recorded with a minimal number of geophones: from thin landfast ice to thick pack ice,” J. Geophys. Res:Oceans,125:1-17. [CrossRef]
- Schock, A., 1952. “Der schalldurchgang durch platten,” Acustica.2: 1-17.
- Stein, P. J., Euerle, S. E., Parinella, J. C., 1998. “Inversion of pack ice elastic wave data to obtain ice physical properties,” J. Geophys. Res. 103(C10):21783–21793.
- Verrall, R., Ganton, J., 1977. “The Reflection of Acoustic Waves in Sea Water from an Ice-Covered Surface,” Defense Research Establishment Pacific (Canada) Tech.Memo.77-8:31.
- White, J. E., 1964. “Motion product seismograms,” Geophysics. 29(2): 288–298. [CrossRef]
- Yang, T. C., Giellis, G. R., 1994. “Experimental characterization of elastic waves in a floating ice sheet,” J. Acoust. Soc. Am. 96(5):2993-3009.
- Yang, T.C., Votaw, C.W., 1981. “Under ice reflectivities at frequencies below 1kHz,” J. Acoust. Soc. Am.70(3): 841-851. [CrossRef]
Figure 1.
Sensitivity response to the frequency: (a) geophone and (b) underwater signal recorder.
Figure 1.
Sensitivity response to the frequency: (a) geophone and (b) underwater signal recorder.
Figure 2.
Field trial geometry.
Figure 2.
Field trial geometry.
Figure 3.
Three-directional signals received by geophone: (a) three-directional displacement, (b) x-direction displacement, (c) y-direction displacement and (d) z-direction displacement.
Figure 3.
Three-directional signals received by geophone: (a) three-directional displacement, (b) x-direction displacement, (c) y-direction displacement and (d) z-direction displacement.
Figure 4.
Bearing-estimation results of each frequency band of the first acoustic source at site S1. (The black line represents the rotational radial power in different directions, and the blue arrow represents the direction of the maximum radial power direction).
Figure 4.
Bearing-estimation results of each frequency band of the first acoustic source at site S1. (The black line represents the rotational radial power in different directions, and the blue arrow represents the direction of the maximum radial power direction).
Figure 5.
The bearing estimation and peak displacements for each frequency band at site S1: (a) The bearing estimation, (b) x-direction peak displacements and (c) y-direction peak displacements.
Figure 5.
The bearing estimation and peak displacements for each frequency band at site S1: (a) The bearing estimation, (b) x-direction peak displacements and (c) y-direction peak displacements.
Figure 6.
The bearing estimation and peak displacements for each frequency band at site S2: (a) The bearing estimation, (b) x-direction peak displacements and (c) y-direction peak displacements.
Figure 6.
The bearing estimation and peak displacements for each frequency band at site S2: (a) The bearing estimation, (b) x-direction peak displacements and (c) y-direction peak displacements.
Figure 7.
The bearing estimation and peak displacements for each frequency band at site S3: (a) The bearing estimation, (b) x-direction peak displacements and (c) y-direction peak displacements.
Figure 7.
The bearing estimation and peak displacements for each frequency band at site S3: (a) The bearing estimation, (b) x-direction peak displacements and (c) y-direction peak displacements.
Figure 8.
Displacement and energy level received at different sites: (a) peak displacement received by geophone and (b) energy level received by USR.
Figure 8.
Displacement and energy level received at different sites: (a) peak displacement received by geophone and (b) energy level received by USR.
Figure 9.
Reflection coefficient and Lamb wave with ice thickness d = 2: (a) reflection coefficient and (b) reflection coefficient and some modes of Lamb waves.
Figure 9.
Reflection coefficient and Lamb wave with ice thickness d = 2: (a) reflection coefficient and (b) reflection coefficient and some modes of Lamb waves.
Figure 10.
Reflection coefficient at different incident angles: (a) incident angle of 35°, corresponding to site S1; (b) incident angle of 73.6°, corresponding to site S2; and (c) incident angle of 45°, corresponding to site S3.
Figure 10.
Reflection coefficient at different incident angles: (a) incident angle of 35°, corresponding to site S1; (b) incident angle of 73.6°, corresponding to site S2; and (c) incident angle of 45°, corresponding to site S3.
Table 1.
Basic information of bearing estimation experiments.
Table 1.
Basic information of bearing estimation experiments.
Site
name
|
Site
coordinate
|
Experimental time |
Real bearing (°) |
Horizontal distance
R (m)
|
Source depth
D (m) |
Source
quantity
|
| S1 |
84.5125°N
168.6950°W |
20200816 |
-5 |
70 |
100 |
2 |
| S2 |
86.0430°N
160.8985°W |
20200818 |
-5 |
340 |
100 |
2 |
| S3 |
85.4917°N
179.9095°E |
20200824 |
90 |
100 |
100 |
2 |
Table 2.
Peak displacements at each center frequency of the received signals at site S1.
Table 2.
Peak displacements at each center frequency of the received signals at site S1.
| Frequency/Hz |
1000 |
800 |
630 |
500 |
400 |
|
|
x peak/10-7 m |
1.1376 |
1.2432 |
5.295 |
13.085 |
38.113 |
|
|
y peak/10-7 m |
0.6745 |
1.0727 |
1.6269 |
1.712 |
4.252 |
|
|
z peak/10-7 m |
1.5068 |
2.6327 |
3.9844 |
8.7499 |
44.337 |
|
| Frequency/Hz |
315 |
250 |
200 |
160 |
125 |
|
|
x peak/10-7 m |
29.355 |
28.626 |
43.977 |
49.736 |
42.540 |
|
|
y peak/10-7 m |
11.638 |
8.931 |
24.205 |
32.477 |
28.067 |
|
z peak/10-7 m |
16.462 |
17.636 |
24.518 |
26.595 |
29.062 |
| Frequency/Hz |
100 |
80 |
63 |
50 |
40 |
|
x peak/10-7 m |
39.758 |
34.733 |
29.084 |
21.995 |
16.103 |
|
y peak/10-7 m |
21.433 |
15.521 |
10.426 |
6.158 |
3.557 |
|
z peak/10-7 m |
31.986 |
36.409 |
40.675 |
38.246 |
32.068 |
|
Disclaimer/Publisher’s Note: The statements, opinions and data contained in all publications are solely those of the individual author(s) and contributor(s) and not of MDPI and/or the editor(s). MDPI and/or the editor(s) disclaim responsibility for any injury to people or property resulting from any ideas, methods, instructions or products referred to in the content. |
© 2023 by the authors. Licensee MDPI, Basel, Switzerland. This article is an open access article distributed under the terms and conditions of the Creative Commons Attribution (CC BY) license (http://creativecommons.org/licenses/by/4.0/).
