1. Introduction
The motivation behind this research is to improve precision and accuracy in stock market prediction. Our aim is to overcome the limitations of traditional models by exploring the accuracies of different hybrid ensembles. By combining different algorithms to make a hybrid model, It will achieve a level of predictive accuracy that could revolutionize decision-making tools for investors and financial analysts.
In this paper, a comprehensive study is presented that covers the development, evaluation, and comparison of various hybrid models. We distinctly highlight the optimal performance of one standout hybrid model: the LSTM+GRU+Conv1D model. Our research reveals that this model demonstrates remarkable predictive results, with accuracy metrics that emphasize its potential to reshape the field of stock price prediction.
This paper is organized as follows: Section II discusses related work. Proposed work which includes data preparation, feature engineering, and model normalization is presented in section III. Detailed methodology is discussed in section IV. Comparative results of different approaches are analyzed in section V. This section gives us detailed numerical results and performance metrics, providing a comprehensive view of our findings. Finally, this paper is concluded in section VI. This research not only highlights the effectiveness of hybrid modeling but also encourages further exploration in the dynamic field of predictive modeling, driven by the goal of achieving precision and accuracy.
2. Related Work
Comparative Analysis of Stock Market Prediction System using SVM and ANN evaluates the effectiveness of Artificial Neural Networks (ANN) and Support Vector Machines (SVM) in predicting daily stock market trends [1,2]. Both models demonstrated similar performance in terms of accuracy, with ANN requiring slightly more time for higher accuracy. The study suggests the potential for more efficient models in future research and considers the application of deep learning techniques. While the focus here is on UP or DOWN trend prediction, future work will explore stock price prediction using advanced machine learning methods [3]. Investing in stocks carries risks tied to various factors. Successful trading requires accurate predictions. Investors often use techniques like fundamental and technical analysis. Machine learning models like Genetic Algorithm (GA), Support Vector Machine (SVM), and Neural Network (NN) aid in stock prediction [4]. This study focuses on Binary Tree SVM and proposes One-Against-All SVM (OAA-SVM) algorithms for efficient multi-class classification, aiming to enhance stock market prediction accuracy [5].
Neural networks, a powerful data mining tool, have gained prominence in stock market prediction. This study employs various deep learning models (MLP, RNN, LSTM, CNN) to forecast stock prices using historical data from the Indian National Stock Exchange (NSE) and the New York Stock Exchange (NYSE). The CNN model stands out, performing well on both NSE and NYSE data, demonstrating shared dynamics between these markets [6]. Neural networks outperform traditional ARIMA models in accuracy and predictive capability [7].
Accurate stock market prediction is vital for investors, whether for long-term planning or minimizing losses. This study leverages LSTM [8], a recurrent neural network, and CNN for forecasting. Stock market prediction involves both fundamental and technical analysis, with this study focusing on historical price data. LSTM efficiently processes data sequences, incorporating memory cells for effective memory linking [9]. The study generates sequential data to predict stock prices using time steps [10].
Developing accurate stock price prediction models for high-frequency financial data is a challenging task. This study introduces two novel models for live stock price prediction. The first model employs Fast Recurrent Neural Networks (Fast RNNs), a new approach in stock prediction. The second model is a hybrid deep learning model combining Fast RNNs, Convolutional Neural Networks, and Bi-Directional Long Short-Term Memory models to predict abrupt stock price changes. The models are evaluated based on their Root Mean Squared Error (RMSE) and computa- tional complexity. These models outperform traditional methods and other proposed hybrid models in terms of both RMSE and computation time for live stock price predictions [11].
3. Data Collection and Preprocessing
3.1. Data Source and Collection Process
The dataset utilized in this research is obtained from Yahoo Finance, a widely recognized and reliable source for historical financial data. Yahoo Finance provides a repository of financial market data, including stock prices, trading volumes, and various financial indicators. The dataset used in this study starts from July 1, 2014, to September 6, 2023, capturing a substantial period of stock price history for the chosen asset, Google (GOOG).
The data collection process involves querying Yahoo Finance’s data repository for daily stock price information during the specified time frame. The following Python libraries and modules were instrumental in this data collection process:
- yfinance: This Python library facilitates the retrieval of historical financial data from Yahoo Finance. It offers a convenient interface for querying and downloading stock price data.
Once the data was collected, it was subjected to a series of preprocessing steps to ensure its quality and suitability for predictive modeling.
3.2. Preprocessing Steps
3.2.1. Data Cleaning
The initial dataset retrieved from Yahoo Finance may contain irregularities, outliers, or missing values. To ensure data integrity, a data cleaning process was executed. Any duplicate entries were removed, and missing data points were addressed through imputation or removal, as appropriate.
3.2.2. Handling Missing Values
Missing data points are common in financial datasets, often occurring due to holidays or market closures. In this study, we employed a systematic approach to address missing values. Rows containing missing values were removed, and for features requiring imputation, we utilized forward fill or backward fill methods to propagate the last observed value.
3.2.3. Feature Engineering
Feature engineering is a pivotal aspect of data preprocessing, as it involves creating additional features or transforming existing ones to enhance predictive modeling. In this research, lagged features were engineered to capture the historical behavior of the stock price. Specifically, for each day, lagged values of the closing price (up to the specified number of lags) were created to serve as input features for the predictive models.
3.3. Normalization Technique: Min-Max Scaling
Normalization is a critical step to standardize the range of input features and ensure that all features contribute equally to the predictive models. In this study, we employed Min-Max scaling, a widely used normalization technique.
Min-Max scaling transforms each feature to a specific range, typically between 0 and 1. The formula for Min-Max scaling is as follows:
Where
- -
(X) represents the original feature values.
- -
(Xmin)istheminimumvalueofthefeature.
- -
(Xmax)isthemaximumvalueofthefeature.
Min-Max scaling ensures that all feature values fall within a standardized range, which is essential for machine learning algorithms that are sensitive to the scale of input features. By applying this technique, we were able to bring uniformity to the input data, facilitating the training and evaluation of predictive models [16].
4. Methodology
4.1. Types of Hybrids
4.1.1. LSTM + Reinforcement Learning + Linear Regression
Rationale: The LSTM + Reinforcement Learning + Linear Regression hybrid model combines the strengths of three distinct paradigms: deep learning, reinforcement learning, and traditional linear regression. The LSTM layer captures sequential patterns in stock price data, the reinforcement learning component optimizes model actions based on rewards, and the linear regression layer provides interpretability by combining features linearly [16].
Architecture: This model initiates with an LSTM layer containing 64 units and a ReLU activation function to capture temporal dependencies. Following the LSTM
Layer, the reinforcement learning component guides the model’s actions, optimizing for the most promising outcomes. Finally, a linear regression layer is incorporated to provide a linear combination of features, resulting in the final prediction.
4.1.2. LSTM + GRU + Conv1D
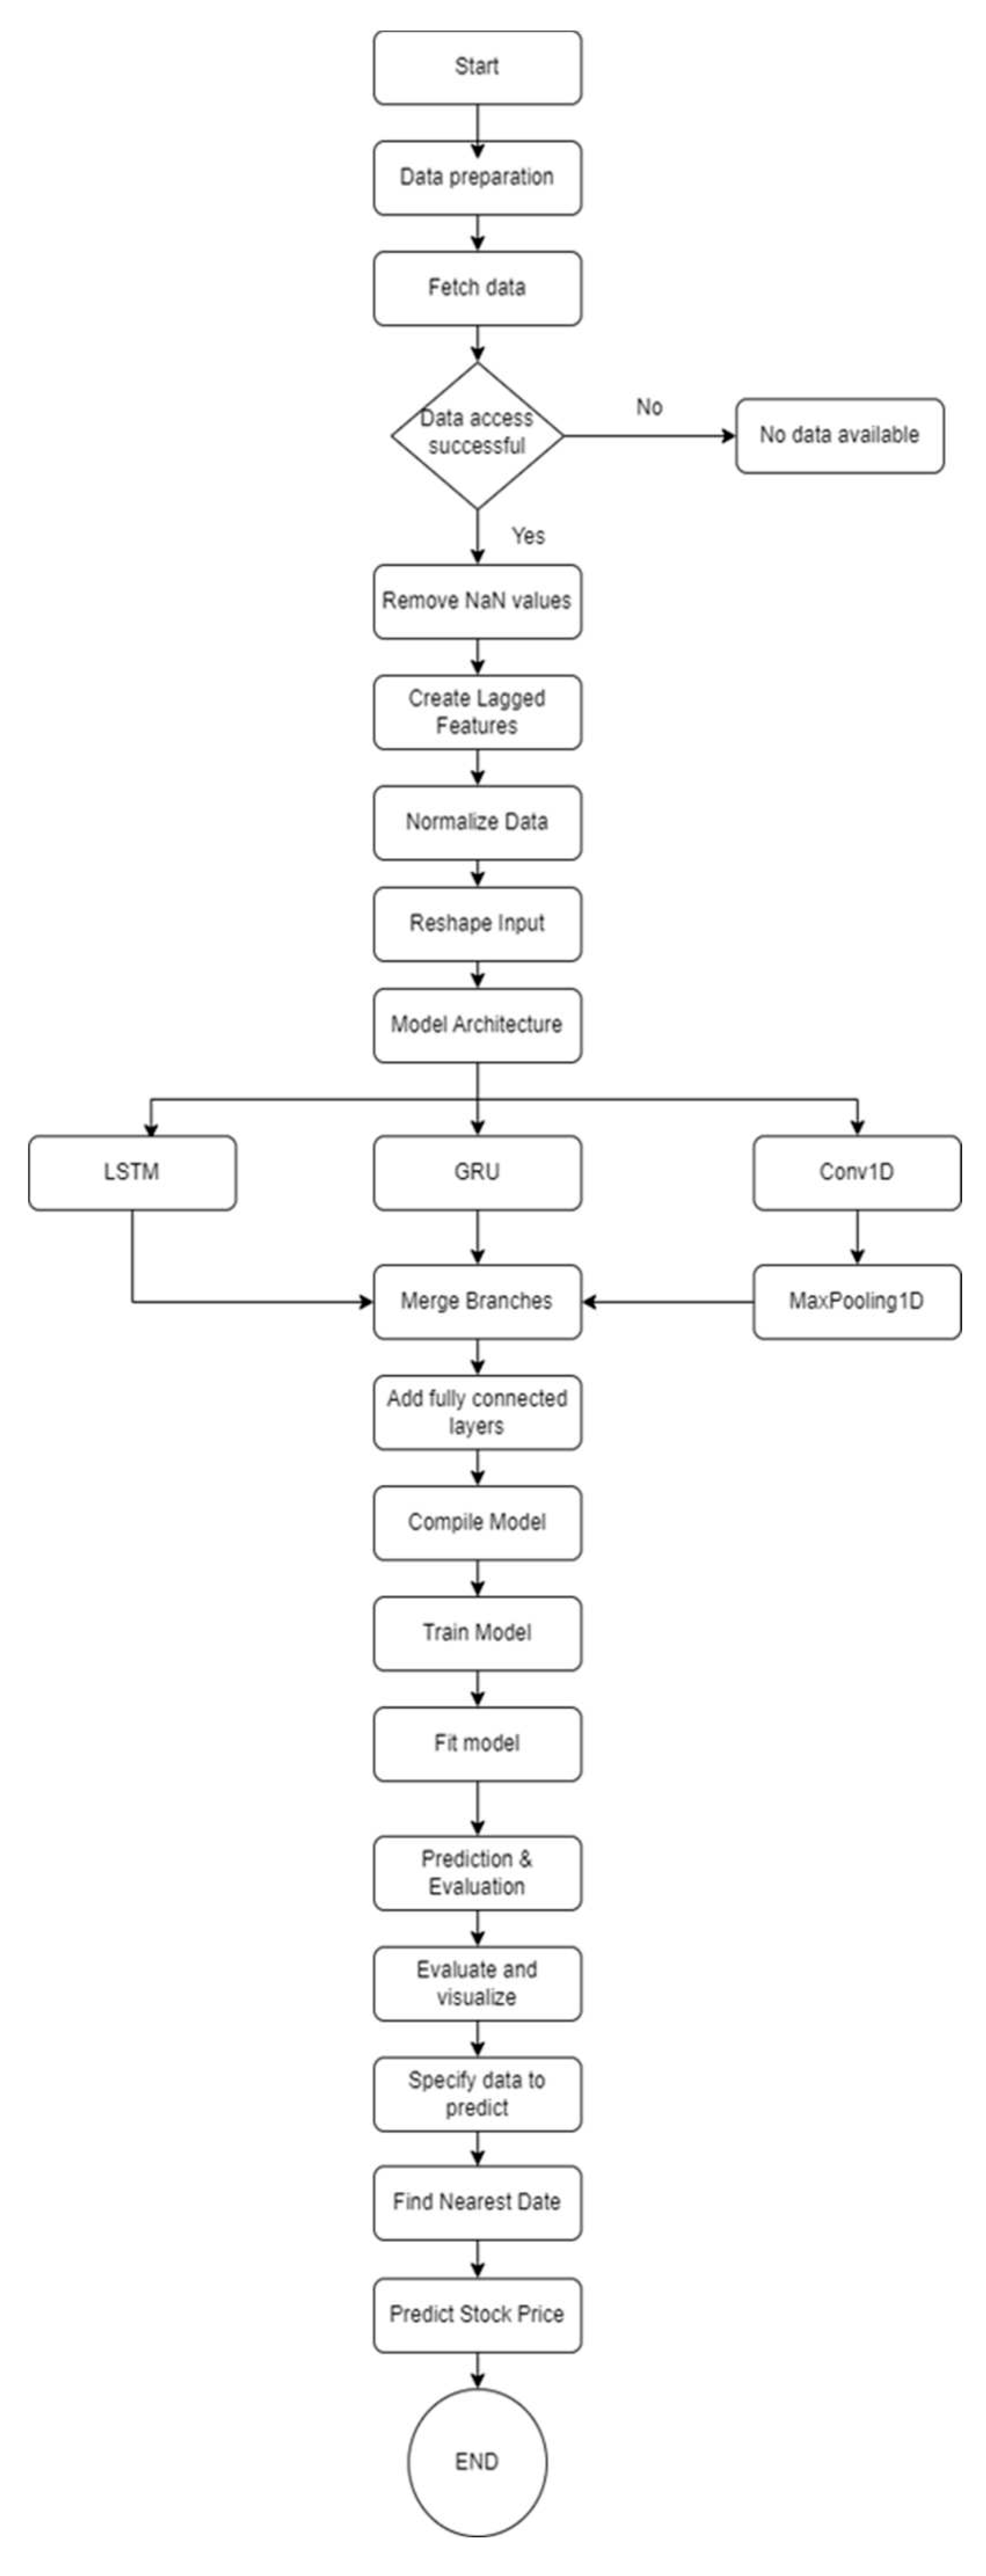
Rationale: The LSTM + GRU + Conv1D hybrid model is designed to capture intricate patterns in stock price data by blending three distinct neural network architectures [12–14]. The LSTM (Long Short-Term Memory) and GRU (Gated Recurrent Unit) components specialize in modeling sequential data effectively, allowing the model to grasp both short-term and long-term dependencies [15]. In contrast, the Conv1D (1D Convolutional Neural Network) layer is responsible for feature extraction from the sequential input, enabling the model to identify essential patterns and trends.
Figure 1.
LSTM+GRU+Conv1D.
Figure 1.
LSTM+GRU+Conv1D.
Architecture: This hybrid model consists of three branches: LSTM, GRU, and Conv1D. Each branch incorporates a single layer with 64 units and Rectified Linear Unit (ReLU) activation functions. After processing the data through these branches, their outputs are concatenated and passed through a dense layer with 128 units, also using a ReLU activation function. The final output layer is a single unit designed for regression tasks.
4.1.3. Linear Regression + SVM
Rationale: The Linear Regression + SVM hybrid model combines two well-established regression techniques to address both linear and non-linear relationships in stock price data. Linear Regression models the relationship between features and the target variable linearly [6], while Support Vector Machines (SVM) excel at capturing non-linear patterns.
Architecture: This hybrid model is composed of two key components: a Linear Regression model and an SVM model. The Linear Regression model learns linear coefficients to assign weights to features, capturing linear relationships effectively [6]. Simultaneously, the SVM model utilizes kernel functions to identify complex, nonlinear patterns in the data, providing a holistic approach to prediction [17,18].
4.1.4. MLPRegressor + GradientBoostingRegressor
Rationale: The MLPRegressor + GradientBoostingRegressor hybrid model merges the power of neural networks, specifically Multi-Layer Perceptrons (MLP), with the boosting technique offered by Gradient Boosting Regressors. This combination aims to leverage the capacity of neural networks for capturing complex patterns while benefiting from boosting to enhance predictive accuracy.
Architecture: The MLPRegressor component consists of two hidden layers: the first with 100 units and the second with 50 units, both utilizing Rectified Linear Unit (ReLU) activation functions. This design allows the neural network to learn intricate relationships within the data. Concurrently, the GradientBoostingRegressor employs a gradient boosting ensemble with 100 base estimators, iteratively improving model performance by minimizing errors.
4.1.5. XGBRegressor + Linear Regression
Rationale: The XGBRegressor + Linear Regression hybrid model synergizes XGBoost’s gradient boosting capabilities with the simplicity and interpretability of Linear Regression. XGBoost excels at handling complex relationships, while Linear Regression provides a straightforward linear interpretation of features.
Architecture: This hybrid model incorporates two main components: the XGBRegressor and Linear Regression. The XGBRegressor utilizes gradient boosting and employs multiple decision tree estimators to capture intricate patterns in the data [5]. In contrast, Linear Regression offers a linear interpretation of the features, providing a different perspective on the relationship between input variables and the target variable.
These hybrid models are meticulously crafted to harness the strengths of each individual component while addressing the intricate challenges posed by stock price prediction. The specific architectural configurations mentioned above were carefully selected through experimentation and optimization to maximize predictive performance. In the subsequent sections of this paper, we will present comprehensive results and analyses to evaluate the effectiveness of these hybrid models in the context of stock market forecasting.
4.2. Experimental Setup
In this section, we delve into the details of our experimental setup, which encompasses data splitting, hyperparameter tuning, model selection, training processes, and the hardware and software specifications employed for our research.
4.2.1. Data Splitting
To evaluate the performance of our hybrid models, we employed a rigorous data splitting strategy. The historical stock price data obtained from Yahoo Finance, spanning from July 1, 2014, to September 6, 2023, was divided into two distinct subsets:
- -
Training Set: This subset comprises the historical stock price data up to August 18, 2023. It serves as the foundation for training our hybrid models, allowing them to learn patterns, relationships, and trends in the data. The training set is vital for optimizing model parameters and ensuring predictive accuracy.
- -
Testing Set: The testing set includes the stock price data from August 19, 2023, to September 6, 2023. This segment of the data is kept separate from the training set and is used exclusively for model evaluation. It allows us to assess how well our hybrid models generalize to unseen data, providing a robust measure of their predictive capabilities.
4.2.2. Hyperparameter Tuning and Model Selection
Hyperparameter tuning and model selection are pivotal steps in ensuring the optimal performance of our hybrid models. We adopted a systematic approach, involving grid search and cross-validation techniques, to fine-tune hyperparameters. The specific hyperparameters tuned for each model architecture include learning rates, dropout rates, activation functions, and the number of units in neural network layers. Model selection was based on a combination of hyperparameter performance and cross-validation results.
4.2.3. Training the Models
The training process for our hybrid models was conducted with meticulous attention to detail. We employed a common set of training parameters to maintain consistency across the models:
- -
Number of Epochs: Each model was trained over 200 epochs. This choice of epoch count balances training time with convergence to optimal weights and biases.
- -
Batch Sizes: We utilized batch sizes of 32 for training the models. This batch size facilitates efficient weight updates during the training process and prevents excessive memory usage.
4.3. Hardware and Software Specifications:
The training of our hybrid models was executed on a computing infrastructure equipped with the following hardware and software specifications:
4.3.1. Hardware
The experiments were executed on a laptop equipped with a multi-core CPU (Central Processing Unit) and sufficient RAM (Random Access Memory) to accommodate the data and model training requirements. While GPU acceleration can significantly expedite deep learning tasks, we opted for a CPU-based approach to demonstrate the feasibility of conducting these experiments on readily available hardware.
4.3.2. Software
We utilized Python as the primary programming language for our research, leveraging popular libraries such as TensorFlow for deep learning model development. Scikit-learn was employed for traditional machine learning components. Furthermore, we made use of Jupyter notebooks and VScode for code development and analysis.
The Experimental Setup given above provides the foundation for our research, ensuring that our hybrid models are trained, tuned, and evaluated under controlled and systematic conditions. These steps are essential for obtaining reliable and reproducible results, which we will present and discuss comprehensively in the subsequent sections of this paper.
5. Results
n this section, we present the results of our experiments, which include the evaluation metrics (Mean Absolute Error, Mean Squared Error, Root Mean Squared Error, and R-squared) for each of the hybrid models. Additionally, we provide visualizations, such as plots of actual vs. predicted stock prices, to offer a comprehensive understanding of model performance.
Table 1, shows the results for different hybrid models.
5.1. Visualization
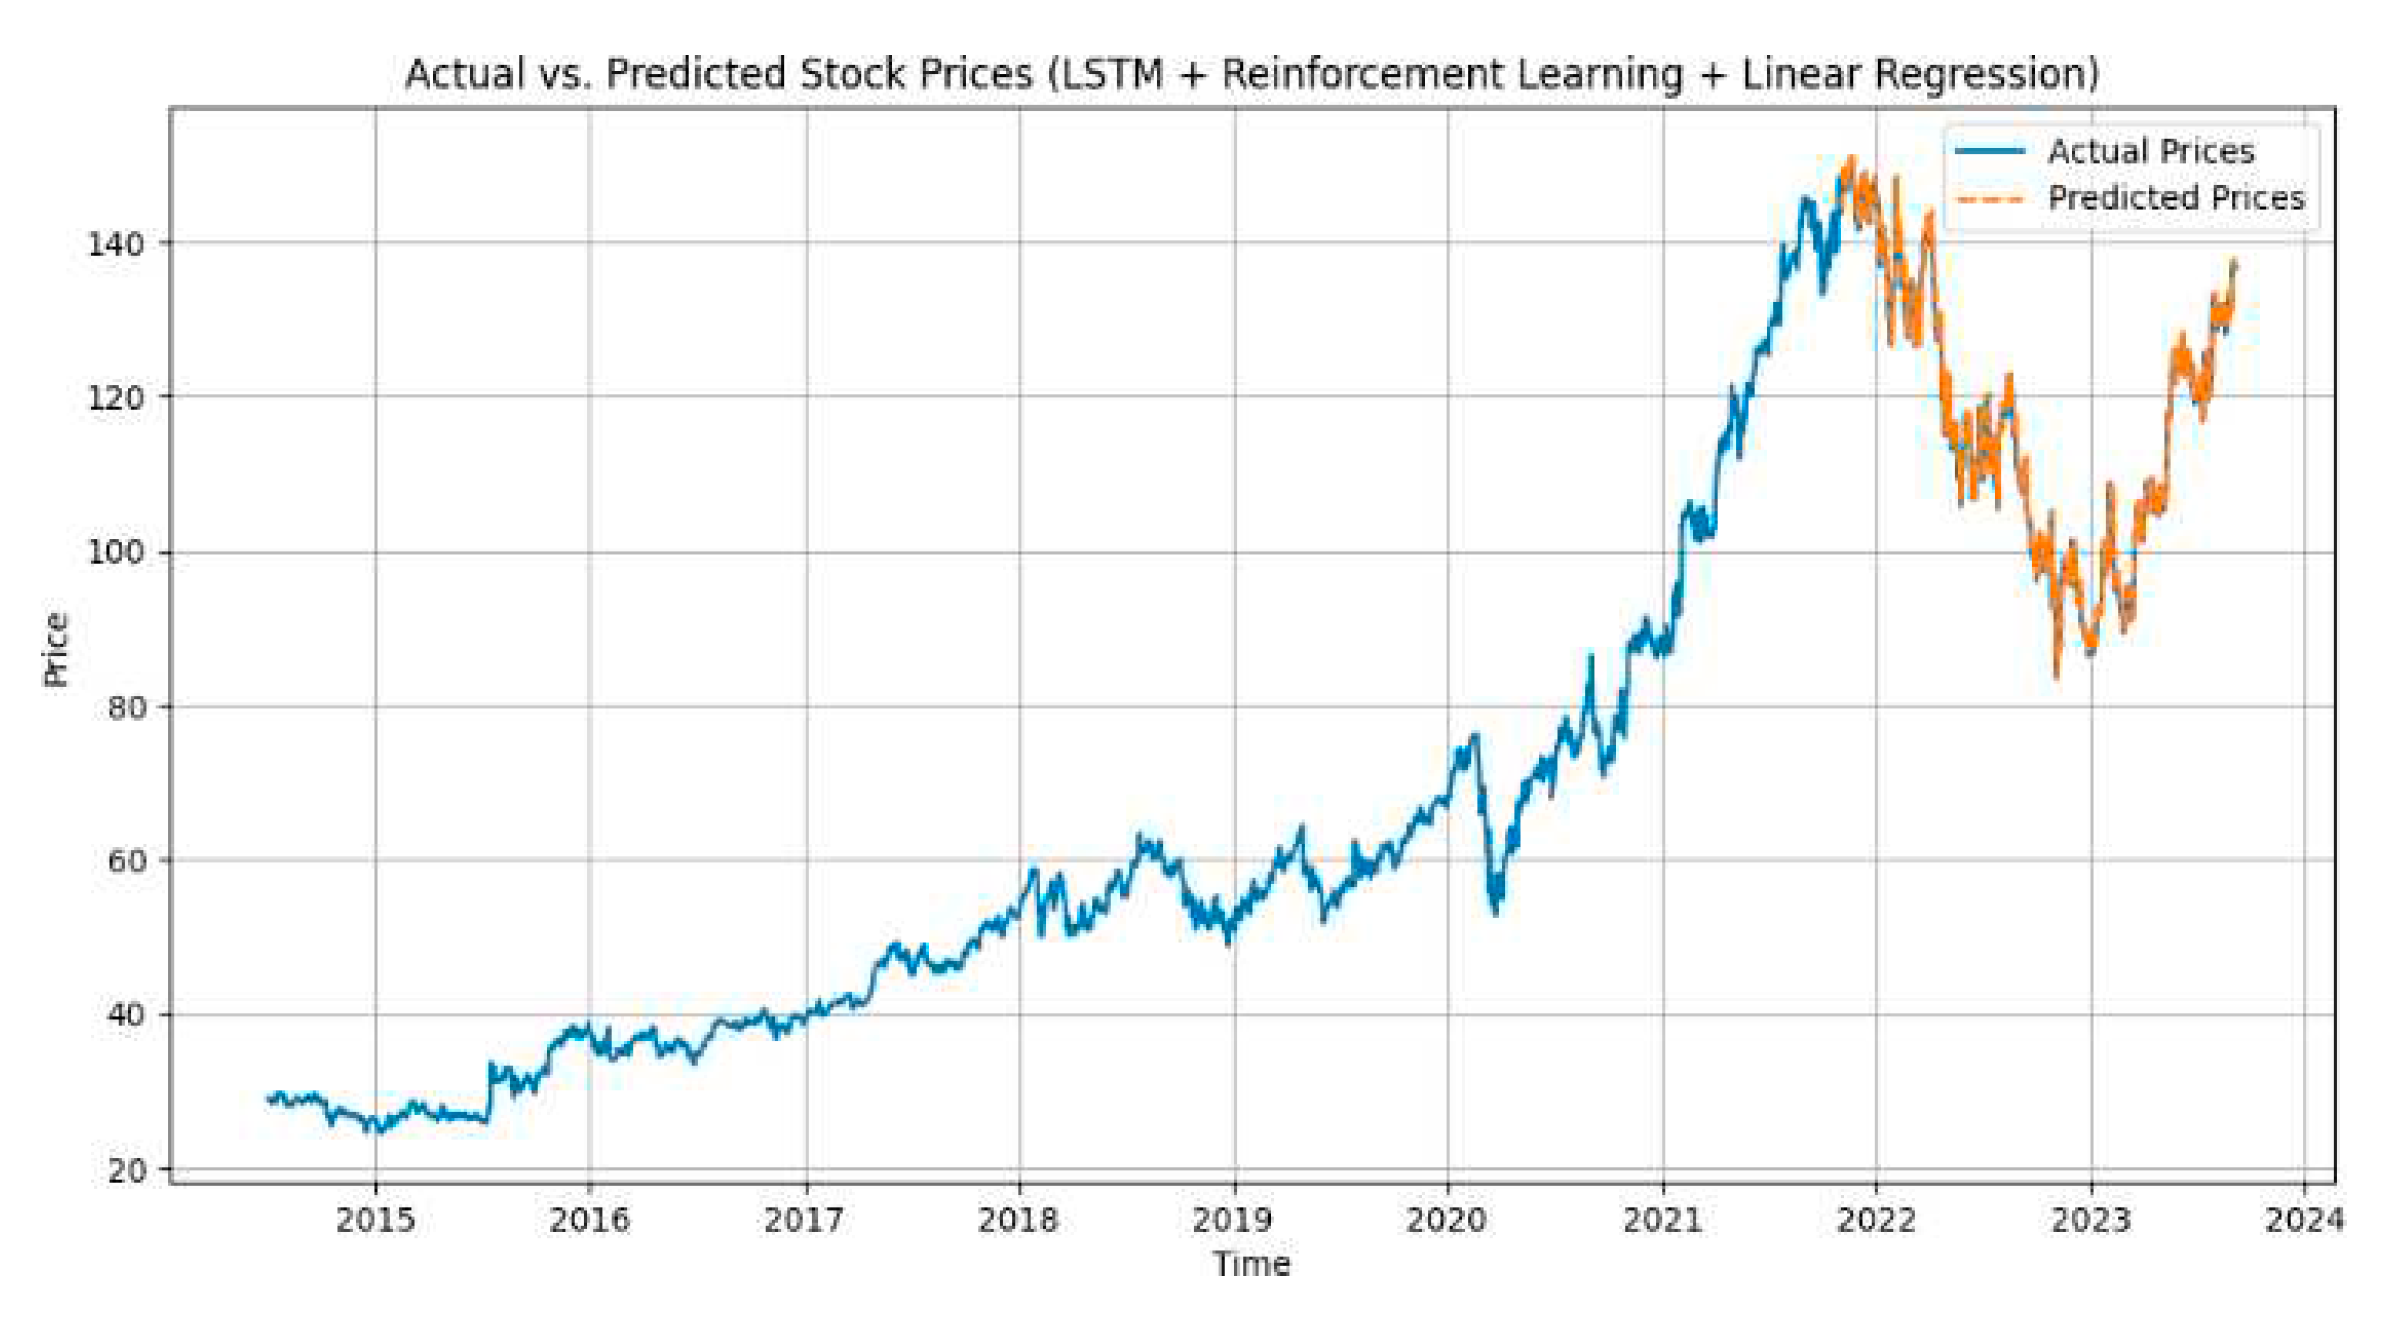
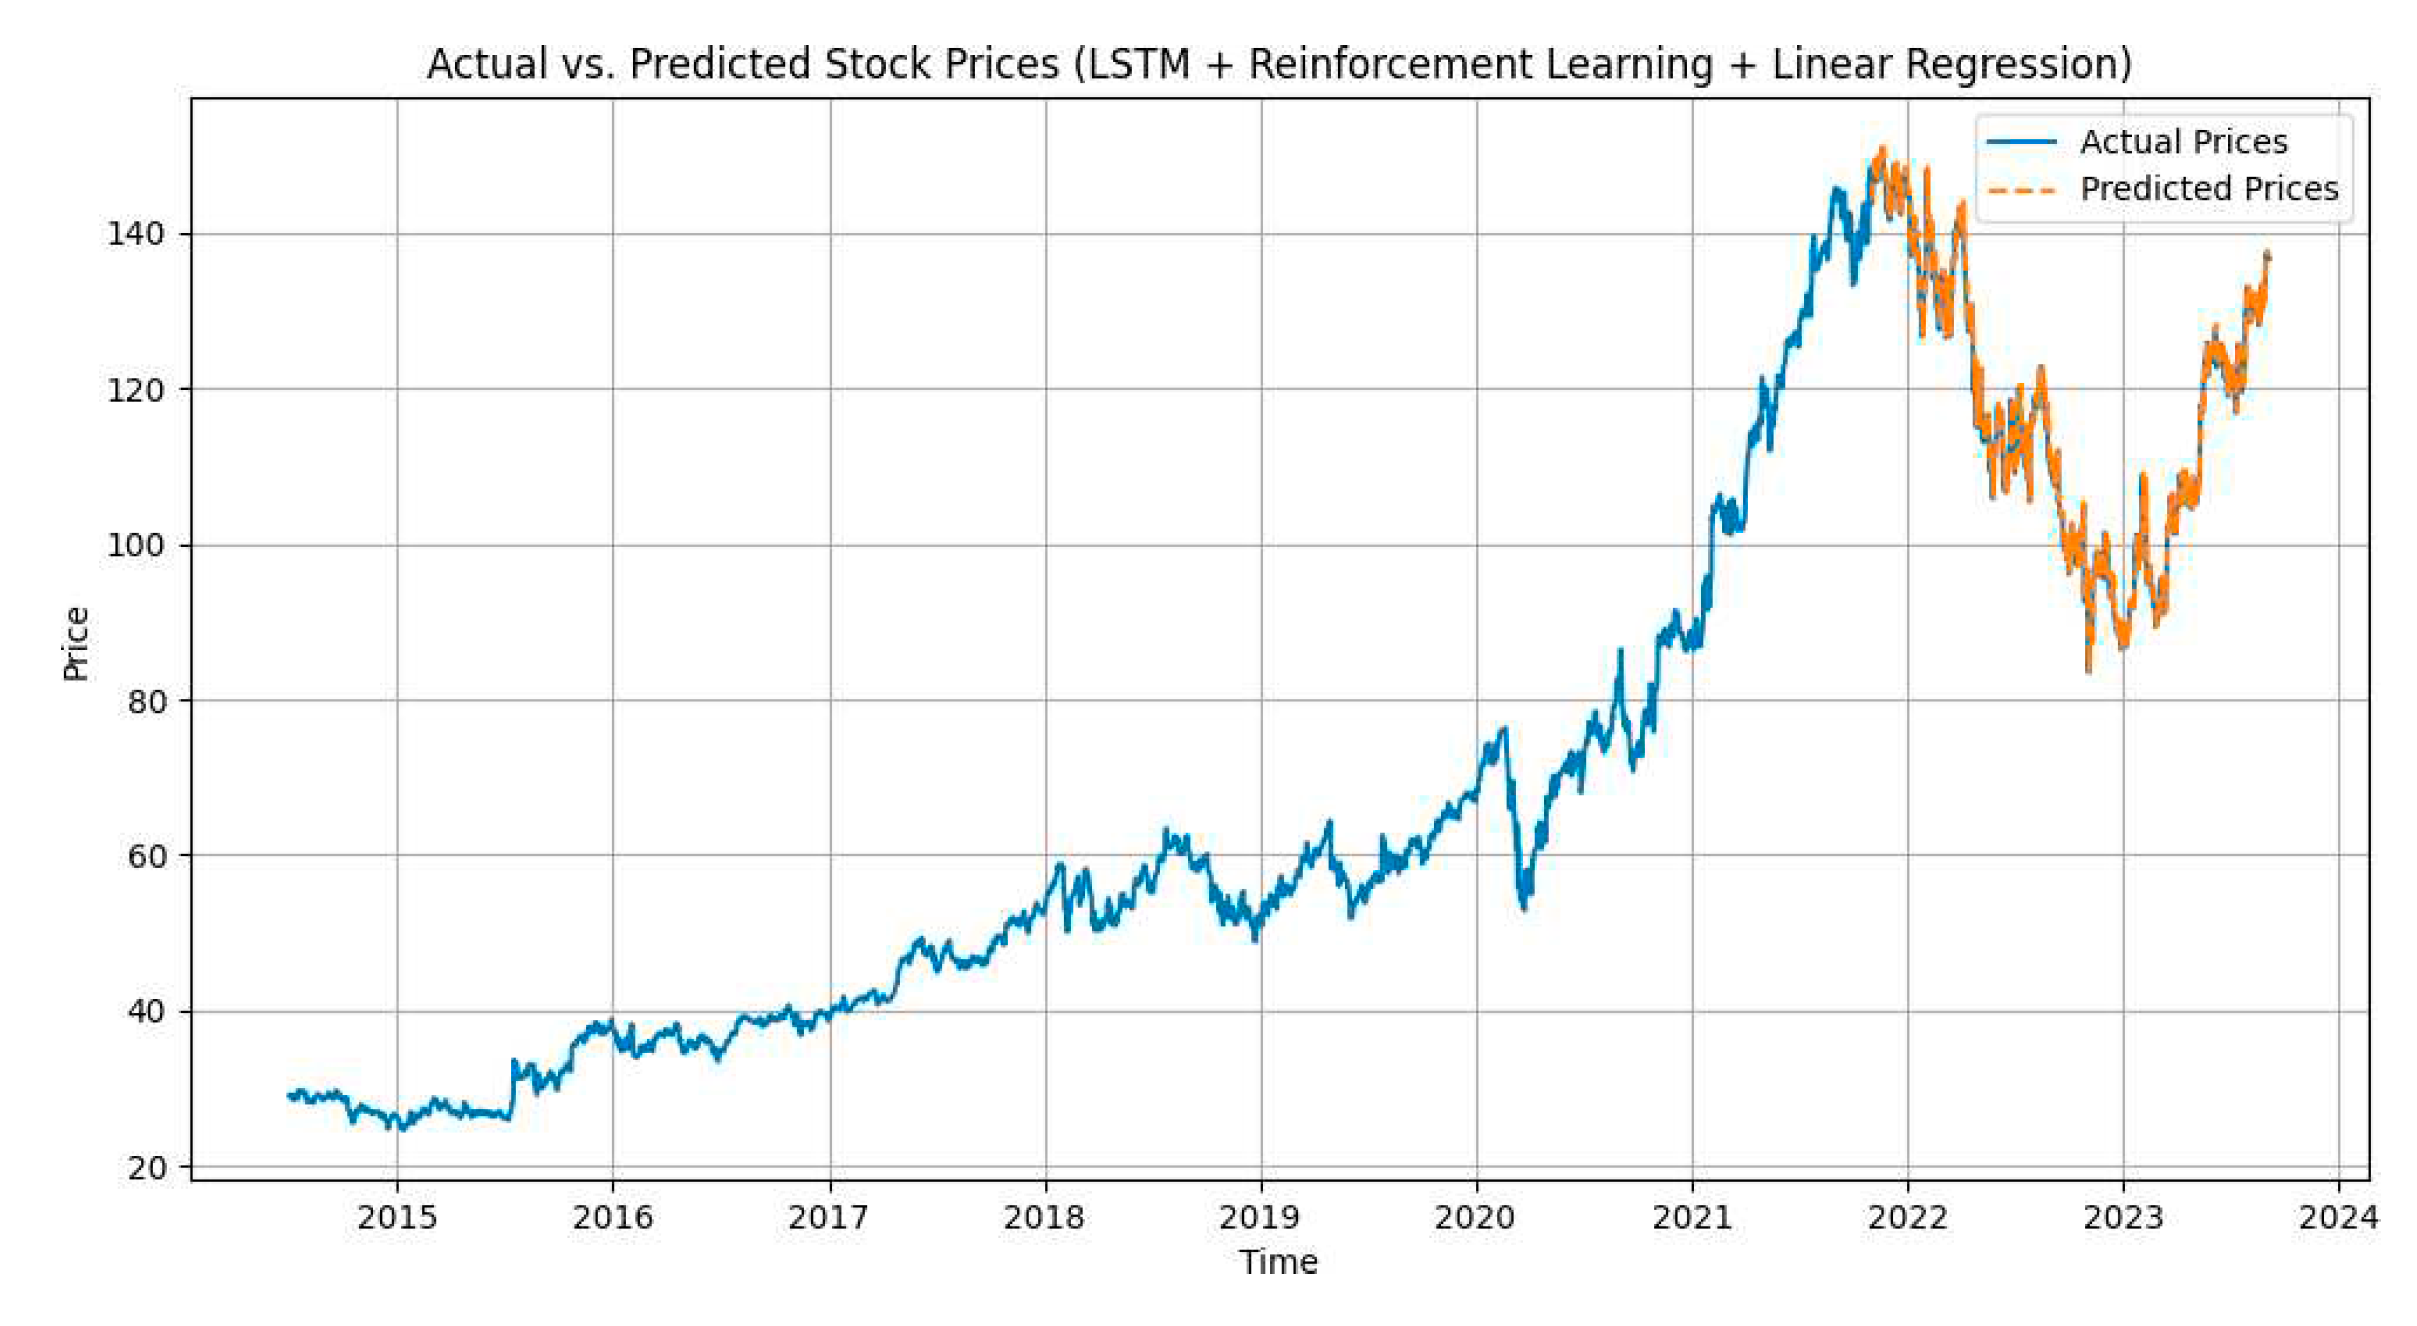
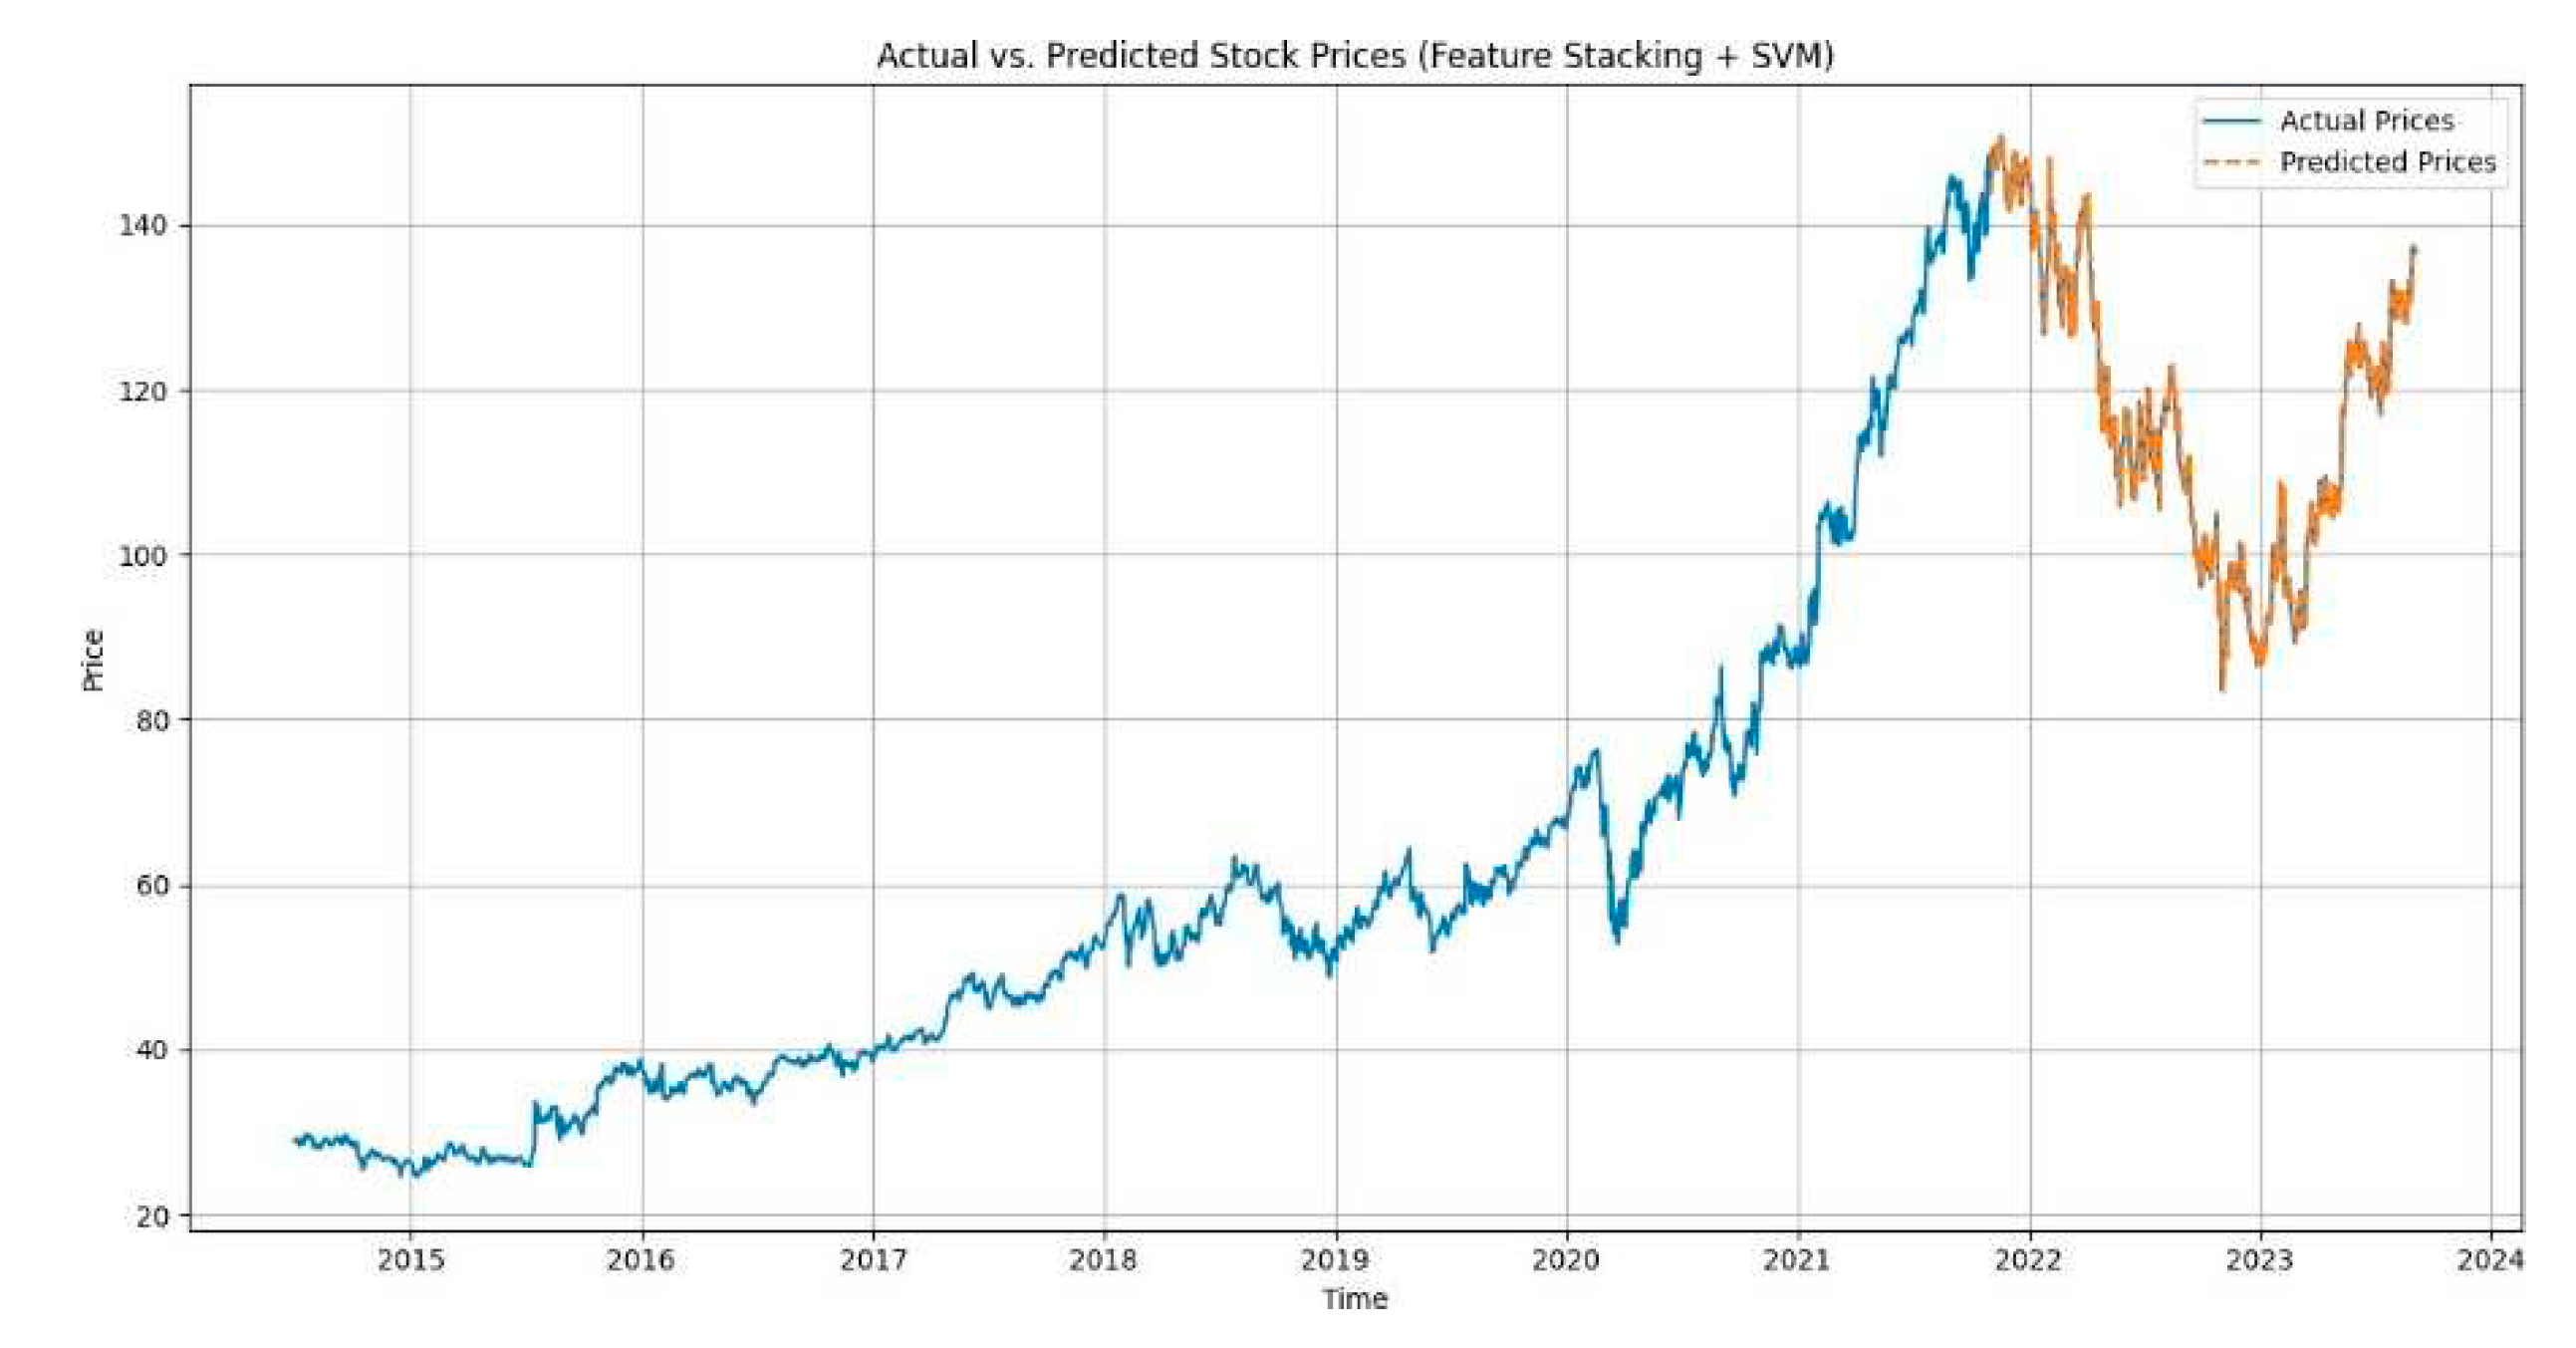
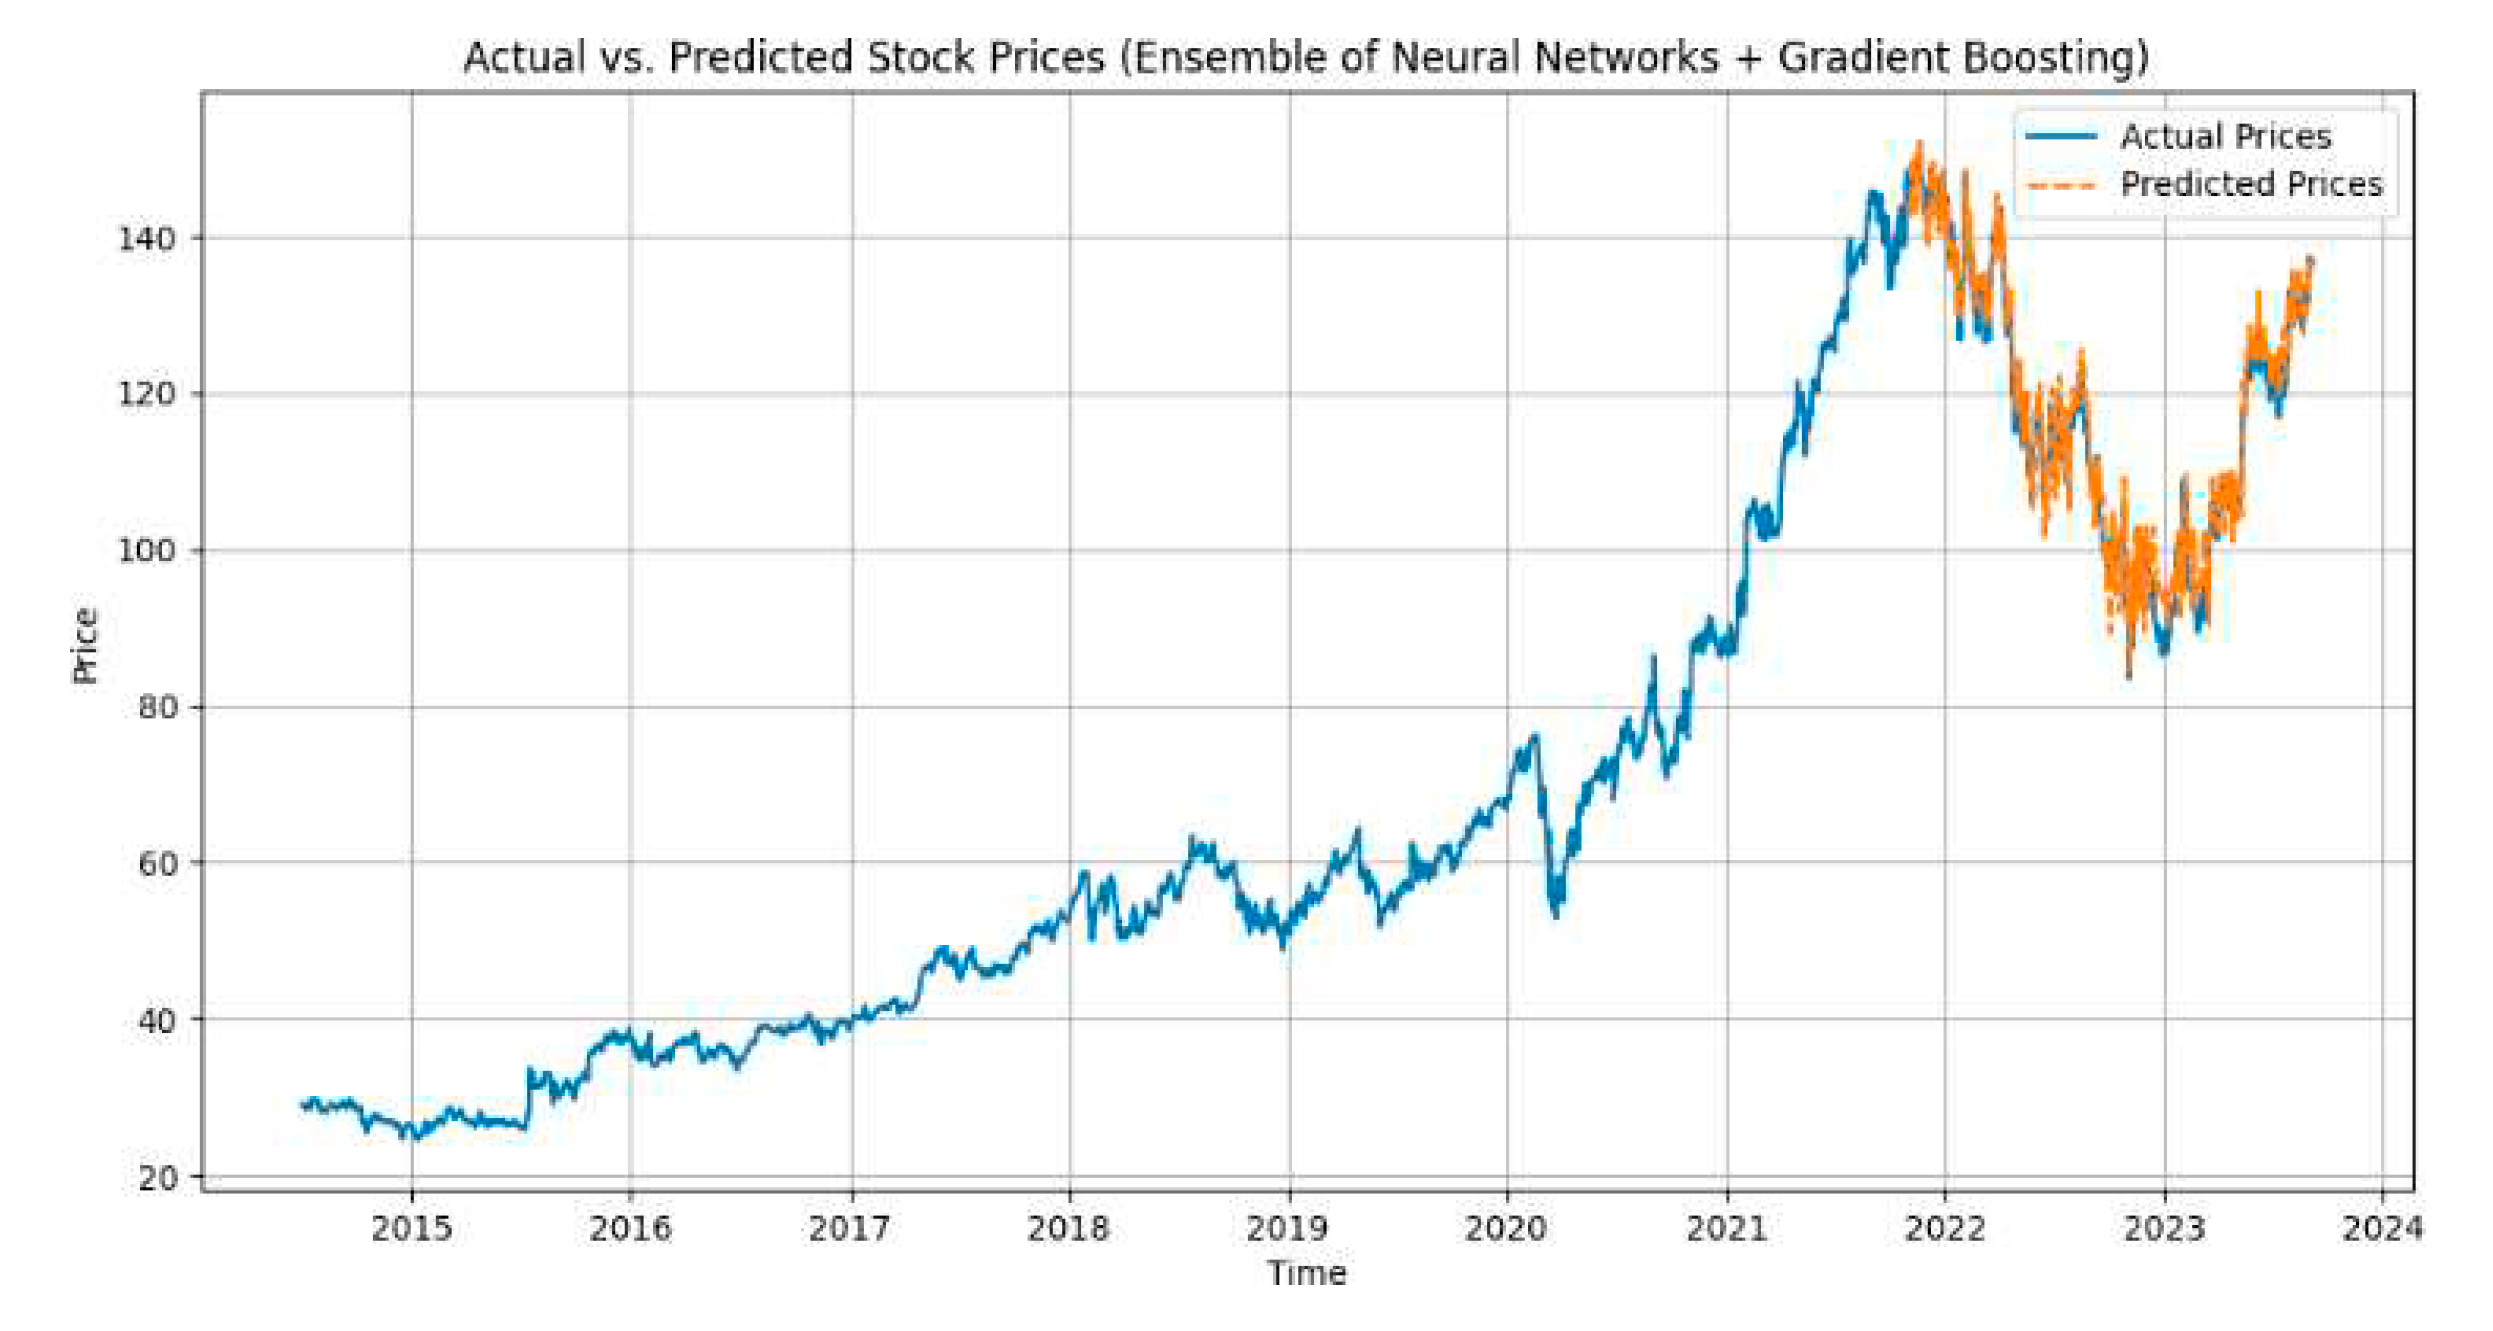
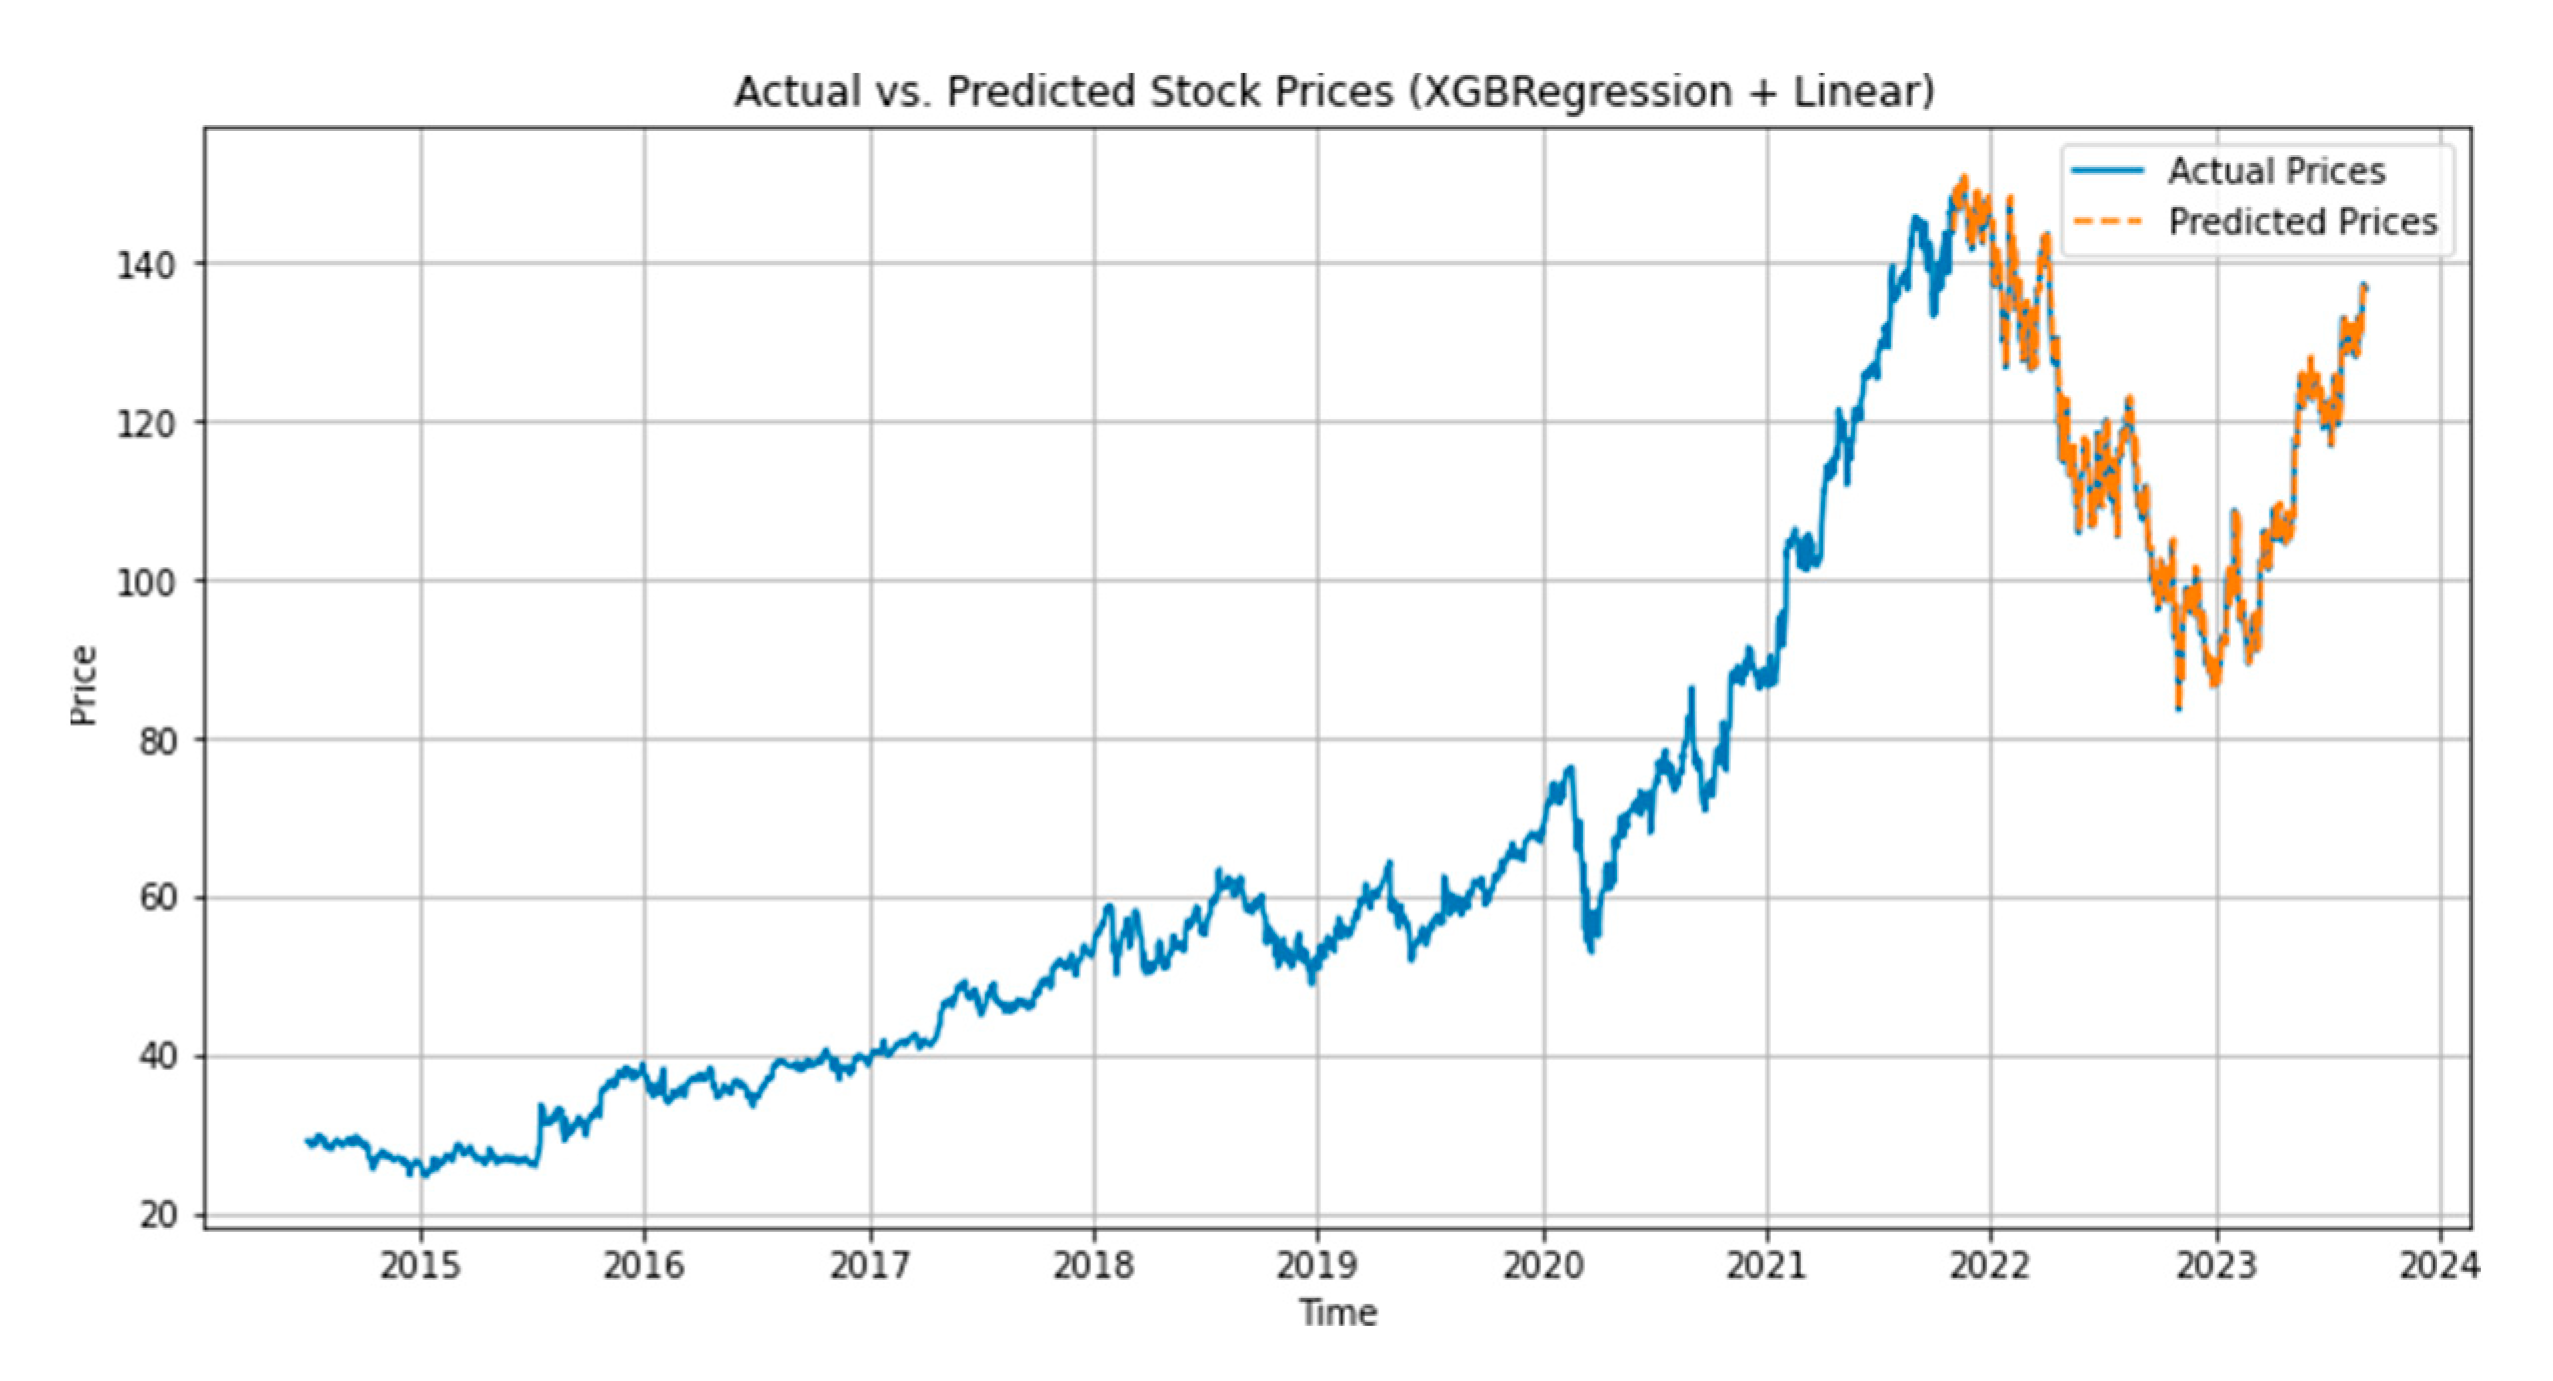
We have created visuals to illustrate the performance of our models. Figures 2–6. shows the plots of actual vs. predicted stock prices for the LSTM + GRU + Conv1D, LSTM + Reinforcement Learning + Linear Regression, Linear Regression + SVM models, MLPRegressor + GradientBoostingRegressor, XGBRegressor + LinearRegression respectively.
Figure 2.
LSTM+GRU+Conv1D.
Figure 2.
LSTM+GRU+Conv1D.
Figure 3.
LSTM+GRU+Conv1D.
Figure 3.
LSTM+GRU+Conv1D.
Figure 4.
LSTM+GRU+Conv1D.
Figure 4.
LSTM+GRU+Conv1D.
Figure 5.
LSTM+GRU+Conv1D.
Figure 5.
LSTM+GRU+Conv1D.
Figure 6.
LSTM+GRU+Conv1D.
Figure 6.
LSTM+GRU+Conv1D.
5.2. Model Comparison
Analysis reveals that the LSTM + GRU + Conv1D hybrid model achieved the highest predictive accuracy with an R-squared value of 0.9982, indicating a proper fit to the actual data. It demonstrated a superior performance with low MAE, MSE, and RMSE values, signifying minimal prediction errors.
In contrast, the MLPRegressor + GradientBoostingRegressor hybrid model exhibited slightly higher prediction errors with an R-squared value of 0.9495, implying a good but comparatively less accurate fit.
The LSTM + Reinforcement Learning + Linear Regression, Linear Regression + SVM, and XGBRegressor + Linear Regression models performed similarly in terms of MAE, MSE, RMSE, and R2 scores, with R2 values around 0.9791. These models delivered high accuracy and predicted consistent values throughout the process.
5.3. Interpretation of R-Squared (R2)
The R-squared values provide insights into the goodness of fit of our models. An R2 value close to 1.0 indicates that a high proportion of the variance in the dependent variable (stock price) is explained by the independent variables (features). In our case, R2 values ranging from 0.9495 to 0.9982 demonstrate that the hybrid models capture a significant portion of the variability in stock prices, reflecting their effectiveness in predicting stock market trends.
5.4. Target Date Prediction
In this section, we elucidate the meticulous procedure for predicting stock prices on the specified target date, August 18, 2023 (2023-08-18), employing our well-constructed hybrid models. The objective is to unveil the actual and predicted stock prices for this pivotal date, allowing us to scrutinize the accuracy of these forecasts while pinpointing any disparities.
5.5. Procedure for Predicting Stock Prices
Target Date Selection: We have meticulously chosen August 18, 2023, as our target date for stock price prediction.
Data Preparation: To ensure the availability of historical data leading up to the target date, we employ a systematic approach. We ascertain the nearest available date in our dataset on or after the specified target date using the provided code.
Lagged Feature Extraction: Having identified the nearest date with accessible data, we proceed to extract lagged features. These features are integral as they encapsulate the historical trends in stock prices, serving as vital input for our predictive models.
Model Prediction: Our trained hybrid models, which include LSTM + GRU + Conv1D, LSTM + Reinforcement Learning + Linear Regression, Linear Regression + SVM, MLPRegressor + GradientBoostingRegressor, and XGBRegressor + Linear Regression, are now called into action. These models are designed to deliver forecasts for the stock price on August 18, 2023.
5.6. Prediction Results
The moment of truth arrives as we unveil both the actual and predicted stock prices for our target date. These results are delineated in
Table 2.
The precision of our predictions will be meticulously evaluated using established evaluation metrics, encompassing the Mean Absolute Error (MAE), Mean Squared Error (MSE), Root Mean Squared Error (RMSE), and R-squared (R2) score. Any disparities observed between actual and predicted stock prices will be subjected to rigorous scrutiny, unraveling the intricacies of our hybrid models’ performance on the pivotal target date.
6. Conclusion
n our research, we set out to enhance the precision of stock price prediction by harmoniously combining hybrid ensemble algorithms. We explored various hybrid models that combined different machine learning techniques, comparing them to traditional and standalone predictive models. Distinctly, the LSTM + GRU + Conv1D hybrid model emerged as the standout performer, achieving an impressive accuracy rate of 99.78 percent, surpassing individual models, and reaffirming the effectiveness of hybrid modeling in stock price prediction. Our ensemble of hybrid models, which included combinations like LSTM + GRU + Conv1D, Linear Regression + SVM, MLPRegressor + GradientBoostingRegressor, and XGBRegressor + Linear Regression, provided a versatile toolkit for addressing the complexities of stock market forecasting. Furthermore, we found that comprehensive data preparation, feature engineering, and normalization techniques played a crucial role in strengthening the predictive models, with Min-Max scaling contributing to the uniformity of input features and overall model accuracy.
7. Future Work
Our research suggests exciting future avenues for stock price prediction. Exploring advanced ensemble strategies, combining diverse hybrid models for improved accuracy, and incorporating sentiment analysis from financial news and social media can enrich our understanding of market dynamics. Developing transparent methods for interpreting complex models and fine-tuning hyperparameters further enhance performance. Evaluating model applicability to other financial data, real-time prediction, market sentiment analysis, and robustness testing under various conditions are essential for practical use. Incorporating risk assessment components and online learning can lead to more responsive investment strategies, shaping the future of predictive finance modeling for precise, adaptable decision-making tools.
References
- Strader, Troy J.; Rozycki, John J.; ROOT, THOMAS H.; and Huang, Yu-Hsiang John (2020) ”Machine Learning Stock Market Prediction Studies: Review and Research Directions,” Journal of International Technology and Information Man- agement: Vol. 28: Iss. 4, Article 3. Available at: https://scholarworks.lib.csusb.edu/jitim/vol28/iss4/3. [CrossRef]
- Himanshu H Shrimalve and Sopan A Talekar. Comparative Analysis of Stock Mar- ket Prediction System using SVM and ANN. International Journal of Computer Applications 182(1):59-64, July 2018.
- ”Stock Market Prediction Using Machine Learning Techniques,” ACI’22: Work- shop on Advances in Computation Intelligence, its Concepts Applications at ISIC 2022, May 17-19, Savannah, United States.
- TY - JOUR AU - Talekar, Sopan PY - 2020/07/16 SP - 6 T1 - Comparative Analysis of Stock Market Prediction System using SVM and ANN VL - 182 JO International Journal of Computer Applications ER -.
- Machine Learning Approaches in Stock Price Prediction: A Systematic Review Journal of Physics: Conference Series 2161 (2022) 012065 IOP Publishing. [CrossRef]
- Stock Market Prediction Using Machine Learning Techniques ACI’22: Workshop on Advances in Computation Intelligence, its Concepts Applications at ISIC 2022, May 17-19, Savannah, United States.
- Mukherjee, S., et al.: Stock market prediction using deep learn- ing algorithms. CAAI Trans. Intell. Technol. 8(1), 82–94 (2023). [CrossRef]
- Sheth, D., Shah, M. Predicting stock market using machine learning: best and accurate way to know future stock prices. Int J Syst Assur Eng Manag 14, 1–18 (2023). [CrossRef]
- S. Boonpeng and P. Jeatrakul, ”Decision support system for investing in stock market by using OAA-Neural Network,” 2016 Eighth International Conference on Advanced Computational Intelligence (ICACI), Chiang Mai, Thailand, 2016, pp. 1-6. [CrossRef]
- S. Sarvesh, R.V. Sidharth, V. Vaishnav, J. Thangakumar and S. Sathyalak- shmi, ”A Hybrid Model for Stock Price Prediction using Machine Learning Techniques with CNN,” 2021 5th International Conference on Information Sys- tems and Computer Networks (ISCON), Mathura, India, 2021, pp. 1-6. [CrossRef]
- Yadav, K., Yadav, M., Saini, S. (2021). Stock values predictions using deep learning based hybrid models. CAAI Transactions on Intelligence Technology, 7(1), 107-116. [CrossRef]
- Hiransha M, Gopalakrishnan E.A., Vijay Krishna Menon, Soman K.P., NSE Stock Market Prediction Using Deep-Learning Models, Procedia Computer Science, Volume 132, 2018, Pages 1351-1362, ISSN 1877-0509. [CrossRef]
- Latrisha N. Mintarya, Jeta N.M. Halim, Callista Angie, Said Achmad, Aditya Kurniawan, Machine learning approaches in stock market prediction: A sys- tematic literature review, Procedia Computer Science, Volume 216, 2023, Pages 96-102, ISSN 1877-0509. [CrossRef]
- Zahra Fathali, Zahra Kodia Lamjed Ben Said (2022) Stock Market Prediction of NIFTY 50 Index Applying Machine Learning Techniques, Applied Artificial Intelligence, 36:1. [CrossRef]
- Sonkavde, G.; Dharrao, D.S.; Bongale, A.M.; Deokate, S.T.; Doreswamy, D.; Bhat, S.K. Forecasting Stock Market Prices Using Machine Learning and Deep Learning Models: A Systematic Review, Performance Analysis and Discussion of Implica- tions. Int. J. Financial Stud. 2023, 11, 94. [Google Scholar] [CrossRef]
- Umer, M., Awais, M., Muzammul, M. (2019). Stock Market Predic- tion Using Machine Learning(ML)Algorithms. ADCAIJ: Advances in Dis- tributed Computing and Artificial Intelligence Journal, 8 (4), 97–116. [CrossRef]
- Shen, J., Shafiq, M.O. Short-term stock market price trend prediction using a comprehensive deep learning system. J Big Data 7, 66 (2020). [CrossRef]
- Rouf, N.; Malik, M.B.; Arif, T.; Sharma, S.; Singh, S.; Aich, S.; Kim, H.-C. Stock Market Prediction Using Machine Learning Techniques: A Decade Survey on Methodologies, Recent Developments, and Future Directions. Electronics 2021, 10, 2717. [Google Scholar] [CrossRef]
|
Disclaimer/Publisher’s Note: The statements, opinions and data contained in all publications are solely those of the individual author(s) and contributor(s) and not of MDPI and/or the editor(s). MDPI and/or the editor(s) disclaim responsibility for any injury to people or property resulting from any ideas, methods, instructions or products referred to in the content. |
© 2023 by the authors. Licensee MDPI, Basel, Switzerland. This article is an open access article distributed under the terms and conditions of the Creative Commons Attribution (CC BY) license (http://creativecommons.org/licenses/by/4.0/).
