Submitted:
28 October 2023
Posted:
30 October 2023
You are already at the latest version
Abstract
Keywords:
1. Introduction
2. Results
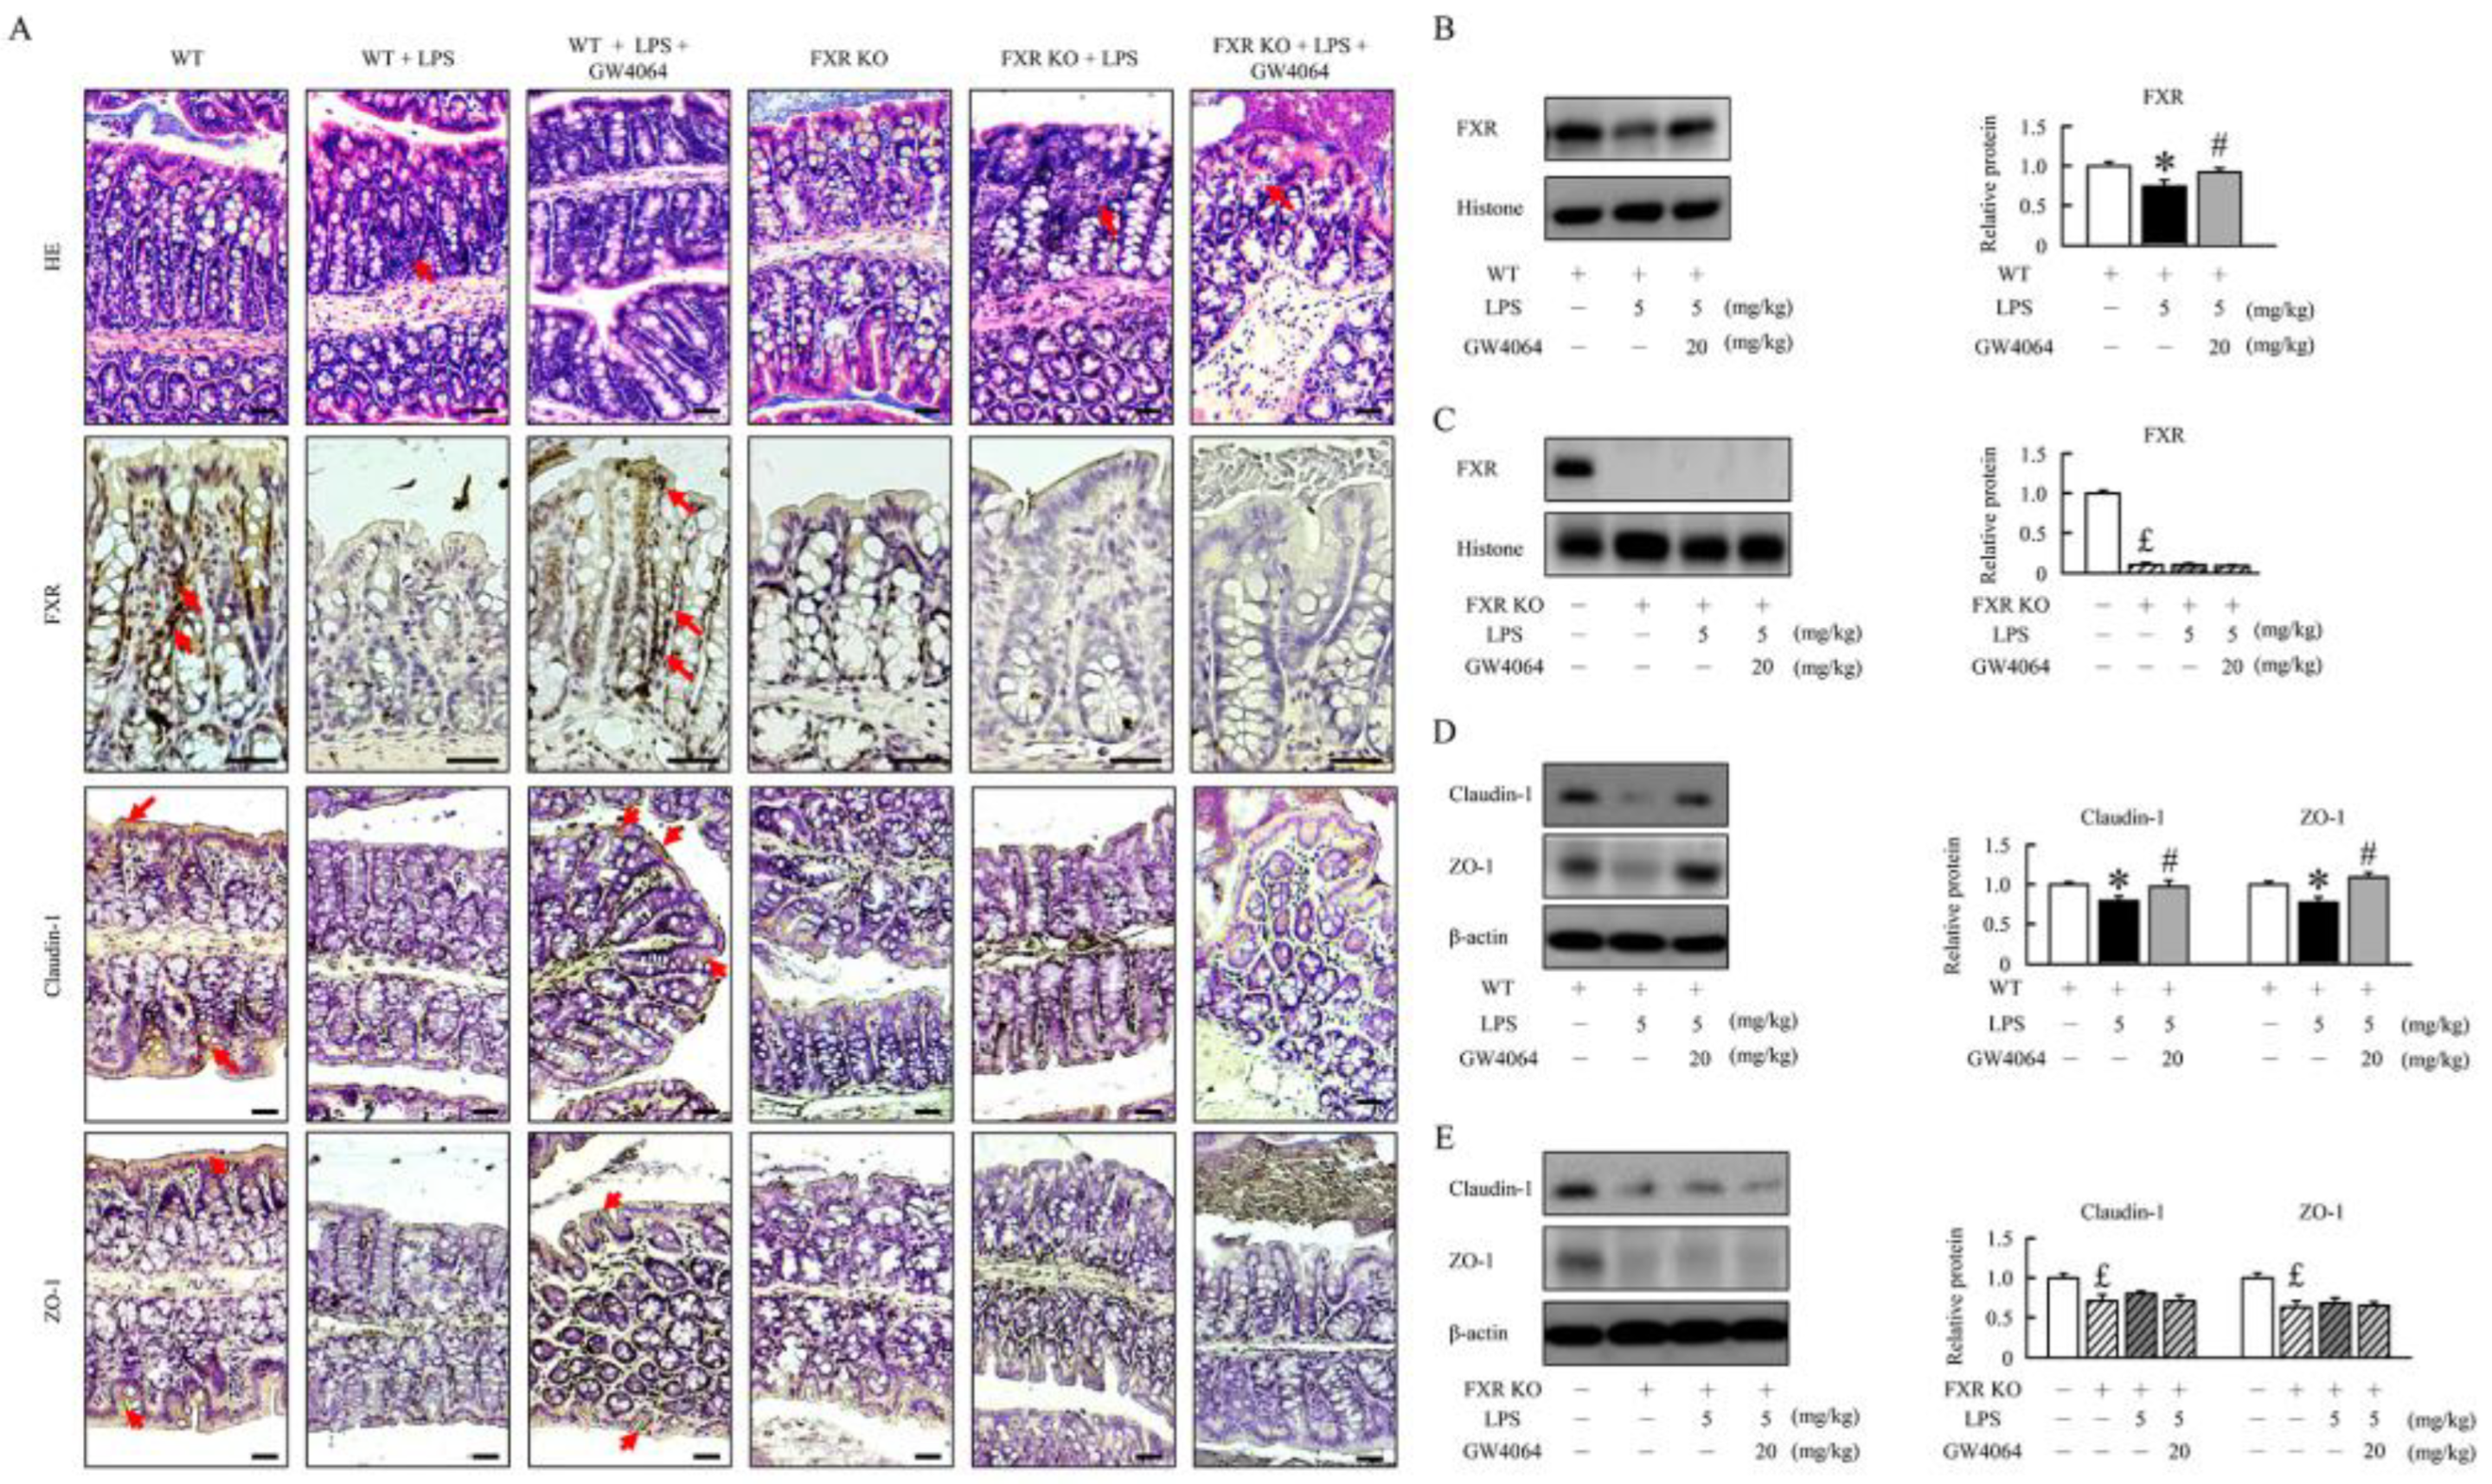
2.1. GW4064 improves tight junction disruption in LPS-treated mice
2.2. GW4064 improves tight junction disruption in LPS-treated mice
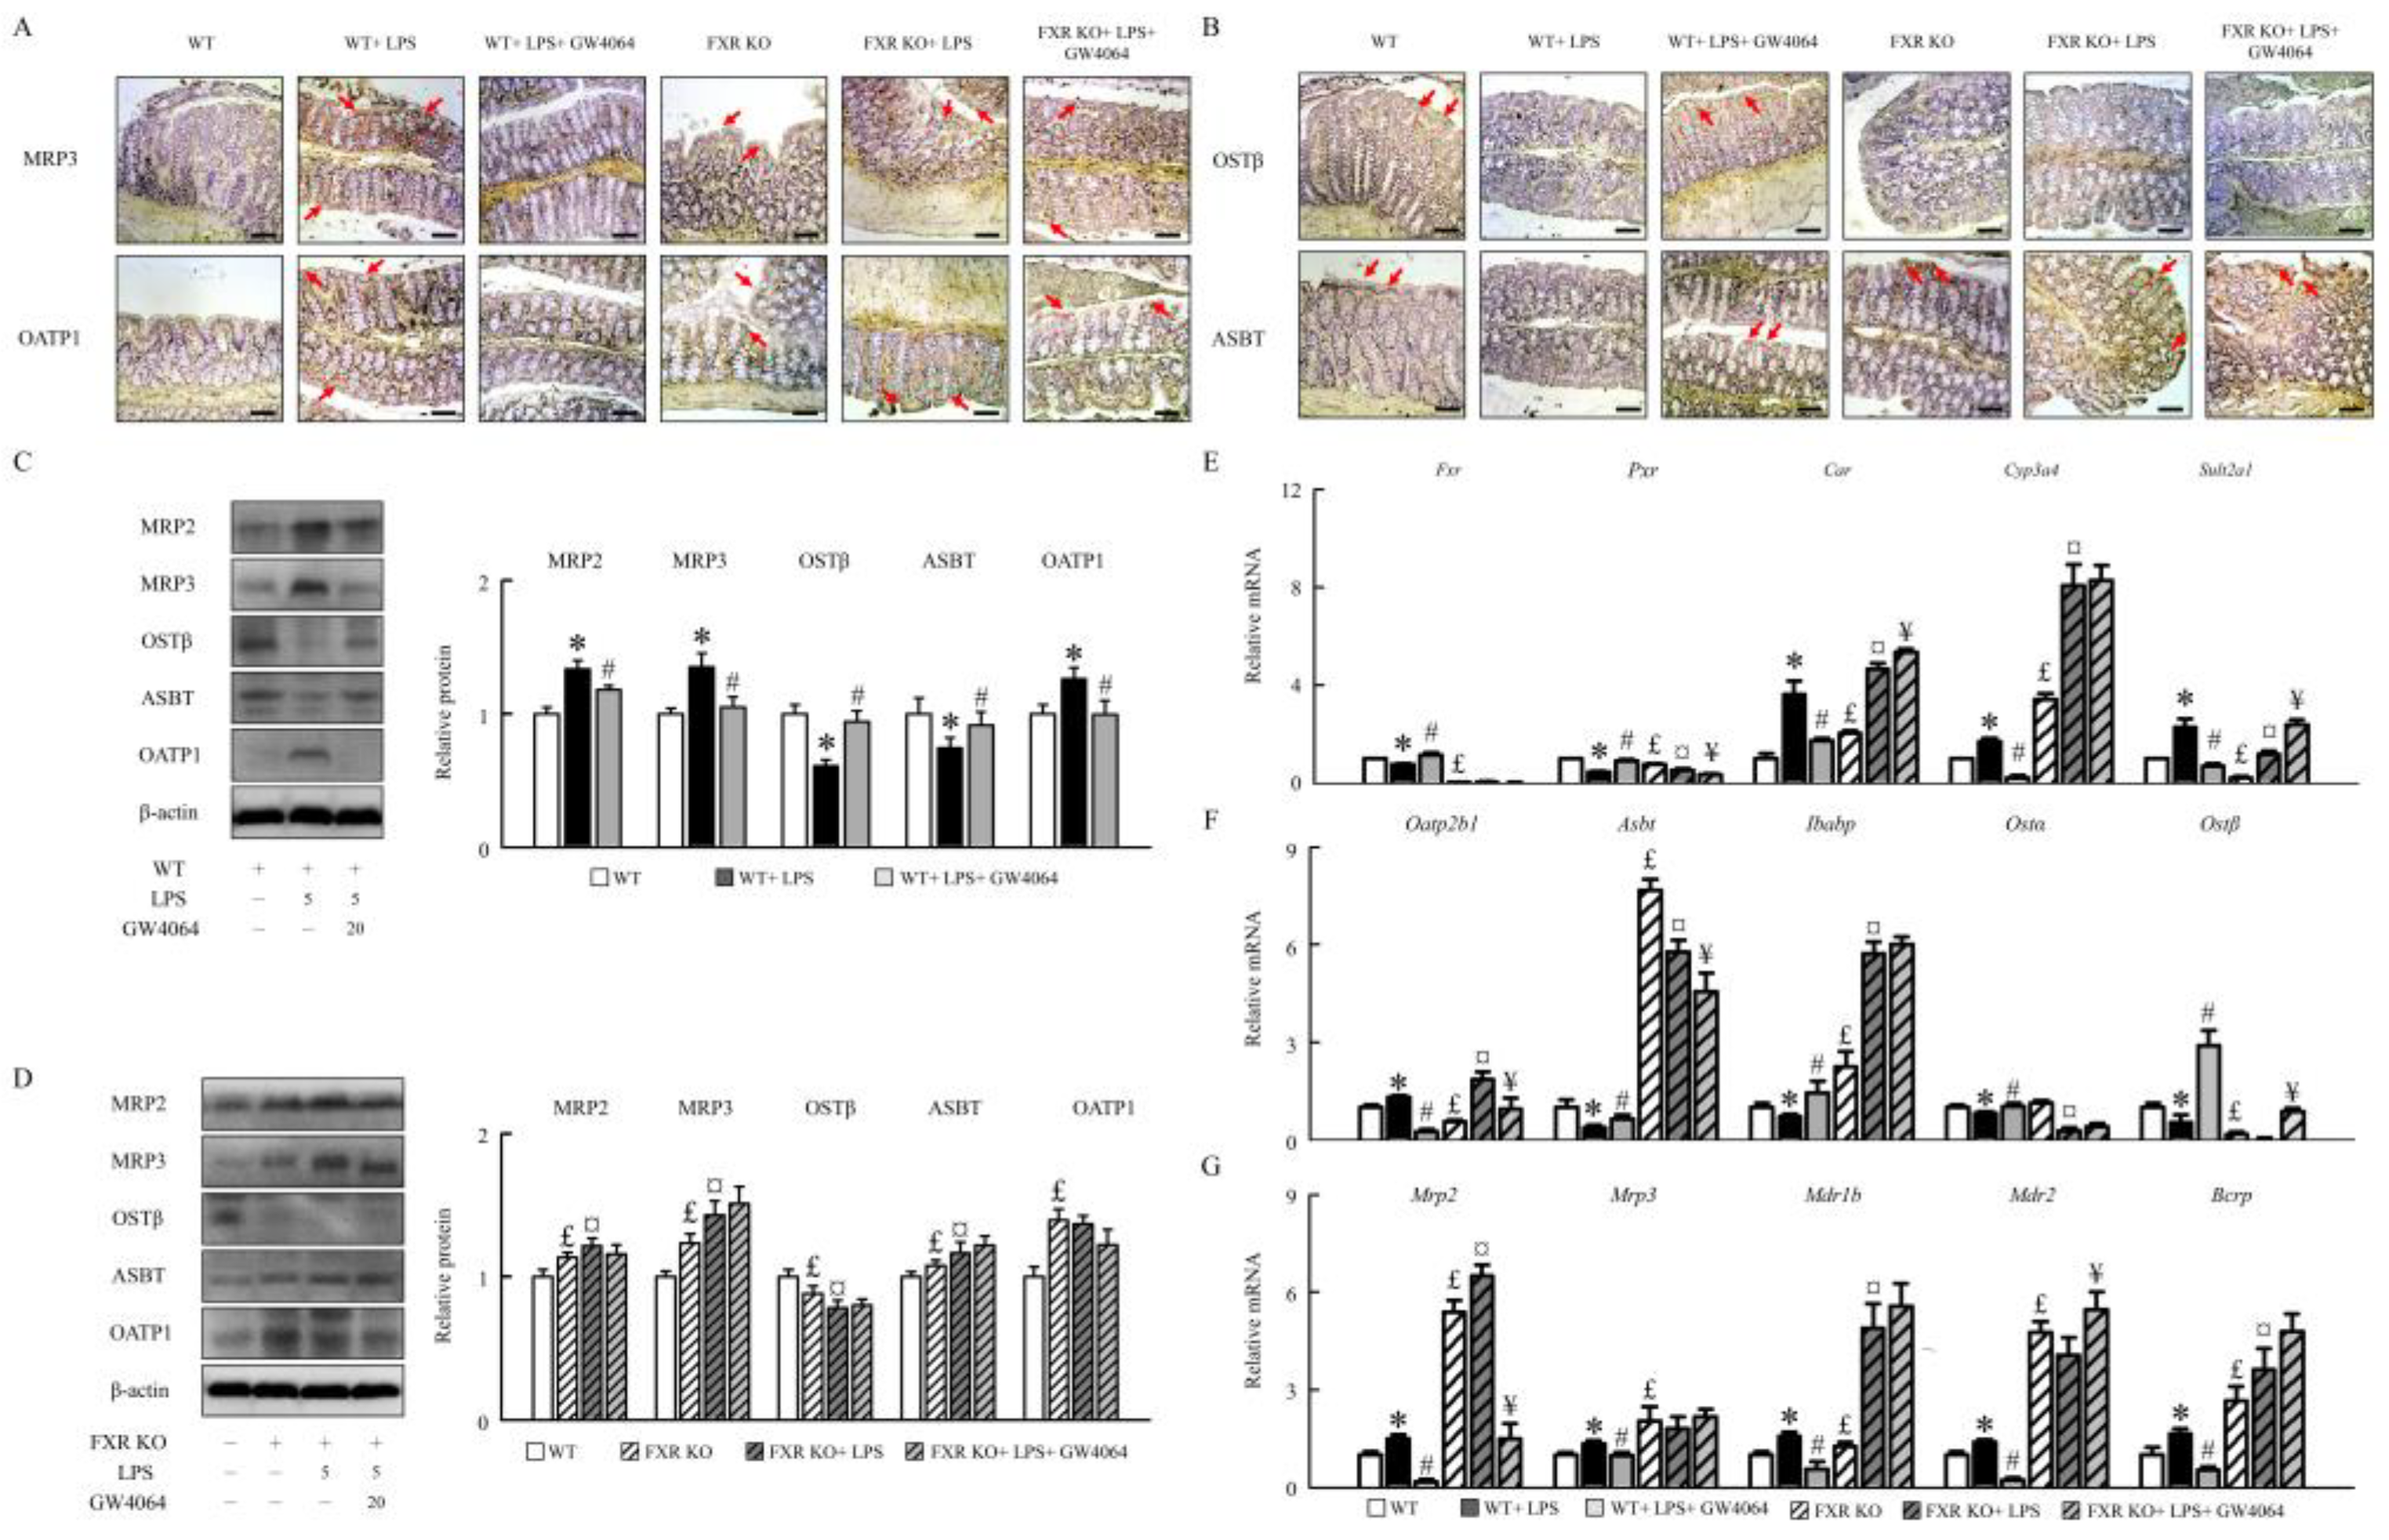
2.3. GW4064 improves FXR dysfunction and regulates the BA receptors and transporters
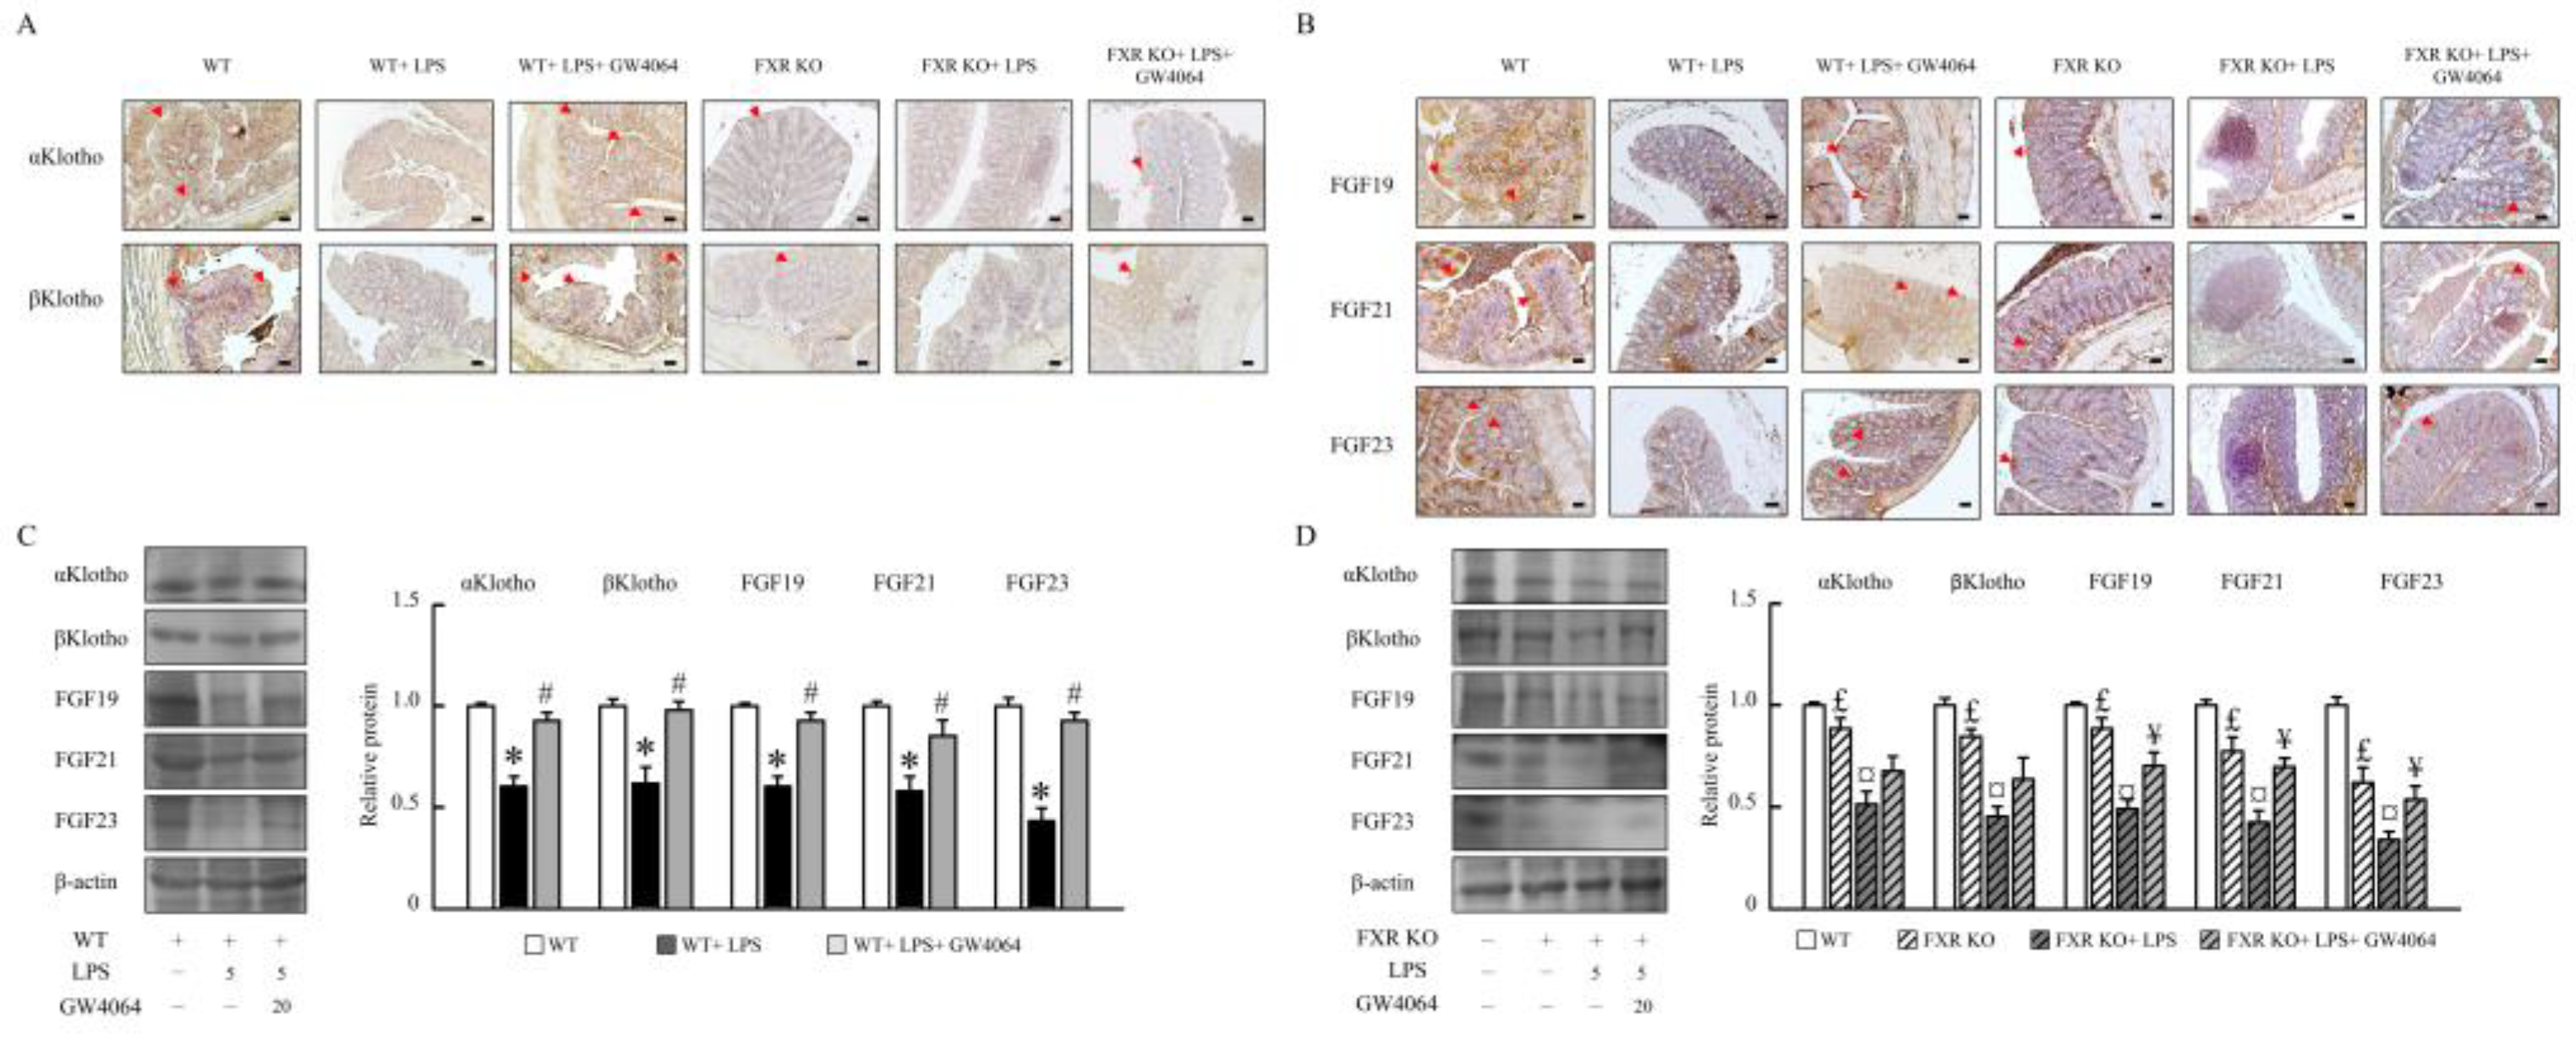
2.4. GW4064 regulates αKlotho/FGF23 and βKlotho/FGF19/FGF21 pathway
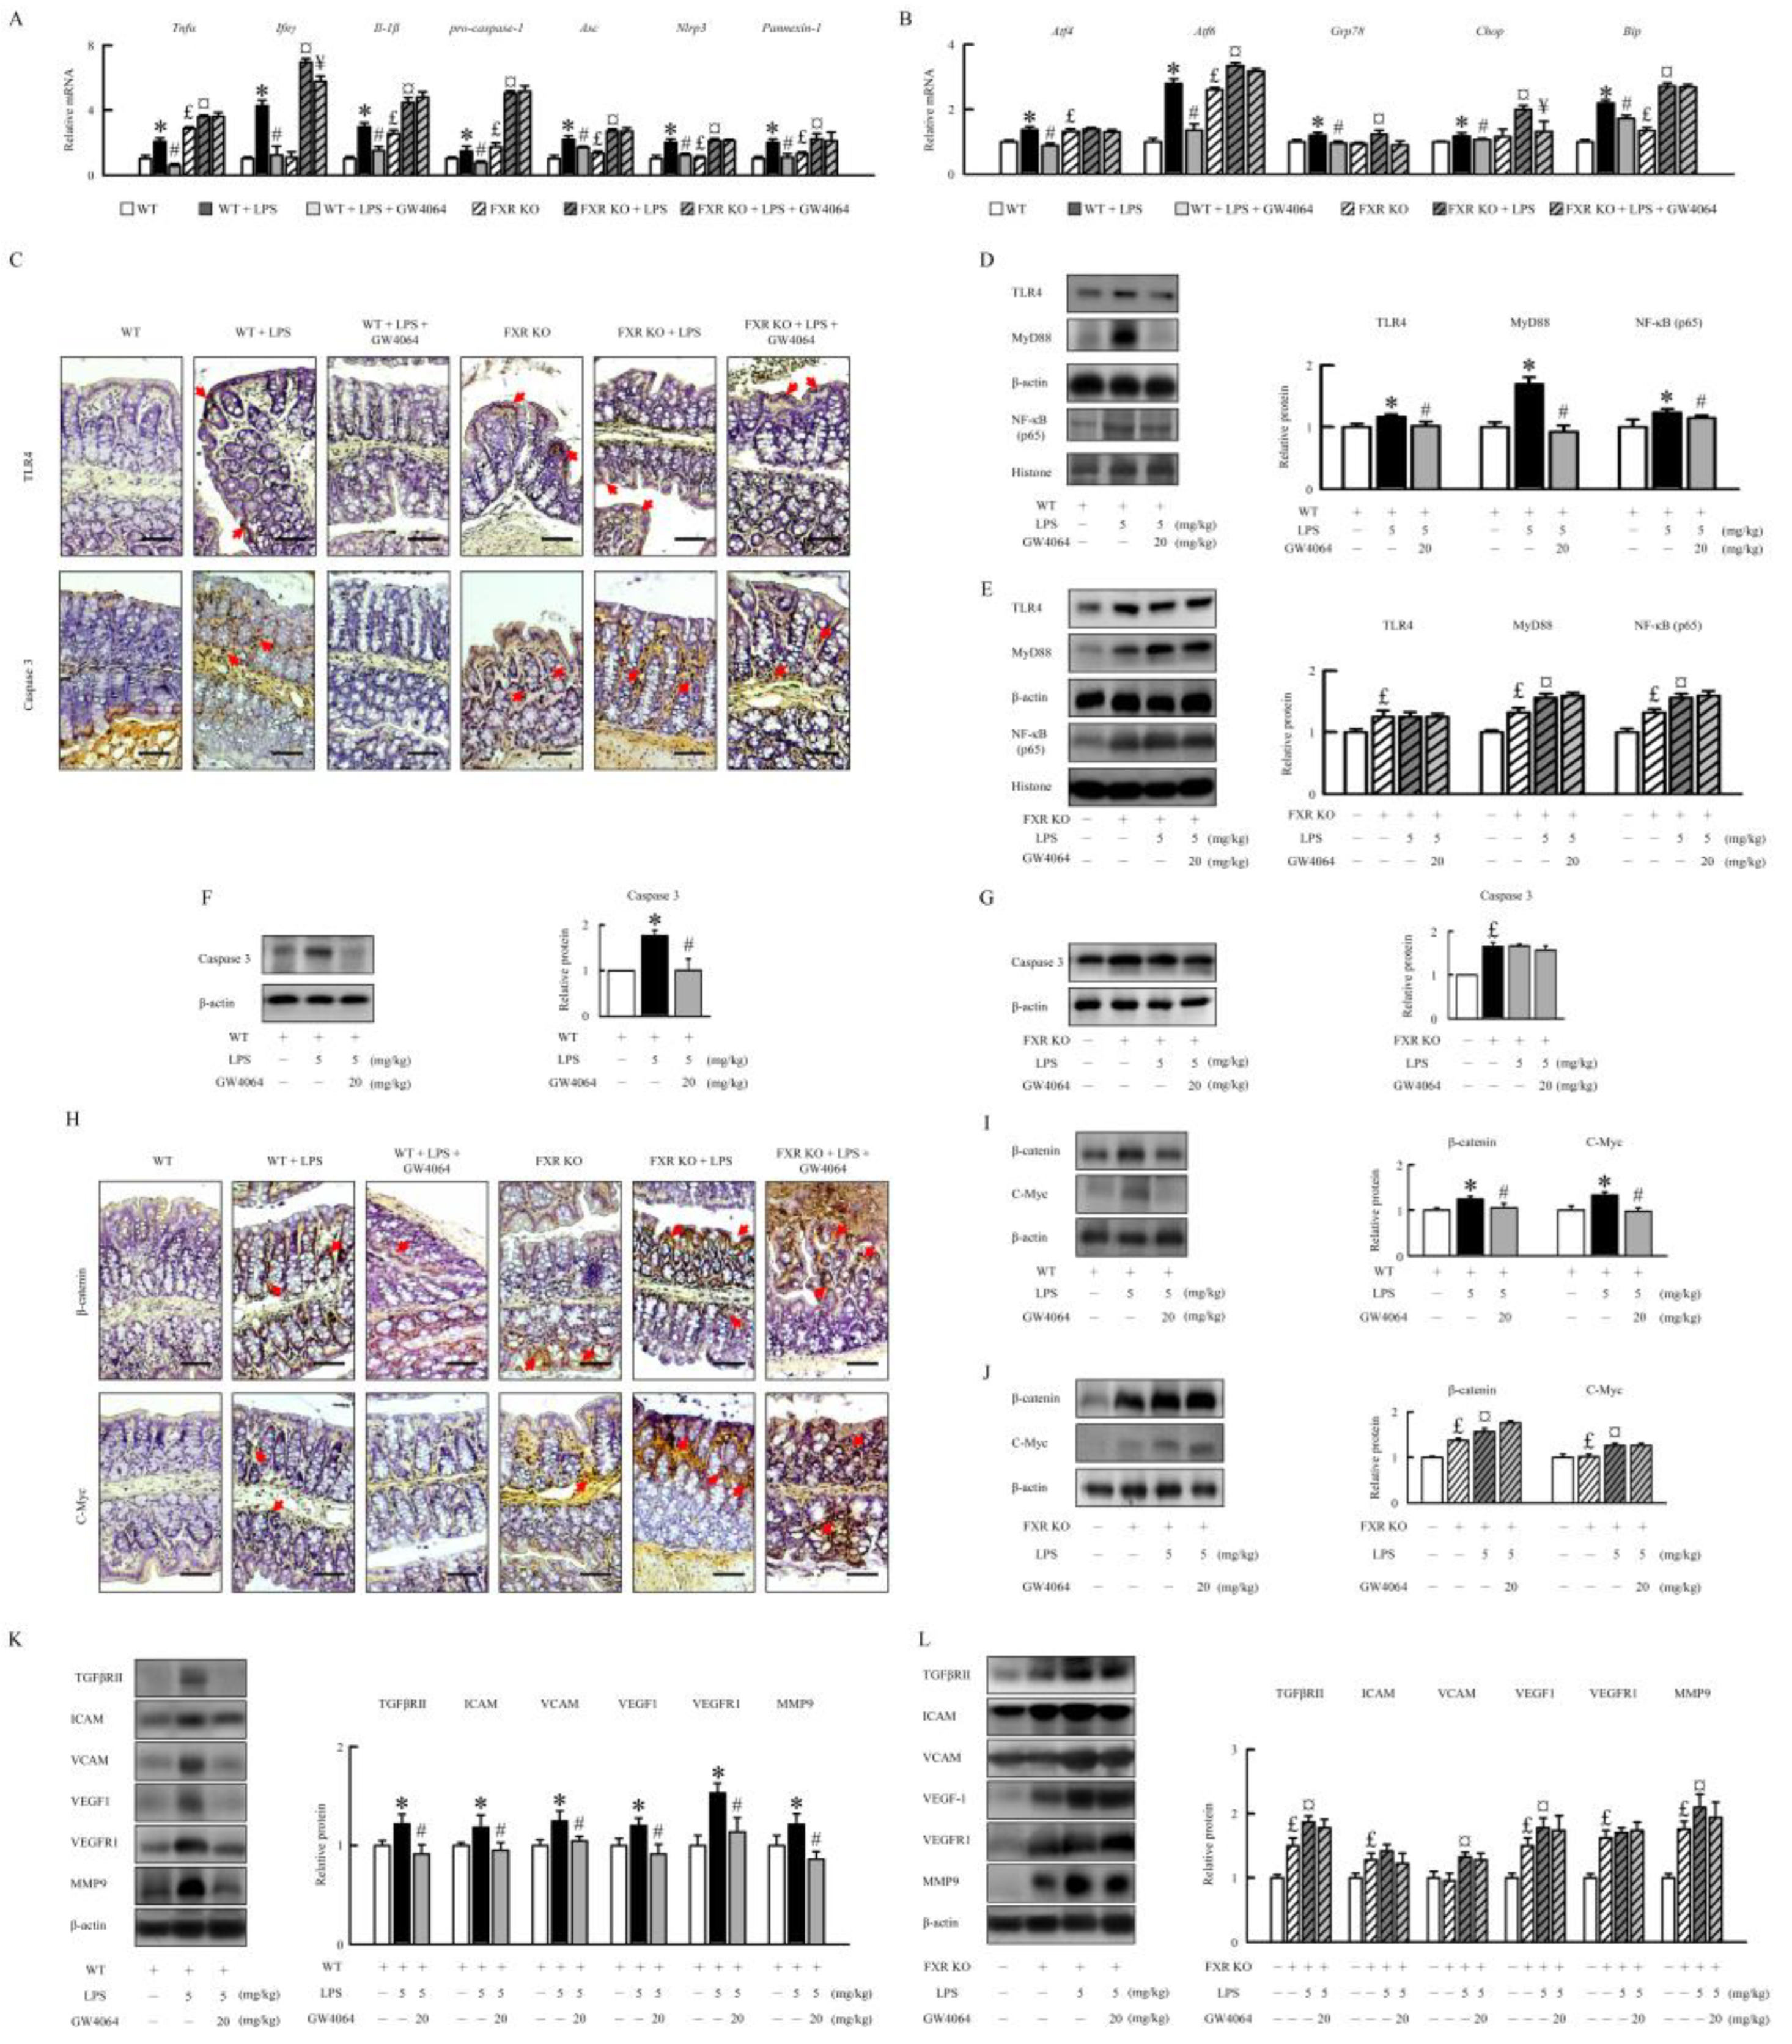
2.5. GW4064 suppresses LPS-induced inflammatory response, ER stress, and angiogenesis in mice
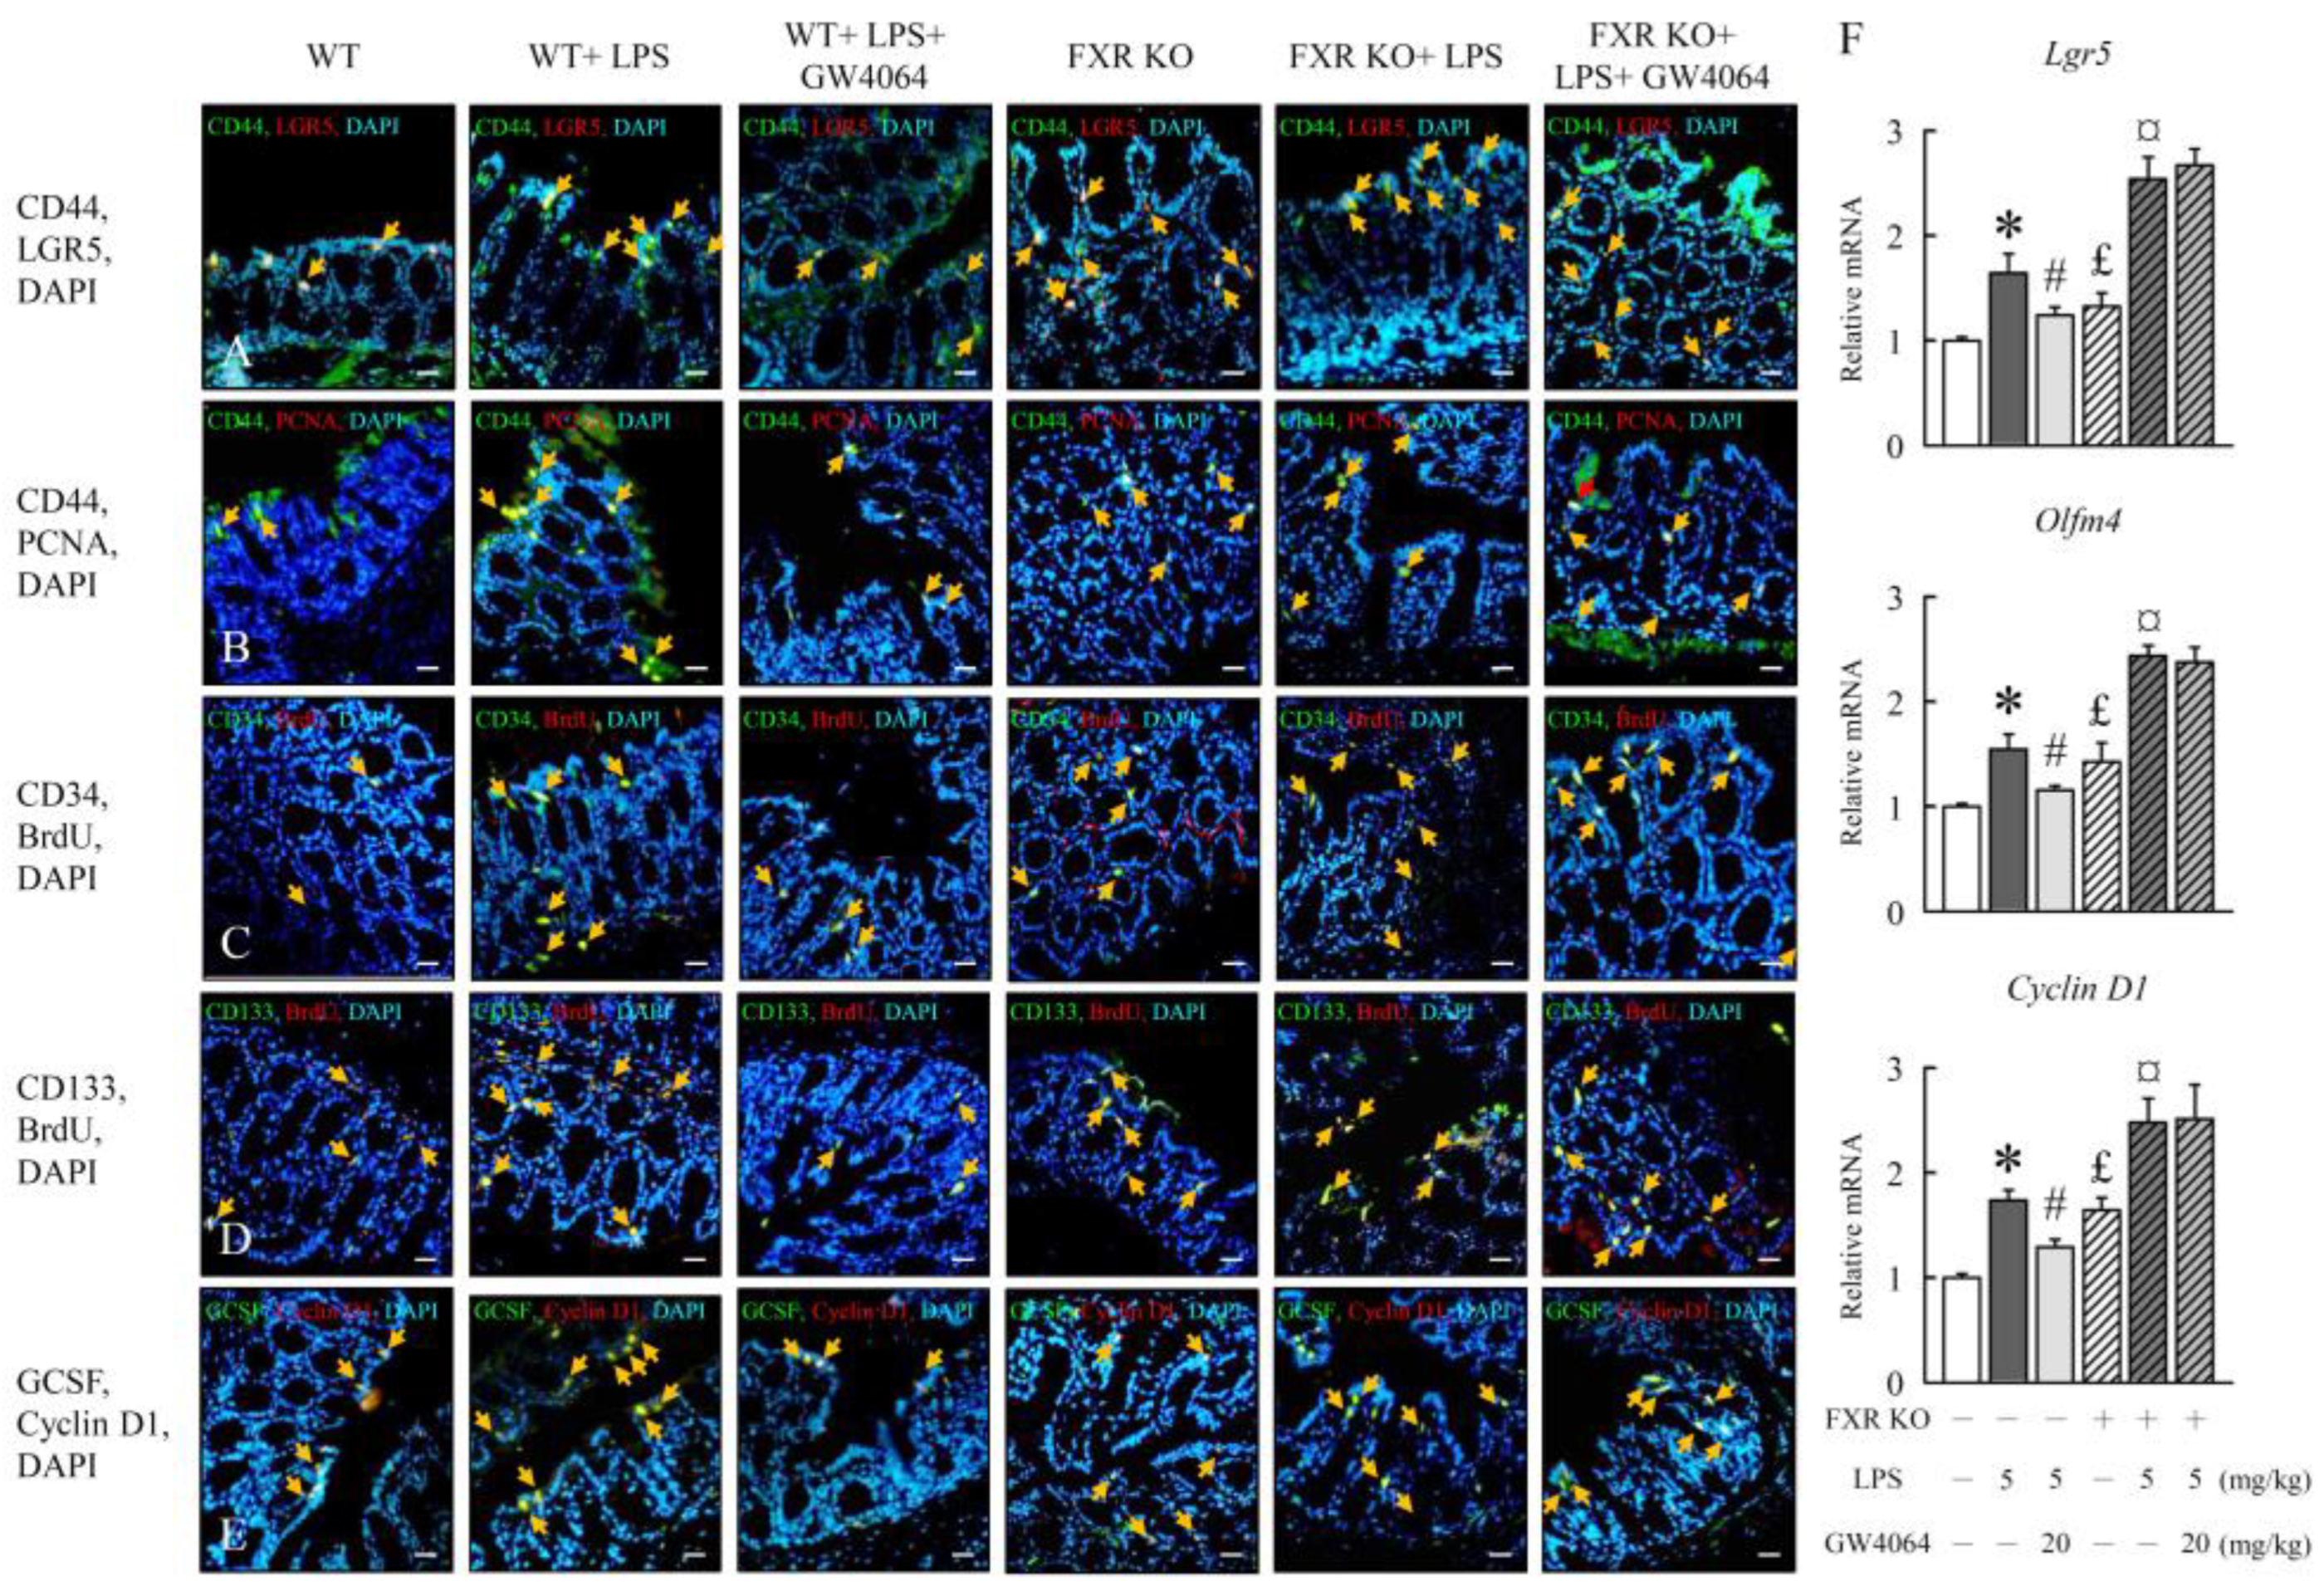
2.6. GW4064 regulates LPS-induced intestinal epithelial cell proliferation
2.7. GW0464 administration affects intestinal microbial diversity and composition
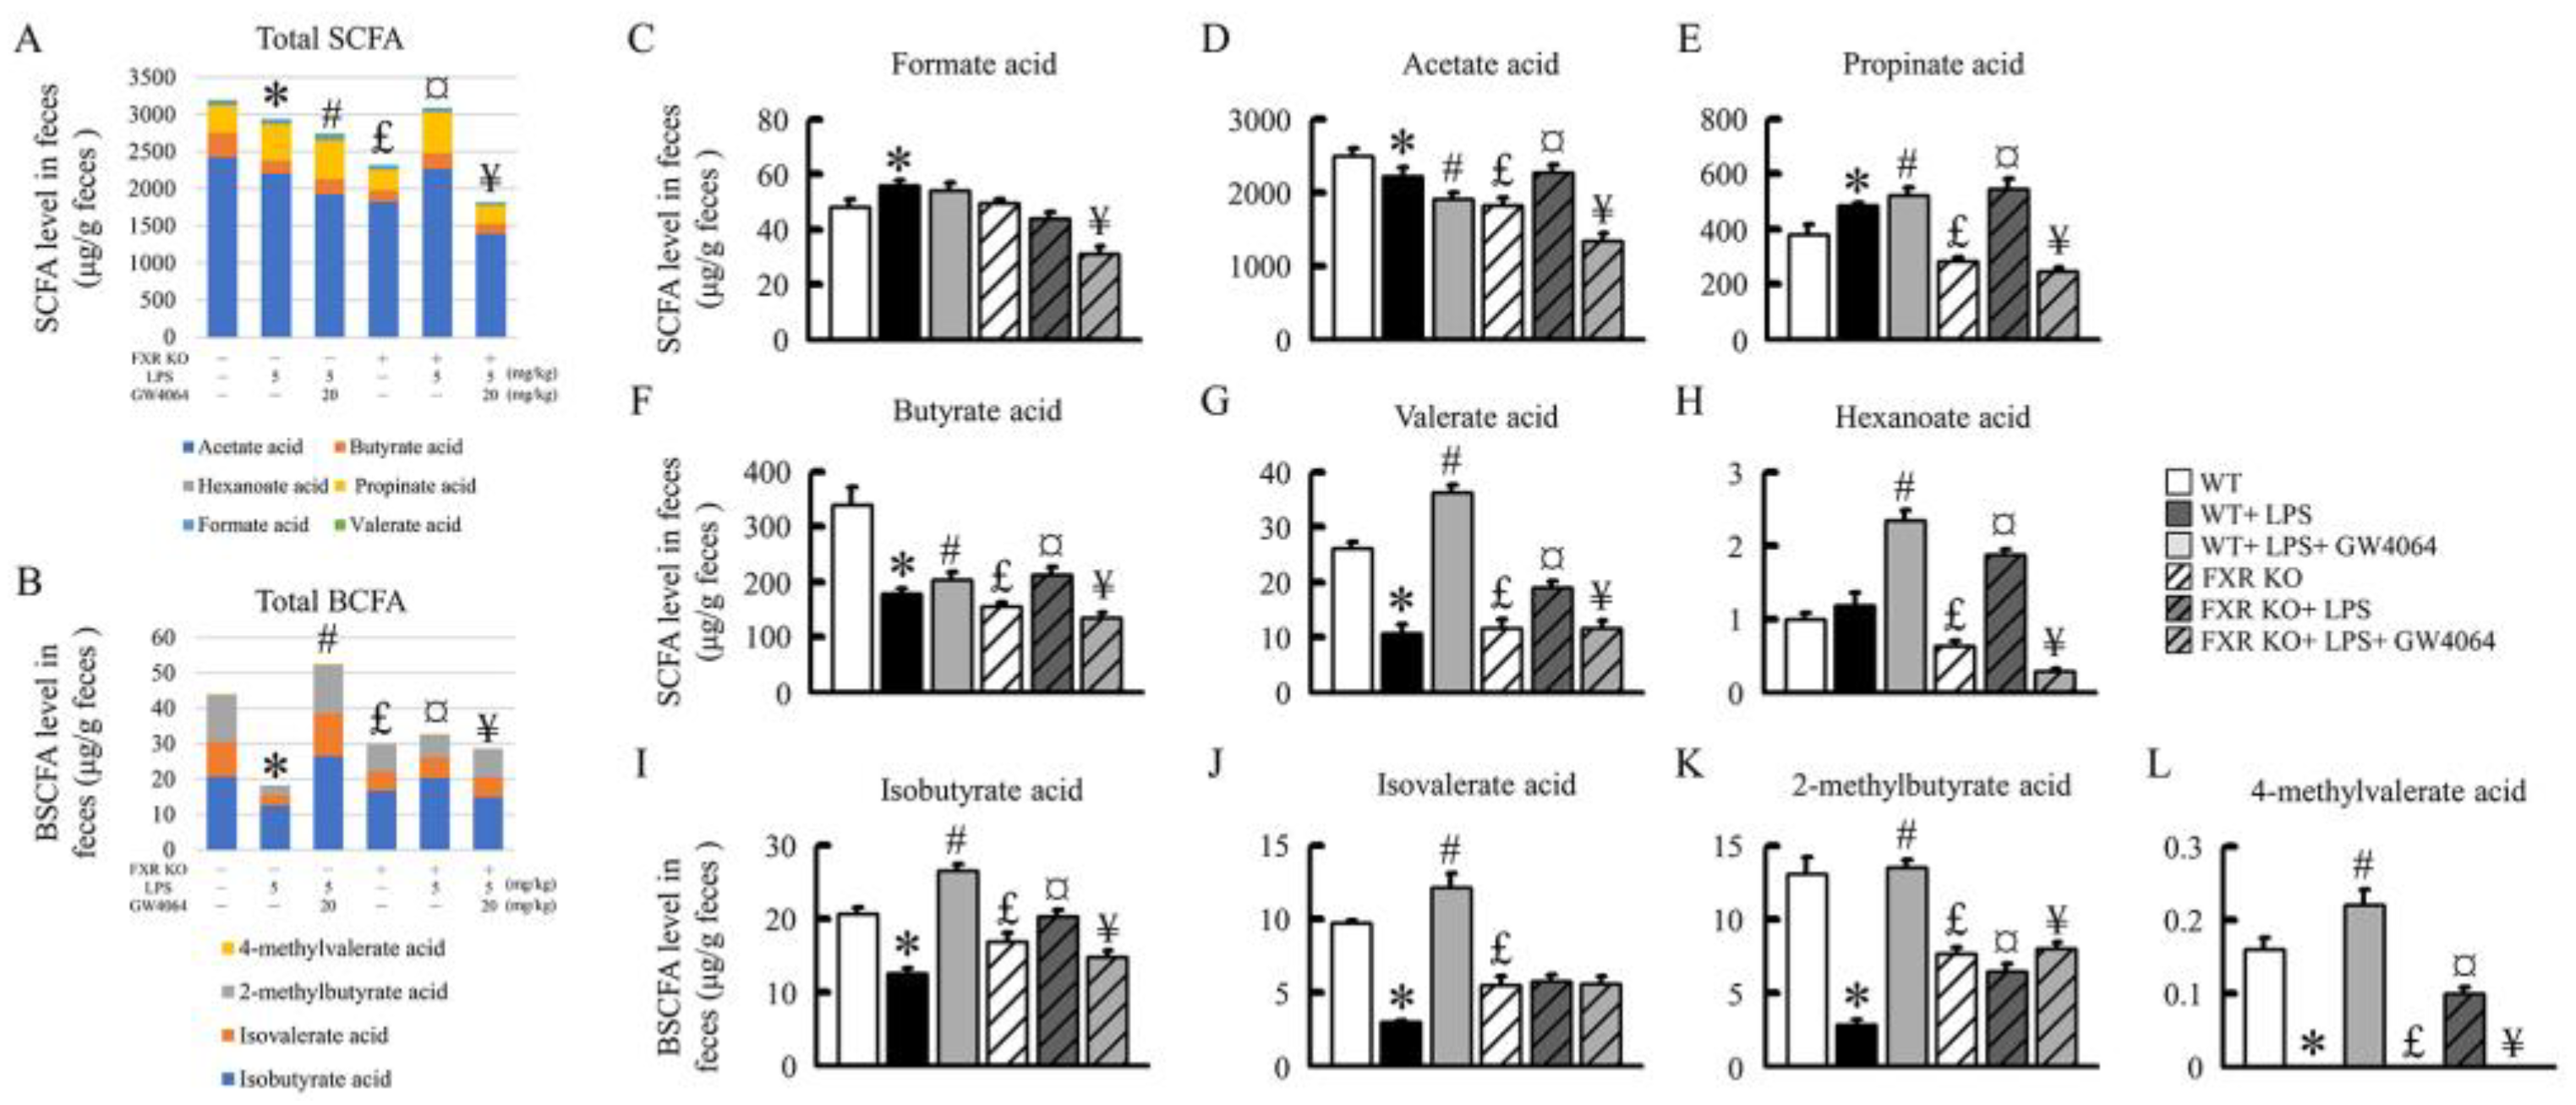
2.8. Impact of GW0464 Administration on Total SCFA and BCFA Concentrations
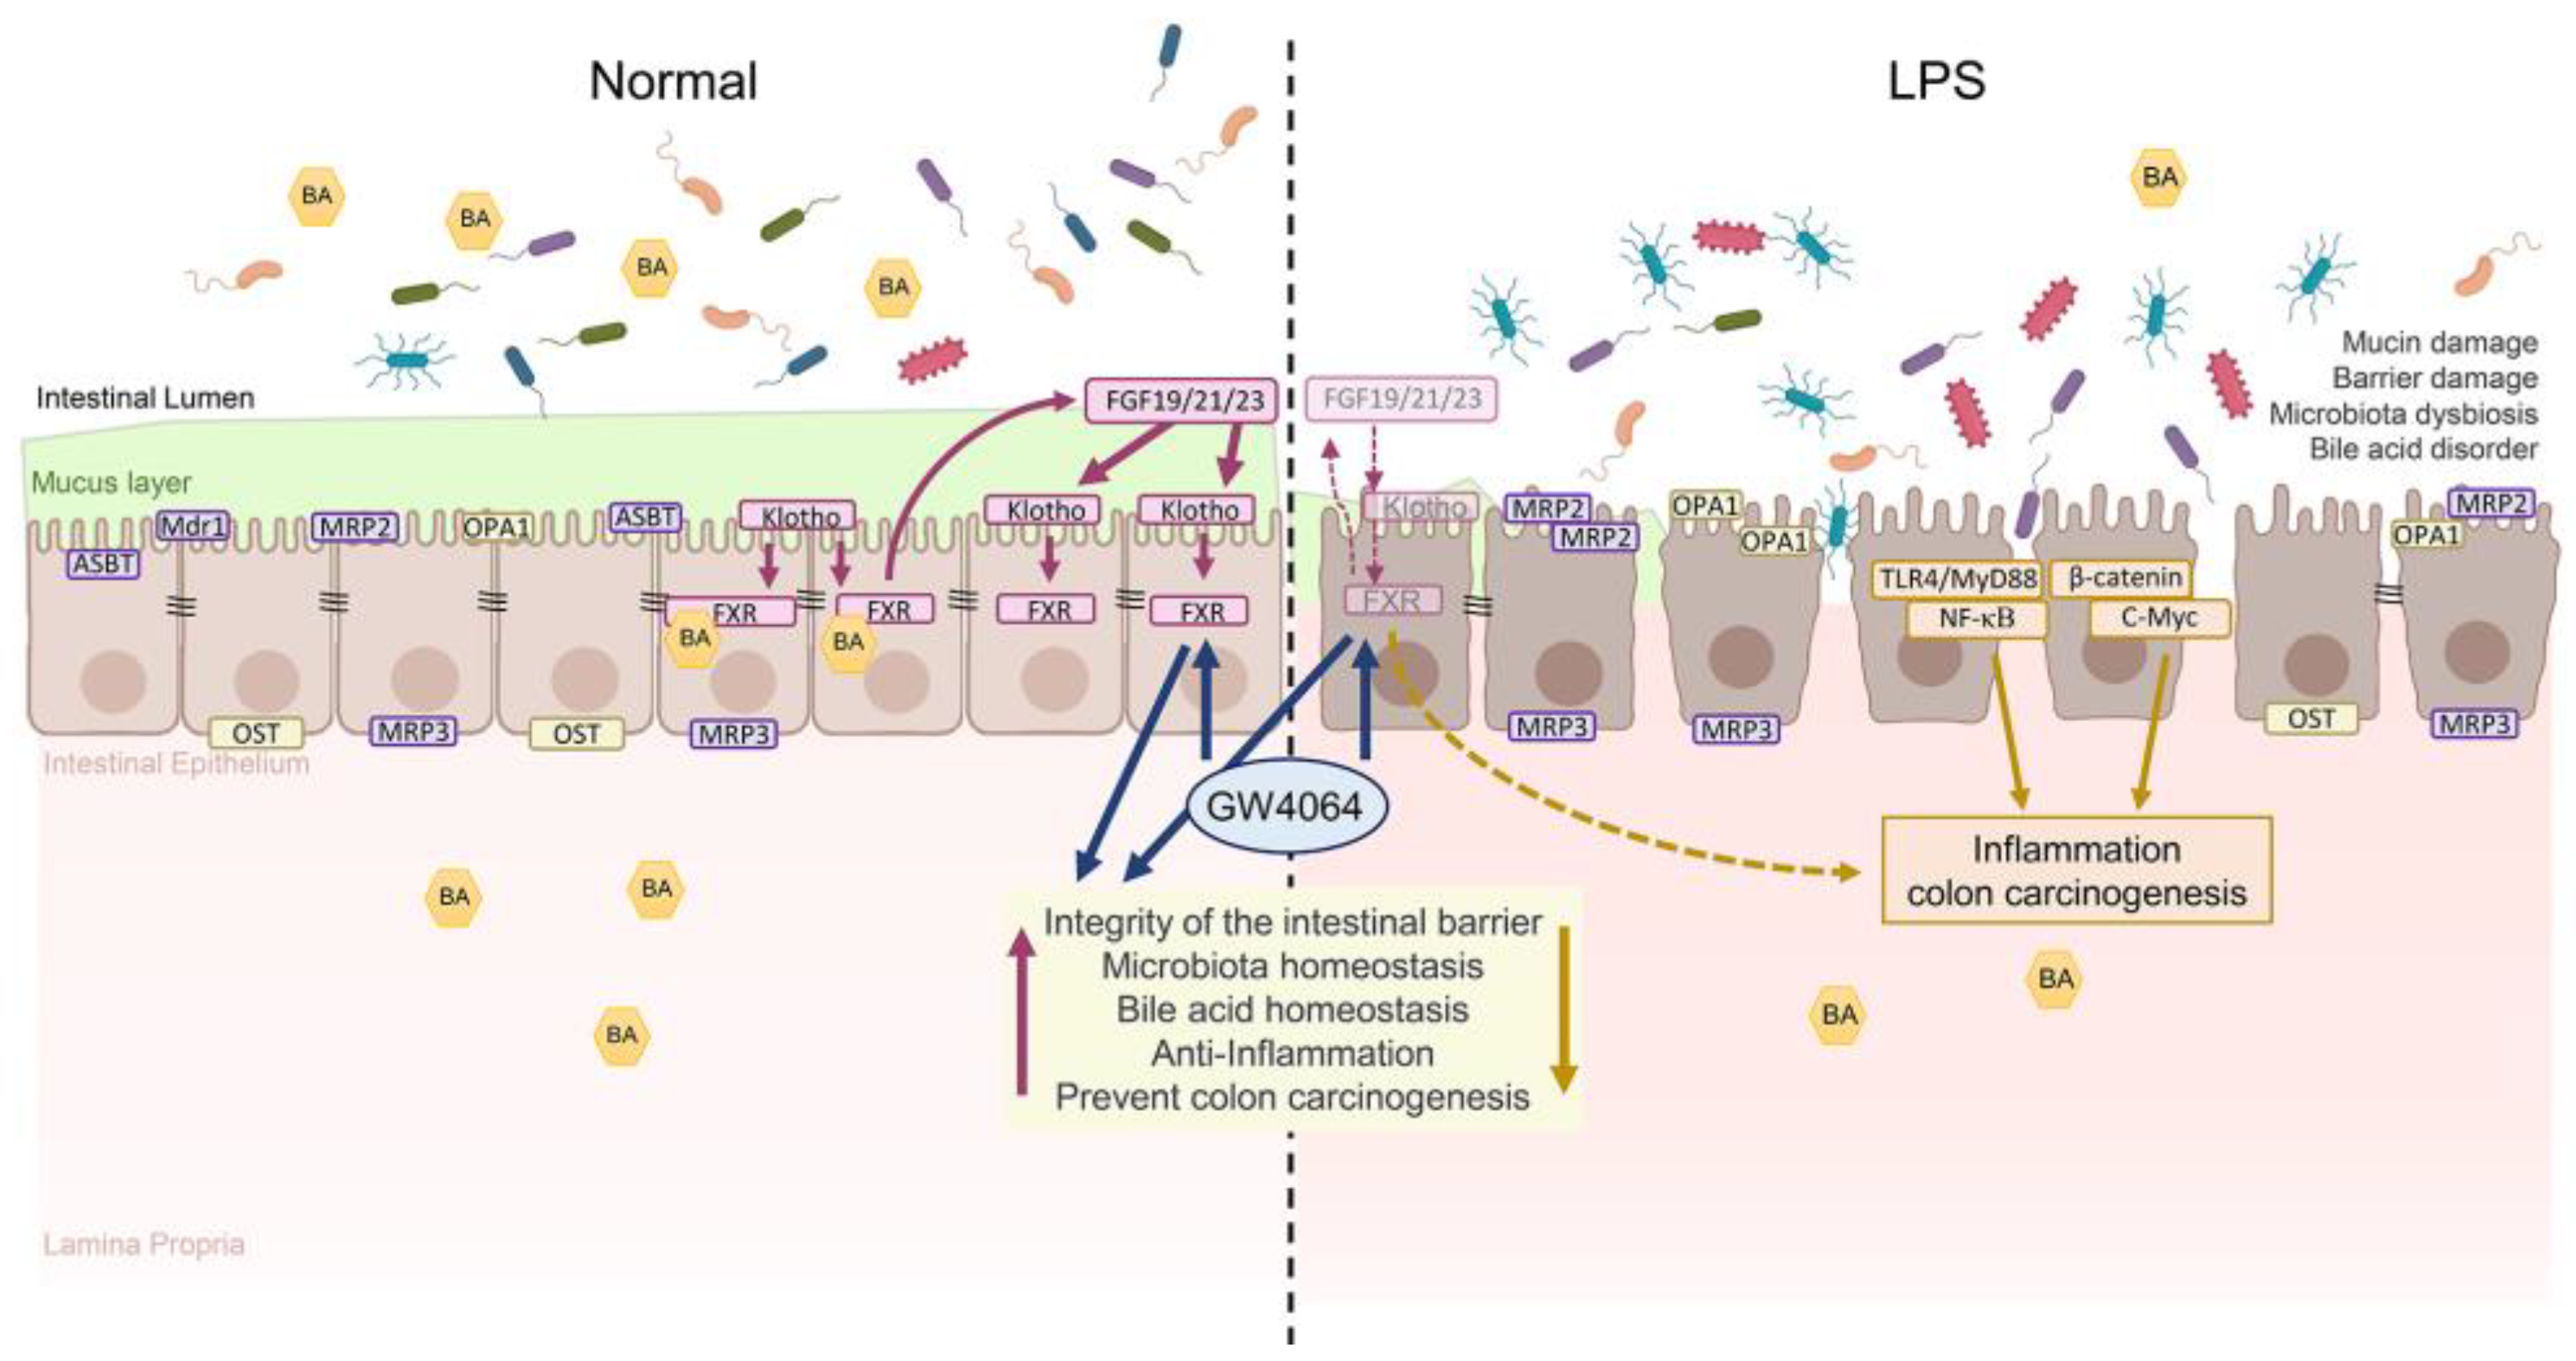
3. Discussion
4. Materials and Methods
4.1. Animals and treatments
4.2. Histology
4.3. Western blot analysis
4.4. Quantitative reverse transcription polymerase chain reaction (qRT-PCR)
4.5. 16S rRNA gene amplification and phylogenetic analysis
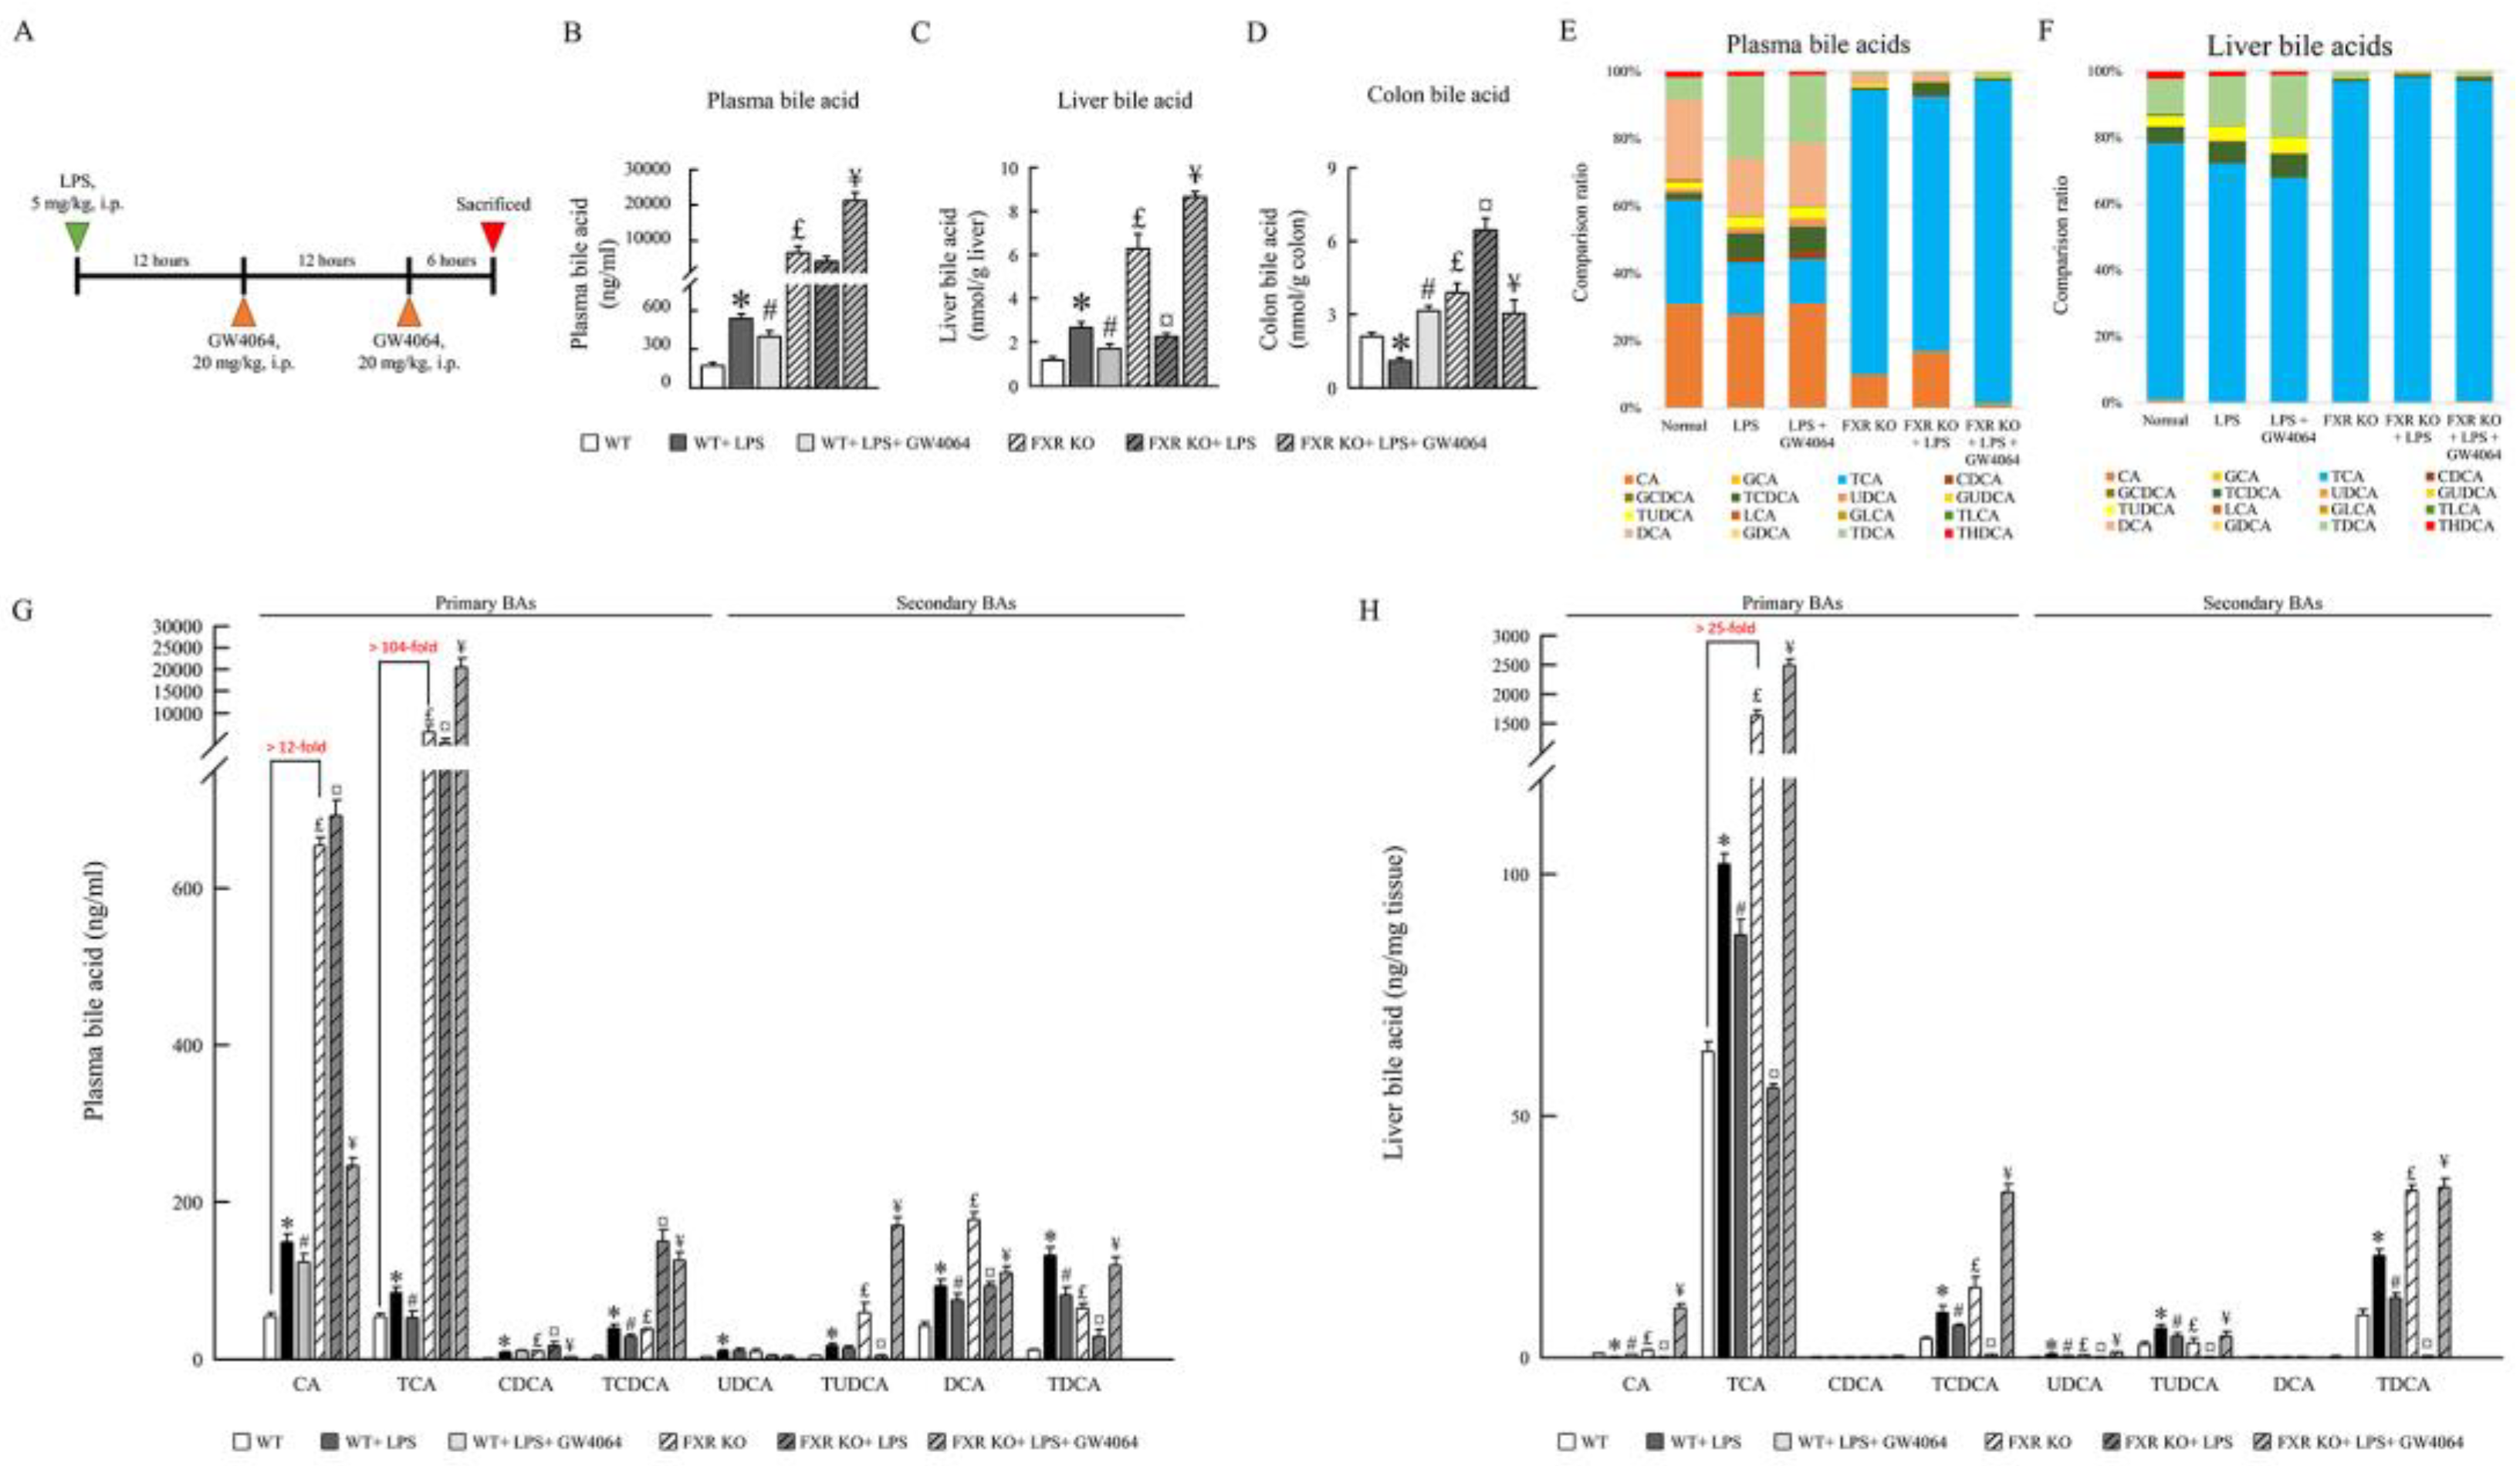
4.6. Plasma, liver, and colonic bile acids analysis
4.7. Fecal SCFAs extraction and Derivatization
4.8. GC/MS analysis
4.9. Statistical analysis
Author Contributions
Funding
Institutional Review Board Statement
Informed Consent Statement
Conflicts of Interest
References
- Zhou:, X.; Cao, L.; Jiang, C.; Xie, Y.; Cheng, X.; Krausz, K.W.; Qi, Y.; Sun, L.; Shah, Y.M.; Gonzalez, F.J.; et al. PPARα-UGT axis activation represses intestinal FXR-FGF15 feedback signalling and exacerbates experimental colitis. Nat. commun. 2014, 5, 4573. [Google Scholar] [CrossRef] [PubMed]
- Vandel, J.; Dubois-Chevalier, J.; Gheeraert, C.; Derudas, B.; Raverdy, V.; Thuillier, D.; Gaal, L.; Francque, S.; Pattou, F.; Staels, B.; et al. Hepatic Molecular Signatures Highlight the Sexual Dimorphism of Nonalcoholic Steatohepatitis (NASH). Hepatology 2021, 73, 920–936. [Google Scholar] [CrossRef] [PubMed]
- Takahashi, S.; Tanaka, N.; Fukami, T.; Xie, C.; Yagai, T.; Kim, D.; Velenosi, T.J.; Yan, T.; Krausz, K.W.; Levi, M.; et al. Role of Farnesoid X Receptor and Bile Acids in Hepatic Tumor Development. Hepatol. commun. 2018, 2, 1567–1582. [Google Scholar] [CrossRef] [PubMed]
- Maran, R.R.; Thomas, A.; Roth, M.; Sheng, Z.; Esterly, N.; Pinson, D.; Gao, X.; Zhang, Y.; Ganapathy, V.; Gonzalez, F.J.; et al. Farnesoid X receptor deficiency in mice leads to increased intestinal epithelial cell proliferation and tumor development. J. Pharmacol. Exp. Tther. 2009, 328, 469–477. [Google Scholar] [CrossRef] [PubMed]
- Wolfe, A.; Thomas, A.; Edwards, G.; Jaseja, R.; Guo, G.L.; Apte, U. Increased activation of the Wnt/β-catenin pathway in spontaneous hepatocellular carcinoma observed in farnesoid X receptor knockout mice. J. Pharmacol. Exp. Ther. 2011, 338, 12–21. [Google Scholar] [CrossRef]
- Liu, N.; Meng, Z.; Lou, G.; Zhou, W.; Wang, X.; Zhang, Y.; Zhang, L.; Liu, X.; Yen, Y.; Lai, L.; et al. Hepatocarcinogenesis in FXR-/- mice mimics human HCC progression that operates through HNF1α regulation of FXR expression. Mol. Endocrinol. 2012, 26, 775–785. [Google Scholar] [CrossRef]
- Dolegowska, K.; Marchelek-Mysliwiec, M.; Nowosiad-Magda, M.; Slawinski, M.; Dolegowska, B. FGF19 subfamily members: FGF19 and FGF21. J. Physiol. Biochem. 2019, 75, 229–240. [Google Scholar] [CrossRef] [PubMed]
- Fu, T.; Kim, Y.C.; Byun, S.; Kim, D.H.; Seok, S.; Suino-Powell, K.; Xu, H.E.; Kemper, B.; Kemper, J.K. FXR Primes the Liver for Intestinal FGF15 Signaling by Transient Induction of β-Klotho. Mol. Endocrinol. 2016, 30, 92–103. [Google Scholar] [CrossRef] [PubMed]
- Wong, B.S.; Camilleri, M.; Carlson, P.J.; Guicciardi, M.E.; Burton, D.; McKinzie, S.; Rao, A.S.; Zinsmeister, A.R.; Gores, G.J. A Klothoβ variant mediates protein stability and associates with colon transit in irritable bowel syndrome with diarrhea. Gastroenterology 2011, 140, 1934–1942. [Google Scholar] [CrossRef]
- Hou, Z.; Ding, Q.; Li, Y.; Zhao, Z.; Yan, F.; Li, Y.; Wang, X.; Xu, J.; Chen, W.; Wu, G.; et al. Intestinal epithelial β Klotho is a critical protective factor in alcohol-induced intestinal barrier dysfunction and liver injury. EBioMedicine 2022, 82, 104181. [Google Scholar] [CrossRef]
- Kuro, O.M. The Klotho proteins in health and disease. Nat. Rev. Nephrol. 2019, 15, 27–44. [Google Scholar] [CrossRef]
- Quarles, L.D. Fibroblast growth factor 23 and α-Klotho co-dependent and independent functions. Curr. Opin. Nephrol. Hypertens. 2019, 28, 16–25. [Google Scholar] [CrossRef]
- Richter, B.; Faul, C. FGF23 Actions on Target Tissues-With and Without Klotho. Front. Endocrinol. 2018, 9, 189. [Google Scholar] [CrossRef]
- Li, S.; Yu, L.; He, A.; Liu, Q. Klotho Inhibits Unilateral Ureteral Obstruction-Induced Endothelial-to-Mesenchymal Transition via TGF-β1/Smad2/Snail1 Signaling in Mice. Front. Pharmacol. 2019, 10, 348. [Google Scholar] [CrossRef]
- Ligumsky, H.; Merenbakh-Lamin, K.; Keren-Khadmy, N.; Wolf, I.; Rubinek, T. The role of α-klotho in human cancer: molecular and clinical aspects. Oncogene 2022, 41, 4487–4497. [Google Scholar] [CrossRef]
- Li, X.X.; Huang, L.Y.; Peng, J.J.; Liang, L.; Shi, D.B.; Zheng, H.T.; Cai, S.J. Klotho suppresses growth and invasion of colon cancer cells through inhibition of IGF1R-mediated PI3K/AKT pathway. Int. J. Oncol 2014, 45, 611–618. [Google Scholar] [CrossRef]
- Degirolamo, C.; Rainaldi, S.; Bovenga, F.; Murzilli, S.; Moschetta, A. Microbiota modification with probiotics induces hepatic bile acid synthesis via downregulation of the Fxr-Fgf15 axis in mice. Cell Rep. 2014, 7, 12–18. [Google Scholar] [CrossRef]
- Fox, A.C.; McConnell, K.W.; Yoseph, B.P.; Breed, E.; Liang, Z.; Clark, A.T.; O'Donnell, D.; Zee-Cheng, B.; Jung, E.; Dominguez, J.A.; et al. The endogenous bacteria alter gut epithelial apoptosis and decrease mortality following Pseudomonas aeruginosa pneumonia. Shock 2012, 38, 508–514. [Google Scholar] [CrossRef] [PubMed]
- Kho, Z.Y.; Lal, S.K. The Human Gut Microbiome - A Potential Controller of Wellness and Disease. Front. Microbiol. 2018, 9, 1835. [Google Scholar] [CrossRef] [PubMed]
- Zaborin, A.; Smith, D.; Garfield, K.; Quensen, J.; Shakhsheer, B.; Kade, M.; Tirrell, M.; Tiedje, J.; Gilbert, J.A.; Zaborina, O.; et al. Membership and behavior of ultra-low-diversity pathogen communities present in the gut of humans during prolonged critical illness. mBio 2014, 5, e01361–01314. [Google Scholar] [CrossRef] [PubMed]
- Taylor, N.S.; Xu, S.; Nambiar, P.; Dewhirst, F.E.; Fox, J.G. Enterohepatic Helicobacter species are prevalent in mice from commercial and academic institutions in Asia, Europe, and North America. J. Clin. Microbiol. 2007, 45, 2166–2172. [Google Scholar] [CrossRef] [PubMed]
- Whary, M.T.; Fox, J.G. Natural and experimental Helicobacter infections. Comp. Med. 2004, 54, 128–158. [Google Scholar] [PubMed]
- Swennes, A.G.; Sheh, A.; Parry, N.M.; Muthupalani, S.; Lertpiriyapong, K.; García, A.; Fox, J.G. Helicobacter hepaticus infection promotes hepatitis and preneoplastic foci in farnesoid X receptor (FXR) deficient mice. PloS one 2014, 9, e106764. [Google Scholar] [CrossRef] [PubMed]
- Watanabe, M.; Houten, S.M.; Mataki, C.; Christoffolete, M.A.; Kim, B.W.; Sato, H.; Messaddeq, N.; Harney, J.W.; Ezaki, O.; Kodama, T.; et al. Bile acids induce energy expenditure by promoting intracellular thyroid hormone activation. Nature 2006, 439, 484–489. [Google Scholar] [CrossRef]
- Liu, H.M.; Liao, J.F.; Lee, T.Y. Farnesoid X receptor agonist GW4064 ameliorates lipopolysaccharide-induced ileocolitis through TLR4/MyD88 pathway related mitochondrial dysfunction in mice. Biochem. Biophys Res. Commun. 2017, 490, 841–848. [Google Scholar] [CrossRef] [PubMed]
- Sheng, L.; Jena, P.K.; Hu, Y.; Liu, H.X.; Nagar, N.; Kalanetra, K.M.; French, S.W.; French, S.W.; Mills, D.A.; Wan, Y.Y. Hepatic inflammation caused by dysregulated bile acid synthesis is reversible by butyrate supplementation. J. Pathol. 2017, 243, 431–441. [Google Scholar] [CrossRef] [PubMed]
- Ridlon, J.M.; Wolf, P.G.; Gaskins, H.R. Taurocholic acid metabolism by gut microbes and colon cancer. Gut microbes 2016, 7, 201–215. [Google Scholar] [CrossRef] [PubMed]
- Dawson, P.A.; Lan, T.; Rao, A. Bile acid transporters. J. Lipid Res. 2009, 50, 2340–2357. [Google Scholar] [CrossRef]
- Bailey, A.M.; Zhan, L.; Maru, D.; Shureiqi, I.; Pickering, C.R.; Kiriakova, G.; Izzo, J.; He, N.; Wei, C.; Baladandayuthapani, V.; et al. FXR silencing in human colon cancer by DNA methylation and KRAS signaling. Am. J. Physiol. Gastrointest. Liver Physiol. 2014, 306, G48–G58. [Google Scholar] [CrossRef]
- Somm, E.; Henry, H.; Bruce, S.J.; Bonnet, N.; Montandon, S.A.; Niederländer, N.J.; Messina, A.; Aeby, S.; Rosikiewicz, M.; Fajas, L.; et al. β-Klotho deficiency shifts the gut-liver bile acid axis and induces hepatic alterations in mice. Am. J. Physiol. Endocrinol. Metab. 2018, 315, E833–E847. [Google Scholar] [CrossRef]
- Stamatovic, S.M.; Johnson, A.M.; Sladojevic, N.; Keep, R.F.; Andjelkovic, A.V. Endocytosis of tight junction proteins and the regulation of degradation and recycling. Ann. N. Y. Acad. Sci. 2017, 1397, 54–65. [Google Scholar] [CrossRef] [PubMed]
- Lax, S.; Schauer, G.; Prein, K.; Kapitan, M.; Silbert, D.; Berghold, A.; Berger, A.; Trauner, M. Expression of the nuclear bile acid receptor/farnesoid X receptor is reduced in human colon carcinoma compared to nonneoplastic mucosa independent from site and may be associated with adverse prognosis. Int. J. Cancer 2012, 130, 2232–2239. [Google Scholar] [CrossRef] [PubMed]
- Frankenberg, T.; Rao, A.; Chen, F.; Haywood, J.; Shneider, B.L.; Dawson, P.A. Regulation of the mouse organic solute transporter alpha-beta, Ostalpha-Ostbeta, by bile acids. Am. J. Physiol. Gastrointest. Liver Physiol. 2006, 290, G912–G922. [Google Scholar] [CrossRef] [PubMed]
- De Gottardi, A.; Touri, F.; Maurer, C.A.; Perez, A.; Maurhofer, O.; Ventre, G.; Bentzen, C.L.; Niesor, E.J.; Dufour, J.F. The bile acid nuclear receptor FXR and the bile acid binding protein IBABP are differently expressed in colon cancer. Dig. Dis. and Sci. 2004, 49, 982–989. [Google Scholar] [CrossRef] [PubMed]
- De Magalhaes Filho, C.D.; Downes, M.; Evans, R. Bile Acid Analog Intercepts Liver Fibrosis. Cell 2016, 166, 789. [Google Scholar] [CrossRef] [PubMed]
- Modica, S.; Murzilli, S.; Salvatore, L.; Schmidt, D.R.; Moschetta, A. Nuclear bile acid receptor FXR protects against intestinal tumorigenesis. Cancer Res. 2008, 68, 9589–9594. [Google Scholar] [CrossRef]
- Fu, T.; Choi, S.E.; Kim, D.H.; Seok, S.; Suino-Powell, K.M.; Xu, H.E.; Kemper, J.K. Aberrantly elevated microRNA-34a in obesity attenuates hepatic responses to FGF19 by targeting a membrane coreceptor β-Klotho. Proc. Natl. Acad. Sci. U S A 2012, 109, 16137–16142. [Google Scholar] [CrossRef] [PubMed]
- Parséus, A.; Sommer, N.; Sommer, F.; Caesar, R.; Molinaro, A.; Ståhlman, M.; Greiner, T.U.; Perkins, R.; Bäckhed, F. Microbiota-induced obesity requires farnesoid X receptor. Gut 2017, 66, 429–437. [Google Scholar] [CrossRef] [PubMed]
- Sachdeva, A.; Gouge, J.; Kontovounisios, C.; Nikolaou, S.; Ashworth, A.; Lim, K.; Chong, I. Klotho and the Treatment of Human Malignancies. Cancers (Basel) 2020, 12, 1665. [Google Scholar] [CrossRef]
- Arbel Rubinstein, T.; Shahmoon, S.; Zigmond, E.; Etan, T.; Merenbakh-Lamin, K.; Pasmanik-Chor, M.; Har-Zahav, G.; Barshack, I.; Vainer, G.W.; Skalka, N.; et al. Klotho suppresses colorectal cancer through modulation of the unfolded protein response. Oncogene 2019, 38, 794–807. [Google Scholar] [CrossRef]
- Jena, P.K.; Sheng, L.; Liu, H.X.; Kalanetra, K.M.; Mirsoian, A.; Murphy, W.J.; French, S.W.; Krishnan, V.V.; Mills, D.A.; Wan, Y.Y. Western Diet-Induced Dysbiosis in Farnesoid X Receptor Knockout Mice Causes Persistent Hepatic Inflammation after Antibiotic Treatment. Am. J. Pathol. 2017, 187, 1800–1813. [Google Scholar] [CrossRef] [PubMed]
- Wexler, H.M. Bacteroides: the good, the bad, and the nitty-gritty. Clin. Microbiol. Rev. 2007, 20, 593–621. [Google Scholar] [CrossRef] [PubMed]
- Berry, D.; Schwab, C.; Milinovich, G.; Reichert, J.; Ben Mahfoudh, K.; Decker, T.; Engel, M.; Hai, B.; Hainzl, E.; Heider, S.; et al. Phylotype-level 16S rRNA analysis reveals new bacterial indicators of health state in acute murine colitis. ISME J. 2012, 6, 2091–2106. [Google Scholar] [CrossRef] [PubMed]
- Che, L.; Hu, Q.; Wang, R.; Zhang, D.; Liu, C.; Zhang, Y.; Xin, G.; Fang, Z.; Lin, Y.; Xu, S.; et al. Inter-correlated gut microbiota and SCFAs changes upon antibiotics exposure links with rapid body-mass gain in weaned piglet model. J. Nutr. Biochem 2019, 74, 108246. [Google Scholar] [CrossRef] [PubMed]
- Che, L.; Hu, Q.; Wang, R.; Zhang, D.; Liu, C.; Zhang, Y.; Xin, G.; Fang, Z.; Lin, Y.; Xu, S.; et al. Inter-correlated gut microbiota and SCFAs changes upon antibiotics exposure links with rapid body-mass gain in weaned piglet model. J. Nutr. Biochem. 2019, 74, 108246. [Google Scholar] [CrossRef]
- Flint, H.J.; Scott, K.P.; Louis, P.; Duncan, S.H. The role of the gut microbiota in nutrition and health. Nat Rev Gastroenterol Hepatol. 2012, 9, 577–589. [Google Scholar] [CrossRef] [PubMed]
- Belcheva, A.; Irrazabal, T.; Robertson, S.J.; Streutker, C.; Maughan, H.; Rubino, S.; Moriyama, E.H.; Copeland, J.K.; Surendra, A.; Kumar, S.; et al. Gut microbial metabolism drives transformation of MSH2-deficient colon epithelial cells. Cell 2014, 158, 288–299. [Google Scholar] [CrossRef] [PubMed]
- Zeng, H.; Hamlin, S.K.; Safratowich, B.D.; Cheng, W.H.; Johnson, L.K. Superior inhibitory efficacy of butyrate over propionate and acetate against human colon cancer cell proliferation via cell cycle arrest and apoptosis: linking dietary fiber to cancer prevention. Nutr. Res. 2020, 83, 63–72. [Google Scholar] [CrossRef] [PubMed]
- Pastorelli, L.; Dozio, E.; Pisani, L.F.; Boscolo-Anzoletti, M.; Vianello, E.; Munizio, N.; Spina, L.; Tontini, G.E.; Peyvandi, F.; Corsi Romanelli, M.M.; et al. Procoagulatory state in inflammatory bowel diseases is promoted by impaired intestinal barrier function. Gastroenterol. Res. Pract. 2015, 2015, 189341. [Google Scholar] [CrossRef]
- Hotta, T.; Yoshida, N.; Yoshikawa, T.; Sugino, S.; Kondo, M. Lipopolysaccharide-induced colitis in rabbits. Res. Exp. Med. 1986, 186, 61–69. [Google Scholar] [CrossRef]
- Yeh, C.C.; Liu, H.M.; Lee, M.C.; Leu, Y.L.; Chiang, W.H.; Chang, H.H.; Lee, T.Y. Phytochemical-rich herbal formula ATG-125 protects against sucrose-induced gastrocnemius muscle atrophy by rescuing Akt signaling and improving mitochondrial dysfunction in young adult mice. Mol. Med. Rep. 2022, 25, 57. [Google Scholar] [CrossRef] [PubMed]
- Mirsepasi, H.; Persson, S.; Struve, C.; Andersen, L.O.; Petersen, A.M.; Krogfelt, K.A. Microbial diversity in fecal samples depends on DNA extraction method: easyMag DNA extraction compared to QIAamp DNA stool mini kit extraction. BMC Res. Notes 2014, 7, 50. [Google Scholar] [CrossRef] [PubMed]
- Edgar, R.C. UPARSE: highly accurate OTU sequences from microbial amplicon reads. Nat. methods 2013, 10, 996–998. [Google Scholar] [CrossRef] [PubMed]
- Metsalu, T.; Vilo, J. ClustVis: a web tool for visualizing clustering of multivariate data using Principal Component Analysis and heatmap. Nucleic Acids Res. 2015, 43, W566–W570. [Google Scholar] [CrossRef]
- Suzuki, Y.; Kaneko, R.; Nomura, M.; Naito, H.; Kitamori, K.; Nakajima, T.; Ogawa, T.; Hattori, H.; Seno, H.; Ishii, A. Simple and rapid quantitation of 21 bile acids in rat serum and liver by UPLC-MS-MS: effect of high fat diet on glycine conjugates of rat bile acids. Nagoya J. Med. Sci.i 2013, 75, 57–71. [Google Scholar]

| Antibodies | Company/State/ Country | Cat number |
| ASBT/SLC10A2 | Bioss Antibidies, Woburn, MA, USA | Cat# bs-4189R |
| αKlotho | Abcam, Trumpington, Cambridge, UK | Cat# ab181373 |
| β-actin | Proteintech, Rosemont, IL, USA | Cat# 60008-1-lg |
| β-catenin | Abcam, Trumpington, Cambridge, UK | Cat# ab6302 |
| βKlotho | GeneTex, Alton Pkwy Irvine, CA, USA | Cat# GTX122197 |
| Caspase 3 | Proteintech, Rosemont, IL, USA | Cat# 25546-1-AP |
| CD133 | Abcam, Trumpington, Cambridge, UK | Cat# ab19898 |
| CD34 | Abcam, Trumpington, Cambridge, UK | Cat# ab8158 |
| Claudin-1 | Abcam, Trumpington, Cambridge, UK | Cat# ab15098 |
| C-Myc | Abcam, Trumpington, Cambridge, UK | Cat# ab32 |
| FGF19 | Abcam, Trumpington, Cambridge, UK | Cat# ab225942 |
| FGF21 | Abcam, Trumpington, Cambridge, UK | Cat# ab171941 |
| FGF23 | Abcam, Trumpington, Cambridge, UK | Cat# ab307421 |
| FXR | Abcam, Trumpington, Cambridge, UK | Cat# ab129089 |
| Histone | Santa Cruz Biotechnology, Santa Cruz, California, USA | Cat# sc-56695 |
| ICAM | Thermo Fisher Scientific, Rockford, IL, USA | Cat# MA5407 |
| LGR5 | Abcam, Trumpington, Cambridge, UK | Cat# ab75850 |
| MMP9 | Merck Millipore, Burlington, Massachusetts, USA | Cat# NP_004985 |
| MRP2 | Thermo Fisher Scientific, Rockford, IL, USA | Cat# MA5-15700 |
| MRP3 | Biocompare, South San Francisco, CA, USA | Cat# L1010 |
| MyD88 | Abcam, Trumpington, Cambridge, UK | Cat# ab28763 |
| NF-κB | Santa Cruz Biotechnology, Santa Cruz, California, USA | Cat# sc-8008 |
| OATP/SLCO1A2 | Merck Millipore, Burlington, Massachusetts, USA | Cat# SAB4502814 |
| OSTβ | Biorbyt, Cambridge, UK | Cat# orb1964 |
| PCNA | Abcam, Trumpington, Cambridge, UK | Cat# ab18197 |
| TGFβRII | Thermo Fisher Scientific, Rockford, IL, USA | Cat# PA5-36115 |
| TLR4 | Thermo Fisher Scientific, Rockford, IL, USA | Cat# MA5-16216 |
| VCAM | Abcam, Trumpington, Cambridge, UK | Cat# ab78712 |
| VEGF | Boster Biological Technology, Pleasanton, CA, USA | Cat# PB9071 |
| VEGFR1 | Abcam, Trumpington, Cambridge, UK | Cat# ab32152 |
| ZO-1 | Abcam, Trumpington, Cambridge, UK, | Cat# ab59720 |
| Goat anti-mouse IgG | MilliporeSigma, Burlington, Massachusetts | Cat# Ap124P |
| Goat anti-rabbit IgG | Jackson ImmunoResearch Laboratories, West Grove, PA, USA | Cat# 111-065-003 |
| Goat anti-rat IgG | Jackson ImmunoResearch Laboratories, West Grove, PA, USA | Cat# 112-065-003 |
| Gene | Forward Primer sequences (5’ - 3’) | Reverse Primer sequences (5’ - 3’) |
| Nlrp3 | agccttccaggatcctcttc | cttgggcagcagtttctttc |
| Asc | gaagctgctgacagtgcaac | gccacagctccagactcttc |
| Panx-1 | ggccacggagtatgtgttct | tacagcagcccagcagtatg |
| Pro-casp 1 | agatggcacatttccaggac | gatcctccagcagcaacttc |
| Tnf-α | ttgacctcagcgctgagttg | cctgtagcccacgtcgtagc |
| Il-1β | gcaactgttcctgaactca | ctcggagcctgtagtgcag |
| Ifn-γ | tggcatagatgtggaagaaaagag | tgcaggattttcatgtcaccat |
| Mrp2 | gcttcccatggtgatctctt | atcatcgcttcccaggtact |
| Mrp3 | ctgggtcccctgcatctac | gccgtcttgagcctggataac |
| Mdr1b | gtgttaaaggggcgatgggcg | aggcttggccagacaacagctt |
| Mdr2 | atcctatgcactggccttctggt | gaaagcatcaatacagggggcag |
| Asbt | ggaactggctccaatatcctg | gttcccgagtcaacccacat |
| Ibabp | acaggacttcacctggtc | gcgctcataggtcacatc |
| Gapdh | tcaccaccatggagaaggc | gctaagcagttggtggtgca |
| Car | ggaggaccagatctcccttc | atttcattgccactcccaag |
| Cyp3a11 | gtgctcctagcaatcagctt | cagtgcctaaaaatggcagagg |
| Sult2a1 | ggaaggaccacgactcataac | gattcttcacaaggtttgtgttacc |
| Bcrp | tcgcagaaggagatgtgttgag | ccagaatagcattaaggccagg |
| Oatp2b1 | attgcaggcatcacacaaga | tagaagacctggcttttgcc |
| Ostα | gccaggcaggactcatatcaaa | ggcaactgagccagtggtaaga |
| Ostβ | caggaactgctggaagaaatgc | gcaggtcttctggtgtttctttgt |
| Grp78/Bip | acatggacctgttccgctcta | tggctccttgccattgaaga |
| Chop | tatctcatccccaggaaacg | gggcactgaccactctgttt |
| Xbp1s | ctgagtccgaatcaggtgcag | gtccatgggaagatgttctgg |
| Atf4 | atggccggctatggatgat | cgaagtcaaactctttcagatccatt |
| Lgr5 | caagccatgaccttggccctg | tttcccagggagtggattctatt |
| Atf6 | tgggcaggactatgaagtaatg | aggcttggccagacaacagctt |
| Cyclin D1 | ggggacaactcttaagtctcac | ccaataaaagaccaatctctc |
| Olfm4 | cagccactttccaatttcactg | gctggacatactccttcacctta |
Disclaimer/Publisher’s Note: The statements, opinions and data contained in all publications are solely those of the individual author(s) and contributor(s) and not of MDPI and/or the editor(s). MDPI and/or the editor(s) disclaim responsibility for any injury to people or property resulting from any ideas, methods, instructions or products referred to in the content. |
© 2023 by the authors. Licensee MDPI, Basel, Switzerland. This article is an open access article distributed under the terms and conditions of the Creative Commons Attribution (CC BY) license (http://creativecommons.org/licenses/by/4.0/).


