Submitted:
30 October 2023
Posted:
31 October 2023
You are already at the latest version
Abstract
Keywords:
1. Introduction
2. Materials and Methods
2.1. Antenna Design
2.2. Basic Structure of the MWI System and Measurement Scheme
2.3. MWI Approach
2.4. Numerical Green’s Function
2.5. Measurement Setup
2.6. Measurement Procedure
- OUT with the inclusion inside.
- OUT without inclusion.
3. Results and Discussion
3.1. Validation of the Antenna Design
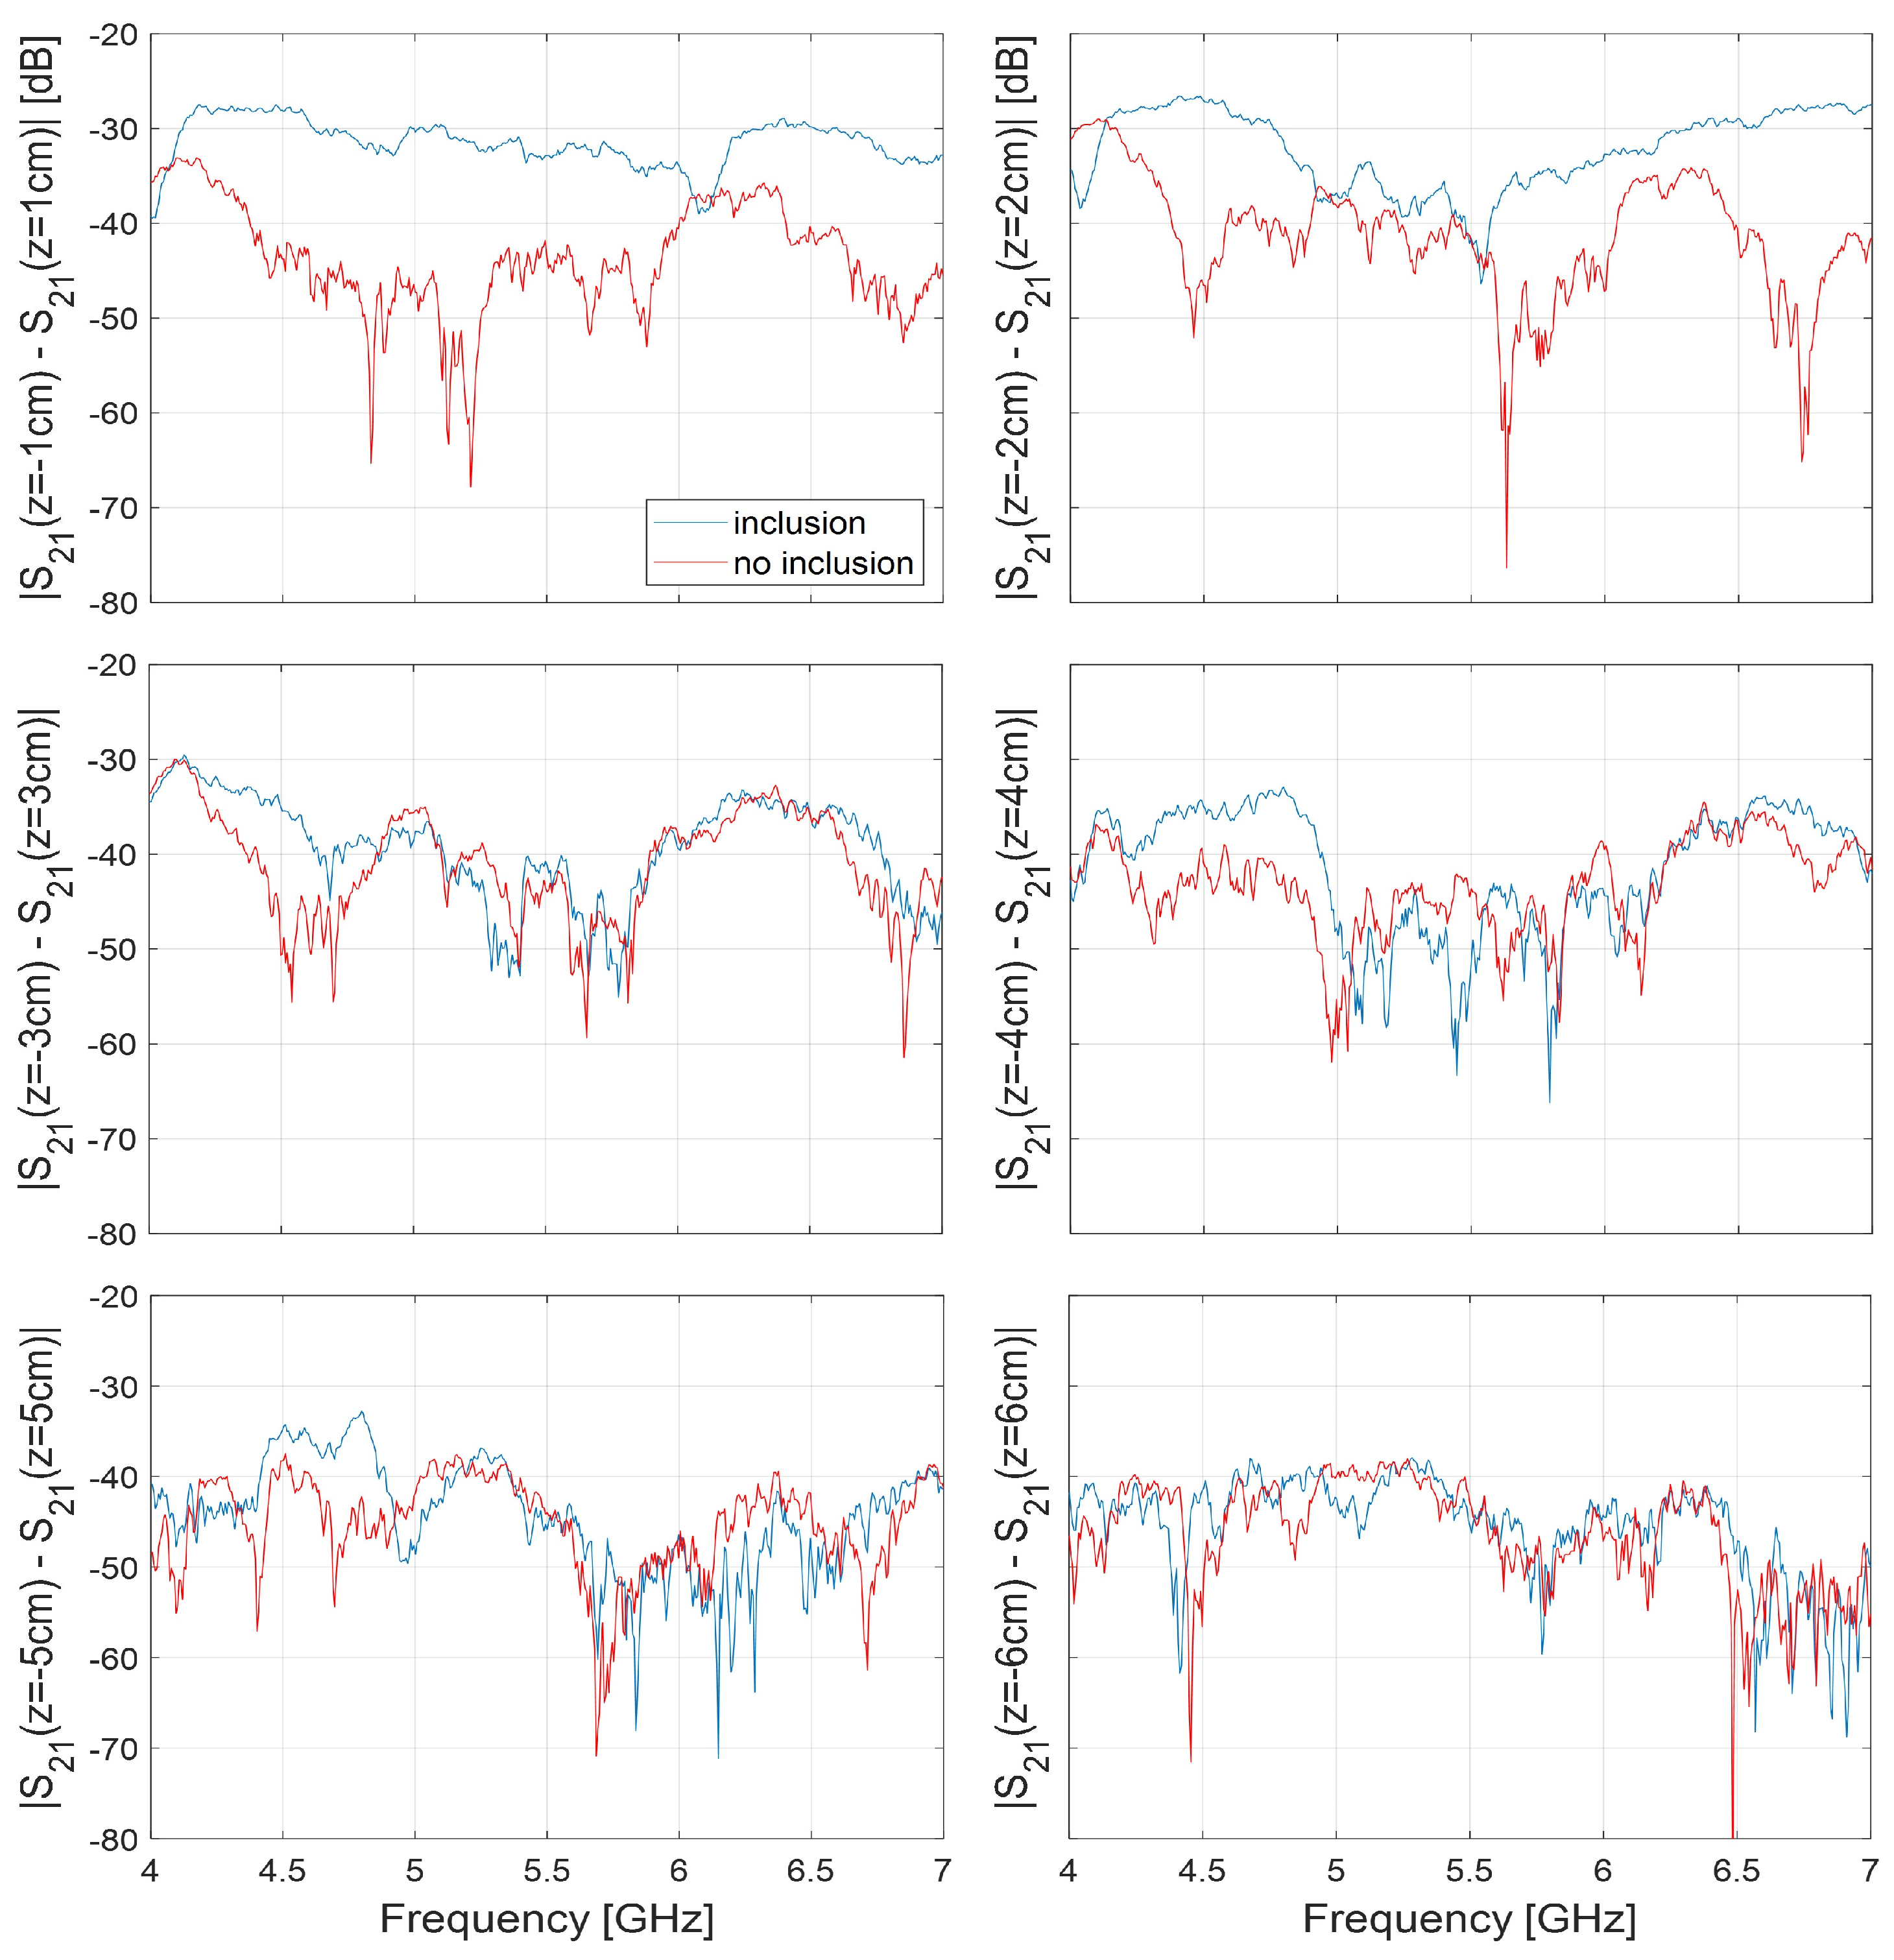
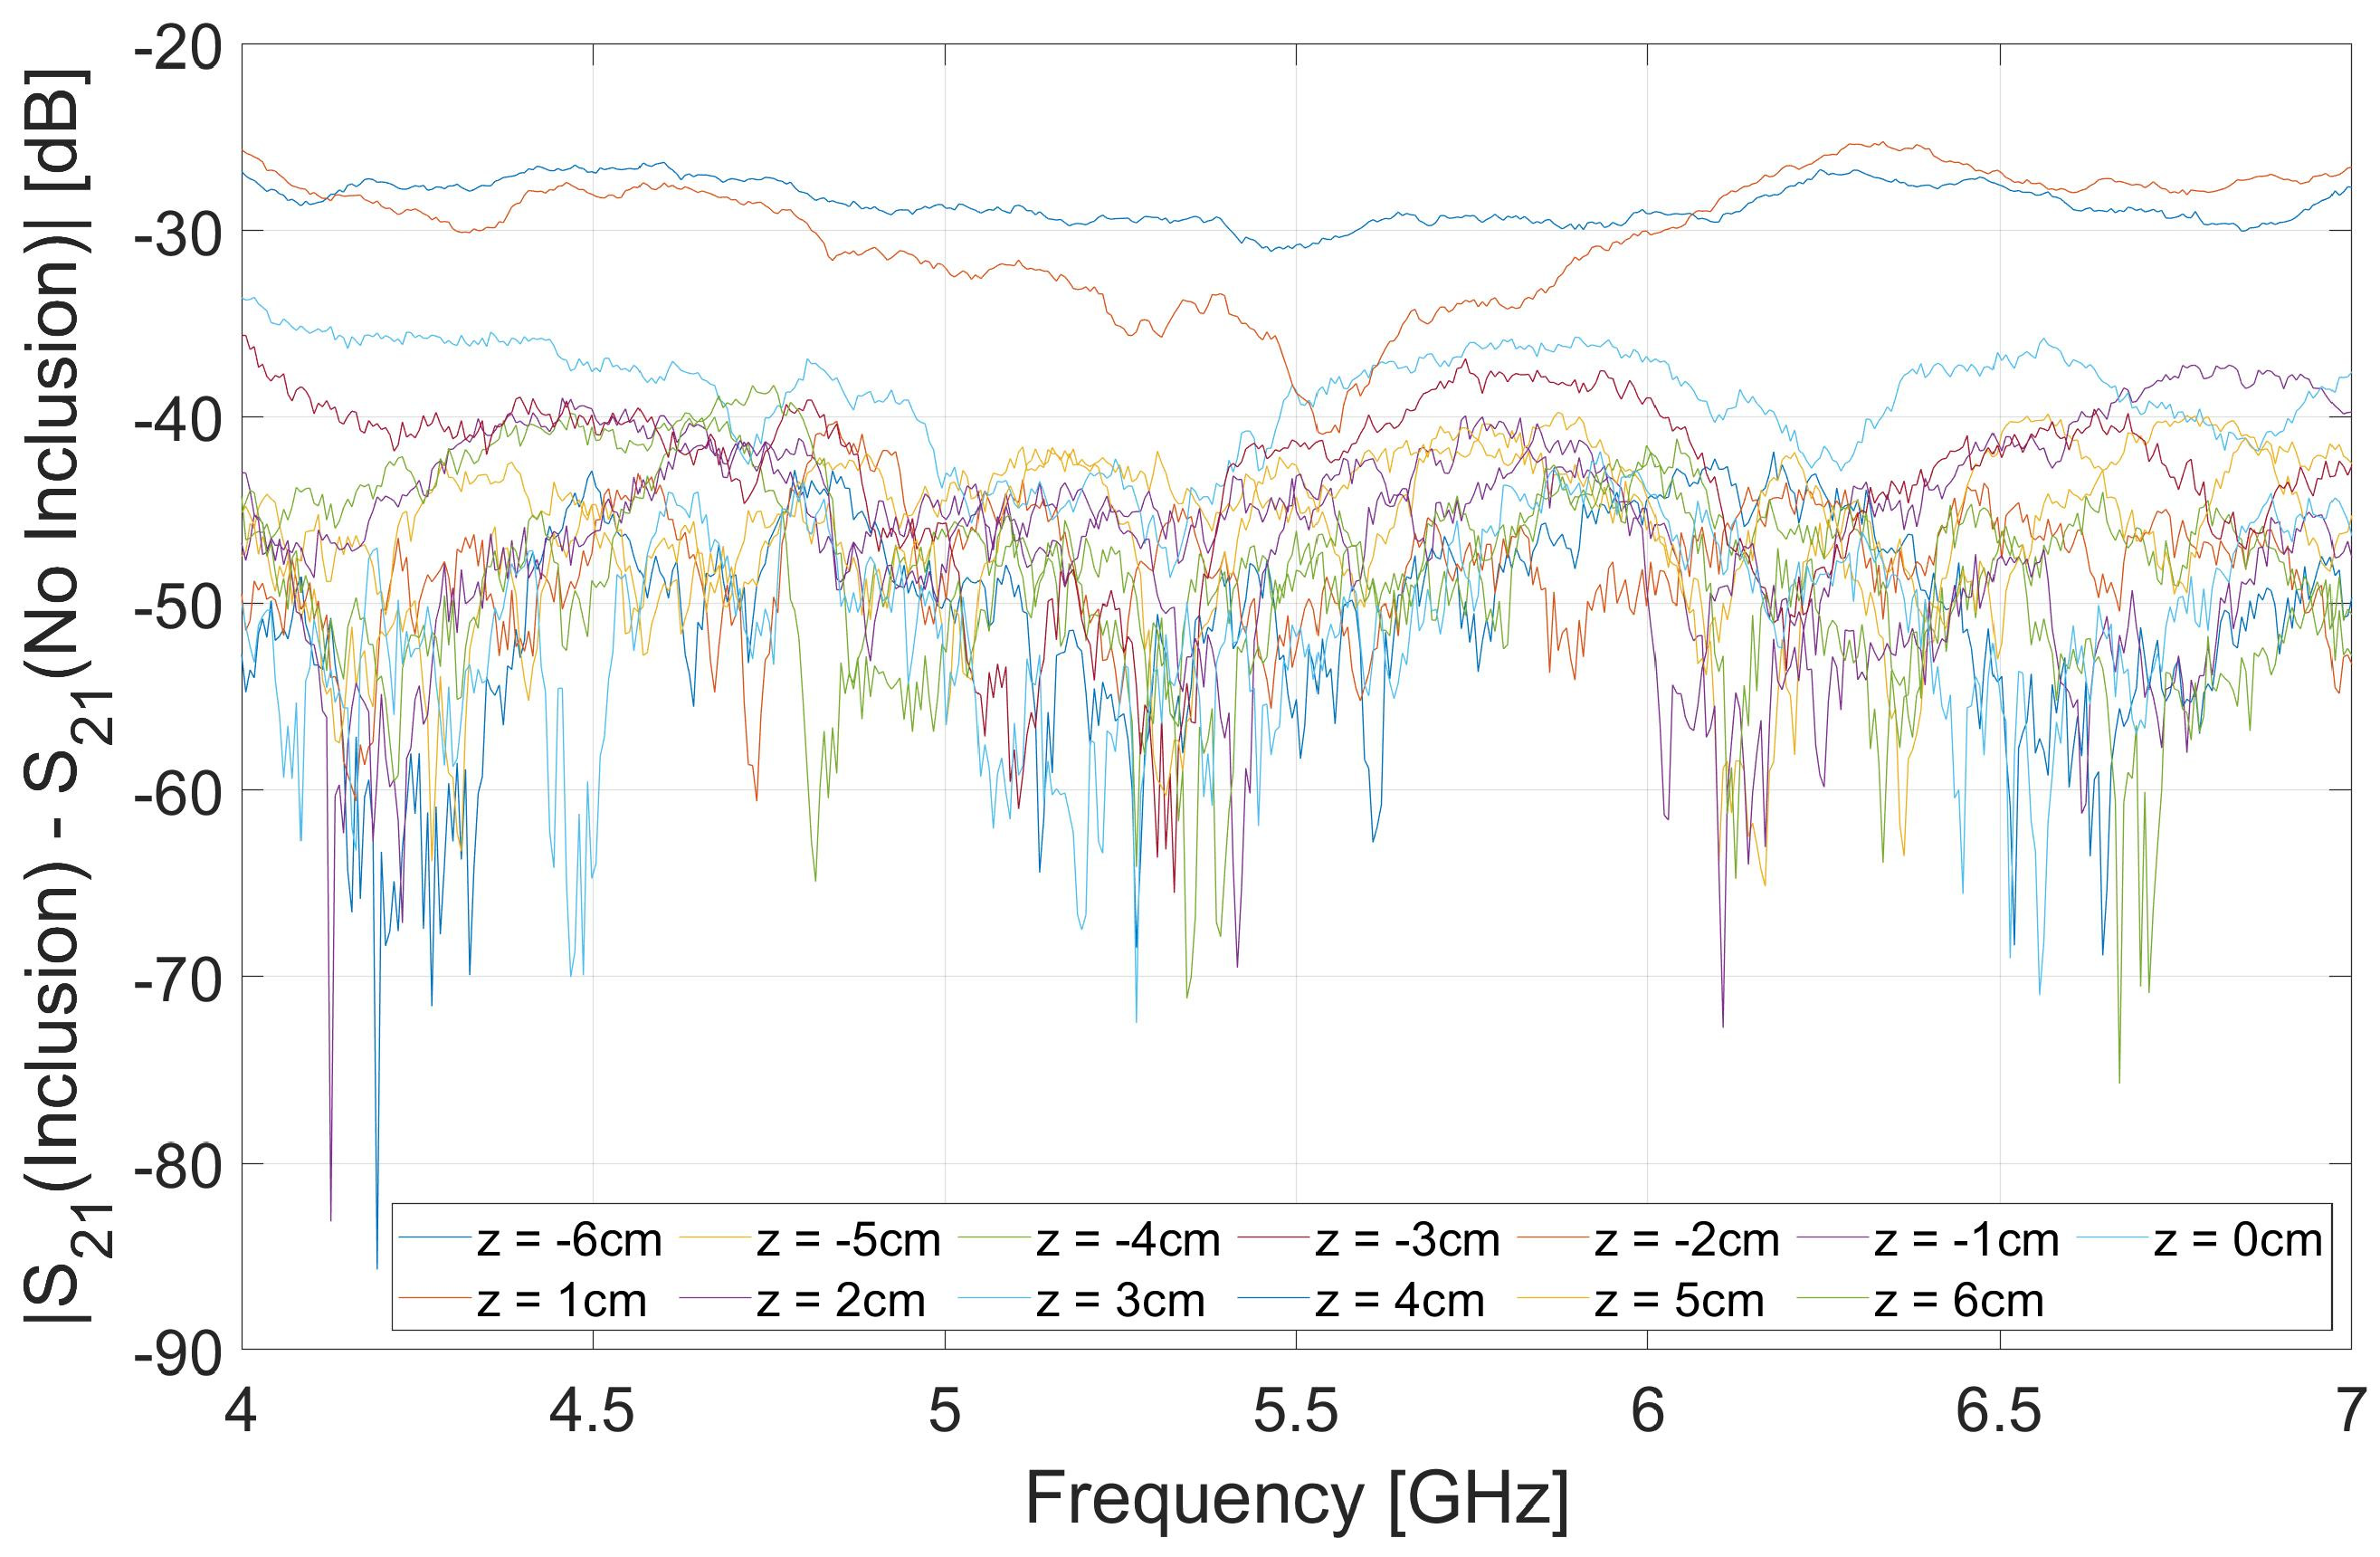
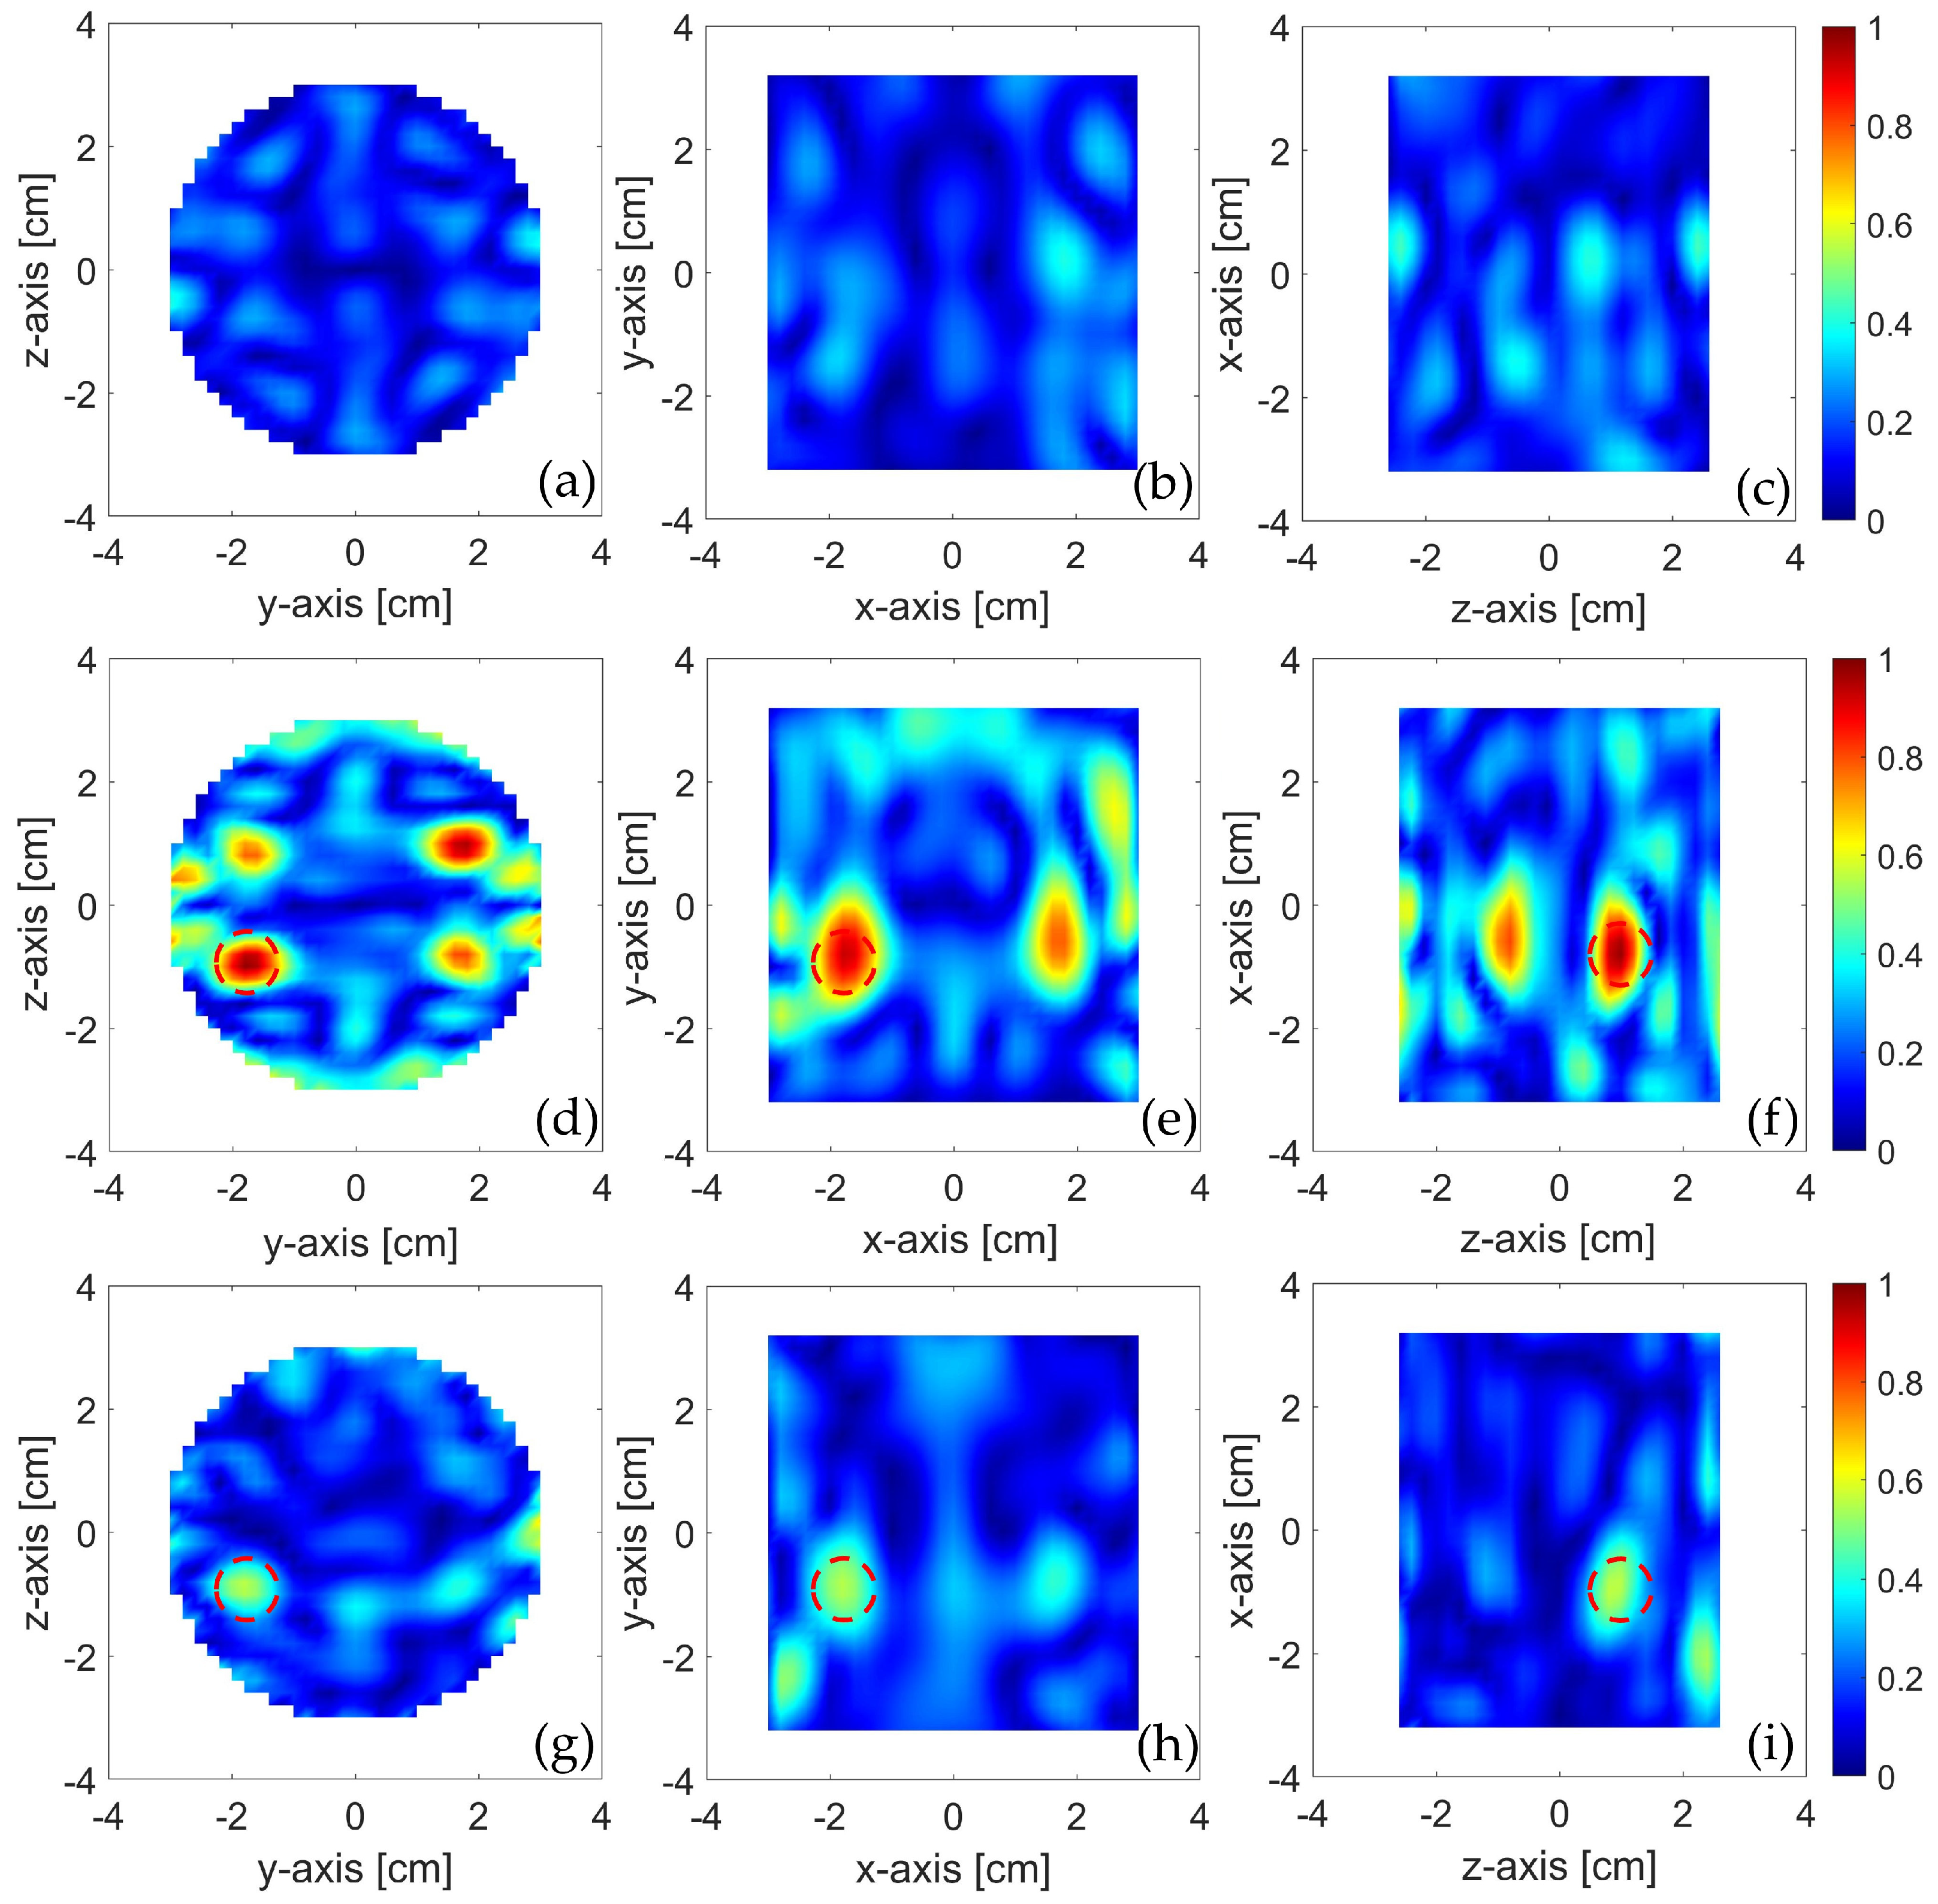
3.2. Assessment of the SB Approach
4. Conclusions
Author Contributions
Funding
Institutional Review Board Statement
Informed Consent Statement
Data Availability Statement
Conflicts of Interest
Abbreviations
| CLAVA | Circularly Loaded Antipodal Vivaldi Antenna |
| MWI | MicroWave Imaging |
| OUT | Object Under Test |
| OSP | Orthogonal Symmetry Plane |
| PSP | Parallel Symmetry Plane |
| RB | Reference-Based |
| SB | Symmetry-Based |
| UWB | Ultrawideband |
| VNA | Vector Network Analyzer |
References
- Lau, O.W.; Wong, S.K. Contamination in food from packaging material. J. Chromatogr. A 2000, 882, 255–270. [Google Scholar] [CrossRef] [PubMed]
- Nerín, C.; Aznar, M.; Carrizo, D. Food contamination during food process. Trends in food science & technology. 2016, 48, 63–68. [Google Scholar]
- Porep, J. U.; Kammerer; D. R.; Carle, R. On-line application of near infrared (NIR) spectroscopy in food production. Trends in Food Science & Technology 2015, 46, 211–230.
- Haff, R.P.; Toyofuku, N. X-ray detection of defects and contaminants in the food industry. Sens. Instrum. Food Qual. Saf. 2008, 2, 262–273. [Google Scholar] [CrossRef]
- Bick, M.; Sullivan, P.; Tilbrook, D. L.; Du, J.; Gnanarajan, S.; Leslie, K. E.; Foley, C. P. A SQUID-based metal detector—comparison to coil and X-ray systems. Superconductor Science and Technology. 2015, 18, 346. [Google Scholar] [CrossRef]
- Edwards, M. (Ed.). Detecting foreign bodies in food. Elsevier. 2004.
- Nikolova, N.K. Introduction to Microwave Imaging, 1st ed.; Cambridge University Press: Cambridge, UK, 2017. [Google Scholar]
- Wu Z.; Wang. H. Microwave tomography for industrial process imaging: Example applications and experimental results. IEEE Antennas Propag. Mag. 2017, 59, 61–71. [CrossRef]
- Asefi, M.; Jeffrey, I.; LoVetri, J.; Gilmore, C.; Card, P.; Paliwal, J. Grain bin monitoring via electromagnetic imaging. Comput. Electron. Agric. 2015, 119, 133–141. [Google Scholar] [CrossRef]
- Vipiana, F.; Crocco, L.; Lo Vetri, J. Electromagnetic imaging and sensing for food quality and safety assessment. IEEE Antennas Propag. Mag. 2020, 62, 16–17. [Google Scholar] [CrossRef]
- Vasquez, J. A. T.; Scapaticci, R.; Turvani, G.; Ricci, M.; Farina, L.; Litman, A.; Vipiana, F. Noninvasive inline food inspection via microwave imaging technology: An application example in the food industry. IEEE Antennas and Propagation Magazine. 2020, 62, 18–32. [Google Scholar] [CrossRef]
- Farina, L.; Scapaticci, R.; Vasquez, J. T.; Rivero, J.; Litman, A.; Crocco, L., Vipiana, F. (2019, July). Microwave imaging technology for in-line food contamination monitoring. In 2019 IEEE International Symposium on Antennas and Propagation and USNC-URSI Radio Science Meeting (pp. 817-818). IEEE.
- Augustin, G.; Denidni, T.A. Ultrawideband Antennas for Microwave Imaging Systems, 1st ed.; Artech House: London, UK, 2014. [Google Scholar]
- Zeni, N.; Bellizzi, G.; Crocco, L.; Cavagnaro, M. (2023, March). A Compact Antipodal Vivaldi Antenna for Food Investigation. In 2023 17th European Conference on Antennas and Propagation (EuCAP) (pp. 1-4). IEEE.
- Farina, L.; Scapaticci, R.; Vasquez, J. T.; Rivero, J.; Litman, A.; Vipiana, F. (2019, March). A feasibility study of a microwave imaging device for in-line food contamination monitoring. In 2019 13th European Conference on Antennas and Propagation (EuCAP) (pp. 1-2). IEEE.
- Ricci, M.; Vasquez, J.A.T.; Scapaticci, R.; Crocco, L.; Vipiana, F. Multi-antenna system for in-line food imaging at microwave frequencies. IEEE Trans. Antennas Propag. 2022, 78, 7094–7105. [Google Scholar] [CrossRef]
- Darwish A.; Ricci M.; Zidane F.; Vasquez JAT.; Casu MR.; Lanteri J.; Migliaccio C.; Vipiana F. Physical Contamination Detection in Food Industry Using Microwave and Machine Learning. Electronics 2022, 11, 3115. [CrossRef]
- Zeni, N.; Crocco, L.; Cavagnaro, M.; Bellizzi, G. A Simple Differential Microwave Imaging Approach for In-Line Inspection of Food Products. Sensors. 2023, 23, 779. [Google Scholar] [CrossRef]
- Bellizzi, G.; Crocco, L.; Cavagnaro M.; Ricci, M.; Vasquez, J. T.; Vipiana, F. (2022, March). A Simple Imaging Strategy for In-Line food Inspection via Microwave Imaging. In 2022 16th European Conference on Antennas and Propagation (EuCAP) (pp. 1-4). IEEE.
- Tayebi, M.; Dastranj, A. A.; Alighanbari, A. (2019, April). Ultra Wide Band Antipodal Vivaldi Antenna with Tapered Triangular Corrugated Edges. In 2019 27th Iranian Conference on Electrical Engineering (ICEE) (pp. 1637-1642). IEEE.
- Wu, Y.; Lu, J.; Liu, Y.; Yang, H. (2012, October). Modified design of the antipodal Vivaldi antenna. In ISAPE 2012 (pp. 316-319). IEEE.
Disclaimer/Publisher’s Note: The statements, opinions and data contained in all publications are solely those of the individual author(s) and contributor(s) and not of MDPI and/or the editor(s). MDPI and/or the editor(s) disclaim responsibility for any injury to people or property resulting from any ideas, methods, instructions or products referred to in the content. |
© 2023 by the authors. Licensee MDPI, Basel, Switzerland. This article is an open access article distributed under the terms and conditions of the Creative Commons Attribution (CC BY) license (http://creativecommons.org/licenses/by/4.0/).


