Submitted:
31 October 2023
Posted:
31 October 2023
You are already at the latest version
Abstract
Keywords:
1. Introduction
2. Materials and Methods
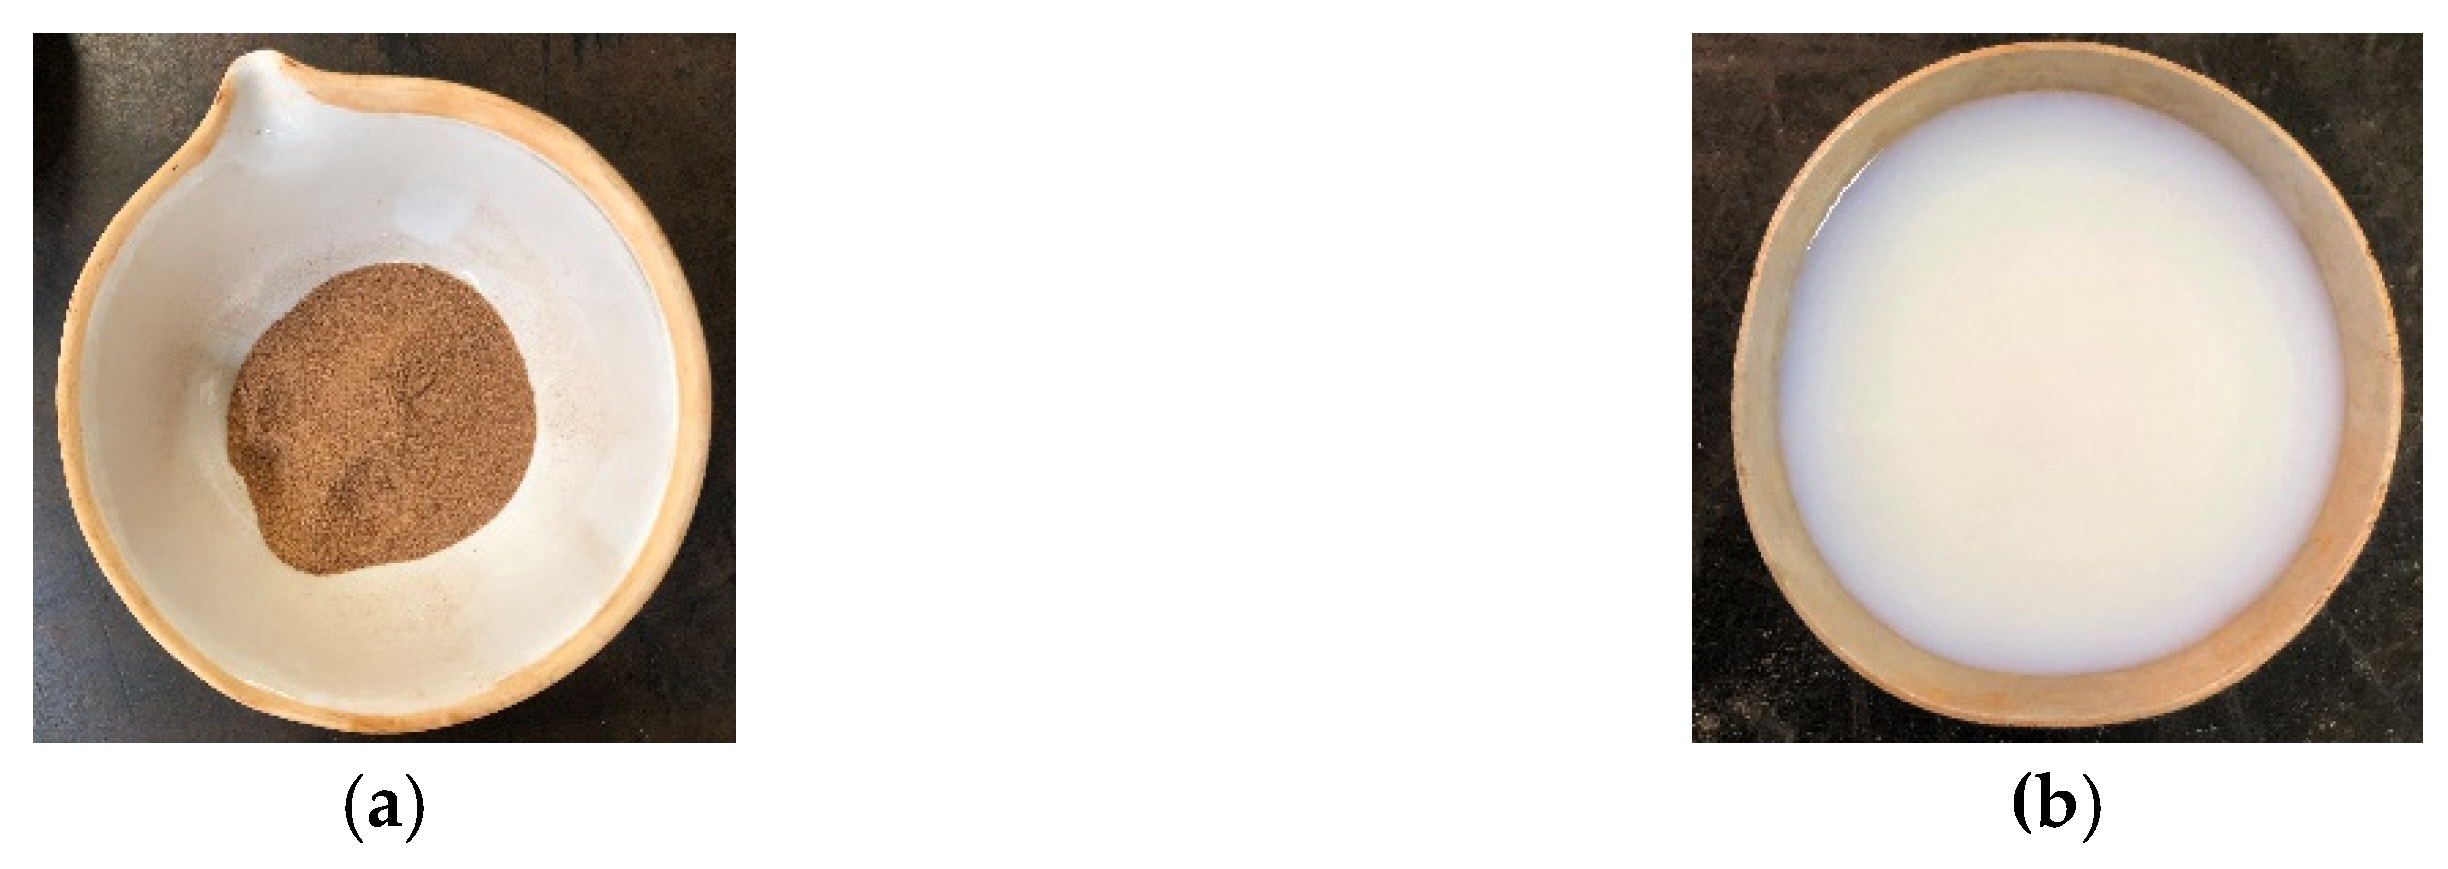
2.1. Soil and Composites 2,5% e 5%
2.2. Proctor Compaction Tests
2.3. Direct Shear Test
2.4. Mineralogical Characterization
3. Results and analysis
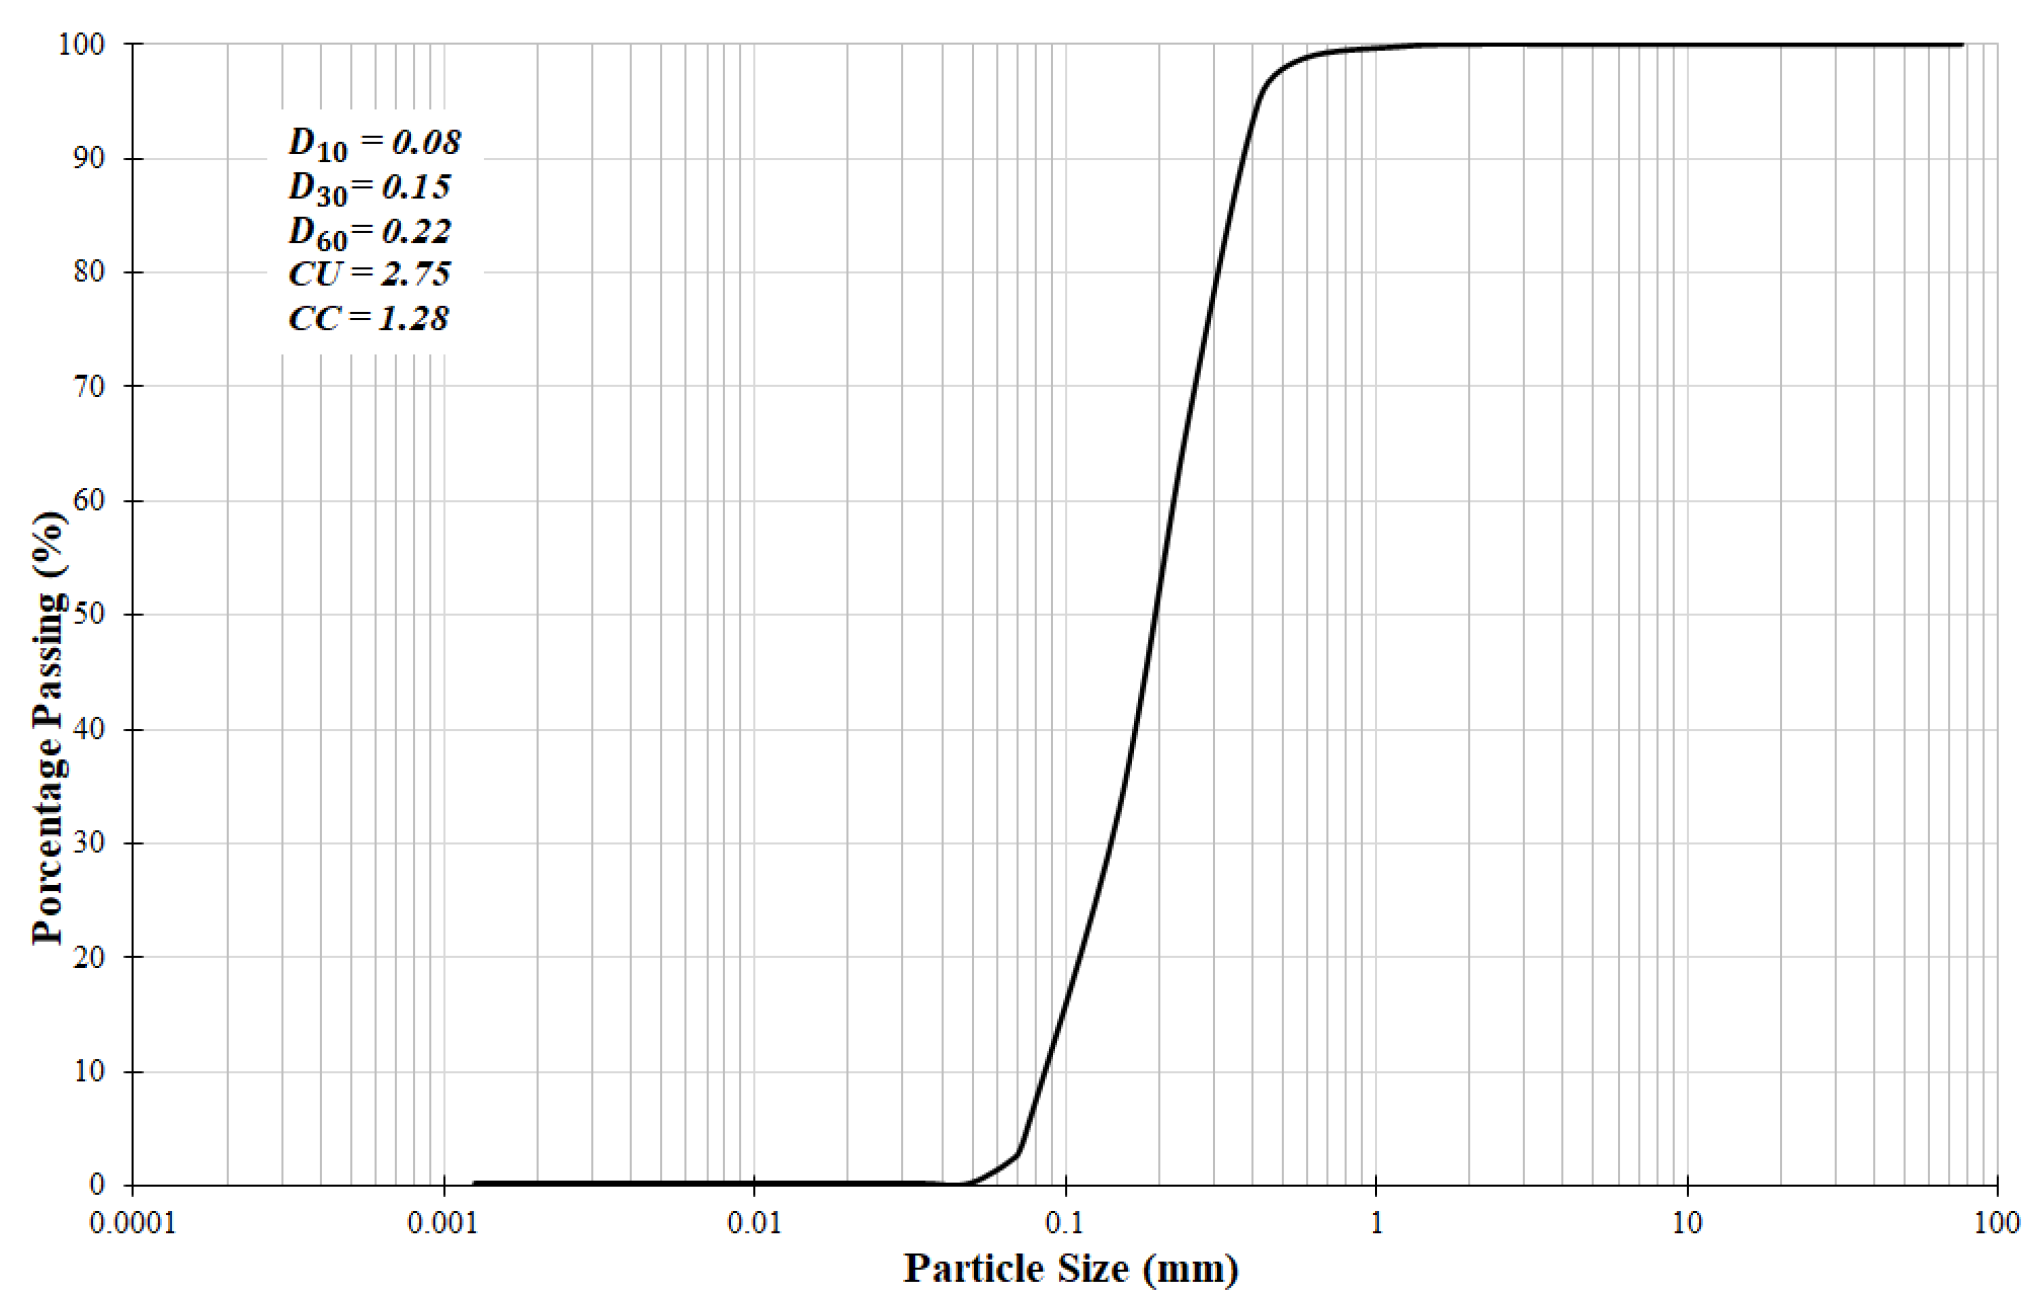
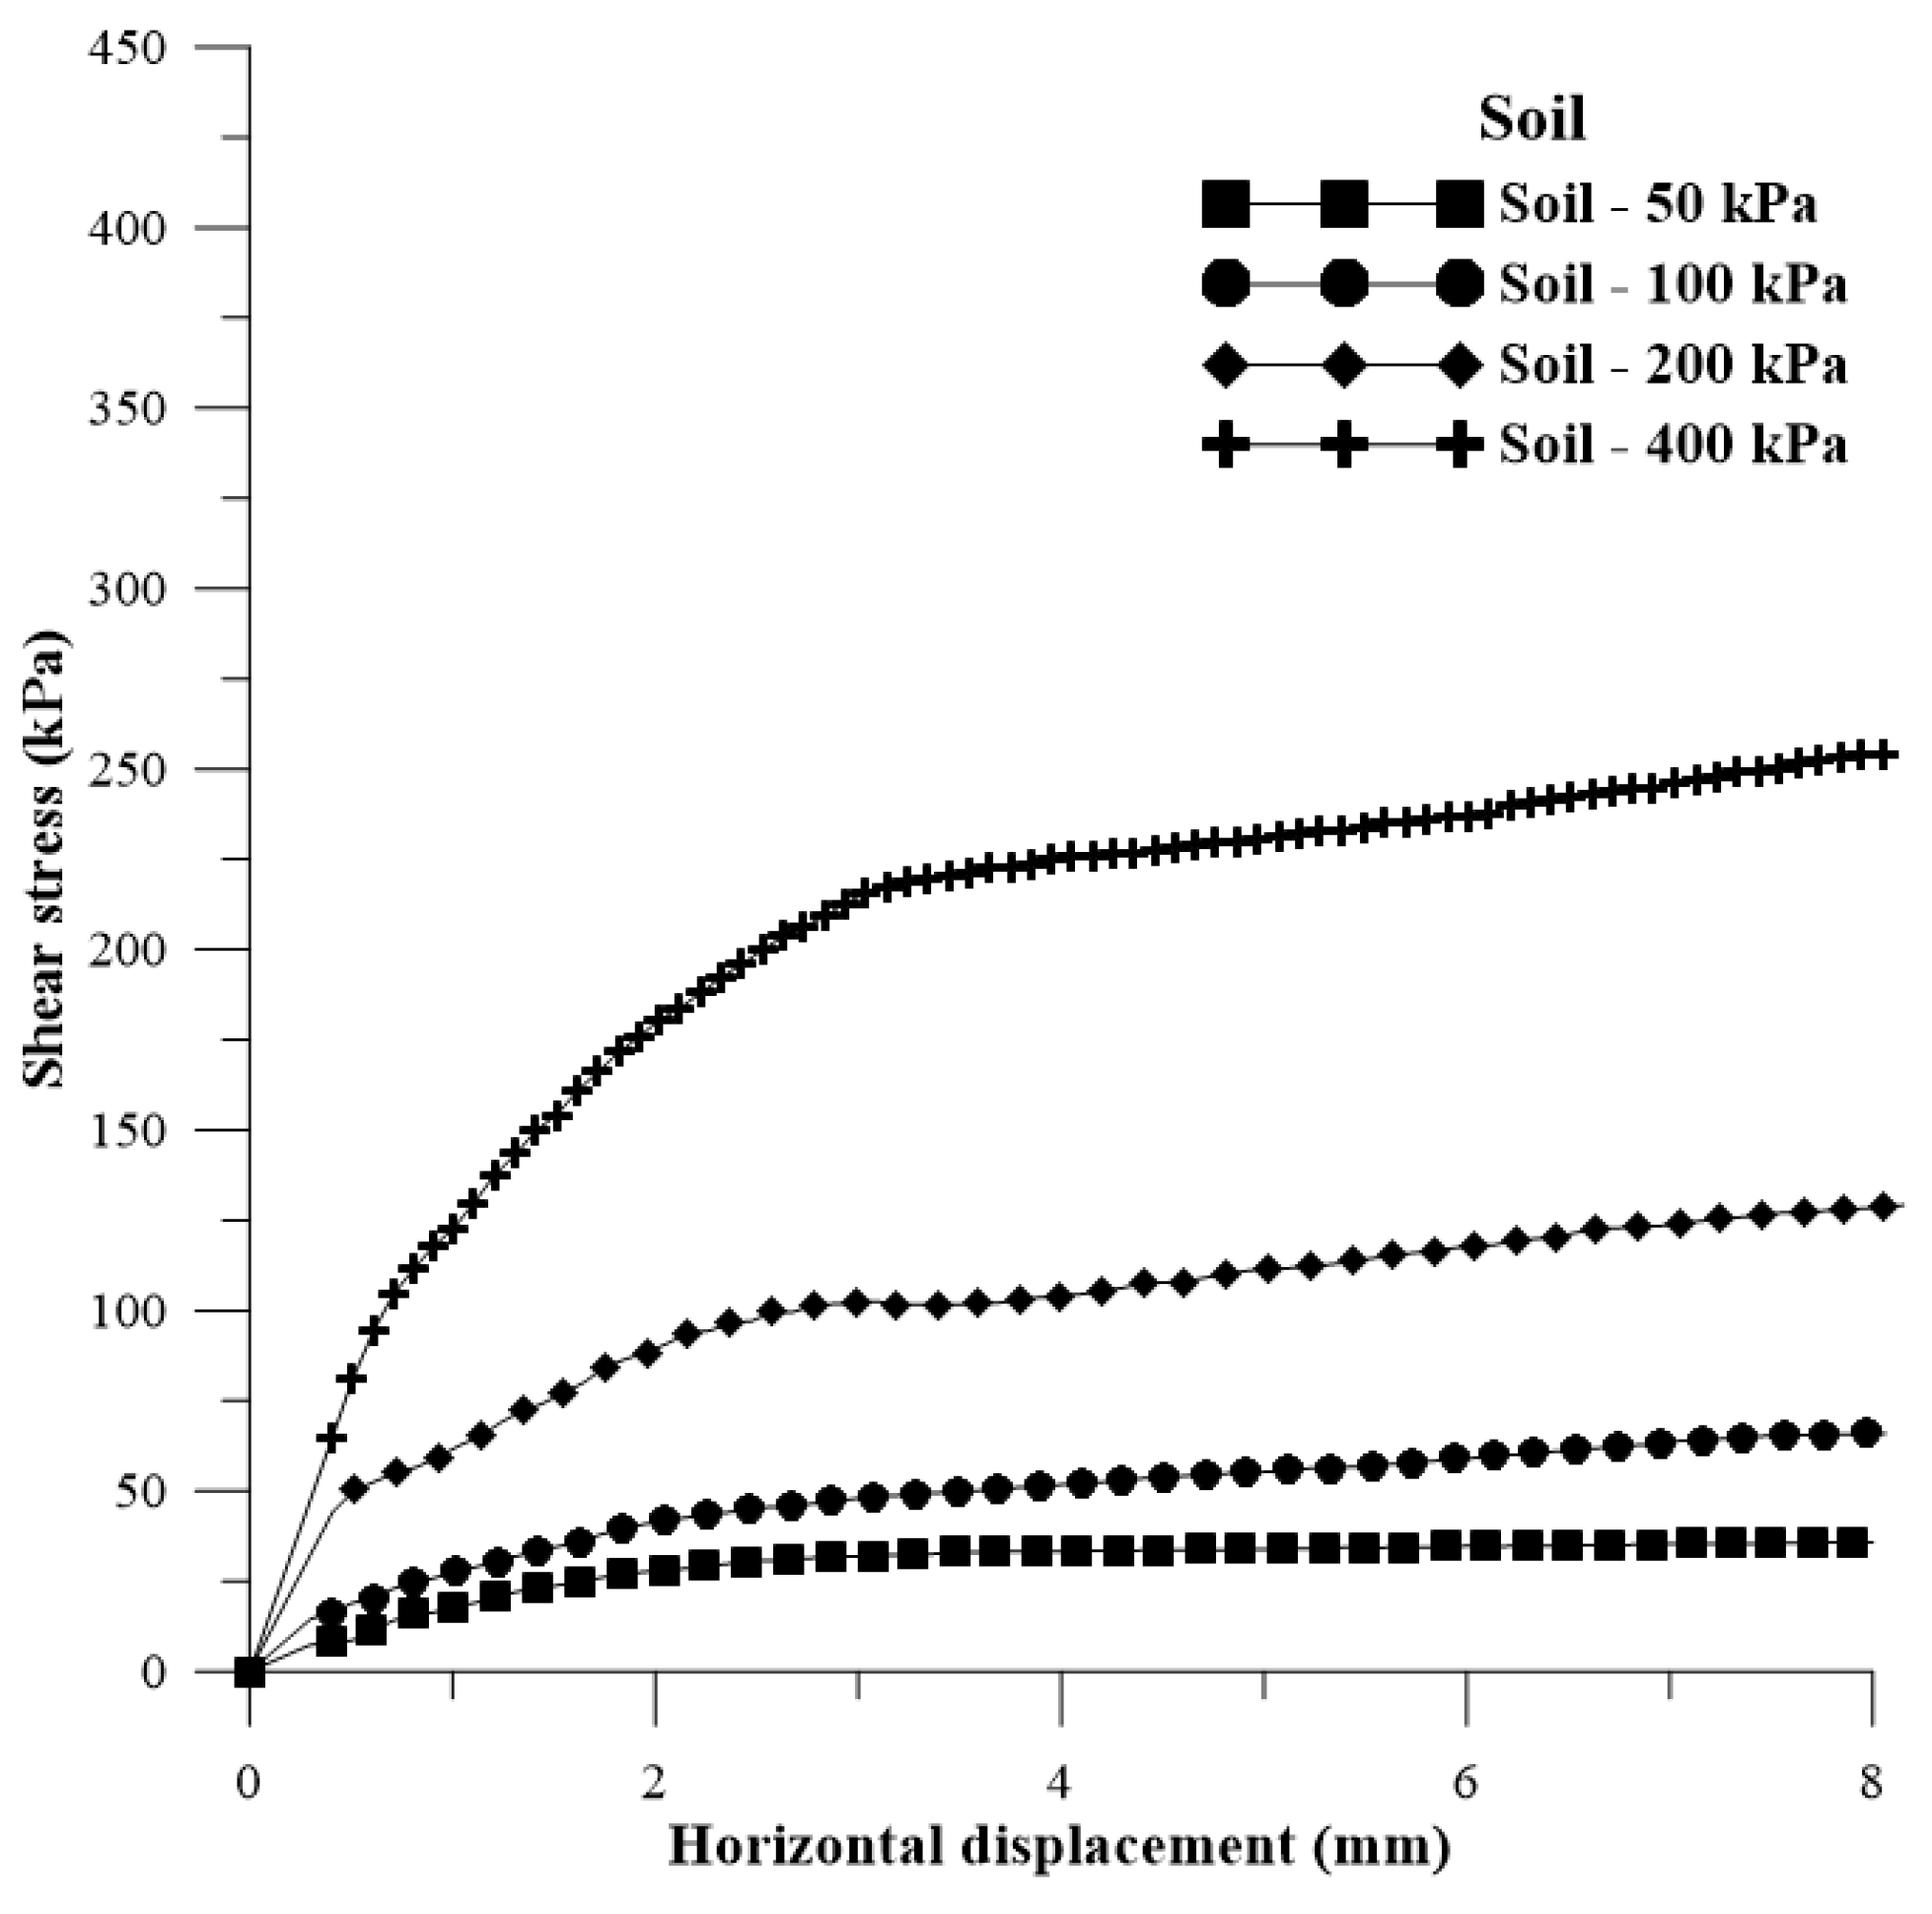
3.1. Soil
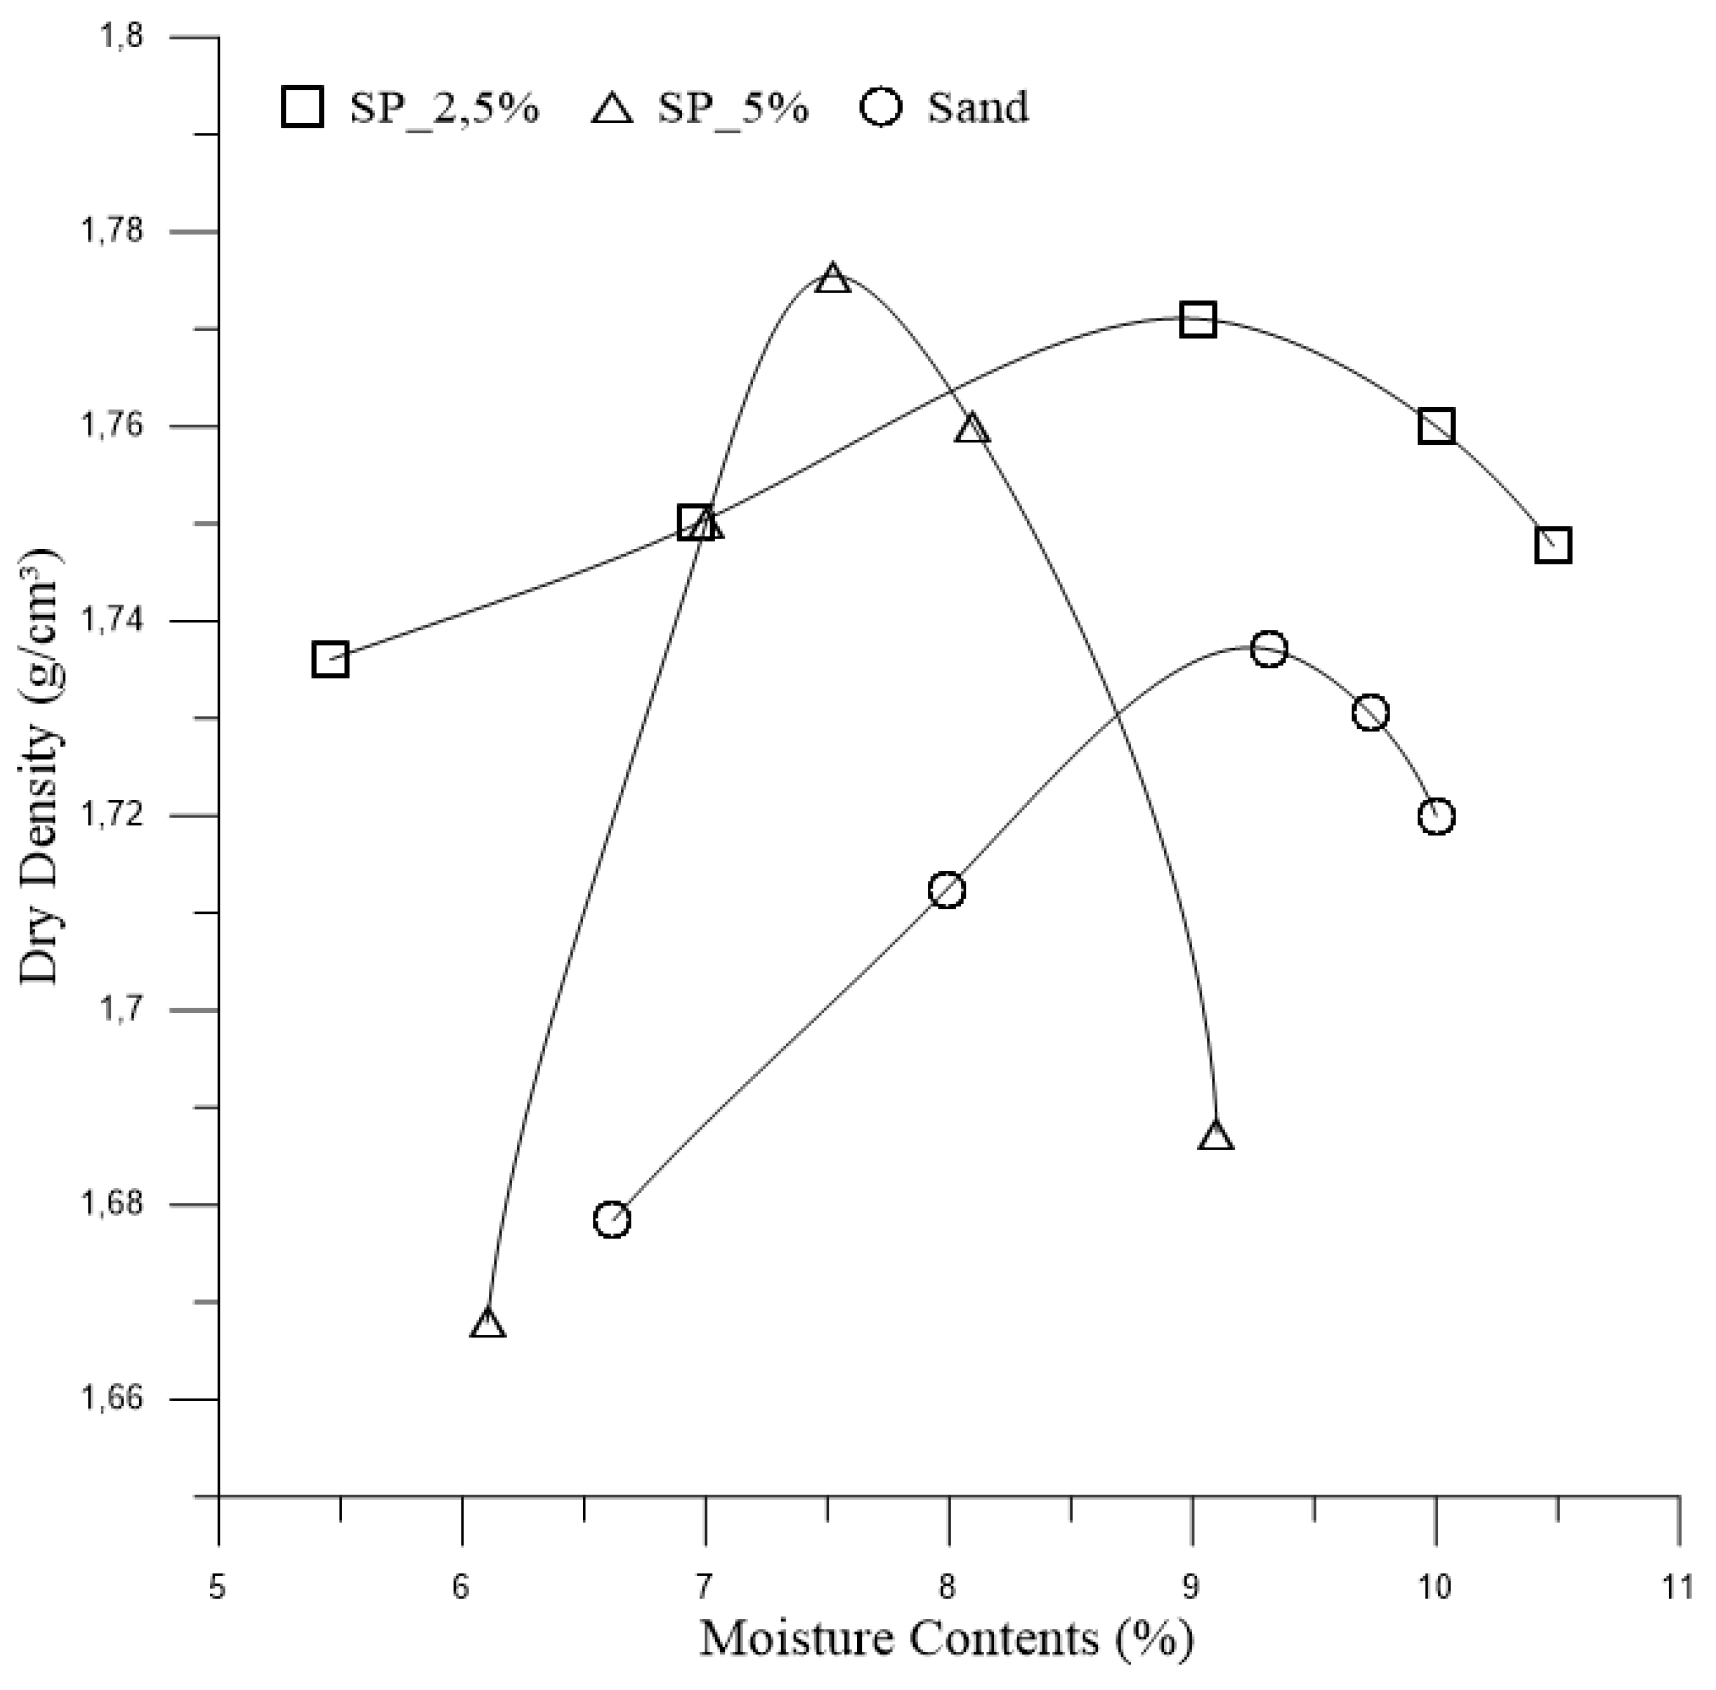
3.2. Proctor Compaction Tests
3.3. 2.5% polymer composite
3.2. 5% polymer composite
3.3. Mineralogical Characterization
3.3.1. X-ray diffraction (XRD) and X-ray fluorescence spectrometry (XRF/EDX) tests
4. Conclusions
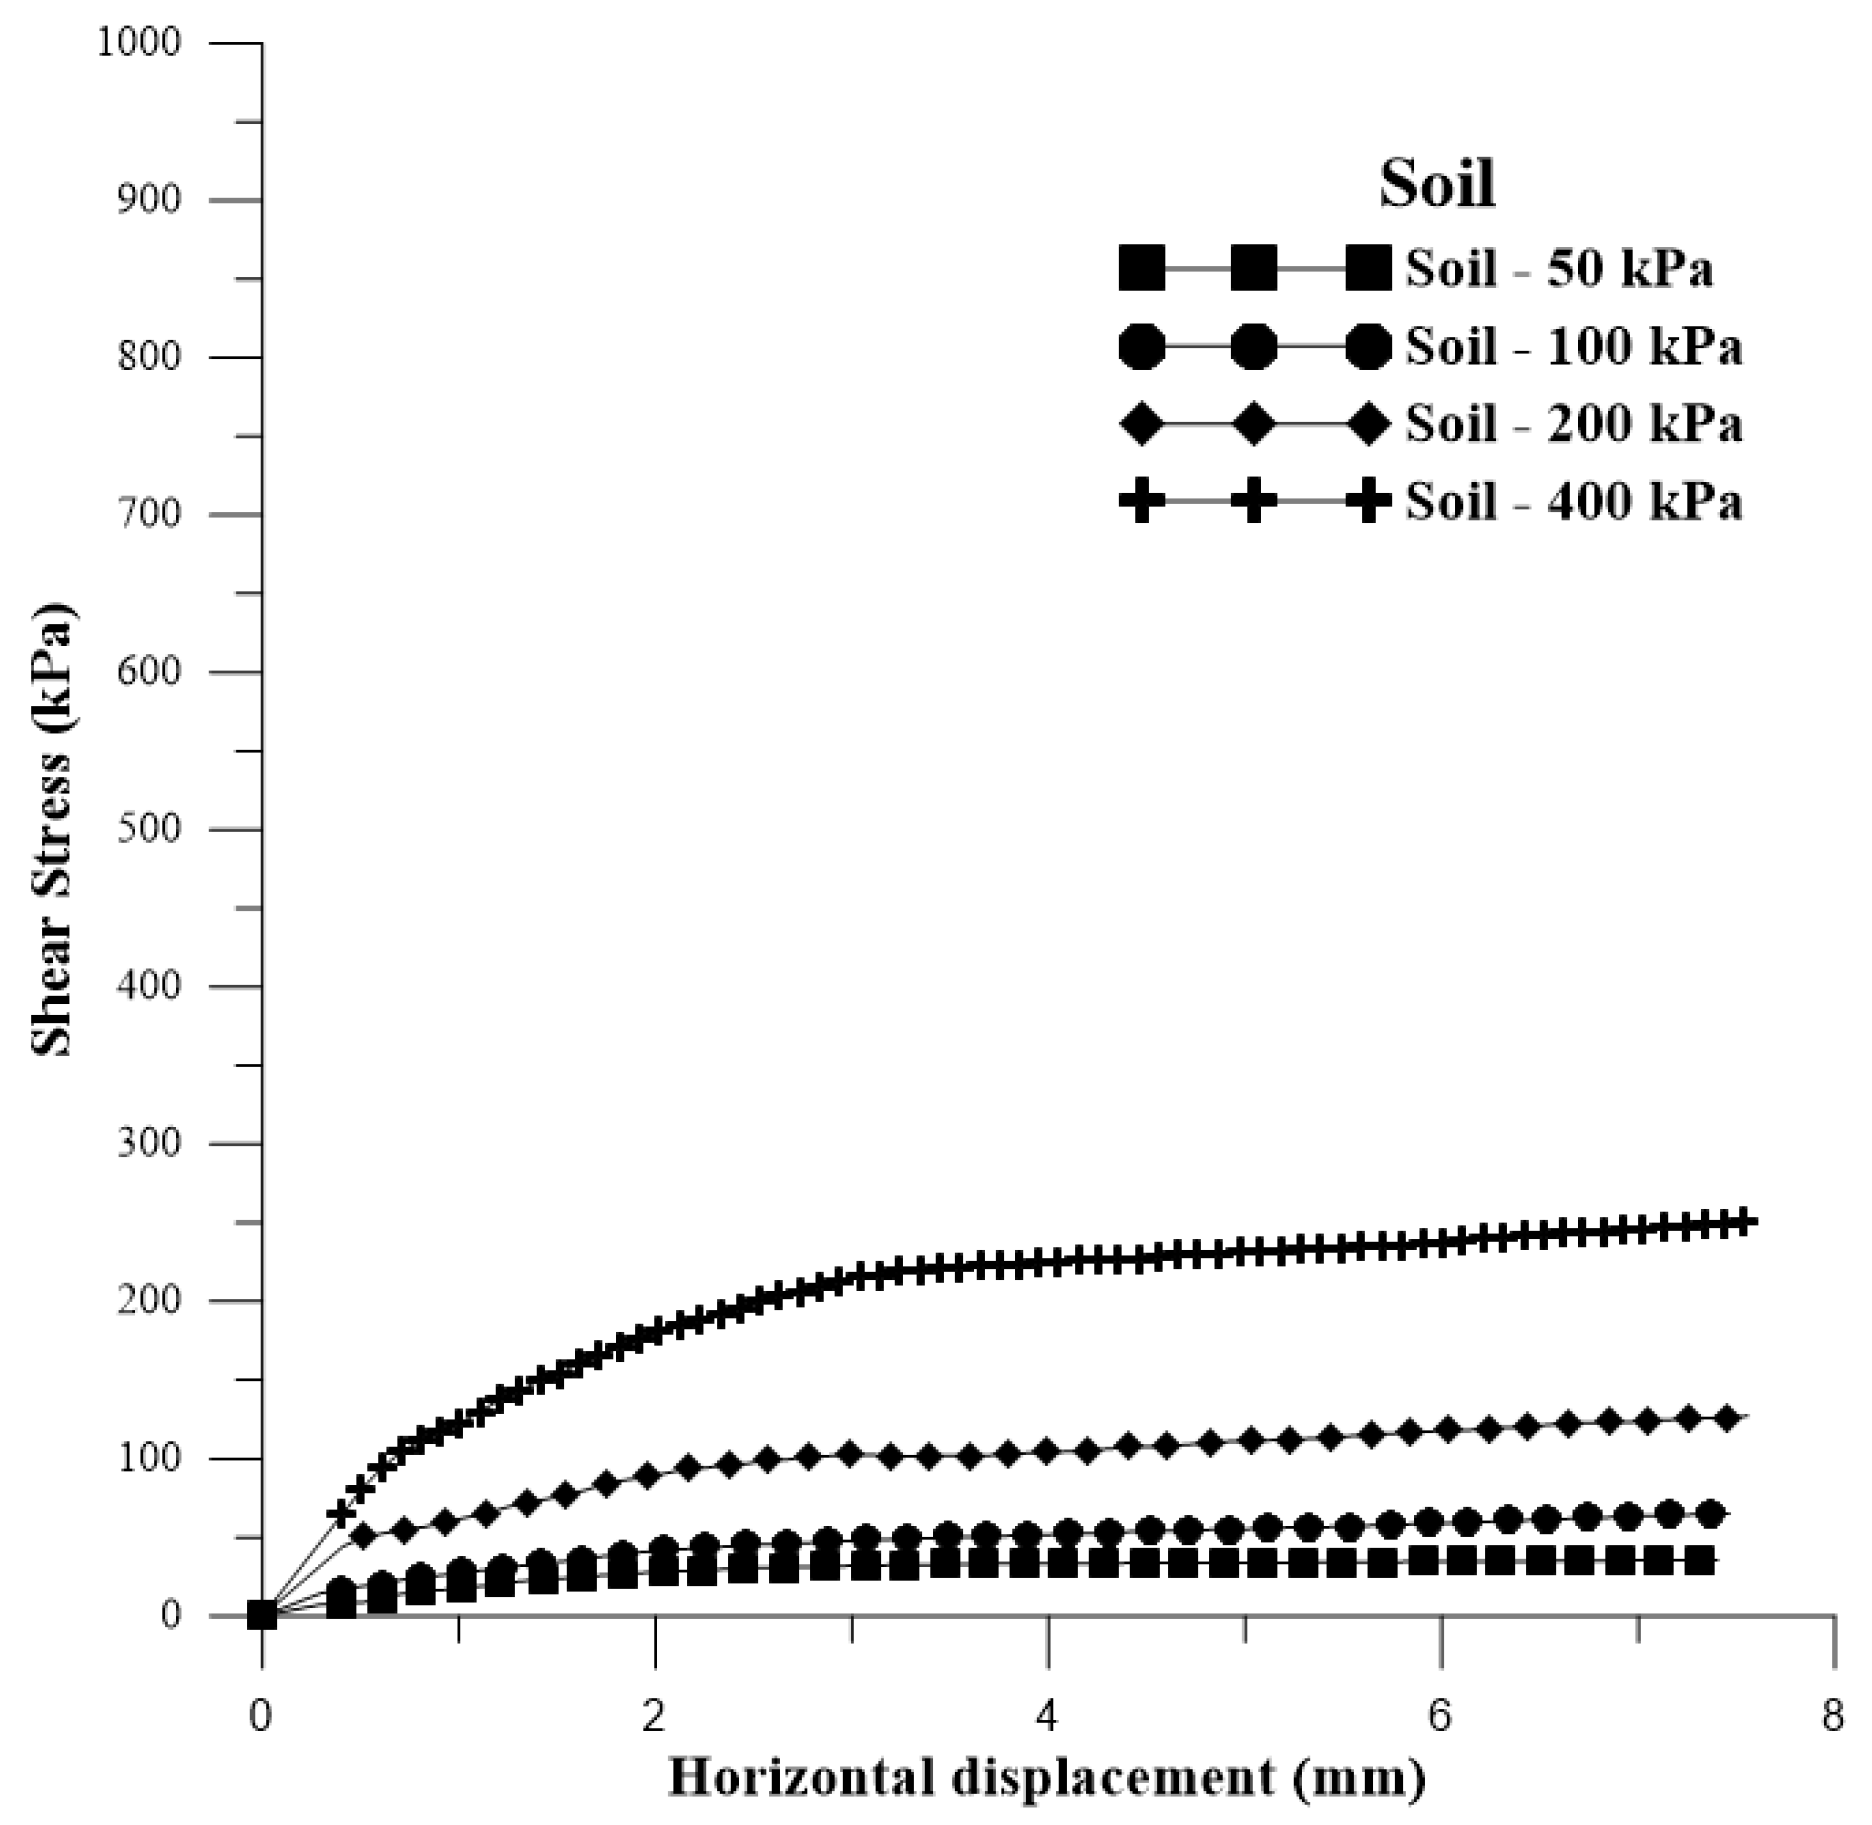
- The studied soil comes from an environmentally protected area where large-scale construction is restricted, making access to the region challenging. The soil is sandy, classified as A-3 by HRB classification, non-plastic (NP), and SP by SUCS classification. Based on these characteristics and microstructural analysis, it can be affirmed that it is a soil without natural cementing elements, exhibiting granular soil behavior.
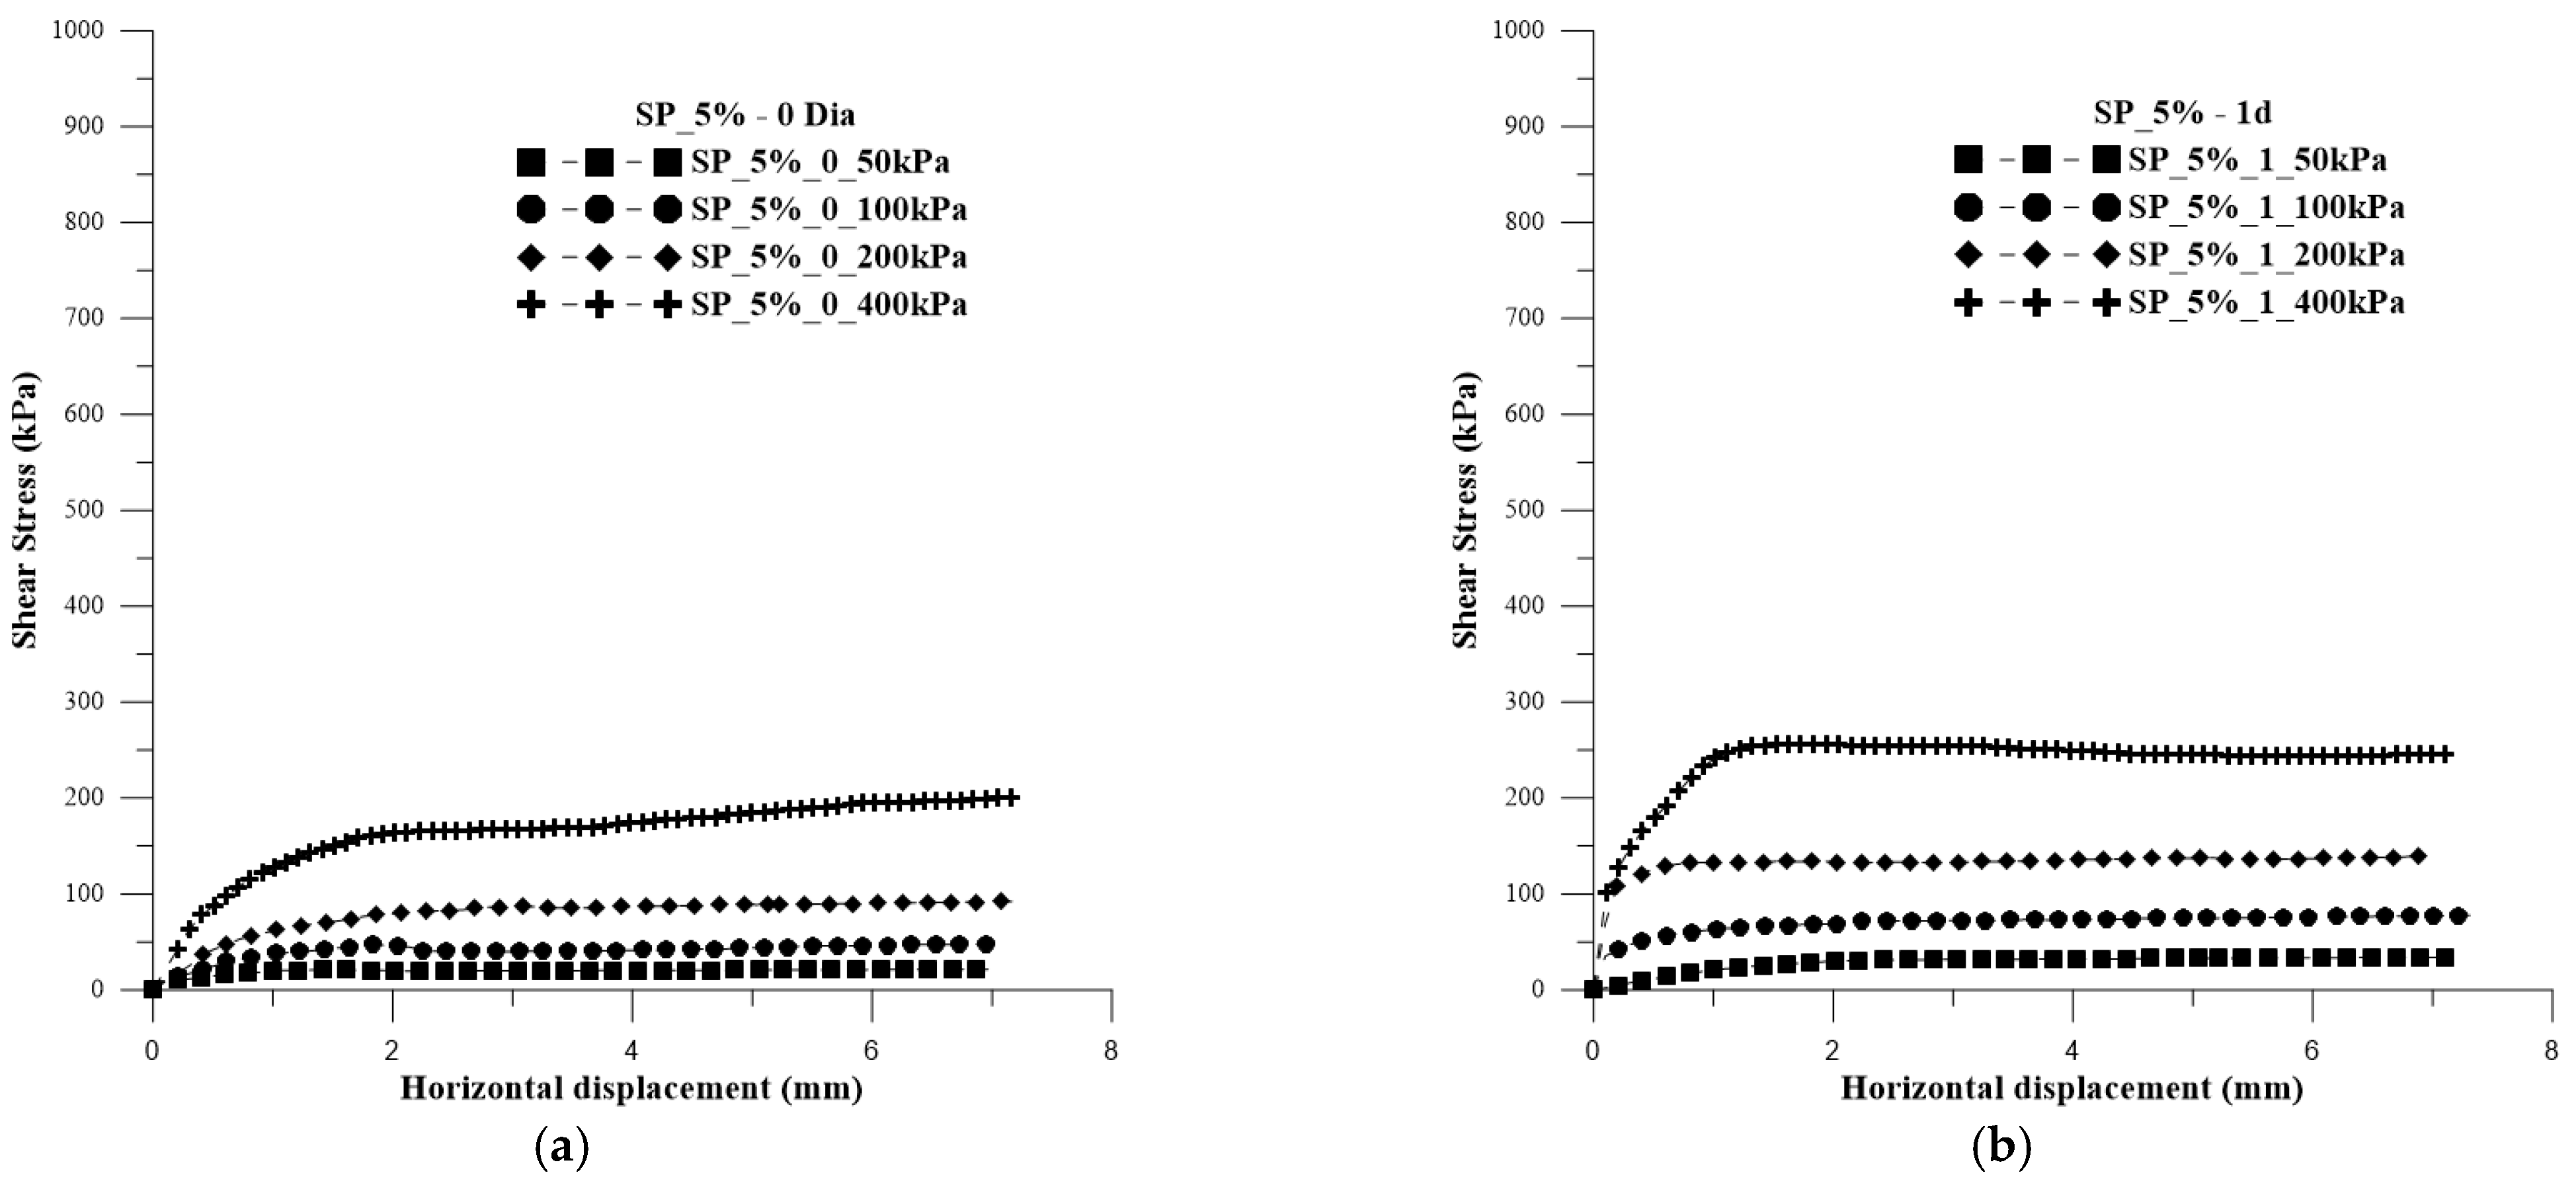
- Overall, the addition of polymer to the studied soil was positive for all the studied applications. The addition of the polymer solution to the soil, in two concentrations of 2.5% and 5%, provided gains in cementation and cohesion to the substrate.
- The compaction results showed a change in the behavior of the curves with the polymer insertion in both concentrations, along with an increase in dry density, but a slight reduction in the optimum moisture content. However, working with a polymer solution leads to a reduction in the total amount of added water.
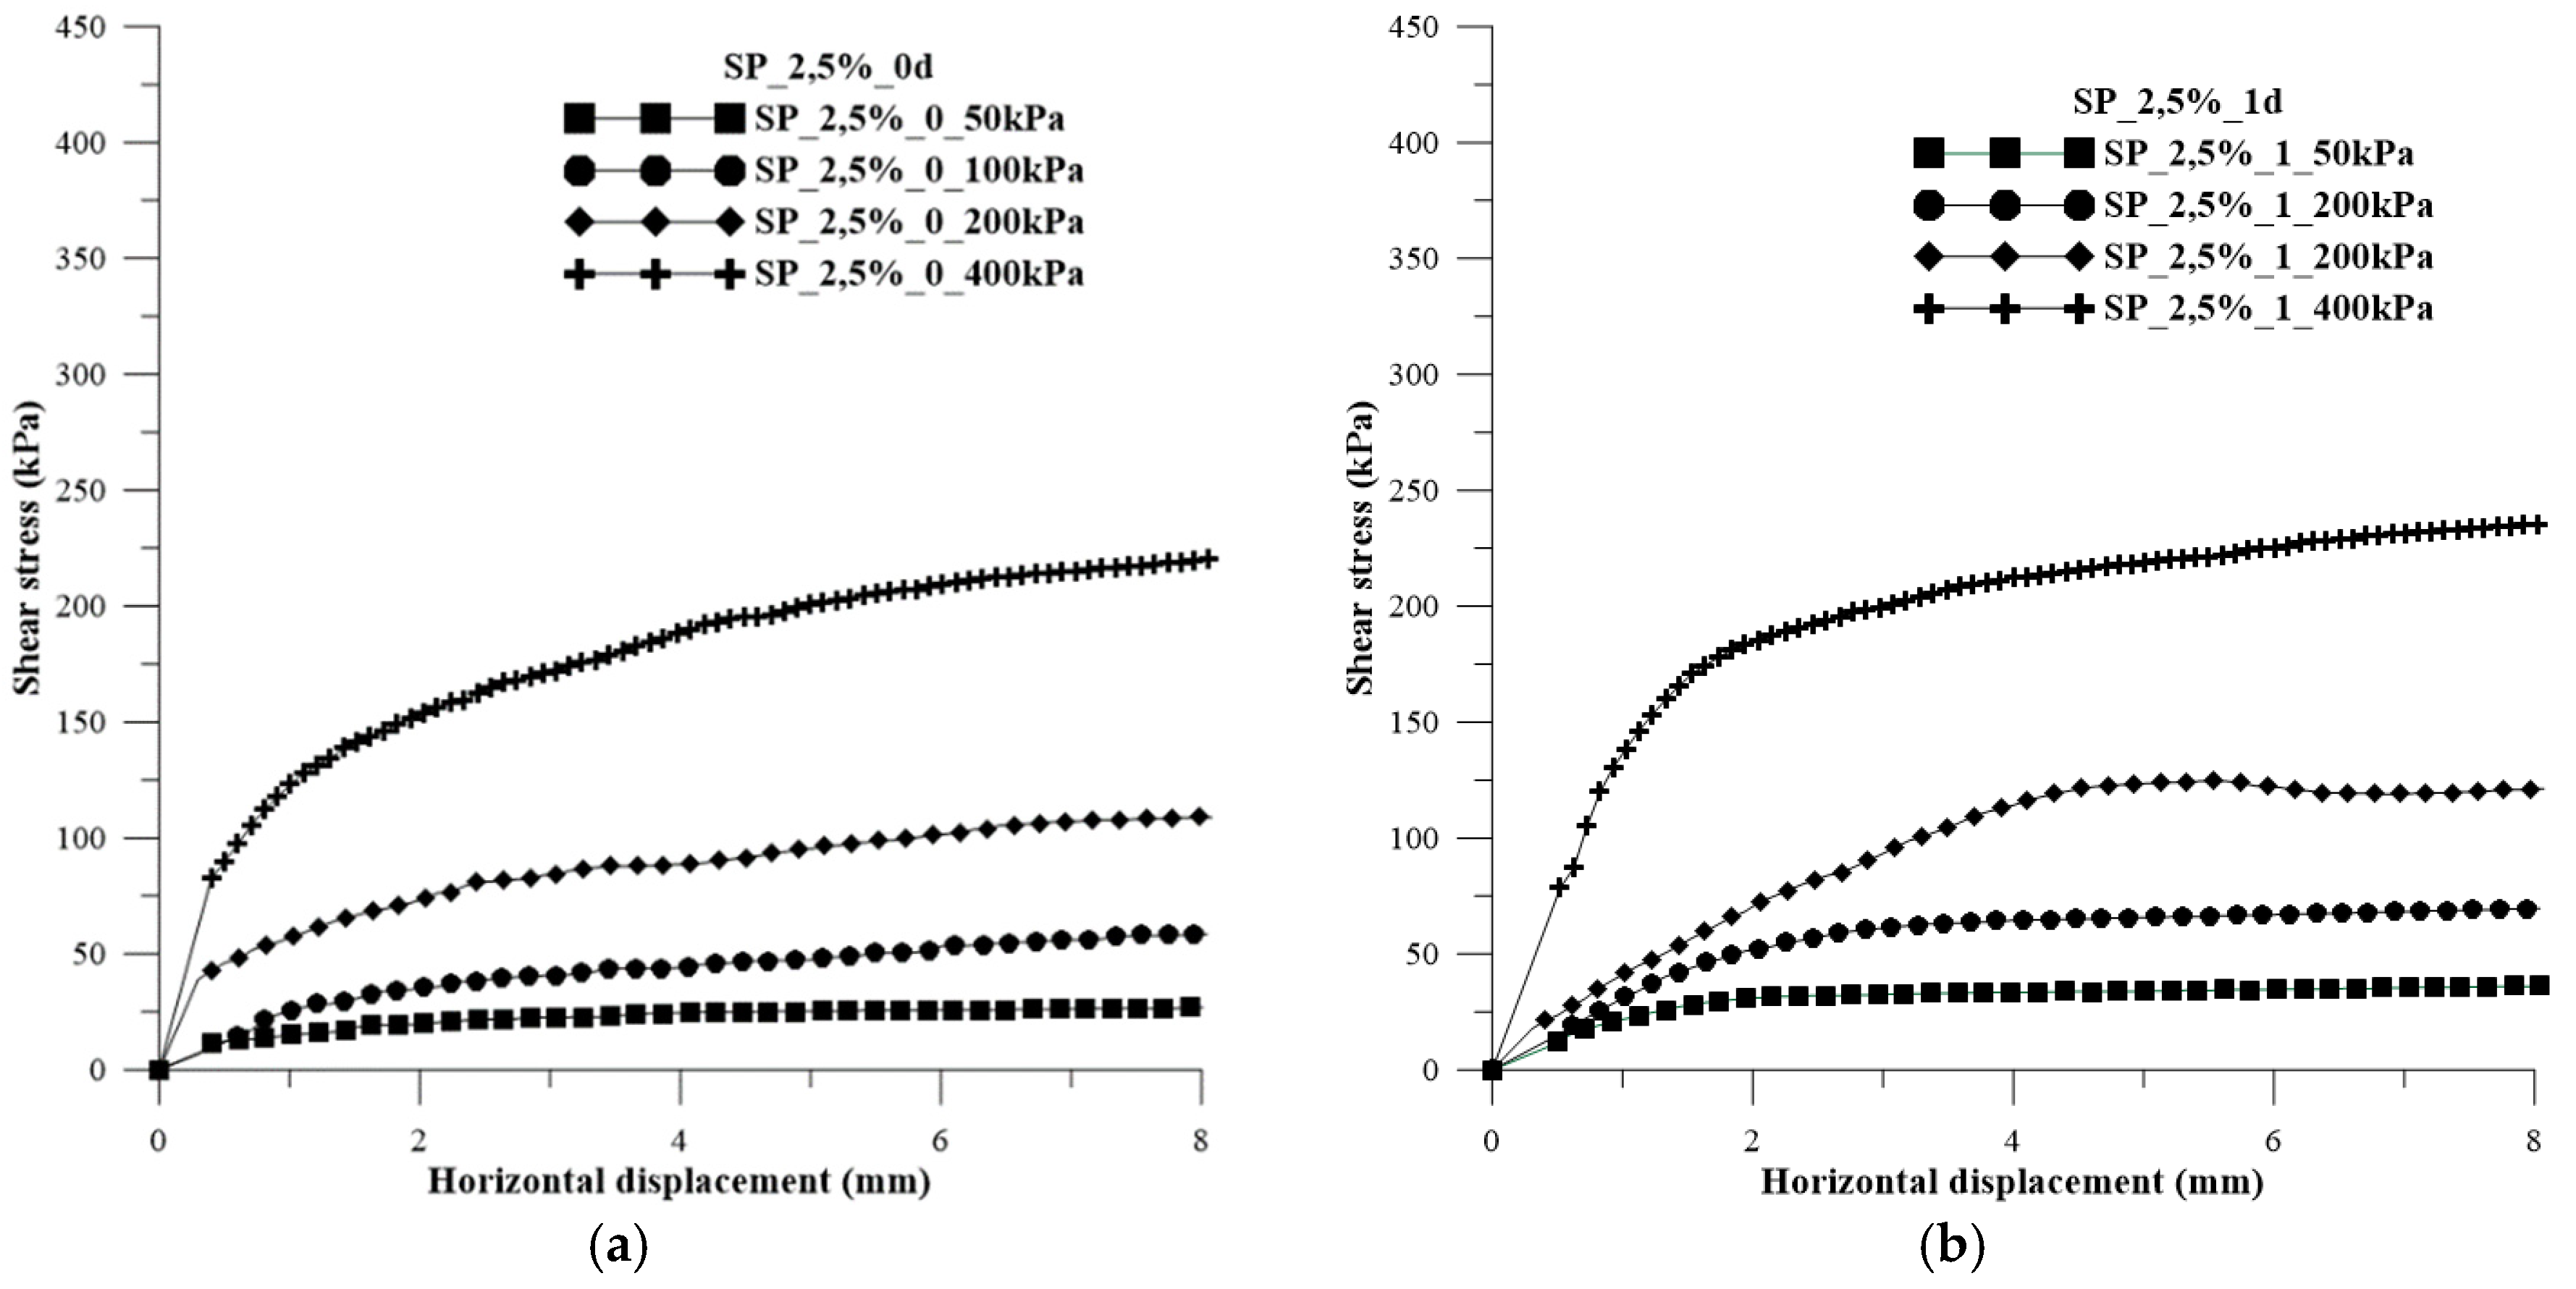
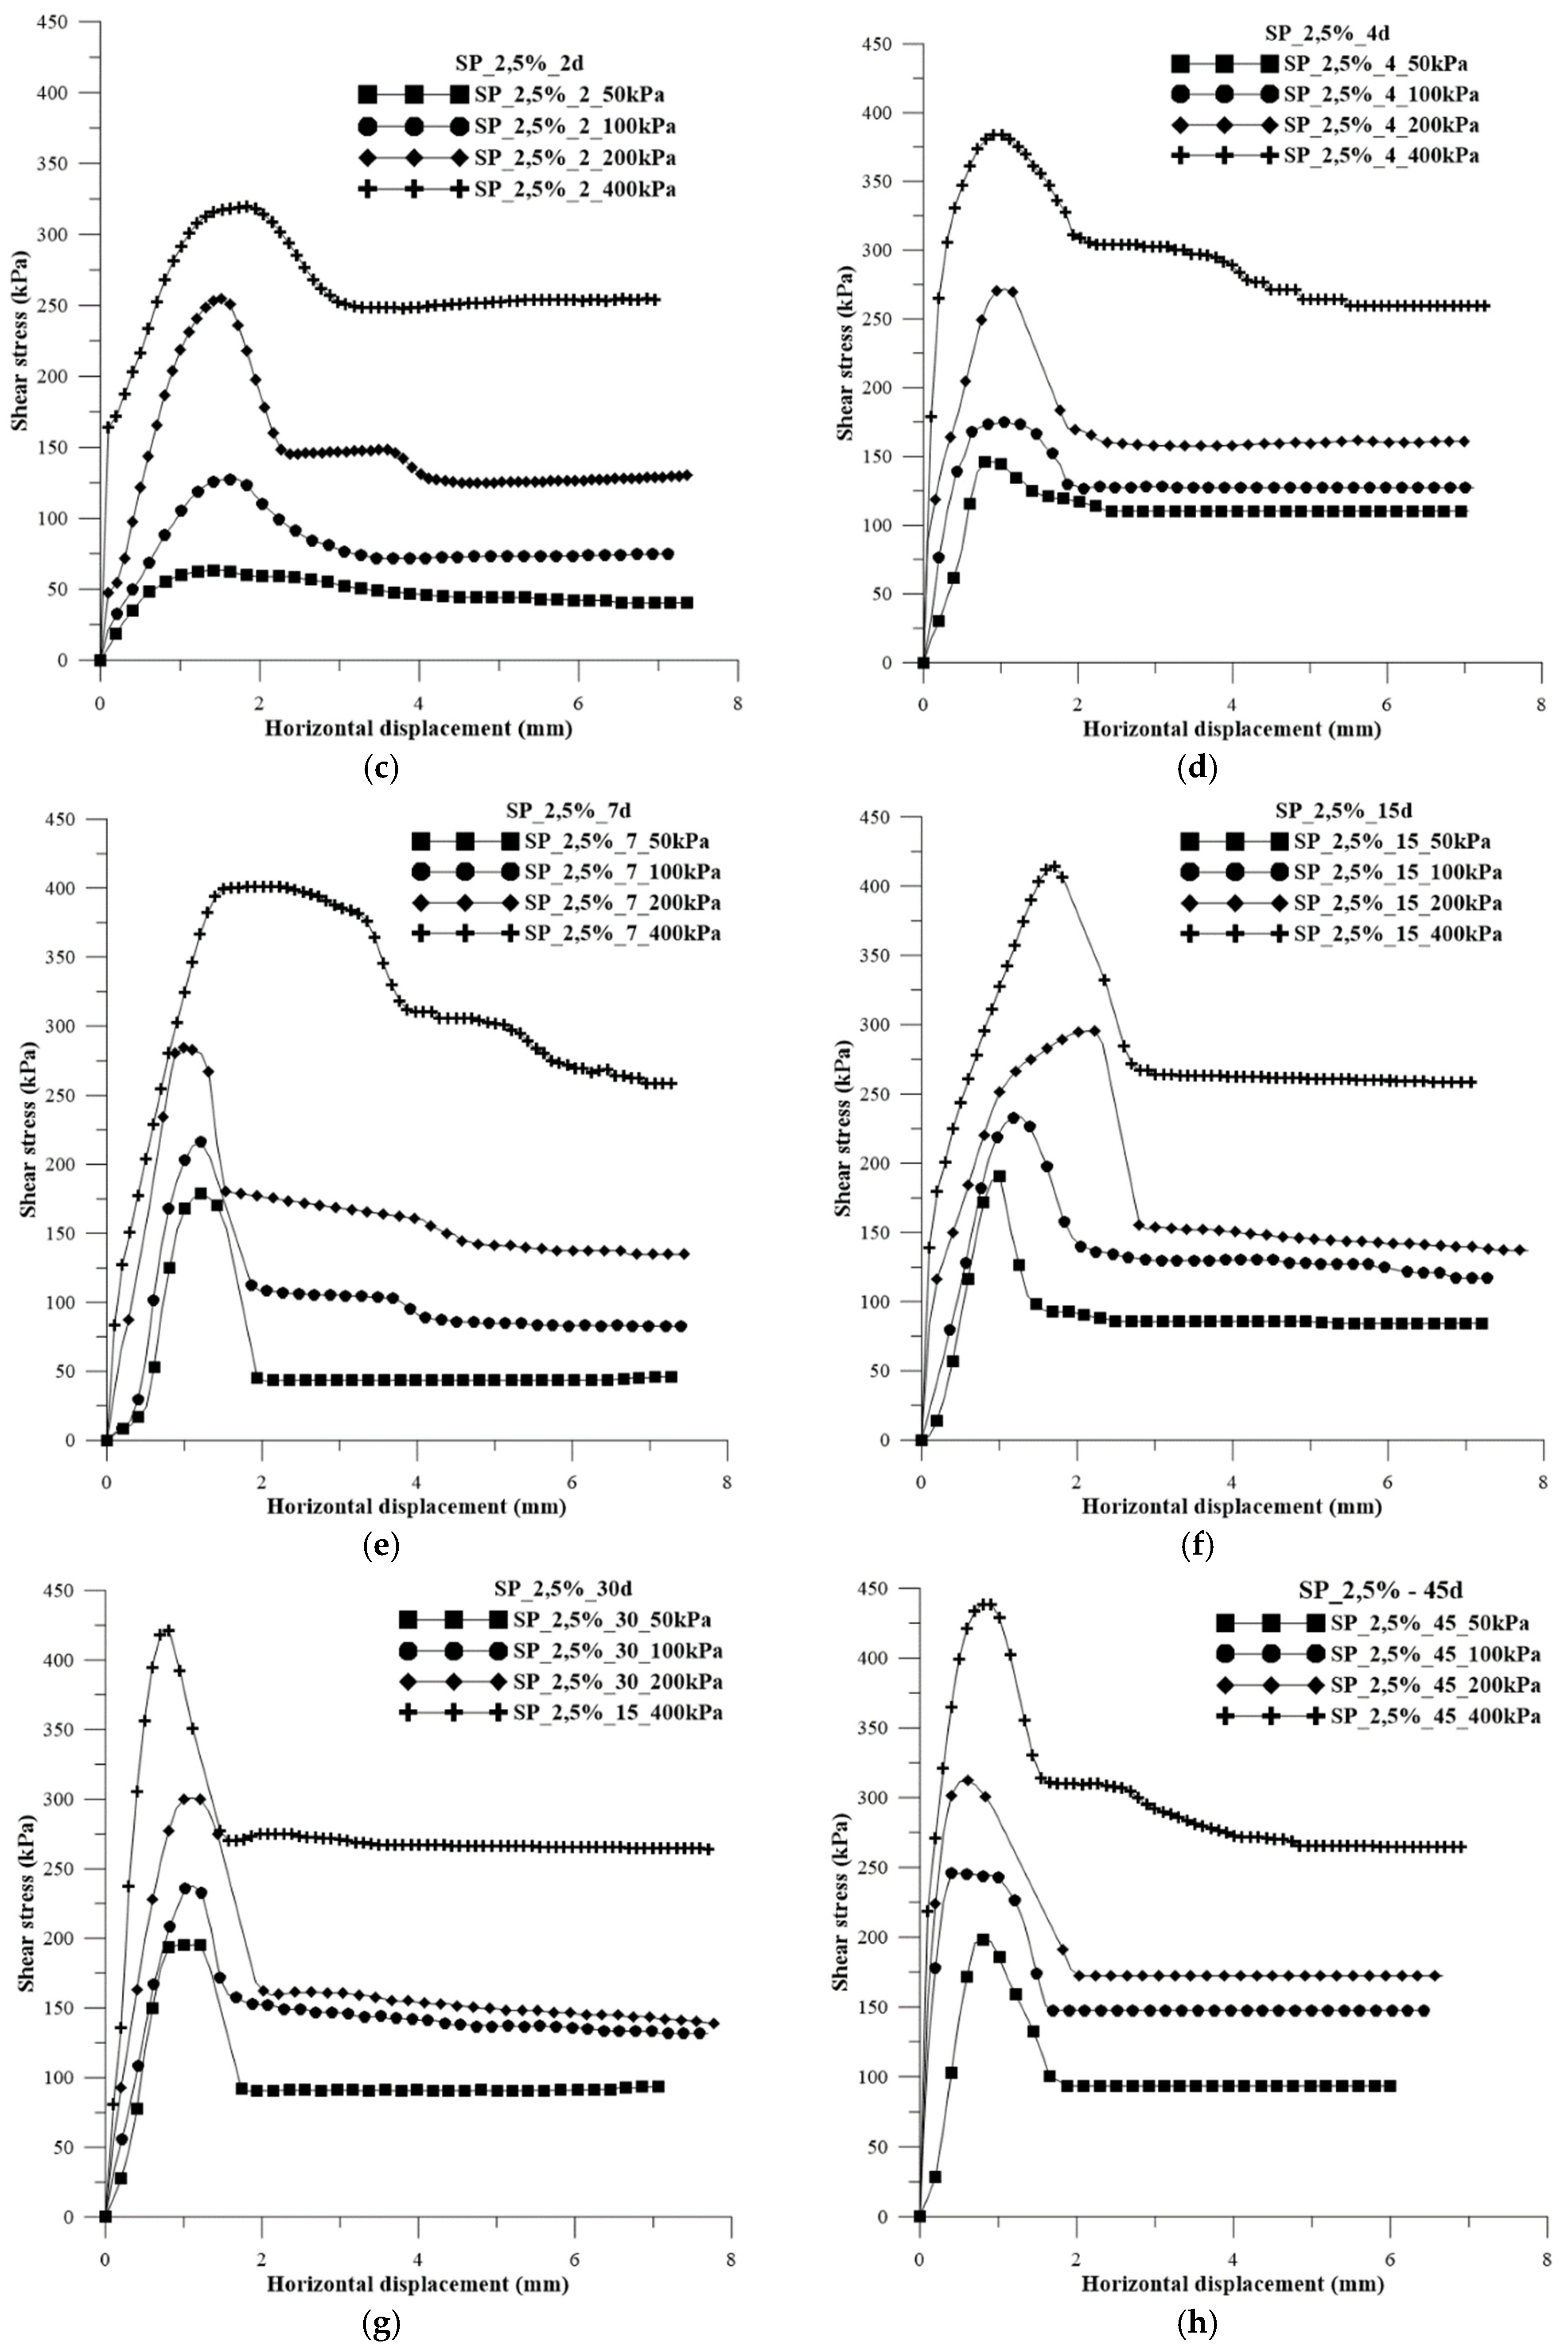
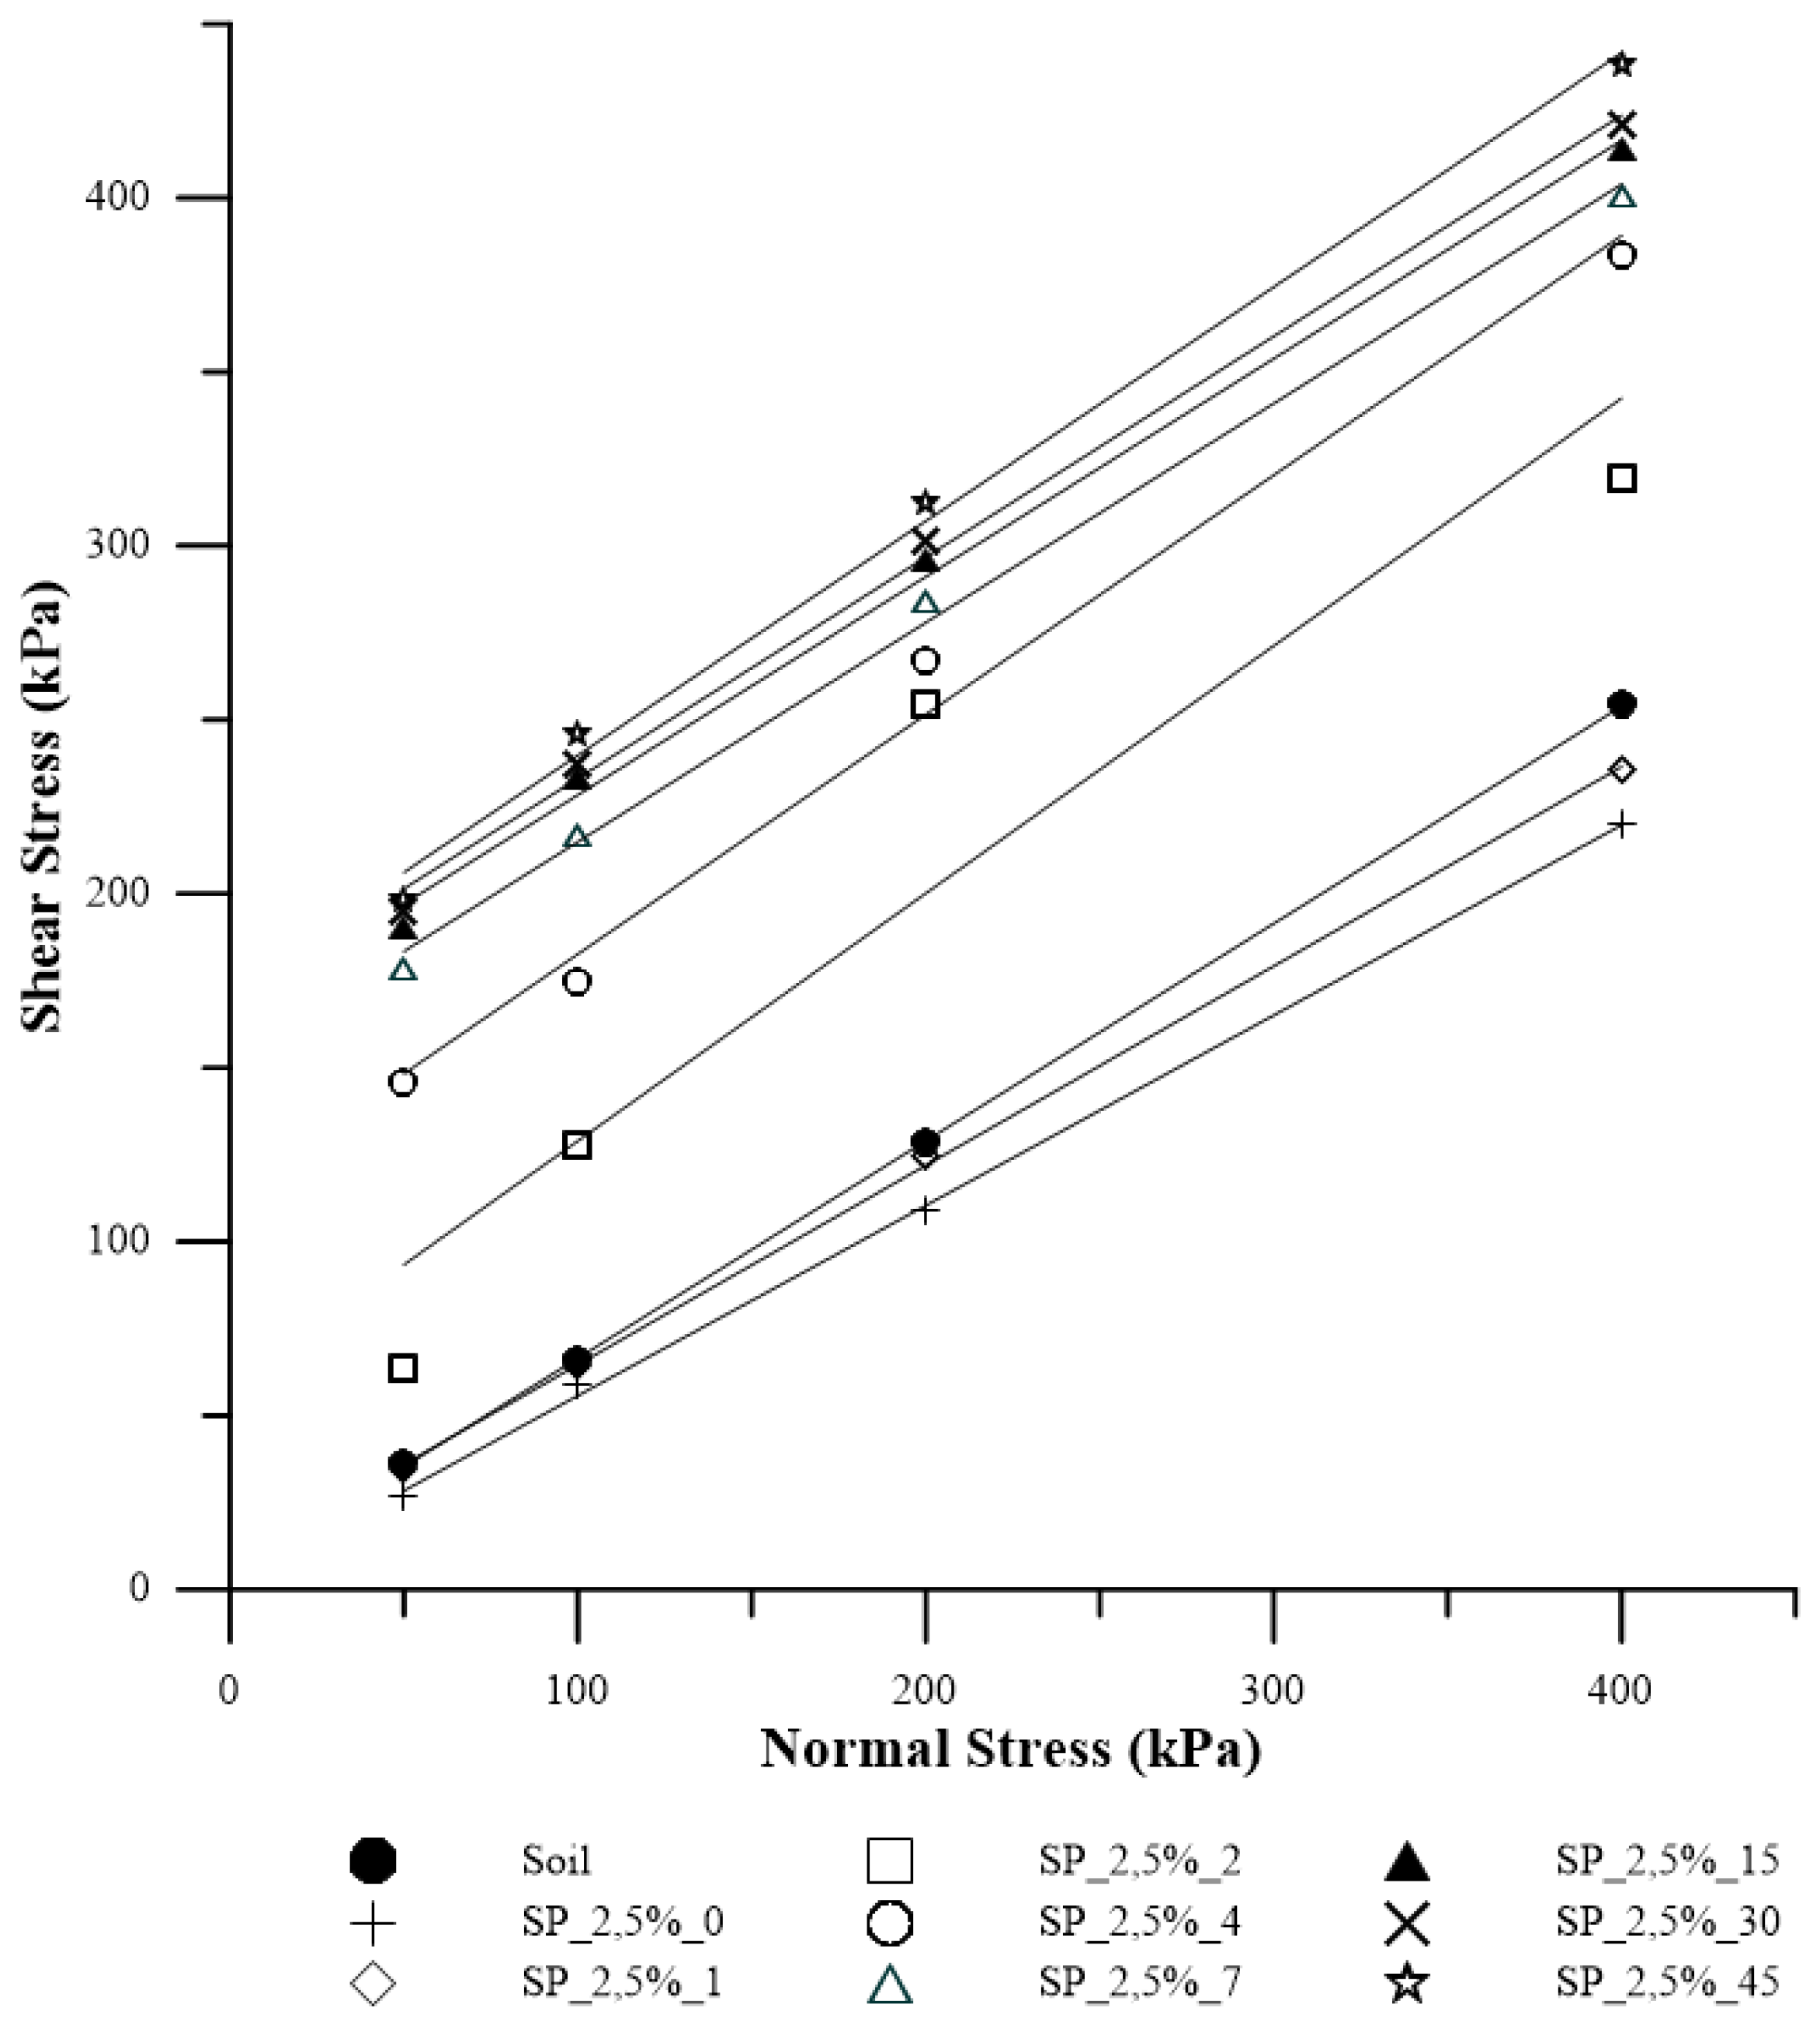
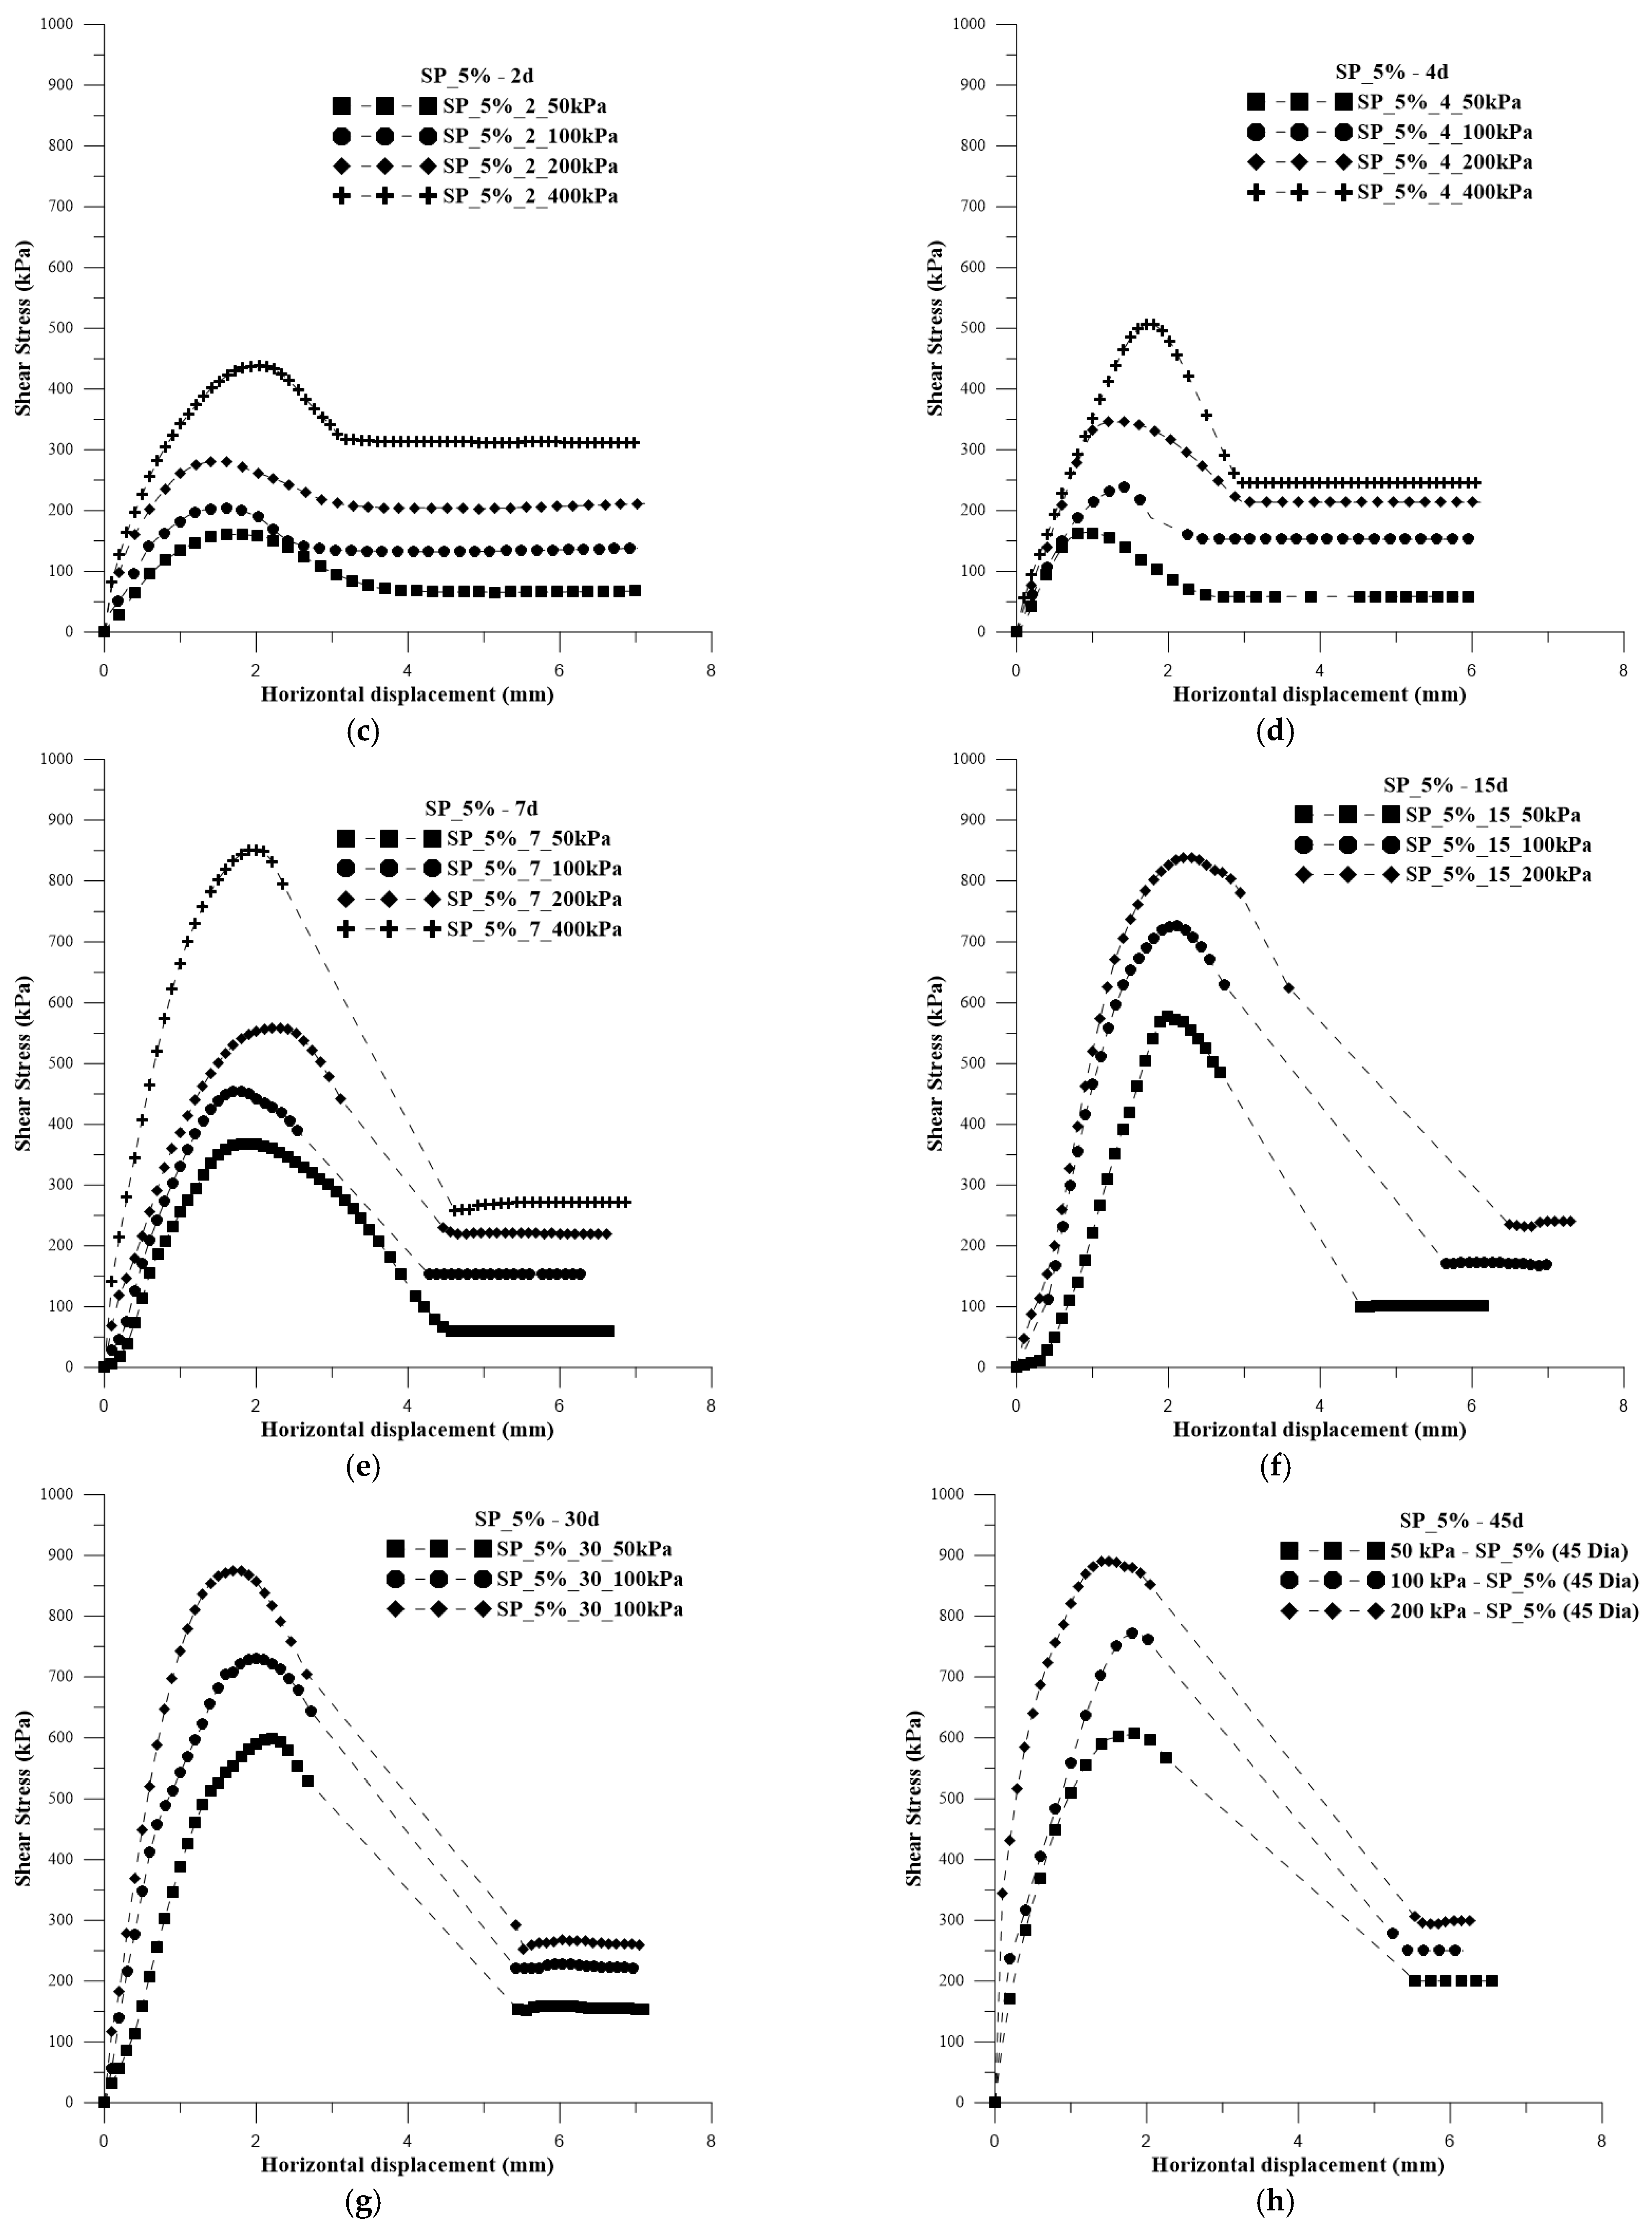
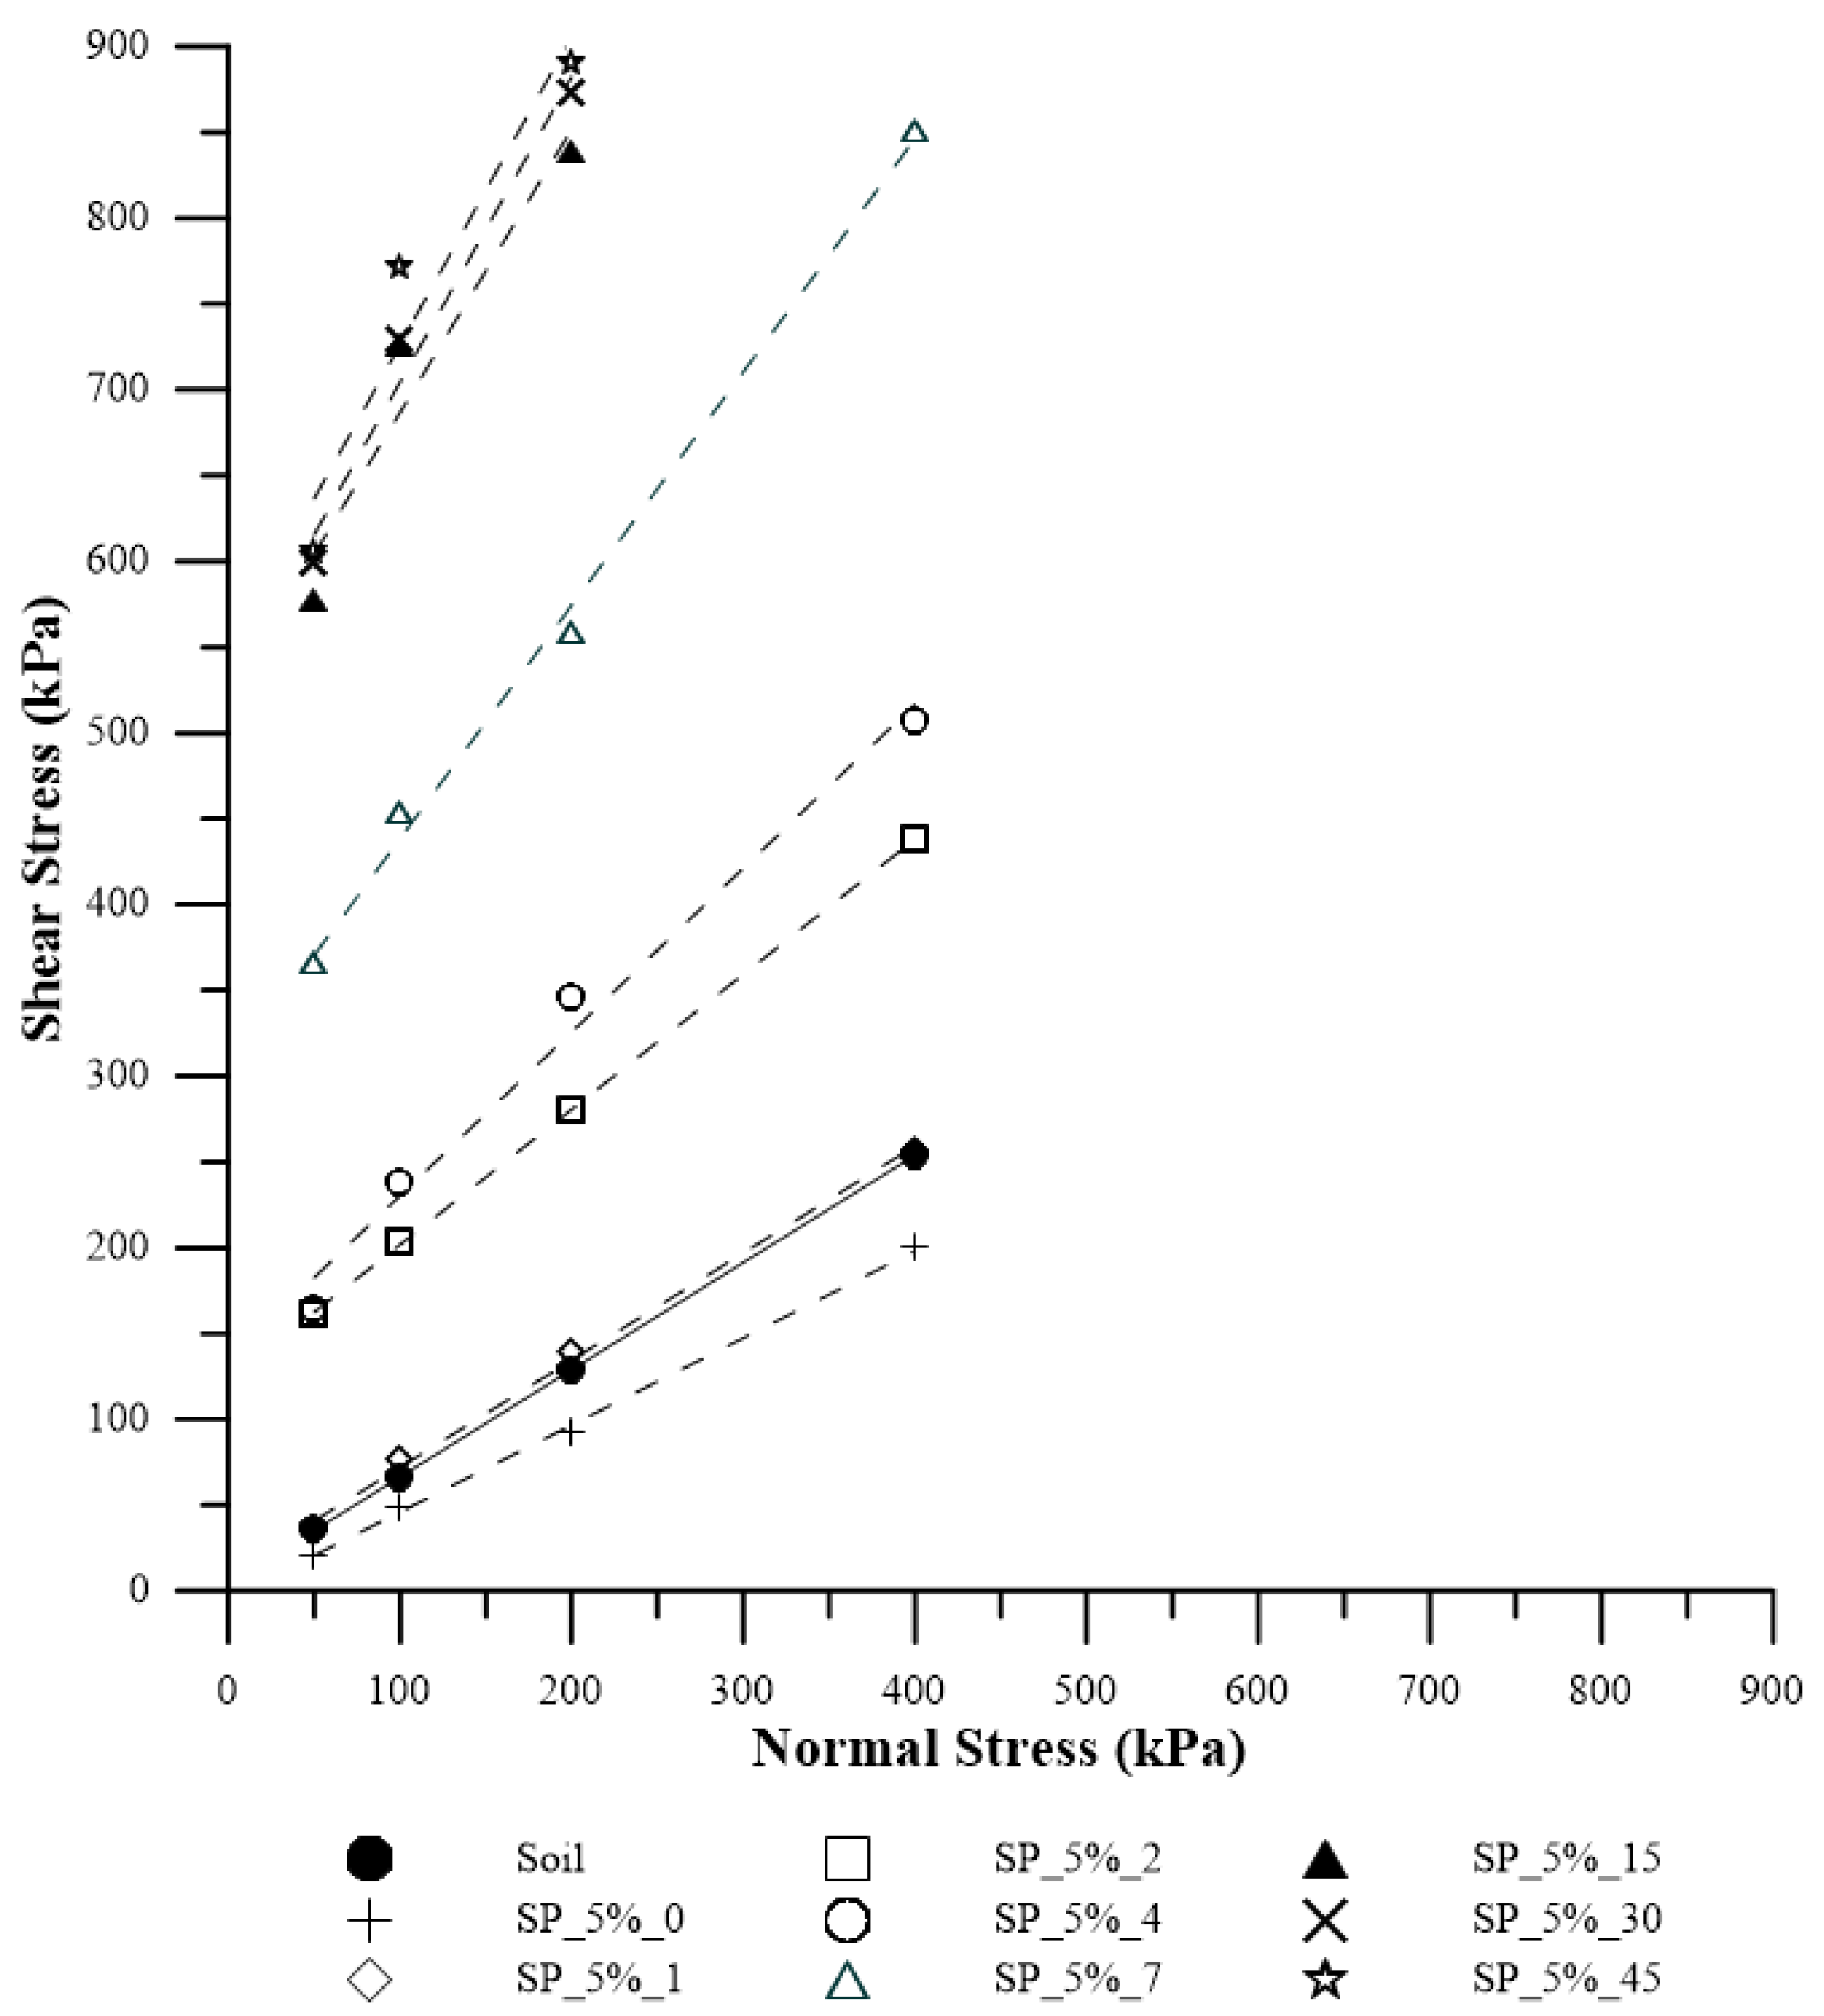
- Analysis of the direct shear results for both studied concentrations showed that an increase in curing time improves the strength parameters, both cohesive intercept and friction angle.
- Permeability was reduced for both composites compared to pure sandy soil, attributed to the polymer solution occupying the void spaces between grains.
- From an environmental perspective, the leachate analysis did not reveal excessive chemical elements that could contaminate groundwater, fauna, flora, or the local population.
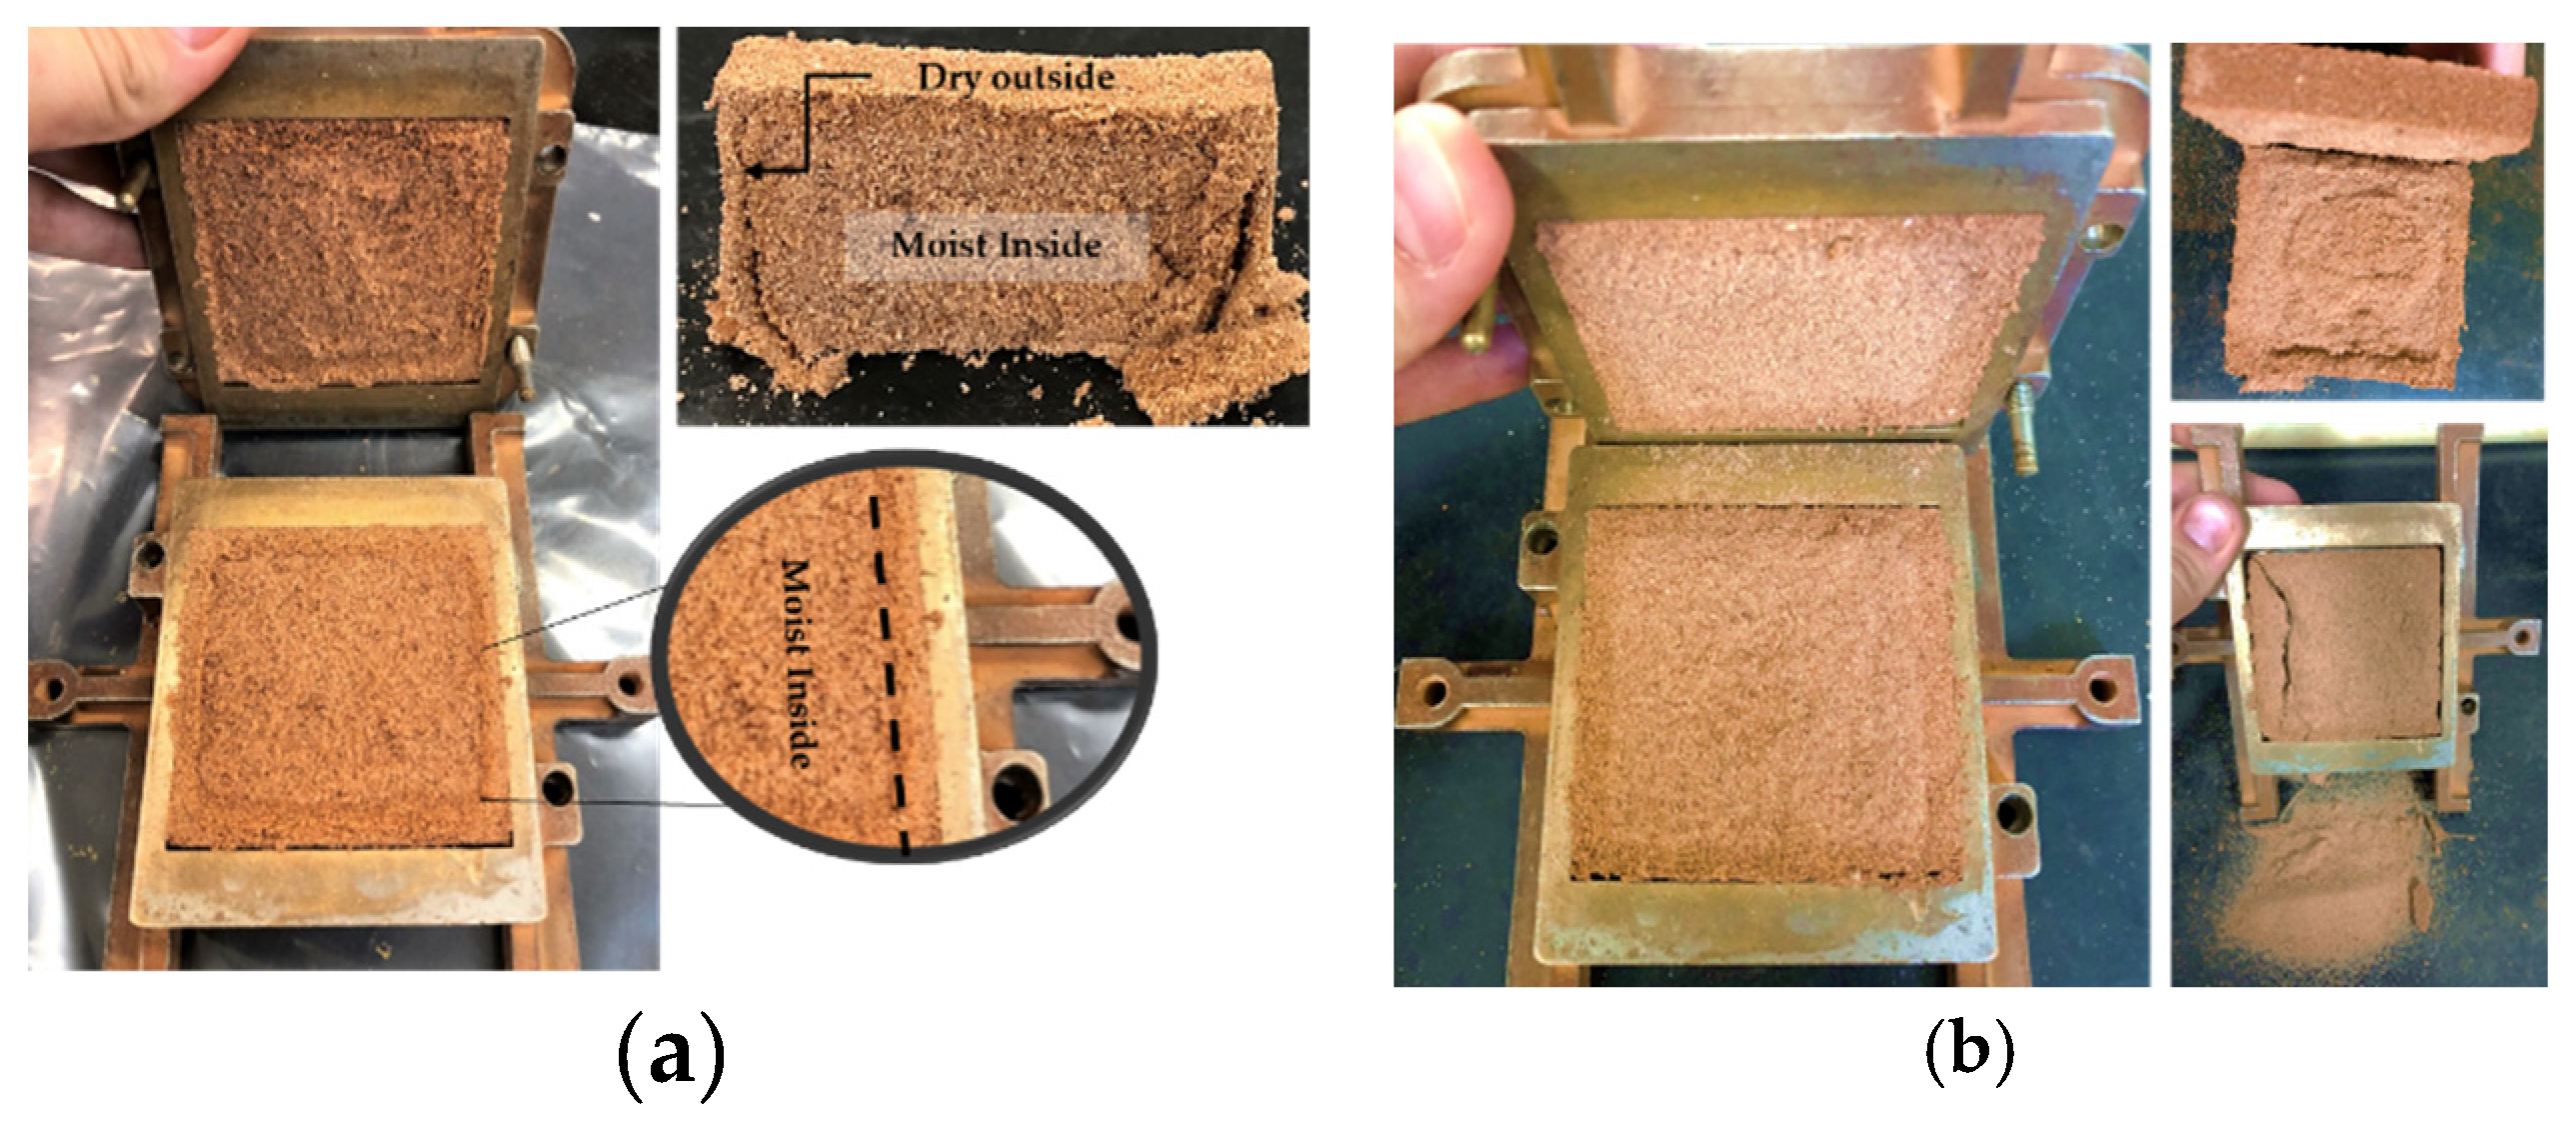
- The action of the polymer increases the rigidity of the composite upon exposure to air, as this is a common chemical reaction in any type of adhesive, where oxygen acts as a catalyst for material hardening.
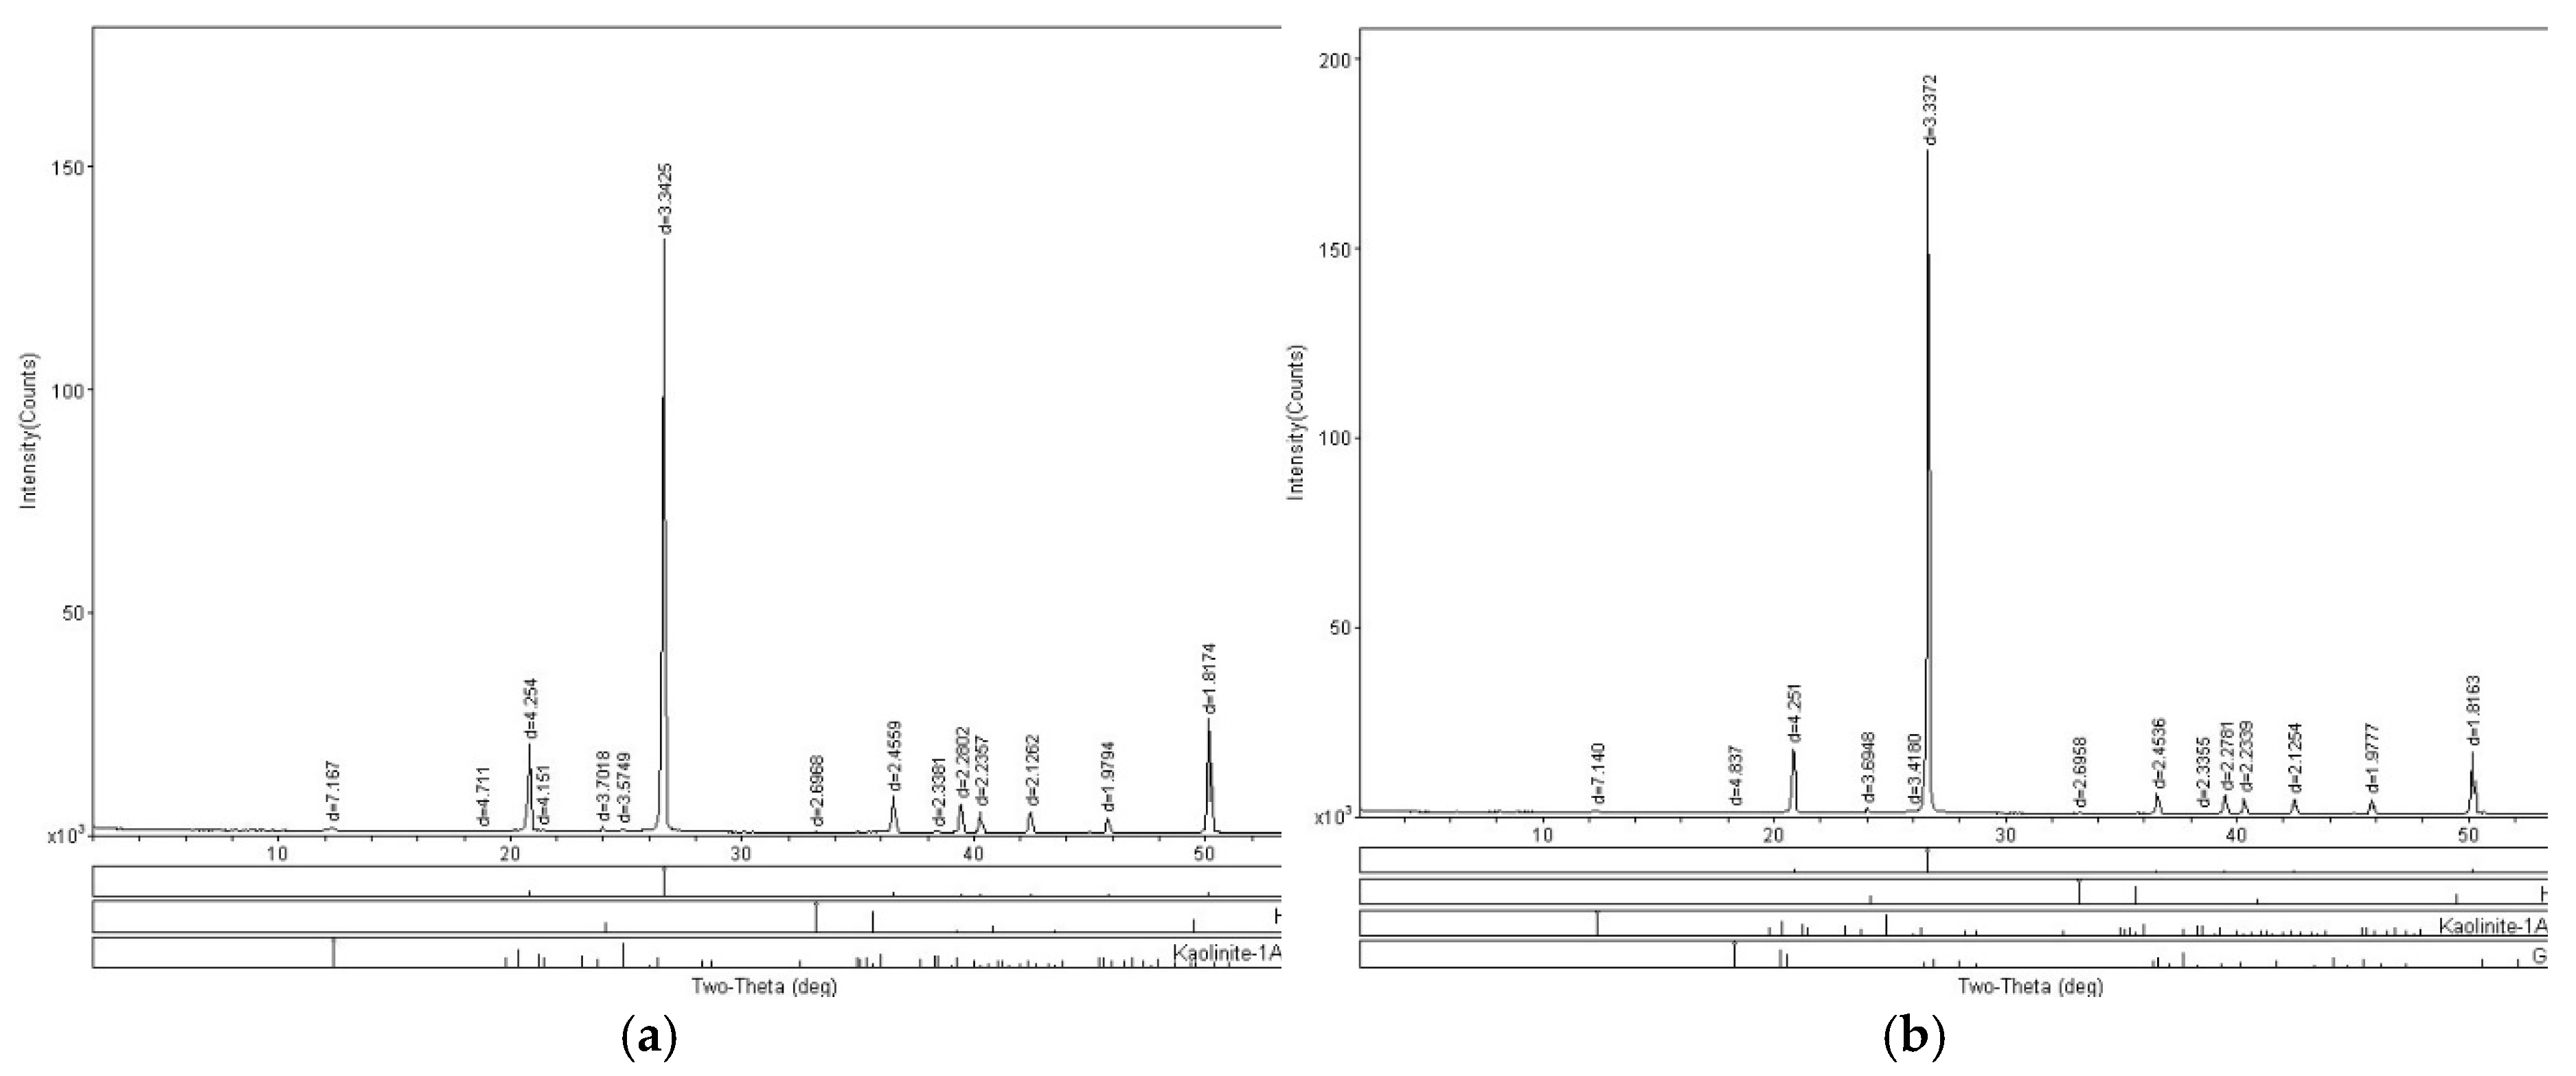
- Microstructural characterization visibly shows the action of the polymer as a cementing agent for grains, forming a film on the grains and binding them. With the increase in curing time in mechanical tests, this grain union led to an improvement in the strength values of the composites.
- Through the analyses and studies conducted in the research, it can be concluded that there is technical feasibility for the application of the polymer solution, for both concentrations, in geotechnical projects. In general, the 5% content yielded better results, although for applications in embankments and slopes, the 2.5% content produces satisfactory results.
Author Contributions
Funding
Conflicts of Interest
References
- Barreto, T.M.; Repsold, L.M.; e Silva, N.A.B. de S.; Casagrande, M.D.T. Influence of Addition of Butadiene Copolymer and Modified Styrene on the Mechanical Behavior of a Sand. Soils and Rocks 2022, 45. [CrossRef]
- Bozyigit, I.; Zingil, H.O.; Altun, S. Performance of Eco-Friendly Polymers for Soil Stabilization and Their Resistance to Freeze–Thaw Action. Construction and Building Materials 2023, 379. [Google Scholar] [CrossRef]
- Silva, N.A.B.S. Performance of a soil-polymer composite for application in geotechnical and paving works. Dissertation (Master’s in Geotechnics), University of Brasília, 2020.
- de A. Carneiro, A.; Casagrande, M.D.T. Mechanical and Environmental Performance of Polymer Stabilized Iron Ore Tailings. Soils and Rocks 2020, 43, 679–689. [Google Scholar] [CrossRef]
- Khodabandeh, M.A.; Nagy, G.; Török, Á. Stabilization of Collapsible Soils with Nanomaterials, Fibers, Polymers, Industrial Waste, and Microbes: Current Trends. Construction and Building Materials 2023, 368. [Google Scholar] [CrossRef]
- Khalaf, A.A.; Kopecskó, K. Proposed Simplified Method of Geopolymer Concrete Mix Design. Concrete Structures 2020, 21, 31–37. [Google Scholar] [CrossRef]
- Davidovits, J. GEOPOLYMERS Inorganic Polymerie New Materials; 1991; Vol. 37, pp. 1633–1656;
- Alelvan, G.M.; Ferreira, J.W. dos S.; Casagrande, M.D.T.; Consoli, N.C. Proposal of New Construction Material: Polymer-Stabilized Gold Ore Tailings Composite. Sustainability (Switzerland) 2022, 14. [CrossRef]
- KHATAMI, H.R.; O’KELLY, B.C. Improving Mechanical Properties of Sand Using Biopolymers. ASCE 2012, 139. [Google Scholar] [CrossRef]
- Samir, A.; Ashour, F.H.; Hakim, A.A.A.; Bassyouni, M. Recent Advances in Biodegradable Polymers for Sustainable Applications. npj Materials Degradation 2022, 6. [Google Scholar] [CrossRef]
- Soldo, A.; Miletić, M.; Auad, M.L. Biopolymers as a Sustainable Solution for the Enhancement of Soil Mechanical Properties. Scientific Reports 2020, 10. [Google Scholar] [CrossRef] [PubMed]
- Almajed, A.; Lemboye, K.; Moghal, A.A.B. A Critical Review on the Feasibility of Synthetic Polymers Inclusion in Enhancing the Geotechnical Behavior of Soils. Polymers 2022, 14. [Google Scholar] [CrossRef] [PubMed]
- Huang, J.; Kogbara, R.B.; Hariharan, N.; Masad, E.A.; Little, D.N. A State-of-the-Art Review of Polymers Used in Soil Stabilization. Construction and Building Materials 2021, 305, 124685. [Google Scholar] [CrossRef]
- Wang, L.; Yao, Y.; Li, J.; Liu, K.; Wu, F. A State-of-the-Art Review of Organic Polymer Modifiers for Slope Eco-Engineering. Polymers 2023, 15. [Google Scholar] [CrossRef]
- Tingle, J.S.; Santoni, R.L. Stabilization of Clay Soils with Nontraditional Additives.
- Onyejekwe, S.; Ghataora, G.S. Soil Stabilization Using Proprietary Liquid Chemical Stabilizers: Sulphonated Oil and a Polymer. Bulletin of Engineering Geology and the Environment 2015, 74, 651–665. [Google Scholar] [CrossRef]
- ABNT Associação Brasileira de Normas Técnicas ABNT NBR 7181: Solo - Análise Granulométrica 2018.
- ASTM Standard Test Methods D7928 - Standard Test Method for Particle-Size Distribution (Gradation) of Fine-Grained Soils Using the Sedimentation (Hydrometer) Analysis 2021.
- ASTM Standard Test Methods D5550 Standard Test Method for Specific Gravity of Soil Solids by Gas Pycnometer 2014.
- ASTM Standard Test Methods D698-12 - Standard Test Methods for Laboratory Compaction Characteristics of Soil Using Standard Effort (12,400 Ft-Lbf/Ft3 (600 kN-m/M3)) 2021.
- ABNT Associação Brasileira de Normas Técnicas ABNT NBR 10004/2004 – Resíduos Sólidos. Em Seu Anexo F (Normativo) Determina a Concentração Dos Limites Máximos Obtidos No Ensaio de Lixiviação 2004.
- ASTM Standard Test Methods D3080-04 - Standard Test Method for Direct Shear Test of Soils Under Consolidated Drained Conditions. 2012.
- ABNT Associação Brasileira de Normas Técnicas ABNT NBR 13292: Solo – Determinação Do Coeficiente de Permeabilidade de Solos Granulares à Carga Constante – Método de Ensaio. 2021.
- ABNT Associação Brasileira de Normas Técnicas ABNT NBR 14545: Solo – Determinação Do Coeficiente de Permeabilidade de Solos Argilosos à Carga Variável. 2021.
- Brazil’s National Environment Council CONAMA no 420/2009; 2013.
- Brazil’s National Environment Council CONAMA No 430/2011; 2011.
- Lopes, L.S.E.; Malko, J.A.C.; Casagrande, M.D.T.; Motta, L.M. g Revista Pavimentação. 2015, pp. 63–82.
- Malko, J.A.C.; Brazetti, R.; Casagrande, M.D.T.; Silva, B.H.A. Applicability of Soil-Enzyme for Paving. In Proceedings of the 15th Asian Regional Conference on Soil Mechanics and Geotechnical Engineering, ARC 2015: New Innovations and Sustainability; Asian Regional Conference on Soil Mechanics and Geotechnical Engineering; 2015; pp. 2082–2085. [Google Scholar]
- Debbarma, K.; Saha, S.; Pratim Sarkar, P. Application of Vinyl Acrylic Co-Polymer on Subgrade and Sub Base Pavement Stabilization. Materials Today: Proceedings 2023. [CrossRef]
- dos S.L. Louzada, N.; Malko, J.A.C.; Casagrande, M.D.T. Behavior of Clayey Soil Reinforced with Polyethylene Terephthalate. Journal of Materials in Civil Engineering 2019, 31, 04019218. [Google Scholar] [CrossRef]
- Umar, M.; Muhamad Mahir, A.; Ilman, M.; Zamri, H.; Fadhli, M.; Haluwi, M.; Nooraiin, S.; Razali, M. Comparison between Unstablized and Stabilized Soil That Affect Shear Strength Characteristics. Multidisciplinary Applied Research and Innovation 2023, 4, 79–84. [Google Scholar]
- Kinter, E.B. Development and Evaluation of Chemical Soil Stabilizers; United States. Federal Highway Administration. Office of Research and Development, 1975.
- Abayazid, Z.; Farrag, S. Different Approaches of Soil Stabilization: A Comprehensive Review; 2023.
- Consoli, N.C.; Casagrande, M.D.T.; Thomé, A.; Rosa, F.D.; Fahey, M. Effect of Relative Density on Plate Loading Tests on Fibre-Reinforced Sand. Geotechnique 2009, 59, 471–476. [Google Scholar] [CrossRef]
- Perera-Mercado, Y.; Hedayat, A.; Tunstall, L.; Clements, C.; Hylton, J.; Figueroa, L.; Zhang, N.; Bolaños Sosa, H.G.; Tupa, N.; Yanqui Morales, I.; et al. Effect of the Class C Fly Ash on Low-Reactive Gold Mine Tailing Geopolymers. Polymers 2022, 14. [Google Scholar] [CrossRef] [PubMed]
- Kurt Albayrak, Z.N.; Isik, M.A. Effects of Liquid Polymers on the Strength and Freezing-Thawing Properties of Bentonite And Kaolin Clays: A Comparative Study for Cold Climates. Baltic Journal of Road and Bridge Engineering 2023, 18, 32–49. [Google Scholar] [CrossRef]
- Ramirez, G.G.D.; Casagrande, M.D.T. Experimental Study of Granular Rubber Waste Tire Reinforced Soil for Geotechnical Applications. In Proceedings of the Key Engineering Materials; Trans Tech Publications Ltd., 2014; Vol. 600, pp. 585–596. [Google Scholar]
- Ravindran, G.; Bahrami, A.; Mahesh, V.; Katman, H.Y.B.; Srihitha, K.; Sushmashree, A.; Nikhil Kumar, A. Global Research Trends in Engineered Soil Development through Stabilisation: Scientific Production and Thematic Breakthrough Analysis. Buildings 2023, 13, 2456. [Google Scholar] [CrossRef]
- Lam, C.; Jeffreris, S.A. Introduction to Polymers and Polymers Fluids. ICE 2017, 29–55. [Google Scholar] [CrossRef]
- Alelvan, G.M.; Casagrande, M.D.T.; Consoli, N.C. Mechanical Behavior Analysis of Polymer Stabilized Gold Ore Tailings. Soils and Rocks 2022, 45. [Google Scholar] [CrossRef]
- Al-Khanbashi, A.; El-Gamal, M. Modification of Sandy Soil Using Water-Borne Polymer. Journal of Applied Polymer Science 2003, 88, 2484–2491. [Google Scholar] [CrossRef]
- ABNT Associação Brasileira de Normas Técnicas ABNT NBR 6457: Amostras de Solo – Preparação Para Ensaios de Compactação e Ensaios de Caracterização 2016.
- ABNT Associação Brasileira de Normas Técnicas ABNT NBR 6459: Solo – Determinação Do Limite de Liquidez. 2017.
- ABNT Associação Brasileira de Normas Técnicas ABNT NBR 7180: Solo – Determinação Do Limite de Plasticidade. 2016.
- ABNT Associação Brasileira de Normas Técnicas ABNT NBR 7182: Solo – Ensaio de Compactação. 2020.
- GARCIA, N.F.; Valdes, J.R.; Cortes, D.D. No AccessStrength Characteristics of Polymer-Bonded Sands. Géotechnique Letters 2015, 5, 212–215. [Google Scholar] [CrossRef]
- Okonta, F. Pavement Geotechnical Properties of Polymer Modified Weathered Semi-Arid Shale Subgrade. International Journal of Pavement Research and Technology 2019, 12, 54–63. [Google Scholar] [CrossRef]
- HOLLAWAY, L. Polymer Composites in Construction: A Brief History. ICE 2015, 162, 107–118. [Google Scholar] [CrossRef]
- Alelvan, G.M.; dos S. Ferreira, J.W.; Casagrande, M.D.T.; Consoli, N.C. Proposal of New Construction Material: Polymer-Stabilized Gold Ore Tailings Composite. Sustainability 2022, 14, 13648. [Google Scholar] [CrossRef]
- Luan, Y.; Ma, X.; Ma, Y.; Liu, X.; Jiang, S.; Zhang, J. Research on Strength Improvement and Stabilization Mechanism of Organic Polymer Stabilizer for Clay Soil of Subgrade. Case Studies in Construction Materials 2023, 19. [Google Scholar] [CrossRef]
- Murray, G.E. Soil Stabilization by Chemical Means. In Proceedings of the Proceedings on Conf. of Soil Stabilization; MIT: Massachusetts Institute of Technology. 1952. [Google Scholar]
- Massachusetts Institute of Technology Soil Stabilization Conference, AC0069_195203_011. In Proceedings of the AC0069_195203_011; MIT: Massachusetts Institute of Technology., 1952.
- Tingle, J.S.; Newman, J.K.; Larson, S.L.; Weiss, C.A.; Rushing, J.F. Stabilization Mechanisms of Nontraditional Additives. 2.
- Naeini, S.A.; Naderinia, B.; Izadi, E. Unconfined Compressive Strength of Clayey Soils Stabilized with Waterborne Polymer. KSCE Journal of Civil Engineering 2012, 16, 943–949. [Google Scholar] [CrossRef]



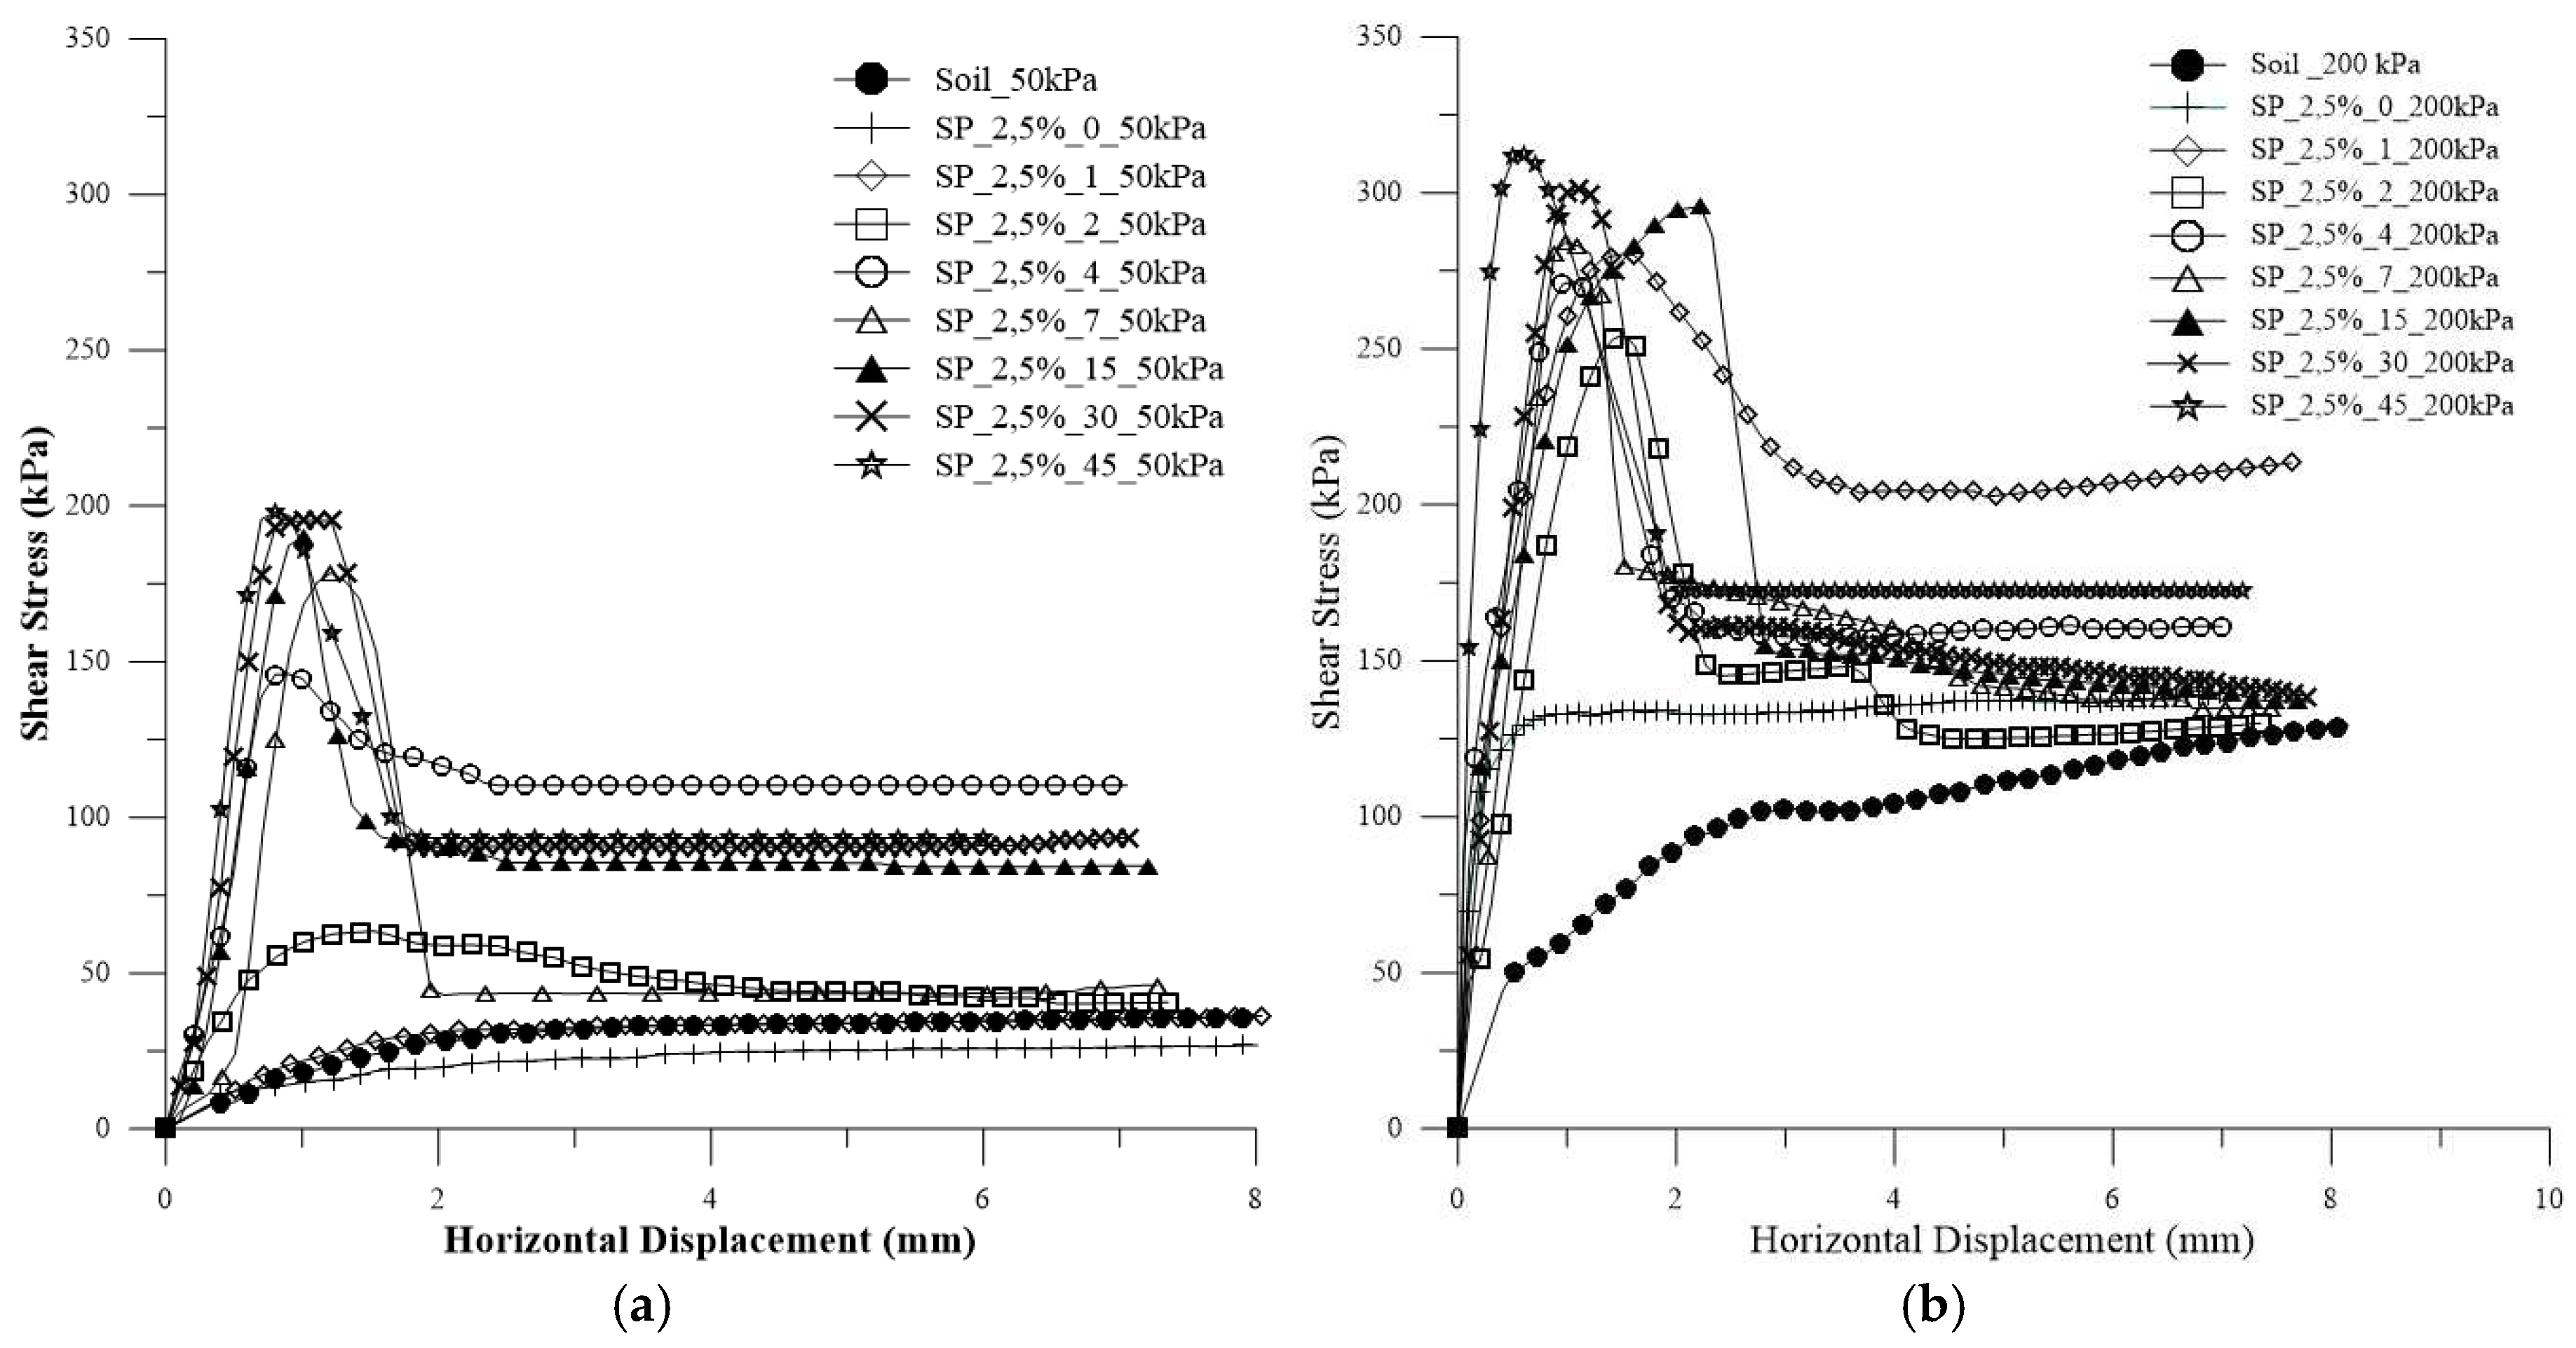
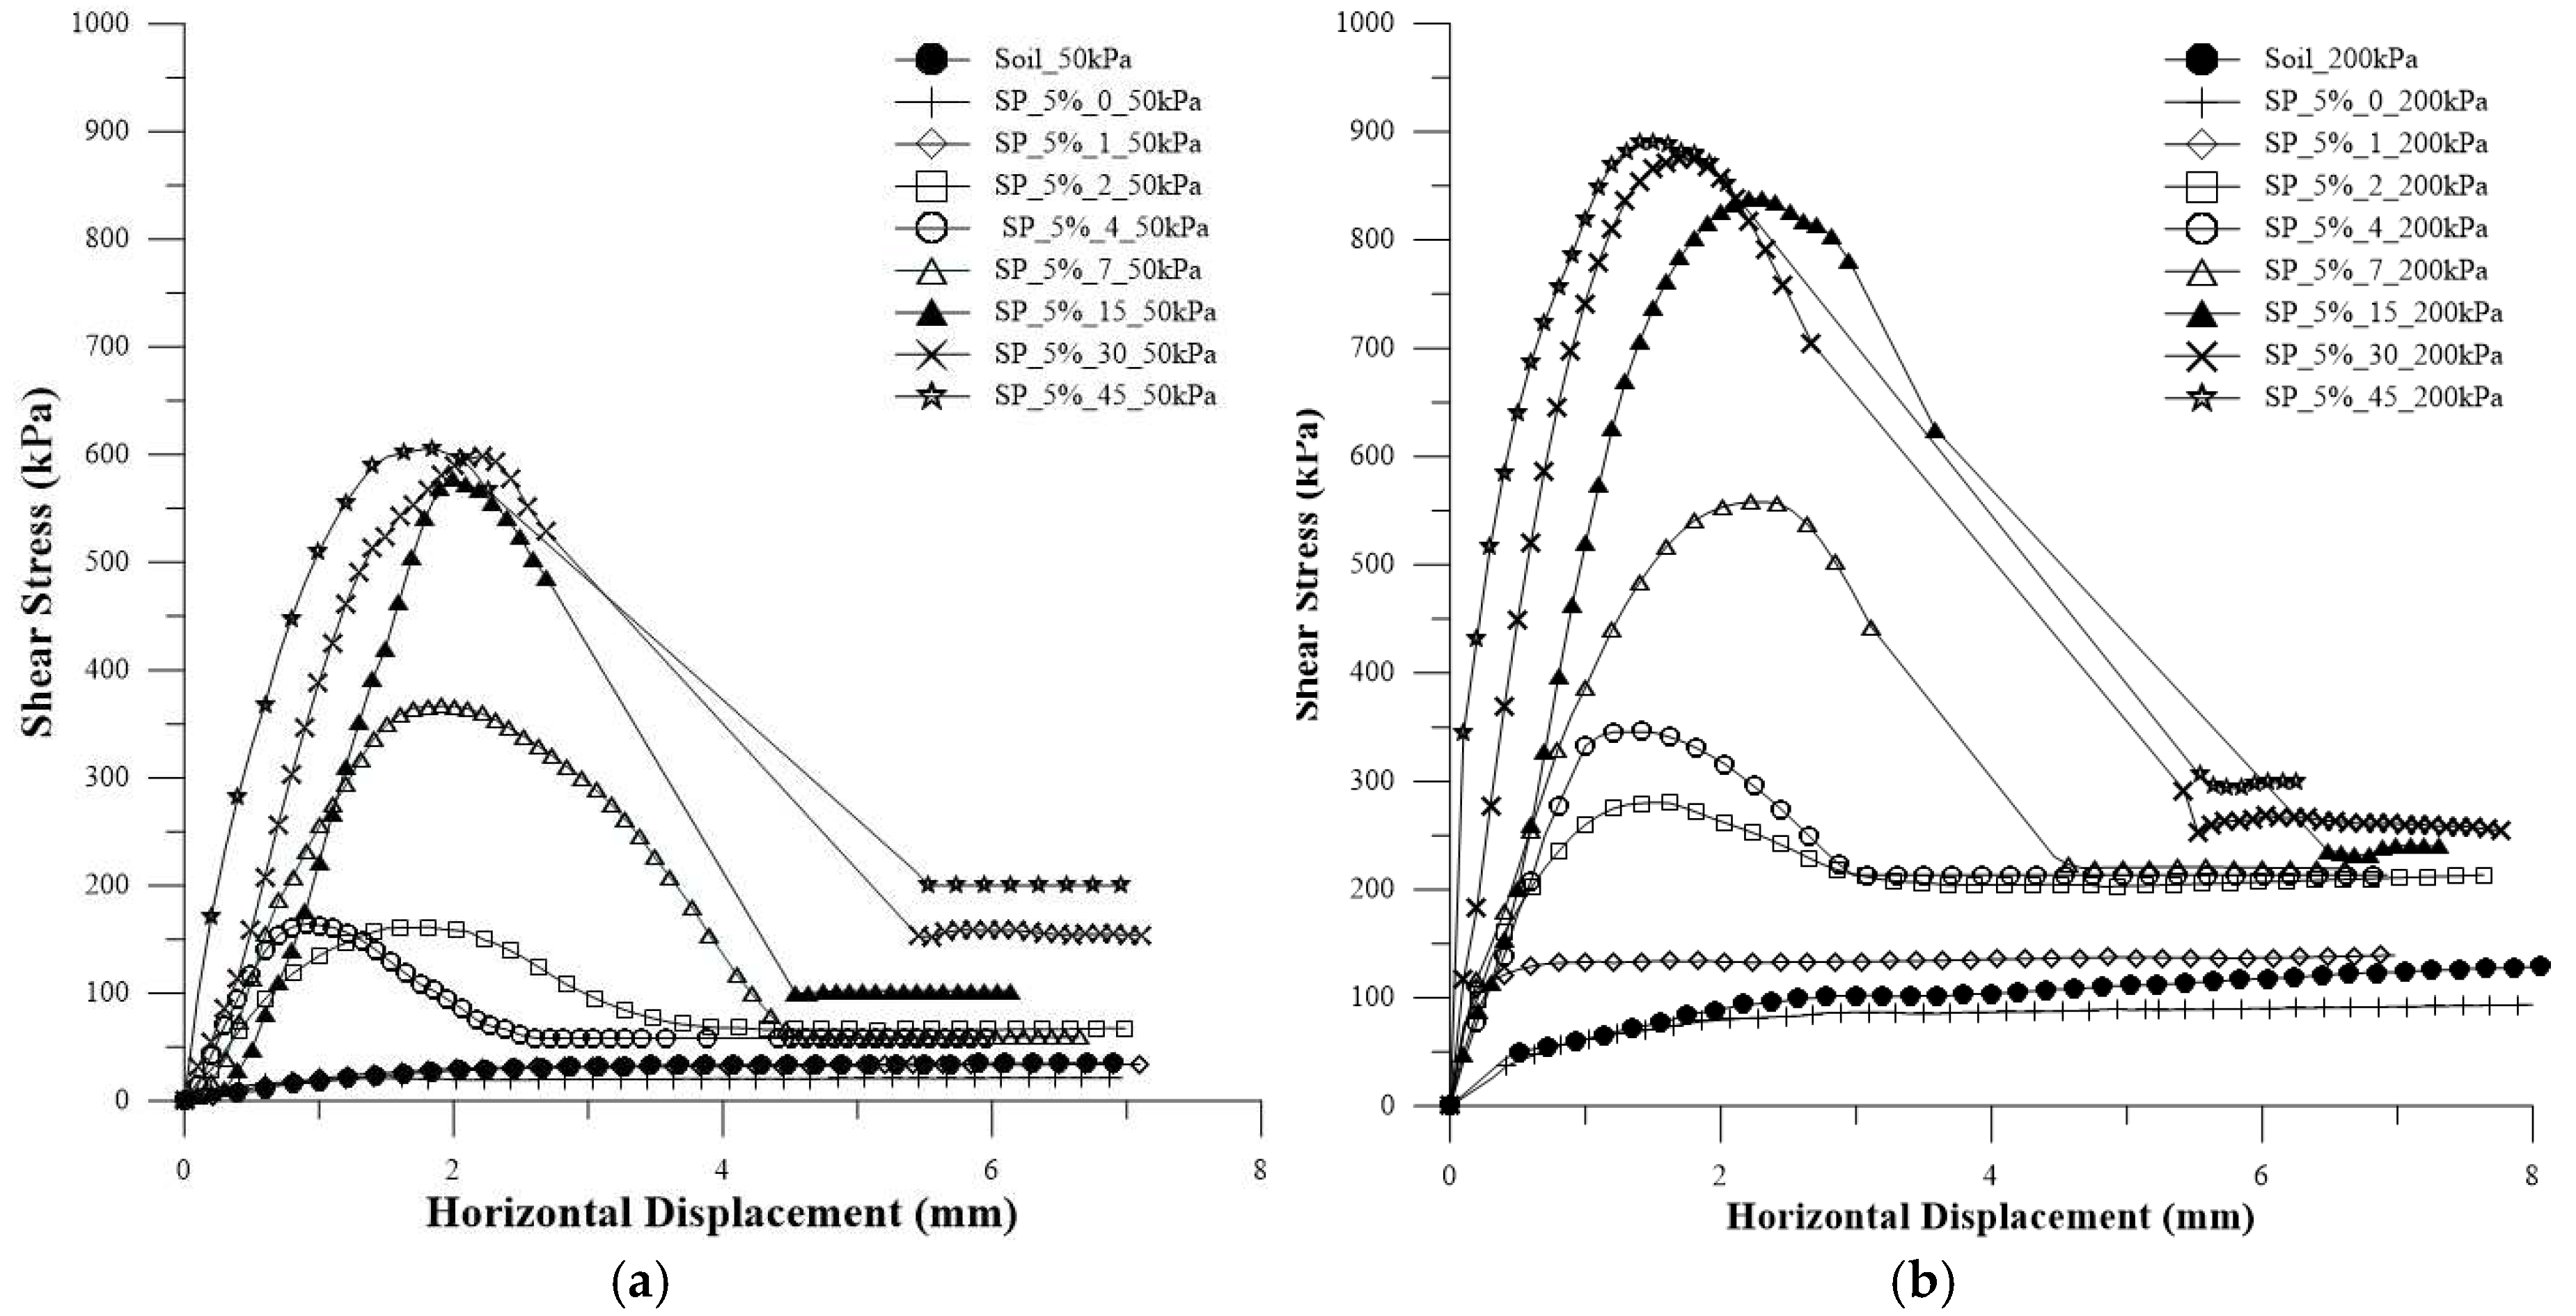
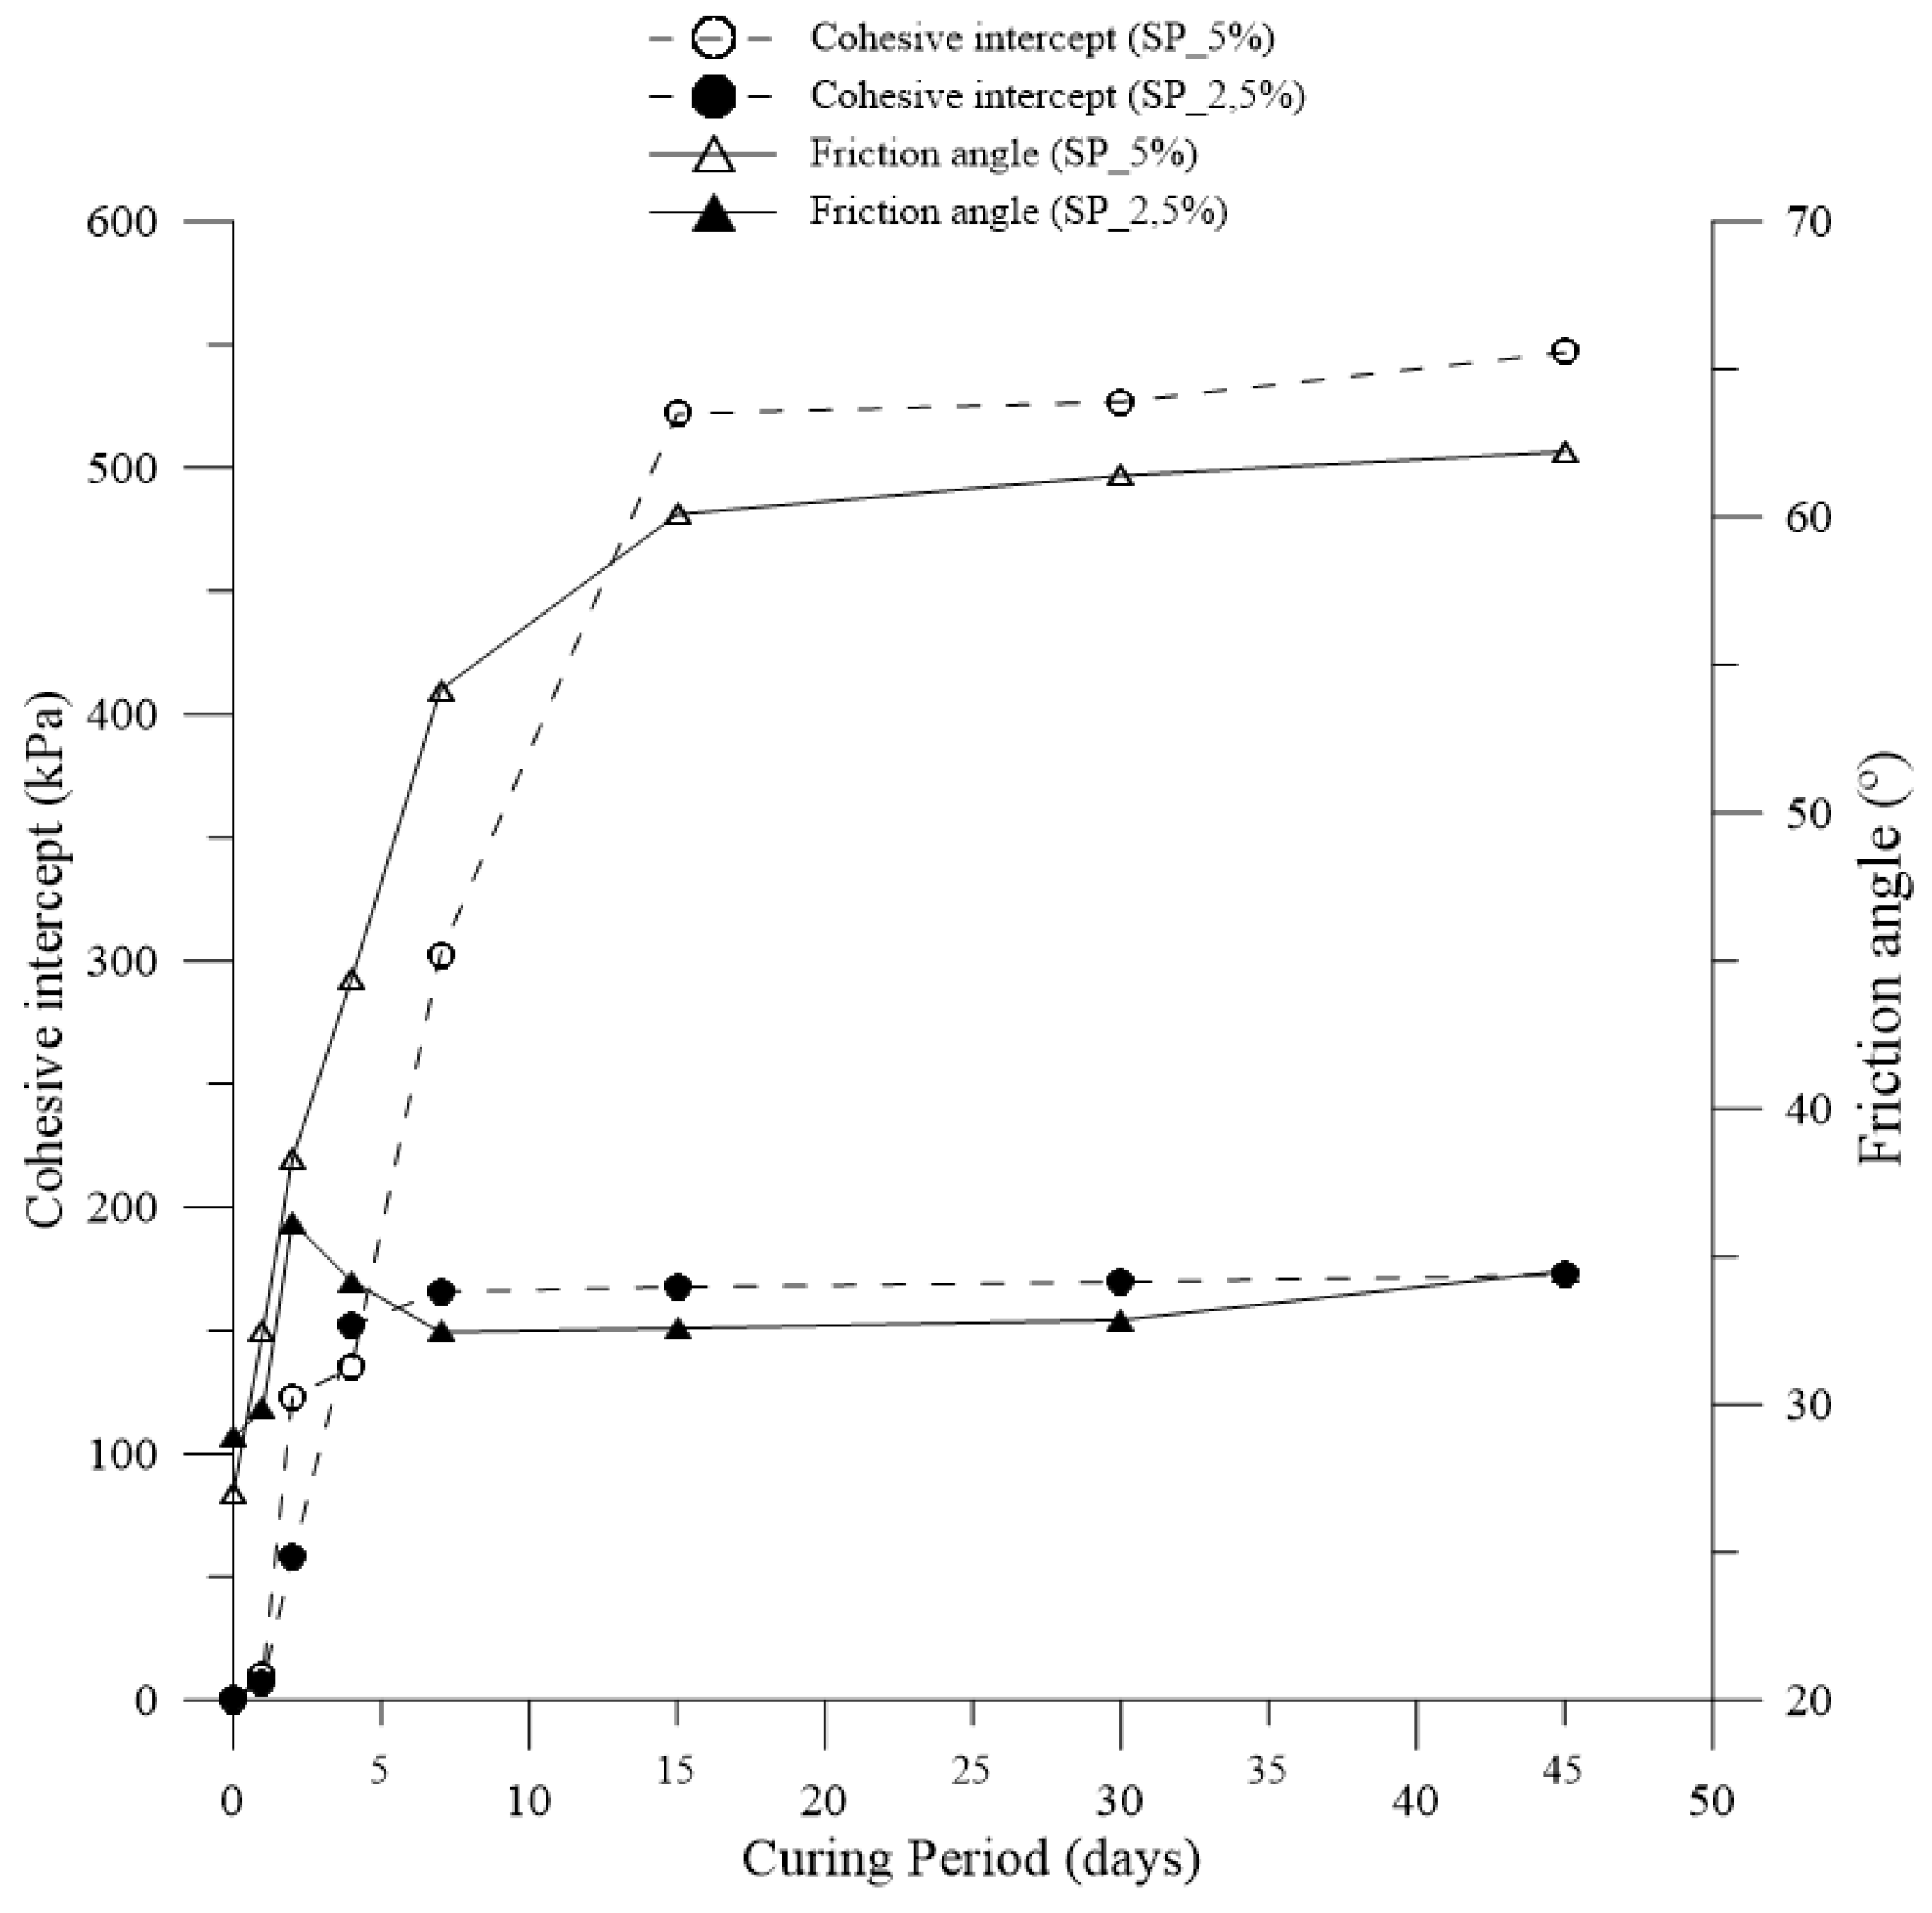


| Material | c’(kPa) | Φ’ (°) |
|---|---|---|
| Soil | 4.05 | 31.9 |
| SP_2.5%_0 | 1.06 | 28.9 |
| SP_2.5%_1 | 7.37 | 29.8 |
| SP_2.5%_2 | 57.81 | 36.2 |
| SP_2.5%_4 | 151.95 | 34.2 |
| SP_2.5%_7 | 165.70 | 32.4 |
| SP_2.5%_15 | 167.59 | 32.6 |
| SP_2.5%_30 | 169.67 | 32.9 |
| SP_2.5%_45 | 172.53 | 34.5 |
| Material | c’(kPa) | Φ’ (°) |
|---|---|---|
| Soil | 4.05 | 31.9 |
| SP_5%_0 | 0.00 | 27.0 |
| SP_5%_1 | 9.68 | 32.5 |
| SP_5%_2 | 123.12 | 38.3 |
| SP_5%_4 | 134.96 | 44.4 |
| SP_5%_7 | 302.48 | 54.2 |
| SP_5%_15 | 521.86 | 60.1 |
| SP_5%_30 | 526.72 | 61.4 |
| SP_5%_45 | 546.72 | 62.2 |
Disclaimer/Publisher’s Note: The statements, opinions and data contained in all publications are solely those of the individual author(s) and contributor(s) and not of MDPI and/or the editor(s). MDPI and/or the editor(s) disclaim responsibility for any injury to people or property resulting from any ideas, methods, instructions or products referred to in the content. |
© 2023 by the authors. Licensee MDPI, Basel, Switzerland. This article is an open access article distributed under the terms and conditions of the Creative Commons Attribution (CC BY) license (http://creativecommons.org/licenses/by/4.0/).


