Preprint
Article

A Robust Flexible Model for Satellite Equipment Layout Optimisation

Altmetrics

Downloads

111

Views

48

Comments

0

A peer-reviewed article of this preprint also exists.

Submitted:

30 October 2023

Posted:

31 October 2023

You are already at the latest version

Alerts
Abstract
The issue of equipment layout in multi-floor satellites consists of two primary parts: allocating the equipment to the satellite's layers and placing the equipment in each layer individually. In reviewing the past literature in this field, firstly, the issue of assigning equipment to layers is observed in a few articles and next in the layout part, the non-overlapping constraint has always been a challenge, particularly for components that do not have a circular cross-section. In addition to presenting a heuristic method for allocating equipment to different layers of the satellite, this article presents a robust flexible programming model (RFPM) for the placement of equipment at different layers, taking into account the inherent flexibility of the equipment in placement and the subject of uncertainty. This model is based on the existing uncertainty between the distances of cuboid equipment which has not been addressed in any of the previous research, and by comparing its outputs with cases from past studies, it demonstrates a significantly higher efficiency in placing the equipment and meeting the limit of non-overlapping constraints between the equipment. Finally, it would be possible to reduce the design time in the conceptual and preparatory stages, as well as the satellite's overall size, while still satisfying other constraints like stability and thermal limitations, moments of inertia and centre of gravity.
Keywords: 
Subject: Engineering  -   Aerospace Engineering

1. Introduction

In the system design phase of a satellite, layout design is the key step which determines whether the aggregation of functional components from different subsystems can operate normally and smoothly in the crucial space environment through its design lifespan or not.
The main aim of satellite layout design is to place the objects or equipment (called components) in the proper position and orientation to meet various engineering requirements or constraints (Zhang et al. 2008).
As the problem of component layout in a satellite occurs in a limited 3D space, the study of three-dimensional layout would help to investigate and find the best choices for satellite components layout. Another important criterion in satellite components layout is the multi-floor concept due to the space of the satellite containing different layers. Ahmadi et al. (2017) studied a comprehensive survey about multi-floor structure layouts and provided a complete overview of the models and solution methods applied for multi-floor facility layout problems.
One of the practical problems with satellite layout is to do with the measurement of the distance between pieces of equipment under uncertainty. This type of planning is related to epistemic uncertainty in which either the data is incomplete or the essence of the problem has an imprecise definition. Here the opinion of the decision maker (DM) is not involved and the uncertainty is related to the data of the problem. On the other hand, flexible programming is used where the constraints are soft and flexibility is considered on the final value of the objective function. Here, the DM has the flexibility to satisfy the constraints or the value of the objective function, and even though the data is certain, the DM can comment on the uncertainty of the information.
The uncertainty concept plays a significant role in determining the distances of cuboid equipment to solve the overlapping issue in satellite layout by applying flexible programming in determining the distances between equipment which is the major contribution of this article.
The rest of this article is structured as follows: A thorough analysis of earlier investigations is provided in Section 2. The multi-layer satellite equipment layout problem and related mathematical model are presented in Section 3. The solution approach for this integration optimization problem is presented in Section 4, which includes two steps of equipment allocation to bearing layers and then a thorough layout of each layer’s equipment.
The findings of the sensitivity analysis for case studies are presented in Section 5, along with a discussion. Finally, Section 6 presents the conclusions.

2. Literature Review

The works of Ferebee and Powers (1987) and Ferebee and Allen (1991) are probably the first use of numerical optimization methods for the layout of spacecraft equipment during the conceptual phase. Rocco et al. (2003) also presented a multi-objective optimization method for a set of satellites to minimize time-limited fuel consumption. A detailed study of approaches and solution algorithms for the arrangement of three-dimensional equipment was presented by Cagan et al. (2002). They showed that the use of CAD software for the arrangement of equipment, especially in the arrangement of electrical board parts, is very common, while the three-dimensional arrangement of this software is not very efficient and innovative and meta-innovative methods such as genetic algorithm and simulated annealing (SA) (Like the research of Jang (2008) who used the SA algorithm to investigate the location of three-dimensional equipment with unknown geometric shapes) have been used more in this field.
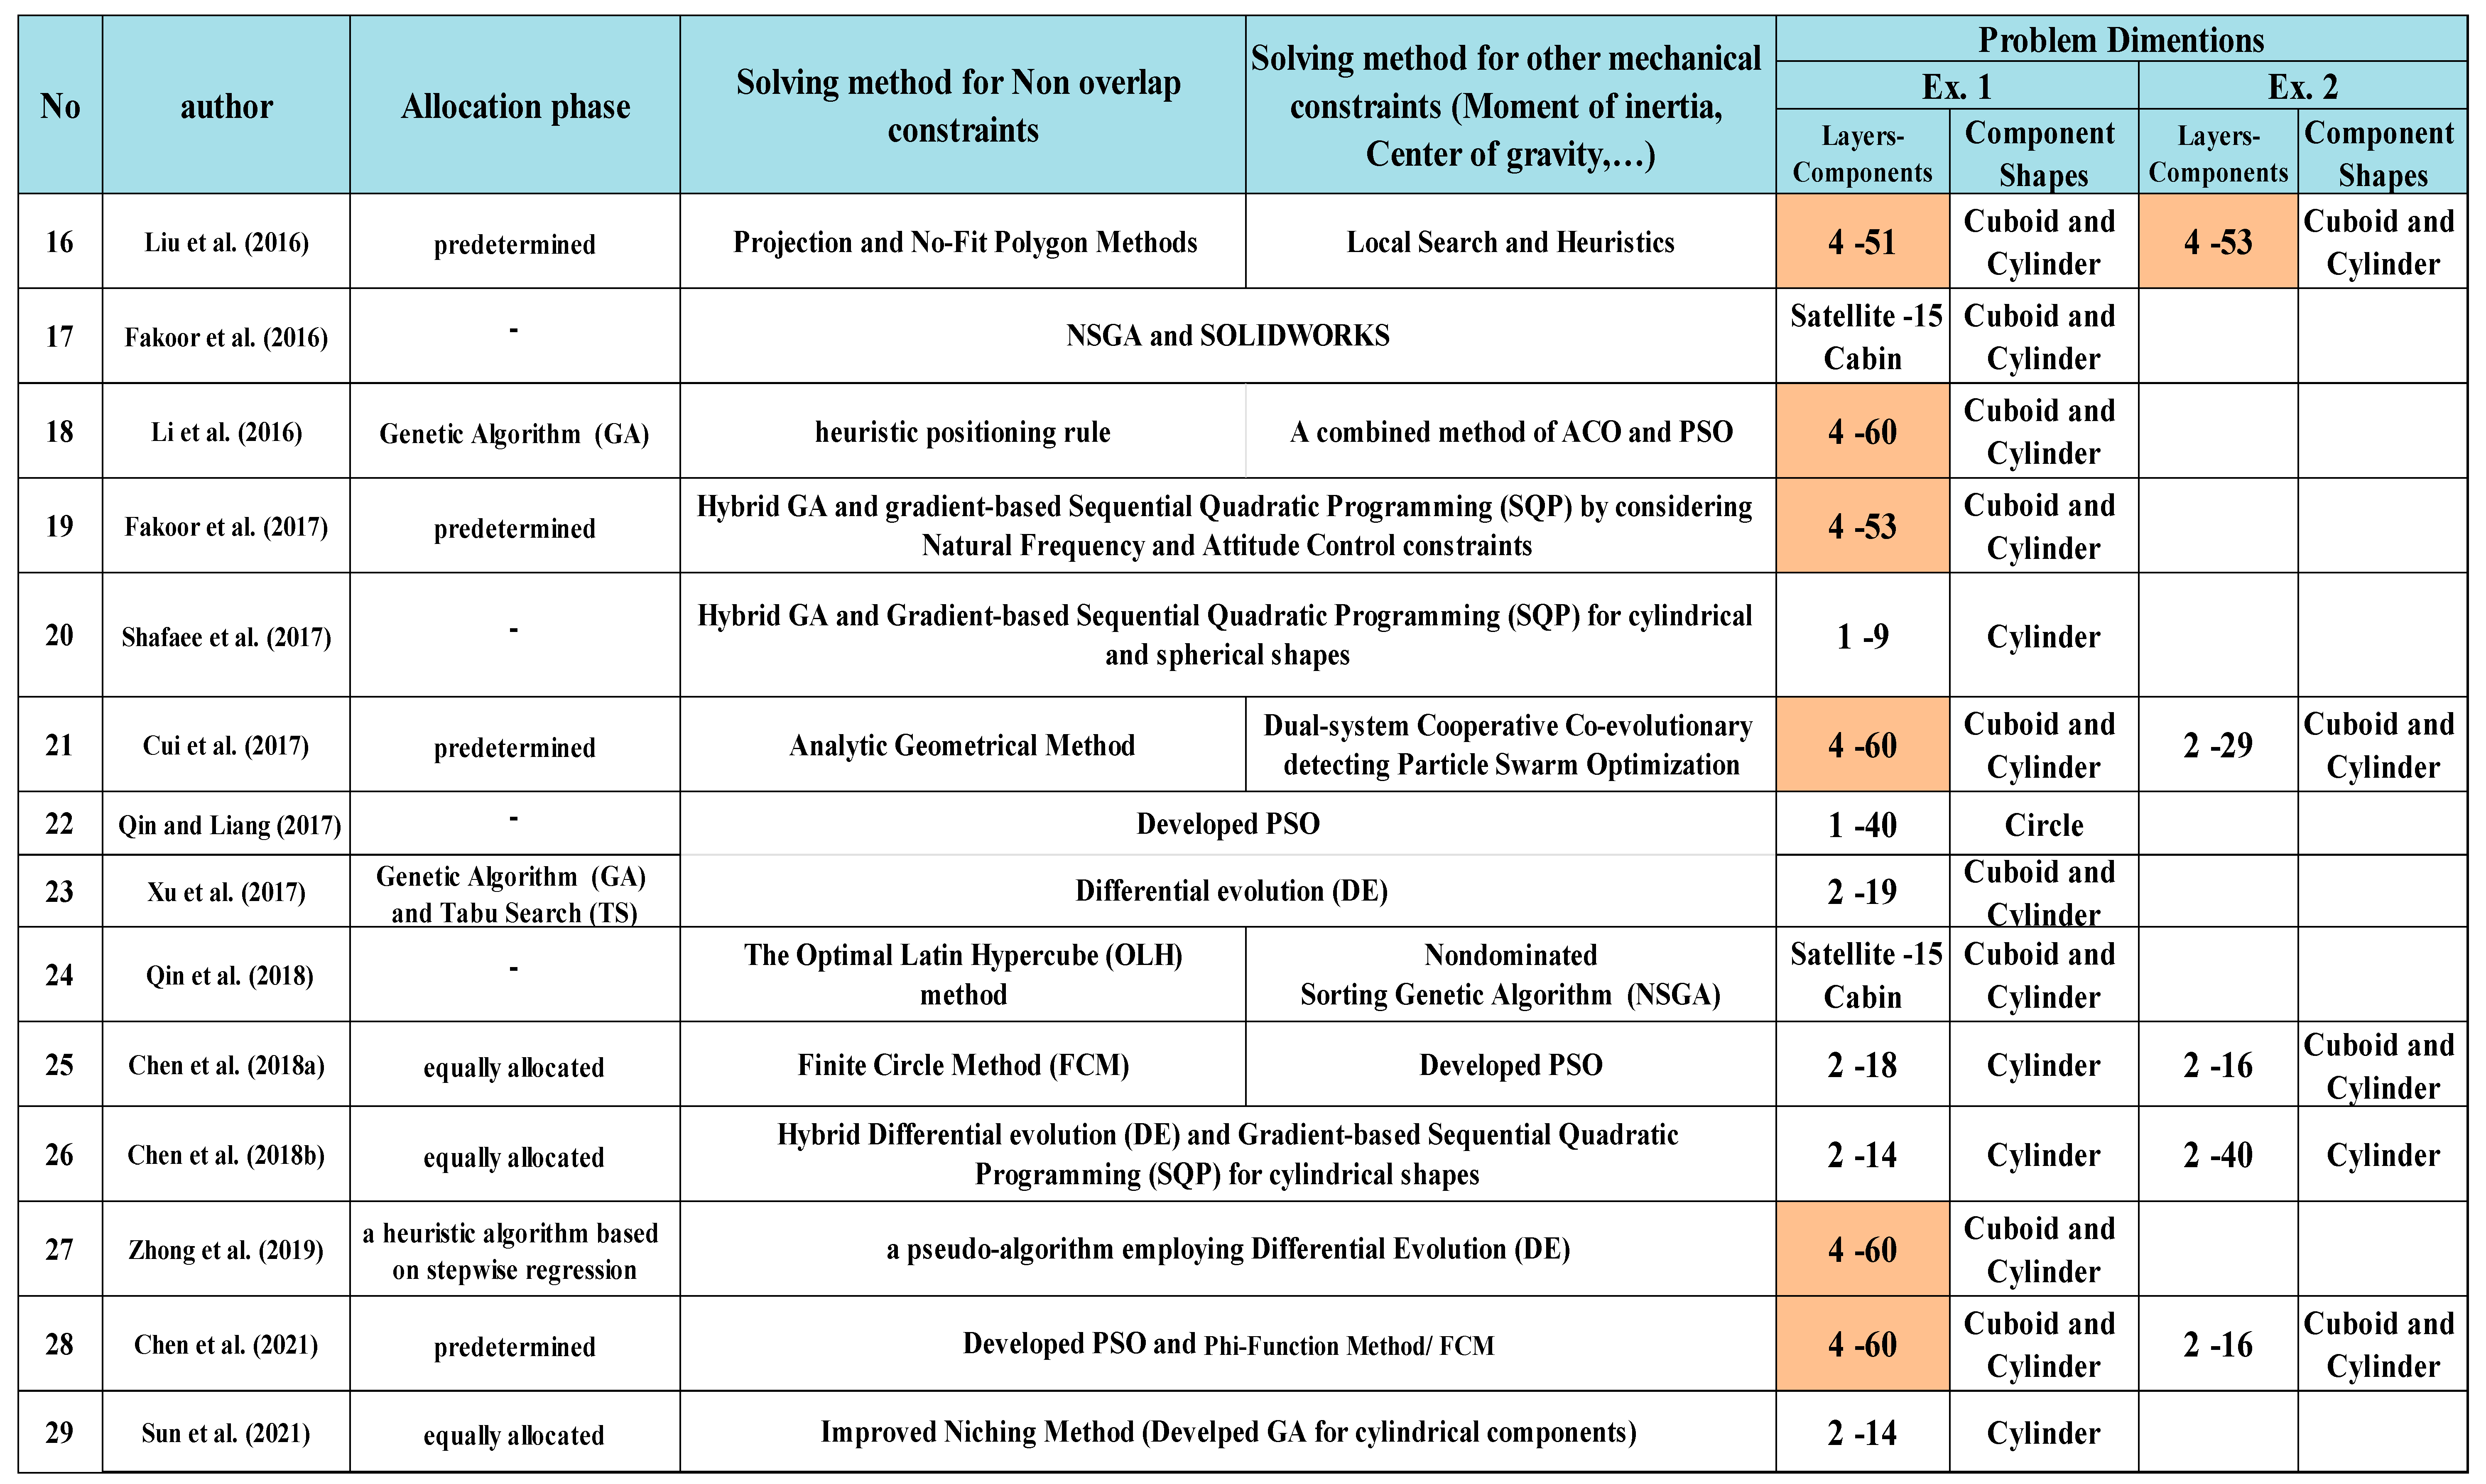
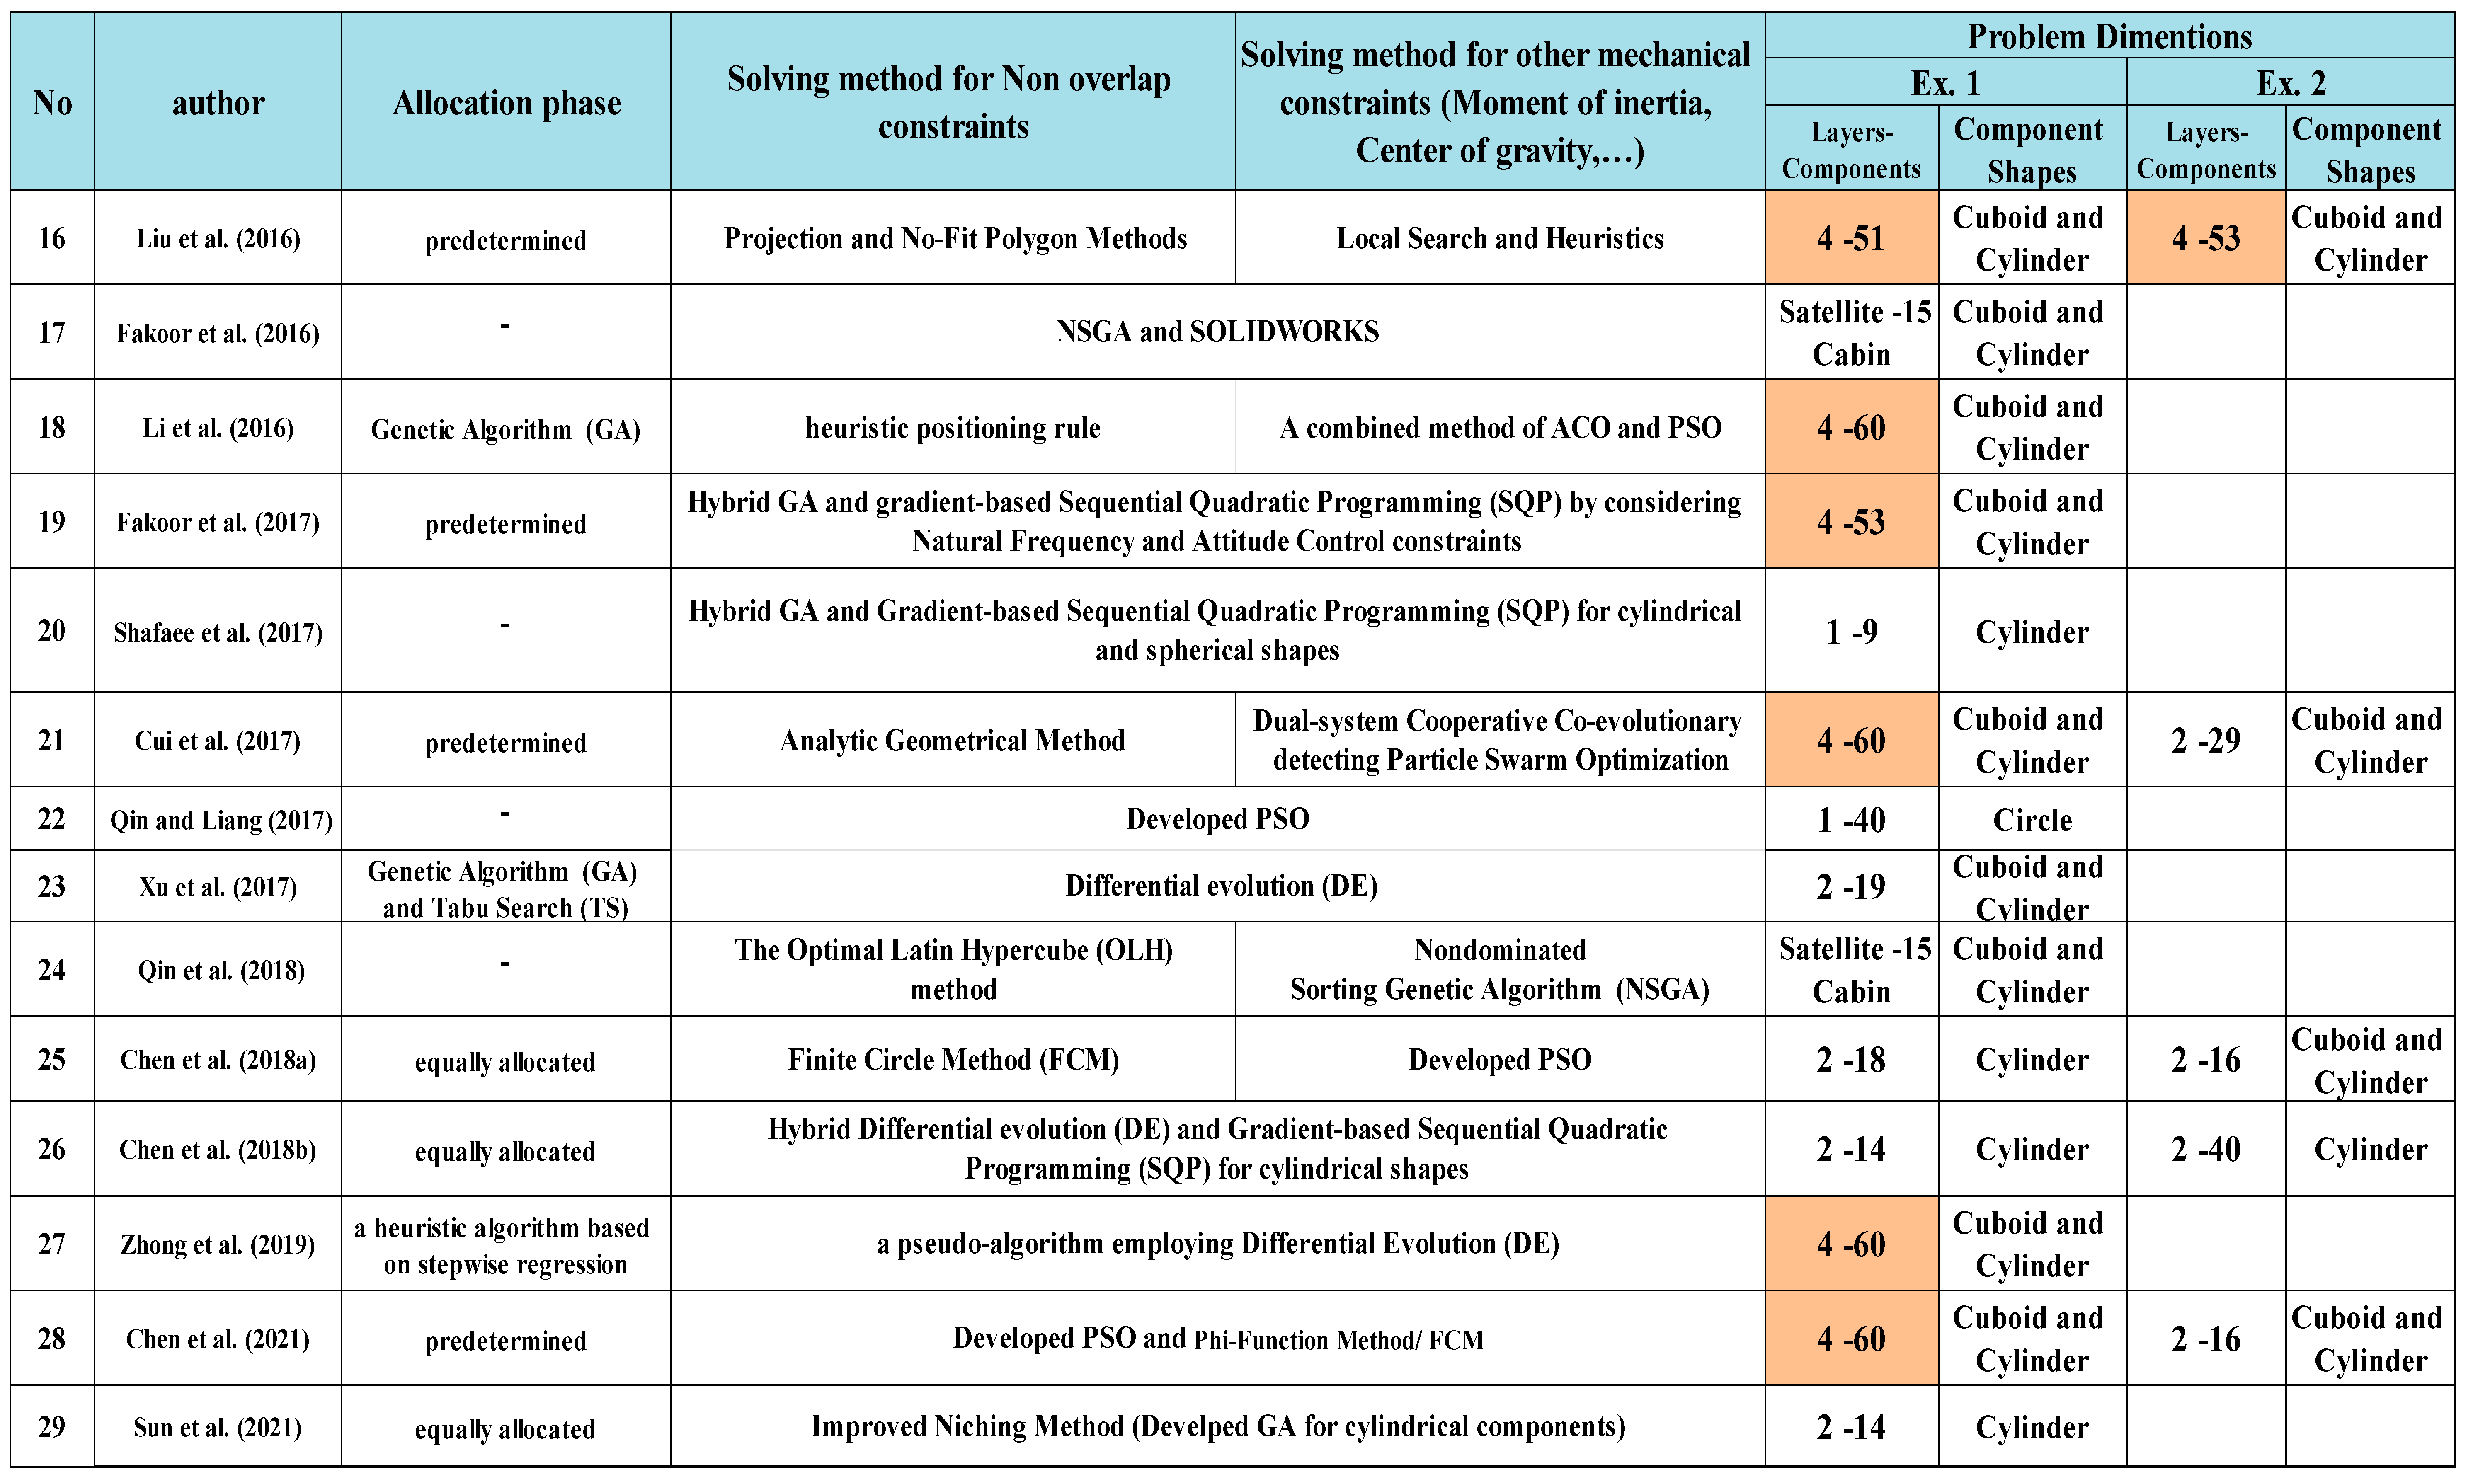
Published articles in the field of satellite layout are summarized in Table 1. In this table, the solution methods for allocating equipment to the carrier plates or locating the equipment on each plate are specified, and the dimensions of the problems mentioned by the articles as case studies or numerical examples can be observed in this table. As demonstrated in the table, there are only four articles discussing the allocation of equipment between carrier plates and the rest of the others have just considered the DM opinion or have used arrangement of previous articles.
In addition, regarding the dimensions of problem-solving, as illustrated in Table 1, only 11 articles have examined issues with the design of 4 carrier plates. Three papers by Zhang et al. (2013), Zhang et al. (2017a) and Zhang et al. (2017b) adapted the data from Zhang et al. (2008) to a multi-cabin satellite with 120 components and 8 layers, as opposed to the single-cabin satellite of the original article. These three articles that established the concept of docking two satellites are excluded from Table 1. In the remaining cases, the layout of the equipment is either described on a smaller number of plates or is located within the satellite’s cabin, with the latter being more suitable for cube-shaped satellites. In the subsequent, most of the research that has been published in the field of satellite equipment arrangement will be introduced.
One of the essential constraints in satellite layout is to consider all components not to be overlapped in all bearing plates named layers. One common method is based on integrating Computer-Aided Design (CAD) tools, engineering analysis packages and optimization algorithms. Coupling optimization algorithms with Computer Aided Design (CAD) and engineering analysis packages for finding the optimal layout of spacecraft equipment was proposed firstly by Pühlhofer and Baier (2003). After that this method has been applied in the study of Pühlhofer et al. (2004), Cuco (2011), Lau et al. (2014), Cuco et al. (2015), Fakoor et al. (2016), Qin et al. (2018).
The following are the most important articles in the field of satellite equipment arrangement that have presented various methods on the subject of non-overlapping.
For the first time, Teng et al. (2001) studied the arrangement of equipment on several satellite layers, and then they analyzed the 3-dimensional layout problem on a rotating vessel. Because of the spiral rotation movement of the vessel, they took into account dynamic equilibrium constraints and used heuristic algorithms represented by Albano and Sapuppo (1980) applied for non-convex polygons to determine the amount of overlap among objects.
Sun and Teng (2003) introduced a centripetal balancing heuristic algorithm to allocate objects between bearing plates. To distribute objects in a bearing plate, they applied a Genetic Algorithm (GA) to produce random populations and finally to reach a feasible (near-optimal) solution. Eventually, they developed an Ant Colony Optimization (ACO) method to tune the position of each object in detailed design within bearing surfaces.
Huo et al. (2007) developed a human-guided GA and compared the results with the GA library to demonstrate the priority of their algorithm for the 2-dimensional layout of objects in a satellite. They added artificial individuals to the population of GA to cope with overlapping volumes of components.
Liu and Teng (2008) presented a Human–Algorithm–Knowledge based on the support of GA to layout equipment in a satellite and applied CAD software for prior knowledge in their GA.
Zhang et al. (2008) developed a two-stage model for layout optimization of satellites. The first stage was about allocating objects to different bearing plates and the second one dealt with the detailed design of each bearing plate in which no overlapped was allowed. To reach an optimal layout in each bearing plate, they applied a combinatorial method including GA and Particle Swarm Optimization (PSO) metaheuristics. They explained that GA inherently is suitable for finding global convergence while PSO is a proper method for local convergence and the disadvantage of GA in local convergence was compensated by using PSO as a replacement of a random population in the initial phase of GA and the weakness of PSO in global converge was satisfied by using the best solution of GA as a replacement of the first population of PSO. To tackle the overlapping issue, they borrowed the concept of compaction and separation algorithm introduced by Li and Milenkovic (1995) who applied locality heuristics for star-shaped non-convex polygons.
Huo and Teng (2009) presented a co-evolutionary method in which a genetic algorithm (GA) was used to determine the rotation angle of the final layout scheme of equipment layout and a heuristic combination-rotation method was introduced to determine the entire layout scheme by reference to the rotation strategy of a heuristic constraint rubik cube method (CRCM).
Teng et al. (2010) proposed an evolutionary method called dual system variable grain algorithm to decompose the satellite layout system into several tractable and also to avoid premature convergence problems. In their model, they took into account the constraints of interference between objects, the centroid offset of the satellite system and constraints of inertia angles. They applied analytic geometry to handle discontinuous constraints related to overlapping volumes. Li et al. (2016) presented a three-step strategy for first distributing equipment throughout the layers of a satellite and then determining the location of each component inside its assigned layer. In the initial phase, each piece of equipment was assigned to one of the four bearing layers using a genetic algorithm (GA). In the second step, they suggested a heuristic positioning rule to address the challenge of satisfying overlapping constraints between circles and rectangles in the 2D scale precise design of equipment for each layer. In this step, an ACO algorithm and a heuristic adjustment approach are used to manage the detailed design of each layer’s equipment. Lastly, they presented a PSO algorithm to combine subproblems and attempt to minimize errors in the mass centre and moment of inertia while preserving the other components of the objective function. Liu et al. (2016) proposed a hybrid method based on local and heuristic search algorithms to find the optimal arrangement of satellite equipment. They calculated the amount of equipment overlap based on their geometric shape; In this way, if two devices were rectangular or one was rectangular and the other was circular, projection and no-fit polygon methods were used respectively. The second method is utilized for the non-overlapping of polyhedra, in which all possible placements of a polyhedron concerning others are illustrated, and the topic of overlapping between two polyhedra is relegated to overlapping between a polyhedron and a vector which is more computationally efficient. Cui et al. (2017) represented a new dual algorithm in which the combination of detecting PSO and a cooperative co-evolution method was applied in a multi-layer satellite. Similar to Teng et al. (2010), analytic geometry was the method they proposed to deal with the overlapping problem among components. Xu et al. (2017) presented an integrated method for satellite equipment assignment and layout. They used GA and Tabu Search (TS) to reassign equipment before attempting to lay out 19 components and 2 layers using the Differential Evolution (DE) method. Zhong et al. (2019) stated that the assignment of satellite equipment can be achieved based on Multiple Bin Packing Problem research (MBPP). They offered a method based on stepwise regression to assign equipment, and after comparing assignment schemes, the optimal one was chosen as the beginning input for the layout phase, which was solved by a pseudo-algorithm employing DE and random mutation operation. Chen et al. (2021) evaluated the overlap between equipment in the satellite’s centre planes utilizing the method given in the paper by Chernov et al. (2012) and the phi-function method. For two components, if the value of the Phi-Function is positive, the two components will not overlap, if the value of the function is zero, they are tangent to each other, and if it is negative, they intersect. They showed that unlike most of the research done in this field, they also considered the interaction between the equipment. They researched 5 numerical examples of different satellites; The first example involved six equilateral triangles in a circular enclosure, the second example involved resolving the overlapping problem between two diagonally placed rectangles, the third example was for cylindrical satellites, the fourth example was for nano satellites, and the final example was also investigated to fix the overlap of parts in cube-shaped satellites. They solved the third and fifth instances using an adaptive PSO approach and the fourth example using the Finite Circle Method (FCM), all of which were developed by Chen et al (2018a). Finally, the existing limitations in the use of this method were also addressed and it was shown that due to the use of geometric non-linear and non-convex restrictions, the proposed model does not provide a correct answer for some conditions and it is necessary that in the future Efficient and effective algorithms should be produced to solve this problem.
In the field of uncertainty, Galbraith J.R. (1973) defined uncertainty as the difference between the amount of information needed and the amount of available information to perform a task. The uncertainty related to decision-making occurs in the conditions of incomplete information. Mula et al. (2007) divided the discussion of uncertainty as flexibility in limitations and different levels of acceptability of goals and uncertainty in input data; In this way, the flexibility in the constraints includes the decision maker’s preferences. Klibi et al. (2010) divided decision-making conditions into two groups according to the quality of available information: decision-making under conditions of certainty (when information is fully available) and decision-making under conditions of uncertainty (when information is incomplete). Pishvaee and Fazli (2016) indicated that developments in robust optimization occurred in three historical waves. The first wave begun by Mulvey et al. (1995) was about robust optimization related to a scenario-based stochastic planning approach. After that, Yu and Li (2000) and Leung et al. (2007) developed this approach. The second wave, known as robust convex programming, was first introduced by Ben-Tal and Nemirovski (1998, 2000) and El-Ghaoui et al. (1998). The cone programming method is used to solve convex problems due to existing complexities, which is done according to duality theorems and optimality conditions for solving convex problems. The third wave by Pishvaee et al. (2012) presented different approaches to robust planning. They demonstrated that robust fuzzy mathematical programming (RFMP) is divided into two parts: possibilistic programming and flexible programming.
As the literature analysis demonstrates, there are two fundamental aspects to the satellite layout issue. First, there is the issue of component distribution across different bearing layers, and second, there is the problem of cuboid component overlapping. As a result, this paper addresses both problems: we offer a heuristic solution for the assignment problem and then the RFMP to evolve the distance between cuboid components. In conclusion, the main issue to be investigated in this study is how to deal with the component assignment problem along with the growing number of bearing layers and components and the complexity of technical requirements of the satellite layout problem.
In the next Section, the mathematical modelling of a satellite component layout is described completely.

3. Problem Statement

Conceptual design, preliminary design, and detailed design are the three basic stages of satellite design. One of the fundamental subjects in the detailed design phase is layout design which raises the issue of whether the integration of operational components from various subsystems can function properly and effectively in a unique environment, such as a space that is constantly exposed to cosmic rays.
The major goal of designing satellite equipment is to optimize a satellite’s stability, control, and dimensions which results in a reduction in the size and weight of the satellite, so this optimization can have a direct impact on the satellite’s successful launch as well as its continuity and durability in space.
Numerous factors, such as size, stability, and optimum system performance, contribute to the best satellite layout and result in more variables and limitations. This intricacy emphasizes the need for industrial engineering optimization solution approaches rather than the typical try-and-error methods used in mechanical engineering in this subject.
The challenge of placing many pieces of equipment in a cylinder, cube, or polygonal volume on different floors to deploy multiple distinct plates within the satellite is known as the problem of optimizing telecommunication and measurement satellite equipment.
The layout optimization problem of a communication satellite module can be described as follows.
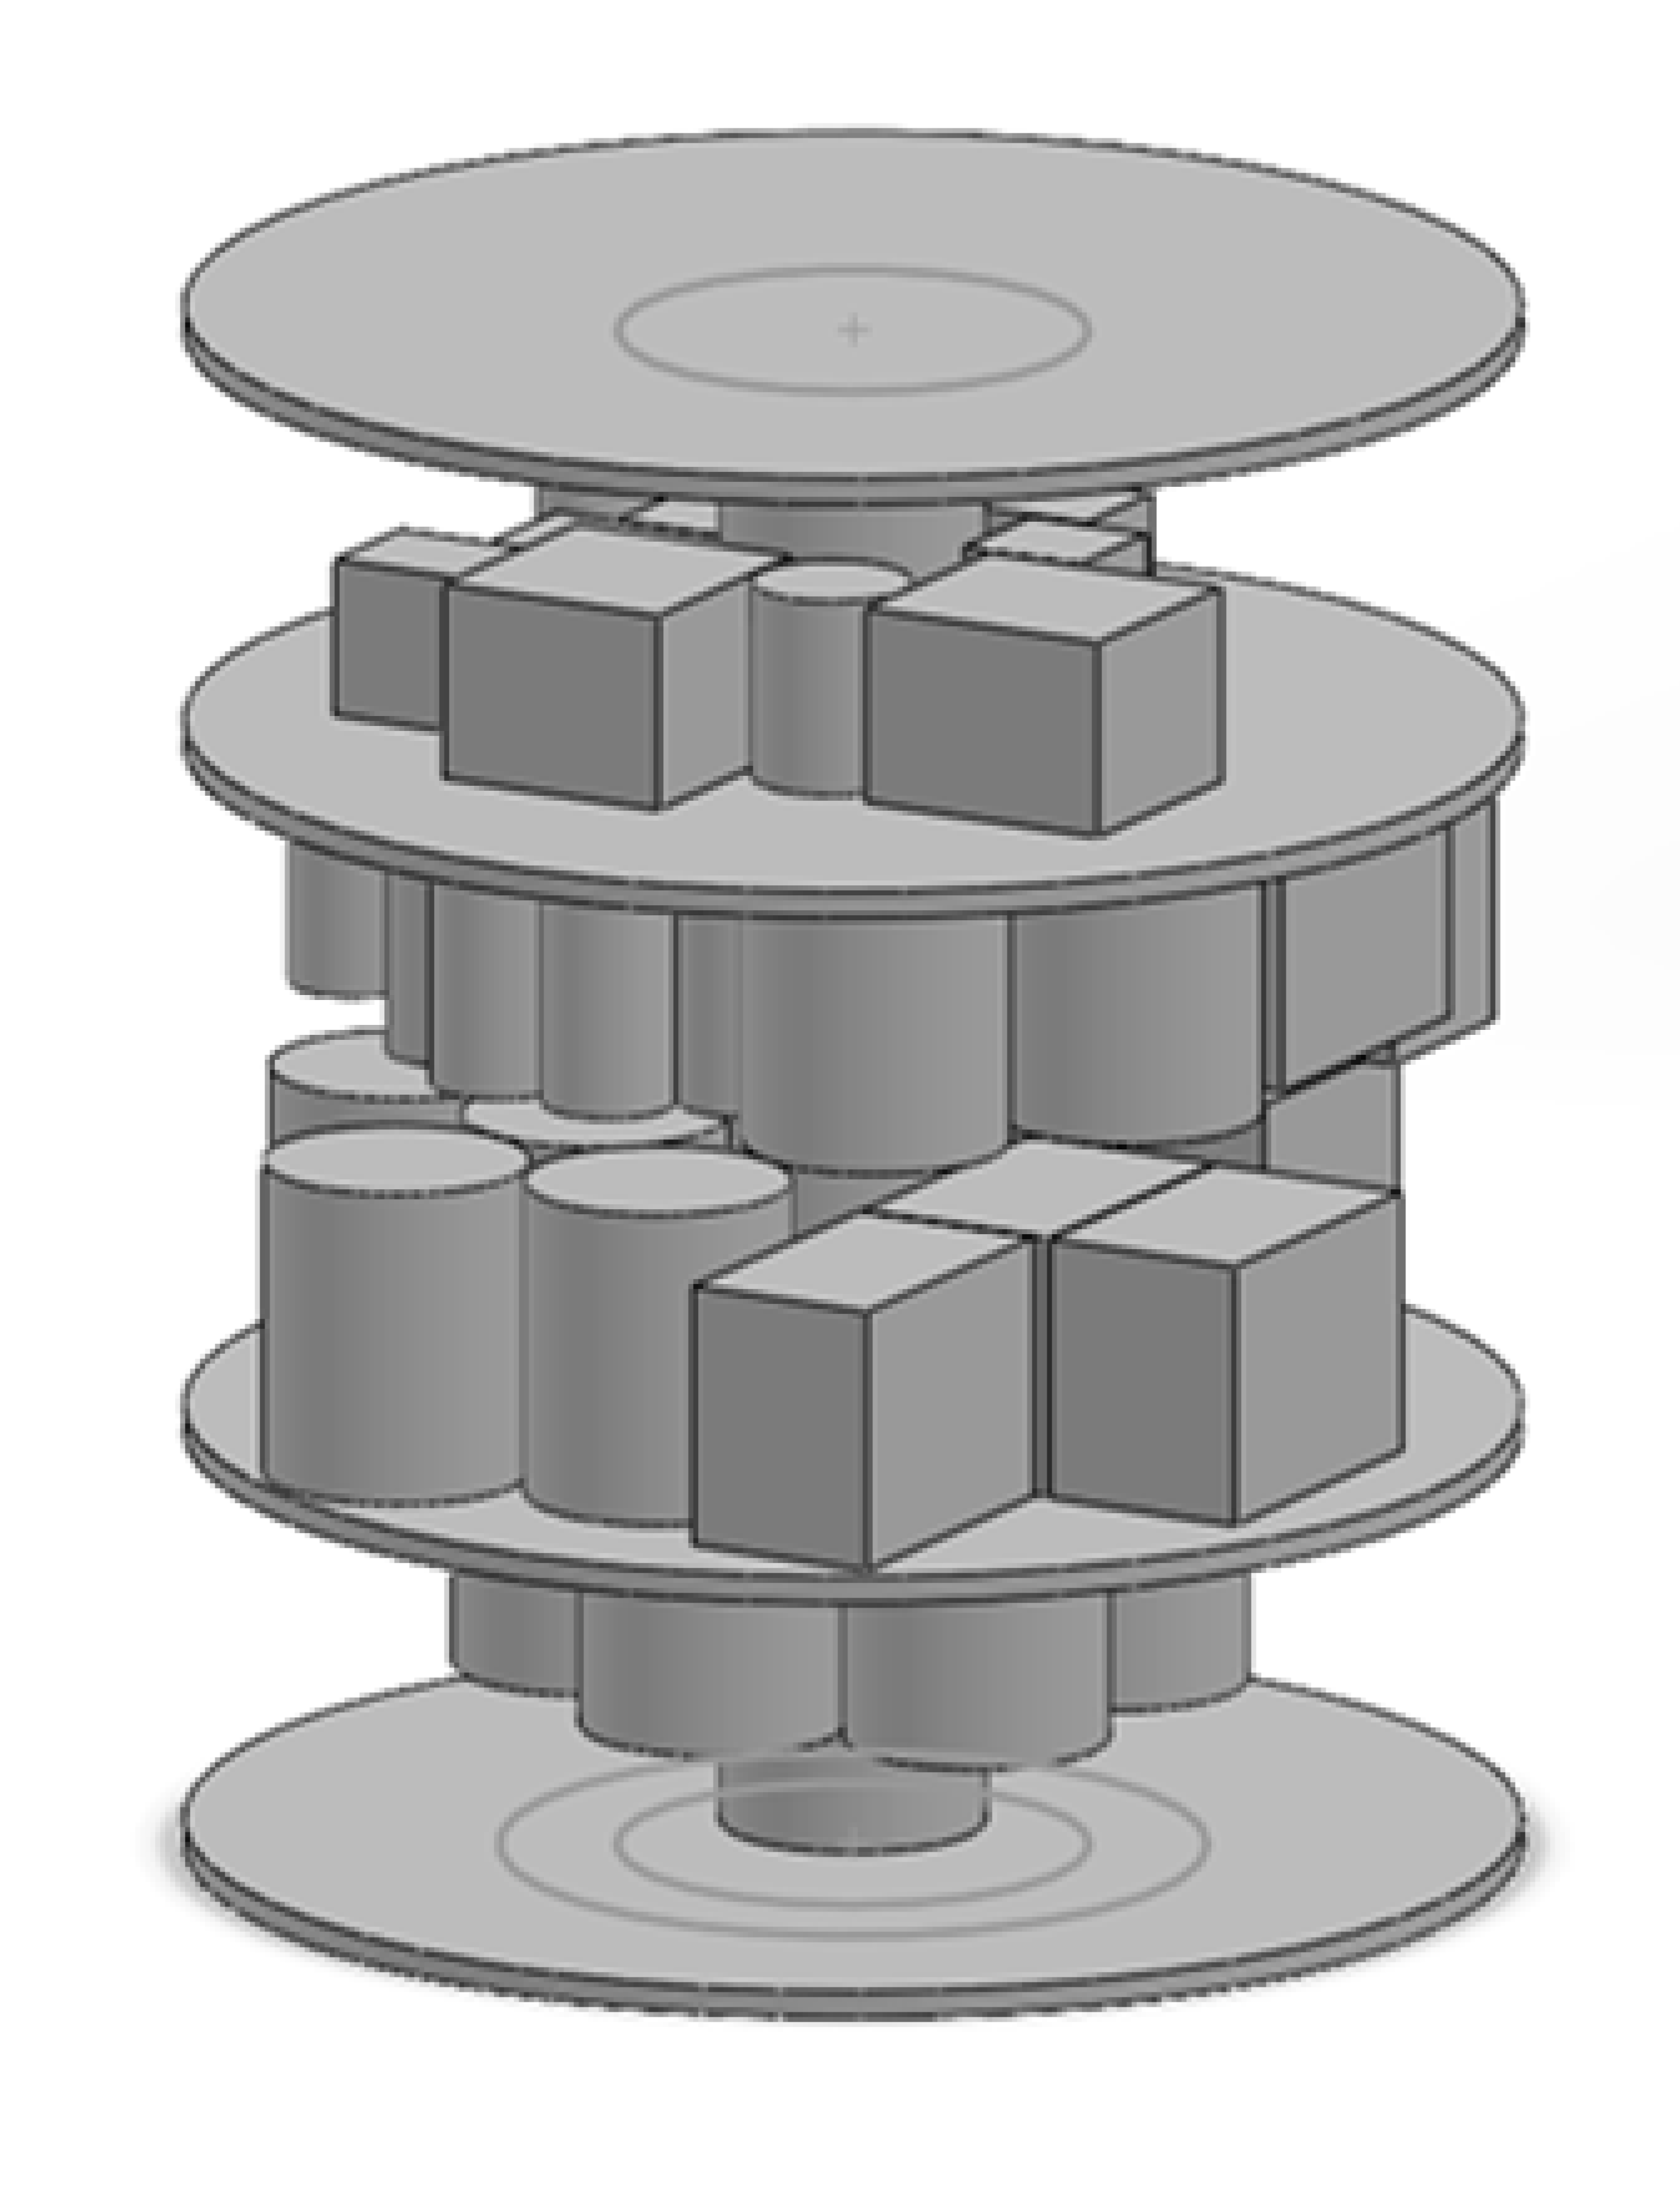
A total number of n components will be located in a cylindrical satellite module with two floors. Four plates including the upper and lower and two middle plates of the inner space of the satellite attached to a standing column in the module are used to hold all the components, and in this proposed methodology, all the components are simplified as cylindrical and cubic shapes and regarded as rigid bodies with uniform mass allocation.
There is an even distribution of mass across every piece of equipment, which is in the shape of a cube or cylinder.
An extensive analysis of the influencing factors, such as distance constraints, heat constraints, radiation constraints, functional constraints, and stability, is crucial because the goal of this paper is to optimize the interior space of the satellite and ultimately reduce its dimensions and weight. The problem becomes more complex after a full analysis of these constraints, necessitating the employment of specialized optimization software. Therefore, the ultimate objective is to provide an optimization model and its output with the aid of software so that manufacturing units can optimally use the placement of equipment to build satellites with smaller dimensions and weights.
The objective is to reduce the satellite’s size and weight while still maintaining stability, taking into account the major inertia moments, cross-inertia moments, and centre of gravity, as well as distance, heat, and radiation limits.
The problem of equipment placement is NP-hard because of the engineering and mechanical complexity of satellites. This calls for the combination of numerous intricate and specialized limitations in addition to the design of a sophisticated system.
The objective function in this problem is multi-objective and in addition to taking into account the non-overlap between the equipment, it must also include all functional and equilibrium constraints. This is because to solve the model, the constraints of the weight coefficient problem are taken and added to the objective function.
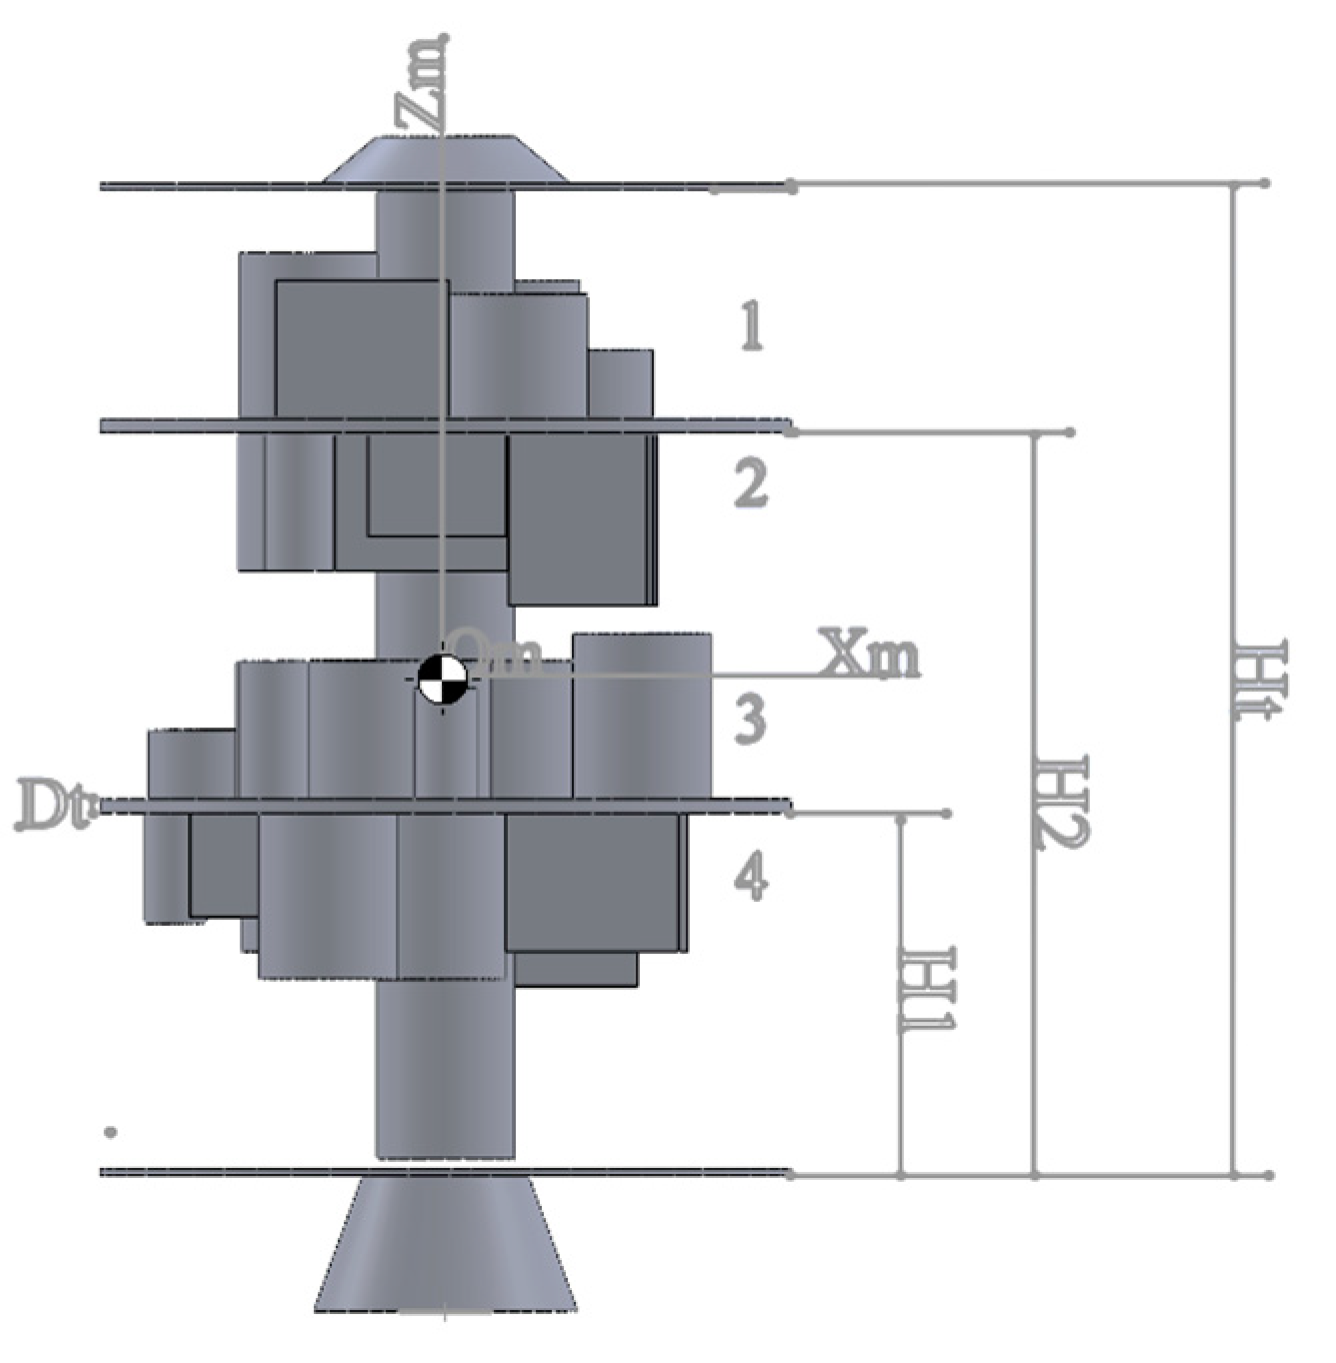
An example of a satellite with two centre plcentrend 4 layers on which the equipment is located is shown in Figure 1.
The assumptions of the model are as follows:
Three-dimensional layout: The difficulty of placing satellite equipment occurs in three dimensions so the Z axis is considered as a main part.
Multi-layer layout: The idea of multi-layer by the various layers of satellite space is another crucial consideration in the installation of satellite equipment. Because of this, the model must allocate equipment to plates or layers.
Non-interference and overlap constraints: No interference occurs between any pieces of components.
Equilibrium constraint: Namely equilibrium error of the system should be as small as possible.
Thermal constraints: The performance of electronic components may be directly impacted by the thermal environment. As a result, system equipment is generally more efficient and reliable when heat flow is distributed uniformly.
From a thermal point of view, each equipment has an effective area which can affect the performance of other equipment; Therefore, reducing the interaction space is equal to improving the uniform state of the thermal field in the satellite. To calculate the thermal effects of equipment, it is assumed that some components produce a thermal radius that uniformly forms a circle around the equipment. For this reason, no intersection between virtual thermal radii between equipment is allowed.
Obnoxious equipment limitations: Another constraint must be taken into account for some equipment with a high amount of heat radiation, or “hot parts,” such as batteries, radio transmitters, and photo transmitters that must be positioned as distant from one another as possible in the satellite space. In other words, there needs to be a modest bit of this hot equipment on each floor of the satellite.
Static stability constraint: Namely centre of gravity offset of the system should be as small as possible.
The stability limit of the satellite should be such that the device can move and rotate easily in space; Therefore, the sum of the inertia moments of the system should be at its minimum. Minimizing the sum of moments of inertia physically means that the satellite inherently tends to be stable, and this minimization can reduce the effort to stabilize the satellite by subsystems, resulting in moments of inertia including the axes of the main axis and impact or cross moments must be at a minimum.
System uncertainty: There is no fixed value for equipment that should be spaced apart, so it is important to use uncertainty to determine this distance. As mentioned in the previous section, uncertainties are included in the model for a variety of reasons one of them is uncertainty in the view of the decision maker (DM). In the design of satellite equipment layout, it is not easy to apply non-overlap constraints for cube-shaped equipment having a rectangular cross-section in the way that it has been used for cylindrical equipment having a circular cross-section; Because for two circular equipment, the overlap of the them can be easily prevented by calculating the radius and entering the distance between the two radii. On the other hand, for two pieces of equipment with a rectangular cross-section or two pieces of equipment, one circular and the other rectangular, the non-overlap restriction will not be observed easily. For this reason, the uncertainty argument is easily applicable and is very effective in solving the model.
Due to the nature of the problem, the concept of fuzzy is also used here, so that the constraints related to equipment distances are written in fuzzy form. By adding fuzzy constraints, a decision variable (α) is defined in the model and added to the objective function with a penalty coefficient (γ).

3.1. Model Development

3.1.1. Model Parameters

The model parameters are introduced as follows:
i: Indicator of the number of equipment
j: Index of the number of layers (j = 1,2,3,4)
l j : layer j of the satellite
a i : The cross-sectional length of the cuboid equipment i
b i : The cross-sectional width of the cuboid equipment i
r i : radius of the cross-sectional area of ​​the cylindrical equipment i
h i : The height of the equipment i
m i : The mass of equipment i
θ i : The angle between the positive direction of the x-axis and the horizontal edge of the cuboid equipment i
c: Number of cuboid equipment
n: total number of equipment
n j : The number of equipment located at layer j
s M i : A segment of the radius of the hypothetical circumferential circle of a cross-section of cuboid equipment i
s O i : Optimistic value of a triangular fuzzy number for s M i
s P i : Pessimistic value of a triangular fuzzy number for s M i
s T i ~ : A triangular fuzzy number for s M i
γ : The cost of the fine for each unit of violation of the soft limit
x e : Expected coordinates in the direction of the x-axis of the satellite’s centre of gravity
y e : Expected coordinates in the y-axis direction of the satellite’s centre of gravity
z e : Expected coordinates in the direction of the z-axis of the satellite’s centre of gravity
Jxi: Moment of inertia of equipment in the direction of the x-axis
Jyi: Moment of inertia of equipment in the direction of the y-axis
Jzi: Moment of inertia of equipment in the direction of the z-axis
δ x e : Permissible error for deviating the coordinates of the real centre of gravity of the satellite from the expected value in the direction of the x-axis
δ y e : ​​Permissible error for deviating the coordinates of the real centre of gravity of the satellite from the expected value in the direction of the y-axis
δ z e : Permissible error for deviating the coordinates of the real centre of gravity of the satellite from the expected value in the direction of the z-axis
δ θ x : Permissible error for deviating the angle between the mass moment of inertia of the satellite in the direction of the x-axis with the axis of the coordinate of the satellite in the direction of the ox axis
δ θ y : Permissible error for deviating the angle between the mass moment of inertia of the satellite in the direction of the y-axis and the axis of the satellite coordinates in the direction of the oy axis
δ θ z : Permissible error for deviating the angle between the mass moment of inertia of the satellite in the direction of the z-axis with the coordinate axis of the satellite in the direction of the z-axis

3.1.2. Decision Variables of the Model

The model decision variables are as follows:
x i : The coordinates of the i equipment in the direction of the x-axis
y i : The coordinates of the i equipment in the direction of the y-axis
z i : The coordinates of the i equipment in the direction of the z-axis
x m : coordinates of the centre of gravity of the satellite in the direction of the x-axis
y m : The coordinates of the centre of gravity of the satellite in the direction of the y-axis
z m : coordinates of the centre of gravity of the satellite in the direction of the z-axis
θ x : The angle between the mass moment of inertia of the satellite in the direction of the x-axis and the axis of the satellite coordinates in the direction of the x-axis
θ y : The angle between the mass moment of inertia of the satellite in the direction of the y-axis and the coordinate axis of the satellite in the direction of the y-axis
θ z : Angle between the mass moment of inertia of the satellite in the direction of the z-axis with the axis of coordinates of the satellite in the direction of the axis oz
I x x : The mass moment of inertia of the satellite in the direction of the x-axis
I y y : The mass moment of inertia of the satellite in the direction of the y-axis
I z z : The mass moment of inertia of the satellite in the direction of the z-axis
I x y : Product moment of inertia to calculate satellite imbalance in the direction of the x and y plane
I x z : Product moment of inertia to calculate satellite imbalance in the x and z plane directions
I y z : Product moment of inertia to calculate satellite imbalance in the y and z plane directions
f r i : The final radius of the i equipment after performing the uncertainty calculations
α i : The minimum level of satisfaction in flexible constraints
There are three types of coordinate systems:
1. Oxyz reference coordinate system
O: The centre of this coordinate system is located on the geometric centre of the lower crust of the satellite.
z: The longitudinal symmetric axis of the satellite which is positive in the upward direction.
x: The axis perpendicular to the z-axis on the lower crust of the satellite
y: The axis perpendicular to the z-axis on the lower crust of the satellite and at a 90-degree angle to the x-axis
This coordinate system is used to find the centre of the satellite and determine the layout of the equipment.
2- Satellite coordinate system O ' x ' y ' z '
O ' : The centre of this coordinate system is located on the real centre of gravity of the satellite.
z ' : is the longitudinal symmetric axis of the satellite that coincides with or parallel to the z-axis.
x ' , y ' : These two axes are parallel to the x and y axes, respectively.
This coordinate system is used to calculate the mass and product moment of inertia of the satellite.
3- The local coordinate system of the equipment O x y z
O : The centre of this coordinate system is located on the centre of gravity of the equipment.
z : is the longitudinal symmetric axis of the equipment which is parallel to the z-axis.
x , y : These two axes form an angle αi parallel to the x and y-axes, respectively.
This coordinate system is used to calculate the moment of inertia of the equipment according to its axis.

3.1.3. Optimization Model

Minimizing the sum of the moments of inertia physically suggests that the satellite is inherently stable. This means that minimizing the sum of the moments of inertia can reduce the efforts of the attitude control subsystem in the stabilization of the satellite.
The moments of inertia of both cubic and cylindrical components are calculated in the xyz direction. The total moments of inertia of all the components which need to be minimized can be expressed as follows:
Min   f ( X ) = I x x + I y y + I z z
The constraints are as below:
Non-overlap constraint:
s.t.
g 1 X = x i x j 2 y i y j 2 + ( r i + r j ) 2 0      for   i , j   L k      k = 1 , 2 , 3 , 4
Static stability constraint:
g 2 X = x m x e δ x e 0
g 3 X = y m y e δ y e 0
g 4 X = z m z e δ z e 0
where xe, ye, ze are the expected centroid position of the satellite and δ x e , δ y e , δ z e are the allowance errors of xm, ym, zm (real centroid position of the satellite) respectively.
Equilibrium constraints:
g 5 X = θ x θ e δ θ x 0
g 6 X = θ y θ e δ θ y 0
g 7 X = θ z θ e δ θ z 0
where θ x , θ y , θ z are angles between the principal axes of inertia of the satellite with the principle axes oz, oy and oz and δ θ x , δ θ y , δ θ z are their allowance errors.
The objective function (1) shows the minimization of mass moments of inertia in the main directions of the coordinate axis. Constraint (2) represents the constraint of non-overlapping between equipment by requiring that the distance between the centres of two pieces of equipment be equal to or larger than the sum of their two radii. For cuboid equipment, the radius of the circumferential circle of the rectangular cross-section is considered as the radius.
Constraints (3) to (5) show static stability where xe, ye, ze coordinates of the expected centre of gravity of the satellite and δ x e , δ y e , δ z e are permissible error for the coordinates of the actual centre of gravity of the satellite (xm, ym, zm). The deviation of the centre of gravity of the satellite after the placement of all equipment should not be greater than the expected centre of gravity of the satellite in the middle of it. Constraints (6) to (8) are equilibrium constraints in which θ x   . θ y , θ z are the angles between the directions of the mass moments of inertial of the satellite with the major axes O x . O y . O z and δ θ x . δ θ y , δ θ z are their allowable errors. The following shows how to calculate θ x , θ y   . θ z .
The centre of mass of the ith component in the local xyz coordinate system can be stated as shown below:
x m = i = 1 n m i x i i = 0 n m i
y m = i = 1 n m i y i i = 0 n m i
z m = i = 1 n m i z i i = 0 n m i
where ( x i . y i . z i ) and m i are the coordinates of the centre and the mass of the equipment i, respectively. The reason that in the denominator of these equations, the sum starts from zero is that in addition to the number of equipment (n) the mass of the shell, the middle cylinder and the floors must also be taken into account in calculating the true centre of gravity of the satellite.
The computational formulas of moments of inertia in the main directions of the satellite coordinate axis are as follows:
I x x = i = 1 n . ( J xi   c o s   2 θ i + J yi   s i n   2 θ i ) + i = 1 n . m i   ( y i 2 + z i 2 ) - i = 0 n . m i   ( y m 2 + z m 2 ) = i = 1 c . ( 1 12 ( m i   ( b i 2 + h i 2 )   cos 2 θ i + 1 12 m i   ( a i 2 + h i 2 ) sin 2 θ i ) + i = c + 1 n . 1 12 m i   ( 3 r i 2 + h i 2 ) + i = 1 n . ( m i   ( y i 2 + z i 2 ) - i = 0 n .   ( m i   ( y m 2 + z m 2 )
where Jxi and Jyi are moments of inertia of the ith component concerning the local coordinate system (to the x and y axis respectively). ai and bi are the length and width of a cubic component respectively and hi and ri are the height and radius of the ith component (for both cubic and cylindrical shape components). Similarly, the derivations of moments of inertia in the y direction of both cylindrical and cubic components are shown below:
I y y = i = 1 c . [ ( 1 12 ( m i   ( a i 2 + h i 2 )   c o s   2 θ i + 1 12 m i   ( b i 2 + h i 2 )   s i n   2 θ i ) + i = c + 1 n . 1 12 m i ( 3 r i 2 + h i 2 ) + i = 1 n . ( m i   ( x i 2 + z i 2 ) - i = 0 n .   ( m i ( x m 2 + z m 2 )
Similarly, the derivations of moments of inertia in the z direction of both cylindrical and cubic components are illustrated below:
I z z = J z i + i = 1 n . ( m i   ( x i 2 + y i 2 ) - i = 0 n . ( m i   ( x m 2 + y m 2 )
α i : this parameter is the placement angle of the cubic object, it equals the included angle between the positive direction axis x and the long edge of the cubic component. Here, it is assumed that the cubic equipment only rotates 90 degrees, so the only possible values for this parameter are zero or 90.
The formula of θ x , θ y , θ z are as below:
  θ x ( x ) = arctan 2 I x y I x x I x y 2
θ y ( x ) = arctan 2 I x z I x z I x x 2
θ z ( x ) = arctan 2 I y z I x z I x y 2
Where Ixy, Ixz and Iyz are the products of moments of inertia in the x–y, x-z and y-z planes respectively for both cylindrical and cubic components and are calculated as below:
I x y = i = 1 n . ( m i   ( x i - x m ) (   y i - y m ) + ( J xi + ( y i 2 + z i 2 ) - J yi - ( x i 2 + z i 2 ) ) ÷ 2 ) × s i n 2 θ i = i = 1 n m i x i y i + J x i + m i ( y i 2 + z i 2 ) 2 s i n 2 θ i - i = 1 n J y i + m i ( x i 2 + z i 2 ) 2 s i n 2 θ i -   i = 1 n . m i x m y m
I x z = i = 1 n .   ( m i   ( x i - x m ) (   Z i - Z m ) ) = i = 1 n m i x i z i - i = 1 n . m i x m z m
I y z = i = 1 n .   ( m i   ( y i - y m ) (   Z i - Z m ) ) = i = 1 n m i y i z i - i = 1 n . m i y m z m
Moments of inertia for the ith cylindrical component are defined by Jxi, Jyi and Jzi concerning the local coordinate system as follows:
J xi = J yi = 1 12 m i 3 r i 2 + h i 2
J zi = 1 2 m i r i 2
Also, moments of inertia for the ith cubic component indicated by Jxi, Jyi and Jzi are shown below:
J xi = 1 12 m i b i 2 + h i 2
J yi = 1 12 m i a i 2 + h i 2
J zi = 1 12 m i a i 2 + b i 2

4. Implementation

Consider Figure 2 evidently, the equipment is located on 2 floors and 4 layers or levels so that the equipment is located on the upper and lower levels of each floor. The centre of gravity of the satellite is somewhere between the levels L 2 and L 3 .

4.1. Allocation and Layout

The placement of equipment in satellite space involves two main parts: first, the allocation of equipment to floors and layers and then their placement in each layer which means that the problem is allocation and layout. Since the objective function involves minimizing mass moments of inertia, the equipment should be arranged as much as possible so that the moments of inertia occupy the minimum possible value in all directions of the coordinate axes (x, y, z). Since the problem consists of two floors and four layers, the placement of equipment in two ways can affect the moments of inertia.
The location of equipment at different levels affects the moment of inertia in the direction of the x and y axes, and the layout of the equipment at each layer can affect the moment of inertia in the direction of the z-axis (Izz); In other words, to change the moment of inertia in the direction of the x and y axes, the distance of the equipment from the omxm and omym axes, respectively, plays a decisive role. Therefore, if a component is moved between layers, its distance from the mentioned axes changes and affects the moment of inertia in the x and y directions. Conversely, in this displacement, if the equipment distance from the omzm axis remains constant, there will be no change in the moment of inertia in the direction of the z-axis. According to these explanations, proper allocation of equipment to different layers can play an important role in reducing the moment of inertia in the direction of the x and y axes (Ixx and Iyy).

4.1.1. Allocation of Components between Layers

At this stage, all components are assigned to 4 layers in the satellite so that the most optimal state is created for the target function. As previously explained, the assignment of equipment to surfaces can affect the moments of inertia along the x and y axes (Ixx and Iyy). Since Equations (12) and (13) are similar, the calculations are considered for one of them and the result is generalized to the other. As it is evident from Equation (26), To obtain the least possible value for this expression, the first 3 expressions must have the lowest value and the last expression must be at the maximum possible value.
Preprints 89091 i002
Before considering the minimization of the above expression, we first discuss the value of zi. This value indicates the final location of the equipment in terms of height (z dimension) after placement. The mentioned amount is calculated as follows:
z i = H 2 + D t + h i 2 i f   l j = 1 H 2 h i 2 i f   l j = 2 H 1 + D t + h i 2 i f   l j = 3 H 1 h i 2 i f   l j = 4
Since the length, width and height (a, b, h) for cuboid equipment and the radius and height (r, h) for cylindrical equipment are fixed, the first three expressions of Equation (26) cannot be altered. Therefore, to make a change in the equation, we come to the following statement:
i = 1 n ( m i ( y 2 i + z 2 i ) - i = 1 n ( m i ( y 2 m + z 2 m )
First, we consider the first part of the above equation. Given that the allocation of equipment at distinct layers impacts their z-axis coordinates, it suffices to minimize the first half of the formula (28) to minimize the next value:
i = 1 n m i . Z 2 i
We now turn to the second part of Equation (28). According to Equations (10) and (11), which are about the coordinates of the centre of mass in the direction of the axes y and z, the second expression of Equation (28) is written as follows:
i = 1 n   ( m i ( i = 1 n m i y i i = 1 n m i ) 2 + m i ( i = 1 n m i z i i = 1 n m i ) 2 )
As can be observed, the denominator of both fractions in expression (30) is the sum of the mass of all the equipment, which is a constant and can be omitted from the maximizing computation. On the other hand, since in this part, the layout of equipment in each layer is not considered and only their location is important to the surfaces, we can omit the first part of term (30), which is related to the coordinates in the direction of the y-axis, so it is sufficient to maximize the following value to maximize the expression:
i = 1 n   ( m i ) ( i = 1 n m i z i ) 2 )
Since the total mass of all equipment is a fixed value, the only part that will need to be maximized is as follows:
( i = 1 n m i z i ) 2
Here there are two expressions (29) and (31) that one should take the maximum possible value and the other should be minimized:
Min i = 1 n (mi.z2i)
Max ( i = 1 n m i z i ) 2
As it is known, maximizing the expression ( i = 1 n m i z i ) 2 is equivalent to maximizing i = 1 n m i z i but in the first expression minimization of i = 1 n m i z i 2 is considered; Therefore, according to the second power in the expression of minimization, this part has a higher priority than the part of maximization, and in principle, the heavier mass the equipment is at lower layers, the product of mass in their height is less and then the total moment of inertia in the direction of the x-axis ( I x x ) assumes the least possible value.
On the other hand, according to Equation (11) and considering that the moment of inertia is calculated according to the coordinates of the centre of gravity, it can be concluded that the closer the equipment is to the centre of gravity of the satellite, the moment of inertia in the direction of the x-axis ( I x x ) And y ( I y y ) decreases. Therefore, it makes sense to place more equipment in the middle layers (layers L 2 and L 3 ) to minimize the moment of inertia. According to the above explanations, we conclude that to optimize the allocation of equipment at different levels of the satellite, it is best to place heavier equipment at lower layers ( L 3 and L 4 layers) and to accumulate them more at the middle layers (layers L 2 and L 3 ). Now, to satisfy the mentioned cases, the following heuristic method is presented.

Heuristic Method to Allocate Equipment to Different Layers

Step 1: Arrange all the equipment at the same time based on height (h) and mass (m). Since all equipment is symmetrical and the mass distribution is assumed to be the same, the centre of mass of each equipment is located in the middle and has a height equal to half the height of the equipment ( h 2 ). Therefore, equipment that has a lower height is in priority at the initial and final layer (layers L 1 and L 4 ). Conversely, if the height of the equipment is large, placing them in the middle layers (layers L 2 and L 3 ) will lower the distance between them and the centre of gravity of the satellite, hence decreasing their moment of inertia along the x-axis ( I x x ) and y-axis ( I y y ). Step 2: Suppose the space available in each layer is displayed as follows:
S j j 1 . 2 . 3 . 4
Where j is the layer counter. S j ' is also a ratio of the layer j occupied by the equipment. Because if more than 70% of the area in each layer (0.7 × S j ) is occupied by equipment, location is practically impossible and it is not possible to place the equipment without overlapping. Moreover, since the occupied area of the equipment at levels L 2 and L 3 must be at least two times the occupied area of the equipment at layers L 1 and L 4 , the following ratio is formed between the surface areas:
2 × ( S 1 ' + S 4 ' ) S 2 ' + S 3 ' 1.4 × ( 1 S ' 1.4 ) × ( S 1 ' + S 4 ' )
Where in
S ' = j = 1 4 S j '
Step 3: After the equipment is arranged according to the height and mass, to minimize the moments of inertia, the equipment with lower height should be placed in L 1 and L 4 layers and also to satisfy Equation (22), the equipment from the lowest Height and mass are selected and placed in a list called A. This separation is necessary so that this amount of equipment can be assigned to two layers L 1 and L 4 and the rest of the equipment is naturally assigned to layers L 2 and L 3 . An approximate value means that you can start from Equation (34) to satisfy Equation (33) and return to this step to add the next equipment to List A if the final assignment of Equation (33) is not met.
( S 1 ' + S 4 ' ) S ' 1.4
Where S ' is the total occupied area of equipment available in 4 layers? There are only a few cases in which equations (33) and (34) are met. For example, if there are a total of 60 pieces of equipment and it is determined by the initial division that only in cases where n 1 + n 4 = 19,20,21,22 the ratio of equation (22) remains eligible, so for all these feasible cases the next steps are performed.
Step 4: The selected number of equipment (list A) that make up n 1 + n 4 are sorted by mass from low to high.
Step 5: To allocate equipment at L 1 layer, start from the lowest height and the lowest amount of mass and work your way up until the following ratio for the total area of ​​the selected equipment remains feasible:
S 1 ' 0.6 ( S 1 ' + S 4 ' ) ( 0.4 ( S 1 ' + S 4 '
This division is to maintain the balance of equipment division between the first and fourth layers. Therefore, with the first choice that satisfies this ratio, the allocation of equipment to the first level is completed and the values of n 1 and S 1 ' are determined. Step 6: The rest of the equipment is assigned to layer L 4 and the values of n 4 and S 4 ' are determined.
Step 7: The rest of the equipment (remaining about 2 3 ) that makes up n 2 + n 3 should be assigned to two layers L 2 and L 3 . So equipment is ordered concurrently by height and then mass, from greatest to least value.
Step 8: Since, according to the previous description, the equipment must occupy less than 70% of the area of ​​each layer, the remaining equipment is assigned to the two layers L 2 and L 3 in such a way that the components are again arranged just based from lowest to the highest value and selected for layer L 2   until the following ratios are met, and then the remaining equipment is assigned to layer L 3 .
S 2 ' 0.7 S 2
S 3 ' 0.7 S 3
0.9 S 3 ' S 2 ' 1.1 S 3 '
According to the previously mentioned constraints such as equation (33) and the need for a balanced distribution of equipment between layers, with the fulfilment of equations (36) and (37), equation (38) must also be established for these two layers. Thus, all equipment was assigned to all layers, so that equipment with the heavier mass was at layers L 3 and L 4 and equipment with the lowest heights was at layers L 1 and L 4 .
Step 9: Upon completion of the equipment allocation between layers, the information obtained is given to GAMS software the problem is solved initially and the optimal local solution is generated and stored. The initial solution means that the uncertainty discussion is not considered at the moment and the layout with the details of the equipment on each floor is done in the next section. By performing the presented heuristic method, all the cases that may produce a near-optimal answer are considered and the best answers are determined as inputs to the next stage.

4.1.2. Layout of Equipment in Each Layer

Since the satellite container’s components are cuboid or cylindrical, they can be viewed in two dimensions a rectangle or a circle. To satisfy the non-overlap constraint between equipment, the location of each equipment must be compared with the location of others and no overlap between all components is allowed. Here there are two types of surveys required: circular and rectangular cross-section equipment.
Satisfying the non-overlap constraint for equipment with a circular cross-section is easily achievable. To do this, it is enough to rewrite constraint number 2 for such equipment as follows.
( r i + r j ) 2 x i x j 2 + y i y j 2
As indicated by inequality (39), the Euclidean distance between the centres of both circles must be greater than or equal to the sum of the radii of the two circles.
For equipment with a rectangular cross-section, satisfying the non-overlap constraint is not as simple as circular equipment. In this article, we use flexible robust programming to solve this problem. It is assumed that each rectangle can be represented by a circle whose centre is the same as the centre of the rectangle, and after this, no overlap between these circles can be allowed.
Now, if the mentioned circle is considered as a circumscribed circle rectangular, satisfying the non-overlap constraint will increase the distance between the equipment more than necessary, and as a result, the objective function will degrade. If the circle is selected so small that it becomes an inscribed circle for the rectangle, then even though the objective function is greatly reduced and the components are positioned at shorter distances from each other, it leads to the overlap of part of the rectangular components and the non-overlap constraint will be violated.
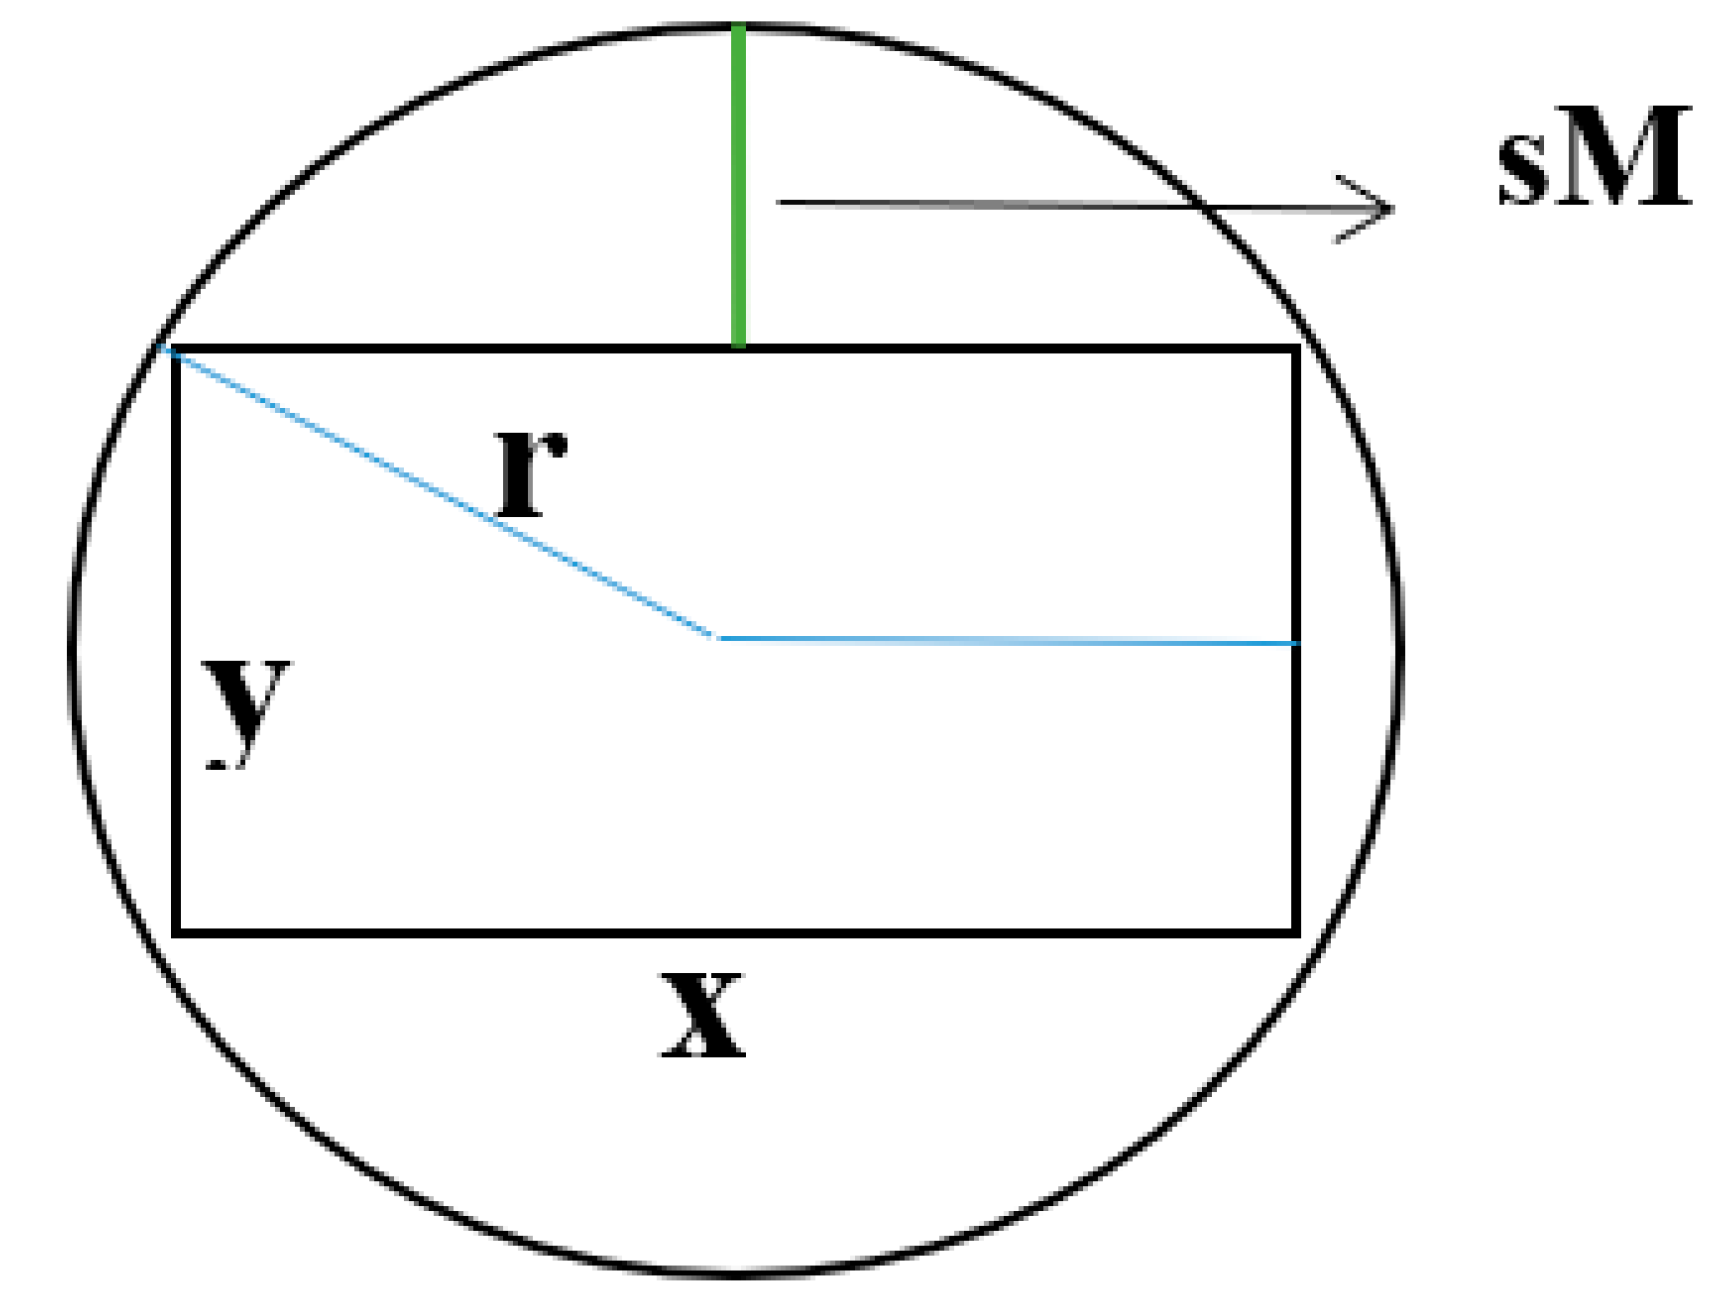
Therefore, it is essential to find virtual circles which despite satisfying the non-overlap constraint, they can exploit optimal and minimal values for the objective function. To achieve the best hypothetical circle, a novel approach is applied. As shown in Figure 3, the value of sM is considered as a parameter to determine the optimal radius of the hypothetical circle.
If the hypothetical circle reaches its largest radius and converts to a circumscribed circle for the rectangle, the value of sM will be calculated as follows
s M i = r i m i n ( x i . y ( i ) ) 2
Where x and y are the length and width of the rectangle, respectively and r is the radius of its hypothetical circumscribed circle.
Conversely, if the radius of the hypothetical circle is at its lowest value as an inscribed circle for the rectangle, the value of sM tends to be zero. To reach a flexible constraint and utilize a robust concept, fuzzy numbers are an appropriate option used to illustrate such flexibility; Because the nature of fuzzy numbers is in close relationship with flexible robust programming. (Inuiguch and Sakawa 1998).

Robust Flexible Programming Model (RFPM)

To cope with the difficulties associated with overlapping issues for rectangle shapes, a robust flexible programming model is proposed.
Based on RFPM introduced in Pishvaee and Fazli Khalaf (2016), fuzzy numbers are represented as triangular numbers in this paper.
To solve the problem in a flexible programming way, the model is first written as follows:
Min f ( x ) = I xx + I yy + I zz
s.t.
f r i ~ r i i c u b i c   e q u i p m e n t s
f r i r i i c y l i n d e r   e q u i p m e n t s
( f r i + f r i + 1 ) 2 x i x i + 1 2 + y i y i + 1 2 i c u b i c   e q u i p m e n t s
The sign of ~   represents the fuzzy version of sign and illustrates that the right-hand side value of the constraint is essentially smaller or similar to the left-hand side. The fuzzy number s T ~ could be applied to depict the flexible condition of the fuzzy constraint.
Therefore, the model is rewritten as follows:
Min   f ( x ) = I xx + I yy + I zz
The
f r i r i s T ~ × 1 α i i c u b i c   e q u i p m e n t s
f r i r i i c y l i n d e r   e q u i p m e n t s
( f r i + f r i + 1 ) 2 x i x i + 1 2 + y i y i + 1 2 i c u b i c   e q u i p m e n t s
s.t.
The α parameter indicates the minimum level of satisfaction with the flexible constraint. Suppose that the fuzzy number   s T ~ is a triangular fuzzy number represented by three numbers ( s T ~ = ( s P . s M . s O ) ) and elucidated by the method demonstrated in Yager (1981) as follows:
s T ~ = s M + s O s M s M s P 3  
Based on constraint 2, the flexible programming model in non-fuzzy mode is rewritten as follows:
Min   f ( x ) = I xx + I yy + I zz
s.t.
f r i r i s M i + s O s M s M s P 3 × 1 α i i c u b i c   e q u i p m e n t s
f r i r i      i c y l i n d e r   e q u i p m e n t s
( f r i + f r i + 1 ) 2 x i x i + 1 2 + y i y i + 1 2   i c u b i c      e q u i p m e n t s
The expression s O s M s M s P 3 × 1 α i indicates the possible amount of violation of the flexible constraint. It should be noted that the use of this flexible fuzzy programming method allows other fuzzy numbers to be used in the fuzzy constraint, and other fuzzy ranking methods can also be used to de-fuzzy the existing uncertain parameters in soft constraints.
Also, using α-cuts as the degree of violation in soft constraints can lead us to different fuzzy solutions that help decision-makers to compare different outputs and to achieve better solutions with sensitivity analysis.
In the fuzzy flexible planning model, the allocation of the minimum level of satisfaction to the flexible constraints (0≤α≤1) must be determined by the decision maker. In other words, this method should be reactive and the decision maker achieves different results by manually changing the minimum level of satisfaction and extracting the best solutions for fuzzy parameters.
The desirability of the choices at each stage is determined by the output of the model. The drawback of this method is that there is no guarantee to achieve the optimal level of satisfaction. For this purpose, the RFPM is represented as follows.
Min   f ( x ) = I xx + I yy + I zz + γ × s M i + s O s M s M s P 3 × ( 1 α )
s.t.
f r i r i s M i + s O s M s M s P 3 × 1 α i i c u b i c e q u i p m e n t s
f r i r i i c y l i n d e r e q u i p m e n t s
( f r i + f r i + 1 ) 2 x i x i + 1 2 + y i y i + 1 2 i c u b i c e q u i p m e n t s
0 α 1 . I x x . I y y . I z z . f r 0
In this model, in addition to minimizing moments of inertia, a new section has been added to the objective function, which depicts the total penalty cost of possible non-compliance with the flexible constraints. In essence, this phase controls the feasibility and robustness of flexible constraints.
In other words, this expression shows the difference between the minimum and maximum possible value for flexible constraint as follows:
s M i + s O s M s M s P 3 × 1 α i = r i r i s M i + s O s M s M s P 3 × 1 α i i c u b i c e q u i p m e n t s
In this model, the penalty cost for each unit of violation of the soft constraint is also considered, which is represented by the parameter γ. In the RFPM, unlike the initial flexible programming model, the minimum level of satisfaction (α) is no longer a parameter and is determined by the model as a variable.
Therefore, by solving the model in one time, the optimal value of this variable can be achieved and there is no need to repeat the experiments. Because the objective function of the model tries to achieve a balance between the robustness cost (the last expression of the objective function) and the overall performance of the system including other expressions of the objective function (such as moments of inertia), the proposed model is called a realistic RFPM.
It should be noted that the parameter γ is an important value and its value is determined based on the application and the subject of discussion. Here, for example, for cuboid components that need to be more distant from other equipment, the value of the penalty parameter can be assigned much more, which in this case the variable α tends to increase near 1, and therefore the soft constraint for this equipment becomes like cylindrical components.
It should be noted that the use of the penalty parameter in the objective function helps to optimize the variable of minimum satisfaction level (α) and prevents dirthe ect involvement of decision-makers in quantifying this variable.

5. Implication and Sensitivity Analysis

In this section, the efficiency of the proposed model is investigated by comparing its performance with previous models in the literature review.
Since some of the constraints of the model are flexible, new parameters are introduced that are valued for the possibility of exceeding the aforementioned constraints. For this purpose, the maximum permissible flexibility for soft constraints (sT) is considered.
To analyze the performance sensitivity of a model based on flexible robust planning, we first compare it with a simple flexible model with certain levels of satisfaction (for example α = 0.0   .   0.1   .   0.2   .   0.3 ). The numerical examples from Sun and Teng (2003), Zhang et al. (2008), and Liu and Teng (2008) were used for this purpose. These three numerical examples served as the foundation for numerous papers; therefore, the eleven articles that used these numerical examples are compared to the suggested model.
Case Study 1: investigating the work of Sun and Teng (2003)
In this example, there are 53 pieces of equipment, of which 24 pieces of pieces of equipment are cuboids and 29 pieces of equipment are cylindrical. In this example, the satellite equipment is arranged in two levels and 4 layers. By considering Figure 8, the parameters of the satellite body are as follows: the radius of the circular cross-section of the satellite surfaces is 500 mm, the radius of the middle cylinder of the satellite connecting the surfaces is 100 mm, the H1, H2 and Ht parameters are 300 mm, 830 mm and 1150 mm respectively and the diameter of the first and second levels is 20 mm each. The mass of the empty satellite consists of 4 plates (two middle levels and two floor and top levels of the satellite), the satellite shell and its middle cylinder are equal to 776.53 kg. To perform more accurate calculations, it was assumed that the density of materials used in the body of this satellite was 3.006 g/cm3 (a combination of aluminum and titanium alloys) and the thickness of the satellite’s shell was 41.25 mm. Also, the two middle plates on which the components are placed were considered hollow cylinders with inner and outer diameters of 100 and 500 mm, respectively, and the upper and lower plates were considered as complete cylinders with 100 mm diameter. With these hypotheses, it was simple to calculate the weight of each component in the satellite’s empty container and to determine the satellite’s moment of inertia as I x 0 = I y 0 = 185.24 and I z 0 = 155.2 kg.m2. Since the moment of inertia is higher than the empty state of the satellite when the components are added to the empty container of the satellite, it is expected that the values ​​obtained from the moment of inertia in each of the principal directions of the coordinate axes are greater than the values ​​calculated for Empty satellite compartment. Also, the coordinates of the centre of gravity of the empty satellite were calculated as C0 = (0,0,595).
After that the case was introduced by Sun and Teng (2003), Huo and Teng (2009), the second example by Liu et al. (2016) and the article by Fakoor et al. (2017) also used the data of this numerical example and compared their results with each other. Huo and Teng (2009) similarly utilized comparable data, but the coordinates of their layout result were not given for comparison with other studies. With the assumptions mentioned above and according to the coordinates of the equipment after placement that is available in the mentioned articles, the moments of inertia were recalculated and the results were compared, which can be seen in Table 2.
As illustrated in Table 2, the best answer in these articles is related to Liu et al. (2016) in which the objective function is less than the others. Therefore, in this paper, we use the output in this paper to determine θ i in cuboid equipment.
Then, using the heuristic method provided in Section 4.1.1.1, all conceivable modes of equipment allocation to different layers for these data were investigated, and 25 viable forms of equipment allocation were determined. Here, each of these feasible modes was implemented using the RFPM provided in Section 4.1.2.1 and GAMS software, and the results were compared to those of previous works that utilized this numerical example. (Table 3).
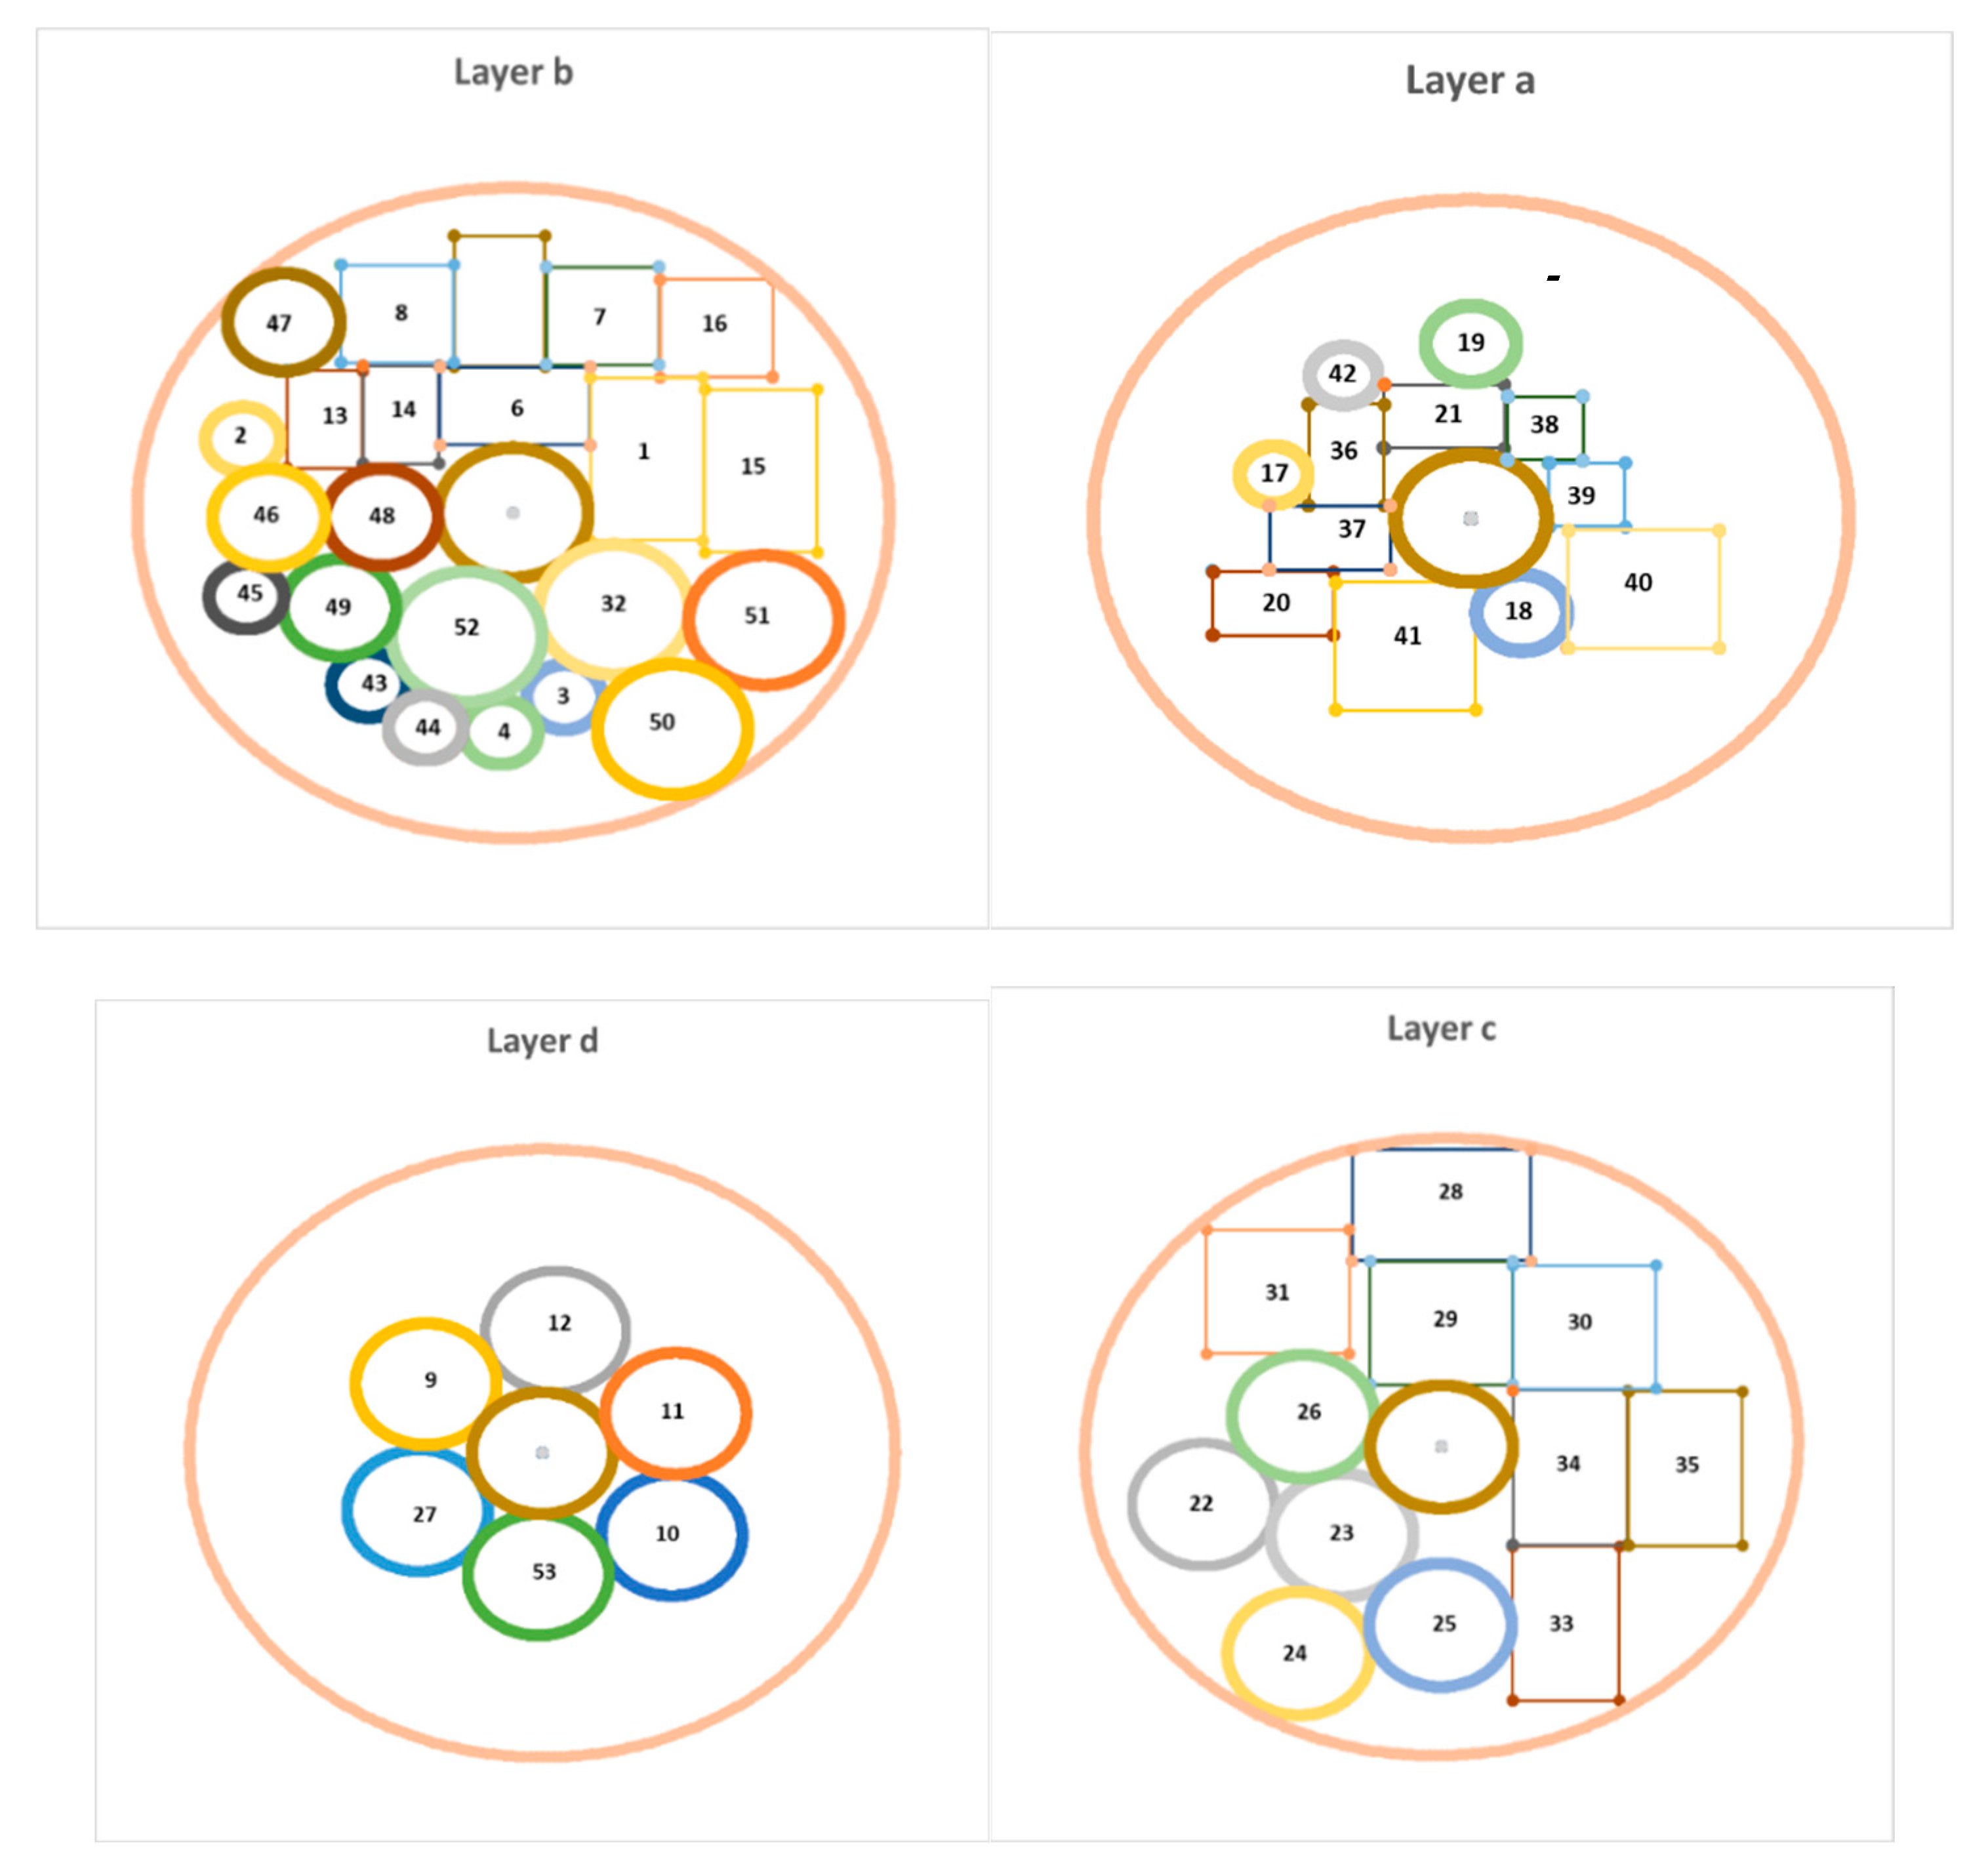
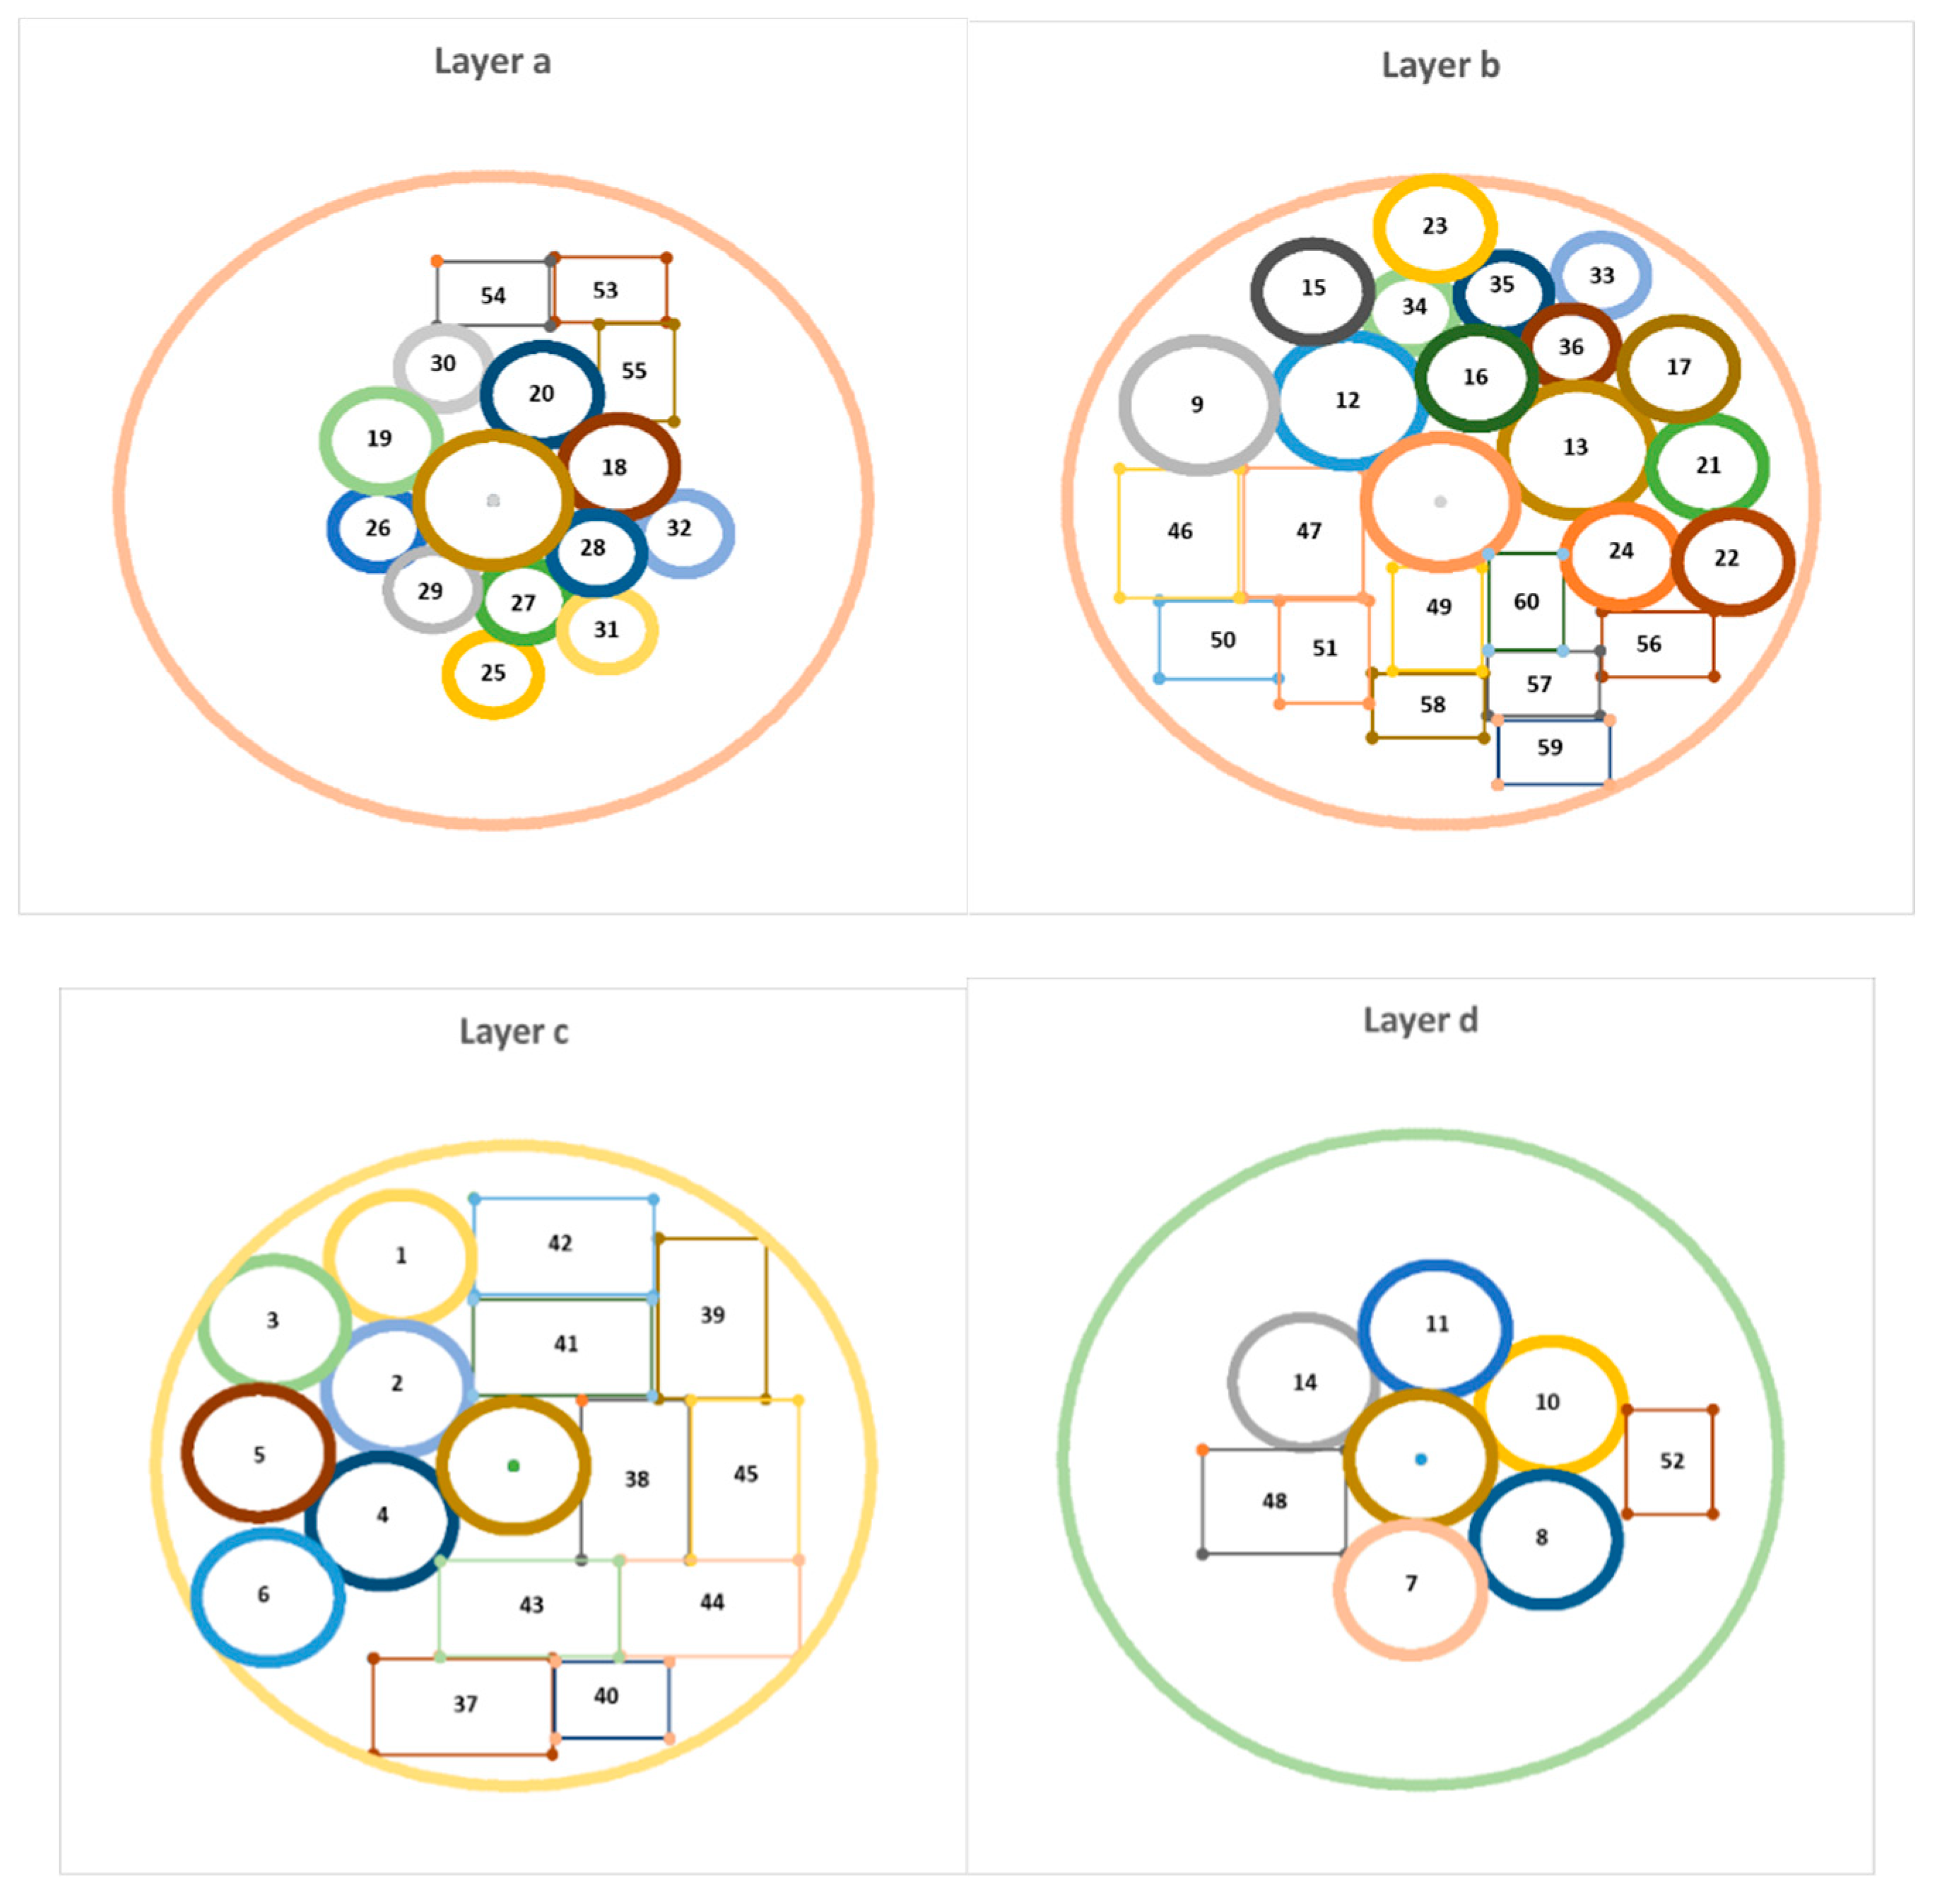
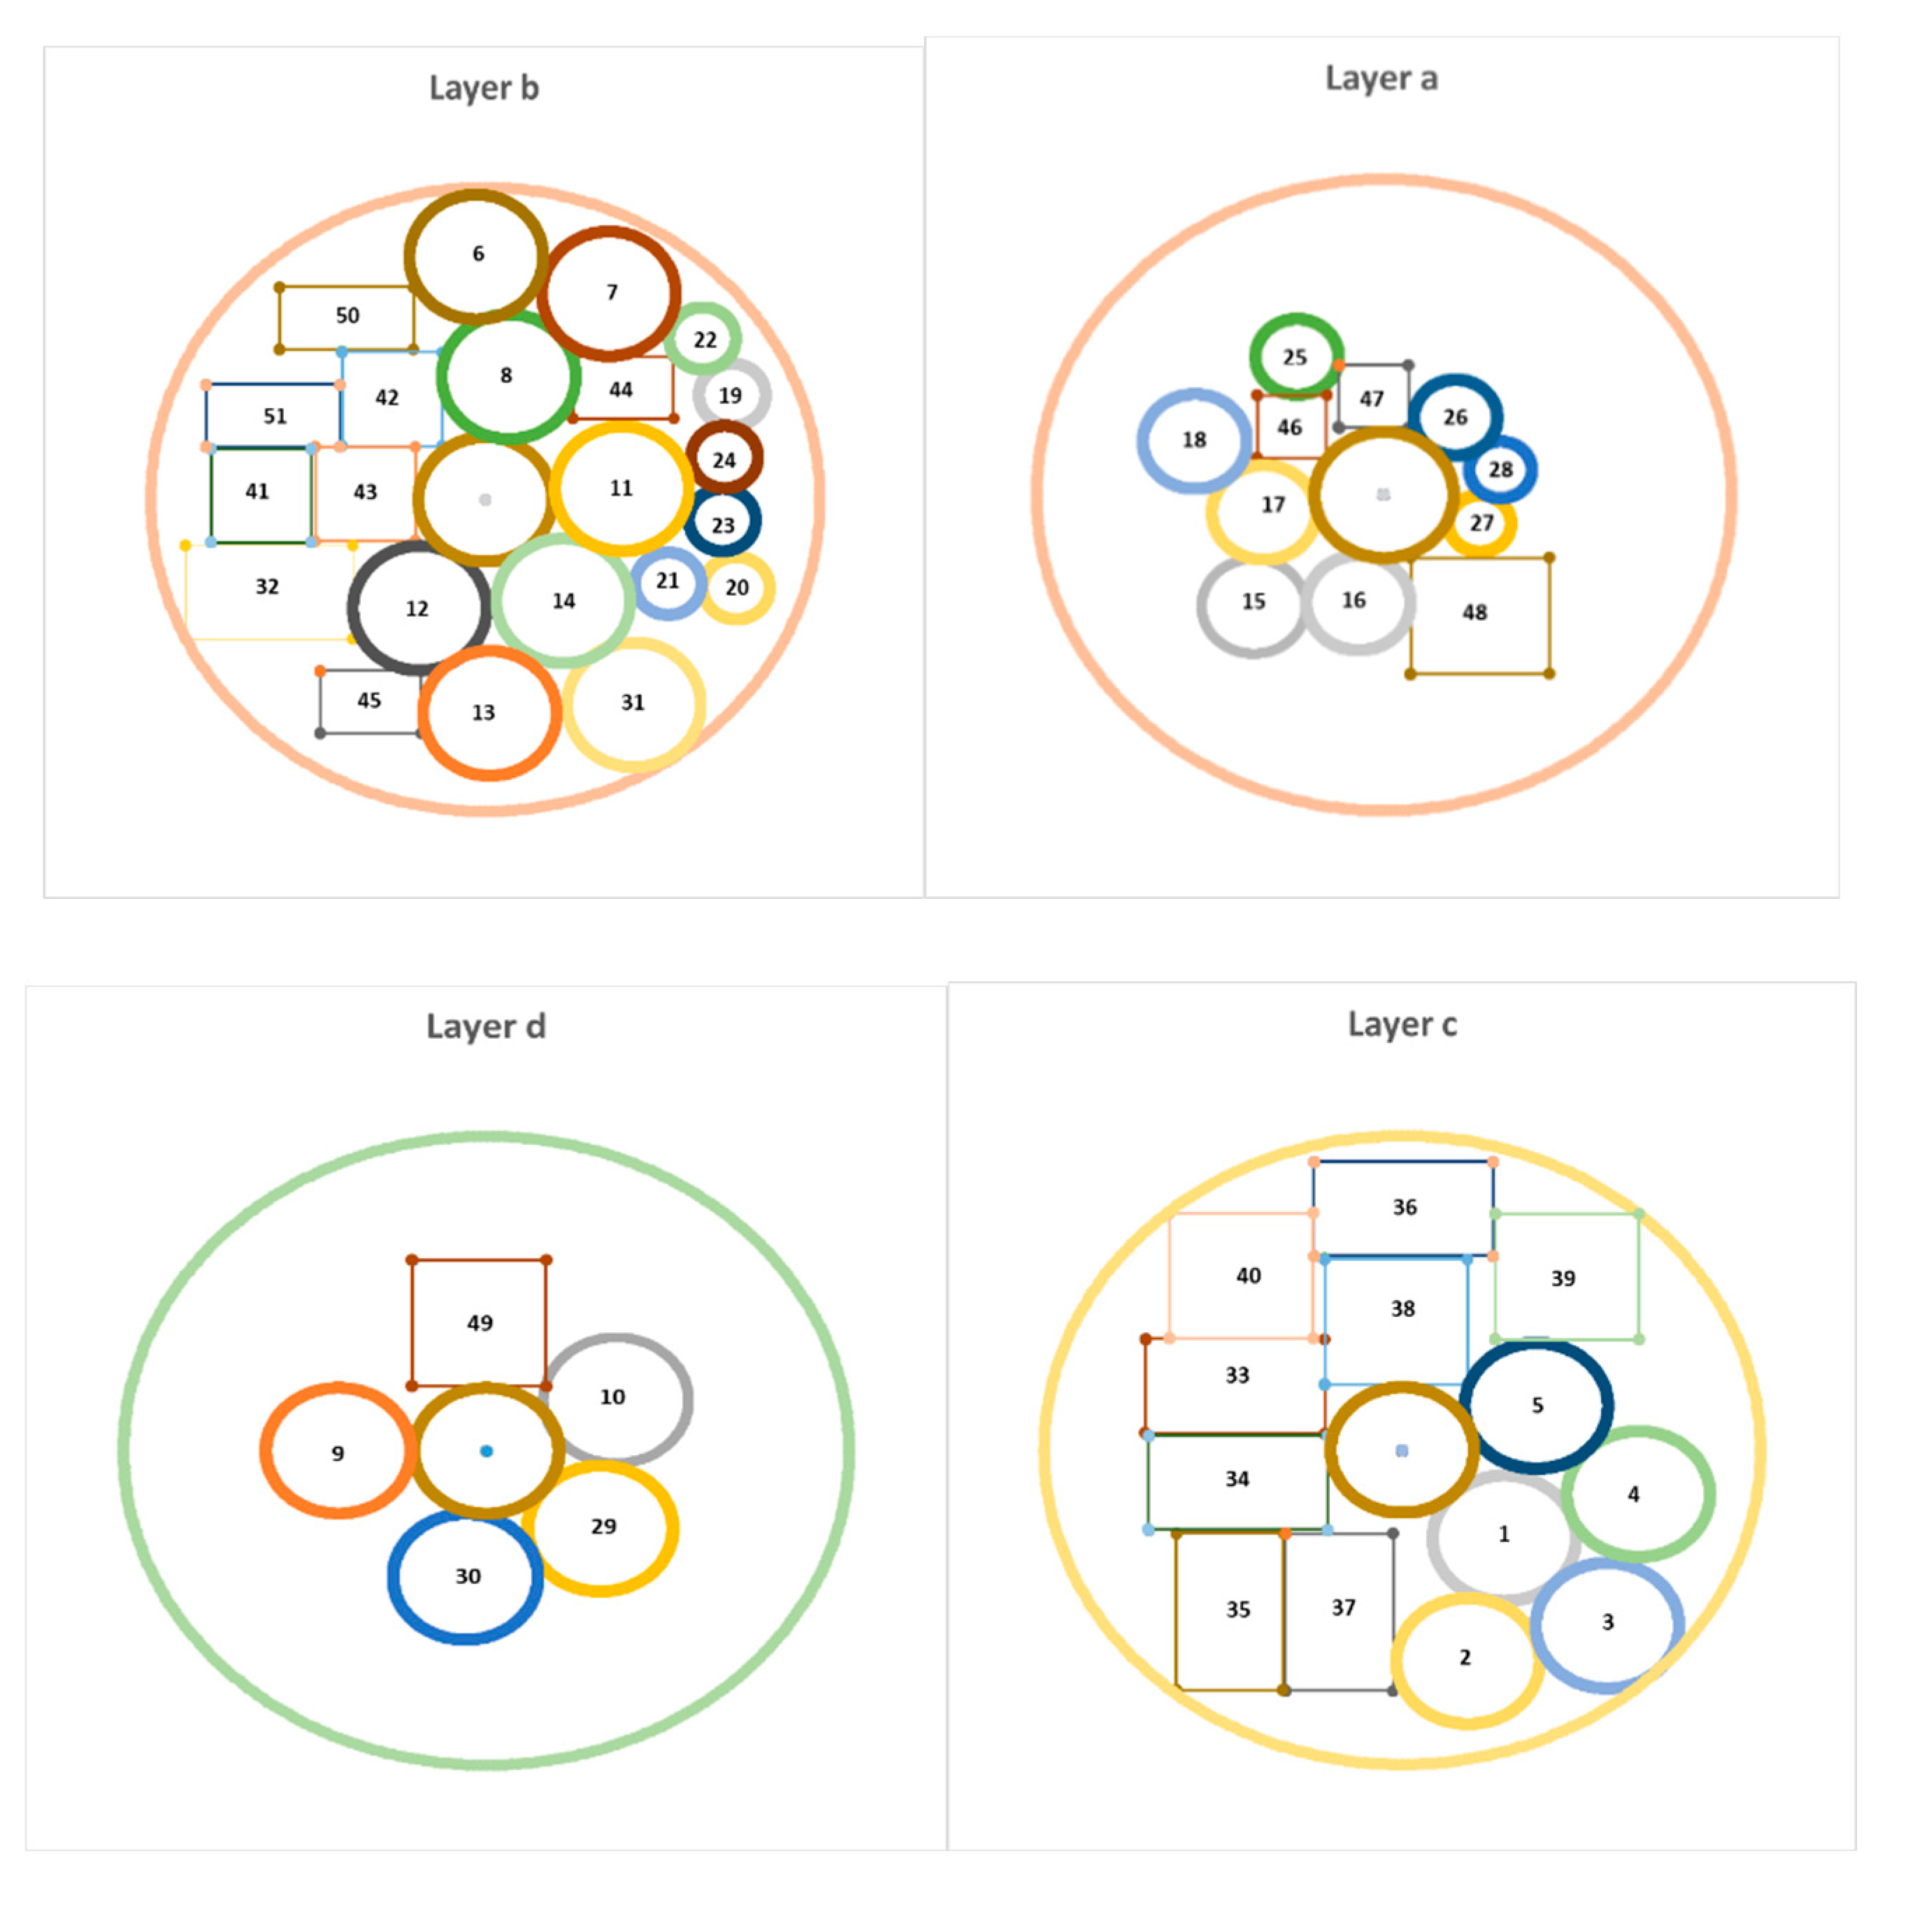
As can be seen from the table, the minimum moment of inertia is related to the possible state number 9, in which the total moment of inertia in the main directions of the coordinate axes is equal to 728.07 kg.m2, and on the other hand in 24 of the 25 possible states of total moments of Inertia are slightly better than Liu et al. (2016). Figure 3, Figure 4 and Table 4 depict the output of the model in the case where the sum of the moment of inertia is at its lowest possible value (layout of equipment on different layers of the satellite) and the coordinates of the equipment in this optimal state respectively.
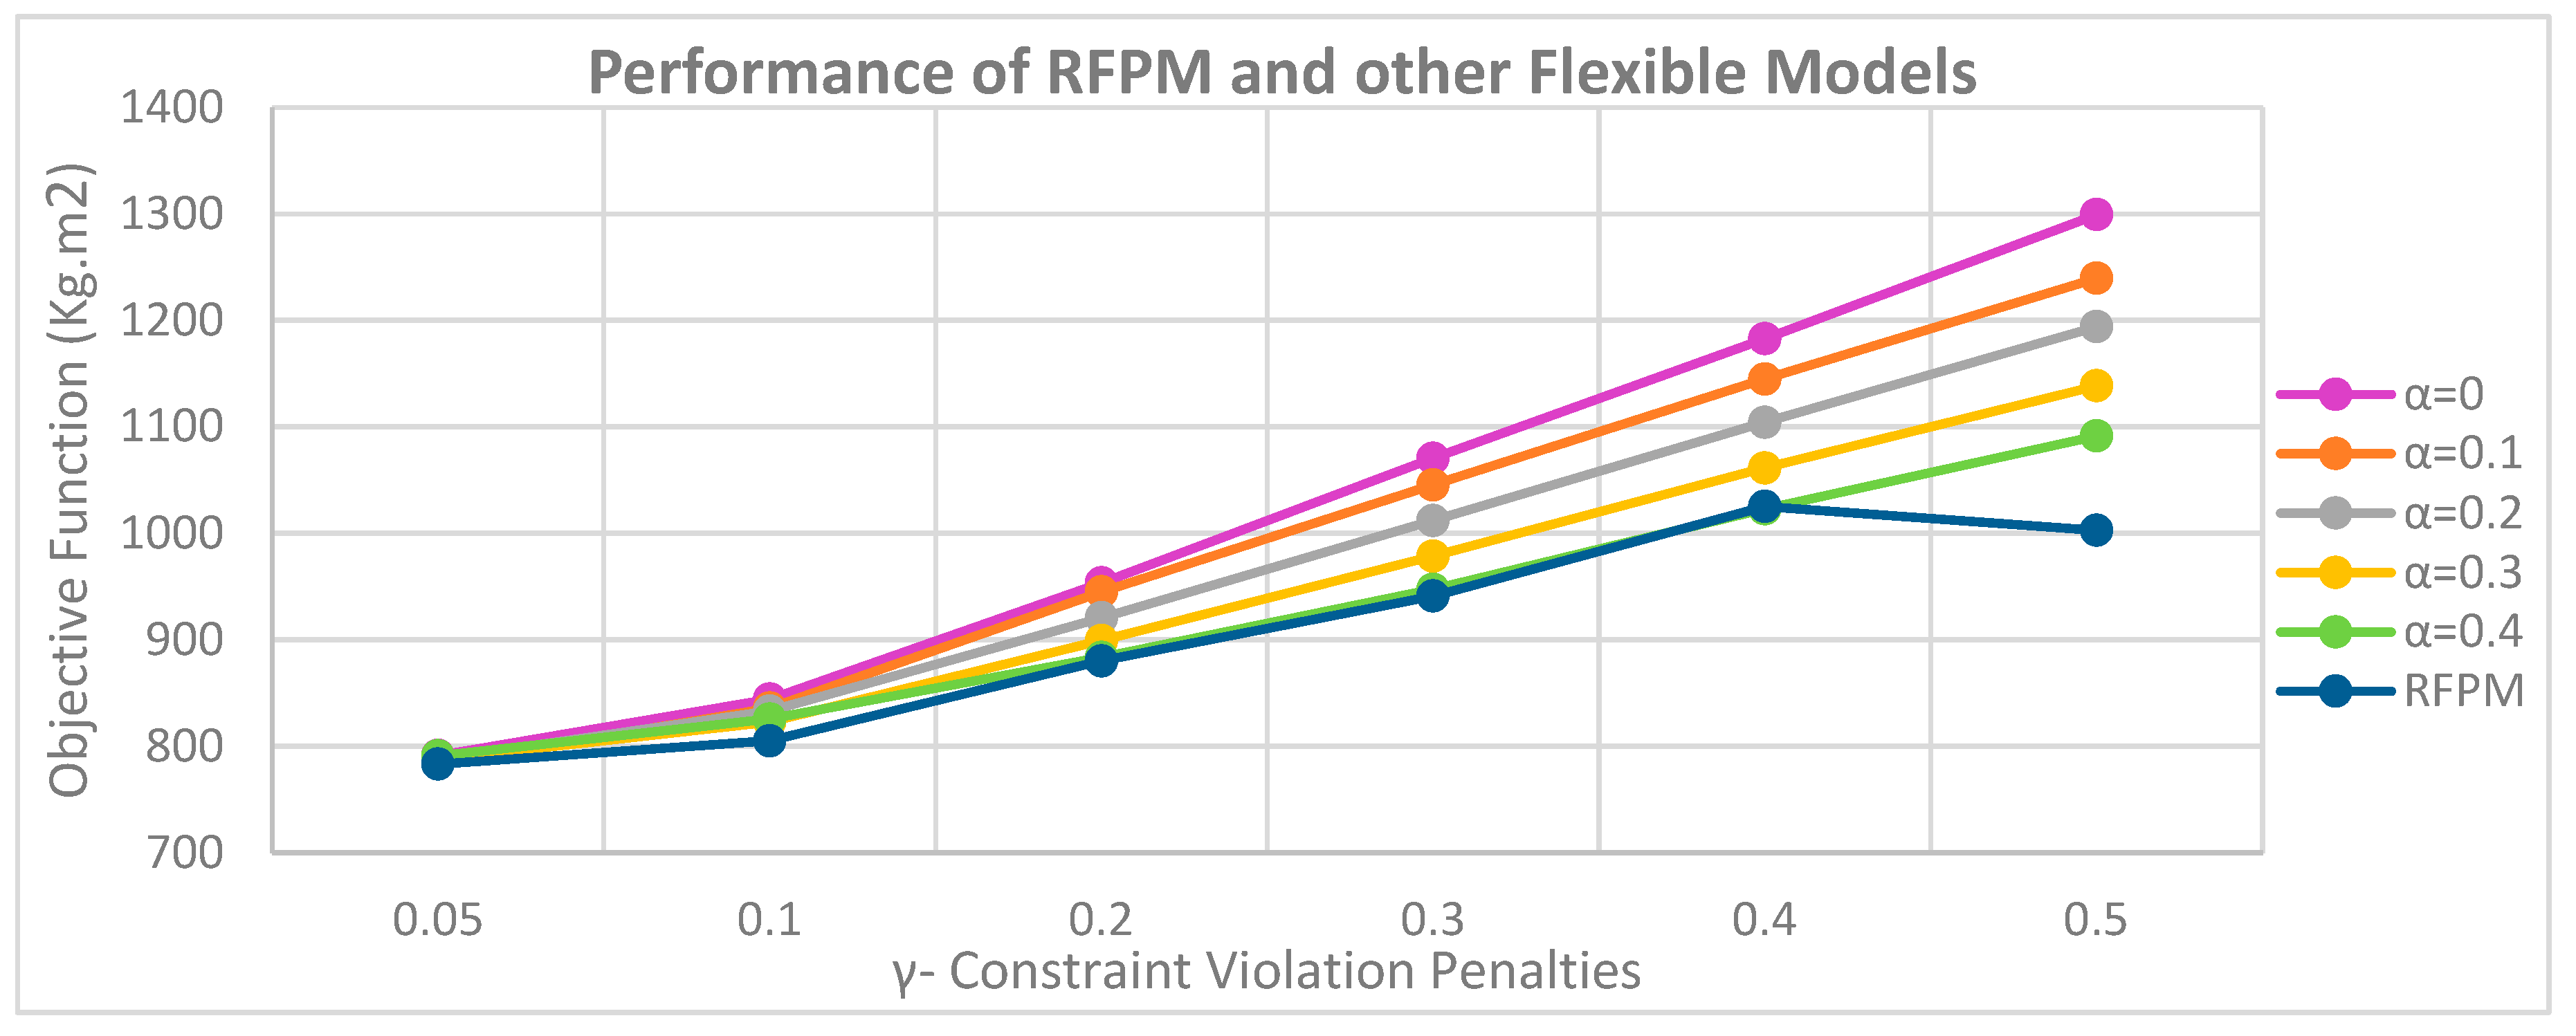
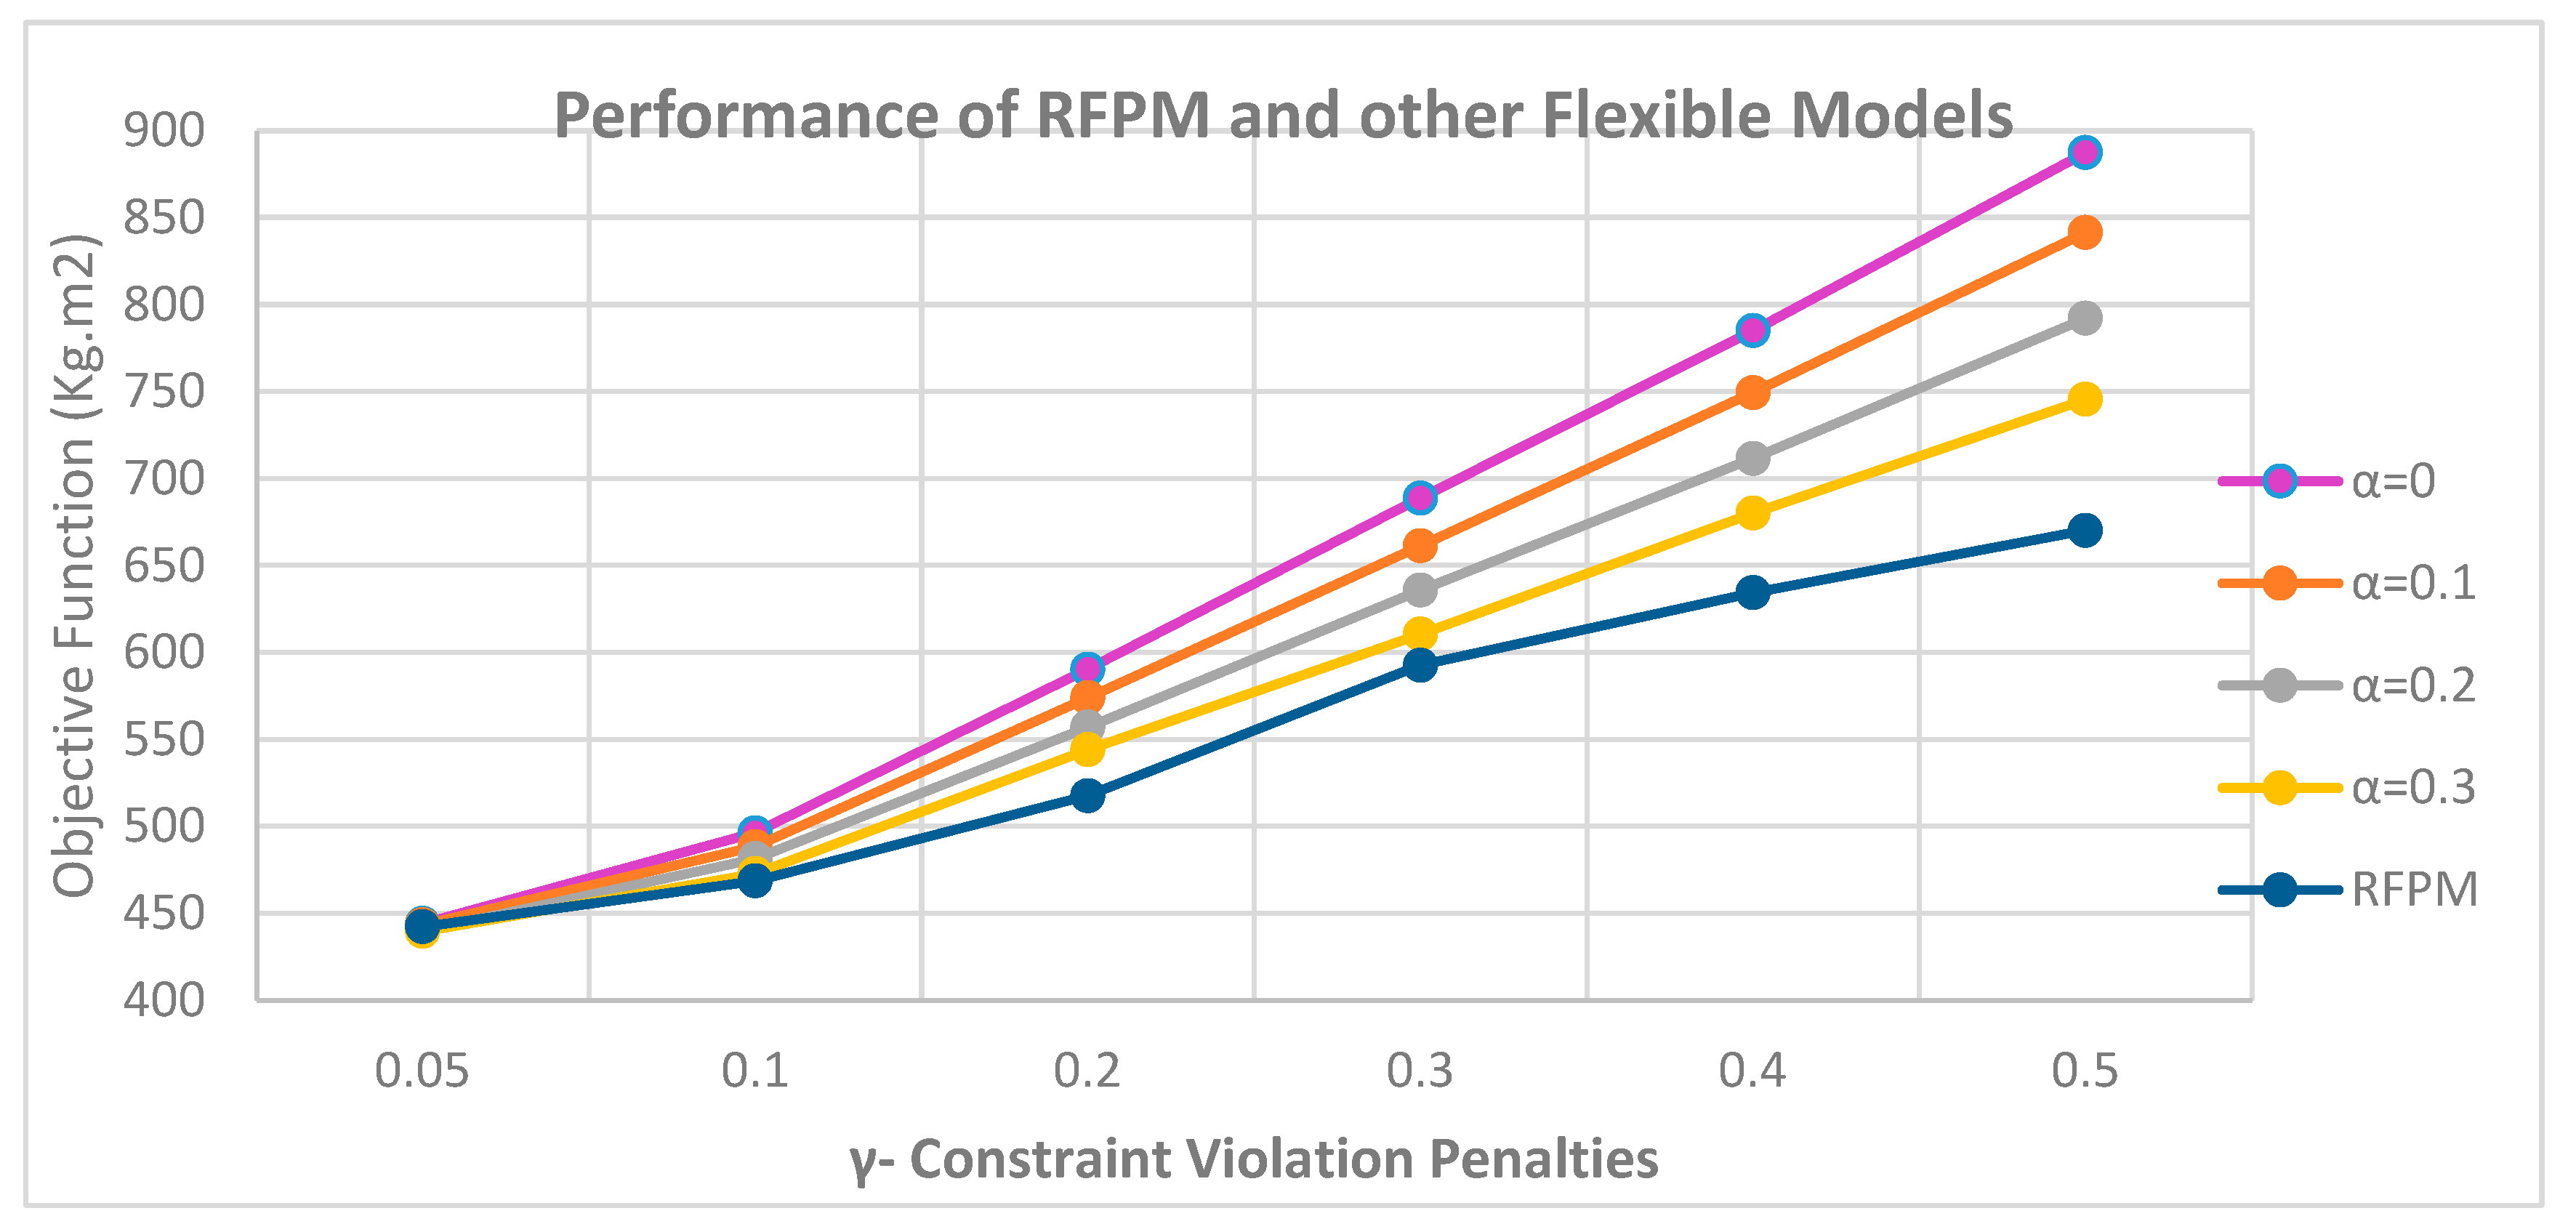
To compare the best answer obtained from the possible answers (Table 3) with the flexible model in the flexible state, we run the model in all possible modes and compare the objective functions with each other. The results can be seen in Figure 5.
As demonstrated in Figure 5, in cases where the minimum level of satisfaction for exceeding the flexible constraints ( α ) is greater than 0.4, the models will not be responsive in the flexible state because if this parameter tends to 1 the constraint loses its flexibility and the radius of the rectangular of cuboid equipment becomes the radius of their circumference and the limit of non-overlap between the equipment will not be practically met.
It is also clear that by increasing the penalty coefficient for violating the flexible constraints ( γ ) in the objective function, the values ​​of the objective function increase. As a result, the higher the coefficient, the faster the minimum level of satisfaction ( α ) rises in flexible models with lower α . The reason for this is that with decreasing the level of satisfaction, the value of (1- α ) increases and the product of the penalty for violating the soft limits in the amount of (1- α ) in the objective function increases more sharply.
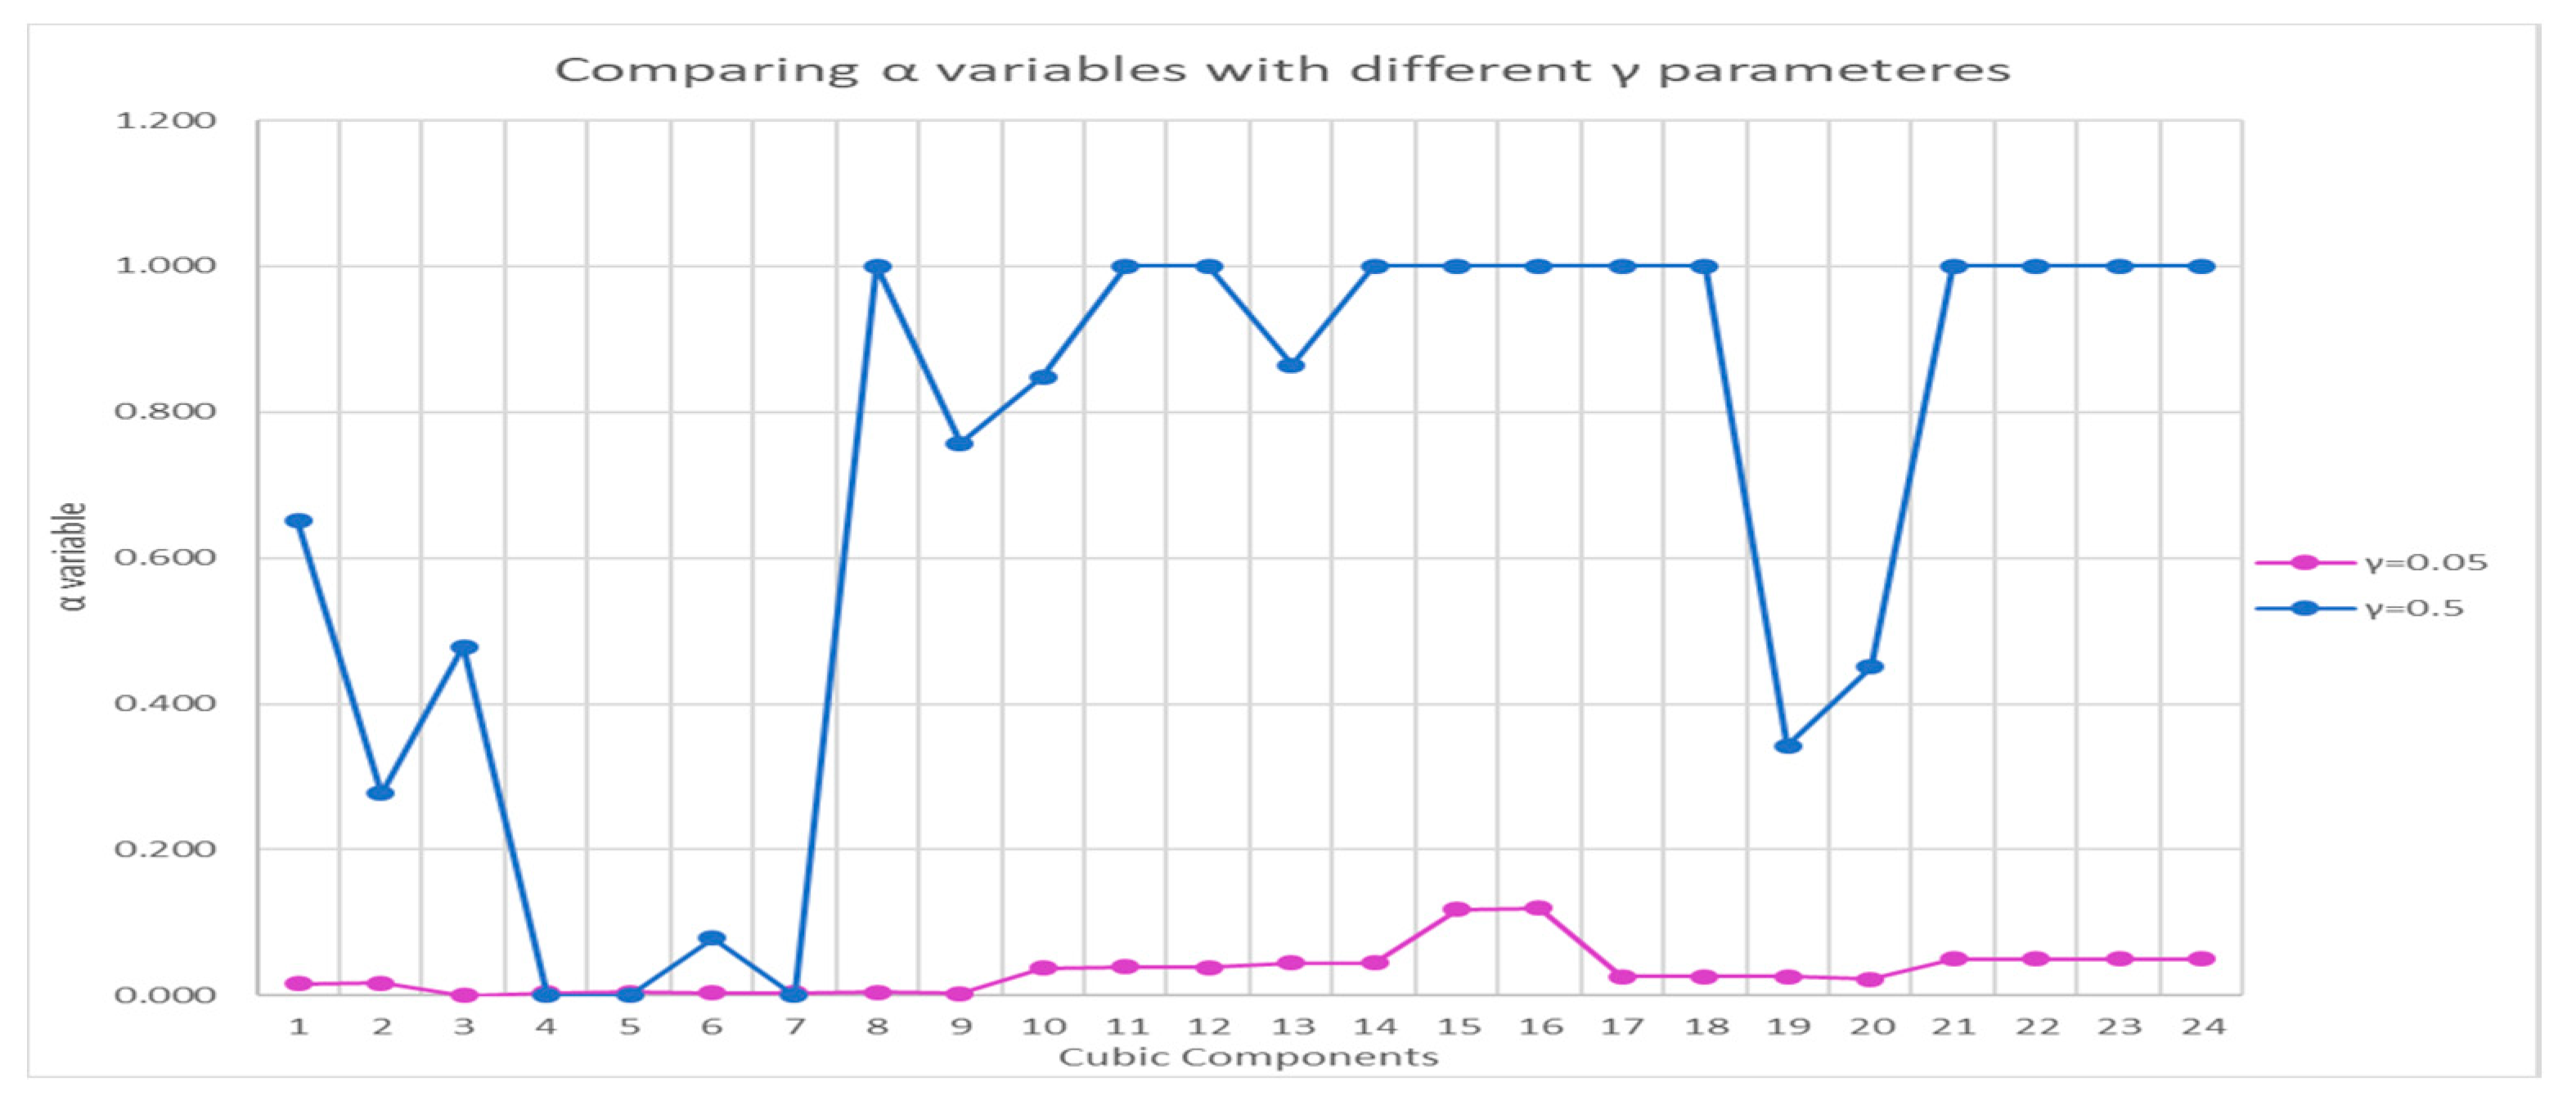
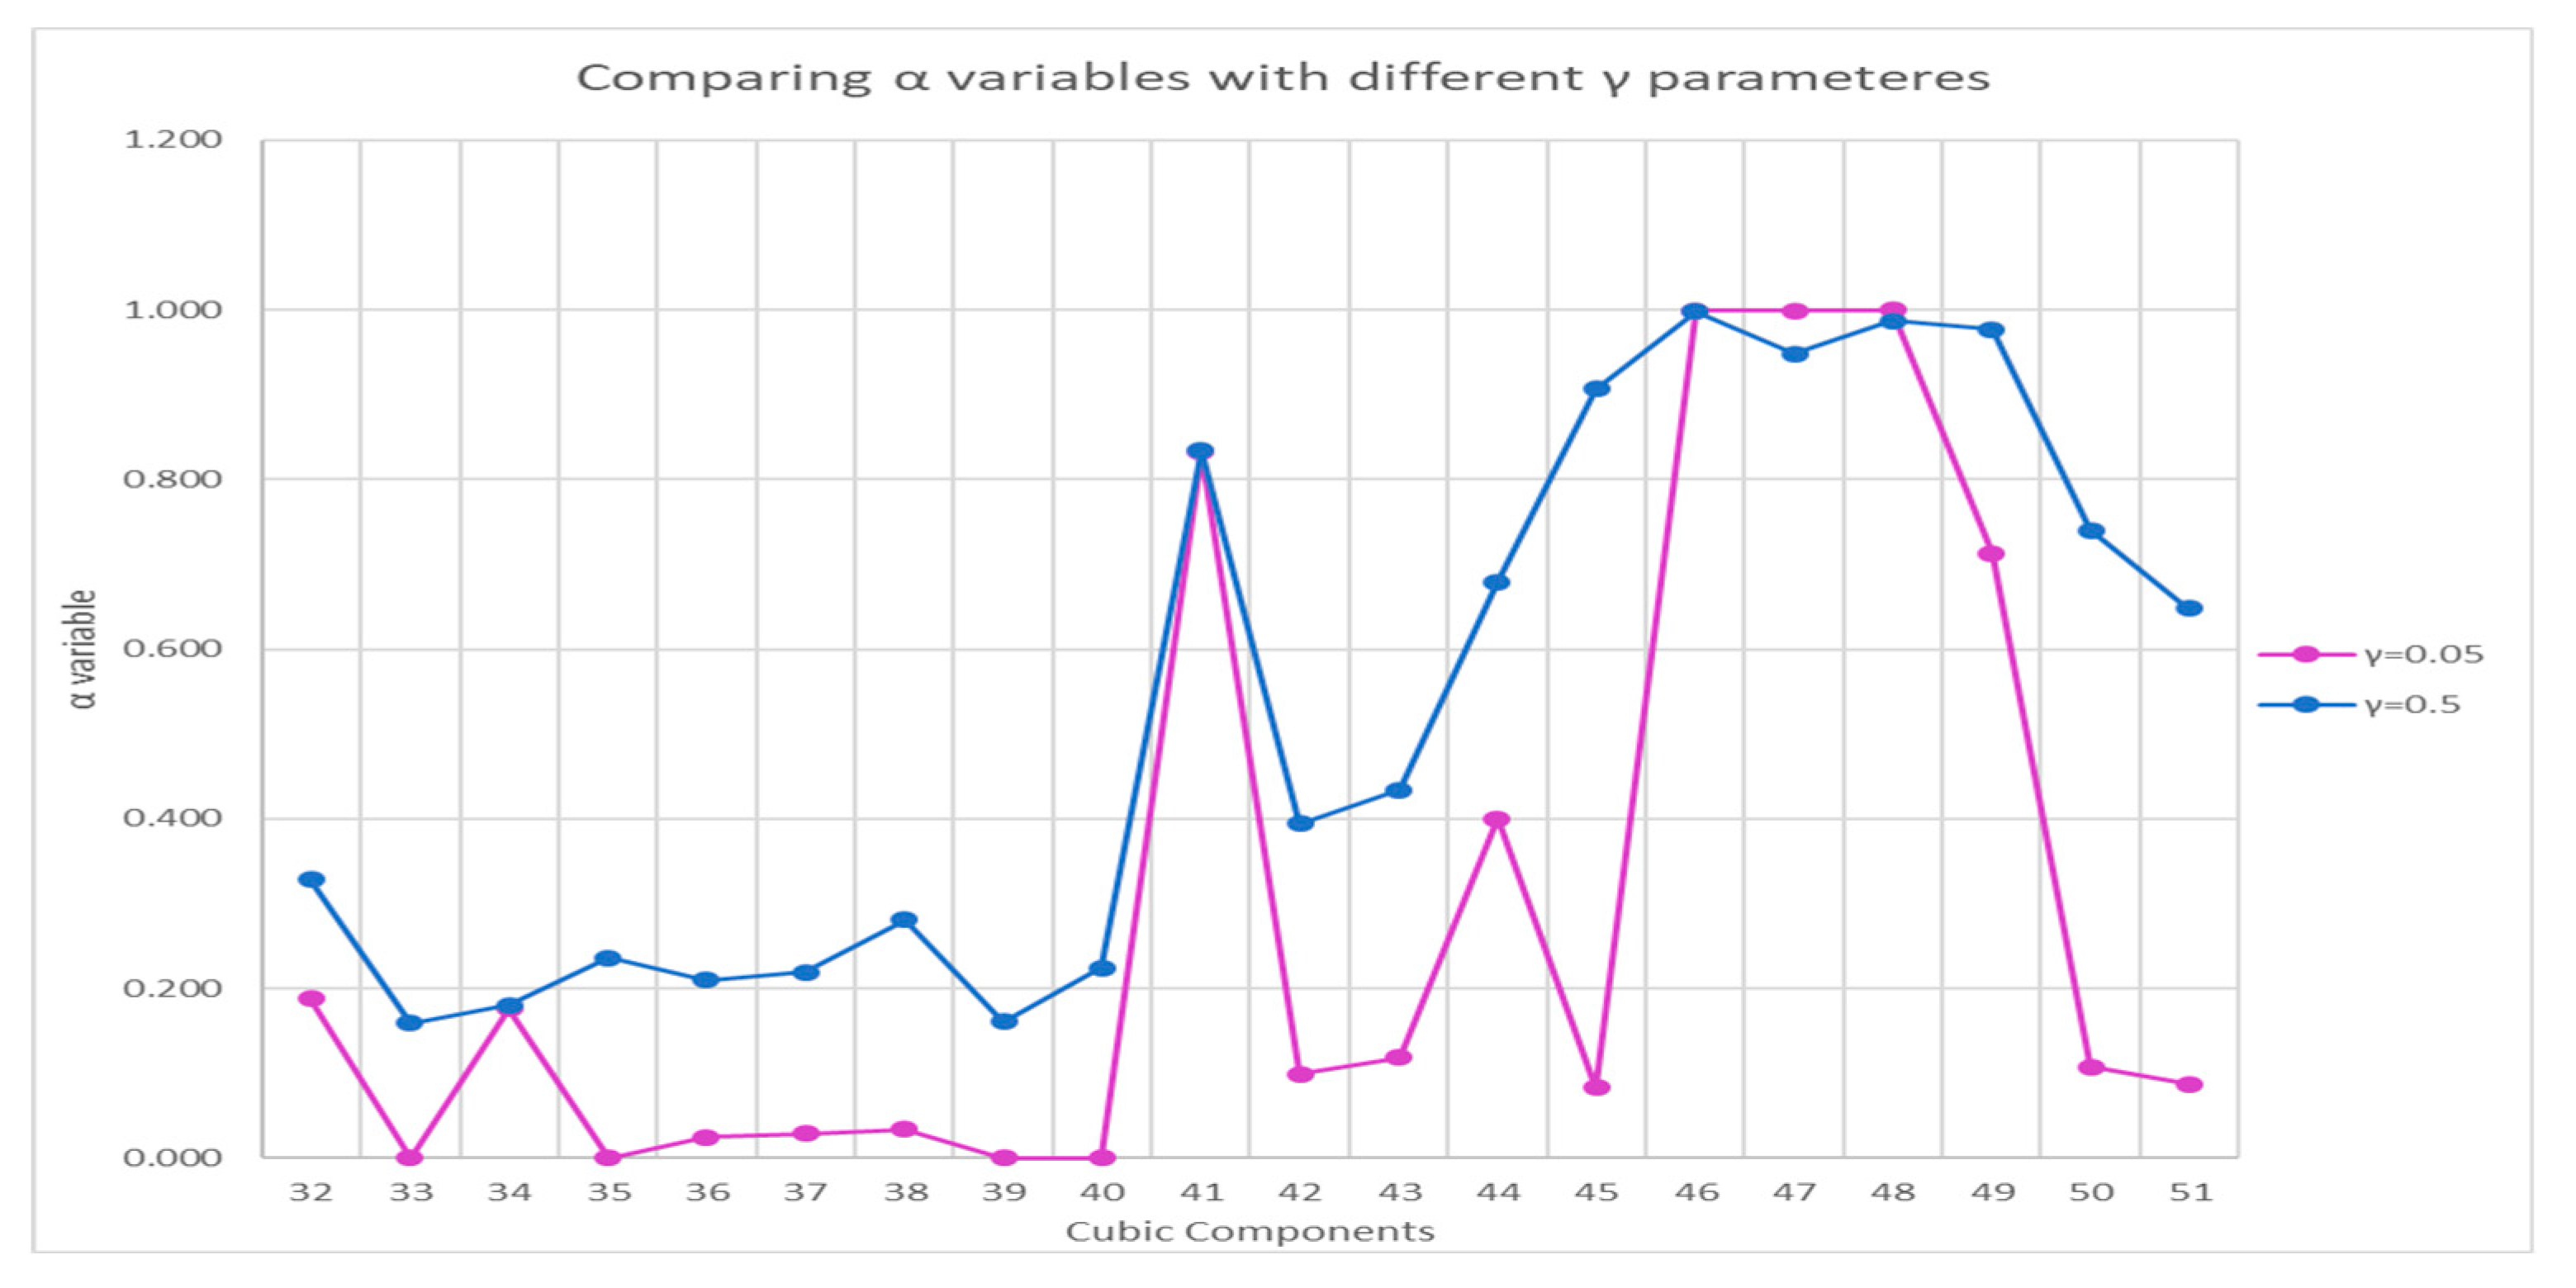
In the RFPM, the model provides a better answer in all cases; however, in case γ = 0.5 , this difference is more pronounced than in other flexible cases, as the penalty coefficients are increased and the model attempts to reduce the value of the objective function, causing the minimum variables Satisfaction levels ( α ) to take on greater values. The values of the minimum satisfaction level variables (α) for γ = 0.05 and γ = 0.5 were compared. As shown in Figure 6, the satisfaction level at γ = 0.5 has higher values, which, as previously stated, is due to the model’s desire to reduce the objective function, but can prevent greater flexibility of soft constraints and increase the values of moment of inertia by increasing the distances between equipment.
Therefore, moments of inertia must also be compared to conclude the best case of the penalty coefficient.
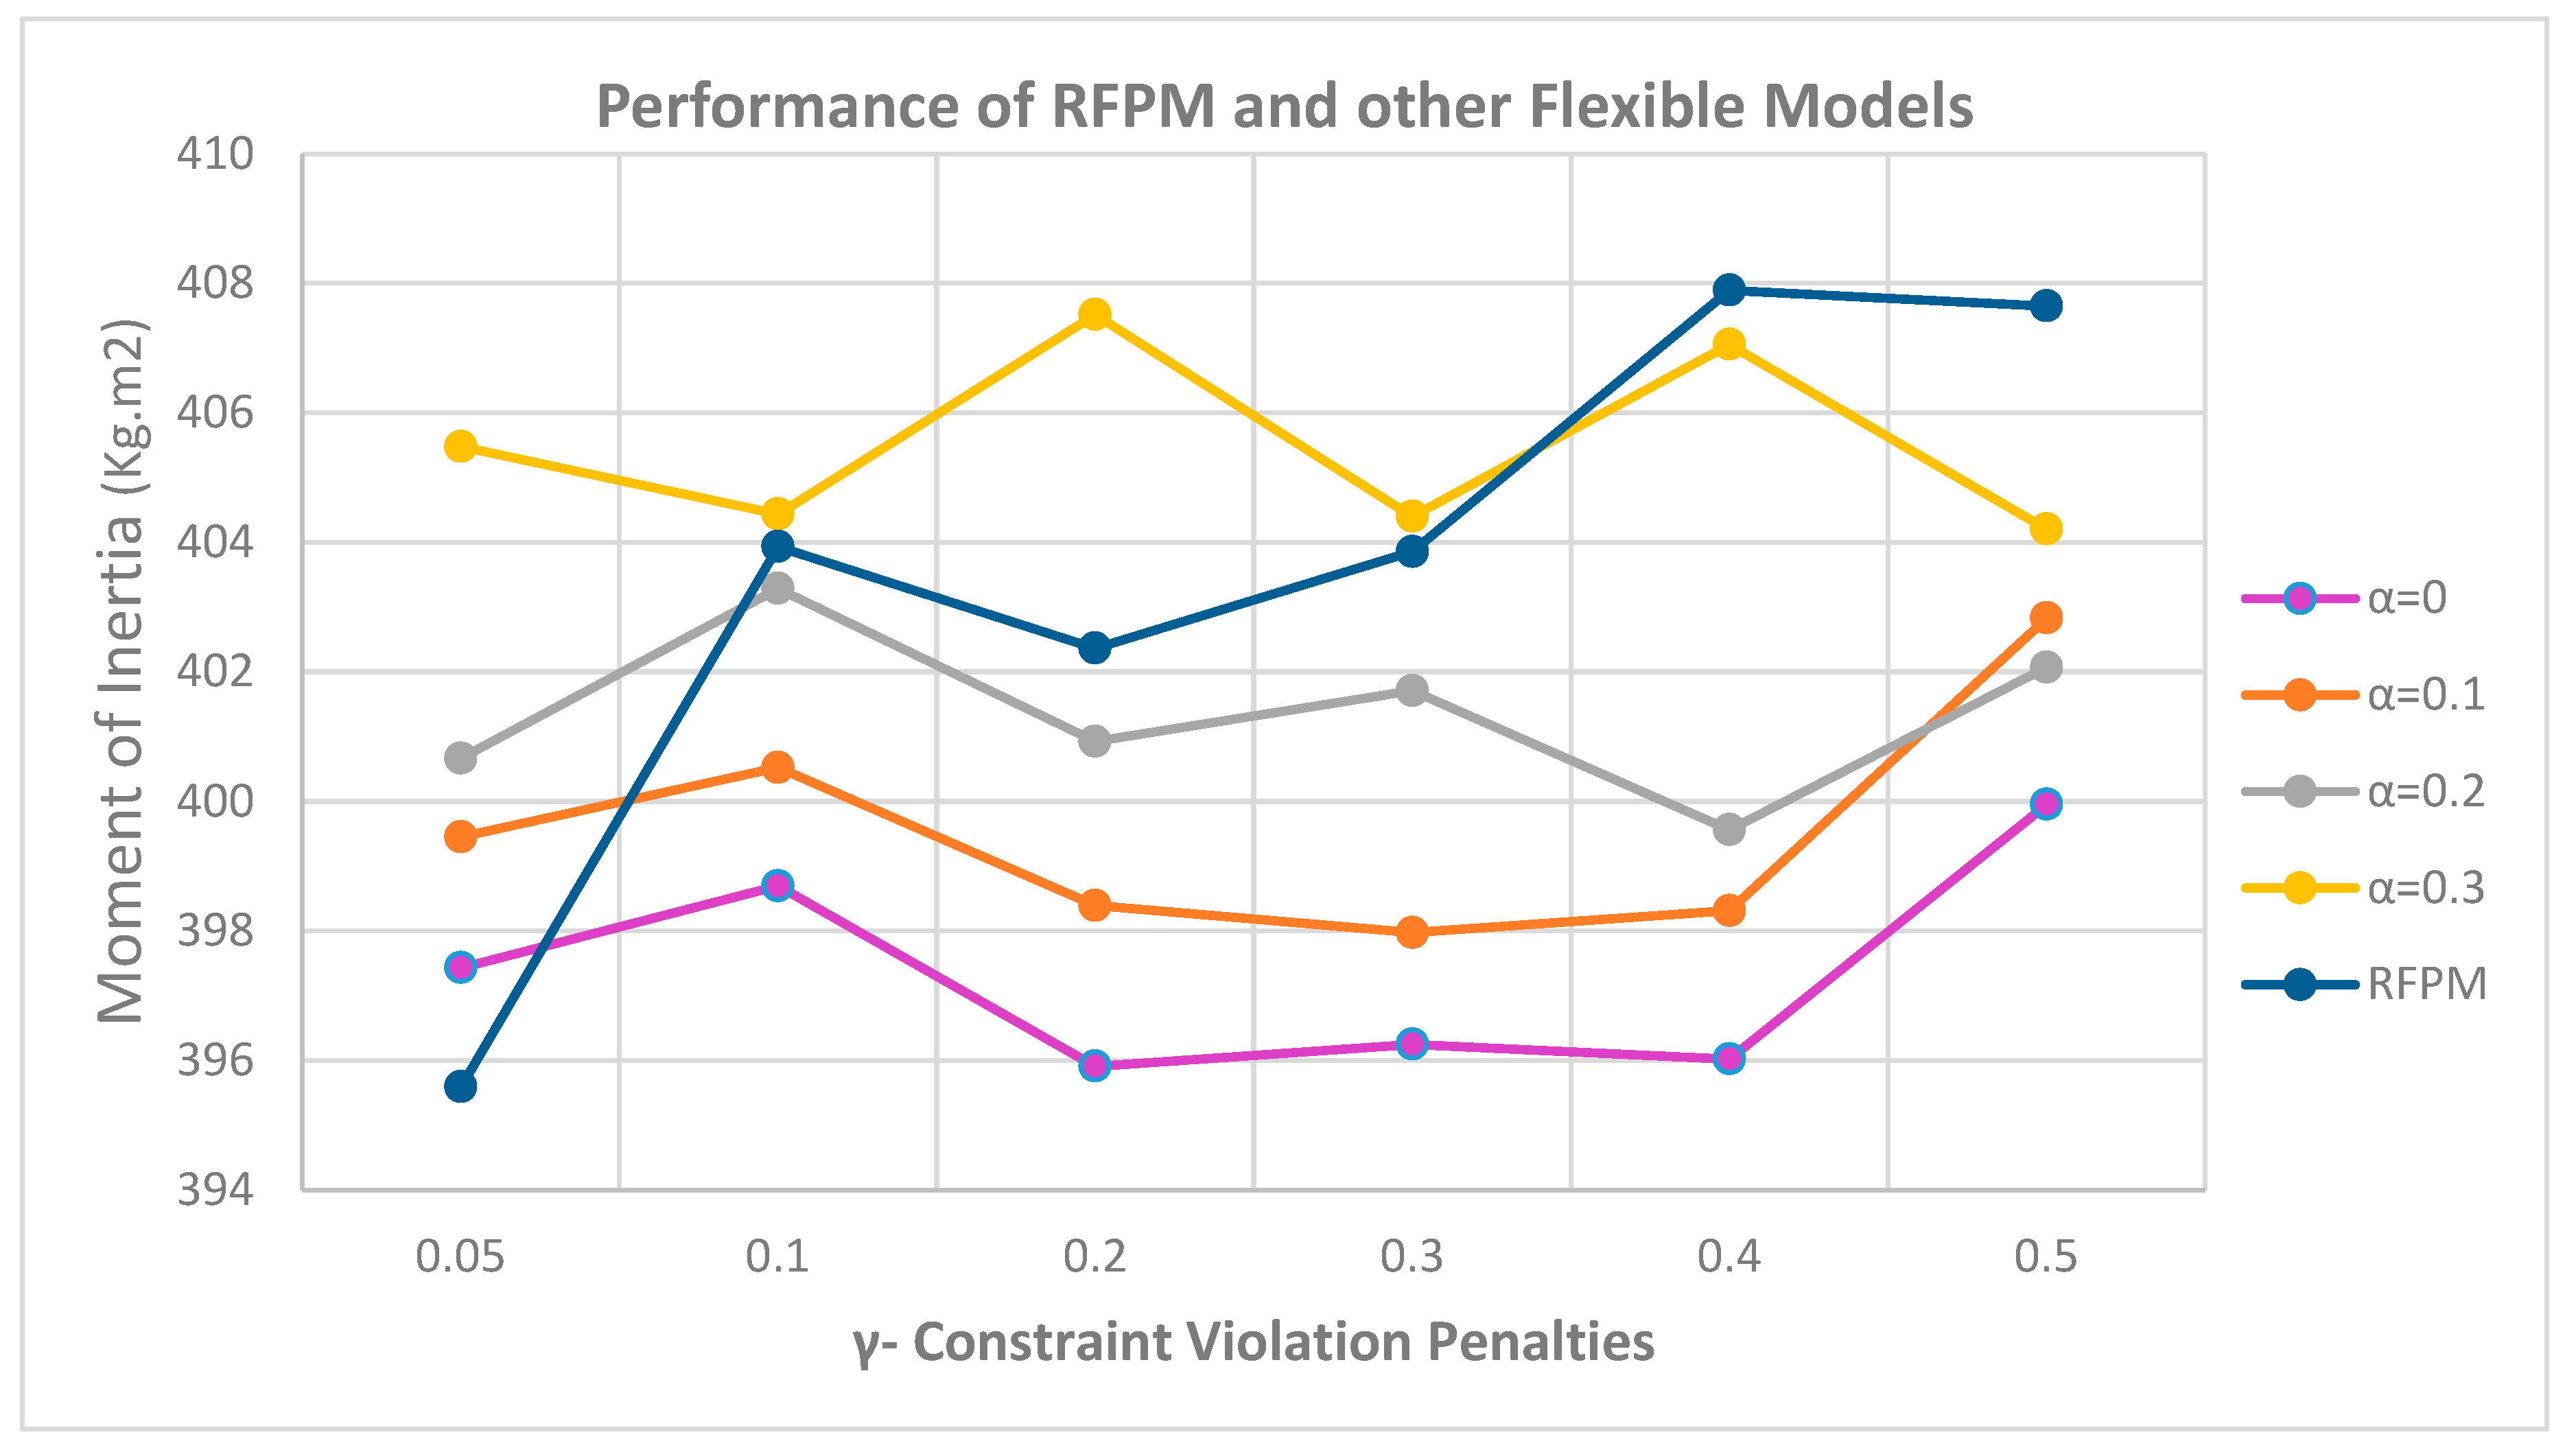
The total of moments of inertia in the principal directions of the coordinate axes was also examined for the aforementioned models to determine with which coefficient the model yields the most accurate response. The outcomes are depicted in Figure 7.
As depicted in Figure 7, the greater the minimal satisfaction level ( α ) in flexible models, the greater the radius estimated in the cuboid equipment to become a circumscribed circle. It tends to place equipment further apart from one another, hence increasing the total moments of inertia. The intriguing phenomenon is the distinction between modifying the model’s trend in RFPM and flexible models in return for increasing the penalty coefficient for violating soft constraints. This indicates that by increasing the penalty coefficient, the RFPM produces a superior sum of moments of inertia output. Consequently, the optimal instance for this model occurs when γ = 0.05 ;
Because as this coefficient increases, to avoid increasing the objective function of the model, it tries to increase the value of the minimum satisfaction level ( α ), but the RFPM prevents this from occurring so that the soft constraints are met and the value of is not excessively high, causing the objective function to be greater than the flexible states; As a result, the best case of a RFPM is when the value of the penalty coefficient is γ = 0.05 . In cases where the cost factor is less than this value, the model loses efficiency because the penalty for violating the soft constraints on the objective function is drastically reduced, the model tends to zero the minimum satisfaction level ( α ), and flexible constraints are at their softest state, which increases the probability of equipment overlapping.
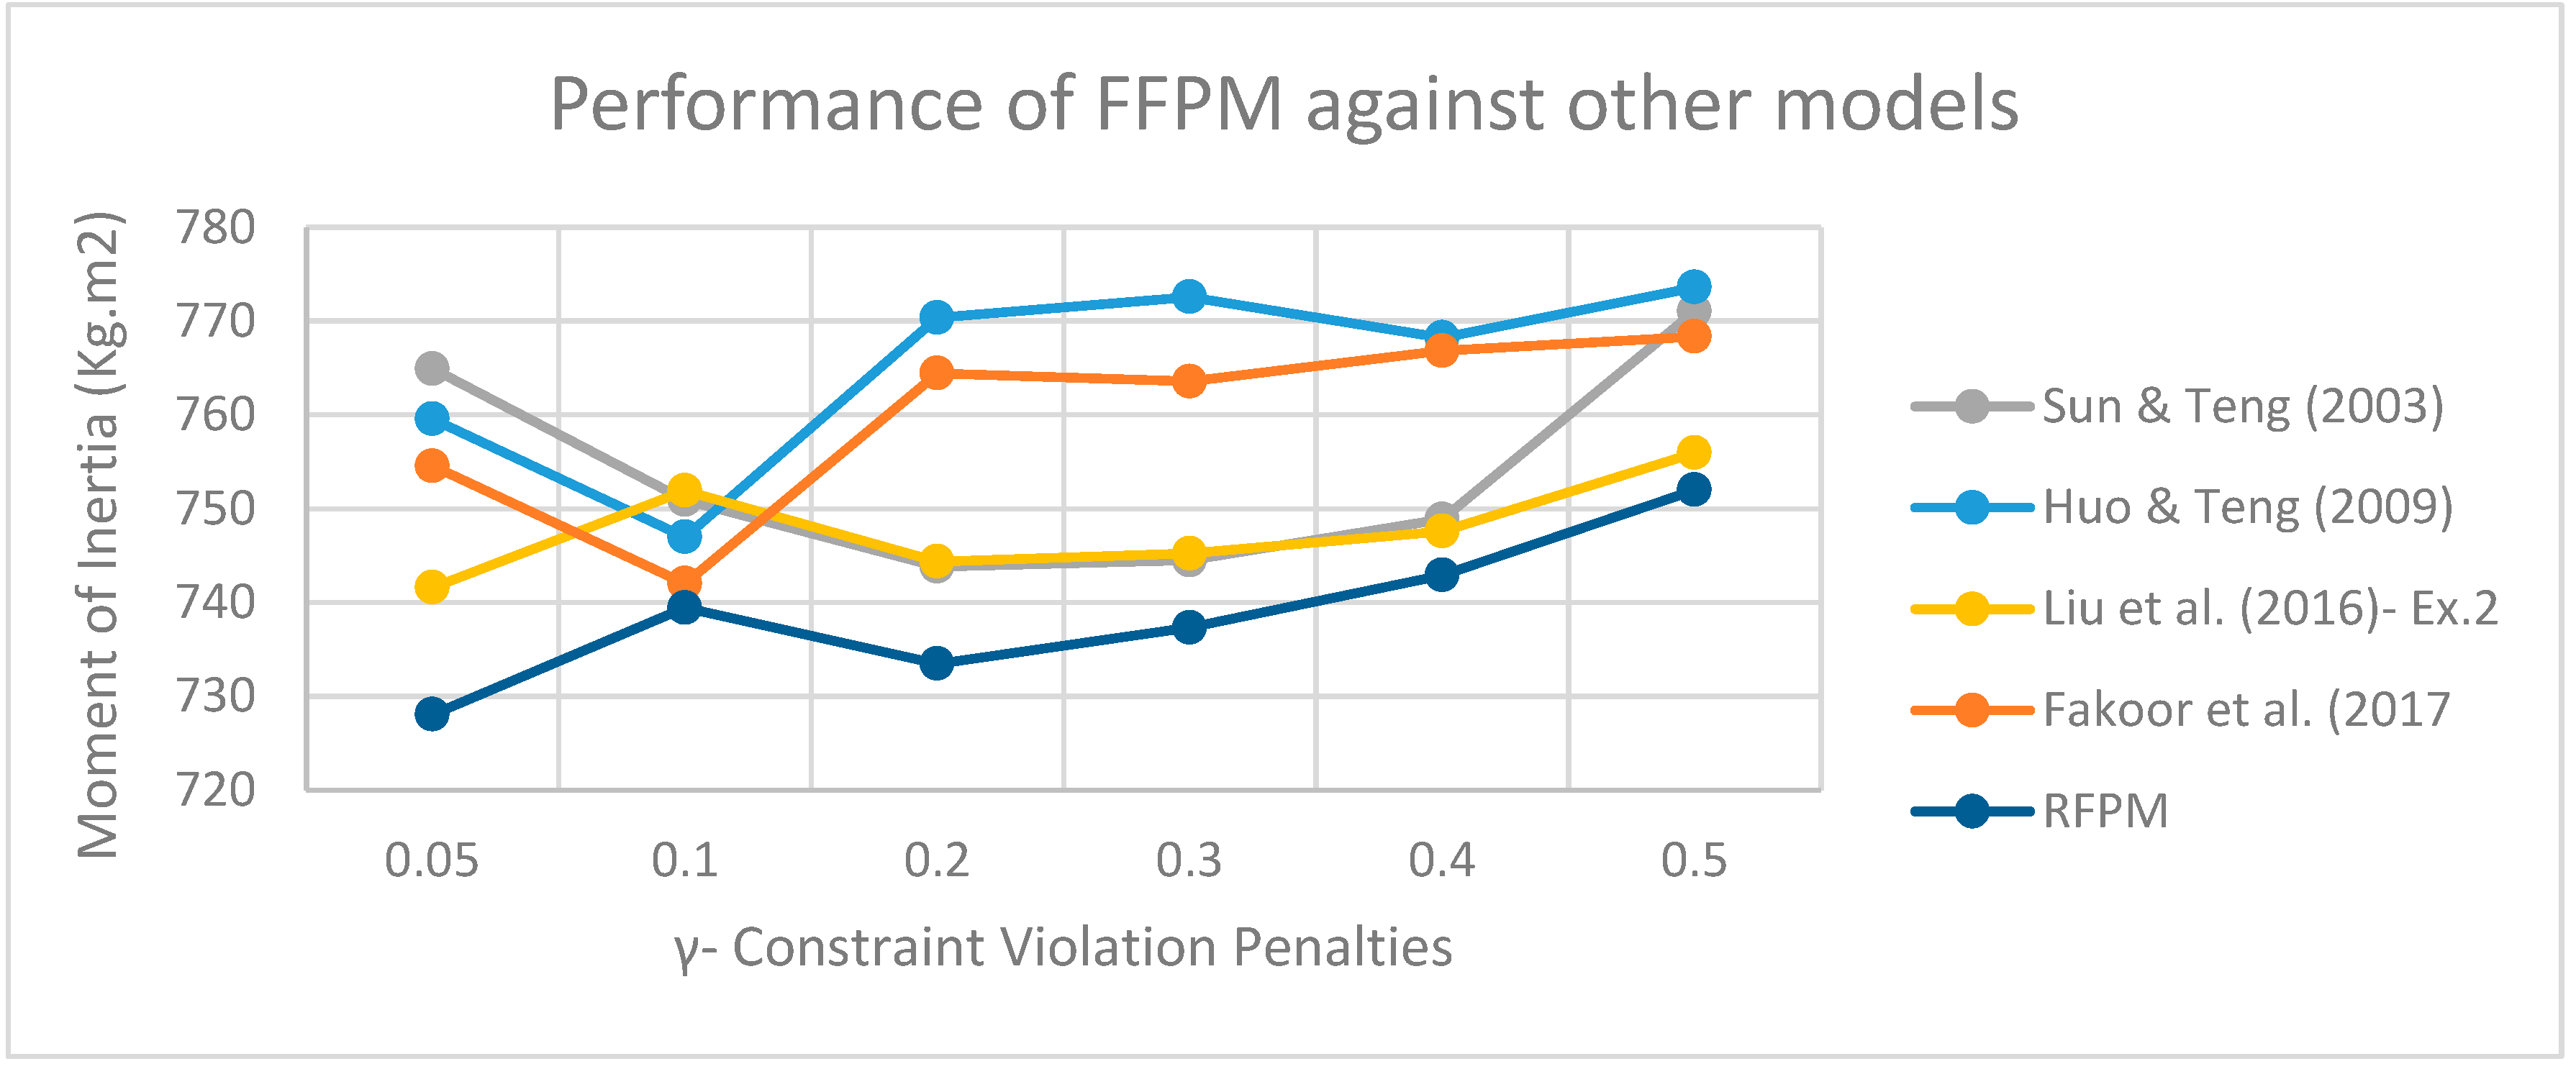
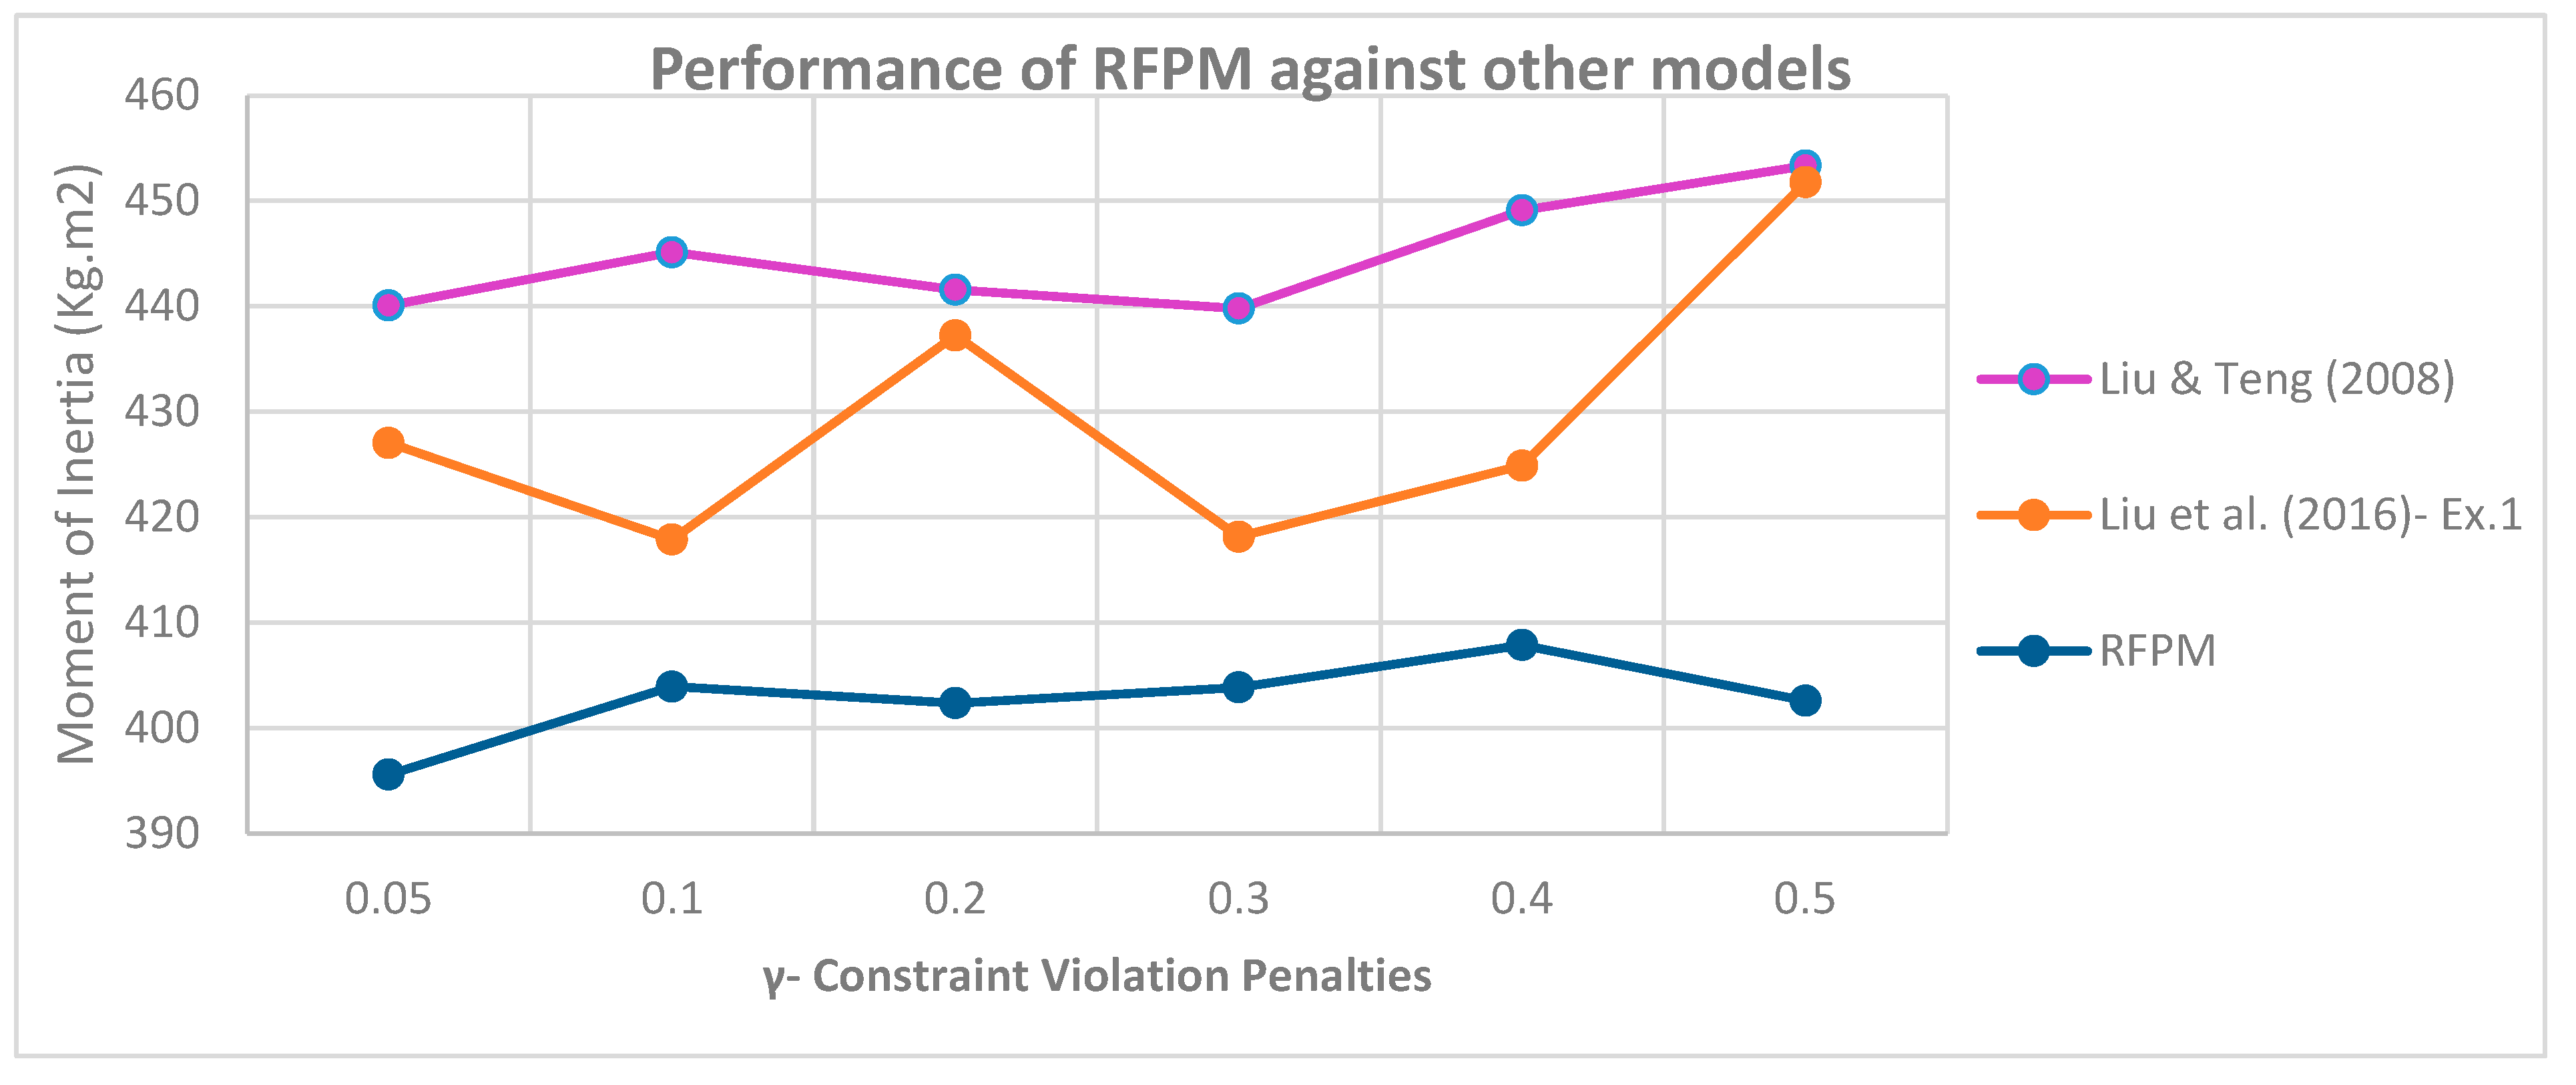
Now that it has been determined that the RFPM is more capable than the other flexible models, we will compare this model to the models proposed in prior articles. Here, four articles that used this example in their case studies were analyzed, and the data from each article were used as input for the suggested robust model based on the existing equipment positions on different satellite layers. In addition, the model was applied to these data. The outcomes are depicted in Figure 8.
As shown in Figure 8, the suggested RFPM has a lower total number of moments of inertia than previous articles in all scenarios of penalty coefficients for violation of soft constraints. Also, the proposed RFPM has the lowest values for the sum of moments of inertia at γ = 0.05 .
There has been a 1.75 percent improvement when comparing the moments of inertia from Liu et al. (2016) (741.6 kg.m2) and the suggested RFPM (728 kg.m2). It implies that if an identical force is required to spin these two satellites, at least 13 kilograms of mass could be conserved. This quantity of improvement will be vital for satellite design specialists to increase the functionality of their products in the field of satellite launching where the reduction of every single kilogram would be essential to have a more successful mission.
As can be seen, as the penalty coefficient increases, the values of moments of inertia tend to increase due to the objective function attempting to reduce the penalty values, resulting in less flexibility of soft constraints, which causes equipment to be placed far apart from one another, thereby increasing the total moments of inertia.
Case Study 2: investigating the work of Zhang et al. (2008)
In this example, there are 60 pieces of equipment, of which 24 pieces of equipment are cuboids and 36 pieces of equipment are cylindrical. In this example, the satellite equipment is arranged in two levels and 4 layers. The parameters of the satellite body are as follows: the radius of the circular cross-section of the satellite surfaces is 500 mm, the radius of the middle cylinder of the satellite connecting the surfaces is 100 mm, the H1, H2 and Ht parameters are 300 mm, 830 mm and 1150 mm respectively and the diameter of the first and second levels is 20 mm each.
The mass of the empty satellite consists of 4 plates (two middle levels and two floor and top levels of the satellite), the satellite shell and its middle cylinder are equal to 576.53 kg. To perform more accurate calculations, it was assumed that the density of materials used in the body of this satellite was 3.006 g/cm3 (a combination of aluminum and titanium alloys) and the thickness of the satellite’s shell was 24.5 mm.
Also, the two middle plates on which the components are placed were considered as hollow cylinders with inner and outer diameters of 100 and 500 mm, respectively, and the upper and lower plates were considered as complete cylinders with 100 mm diameter. With these hypotheses, the weight of each part in the empty chamber of the satellite was calculated and the moment of inertia of the empty satellite was calculated as I x 0 = I y 0 = 133.24 and I z 0 = 98.4 kg.m2.
Since the moment of inertia is higher than the empty state of the satellite when the components are added to the empty container of the satellite, it is expected that the values ​​obtained from the moment of inertia in each of the principal directions of the coordinate axes are greater than the values ​​calculated for Empty satellite compartment. Also, the coordinates of the centre of gravity of the empty satellite were calculated as C0 = (0,0,595).
After that the case was introduced by Zhang et al. (2008), Five articles including Wang et al. (2009), the second example by Teng et al. (2010), Cui et al. (2017), Zhong et al. (2019) and the third example in the article Chen et al. (2021) also used the data of this numerical example and compared their results with each other. Li et al. (2016) also utilized this numerical data but the output places of equipment were not organized diagonally therefore the findings were not comparable here. With the assumptions mentioned above and according to the coordinates of the equipment after placement that are available in the mentioned articles, the moments of inertia were recalculated and the results were compared, which can be seen in Table 5.
As depicted in Table 5, the best answer in these articles is related to the article by Zhong et al. (2019) in which the objective function is less than other articles. Therefore, in this paper, we use the output to determine θ i in cuboid equipment. As explained in Case Study No. 1, here, according to the heuristic method presented in Section 4.1.1.1, all possible modes of equipment allocation to different layers for this data were examined and 25 feasible modes of equipment allocation were obtained.
Here, each of these feasible modes was implemented using the RFPM presented in Section 4.1.2.1 and by GAMS software, and the results were compared with other papers that used this numerical example (Table 6).
As can be seen from the table, the minimum sum of moments of inertia in the main directions of the coordinate axes is equal to 578.49 kg / m2, and also in 24 feasible states, the sum of moments of inertia is slightly better than Zhong et al. (2019). Figure 9 and Table 7 show the output of the model in the case where the sum of the moment of inertia is at its minimum possible (layout of equipment on different layers of the satellite) and the coordinates of the equipment in this optimal state respectively.
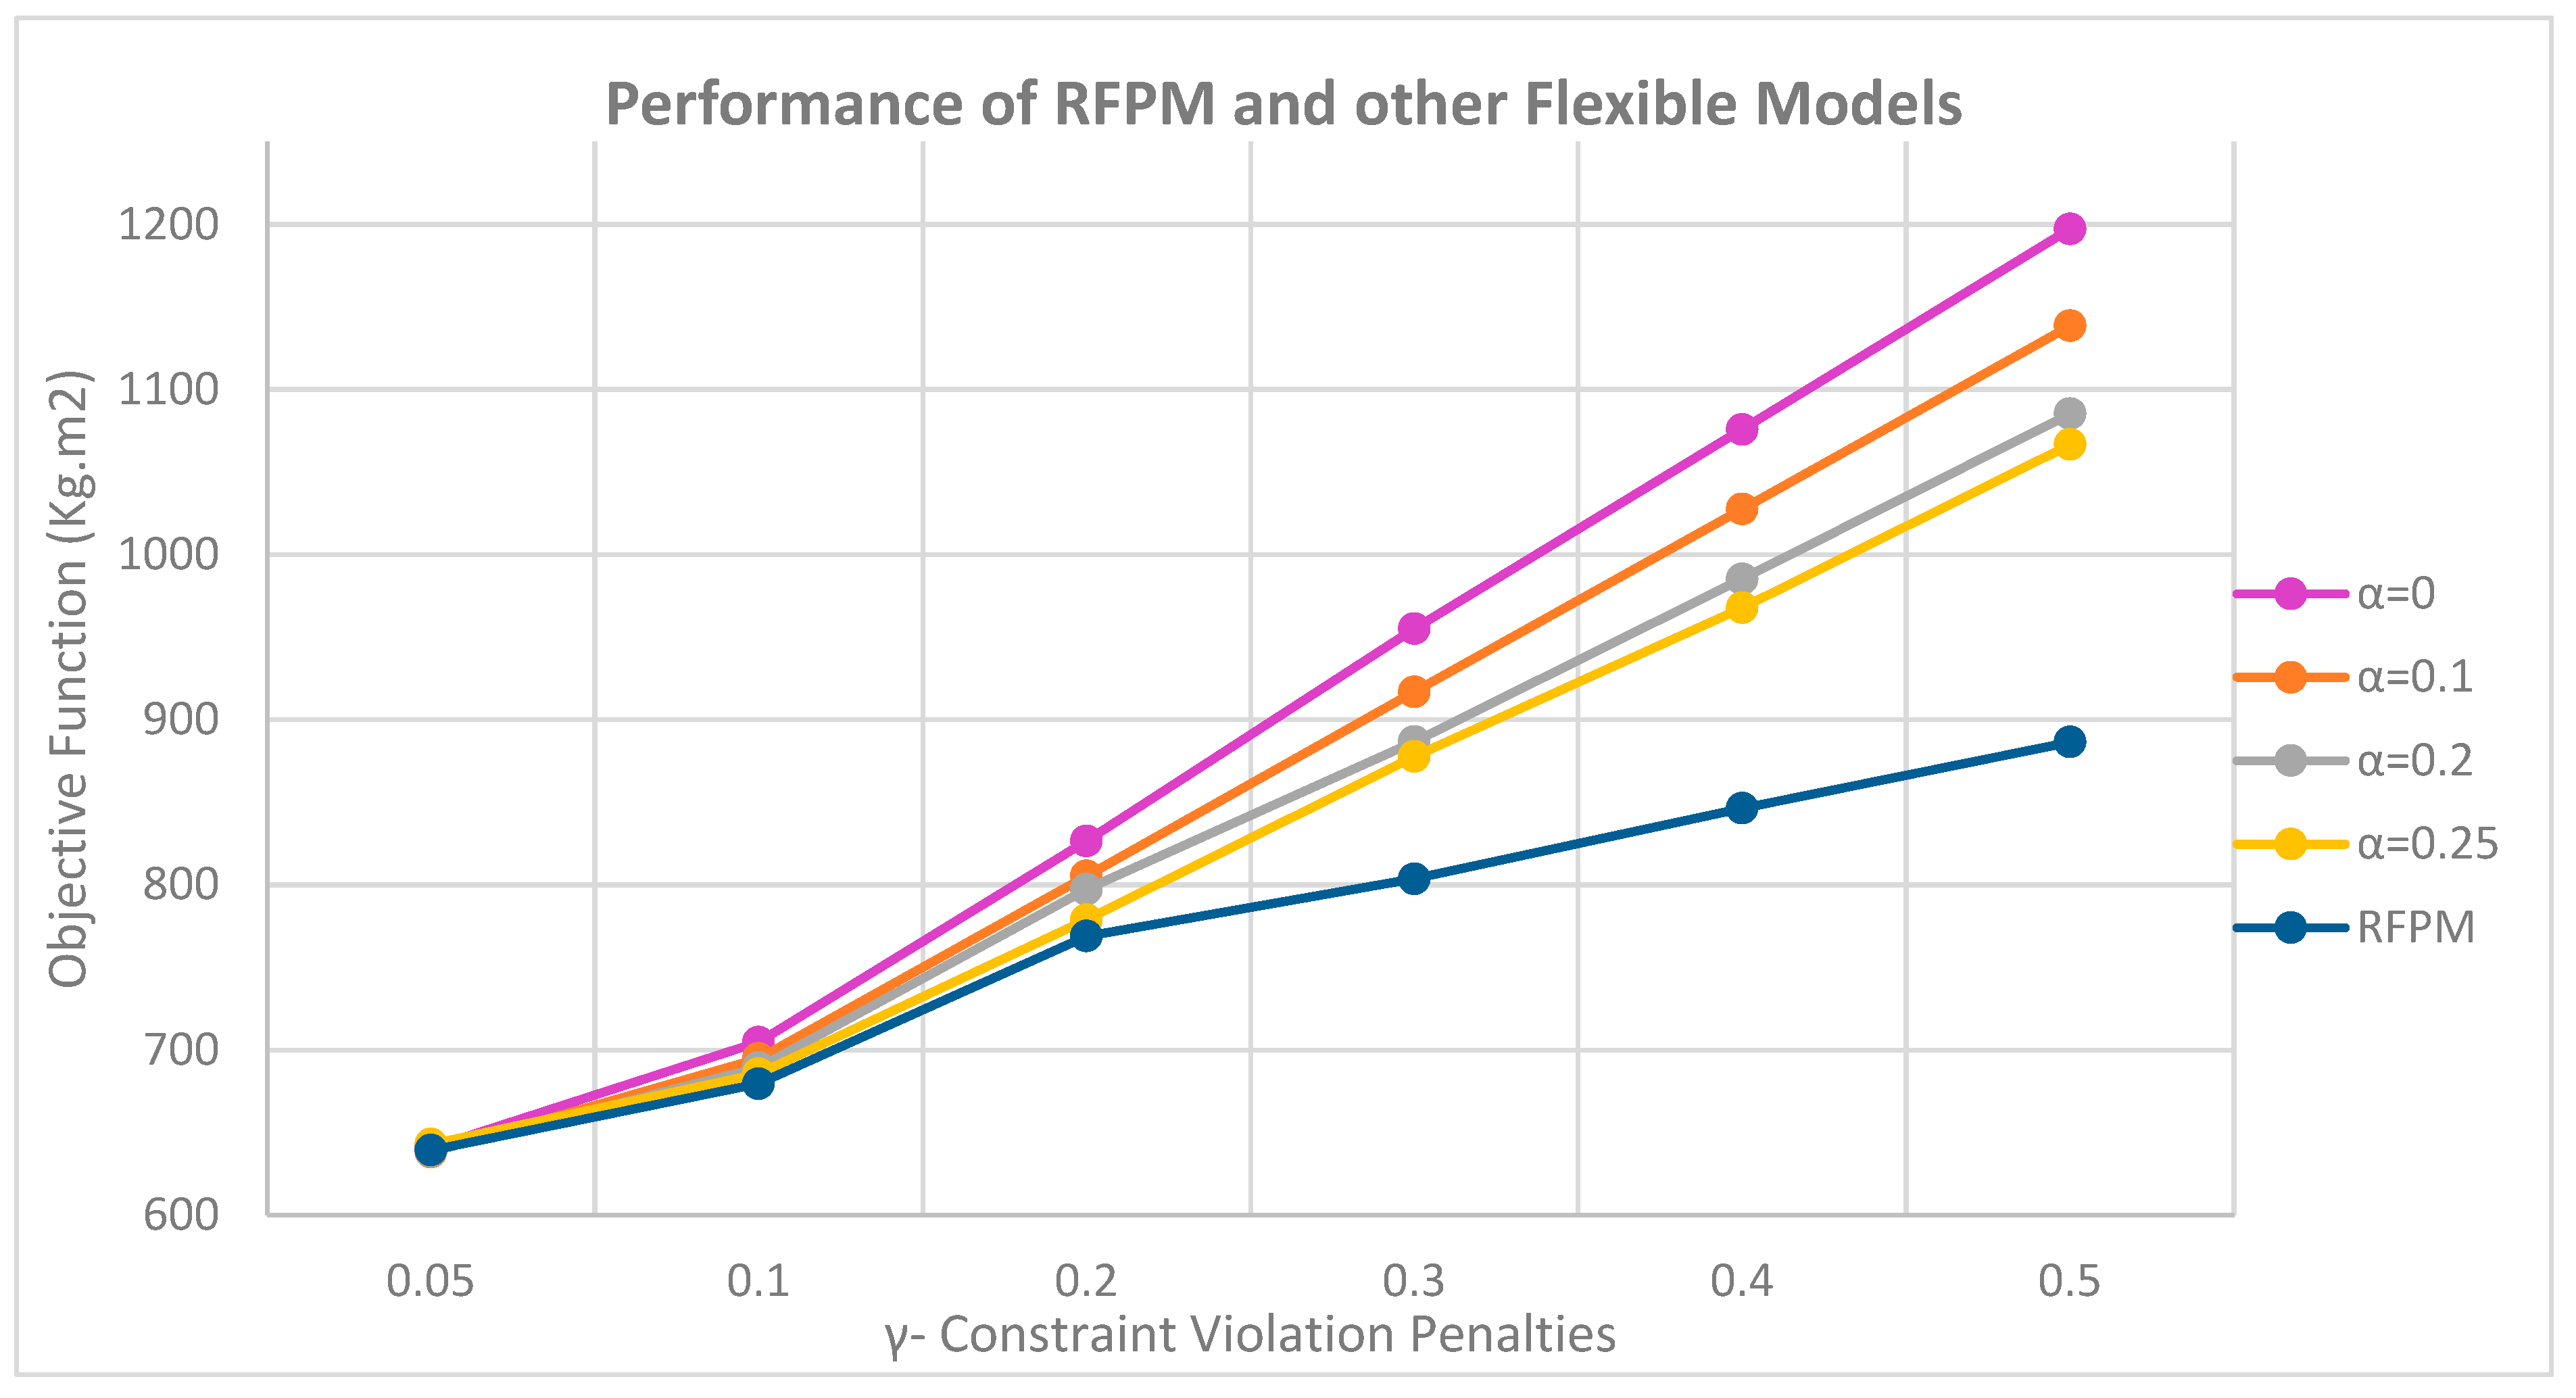
To compare the best answer obtained from the possible answers (Table 6) with the flexible model in the flexible state, we run the model in all possible modes and compare the objective functions with each other. The results can be seen in Figure 10.
As illustrated in Figure 10, in cases where the minimum level of satisfaction for exceeding the flexible constraints ( α ) is greater than 0.25, the models will not be responsive in the flexible state because, as in Case No. 1, if this parameter tends to 1, the constraint loses its flexibility and the radius of the rectangular of cuboid equipment becomes the radius of their circumference and the constraint of non-overlapping between the equipment will not be practically met. The only difference with Case Study No. 1 is that in flexible states, the minimum level of satisfaction becomes infeasible if it is greater than 0.25.
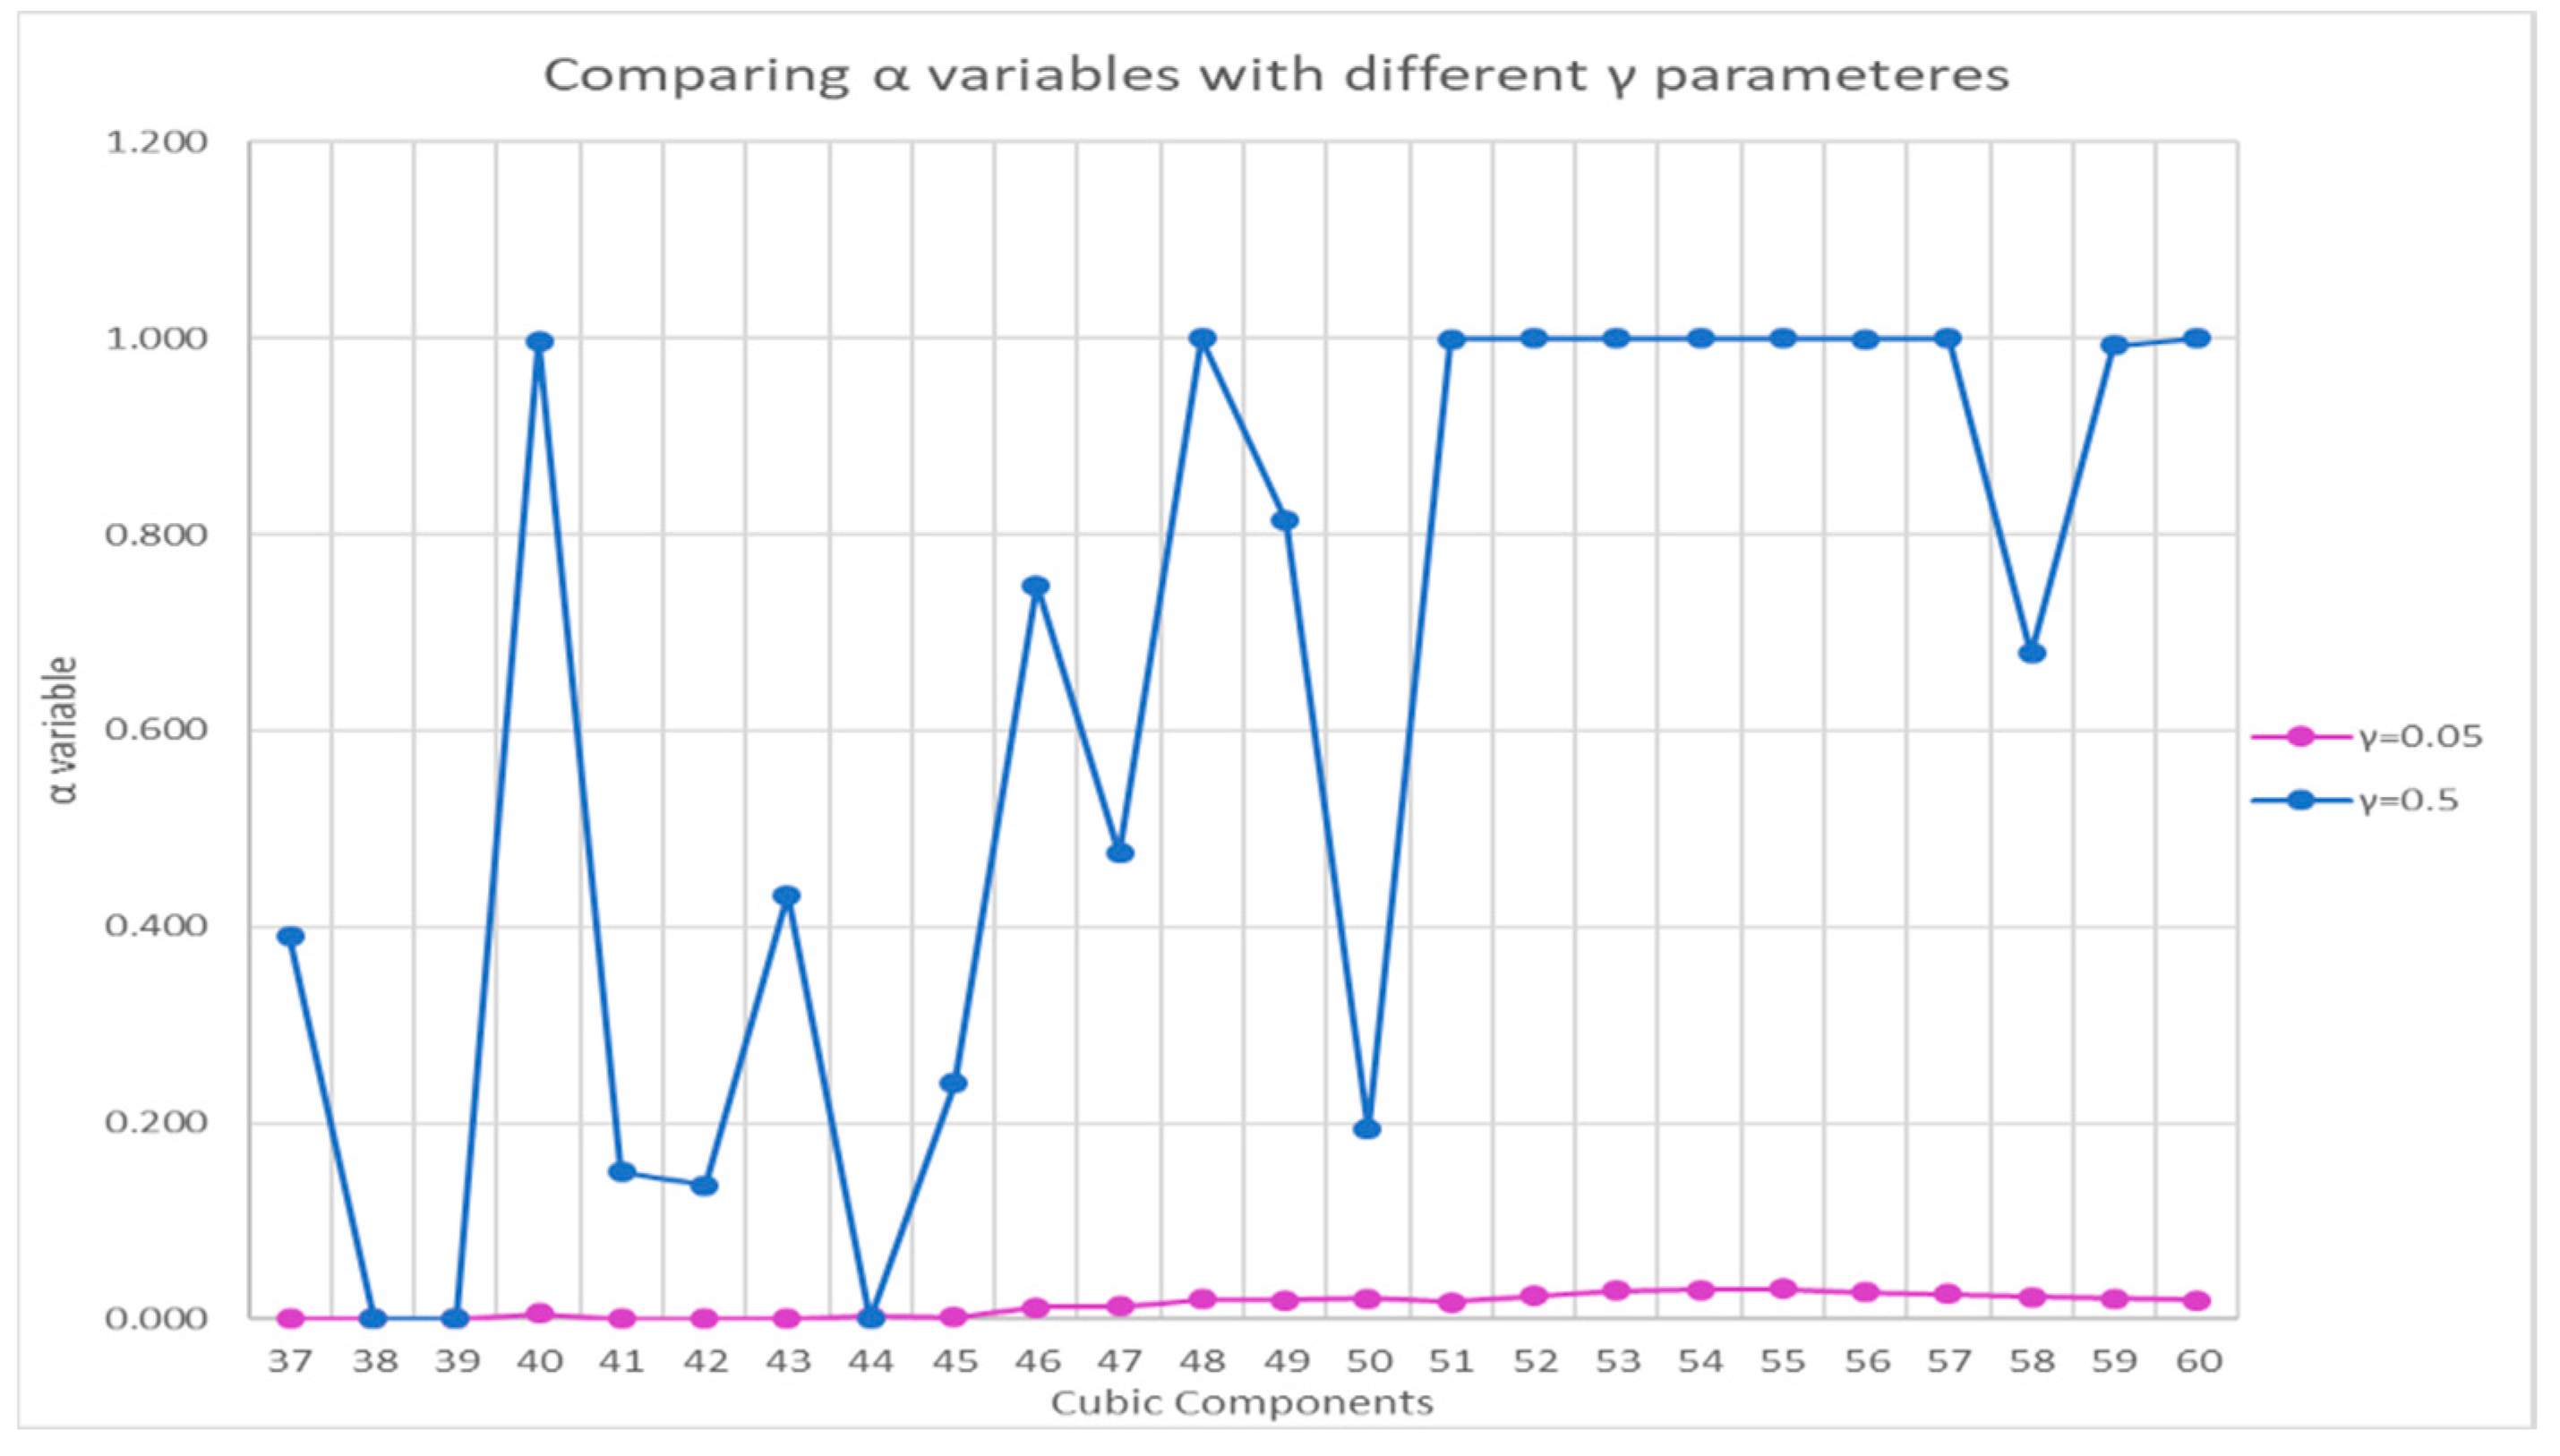
This is due to the increased quantity of positioning equipment, which reduces the flexibility of the non-overlap constraints by increasing the ( α ) variable and making the model infeasible. As previously, the objective function values increase as the penalty coefficient for violating the flexible constraints ( γ ) in the objective function increases. In reality, in flexible models with a smaller ( α ) variable, increasing ( γ ) will increase the objective function more. In the RFPM, the model behaves similarly to the first case study, and at γ =0.5, the difference in the output of the objective function between the robust and flexible models becomes more obvious. As before, Figure 11 presents, for greater clarity, the minimal satisfaction level variables obtained for these two modalities.
Observing Figure 11 and similar to Case Study No. 1, it is evident that at γ = 0.5 , greater values are obtained for the variable, but this leads to an increase in moments of inertia. This case demonstrates substantially lesser values for ( α ) variables than Case Study No. 1 due to the bigger quantity of equipment. It indicates that soft constraints must be set to their softest mode to prevent components from overlapping.
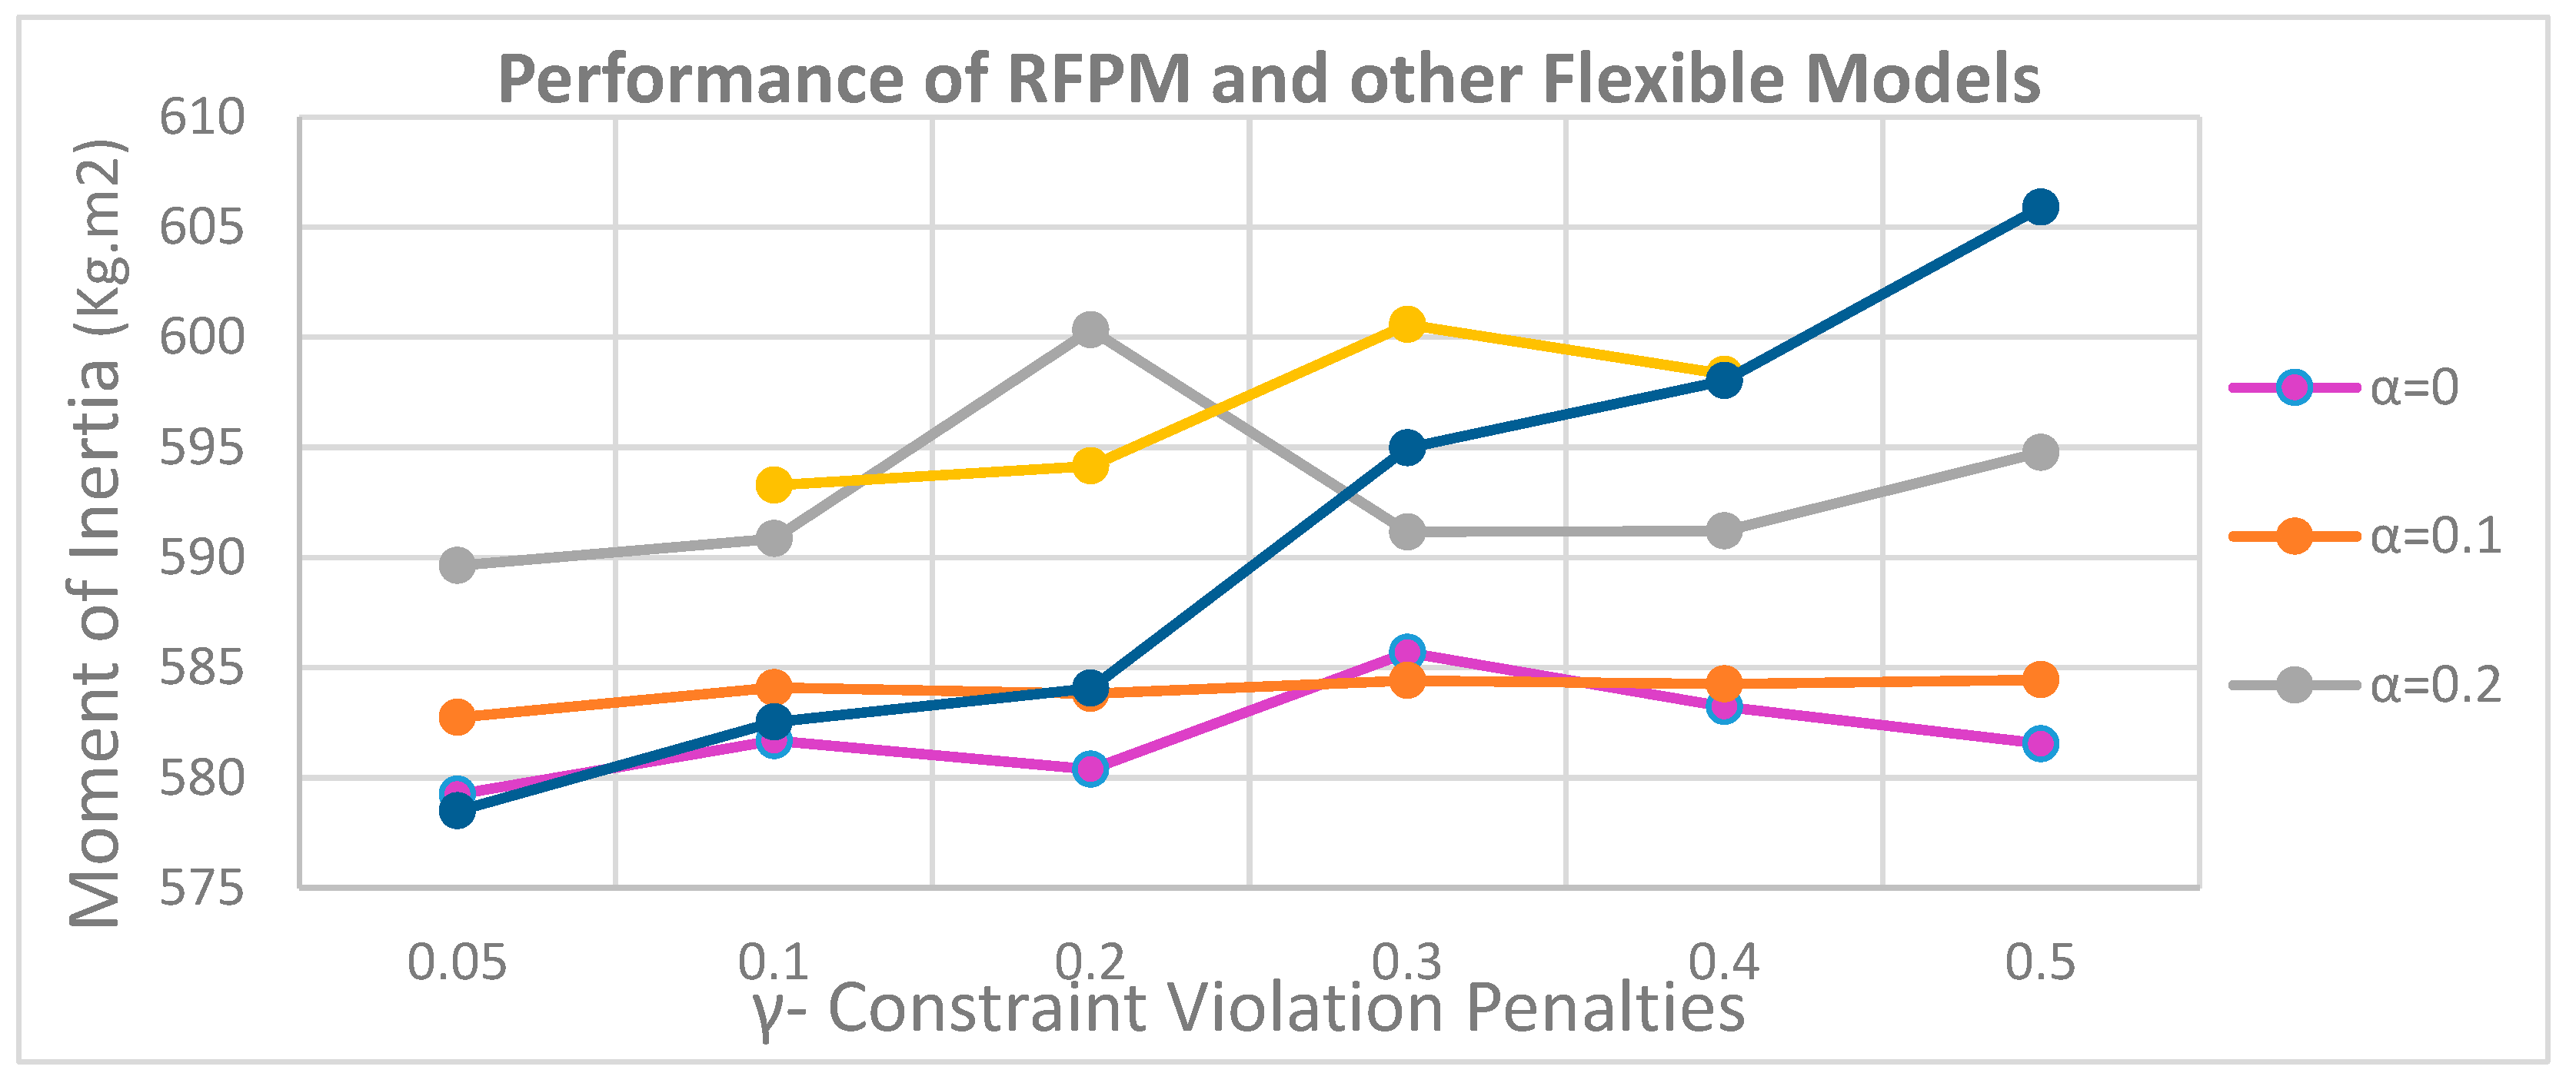
Therefore, the sum of moments of inertia in the main directions of the coordinate axes was also compared for the mentioned models, and the results can be seen in Figure 12.
As depicted in Figure 12, the behavior of the models has not changed significantly since Case Study No. 1, and it is only due to the increase in the number of equipment that the flexibility of soft constraints becomes more important; even in the flexible Models where the minimum satisfaction level ( α ) exceeds 0.25, the model is infeasible. Similarly, by increasing the penalty factor ( γ ), the model in its robust form will gain more moments of inertia, due to the tendency of the model to shrink the objective function and increase the α variables, as well as the tendency of the equipment to move away from one another and raise the moments of inertia.
As a result, the best case of a RFPM is when γ = 0.05 . As said before, in cases of less than this value for the cost factor, the model loses its efficiency because the penalty for violating the soft constraints in the objective function is sharply reduced and the model tends to zero the minimum level of satisfaction (α) and Makes flexible constraints at their softest mode, increasing the likelihood of equipment overlapping.
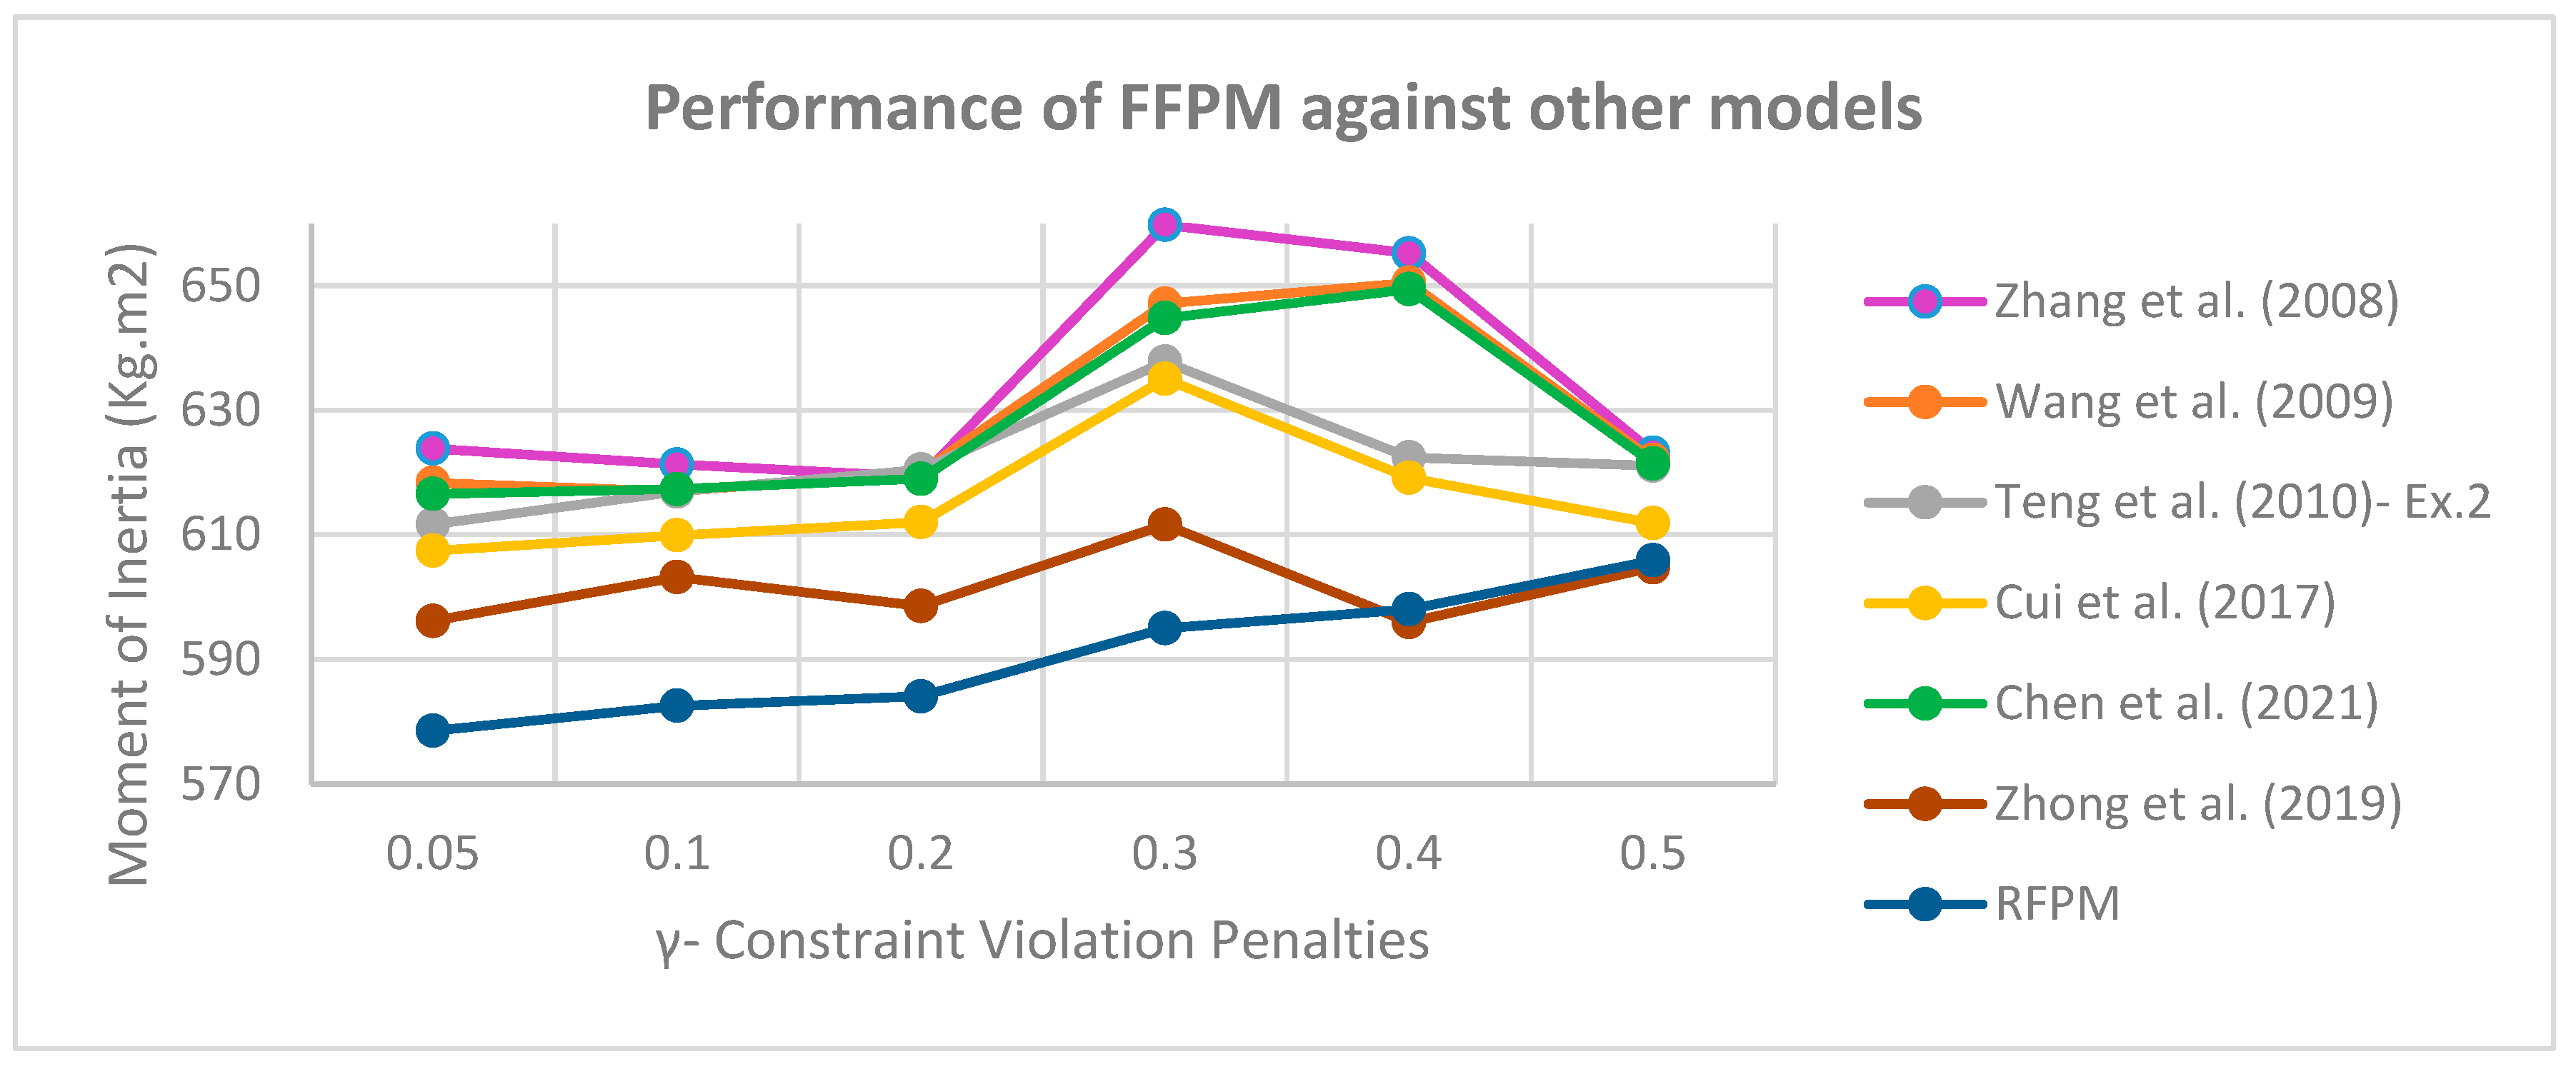
Now that it has been found that the RFPM has a higher capability compared to the other flexible models, we now compare this model with the proposed models in similar articles. Here, five articles that used this example in their case studies were reviewed and according to the existing equipment layout on different satellite layers that were available in the articles, the data of each article were used as an input for the proposed RFPM and the model was implemented for these data. The results are shown in Figure 13.
As depicted in Figure 13, the sum of moments of inertia in the suggested RFPM in circumstances when the penalty coefficients for violation of soft constraints are less than 0.3 provides a significantly superior solution than other articles. Compared to Zhong et al. (2019), the sum of moments of inertia has increased marginally only in cases γ = 0.4 and γ = 0.5 . This is to confirm that the best choice for the value of the penalty coefficient occurs in the case γ = 0.05 and that increasing this coefficient reduces the model’s efficiency. Therefore, similar to case study No. 1, an improvement of 2.95 percent has been made when comparing the moments of inertia in Zhong et al. (2019) (596.1 kg.m2) and the suggested RFPM (578.5 kg.m2). It means that if an identical force is required to spin these two satellites, at least 17.6 kilograms of mass could be preserved.
Case Study 3: investigating the work of Liu and Teng (2008)
Liu and Teng (2008) utilized the data from Li (2003). In this example, there are 51 pieces of equipment, of which 20 pieces of equipment are cuboid and 31 pieces of equipment are cylindrical. In this example, the satellite equipment is arranged in two levels and 4 layers. The parameters of the satellite body are as follows: the radius of the circular cross-section of the satellite surfaces is 500 mm, the radius of the middle cylinder of the satellite connecting the surfaces is 100 mm, the H1, H2 and Ht parameters are 500 mm, 1050 mm and 1400 mm respectively and the diameter of the first and second levels is 20 mm each.
The mass of the empty satellite consists of 4 plates (two middle levels and two floor and top levels of the satellite), the satellite shell and its middle cylinder are equal to 349.557 kg.
To perform more accurate calculations, it was assumed that the density of materials used in the body of this satellite was 1.766 g/cm3 (a combination of fiberglass, Kevlar and carbon fiber and aluminum and titanium alloys) and the thickness of the satellite shell was 20 mm. is. Also, the two middle plates on which the equipment is placed were considered as hollow cylinders with inner and outer diameters of 100 and 500 mm, respectively, and the upper and lower plates were considered as complete cylinders with 100 mm diameter. With these hypotheses, the weight of each part in the empty chamber of the satellite was calculated and the moment of inertia of the empty satellite was calculated as I x 0 = I y 0 = 101.556 and I z 0 = 56.686   kg.m2.
Since the moment of inertia is higher than the empty state of the satellite when the equipment is added to the empty container of the satellite, it is expected that the values ​​obtained from the moments of inertia in each of the principal directions of the coordinate axes are greater than the values ​​calculated for Empty satellite compartment. The coordinates of the centre of gravity of the empty satellite were calculated as C0 = (0,0,732.96).
Except for Liu and Teng (2008), the first example Liu et al. (2016) utilized these numerical example’s data and compared their results. Huo et al. (2007) also employed similar data but the coordinates of their layout output were not disclosed in that article to be compared with other researches. With the assumptions mentioned above and according to the coordinates of the equipment after placement that are available in the mentioned articles, the moments of inertia were recalculated and the results were compared, which can be seen in Table 8.
As can be seen in Table 8, the best answer in these two articles is related to Liu et al. (2016) in which the objective function has a lower value compared to another article. Therefore, in this paper, we use the output to determine θ i in cuboid equipment. Then, according to the heuristic method presented in Section 4.1.1.1, all possible modes of equipment allocation to different layers for this data were examined and 11 feasible modes of equipment allocation were obtained. Here, each of these feasible modes was implemented using the RFPM presented in Section 4.1.2.1 and by GAMS software, and the results were compared with the outcome of other papers that used this numerical example (Table 9).
As can be seen from the table, the minimum moment of inertia is related to the second possible state in which the total moment of inertia in the main directions of the coordinate axes is equal to 397.92 kg.m2, and on the other hand in all possible states the total moment of inertia is better than the article of Liu et al. (2016). Figure 14 and Table 10 show the output of the model in the case where the sum of the moment of inertia is at its minimum possible (layout of equipment on different layers of the satellite) and the coordinates of the equipment in this optimal state respectively.
To compare the best answer obtained from the possible answers (Table 9) with the flexible model in the flexible state, we run the model in all possible modes and compare the objective functions with each other. The results can be seen in Figure 15.
As shown in Figure 15, in cases where the minimum level of satisfaction for exceeding the flexible constraints ( α ) is greater than 0.3, the models will not be responsive in the flexible state because, as in case studies 1 and 2 It was stated that by increasing the value of ( α ), it loses its flexibility and the radius of the rectangular of cuboid equipment becomes their radius of circumference and as a result, the constant of non-overlap between the equipment will not be met.
The only difference with previous case studies is that in flexible states the minimum level of satisfaction becomes infeasible if it increases from 0.3. The reason is that the equipment occupies more space than case study No. 1, but this space is less compared to case study No. 2, and therefore in the case of α = 0.3 also offers a feasible model. As said before, by increasing the penalty coefficient for violation of the flexible constraints ( γ ) in the objective function, the objective will rise as flexible models with a lower minimum degree of satisfaction ( α ) increase dramatically as this coefficient increases.
In the robust state, the model acts like the previous case studies, and at γ = 0.5 , the difference in the answer of the objective function with the flexible models is more obvious. As again, Figure 16 provides, for more clarity, the minimal satisfaction level variables obtained for the two modes γ = 0.05 and γ = 0.5 .
According to Figure 16, although the values ​​obtained for the α variable at γ = 0.05 are higher than previous case studies, it is only due to the location of the equipment that allows the robust model to prevent more flexibility of soft constraints by increasing the values of minimum satisfaction level ( α ) variables and therefore these non-overlap constraints are met more easily (less penalty in the objective function).
For a more detailed study, the sum of moments of inertia in the main directions of the coordinate axes was also compared for the mentioned models, and the results can be seen in Figure 17.
As can be seen in Figure 17, in general, the behavior of the models has not changed much compared to previous case studies, and by increasing the penalty coefficient γ , the model will gain more moments of inertia in the robust state, due to the same tendency of the model to reduce the objective function by increasing the α variables which cause equipment to be placed far apart from one another, thereby increasing the total moments of inertia.
Therefore, as in case studies 1 and 2, the best case of a RFPM is when γ = 0.05 . As before, in cases of less than this value for the cost factor, the model loses its efficiency because the penalty for violating the soft constraints in the objective function is sharply reduced and the model tends to zero the minimum level of satisfaction ( α ) and forces flexible constraints to be at their softest state, increasing the probability of equipment overlapping. As before, we now compare the robust model presented with the proposed models in similar articles.
Here, 2 articles that used this example in their case studies were examined and according to the existing equipment layout on different satellite layers that were available in the articles, the data of each article were used as the input for the proposed robust model. The model was implemented for this data and the results are illustrated in Figure 18.
As can be seen in Figure 18, the sum of moments of inertia in the proposed RFPM in all cases of penalty coefficients for violation of soft constraints is much lower than in other articles. Also, as in previous case studies, the best and lowest values ​​for the sum of moments of inertia occur in the proposed RFPM at γ = 0.05 .
Similar to other case studies, an improvement of 7.35 percent may be seen by comparing the moments of inertia in Liu et al. (2016) (427 kg.m2) and the suggested RFPM (395.6 kg.m2). It suggests that if an identical force is required to spin these two satellites, at least 31.4 kilograms of mass could be preserved.
Finally, as can be seen, by increasing the penalty coefficient, the values ​​of moments of inertia tend to increase due to the objective function trying to reduce the penalty values. ​​ As a result, less flexibility of soft constraints is obtained, which causes equipment to be placed at great distances apart, thereby increasing the total moments of inertia.

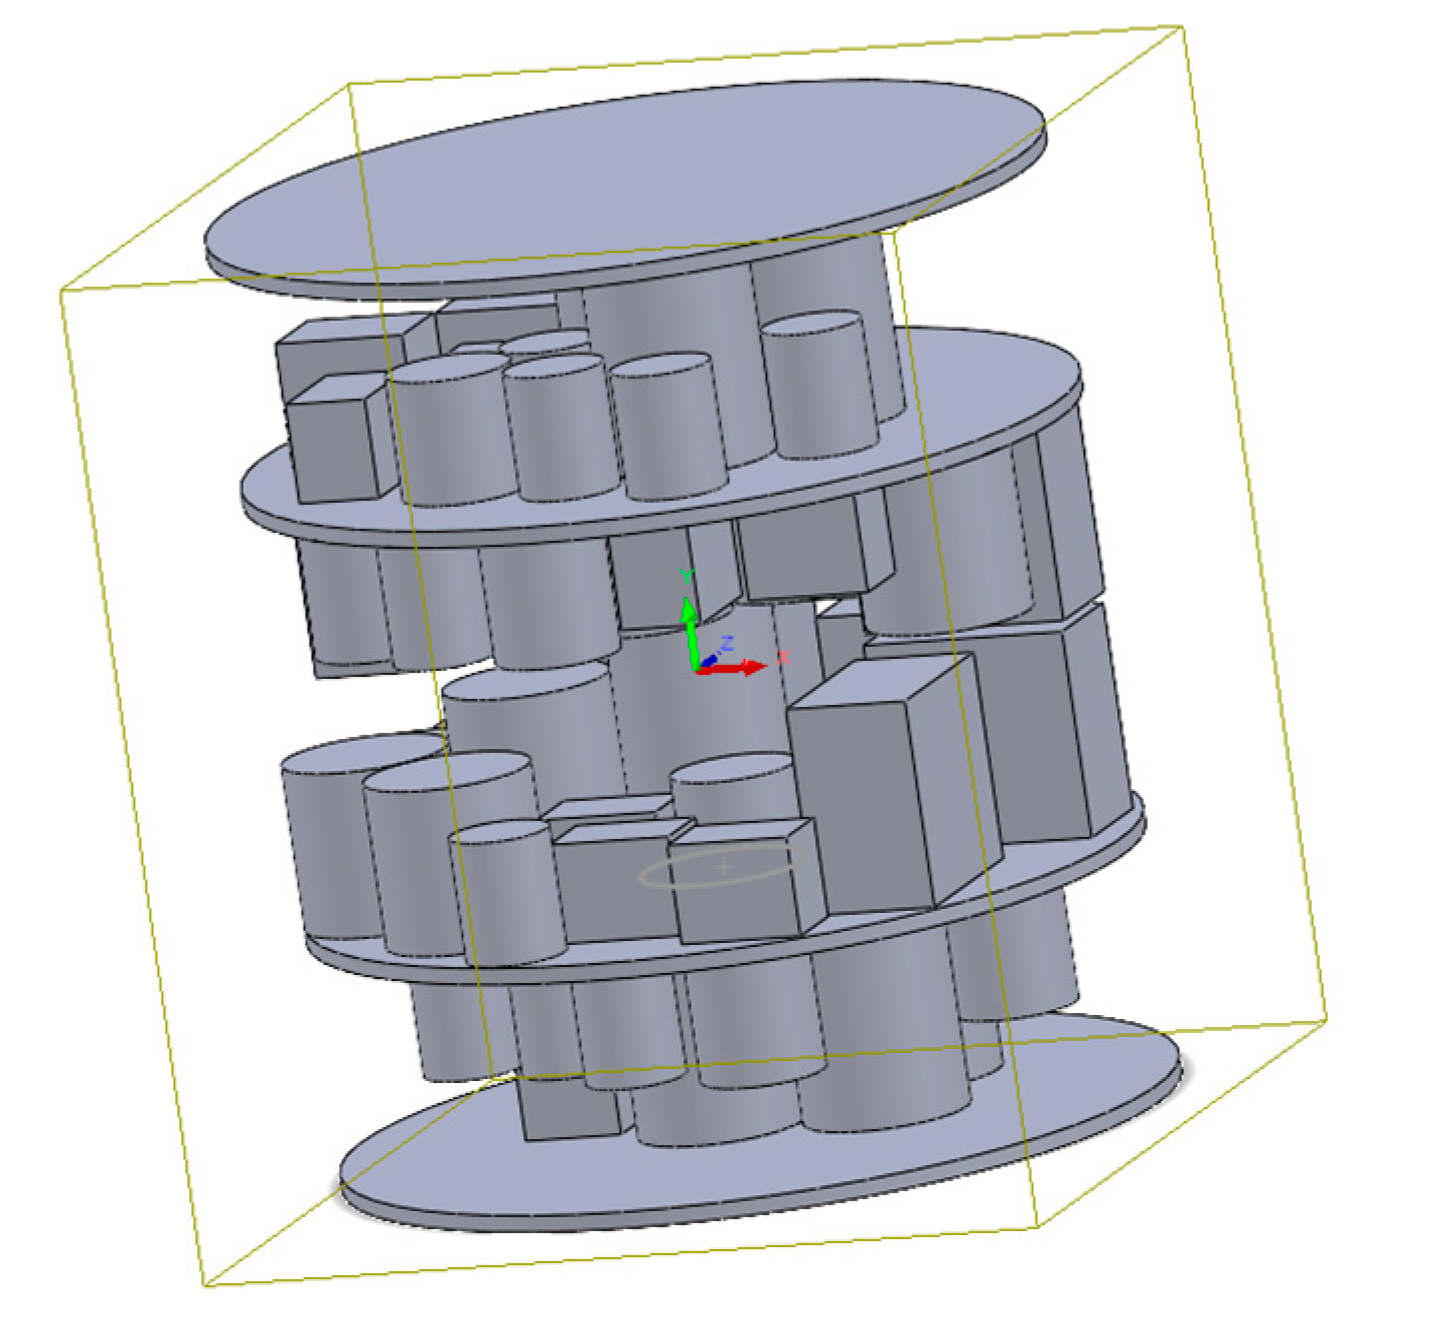
6. Conclusion and Future Work

In this study, the optimal allocation and layout of equipment in three-dimensional satellite space are investigated. Stratified satellites were laid, and to demonstrate performance, research was conducted on the satellite containers with the most floors. According to the articles in the history of literature, the majority of satellite categories had two levels and four layers, with a total of eleven case studies using this number of levels and layers. In this study, the performance of the suggested model against all of the examples from these 11 publications, which were analyzed in 3 separate cases, is questioned.
In every instance, it was demonstrated that the flexible model delivers a far superior solution than the models presented in prior articles.
Although some authors considered constraints related to thermal distributions such as Cuco et al. (2015) and Fakoor et al. (2016), there has not been any research to take into account the importance of distance between components with more thermal energy. Therefore, components that produce and emit more thermal energy are required to be far away from each other as much as possible. For instance, for better performance and a longer battery life, this component should be kept away from equipment that generates greater heat. In this case, the concept of obnoxious facility location problem (reviewed by Zanjirani Farahani and Hekmatfar (2009)) would be an appropriate choice to locate the position of these components in the area of the satellite. The concept of uncertainty can be applied here. For unpleasant equipment, the amount required for their distance is unknown in advance. Possibilistic programming is useful when there is “uncertainty in the data”. As a consequence, it is conceivable to model some of this problem as flexible programming under uncertainty and some of it as possible programming when it comes to unpleasant equipment.
Since one of the sources of uncertainty is measurement error and the issue of tolerance design plays a significant role in the conceptual design phase of satellite equipment layout, the concept of uncertainty in determining the distances between components is another appropriate use of uncertainty concept which can enhance the performance of the model by satisfying the functional and equilibrium constraints that ultimately lead to better model optimization.
Another topic that could be investigated is the satellite’s temperature field which would exert a direct influence on the operational performance of electrical components. Generally, a homogeneous distribution of heat flux within the satellite is necessary to maintain optimal performance and reliability of its components. Batteries, telemetry senders, and picture senders are examples of components that emit a great deal of energy and are therefore classified as “hot” components. These components must be positioned at specified distances from each other. Hengeveld et al. (2011a) proposed that their strategy paired with the one established by Hengeveld et al. (2011b) was highly appropriate for distributing individual components of uneven power to different panels of a satellite to minimise temperature dispersion in a satellite. From a thermal perspective, each component has an effective area that influences neighbouring modules; therefore, decreasing the intersection area is comparable to increasing the uniformity of the temperature field throughout the satellite panels. To add thermal constraints, Chen et al. (2018) might be a proper reference.
With all these interpretations, regarding the calculation of distances and, in principle, the thermal radii of the equipment, soft constraints can be used to calculate the distances of all cuboid and cylindrical equipment such that they are no closer than a specific limit.

References

  1. Ahmadi, A.; Pishvaee, M.S.; Jokar, M.R.A. A survey on multi-floor facility layout problems. Comput. Ind. Eng. 2017, 107, 158–170. [Google Scholar] [CrossRef]
  2. Albano, A.; Sapuppo, G. Optimal Allocation of Two-Dimensional Irregular Shapes Using Heuristic Search Methods. IEEE Trans. Syst. Man Cybern. 1980, 10, 242–248. [Google Scholar] [CrossRef]
  3. Ben-Tal, A.; Nemirovski, A. Robust convex optimization. Math. Oper. Res. 1998, 2, 769–805. [Google Scholar] [CrossRef]
  4. Ben-Tal, A.; Nemirovski, A. Robust solutions of Linear Programming problems contaminated with uncertain data. Math. Program. 2000, 88, 411–424. [Google Scholar] [CrossRef]
  5. Cagan, J.; Shimada, K.; Yin, S. A survey of computational approaches to three-dimensional layout problems. Comput. Des. 2002, 34, 597–611. [Google Scholar] [CrossRef]
  6. Chen, W.; Shi, Y.J.; Teng, H.F. An improved differential evolution with local search for constrained layout optimization of satellite module. Int. Conf. Intell. Comput. 5227, 742–749. [Google Scholar]
  7. Chen, X.; Yao, W.; Zhao, Y.; Chen, X.; Zheng, X. A practical satellite layout optimization design approach based on enhanced finite-circle method. Struct. Multidiscip. Optim. 2018, 58, 2635–2653. [Google Scholar] [CrossRef]
  8. Chen, X.; Yao, W.; Zhao, Y.; Chen, X.; Zhang, J.; Luo, Y. The hybrid algorithms are based on differential evolution for satellite layout optimization design. In Proceedings of the 2018 IEEE Congress on Evolutionary Computation (CEC), IEEE, Rio de Janeiro, Brazil, 8–13 July 2018. [Google Scholar] [CrossRef]
  9. Chen, S.; Xuan, M.; Xin, J.; Liu, Y.; Gu, S.; Li, J.; Zhang, L. Design and experiment of dual micro-vibration isolation system for optical satellite flywheel. Int. J. Mech. Sci. 2020, 179. [Google Scholar] [CrossRef]
  10. Chen, X.; Yao, W.; Zhao, Y.; Chen, X.; Liu, W. A novel satellite layout optimization design method based on phi-function. Acta Astronaut. 2021, 180, 560–574. [Google Scholar] [CrossRef]
  11. Chernov, N.; Stoyan, Y.; Romanova, T.; Pankratov, A. Phi-Functions for 2D Objects Formed by Line Segments and Circular Arcs. Adv. Oper. Res. 2012, 2012, 1–26. [Google Scholar] [CrossRef]
  12. Cuco, A. Development of a Multi-Objective Methodology for Layout Optimization of Equipment in Artificial Satellites. Master dissertation, Postgraduate Course in Space Technology and Engineering, National Institute for Space Research (INPE), São José dos Campos, Brazil, 2011. [Google Scholar]
  13. Cuco, A.P.C.; de Sousa, F.L.; Neto, A.J.S. A multi-objective methodology for spacecraft equipment layouts. Optim. Eng. 2015, 16, 165–181. [Google Scholar] [CrossRef]
  14. Cui, F.-Z.; Xu, Z.-Z.; Wang, X.-K.; Zhong, C.-Q.; Teng, H.-F. A dual-system cooperative co-evolutionary algorithm for satellite equipment layout optimization. Proc. Inst. Mech. Eng. Part G: J. Aerosp. Eng. 2017, 232, 2432–2457. [Google Scholar] [CrossRef]
  15. Fakoor, M.; Taghinezhad, M. Layout and configuration design for a satellite with variable mass using hybrid optimization method. Proc. Inst. Mech. Eng. Part G: J. Aerosp. Eng. 2015, 230, 360–377. [Google Scholar] [CrossRef]
  16. Fakoor, M.; Ghoreishi, S.M.N.; Sabaghzadeh, H. Spacecraft Component Adaptive Layout Environment (SCALE): An efficient optimization tool. Adv. Space Res. 2016, 58, 1654–1670. [Google Scholar] [CrossRef]
  17. Fakoor, M.; Zadeh, P.M.; Eskandari, H.M. Developing an optimal layout design of a satellite system by considering natural frequency and attitude control constraints. Aerosp. Sci. Technol. 2017, 71, 172–188. [Google Scholar] [CrossRef]
  18. Ferebee, M.J.; Powers, R.B. Optimization of Payload Mass Placement in a Dual. Keel Space Station; NASA, Langley Research Centre: Hampton, VA, USA, 1987. [Google Scholar]
  19. Ferebee, M.J.; Allen, C.L. Optimization of payload placement on arbitrary spacecraft. J. Spacecr. Rocket. 1991, 28, 612–614. [Google Scholar] [CrossRef]
  20. El Ghaoui, L.; Oustry, F.; Lebret, H. Robust Solutions to Uncertain Semidefinite Programs. SIAM J. Optim. 1998, 9, 33–52. [Google Scholar] [CrossRef]
  21. Galbraith, J.R. Designing complex organizations; Addison-Wesley Longman Publishing Co., Inc., 1973. [Google Scholar]
  22. He, K.; Mo, D.; Ye, T.; Huang, W. A coarse-to-fine quasi-physical optimization method for solving the circle packing problem with equilibrium constraints. Comput. Ind. Eng. 2013, 66, 1049–1060. [Google Scholar] [CrossRef]
  23. Hengeveld, D.W.; Braun, J.E.; Groll, E.A.; Williams, A.D. Optimal Placement of Electronic Components to Minimize Heat Flux Nonuniformities. J. Spacecr. Rocket. 2011, 48, 556–563. [Google Scholar] [CrossRef]
  24. Hengeveld, D.W.; Braun, J.E.; Groll, E.A.; Williams, A.D. Optimal Distribution of Electronic Components to Balance Environmental Fluxes. J. Spacecr. Rocket. 2011, 48, 694–697. [Google Scholar] [CrossRef]
  25. Huo, J.; Shi, Y.; Teng, H.F. Layout design of a satellite module using a human-guided genetic algorithm. 2006 Int Conf Comput Intell Secur ICCIAS 2007, 1, 230–235. [Google Scholar]
  26. Huo, J.-Z.; Teng, H.-F. Optimal Layout Design of a Satellite Module Using a Coevolutionary Method with Heuristic Rules. J. Aerosp. Eng. 2009, 22, 101–111. [Google Scholar] [CrossRef]
  27. Huo, J.-Z.; Teng, H.-F.; Sun, W.; Chen, J. Human-computer co-operative co-evolutionary method and its application to a satellite module layout design problem. Aeronaut. J. 2010, 114, 209–223. [Google Scholar] [CrossRef]
  28. Jang, S.-H. A study on three dimensional layout design by the simulated annealing method. J. Mech. Sci. Technol. 2008, 22, 2016–2023. [Google Scholar] [CrossRef]
  29. Klibi, W.; Martel, A.; Guitouni, A. The design of robust value-creating supply chain networks: A critical review. Eur. J. Oper. Res. 2010, 203, 283–293. [Google Scholar] [CrossRef]
  30. Lau, V.; de Sousa, F.L.; Galski, R.L.; Rocco, E.M.; Becceneri, J.C.; Santos, W.A.; Sandri, S.A. A Multidisciplinary Design Optimization Tool for Spacecraft Equipment Layout Conception. J. Aerosp. Technol. Manag. 2014, 6, 431–446. [Google Scholar] [CrossRef]
  31. Leung, S.C.; Tsang, S.O.; Ng, W.; Wu, Y. A robust optimization model for multi-site production planning problem in an uncertain environment. Eur. J. Oper. Res. 2007, 181, 224–238. [Google Scholar] [CrossRef]
  32. Li, G.Q. Research on the theory and methods of layout design and their applications. Dissertation Thesis, Dalian University of Technology, Dalian, Chinese, 2003. [Google Scholar]
  33. Li, Z.; Milenkovic, V. Compaction and separation algorithms for non-convex polygons and their applications. Eur. J. Oper. Res. 1995, 84, 539–561. [Google Scholar] [CrossRef]
  34. Li, Z.; Zeng, Y.; Wang, Y.; Wang, L.; Song, B. A hybrid multi-mechanism optimization approach for the payload packing design of a satellite module. Appl. Soft Comput. 2016, 45, 11–26. [Google Scholar] [CrossRef]
  35. Liu, Z.-W.; Teng, H.-F. Human–computer cooperative layout design method and its application. Comput. Ind. Eng. 2008, 55, 735–757. [Google Scholar] [CrossRef]
  36. Liu, J.-F.; Hao, L.; Li, G.; Xue, Y.; Liu, Z.-X.; Huang, J. Multi-objective layout optimization of a satellite module using the Wang-Landau sampling method with local search. Front. Inf. Technol. Electron. Eng. 2016, 17, 527–542. [Google Scholar] [CrossRef]
  37. Mula, J.; Poler, R.; Garcia-Sabater, J. Material Requirement Planning with fuzzy constraints and fuzzy coefficients. Fuzzy Sets Syst. 2007, 158, 783–793. [Google Scholar] [CrossRef]
  38. Mulvey, J.M.; Vanderbei, R.J.; Zenios, S.A. Robust Optimization of Large-Scale Systems. Oper. Res. 1995, 43, 264–281. [Google Scholar] [CrossRef]
  39. Pishvaee, M.; Razmi, J.; Torabi, S. Robust possibilistic programming for socially responsible supply chain network design: A new approach. Fuzzy Sets Syst. 2012, 206, 1–20. [Google Scholar] [CrossRef]
  40. Pishvaee, M.S.; Khalaf, M.F. Novel robust fuzzy mathematical programming methods. Appl. Math. Model. 2016, 40, 407–418. [Google Scholar] [CrossRef]
  41. Pühlhofer, T.; Baier, H. Approaches for further rationalisation in mechanical architecture and structural design of satellites. In Proceedings of the 54th International Astronautical Congress (IAC); 2003. [Google Scholar]
  42. Pühlhofer, T.; Langer, H.; Baier, H.; Huber, M.B.T. Multi-criteria and Discrete Configuration and Design Optimization with Applications for Satellites. In Proceedings of the 10th AIAA/ISSMO Multidisciplinary Analysis and Optimization Conference, Albany, 2004. [Google Scholar]
  43. Qin, Z.; Liang, Y.G. Layout Optimization of Satellite Cabin Considering Space Debris Impact Risk. Journal of Spacecraft Rockets 2017, 54, 1–5. [Google Scholar]
  44. Qin, Z.; Liang, Y.-G.; Zhou, J.-P. An optimization tool for satellite equipment layout. Adv. Space Res. 2018, 61, 223–234. [Google Scholar] [CrossRef]
  45. Rocco, E.M.; Souza, M.; Prado,, A. Multi-objective optimization applied to satellite constellations I: Formulation of the smallest loss criterion. In Proceedings of the 54th International Astronautical Congress (IAC’03); 2003. [Google Scholar]
  46. Shafaee, M.; Mohammadzadeh, P.; Elkaie, A.; Abbasi, S. Layout design optimization of a space propulsion system using hybrid optimization algorithm. Proc. Inst. Mech. Eng. Part G: J. Aerosp. Eng. 2017, 231, 338–349. [Google Scholar] [CrossRef]
  47. Sun, Z.-G.; Teng, H.-F. Optimal layout design of a satellite module. Eng. Optim. 2003, 35, 513–529. [Google Scholar] [CrossRef]
  48. Sun, J.; Chen, X.; Zhang, J.; Yao, W. A niching cross-entropy method for multimodal satellite layout optimization design. Complex Intell. Syst. 2021, 7, 1971–1989. [Google Scholar] [CrossRef]
  49. Teng, H.F.; Lin, S.S.; Quan, L.D.; Zhao, L.Y. Layout optimization for the objects located within a rotating vessel - a three-dimensional packing problem with behavioural constraints. Computers and Operations Research 2001, 28, 521–535. [Google Scholar] [CrossRef]
  50. Teng, H.F.; Chen, Y.; Zeng, W.; Shi, Y.J.; Hu, Q.H. A dual-system variable-grain cooperative Co-evolutionary algorithm: satellite-module layout design. IEEE Transactions on Evolutionary Computation 2010, 14, 438–455. [Google Scholar] [CrossRef]
  51. Wang, Y.; Teng, H.; Shi, Y. Cooperative co-evolutionary scatter search for satellite module layout design. Eng. Comput. 2009, 26, 761–785. [Google Scholar] [CrossRef]
  52. Xu, Y.C.; Dong, F.M.; Liu, Y.; et al. Ant colony algorithm for the weighted item layout optimization problem. Computational Science 2010, 3, 221–232. [Google Scholar]
  53. Xu, Z.-Z.; Zhong, C.-Q.; Teng, H.-F. Assignment and layout integration optimization for simplified satellite re-entry module component layout. Proc. Inst. Mech. Eng. Part G J. Aerosp. Eng. 2017, 233, 4287–4301. [Google Scholar] [CrossRef]
  54. Yu, C.-S.; Li, H.-L. A robust optimization model for stochastic logistic problems. Int. J. Prod. Econ. 2000, 64, 385–397. [Google Scholar] [CrossRef]
  55. Zanjirani Farahani., R.; Hekmatfar., M. Facilities location: concepts, models and applications; Springer: Berlin/Heidelberg, Germany, 2009. [Google Scholar]
  56. Zhang, B.; Teng, H.-F.; Shi, Y.-J. Layout optimization of satellite module using soft computing techniques. Appl. Soft Comput. 2008, 8, 507–521. [Google Scholar] [CrossRef]
  57. Zhang, Z.H.; Wang, Y.S.; Teng, H.F.; Shi, Y.J. Parallel Dual-system Cooperative Co-Evolutionary Differential Evolution Algorithm with Human-computer Cooperation for Multi-Cabin Satellite Layout Optimization. Journal of Convergence Information Technology 2013, 8, 711–720. [Google Scholar]
  58. Zhang, Z.-H.; Zhong, C.-Q.; Xu, Z.-Z.; Teng, H.-F. A Non-Dominated Sorting Cooperative Co-Evolutionary Differential Evolution Algorithm for Multi-Objective Layout Optimization. IEEE Access 2017, 5, 14468–14477. [Google Scholar] [CrossRef]
  59. Zhang, Z.; Sun, X.; Hou, L.; Chen, W.; Shi, Y.; Cao, X. A cooperative co-evolutionary multi-agent system for multi-objective layout optimization of satellite module. In Proceedings of the 2017 IEEE International Conference on Systems, Man and Cybernetics (SMC), Banff, AB, Canada, 5–8 October 2017; pp. 147–151. [Google Scholar]
  60. Zhong, C.-Q.; Xu, Z.-Z.; Teng, H.-F. Multi-module satellite component assignment and layout optimization. Appl. Soft Comput. 2019, 75, 148–161. [Google Scholar] [CrossRef]
Figure 1. A view of a satellite with two middle plates and four layers.
Preprints 89091 g001
Figure 2. View of the satellite with the location of the equipment in different layers.
Preprints 89091 g002
Figure 3. circumscribed circle for equipment with rectangular cross-section.
Preprints 89091 g003
Figure 3. - Layout of equipment on different layers of the satellite in the optimal state.
Preprints 89091 g003a
Figure 4. Optimal allocation and layout of equipment on different layers of the satellite.
Preprints 89091 g004
Figure 5. - Comparison of the Objective Function of the RFPM with the Flexible Models.
Preprints 89091 g005
Figure 6. - Comparison of values for the minimum satisfaction level variable ( α ) in RFPM with γ = 0.05 and γ = 0.5  in Case Study No. 1.
Preprints 89091 g006
Figure 7. - Comparison of the sum of moments of inertia of RFPM with flexible models.
Preprints 89091 g007
Figure 8. - Comparison of the sum of moments of inertia of RFPM with the results of other articles.
Preprints 89091 g008
Figure 9. - Optimal allocation and layout of equipment on different layers of the satellite.
Preprints 89091 g009
Figure 10. - Comparison of the Objective Function of the RFPM with the Flexible Models.
Preprints 89091 g010
Figure 11. - Comparison of values for the minimum satisfaction level variable ( α ) in RFPM with γ = 0.05 and γ = 0.5  in Case Study No. 2.
Preprints 89091 g011
Figure 12. - Comparison of the sum of moments of inertia of RFPM with flexible models.
Preprints 89091 g012
Figure 13. - Comparison of the sum of moments of inertia of RFPM with the results of other articles.
Preprints 89091 g013
Figure 14. - Optimal allocation and layout of equipment on different layers of the satellite.
Preprints 89091 g014
Figure 15. - Comparison of the Objective Function of the RFPM with the Flexible Models.
Preprints 89091 g015
Figure 16. - Comparison of values ​​for the minimum satisfaction level variable ( α ) in RFPM with γ = 0.05 and γ = 0.5  in Case Study No. 3.
Preprints 89091 g016
Figure 17. - Comparison of the sum of moments of inertia of RFPM with flexible models.
Preprints 89091 g017
Figure 18. Comparison of the sum of moments of inertia of RFPM with the results of other articles.
Preprints 89091 g018
Table 1. Solution methods and dimensions of case studies in satellite components layout in previous articles.
Preprints 89091 i001a
Preprints 89091 i001b
Table 2. - Comparison of moments of inertia of articles with similar data.
Author Moment of Inertia
Ixx
(Kg.m2)
Iyy
(Kg.m2)
Izz
(Kg.m2)
f
(Kg.m2)
Sun & Teng (2003) 261.0494 268.4691 225.7972 755.3157
Huo & Teng (2009) 268.368 271.093 232.726 772.187
Liu et al. (2016)- Ex.2 264.4117 261.5193 222.2096 748.1407
Fakoor et al. (2017) 270.0088 265.6922 231.9796 767.6807
Table 3. moments of Inertia for feasible states in case study 1.
No. Ixx
(Kg.m2)
Iyy
(Kg.m2)
Izz
(Kg.m2)
f
(Kg.m2)
No. Ixx
(Kg.m2)
Iyy
(Kg.m2)
Izz
(Kg.m2)
f
(Kg.m2)
1 256.26 254.54 220.05 730.85 14 255.03 256.43 220.34 731.80
2 257.57 257.16 232.88 747.60 15 254.21 257.58 220.38 732.18
3 252.89 254.14 224.53 731.55 16 256.18 255.12 219.31 730.62
4 255.51 257.92 224.05 737.49 17 256.28 255.68 219.74 731.70
5 254.68 257.92 226.97 739.57 18 257.26 256.28 220.96 734.51
6 253.88 256.51 224.20 734.59 19 256.52 258.75 222.14 737.41
7 254.46 254.95 220.88 730.29 20 256.41 257.36 224.69 738.46
8 255.67 253.70 220.29 729.65 21 256.90 257.65 220.29 734.84
9 255.11 253.78 219.18 728.07 22 256.18 257.77 219.05 733.00
10 255.16 255.94 221.20 732.30 23 259.65 261.15 225.42 746.21
11 256.54 259.68 226.21 742.43 24 259.50 256.18 219.63 735.31
12 260.84 255.10 227.59 743.52 25 261.01 262.46 226.97 750.44
13 255.29 255.95 220.39 731.63
Table 4. Optimal dimensions and coordinates of equipment in case study No. 1.
No. Dimenssions (mm) Mass(kg) Optimal Coordinates θi(rad) Layer No. Dimenssions (mm) Mass(kg) Optimal Coordinates Layer
ai/ri bi hi mi xi(mm) yi(mm) ri hi mi xi(mm) yi(mm)
1 150 250 200 22.50 329.47 64.86 π/2 L 2 28 100 240 26.62 -1.58 -288.80 L 3
2 150 250 200 22.50 177.47 82.86 π/2 L 2 29 100 240 26.62 -193.90 49.01 L 3
3 150 250 200 22.50 174.13 -285.90 π/2 L 3 30 100 180 16.97 -175.93 -95.12 L 4
4 160 250 200 24.00 180.21 -33.62 π/2 L 3 31 100 180 16.97 189.11 65.10 L 4
5 160 250 200 24.00 341.89 -35.46 π/2 L 3 32 100 180 16.97 19.82 199.02 L 4
6 250 180 200 27.00 0.07 391.00 L 3 33 100 180 16.97 -164.75 113.40 L 4
7 200 200 250 30.00 -0.30 200.34 L 3 34 100 180 16.97 183.52 -134.83 L 4
8 200 200 250 30.00 200.37 193.88 L 3 35 100 200 18.85 211.87 -332.71 L 2
9 200 200 250 30.00 -229.55 251.01 π/2 L 3 36 100 200 18.85 333.30 -164.84 L 2
10 150 150 250 16.88 118.90 302.23 π/2 L 2 37 100 200 18.85 -61.62 -190.27 L 2
11 150 150 250 16.88 -153.95 305.58 π/2 L 2 38 100 200 18.85 133.97 -148.50 L 2
12 150 150 250 16.88 270.27 283.38 L 2 39 75 200 10.60 -324.88 -7.36 L 2
13 100 150 200 9.00 -250.46 143.29 π/2 L 2 40 75 200 10.60 -304.87 293.12 L 2
14 100 150 200 9.00 -149.32 150.71 π/2 L 2 41 75 200 10.60 -174.88 -6.50 L 2
15 100 100 150 4.50 98.32 140.94 L 1 42 75 200 10.60 -230.85 -145.67 L 2
16 100 100 150 4.50 153.65 36.60 L 1 43 50 200 4.71 -359.25 112.82 L 2
17 200 185 150 16.65 228.81 -111.59 L 1 44 50 200 4.71 67.92 -283.18 L 2
18 185 200 150 16.65 -86.89 -200.66 π/2 L 1 45 50 200 4.71 -16.60 -336.62 L 2
19 200 120 200 14.40 2.14 164.48 L 2 46 50 200 4.71 -191.98 -264.47 L 2
20 120 200 200 14.40 -18.22 325.14 π/2 L 2 47 50 200 4.71 -116.38 -329.92 L 2
21 160 100 120 1.92 -261.47 -133.58 L 1 48 50 200 4.71 -354.70 -128.75 L 2
22 160 100 120 1.92 -35.20 159.98 L 1 49 60 150 5.09 67.08 -148.29 L 1
23 100 160 120 1.92 -165.12 99.19 π/2 L 1 50 60 150 5.09 0.03 273.81 L 1
24 160 100 120 1.92 -186.27 -30.91 L 1 51 45 160 3.05 -168.36 223.99 L 1
25 100 240 26.62 -333.30 -94.41 L 3 52 45 160 3.05 -261.07 68.28 L 1
26 100 240 26.62 -139.40 -143.42 L 3 53 100 180 16.97 -5.59 -199.92 L 4
27 100 240 26.62 -200.18 -334.88 L 3
Table 5. Comparison of inertia moments of articles with similar data.
Author Moment of Inertia
Ixx
(Kg.m2)
Iyy
(Kg.m2)
Izz
(Kg.m2)
f
(Kg.m2)
Zhang et al. (2008) 228.7177 232.9378 185.0577 646.7132
Wang et al. (2009) 227.809 226.044 178.162 632.015
Teng et al. (2010)- Ex.2 228.266 225.811 171.446 625.523
Cui et al. (2017) 223.477 220.732 168.419 612.628
Zhong et al. (2019) 218.2072 215.5635 166.2441 600.0148
Chen et al. (2021)- Ex.3 224.078 228.114 179.759 631.951
Table 6. - Moments of inertia for feasible states in case study 2.
No. Ixx
(Kg.m2)
Iyy
(Kg.m2)
Izz
(Kg.m2)
f
(Kg.m2)
No. Ixx
(Kg.m2)
Iyy
(Kg.m2)
Izz
(Kg.m2)
f
(Kg.m2)
1 204.85 208.88 164.76 578.49 14 207.94 209.34 171.25 588.52
2 206.81 208.30 164.72 579.83 15 208.30 210.93 169.62 588.85
3 207.75 206.19 166.90 580.84 16 211.30 208.28 169.70 589.27
4 210.81 199.91 170.22 580.94 17 209.10 209.91 172.84 591.84
5 206.60 208.80 167.19 582.59 18 209.03 212.59 170.56 592.19
6 210.87 207.11 165.76 583.74 19 211.65 210.12 171.22 592.98
7 207.94 207.90 168.20 584.04 20 209.75 211.27 173.22 594.24
8 209.78 209.18 165.09 584.05 21 210.77 210.14 174.06 594.97
9 209.78 209.45 166.33 585.55 22 210.99 211.39 173.12 595.50
10 208.24 207.95 169.85 586.04 23 211.31 211.10 175.31 597.72
11 207.98 208.19 170.79 586.96 24 211.97 208.36 177.74 598.06
12 208.76 208.73 169.61 587.09 25 212.37 211.46 176.54 600.37
13 208.43 207.13 171.55 587.10
Table 7. - Optimal dimensions and coordinates of equipment in case study No. 2.
No. Dimenssions (mm) Mass(kg) Optimal Coordinates Layer No. Dimenssions (mm) Mass(kg) Optimal Coordinates θi(rad) Layer
ri hi mi xi(mm) yi(mm) ai/ri bi hi mi xi(mm) yi(mm)
1 100 150 23.56 -157.91 323.04 3 31 60 150 5.09 152.08 -200.16 1
2 100 160 23.56 -162.29 119.59 3 32 60 150 5.09 254.36 -51.71 1
3 100 160 23.56 -334.04 221.00 3 33 60 250 5.09 214.76 350.94 2
4 100 200 23.56 -184.43 -86.48 3 34 60 250 5.09 -39.89 294.17 2
5 100 200 23.56 -356.04 19.65 3 35 60 250 5.09 84.65 322.06 2
6 100 250 23.56 -342.86 -206.04 3 36 60 250 5.09 174.52 240.14 2
7 100 120 23.56 -13.61 -200.30 4 37 250 150 150 28.13 -70.59 -376.17 3
8 100 120 23.56 175.10 -123.62 4 38 250 150 150 28.13 170.26 -22.27 π/2 3
9 100 200 18.85 -323.04 149.99 2 39 250 150 150 28.13 277.27 229.48 π/2 3
10 100 150 18.85 182.57 81.65 4 40 160 120 250 28.13 138.00 -365.67 3
11 100 150 18.85 20.57 198.94 4 41 250 150 250 28.13 68.61 184.05 3
12 100 160 15.08 -123.19 157.56 2 42 250 150 250 28.13 70.52 341.27 3
13 100 160 15.08 183.14 80.37 2 43 250 150 250 28.13 22.27 -223.55 3
14 100 150 15.08 -162.00 117.29 4 44 250 150 250 28.13 274.53 -222.49 3
15 75 160 8.48 -171.11 325.87 2 45 250 150 250 28.13 323.45 -22.16 π/2 3
16 75 200 8.48 48.39 192.02 2 46 200 160 150 19.20 -349.98 -48.24 π/2 2
17 75 250 8.48 318.66 206.31 2 47 200 160 250 19.20 -184.03 -47.62 π/2 2
18 75 150 8.48 167.27 51.44 1 48 200 160 120 19.20 -204.69 -64.54 4
19 75 120 7.95 -149.11 91.61 1 49 160 120 250 15.36 -4.24 -181.12 π/2 2
20 75 150 7.95 65.57 162.25 1 50 160 120 250 8.64 -296.70 -213.45 2
21 75 200 7.95 357.02 54.73 2 51 160 120 250 8.64 -155.99 -232.17 π/2 2
22 75 250 7.95 391.52 -93.06 2 52 160 120 120 8.64 347.96 -3.84 π/2 4
23 75 250 7.95 -7.19 424.25 2 53 150 100 120 5.40 156.39 324.55 1
24 75 250 7.95 242.04 -84.42 2 54 150 100 120 5.40 0.21 319.01 1
25 60 150 5.09 -0.03 -268.05 1 55 150 100 150 5.40 191.11 197.40 π/2 1
26 60 150 5.09 -154.03 -43.30 1 56 150 100 160 5.40 290.63 -220.08 2
27 60 150 5.09 41.05 -154.64 1 57 150 100 160 5.40 138.32 -281.15 2
28 60 150 5.09 137.99 -80.99 1 58 150 100 200 5.40 -16.39 -315.18 2
29 60 150 5.09 # -79.94 -138.60 1 59 150 100 250 5.40 151.69 -388.18 2
30 60 150 5.09 # -65.87 203.39 1 60 150 100 250 5.40 114.05 -154.64 π/2 2
Table 8. - Comparison of moments of inertia of articles with similar data.
Author Moment of Inertia
Ixx
(Kg.m2)
Iyy
(Kg.m2)
Izz
(Kg.m2)
f
(Kg.m2)
Liu & Teng (2008) 174.466 171.322 101.016 446.804
Liu et al. (2016)- Ex.1 163.1813 162.9923 93.87346 420.047
Table 9. - moments of Inertia for feasible states in case study 3.
No. Ixx
(Kg.m2)
Iyy
(Kg.m2)
Izz
(Kg.m2)
f
(Kg.m2)
No. Ixx
(Kg.m2)
Iyy
(Kg.m2)
Izz
(Kg.m2)
f
(Kg.m2)
1 147.74 149.48 100.70 397.92 7 149.90 150.87 96.82 397.59
2 149.21 150.72 95.66 395.59 8 148.49 149.69 98.91 397.09
3 149.36 150.71 99.81 399.88 9 149.93 150.19 97.59 397.72
4 148.47 150.42 99.59 398.48 10 149.16 150.88 98.47 398.51
5 148.62 150.00 101.23 399.84 11 153.62 152.11 102.67 408.40
6 149.10 149.37 100.58 399.05
Table 10. Optimal dimensions and coordinates of equipment in case study No. 3.
No. Dimenssions (mm) Mass(kg) Optimal Coordinates Layer No. Dimenssions (mm) Mass(kg) Optimal Coordinates θi(rad) Layer
ri hi mi xi(mm) yi(mm) ai/ri bi hi mi xi(mm) yi(mm)
1 100 240 15.08 142.45 -140.39 3 27 45 160 2.04 137.72 -45.38 1
2 100 240 15.08 91.76 -335.64 3 28 45 160 2.04 167.52 39.54 1
3 100 240 15.08 286.34 -279.30 3 29 100 180 11.31 157.00 -123.90 4
4 100 240 15.08 329.64 -69.98 3 30 100 180 11.31 -28.80 -200.62 4
5 100 240 15.08 187.19 70.41 3 31 100 200 12.56 222.23 -328.97 2
6 100 180 11.31 -13.36 388.64 2 32 250 150 200 15.00 -322.86 -148.10 2
7 100 180 11.31 184.80 329.64 2 33 250 150 200 15.00 -233.30 101.53 3
8 100 180 11.31 35.22 196.87 2 34 150 250 200 15.00 -228.87 -51.75 3
9 100 100 11.31 -204.01 0.03 4 35 250 150 200 15.00 -240.89 -256.87 π/2 3
10 100 180 11.31 179.48 79.29 4 36 250 150 200 15.00 1.96 384.02 3
11 100 200 12.56 204.42 17.36 2 37 250 150 200 15.00 -87.85 -257.64 π/2 3
12 100 200 12.56 -97.81 -174.16 2 38 200 200 250 20.00 -8.51 203.90 π/2 3
13 100 200 12.56 6.81 -342.64 2 39 200 200 250 20.00 229.92 275.90 3
14 100 200 12.56 116.62 -162.48 2 40 200 200 250 20.00 -224.82 277.22 3
15 75 100 3.53 -186.80 -177.33 1 41 150 150 250 11.25 -334.57 5.86 π/2 2
16 75 100 3.53 -36.93 -171.06 1 42 150 150 250 11.25 -139.19 160.95 π/2 2
17 75 100 3.53 -172.75 -27.99 1 43 150 150 250 11.25 -179.06 8.71 π/2 2
18 75 100 3.53 -272.01 84.47 1 44 150 100 200 6.00 206.45 179.29 2
19 50 200 3.14 369.12 167.63 2 45 150 100 200 6.00 -171.27 -324.51 2
20 50 200 3.14 375.19 -141.99 2 46 100 100 150 3.00 -132.68 107.42 1
21 50 200 3.14 273.43 -134.98 2 47 100 100 150 3.00 -14.91 156.06 π/2 1
22 50 200 3.14 324.67 258.27 2 48 200 185 150 11.10 138.12 -191.63 1
23 50 200 3.14 354.34 -32.69 2 49 200 185 150 11.10 -9.88 203.01 π/2 4
24 50 200 3.14 357.64 68.18 2 50 200 100 200 8.00 -207.12 290.34 2
25 60 150 3.39 -125.24 218.41 1 51 200 100 200 8.00 -317.00 134.39 2
26 60 150 3.39 103.02 122.42 1
Disclaimer/Publisher’s Note: The statements, opinions and data contained in all publications are solely those of the individual author(s) and contributor(s) and not of MDPI and/or the editor(s). MDPI and/or the editor(s) disclaim responsibility for any injury to people or property resulting from any ideas, methods, instructions or products referred to in the content.
Copyright: This open access article is published under a Creative Commons CC BY 4.0 license, which permit the free download, distribution, and reuse, provided that the author and preprint are cited in any reuse.
Prerpints.org logo

Preprints.org is a free preprint server supported by MDPI in Basel, Switzerland.

Subscribe

© 2024 MDPI (Basel, Switzerland) unless otherwise stated