1. Introduction
Organic Rankine cycle (ORC) technology is a well-grounded and promising way to convert heat into power. It is one of the leading ways to achieve pumped thermal electricity storage in Carnot battery technology [
1]. For high-temperature heat sources, cascade or even triple organic Rankine cycle (TORC) is commonly adopted to extract the exergy more adequately and realize stage-wise utilization of the energy. TORC technology is booming and attracting increasingly widespread attention. Prabhu et al. compared the performance of 10 MWe parabolic trough power stations with different structures. The highest net efficiency of 27.5% was achieved for a TORC arrangement when the top cycle evaporation temperature was 318 °C and the degree of superheat was around 60 °C. Toluene, cyclohexane and butane were the top, middle and bottom cycle fluids, respectively. TORC is inferior to the most efficient cascade cycles due to the additional internal losses, complexity and cost [
2]. Mahmoud et al. devised an independent TORC system adopting three hydrocarbons as the working fluids to recover waste heat from comprehensive crude oil refining and aromatics facilities with a maximum temperature of 160 °C [
3]. Zhang et al. researched both TORC and four-stage ORC systems. For a single-phase heat source of 300 °C hot air, the highest thermal efficiencies of 26.86% and 26.22%, exergy efficiencies of 79.46% and 77.56%, and levelized energy costs (LECs) of 0.063
$/kWh and 0.072
$/kWh could be achieved by the two systems. For a two-phase heat source of 185 °C saturated steam, the highest thermal efficiencies of 23.64% and 24.43%, exergy efficiencies of 69.94% and 72.26%, and LECs of 0.069
$/kWh and 0.068
$/kWh could be obtained [
4]. Yu et al. conducted analysis on an R245fa-based TORC system. When the geothermal fluid temperature was 200 °C, the net power output was 3.8% and 2.4% higher than that of the single-stage and cascade cycles, respectively. The LEC of the TORC was approximately 0.04
$/kWh [
5].
Alongside this, TORC configuration is also applied in the field of recovering the cold exergy of liquefied natural gas (LNG). García et al. investigated a TORC system with LNG and industrial waste heat as the cold and heat sources. The working fluid of each stage is argon, methane and R14. The highest exergy efficiency was 85.6% [
6]. Zhang et al. found that when the waste heat temperature was above 100 °C, the TORC system has higher net power output and thermal efficiency than those of the single-stage one. The optimal thermal and exergy efficiencies were respectively 32.5% and 39.08% at the heat source temperature of 150 °C [
7]. Ma et al. constructed a multi-stage ORC model for LNG cold-energy utilization. The heat source was seawater at 20 °C. The efficiencies of single-stage to five-stage ORC systems were analyzed. The maximum efficiencies of the TORC and five-stage ORC were 55.01% and 67.7%, respectively [
8]. Han et al. simulated a TORC system using LNG and 127.17 °C ship power generation waste heat as the cold and heat sources. The highest efficiencies were 31.72%, 19.86% and 27.53% for the top, middle and bottom ORCs using the working fluids of R290, R601a and R236ea, respectively. The cost of each cycle was 0.71, 1.33 and 0.98 million
$/year [
9].
Notably, the maximum evaporation temperatures of the above TORC systems are limited to below 320 °C due to the low critical temperatures of the conventional refrigerants, hydrocarbons and siloxanes [
10]. A biphenyl/diphenyl oxide (BDO) mixture has significant potential for high- or medium-temperature ORC applications [
11], and has been reported in extensive literature. The mixture is consisting of 73.5% diphenyl oxide and 26.5% biphenyl, and possesses extraordinarily low viscosity and high stability in a large temperature interval from 12 °C to 400 °C [
12,
13]. Bronicki successfully tested a cascade cycle device employing the BDO mixture and monochlorobenzene as the first- and second- stage cycle fluids. The overall efficiency was 8.5% and the power output was 680 W at the first-stage cycle evaporation temperature of 195 °C [
14]. Bombarda et al. employed the BDO mixture as the bottom cycle fluid in a binary liquid metal-ORC distributed system. An efficiency of 46% was claimed [
15]. Vescovo briefly introduced the application of BDO mixture in high-temperature ORC. The described system efficiency ranged from 30% to 34% [
16,
17]. Sampedro et al. presented a toluene ORC topped by a wet-to-dry cycle using the BDO mixture. The maximal power output by the cascade cycle was 96 kW at the heat source temperature of 492 °C [
18]. Li et al. innovatively adopted the BDO mixture as the heat transfer, storage and power cycle fluid in a cascade organic-steam Rankine cycle system [
19,
20]. The thermal efficiency was 42.90% when the BDO was vaporized at 390 °C [
20]. Ren et al. put forward a cascade ORC topped by a BDO mixture cycle. The maximum thermal efficiency was 40.26% irrespective of pressure drop in all the heat exchangers [
21]. Li et al. analyzed a novel partial cascade organic-steam Rankine cycle utilizing the BDO mixture as the ORC fluid. The maximum efficiency was 45.3% when the ORC and water evaporation temperatures were 400 °C and 290 °C, respectively [
22].
In order to ramp up the maximum evaporation temperature and the heat-to-power conversion efficiency of existing TORCs, this paper proposes a BDO mixture-based TORC system for the first time. It uses the BDO mixture as the top and middle ORC working fluid simultaneously, and conventional organic fluids for the bottom ORC. The above experimental and simulation studies on the BDO mixture [
11,
12,
13,
14,
15,
16,
17,
18,
19,
20,
21,
22] set the stage for its application in high temperature TORC. The BDO mixture in the top cycle evaporates at 400 °C and drives the top turbine. Both the top and middle ORCs are equipped with an internal recuperator to recover the exergy in the exhaust vapor at the turbine outlets. The superheated vapor at the recuperators’ outlets serve as the heat source for the next-stage cycle. A mixing heat exchanger (MHX) connects the top and middle ORCs to reduce the irreversible loss in heat transfer.
The operating philosophy and characteristics of the TORC are elaborated, and mathematical models are built. Thermal and exergy efficiencies of the TORC were optimized with respect to the MHX outlet temperature ( or ), middle ORC condensation temperature () and different bottom ORC fluids, followed by the evaluation of the entropy generation in each component and the economic index. Finally, a comprehensive comparison with a BDO mixture-based cascade ORC is carried out.
2. System Description
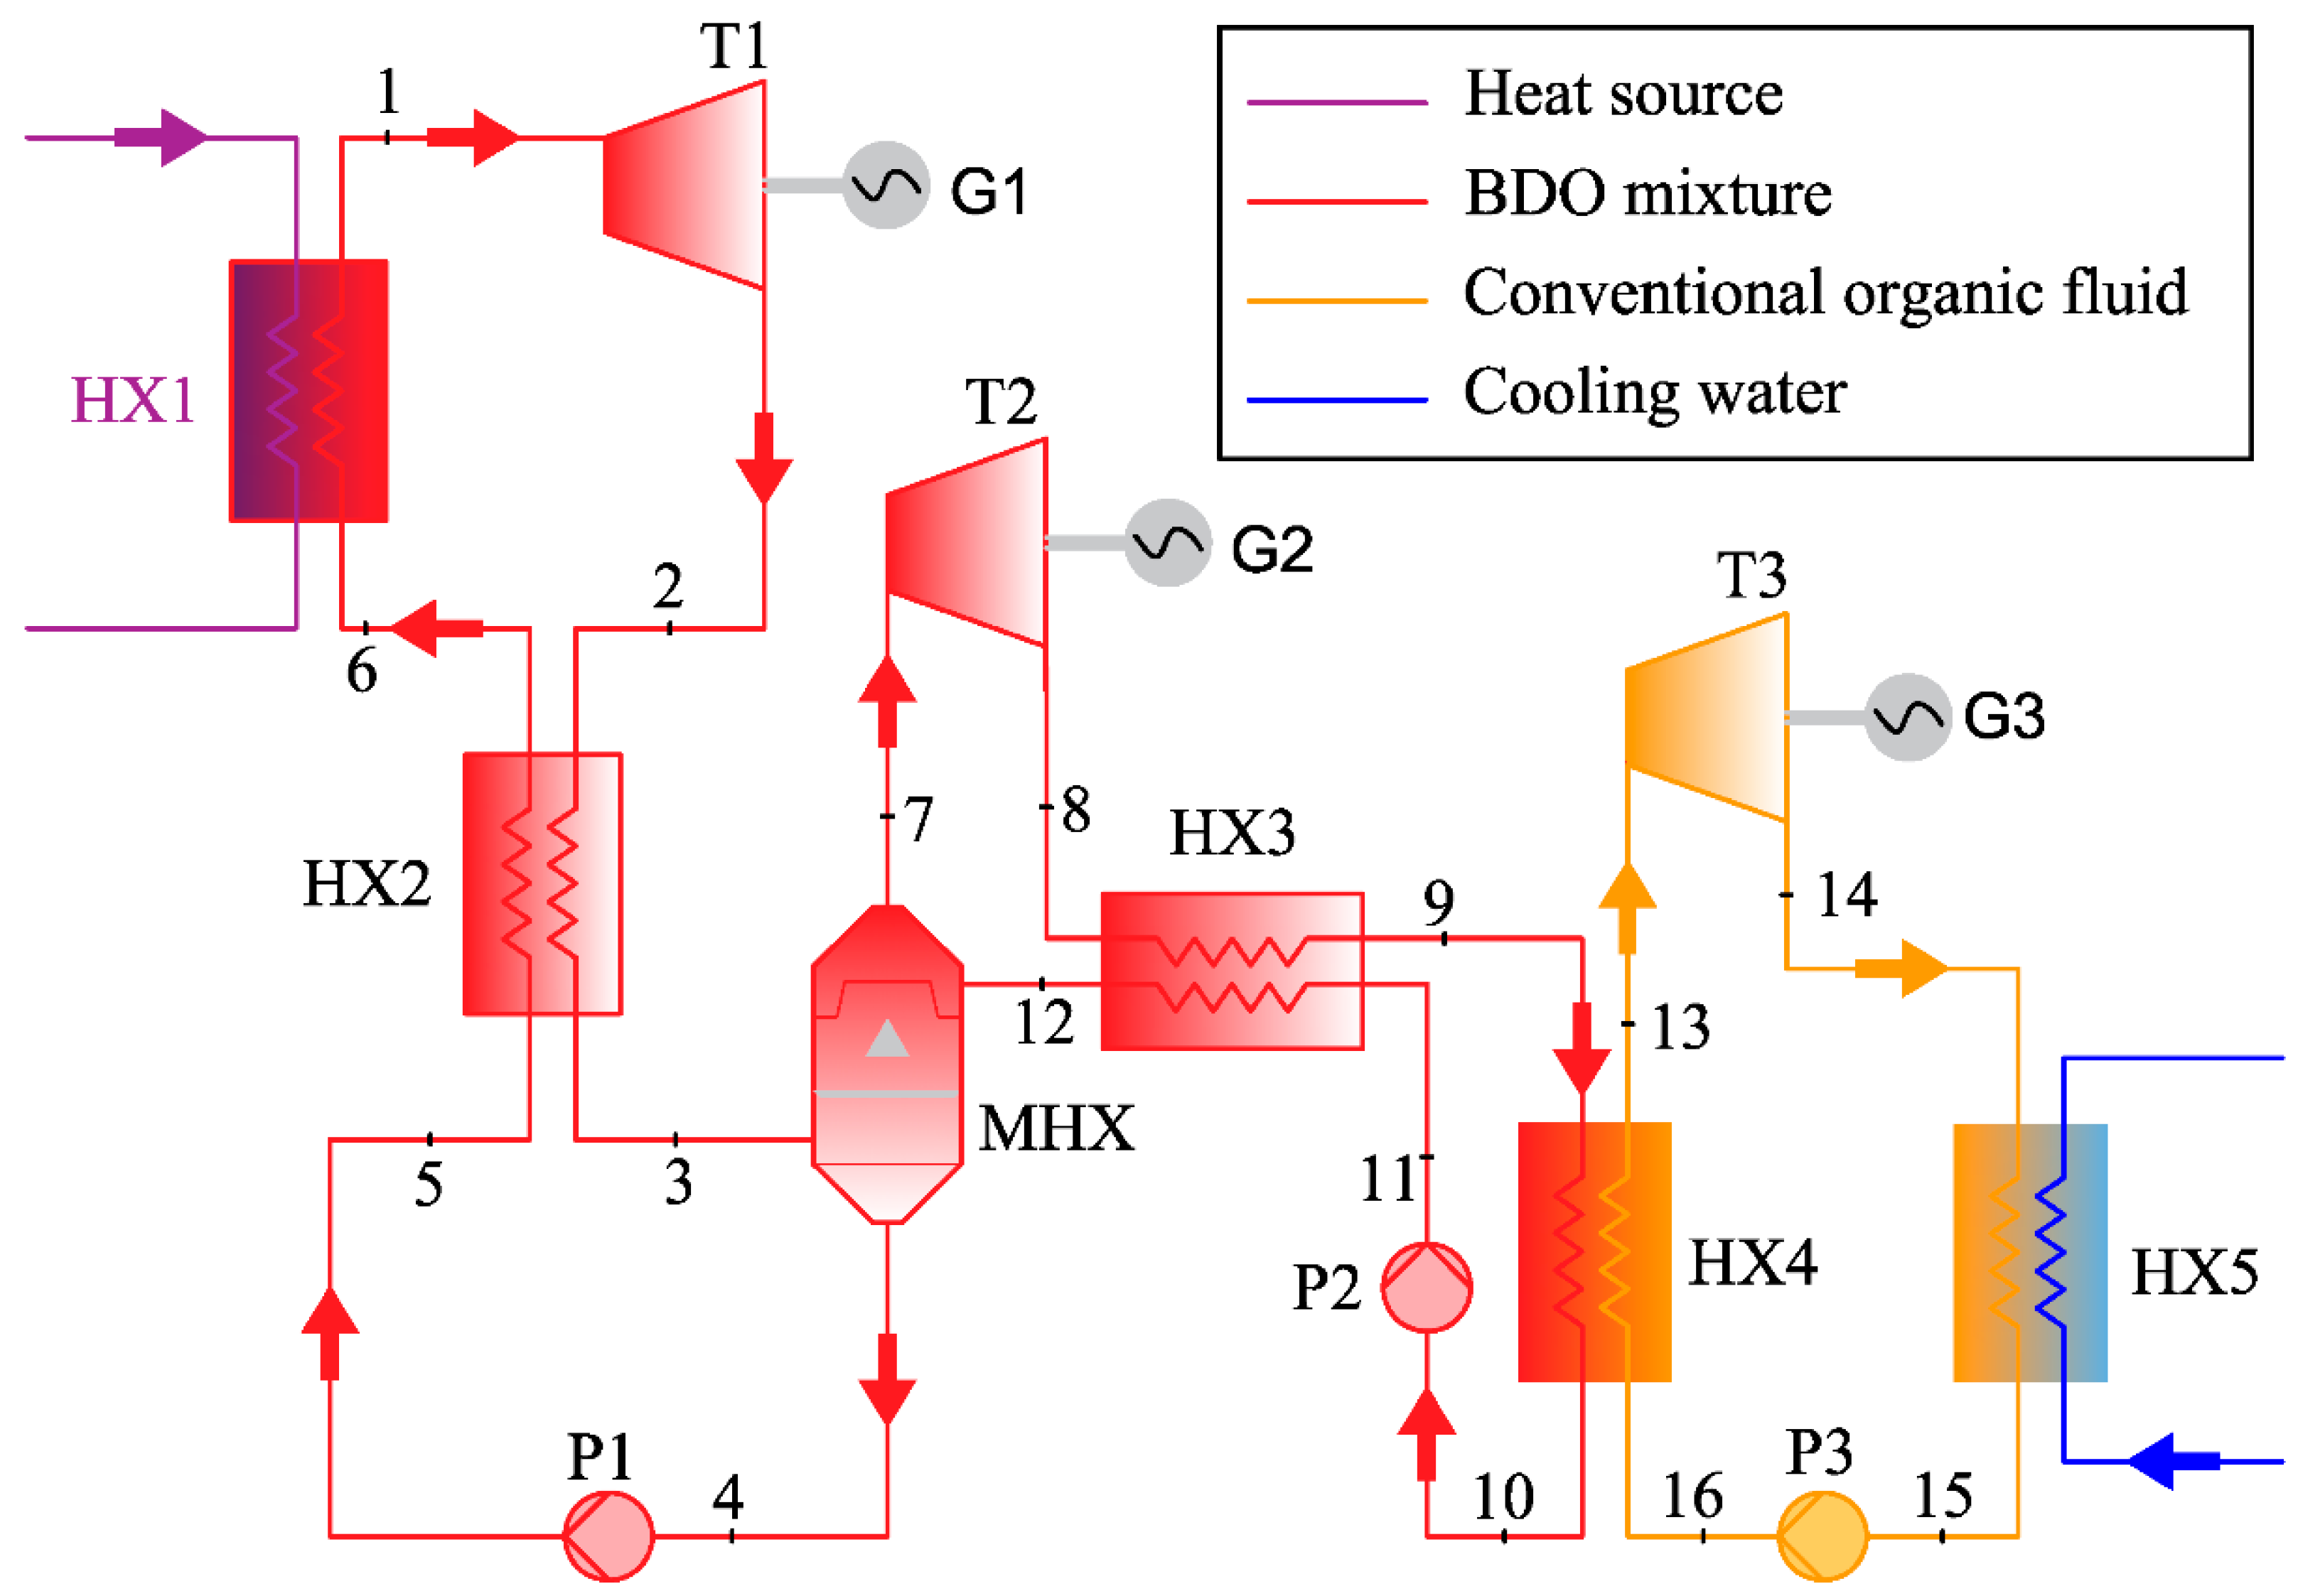
Figure 1 shows the schematic diagram of the proposed high-temperature TORC system. The heat source can be waste heat in industrial production, exhaust heat from land or marine engines, geothermy, biomass combustion, concentrating solar heat, and etc. The cold source can be ambient temperature air or water. In this study, industrial flue gas and water-cooled device are taken as instances.
The system consists of three loops: top ORC in red, middle ORC in red and bottom ORC in orange. The top and middle cycles are coupled by a MHX. MHXs are open-type direct contact heat exchangers (HXs) where one sort or different fluid streams exchange heat and mix with each other [
23]. Indirect heat exchange between the two cycles is thus avoided, leading to enhanced heat transfer performance and reduced cost of equipment [
24]. The function of a MHX is similar to that of the absorbers in absorption refrigeration and the jet HXs in jet refrigeration. MHXs are widely applied in fuel cells to ensure adequate mixing of the fuels with oxidant (usually air) and rapid evaporation [
25]. MHXs are divided into four types according to the structural characteristics: liquid film, liquid column, packed and jet type. The liquid film type is exemplified in
Figure 1. The subcooled liquid of the middle cycle flows into the MHX, and is sprayed to form liquid film after encountering an obstacle. Meanwhile, the superheated vapor of the top cycle flows into the bottom of MHX, and mixed with the liquid film. Due to gravity, the top and bottom outlets of MHX are respectively saturated vapor and saturated liquid after sufficient heat exchange in the middle of MHX. The former drives the turbine 2 (T2) and the latter flows into the pump 1 (P1). Notably, the outlet temperatures and pressures of MHX are correspondingly the same (
and
).
The BDO mixture from P1 outlet is heated in HX2 by the exhaust vapor from T1, and further heated to saturated vapor in HX1 to drive T1 and generate electricity. The exhaust vapor in superheated state is precooled in HX2 and enters MHX. The operating principles of the middle ORC is the same as those of the top ORC. In the bottom ORC, conventional fluids such as benzene, toluene, R141b, cyclohexane and pentane can be adopted. The middle ORC is coupled with the bottom ORC through HX4. The exhaust vapor from the bottom ORC turbine enters HX5, and is cooled to saturated liquid by ambient temperature water.
4. Results and Discussion
Table 4 displays the design parameters. Given the top ORC evaporation temperature (
) and bottom ORC condensation temperature (
), the middle ORC evaporation and condensation temperatures (
and
) emerge as crucial parameters because they not only affect each subcycle efficiency, but also influences the TORC efficiency. As
equals to the top ORC condensation temperature, i.e., MHX outlet temperature (
),
and
are taken as variables in this simulation. The parameters for the rest state points can be determined by the conditions such as conservation of energy, pump and turbine efficiencies, and heat transfer temperature difference.
The ranges of
and
are determined in the following considerations. First, maintaining a vacuum below 5 kPa in the HXs is a technical limit [
47,
48]. As 5 kPa corresponds to the saturation temperature of 153 °C for the BDO mixture, the lower limit of
is chosen as 153 °C. Second, limited by the minimum heat transfer temperature difference (
),
. The lower limit of
is selected as 163 °C. Third, the upper limit of
is taken as the critical temperature of each bottom ORC fluid plus
in HX4. Forth, as
in the top ORC, the upper limit of
is set as 390 °C.
4.1. Thermodynamic Performance Analysis
4.1.1. Thermal Efficiency
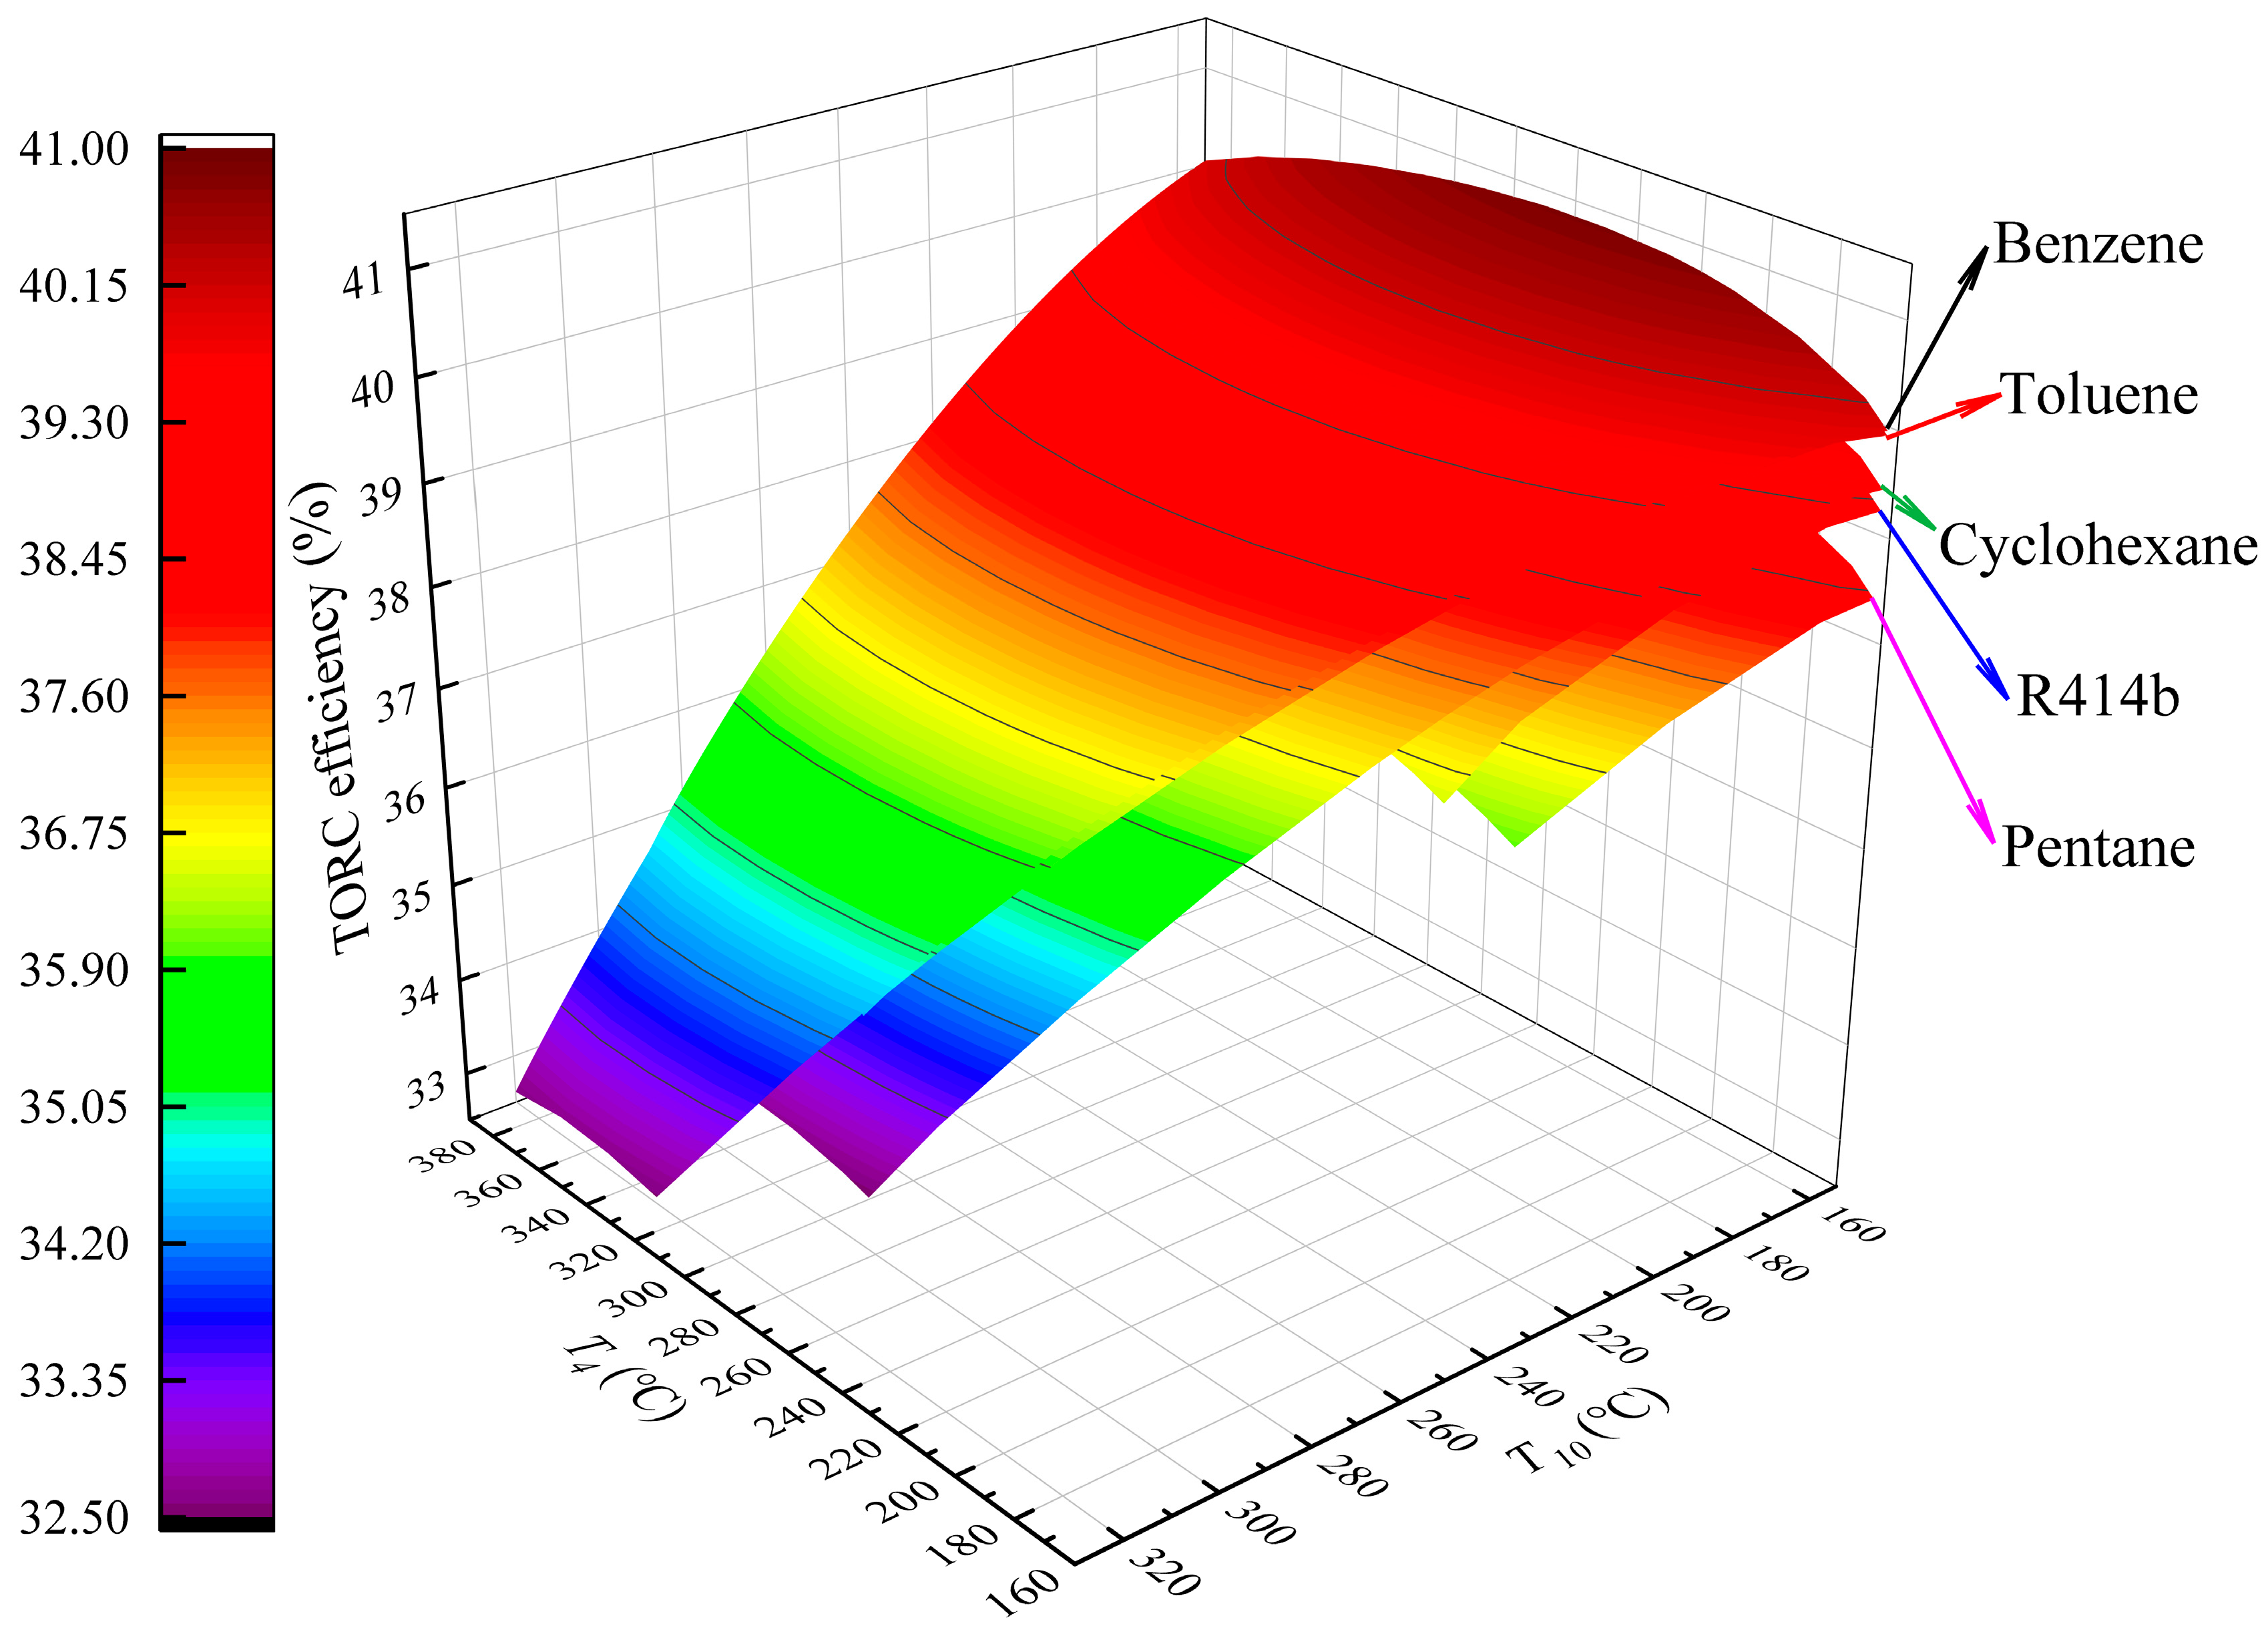
Figure 3 exhibits the variation of
with
and
in the circumstance of considering pressure drop. The actual pressure drop is taken as the minimum allowable pressure drop in
Table 1. The size of each curved surface varies because the different critical temperatures of bottom ORC fluids limit the maximum
. Each surface becomes narrower as
increases. The reason is that as
, the lower limit of
rises as
ascends, while the upper limit of
is maintained at 390 °C. For example,
ranges from 170 °C to 390 °C when
is 160 °C, while
varies from 310 °C to 390 °C when
is 300 °C for benzene, toluene or pentane. The curves representing benzene and toluene almost coincide because of their close efficiencies. Given
,
decreases monotonously with the increment in
. The optimum
is achieved at the lowest
of 153 °C for the five bottom fluids.
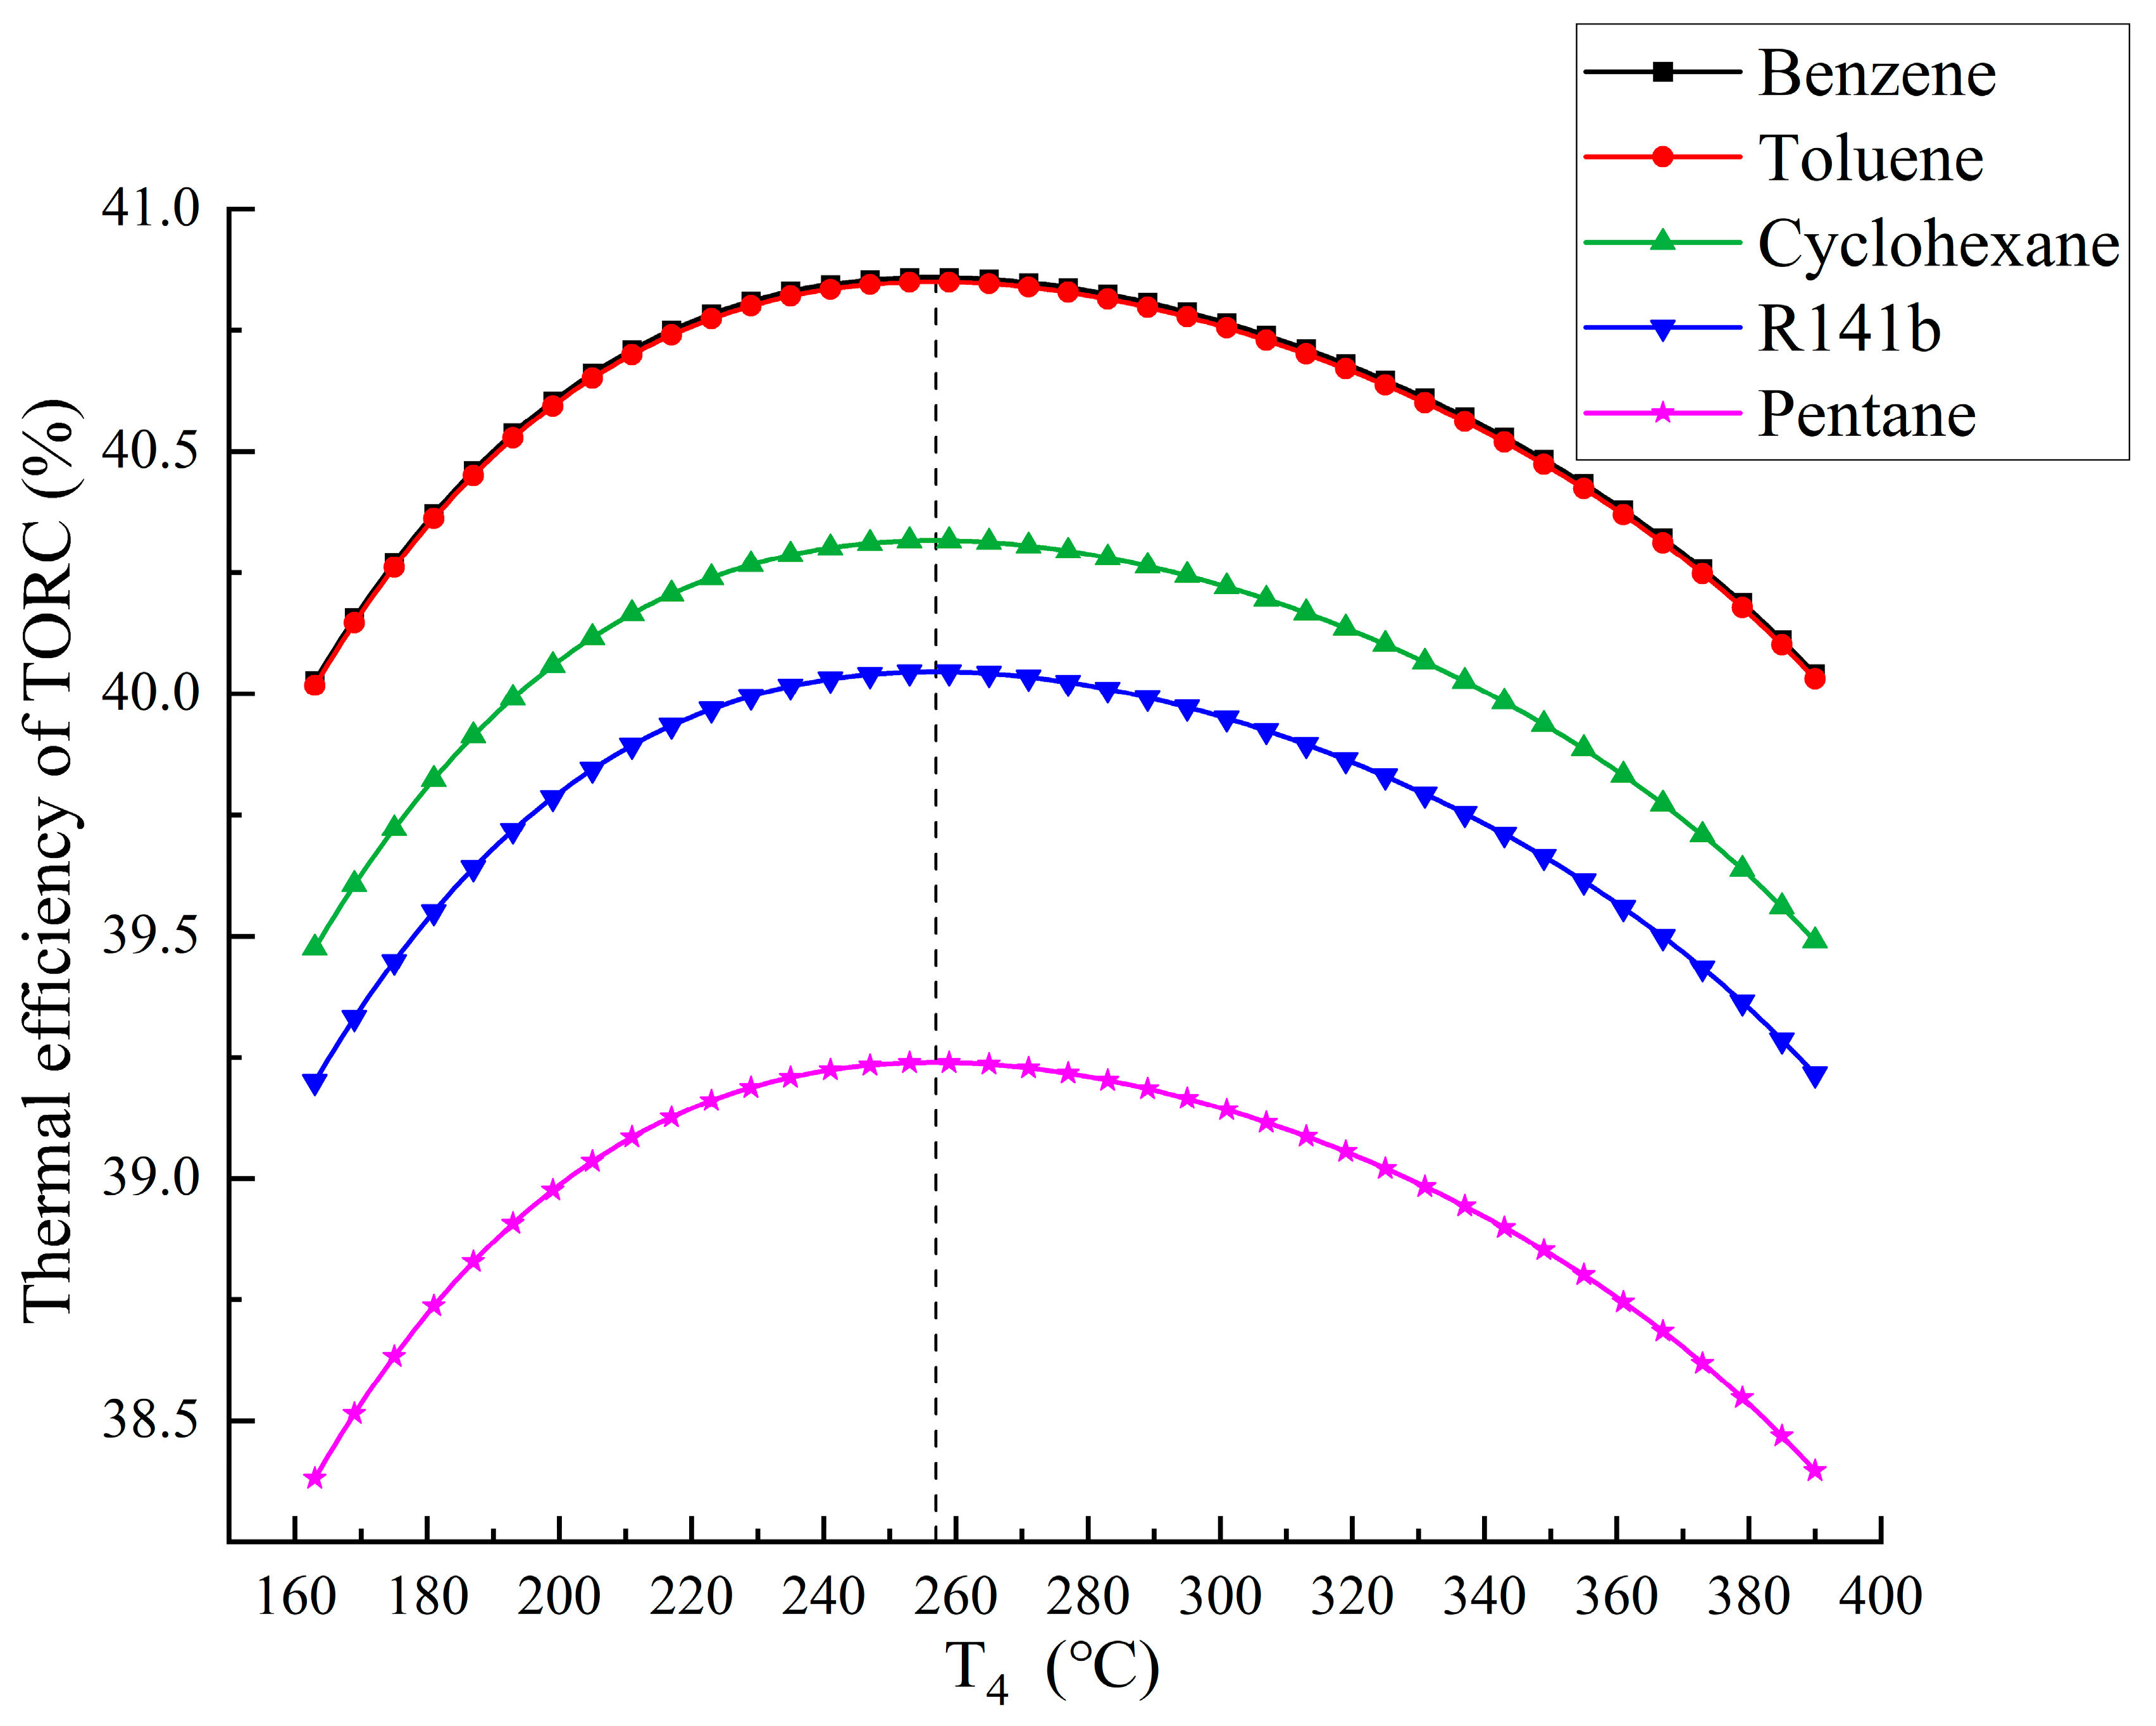
Figure 3 displays the cross section corresponding to
of 153 °C.
first increases and then decreases with
. The peak value of each curve is obtained when
is 257 °C. The maximum
is 40.86% when benzene is employed, and it is noticeably higher than that of the results obtained by all the previous TORC studies [
2,
4,
7,
8,
21,
22].
Table 5 summarizes the thermodynamic parameters of each state point for benzene at the optimum condition. The pressure drop of the cold side in HX1, HX2 and HX4 is postulated to be 35 kPa, and it is 5 kPa for HX3. Whereas it is 5 kPa, 0.633 kPa, 0.57 kPa and 1.76 kPa on the hot side of HX2, HX3, HX4 and HX5, respectively.
Figure 4.
Variations of TORC thermal efficiency with when 153 °C.
Figure 4.
Variations of TORC thermal efficiency with when 153 °C.
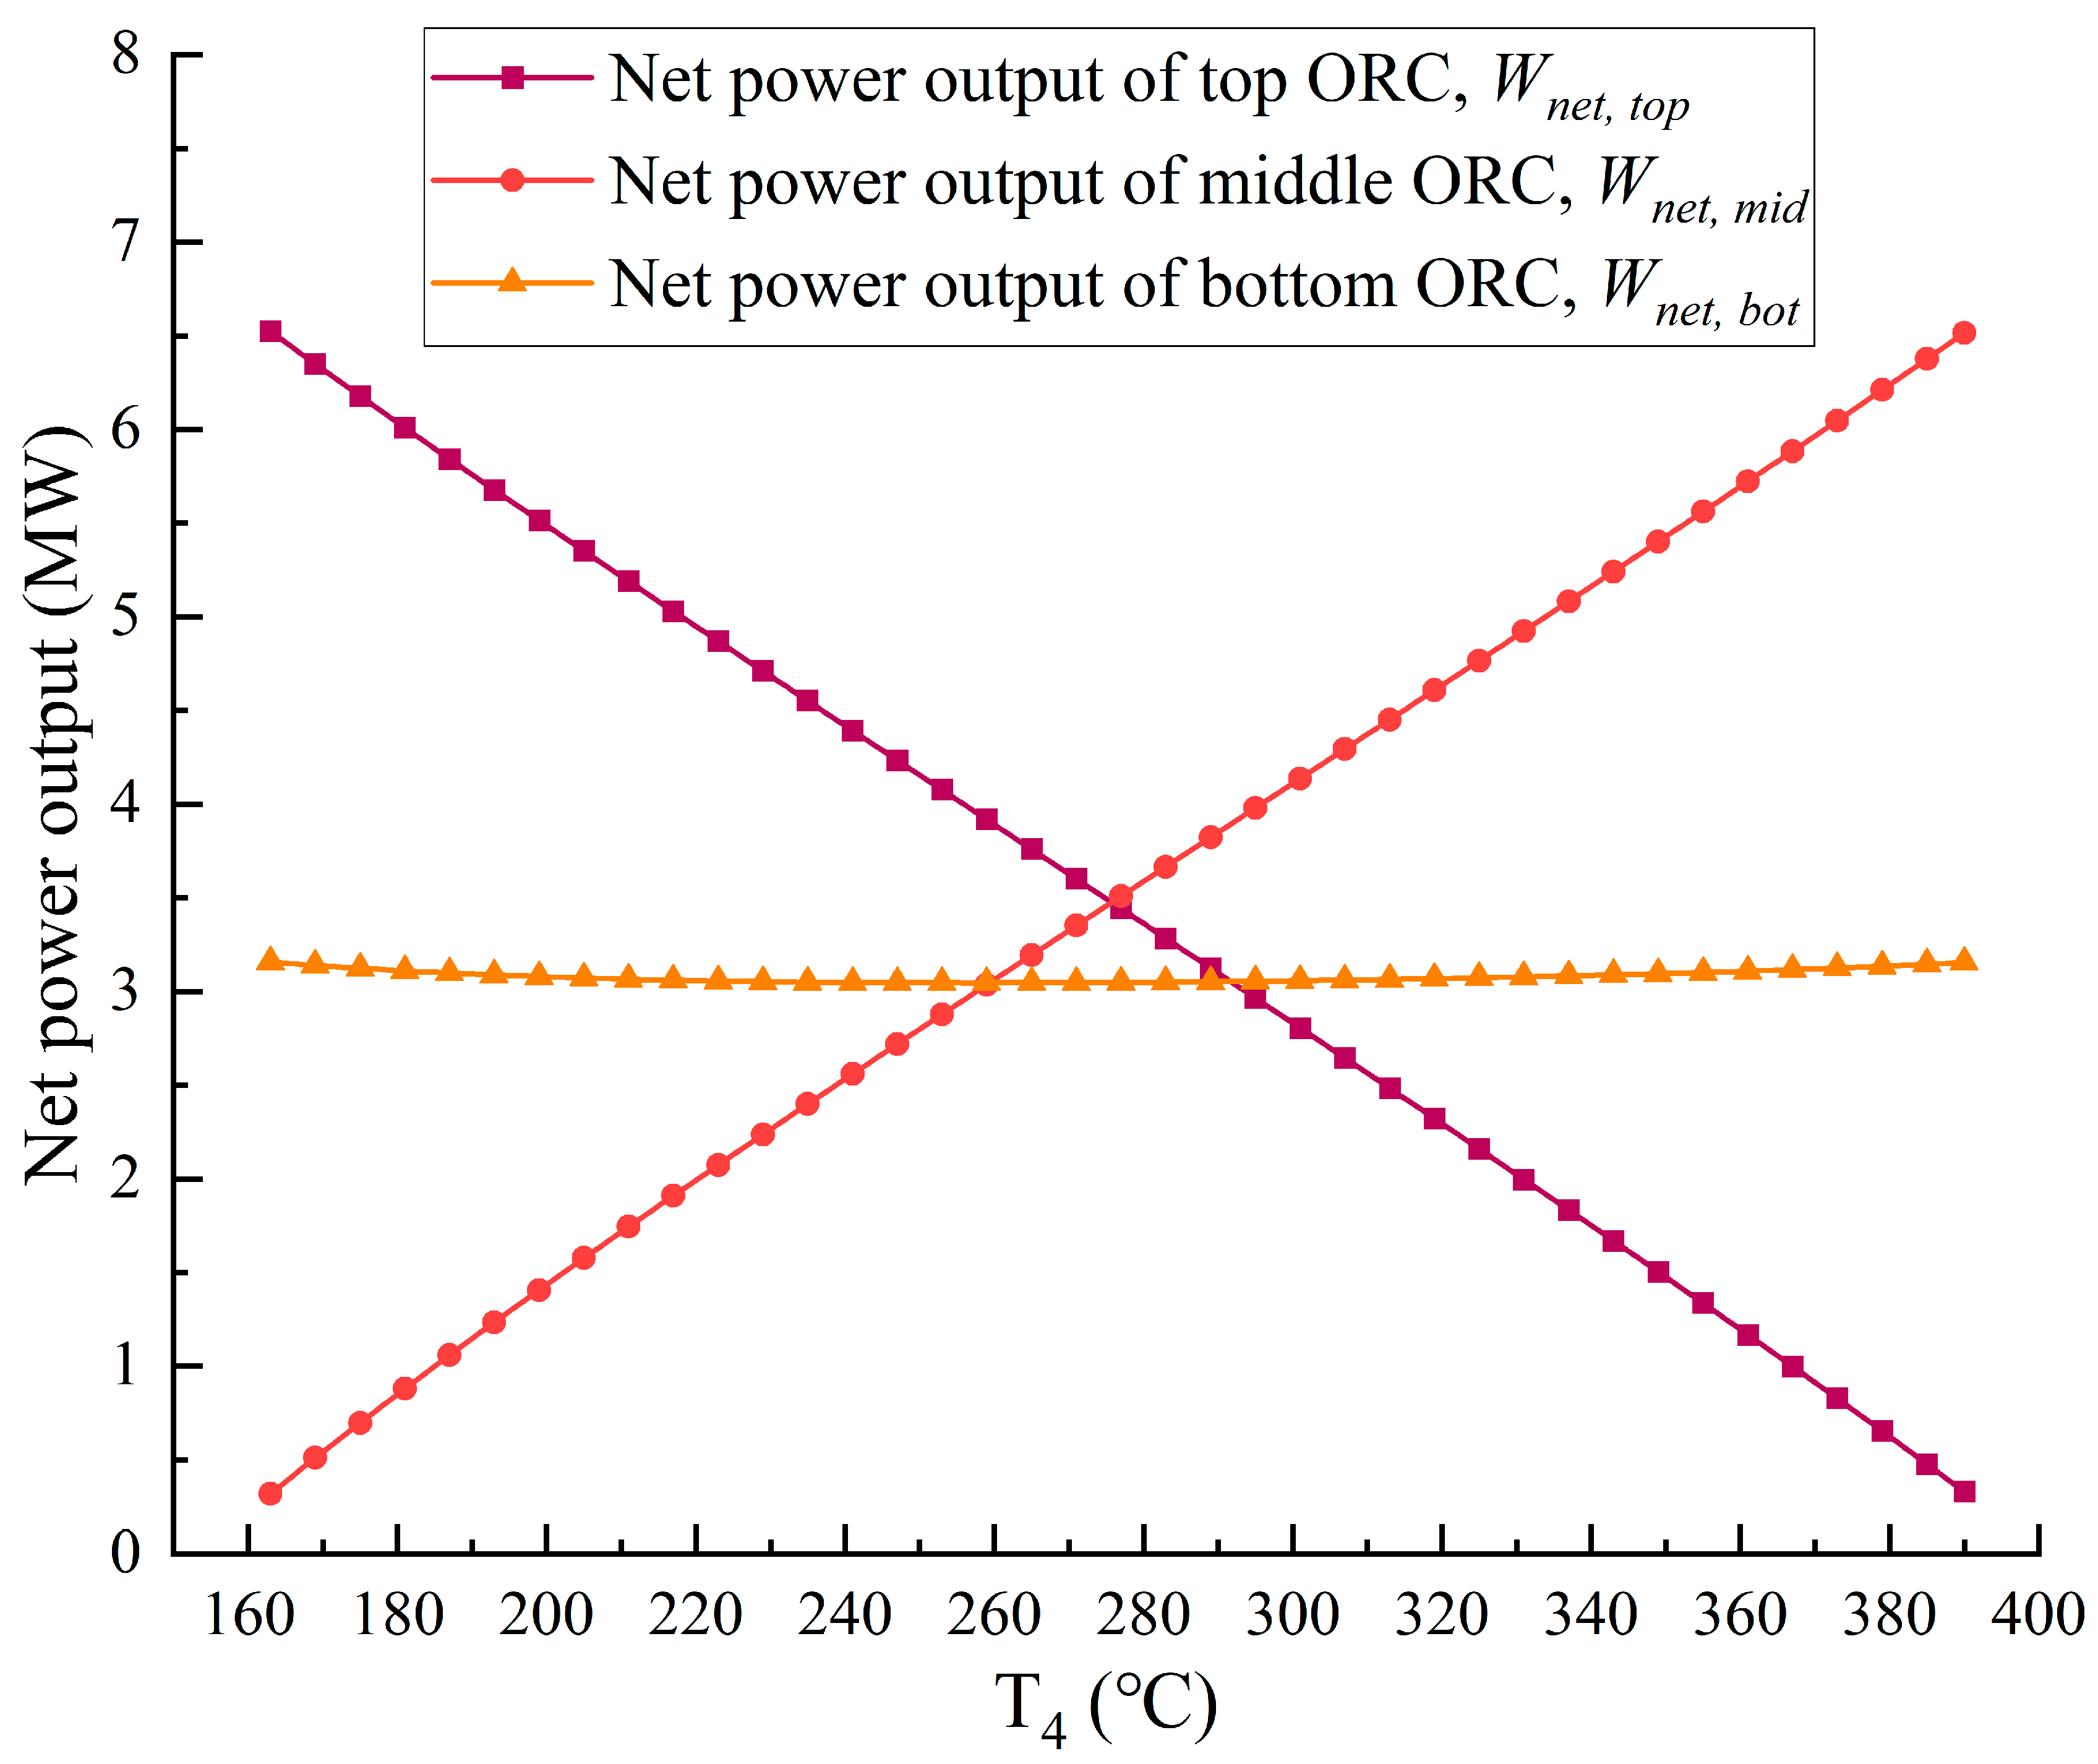
Figure 5 and
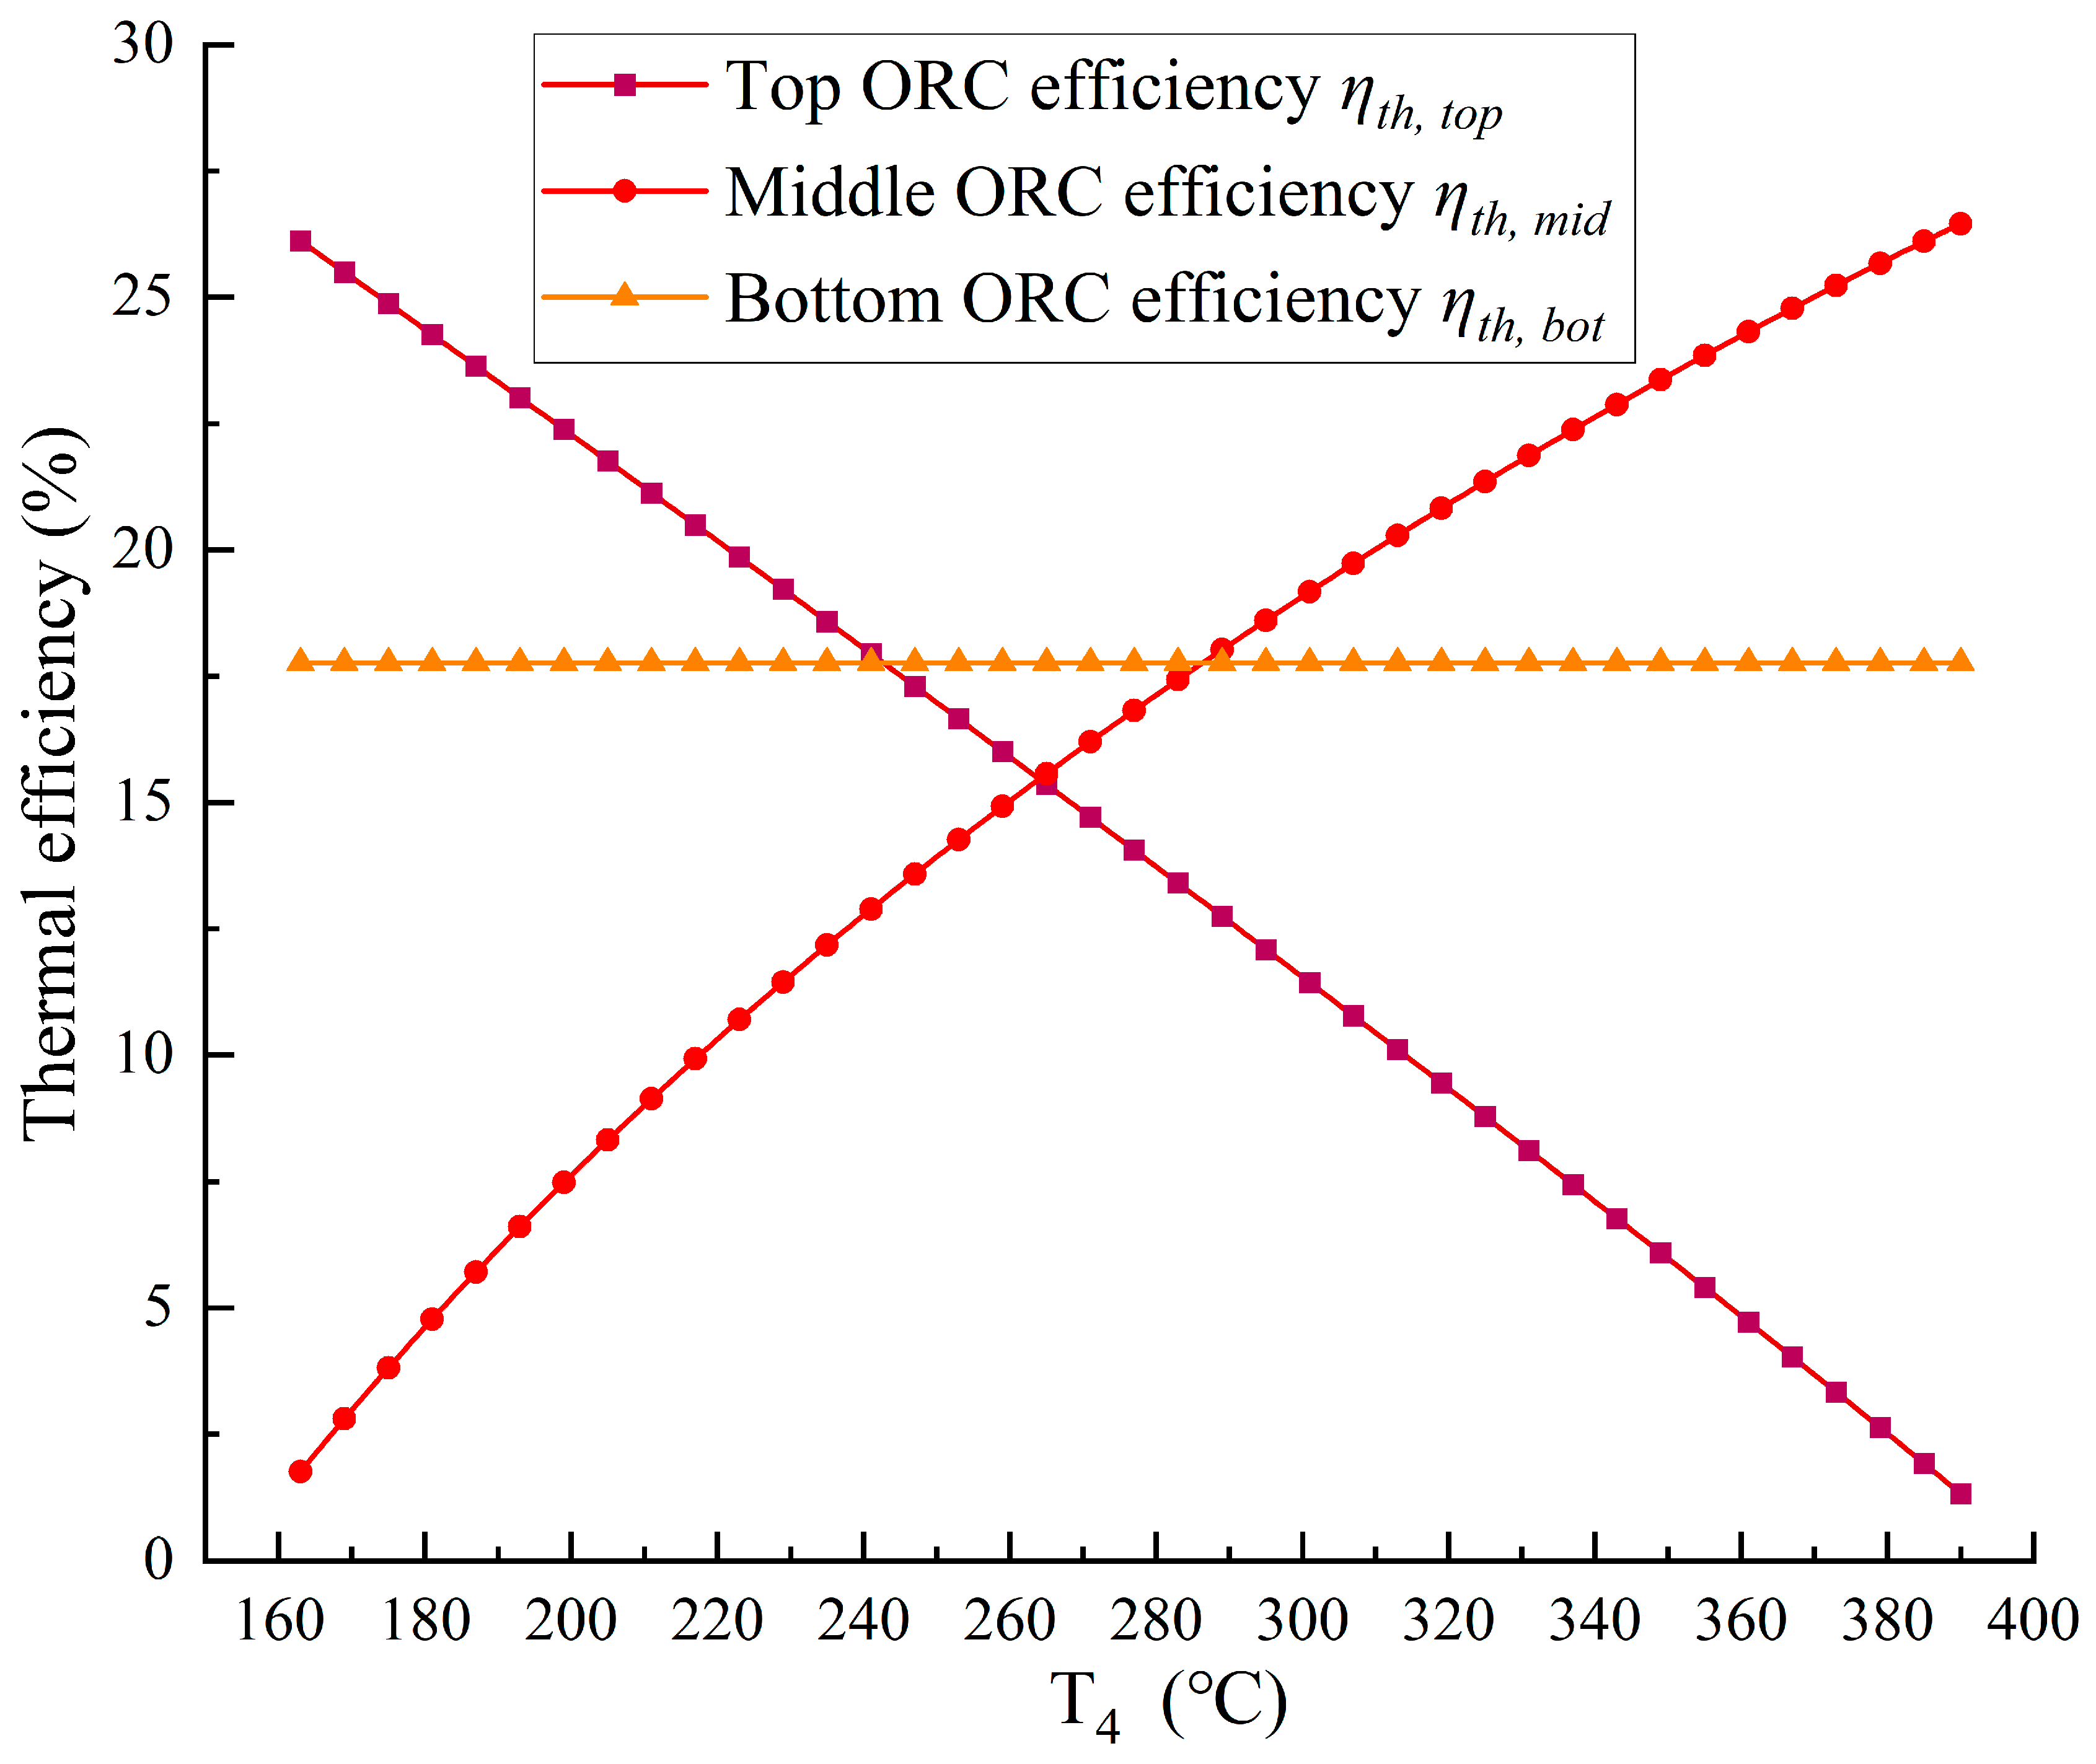
Figure 6 present the variations of subcycle net power outputs and efficiencies on the use of benzene at
of 153 °C. The net power output for the top ORC drops linearly as
rises, while it increases linearly for the middle ORC and keeps almost stable for the bottom ORC. Similarly, the top ORC efficiency (
) decreases linearly, the middle ORC efficiency (
) increases approximately linearly, and the bottom ORC efficiency (
) remains constant with
. The reason is that given
,
and
, the temperature difference between the top ORC declines, while it increases for the middle ORC and remains unchanged for the bottom ORC. As the optimal
and
are fixed for different bottom ORC fluids,
of 16.22% and
of 14.71% can be calculated at the optimal condition. But
varies depending on the bottom fluids, leading to a difference in
. The minimum
is 15.45% for pentane and the maximum
is 17.76% for benzene.
Table 6 posts some key thermodynamic indicators by using benzene.
4.1.2. Mass Flow Rate
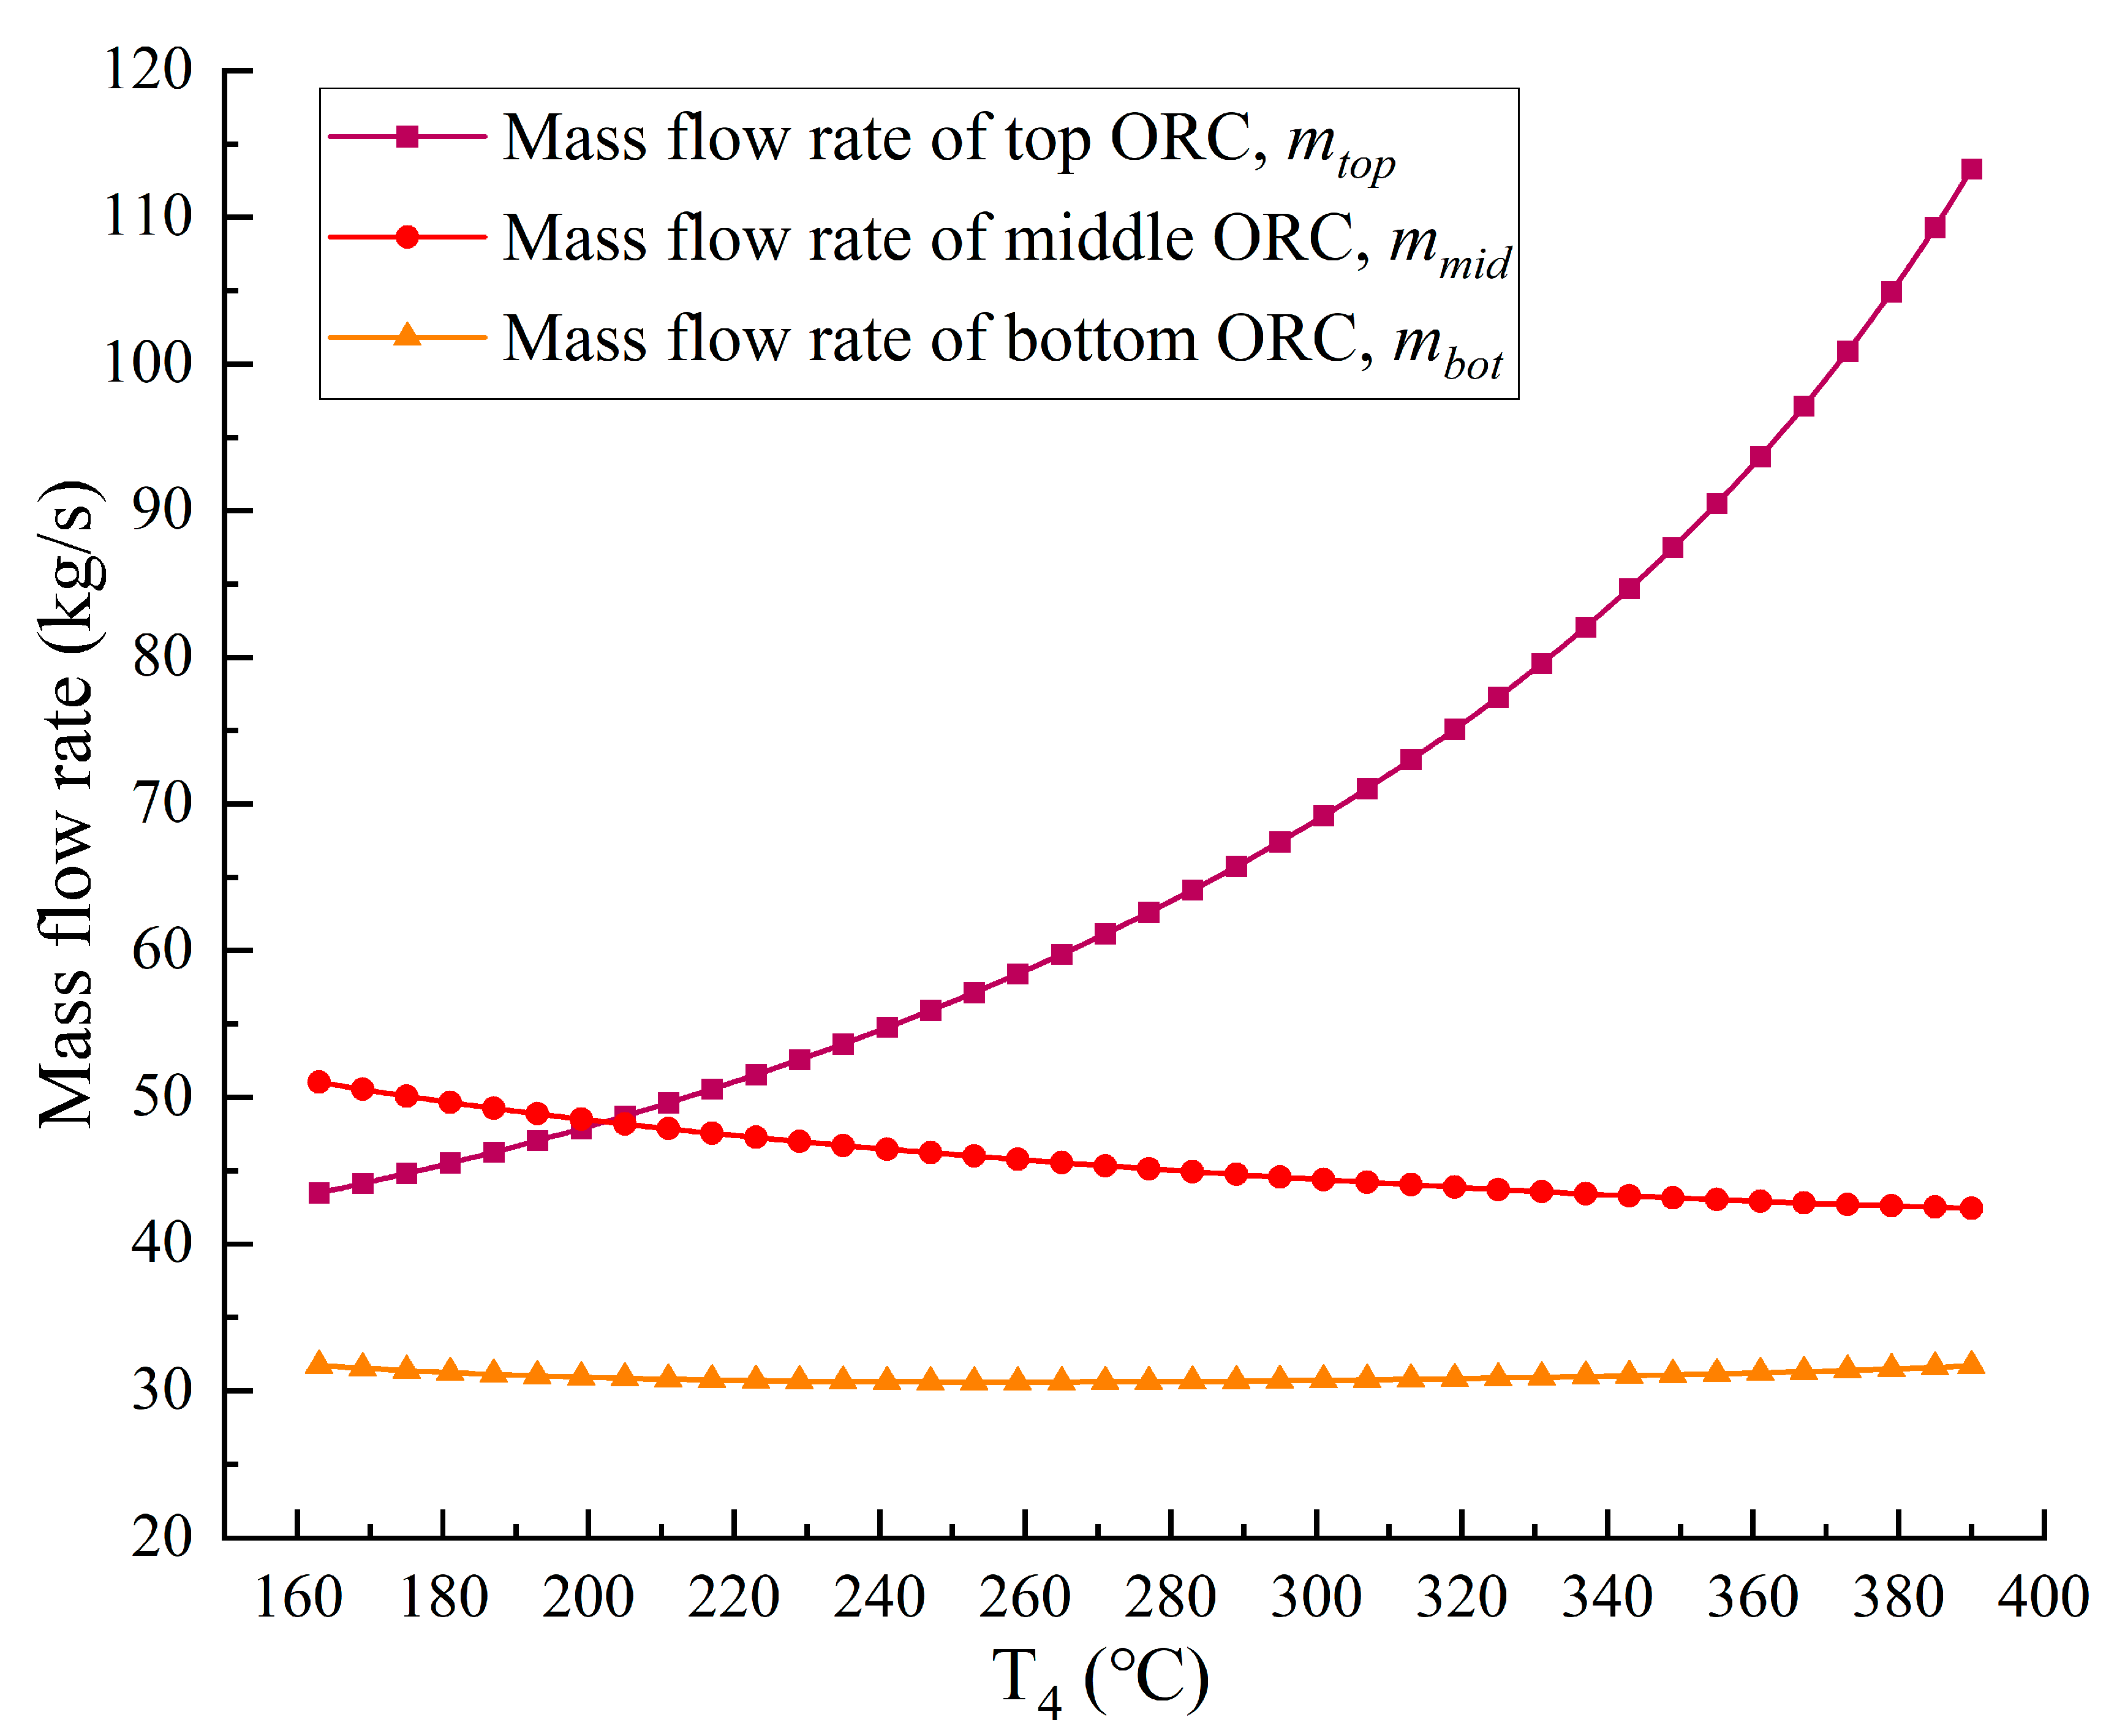
Figure 7 portrays the variations of subcycle mass flow rates on the use of benzene when
is 153 °C. The mass flow rate of top ORC (
) first increases appreciably, and then soars with
. The reason is as follows. Given
and
,
increases with
and (
) reduces. As the net power output of TORC system (
) is fixed at 10 MW,
is inversely proportional to the total heat absorbed (
) according to Eq. (25). As
rises when
257 °C and falls down when
257 °C as displayed in
Figure 4,
first diminishes, and then increases. However, the magnitude of
reduction is smaller than that of (
) when
ranges from 163 °C to 257 °C. For instance,
is 24.78, 24.62 and 24.53 MW when
is 180, 200 and 220 °C. The corresponding (
) is 545.82, 512.82 and 480.44 kJ/kg.
increases moderately when 163 °C
257 °C according to
. As
rises and (
) descends when
257 °C,
therefore grows considerably. The mass flow rate of middle ORC (
) decreases and mass flow rate of bottom ORC (
) remains almost constant with
. The reasons can be deduced similarly.
4.1.3. T-Q Diagram
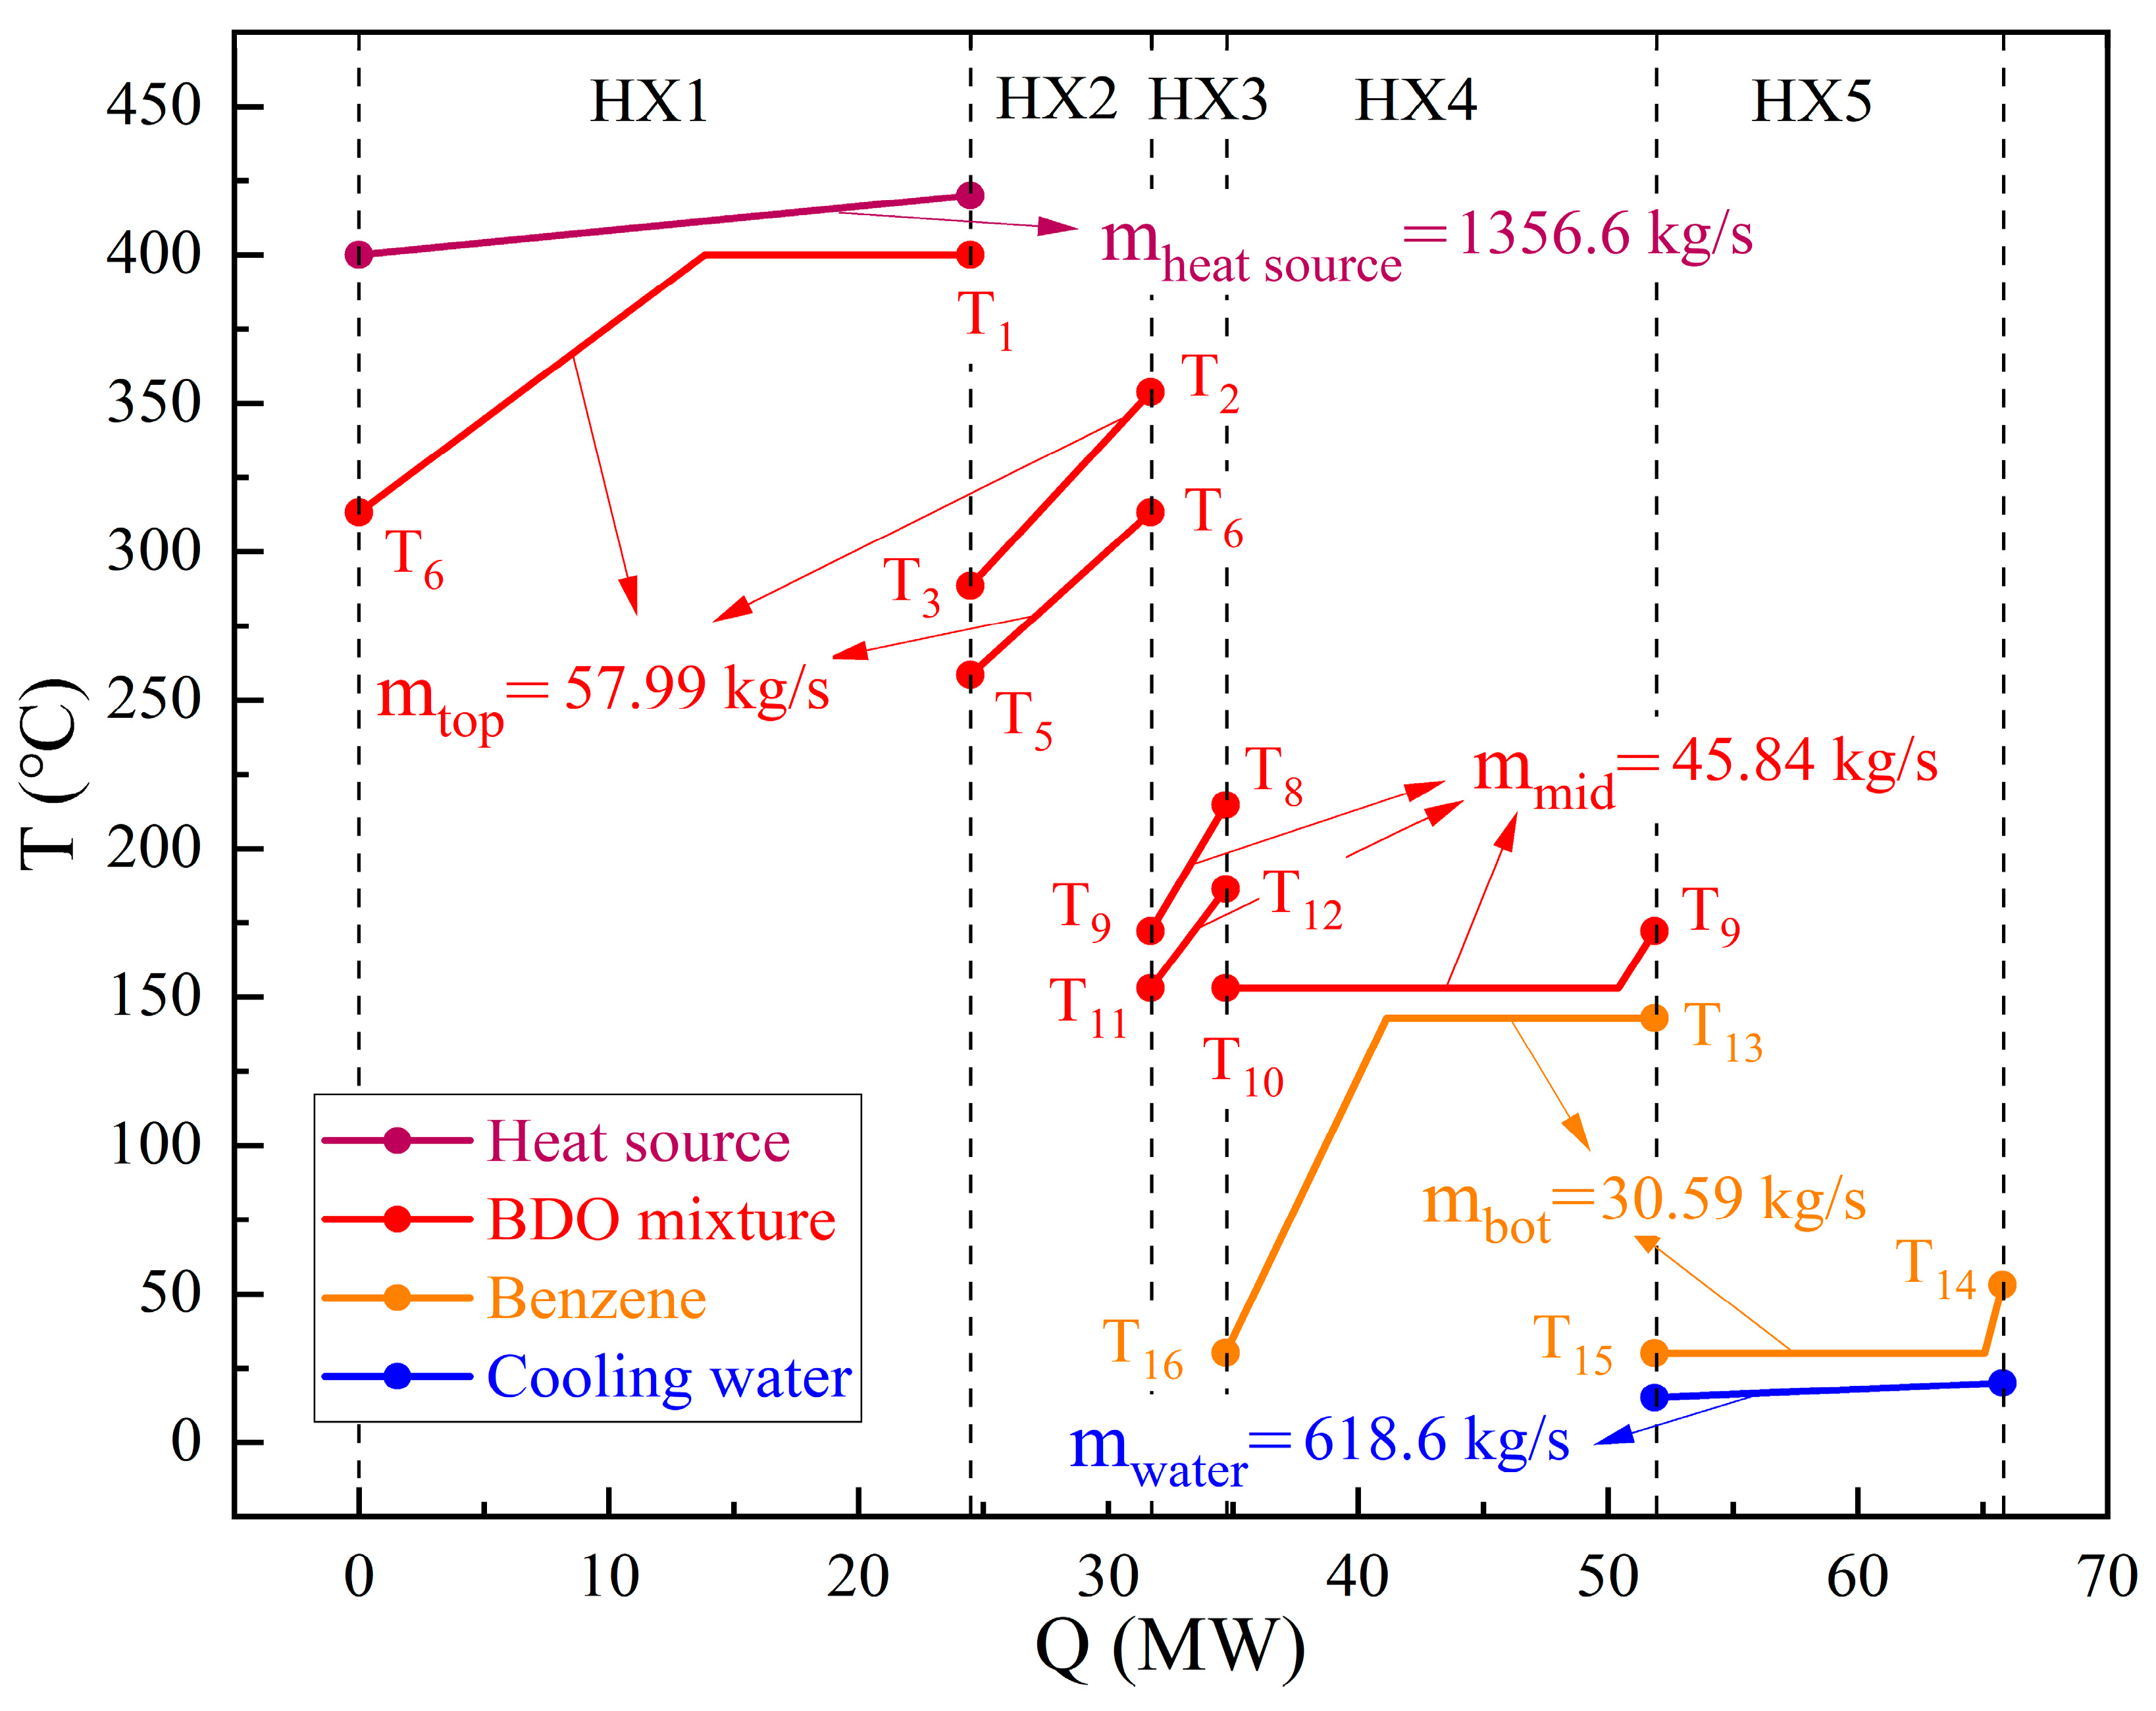
Figure 8 illustrates the
T-Q diagram at the optimum condition. The dotted lines distinguish different heat exchangers. The heat transfer temperature difference takes place at the pinch point for HX1, HX4 and HX5, while it occurs at the high temperature BDO mixture outlet for HX2 and HX3. The heat transfer temperature differences are 11.31, 29.97, 19.28, 10 and 10.26 °C for HX1-HX5, respectively. Notably,
of 10 °C is the minimum heat transfer temperature difference in all the HXs. The heat transfer temperature differences in HX1, HX2, HX3 and HX5 are higher than
. The heat transfer in HX1-HX5 is 24.472, 7.216, 3.012, 17.443 and 13.942 MW, respectively.
4.1.4. Entropy Generation
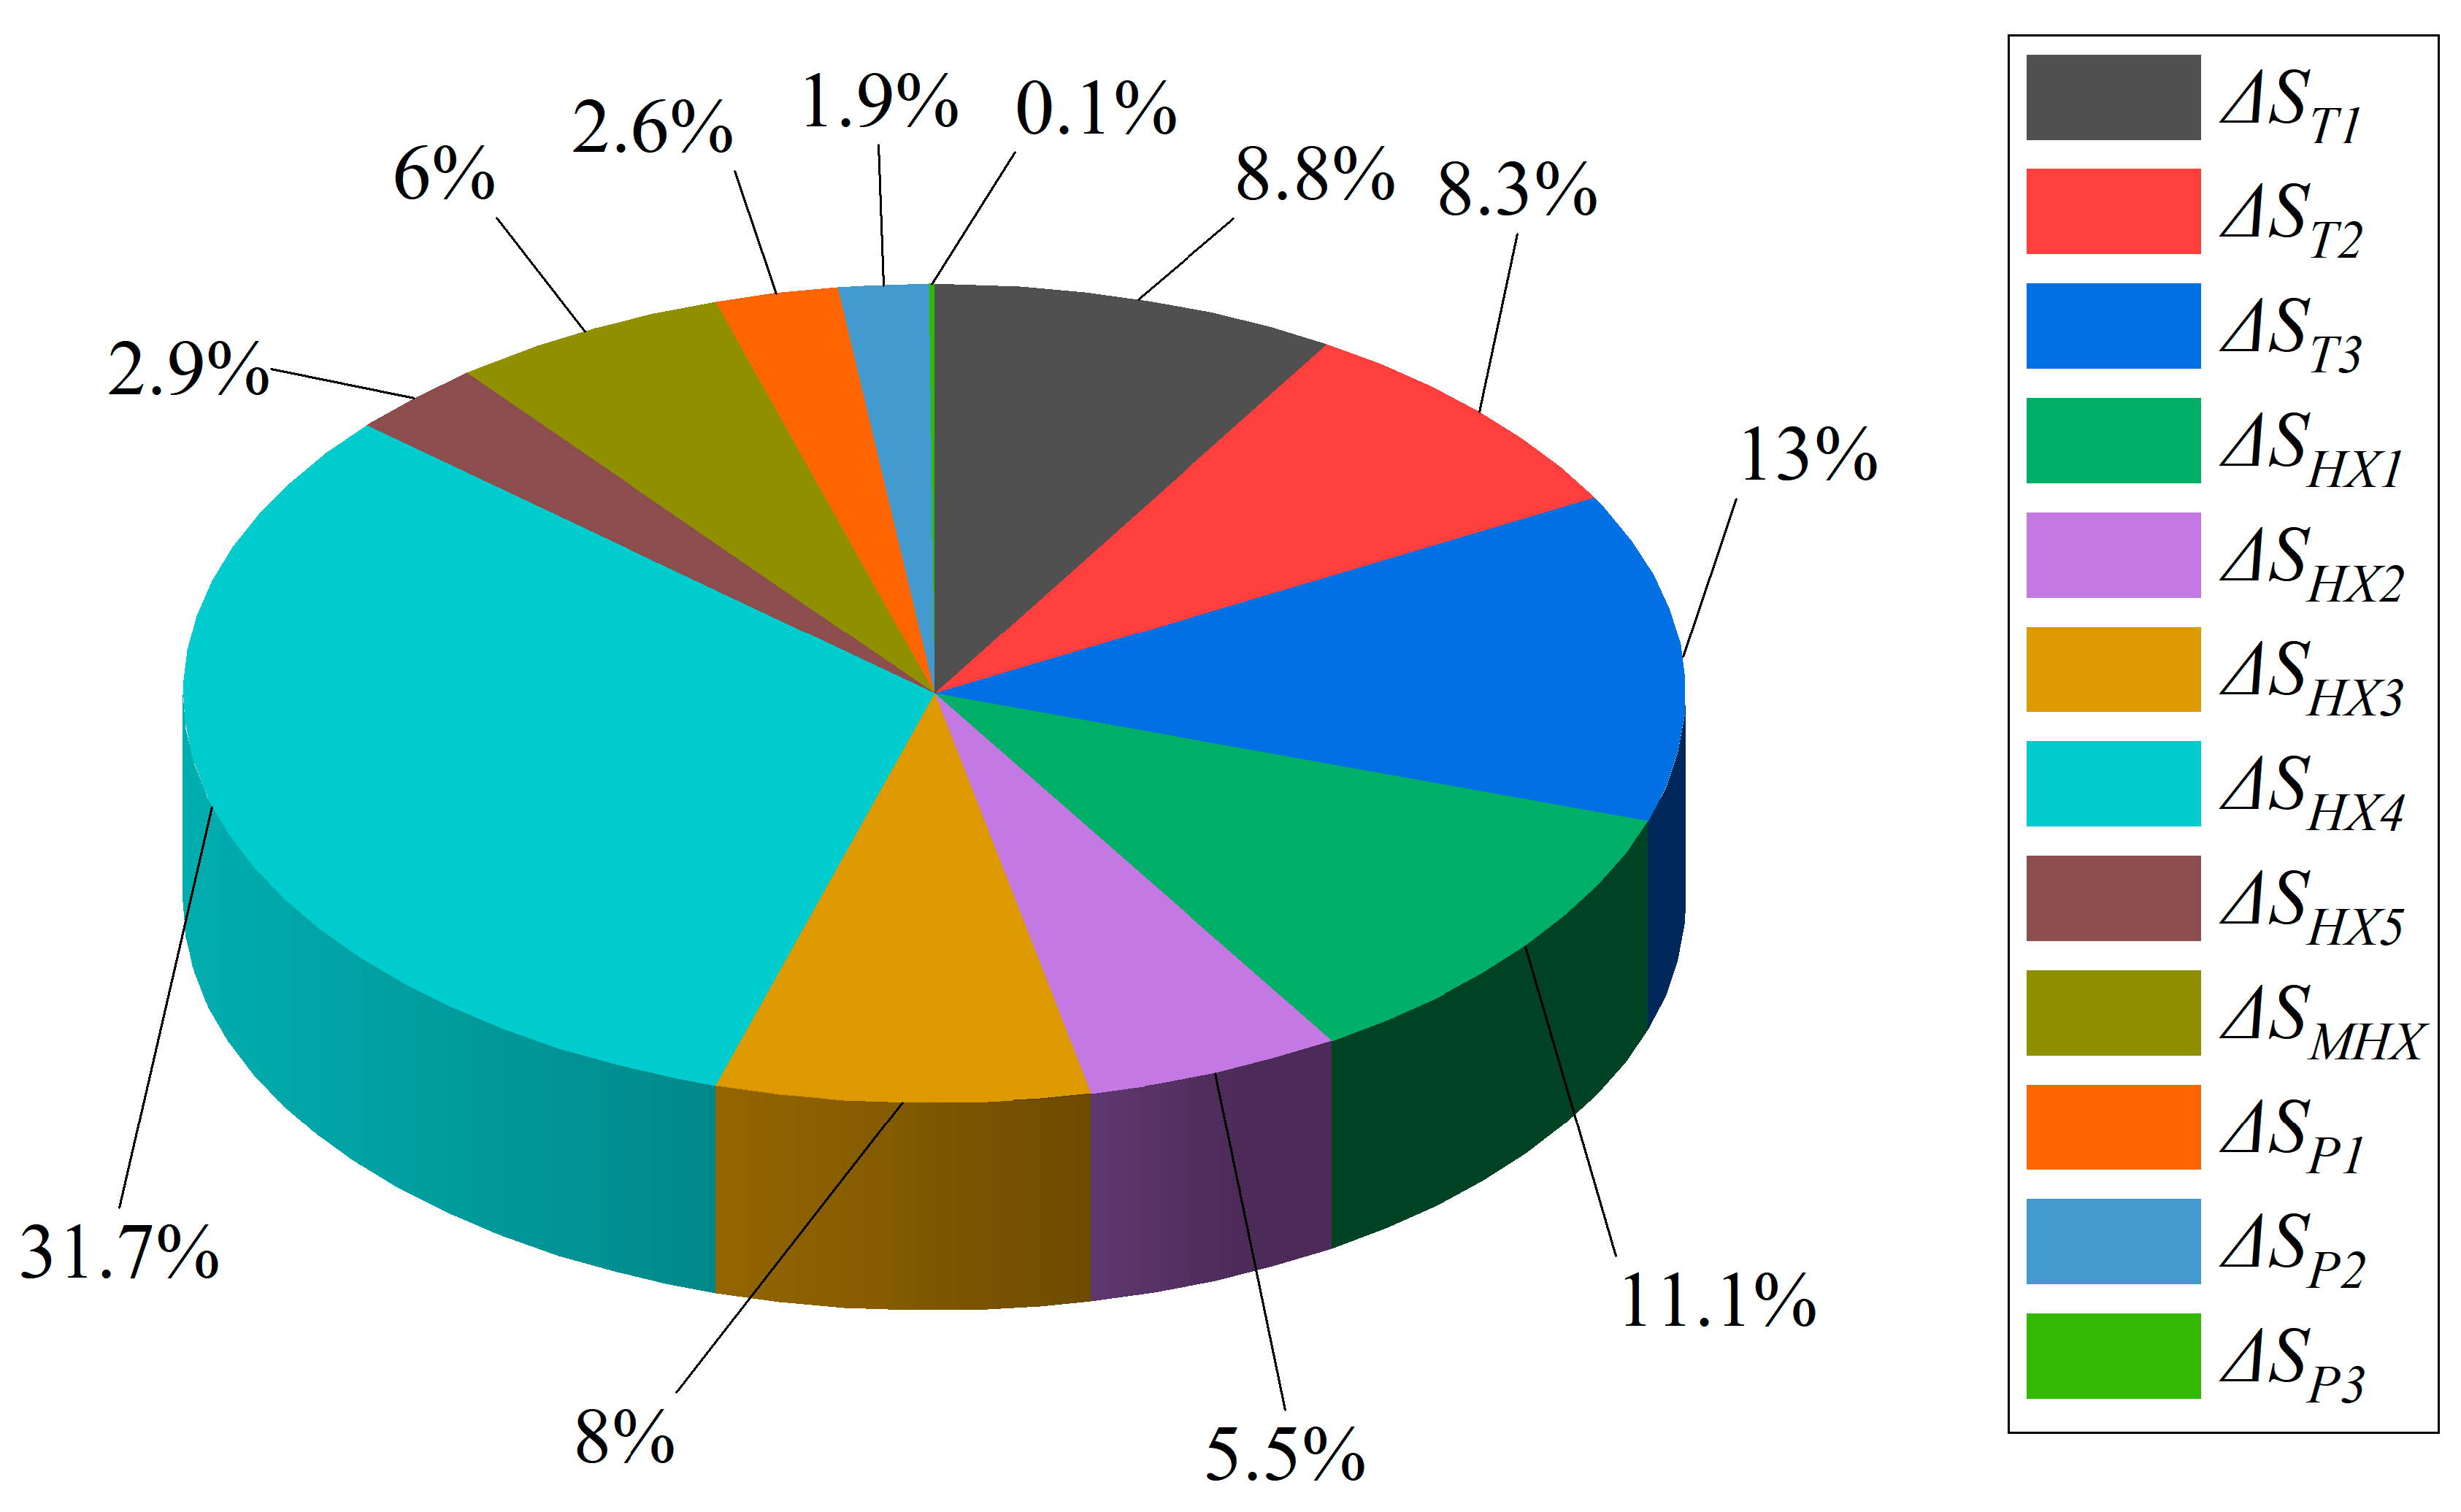
Figure 9 exhibits the percentage of entropy generated by each component at the maximum
. The largest exergy destruction takes place in HX4, which accounts for more than 30% of the total irreversible losses. This is mainly due to the large heat transfer temperature difference in the subcooled region of HX4. The cold side benzene rises from subcooled state at 30.21 °C to saturated liquid state at 143 °C, while the hot side BDO mixture remains in the binary phase state of 153 °C. The entropy generation in T3 ranks the second largest on account of the large enthalpy drop (i.e., exergy drop) during expansion. The irreversible loss in P3 accounts for merely 0.1%, which is much less than that of P1 and P2. The reason is that the mass flow rate through P3 (
30.59 kg/s) is remarkably lower than that of P1 (
57.99 kg/s) and P2 (
45.84 kg/s).
4.1.5. Exergy Efficiency
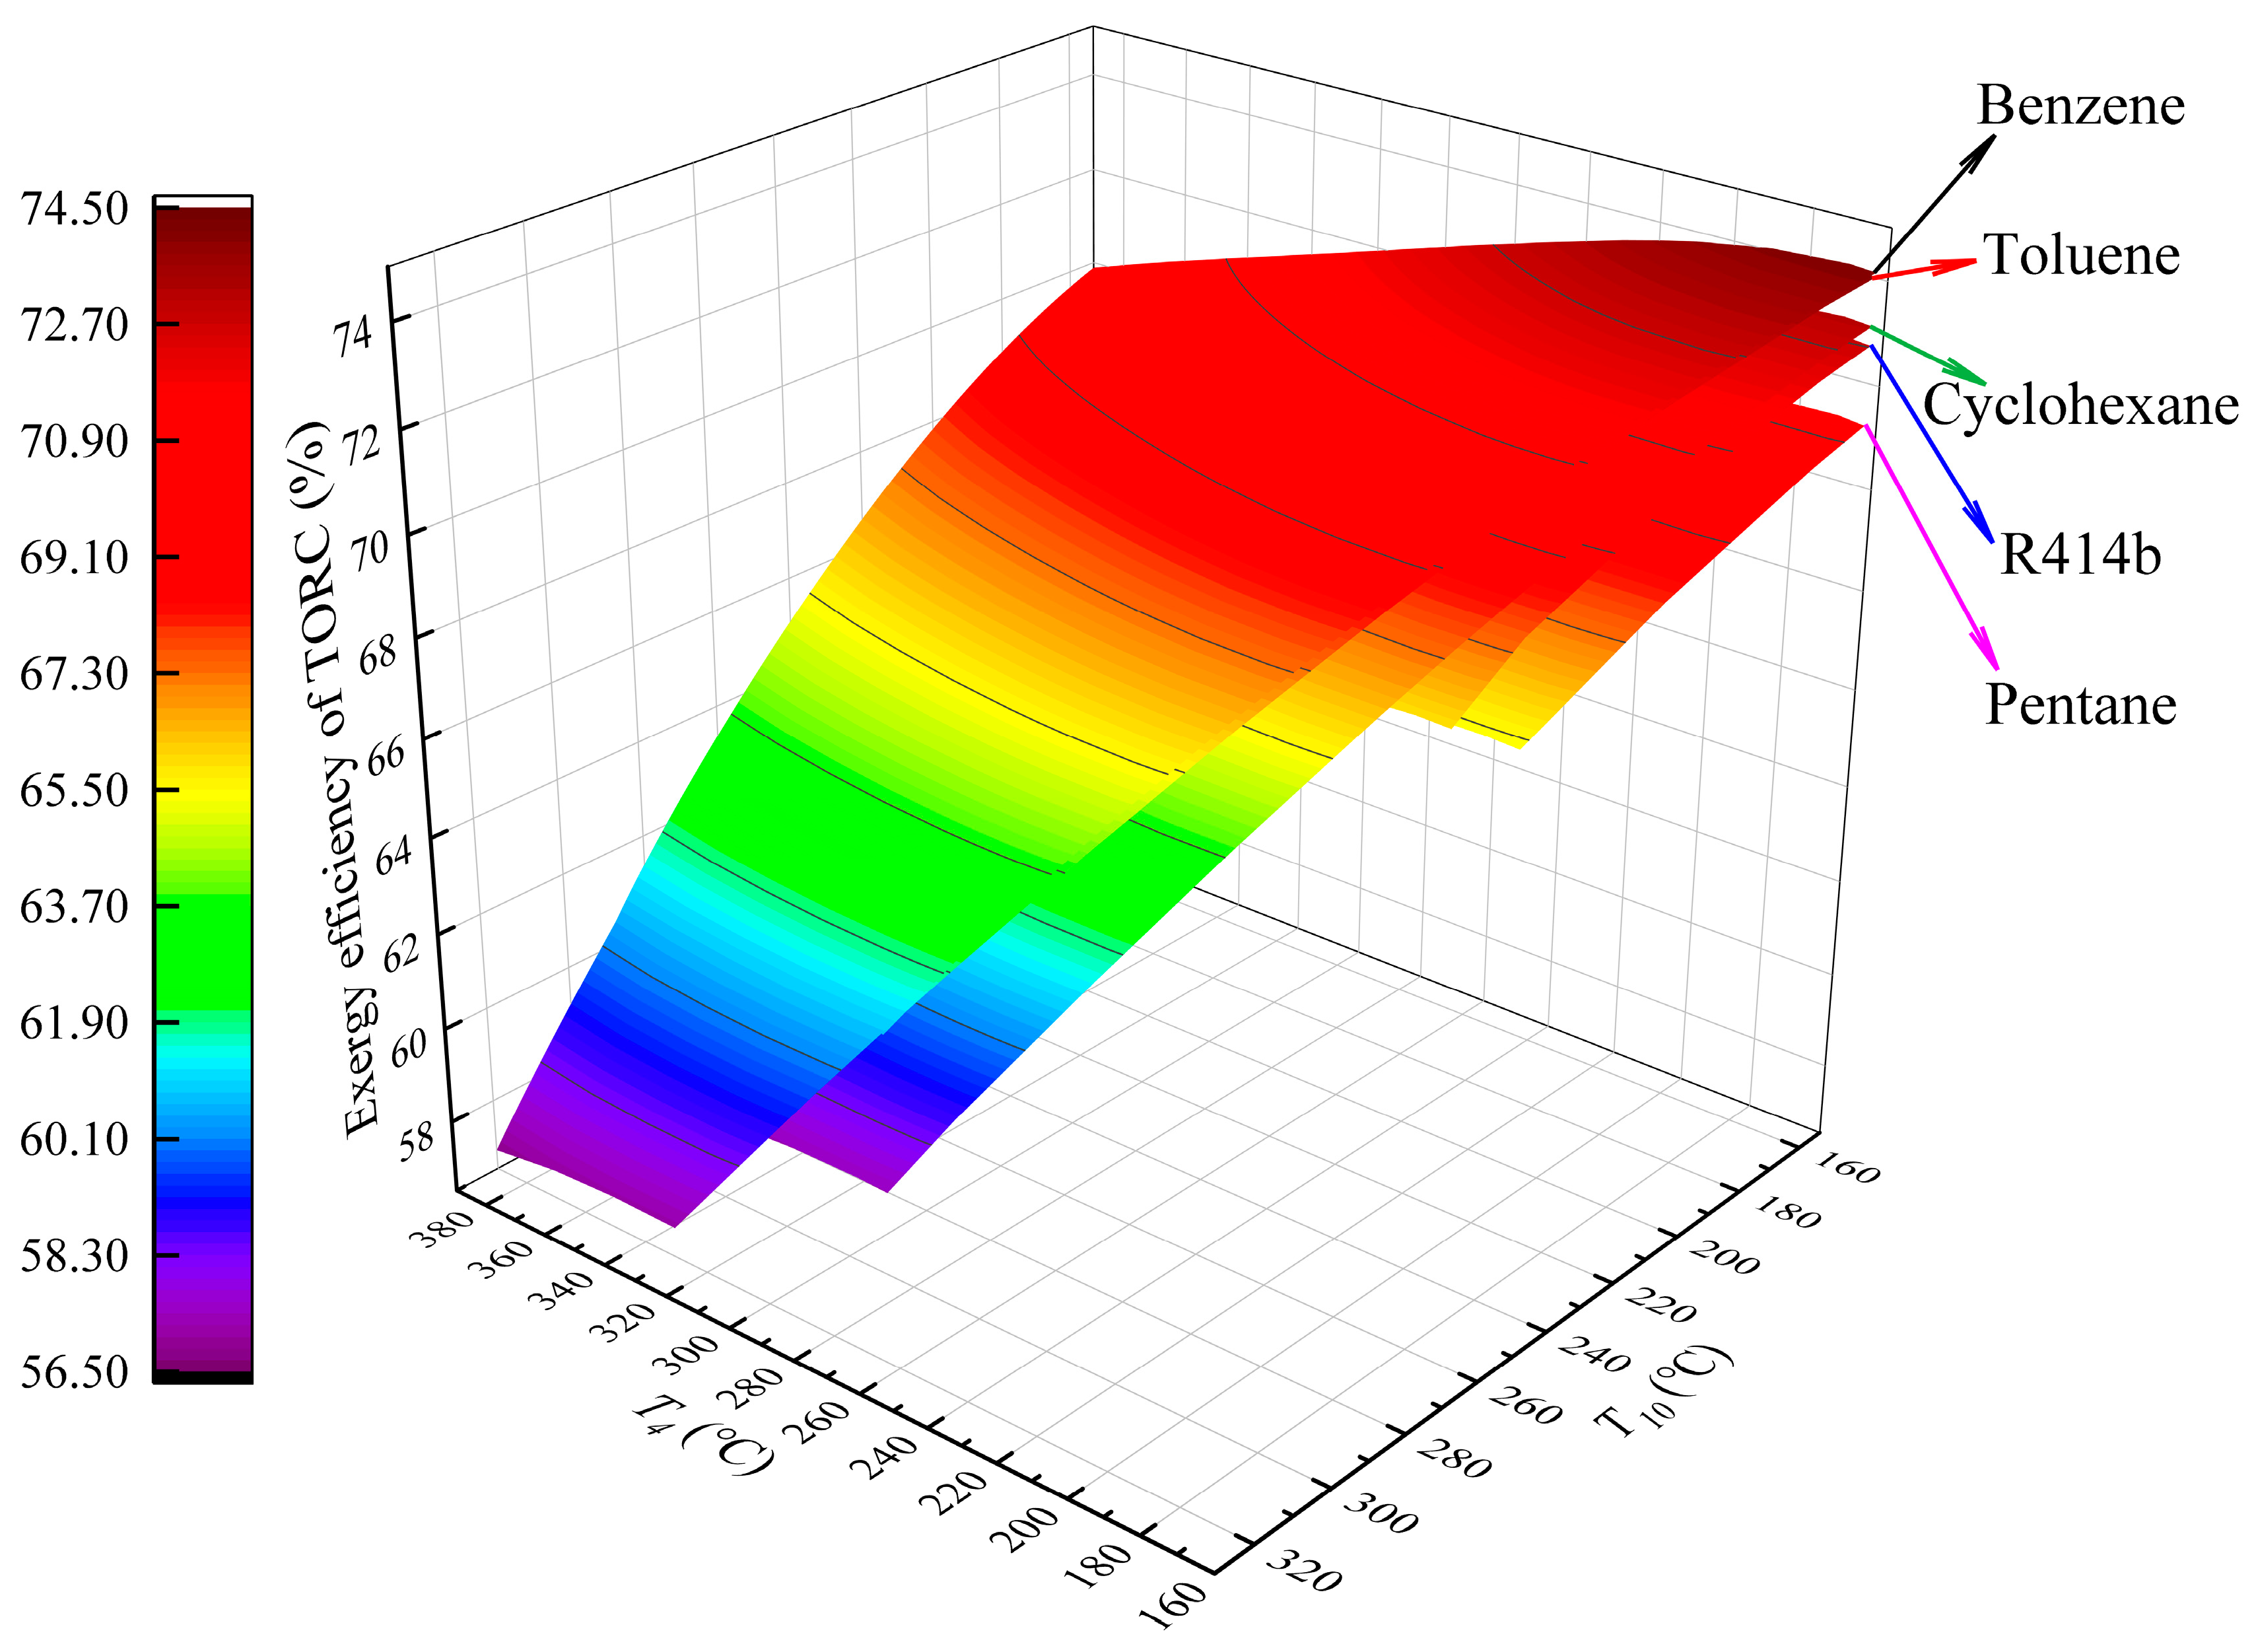
Figure 10 graphs the variation of
with
and
. Similar to
Figure 3, the area of the curved surface representing pentane and R141b is smaller than that of benzene, toluene and cyclohexane due to the narrower
range. Benzene and toluene have very close exergy efficiencies, and pentane has the lowest
. Given
,
drops monotonously as
elevates. The optimal
is obtained at the lowest
of 153 °C for different bottom ORC fluids, which is the same as that of
.
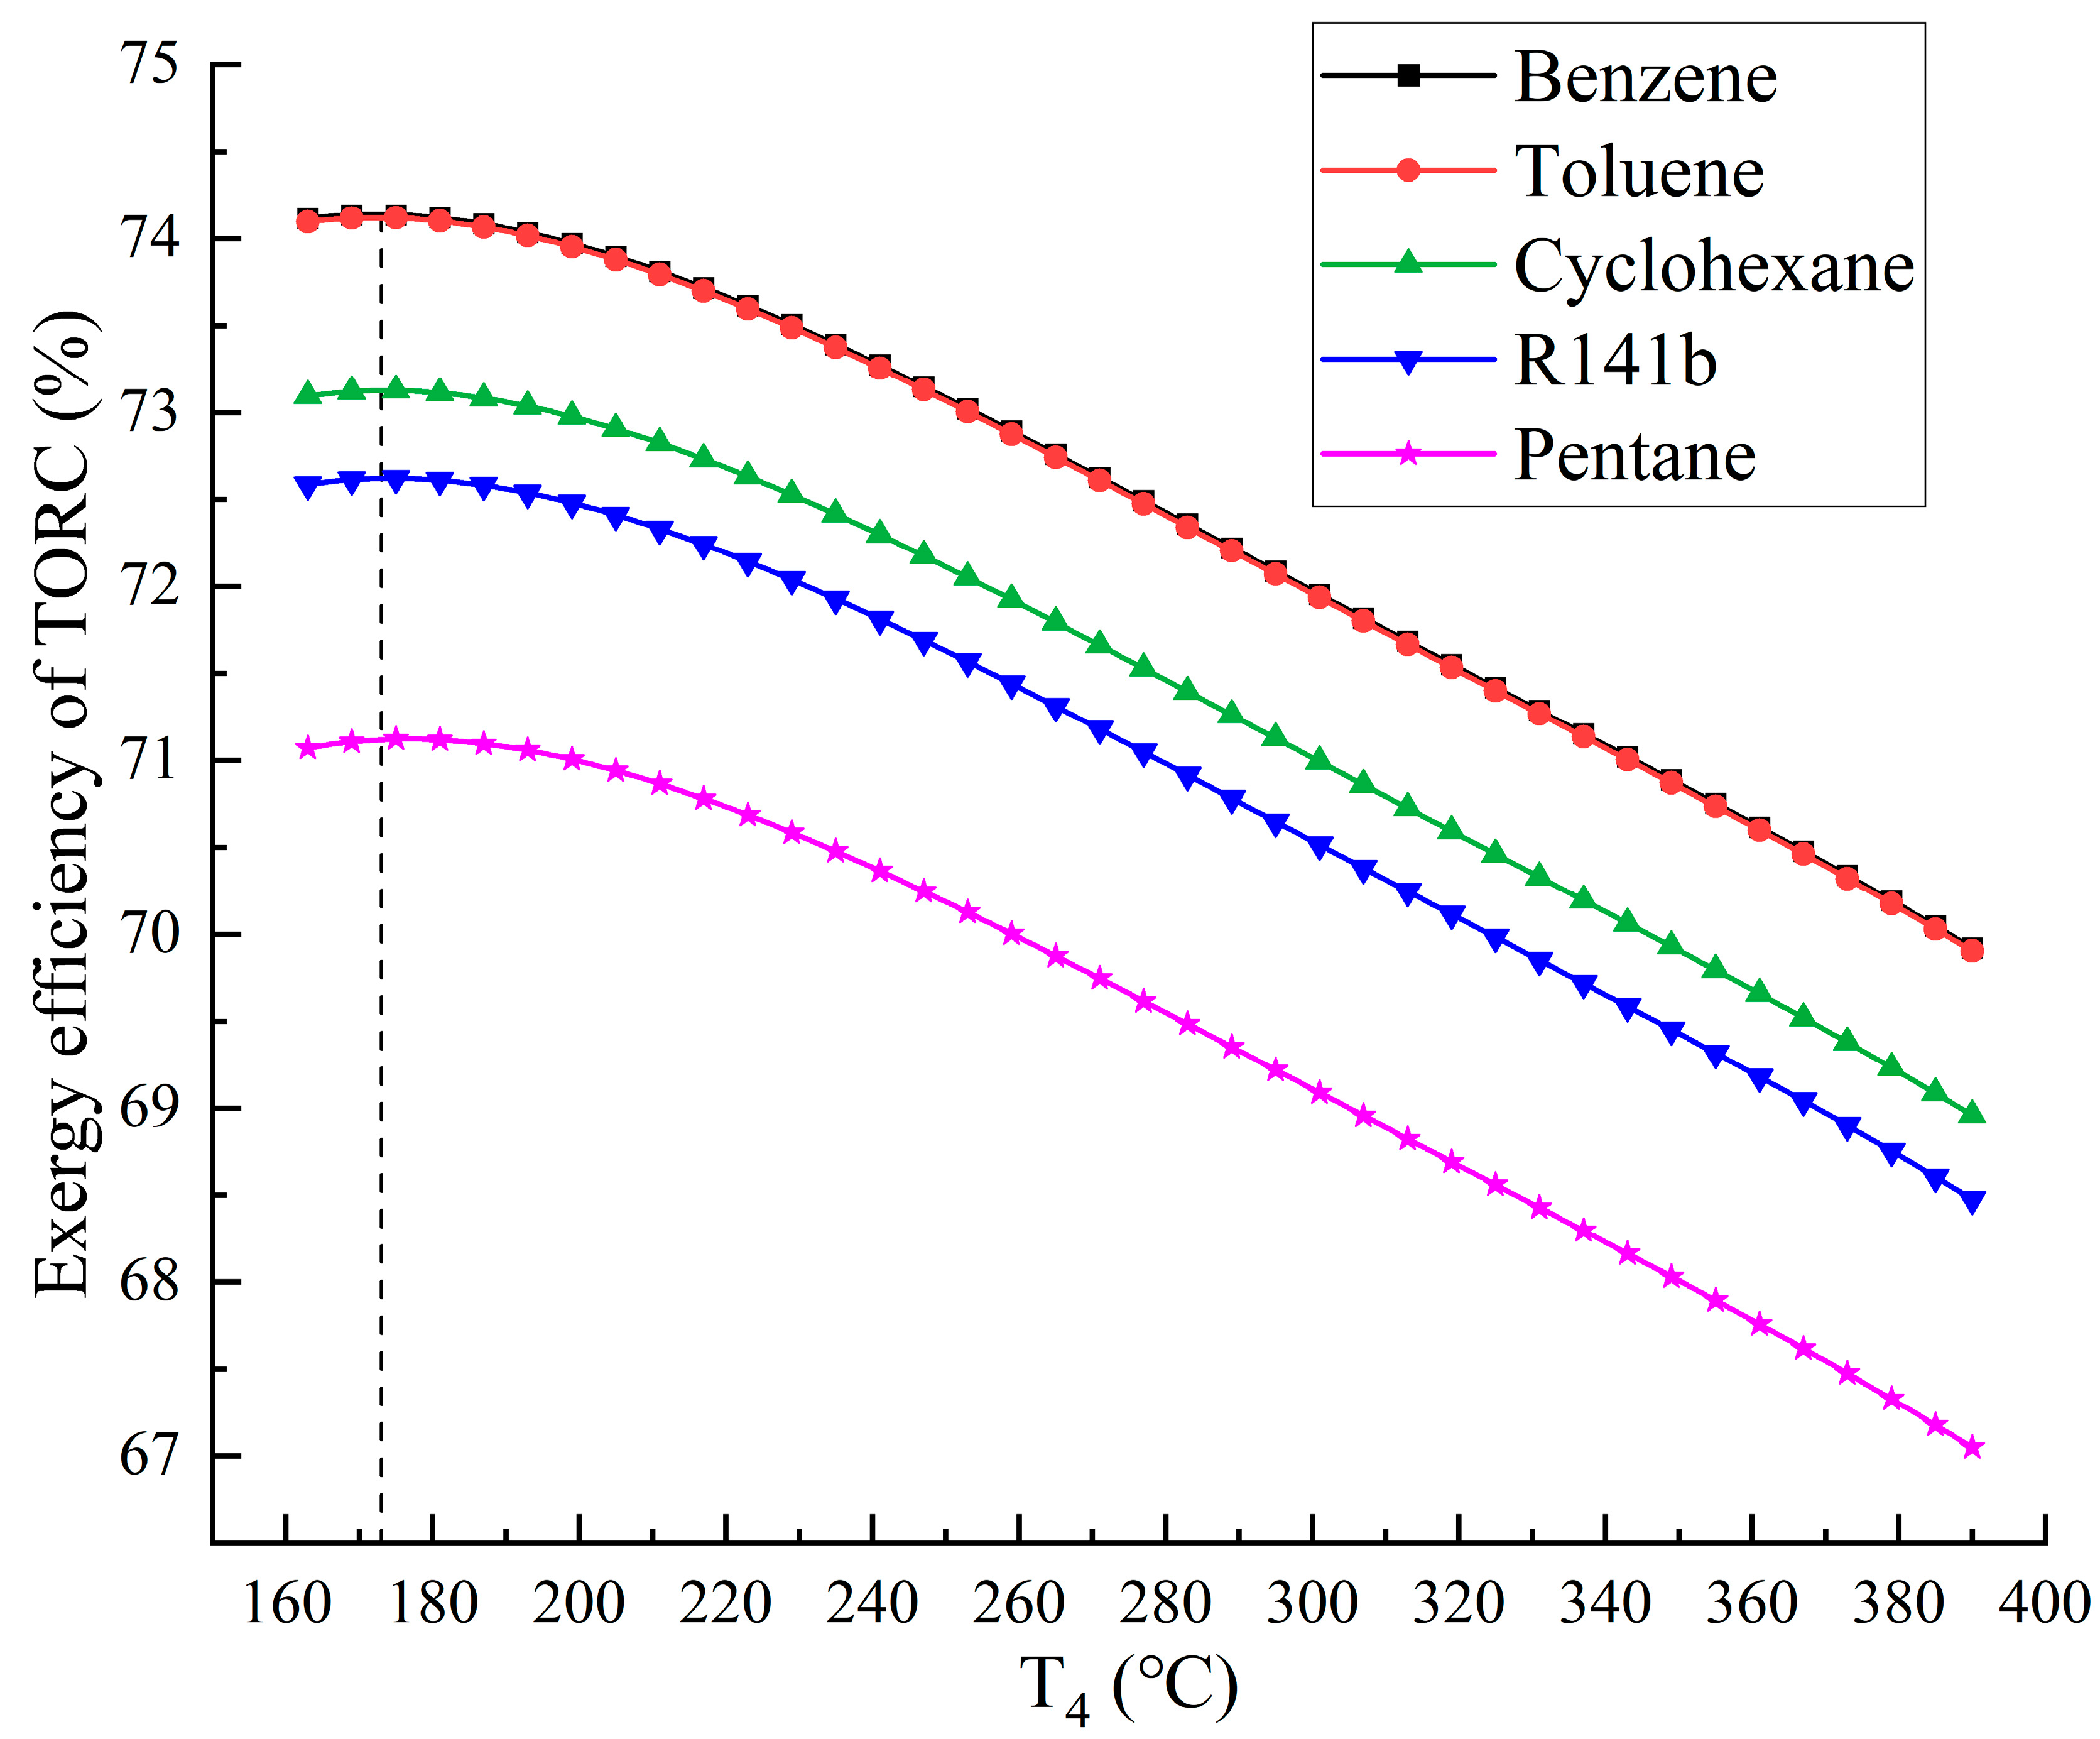
Figure 11 shows the cross section of the above three-dimensional diagram corresponding to
of 153 °C. All the curves first climbs marginally, and then go down considerably. The peak value of each curve is achieved when
is 172 °C. The maximum
is 74.14% for benzene, which indicates that the TORC system has the highest degree of thermodynamic perfection when benzene is adopted. It is worth pointing out that the maximum thermal and exergy efficiencies correspond to the same middle ORC condensation temperatures of 153 °C, but different MHX outlet temperatures.
4.2. Economic Assessment
Benzene is exemplified in this section due to its highest
and
. The economic calculation is based on the parameters in
Table 5.
4.2.1. Design of HXs
Heat Transfer Research Inc (HTRI) technology has been used by companies worldwide for decades to design, operate, and maintain HXs and fired heaters. The acclaimed Xchanger Suite® software is applied in this section as it is considered the most advanced available for the design, rating, and simulation of HXs [
49].
The most widely used shell-and-tube HXs are exemplified. The hot and cold fluids are located in the shell and tube sides, respectively. Double tube passes with the tube outer diameter of 19 mm and the tube pitch of 25 mm are employed, which are frequent in industrial production. The ratio of the tube length and the shell inner diameter is limited to 4-10, and the over-design area above 10% is ensured in the design process. The introduction of rod baffles can remarkably increase the flow rate while reducing the vibration and the flow resistance of the shell side fluid. The shell side fluid makes an axial flow parallel to the tube bundle, which facilitates uniform vortices along the tube length and on the heat transfer surfaces. The vortices are good for improving the parallel flow heat transfer. In consequence, rod baffles are exploited in HX1-HX5.
The physical parameters of the BDO mixture can be derived from Aspen Plus by importing a mass fraction of 26.5% biphenyl and 73.5% diphenyl oxide. Then the parameters like density, heat capacity, thermal conductivity and dynamic viscosity can be imported from Aspen Plus into Xchanger Suite. As the fouling resistances of organic heat carriers for industrial use, solvent vapor, refrigerant liquid, and cooling water below 52 °C are all 17.6×10
-5 m
2·K/W according to GB/T 151-2014 [
51], the fouling resistances of BDO mixture, benzene and water in this work are taken as 17.6×10
-5 m
2·K/W. 420 °C industrial flue gas is exemplified as heat source, and its fouling resistance is 176.1×10
-5 m
2·K/W [
52]. The dominating composition of flue gas is air and its physical parameters can be invoked from REFPROP 8.0 [
53].
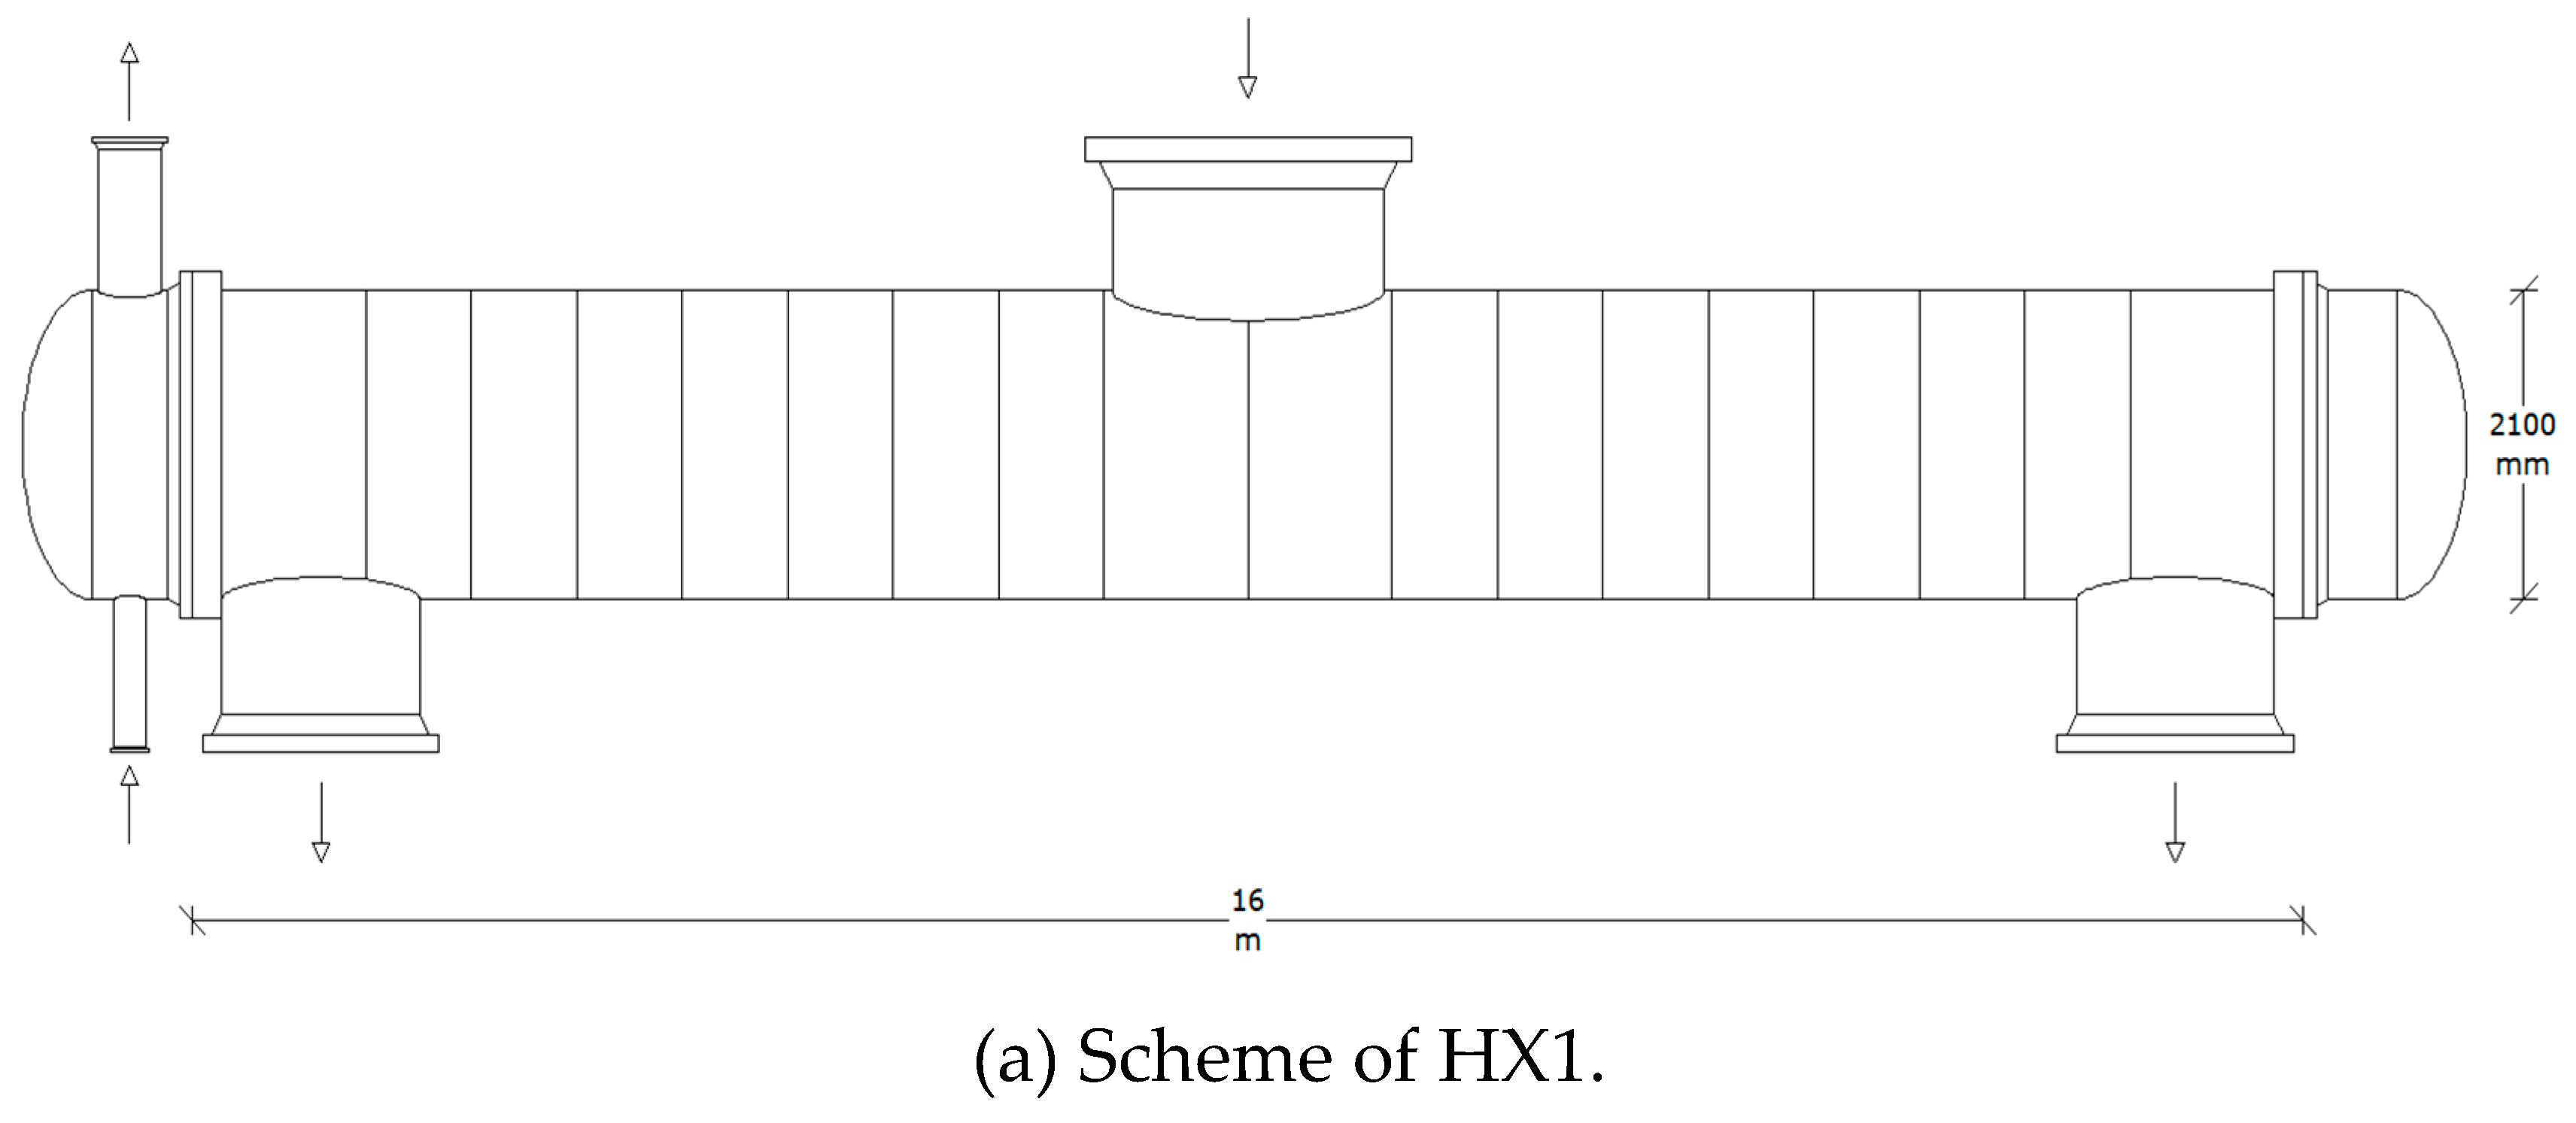
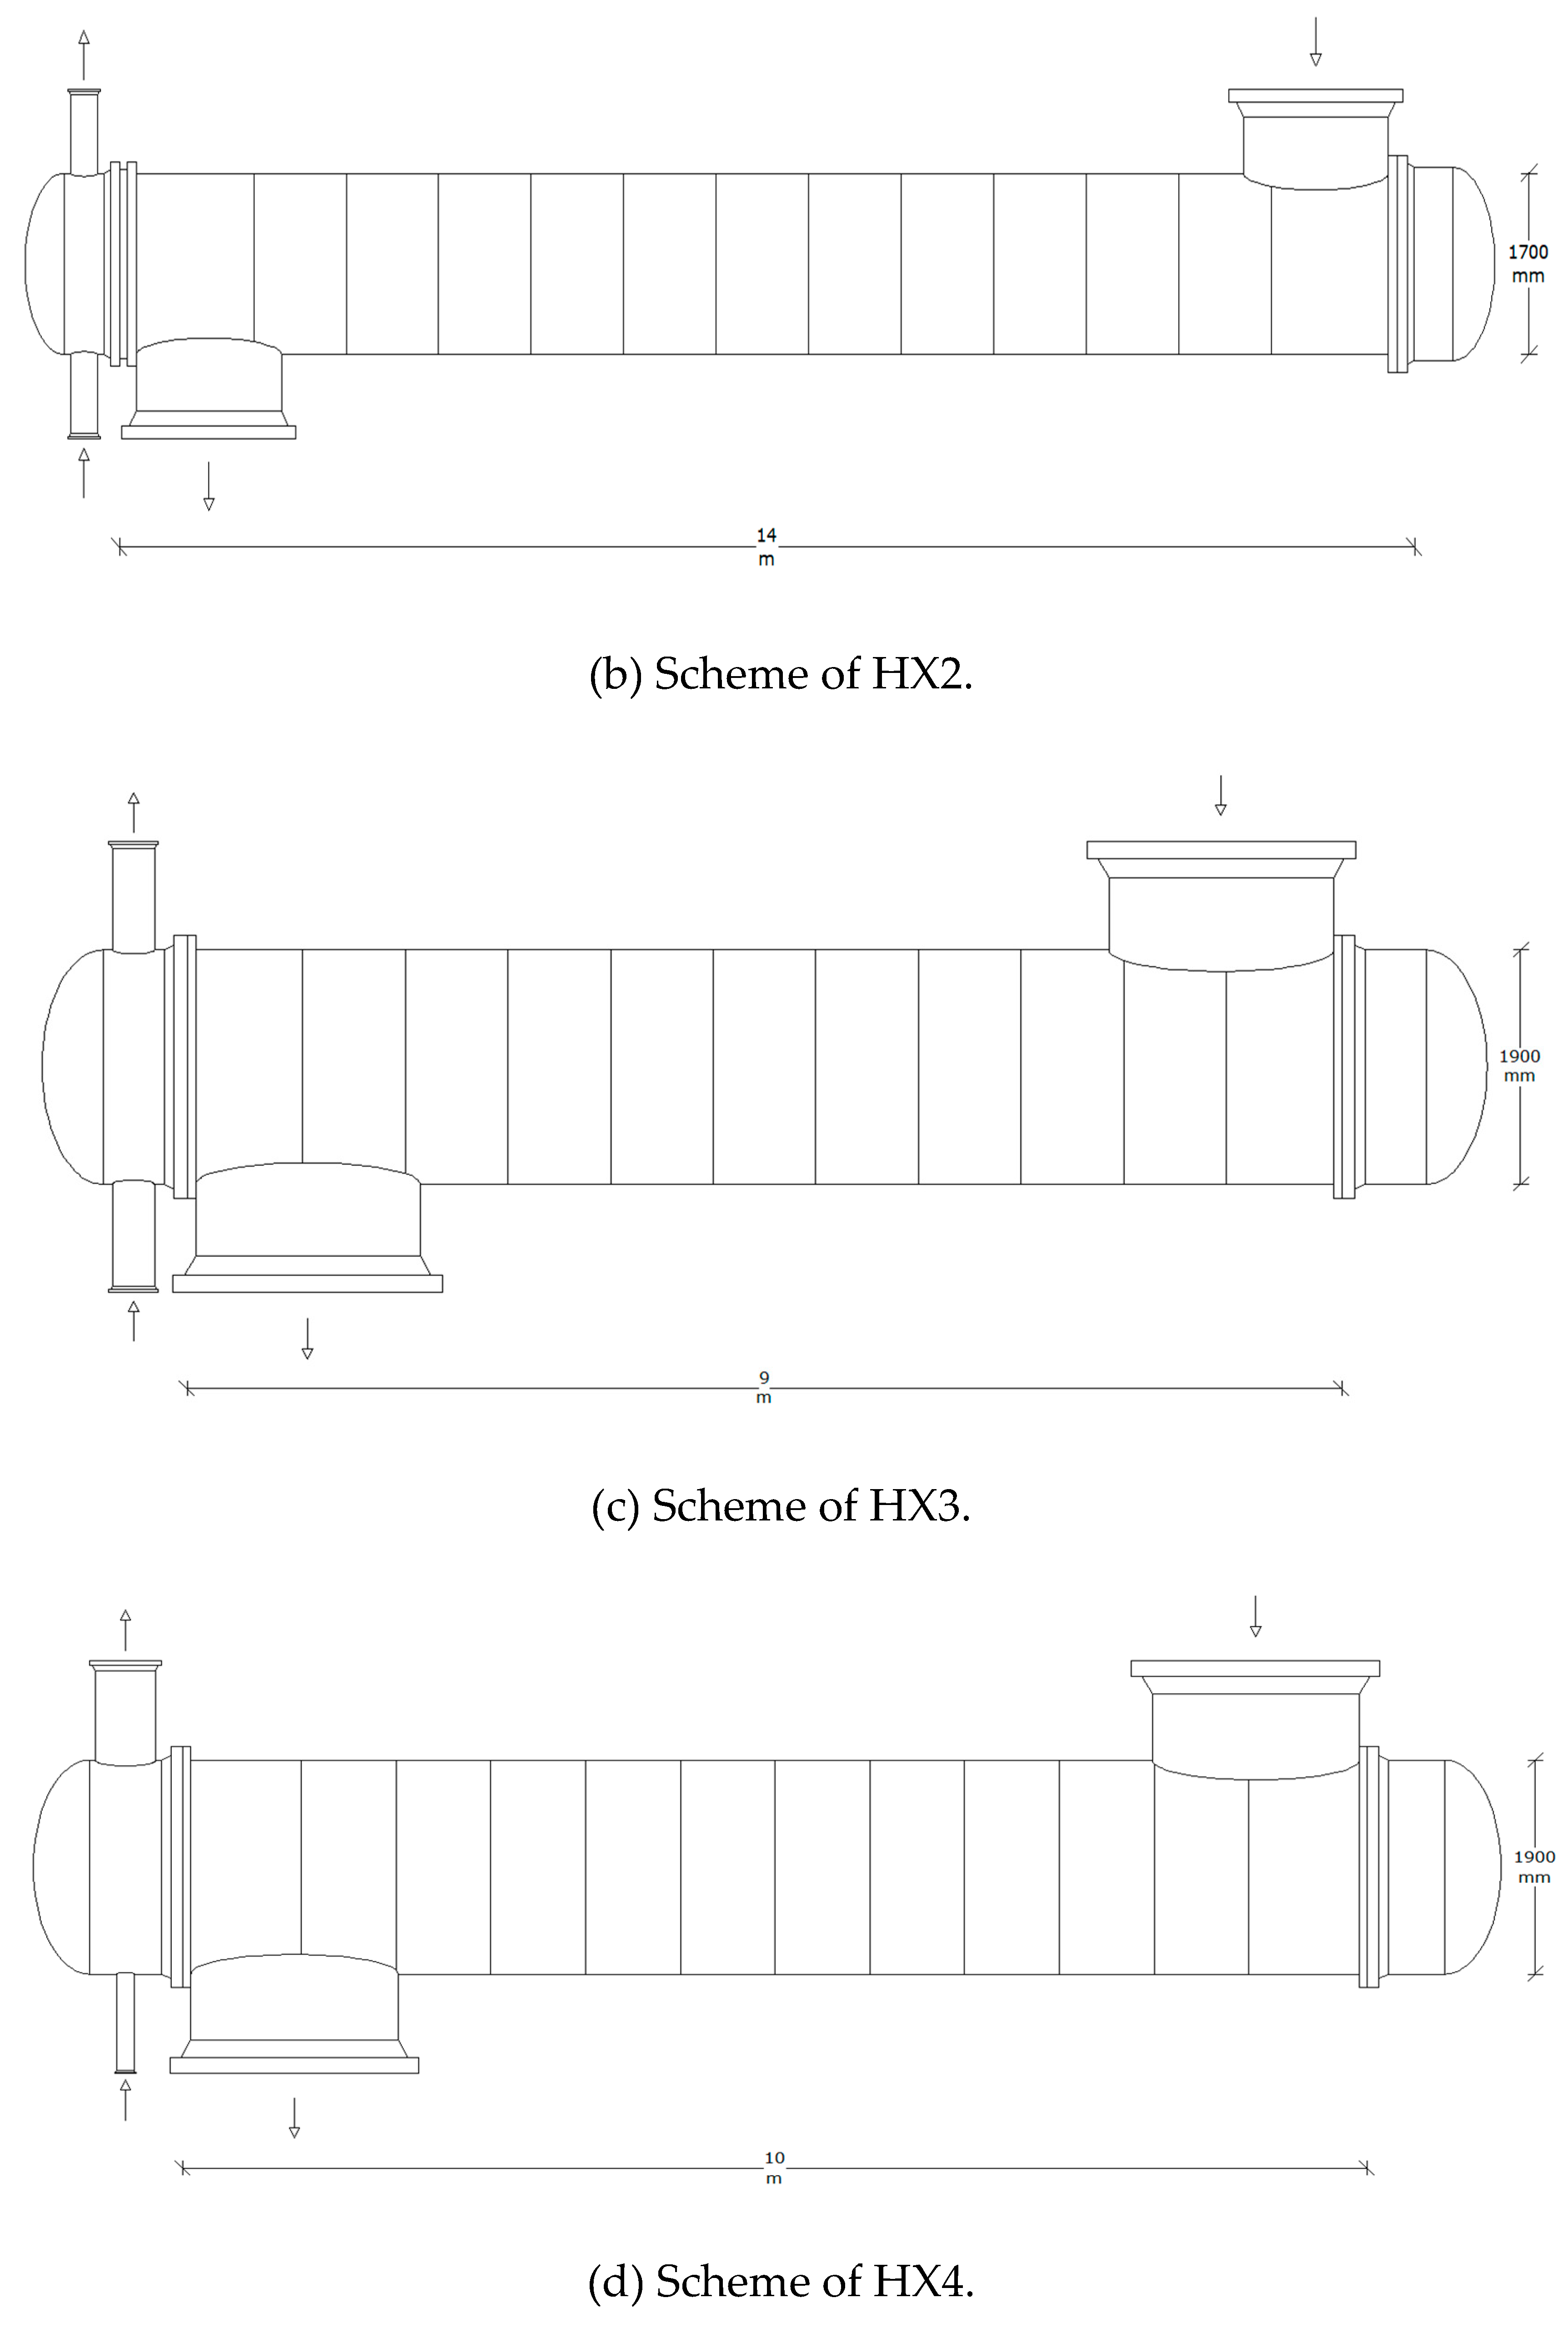
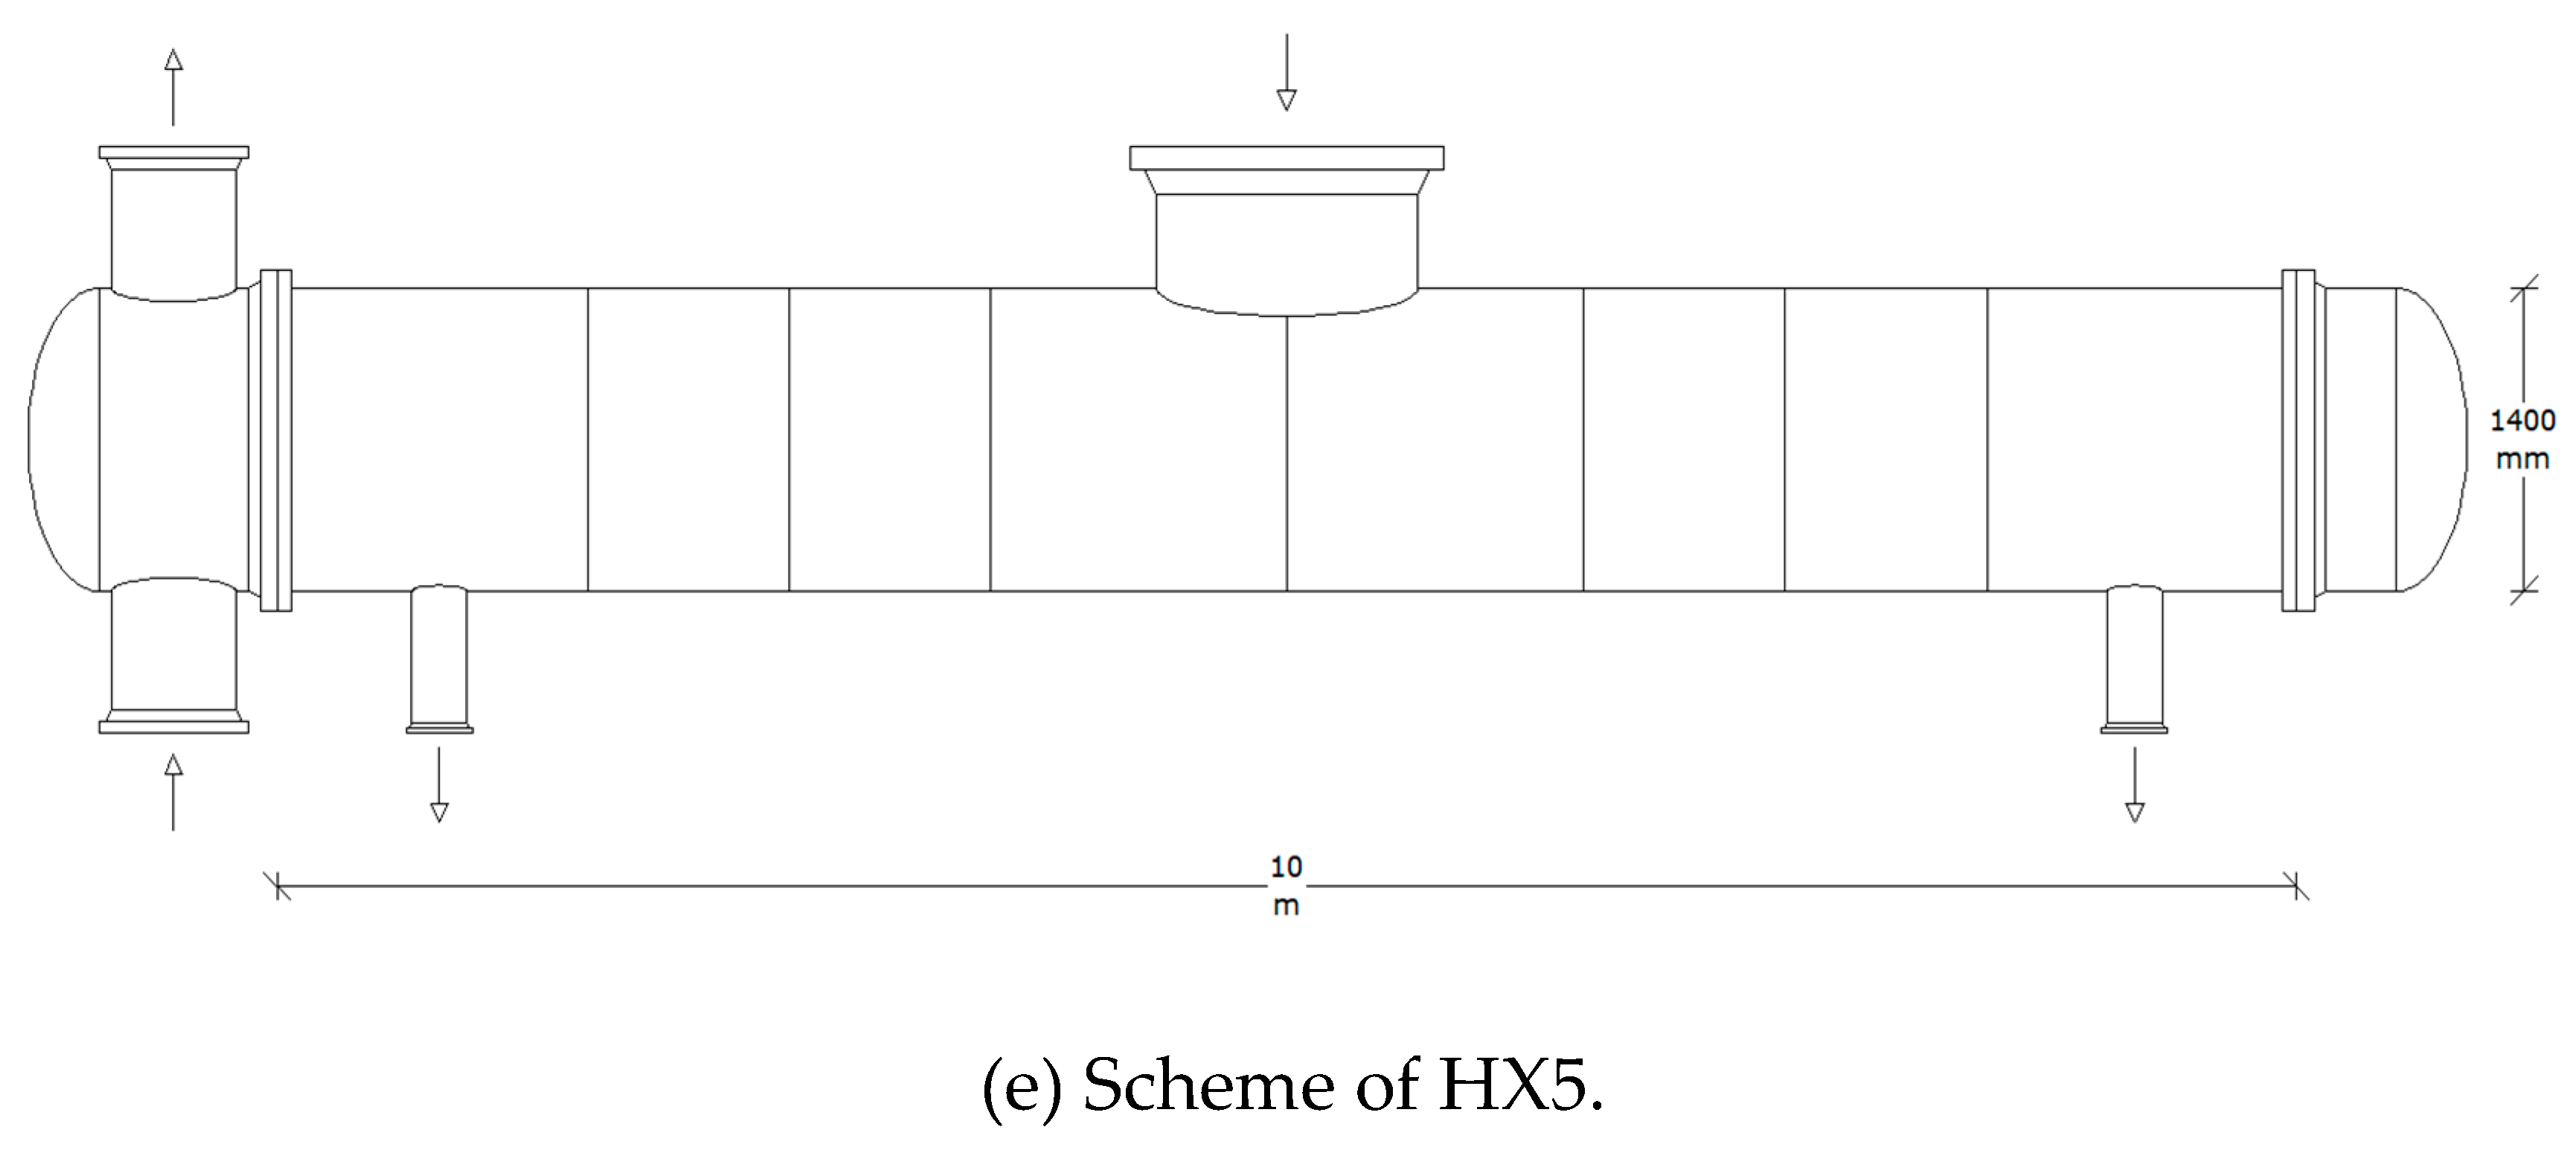
Table 7 provides the design data of different HXs and
Figure 12 portrays the schemes.
4.2.2. Material Selection and Initial Investment
Choice of construction materials is a compromise between the conflicting goals of performance and capital cost. Multiple factors need to be considered, including mechanical properties (mainly strength), oxidation resistance, heat resistance, and corrosion resistance, etc [
53]. The operating temperatures of HX1 and T1 reach 400 °C, which imposes stringent requirements for materials. Although stainless steel is somewhat more expensive than carbon steel, its various properties and lifespan in the range of 400 to 500 °C are superior to those of carbon steel [
53,
54,
55]. In view of this, HX1 and T1 are manufactured in stainless steel and carbon steel for the remaining equipment.
Table 8 indexes the selected impact factors of the devices [
29,
53].
The power generated by T1 (
), T2 (
) and T3 (
) is 4.059 MW, 2.990 MW and 3.069 MW, respectively.
and the mass of benzene (
) are 38064.6-39262.9 kg and 16572.6-17094.3 kg according to
Section 3.2.2. For the sake of sufficient charge mass and reliable results,
and
are taken as 40000 kg and 18000 kg, respectively. As
is 2.2
$/kg and
is 0.92
$/kg [
57], the total cost of the two fluids is 10.46×10
4 $.
Table 9 summarizes the first cost of each component. The total cost of the TORC system is 2087.17×10
4 $. The cost of T1 accounts for the largest proportion, followed by T3 and T2. The three turbines occupy more than three quarters and the five HXs account for nearly one fifth of the total investment. It can be calculated that LEC is 0.0284
$/kWh, which is lower than that of the indicators obtained by the previous TORC studies [
4,
5].
5. Comparison with a Cascade ORC Using the BDO Mixture
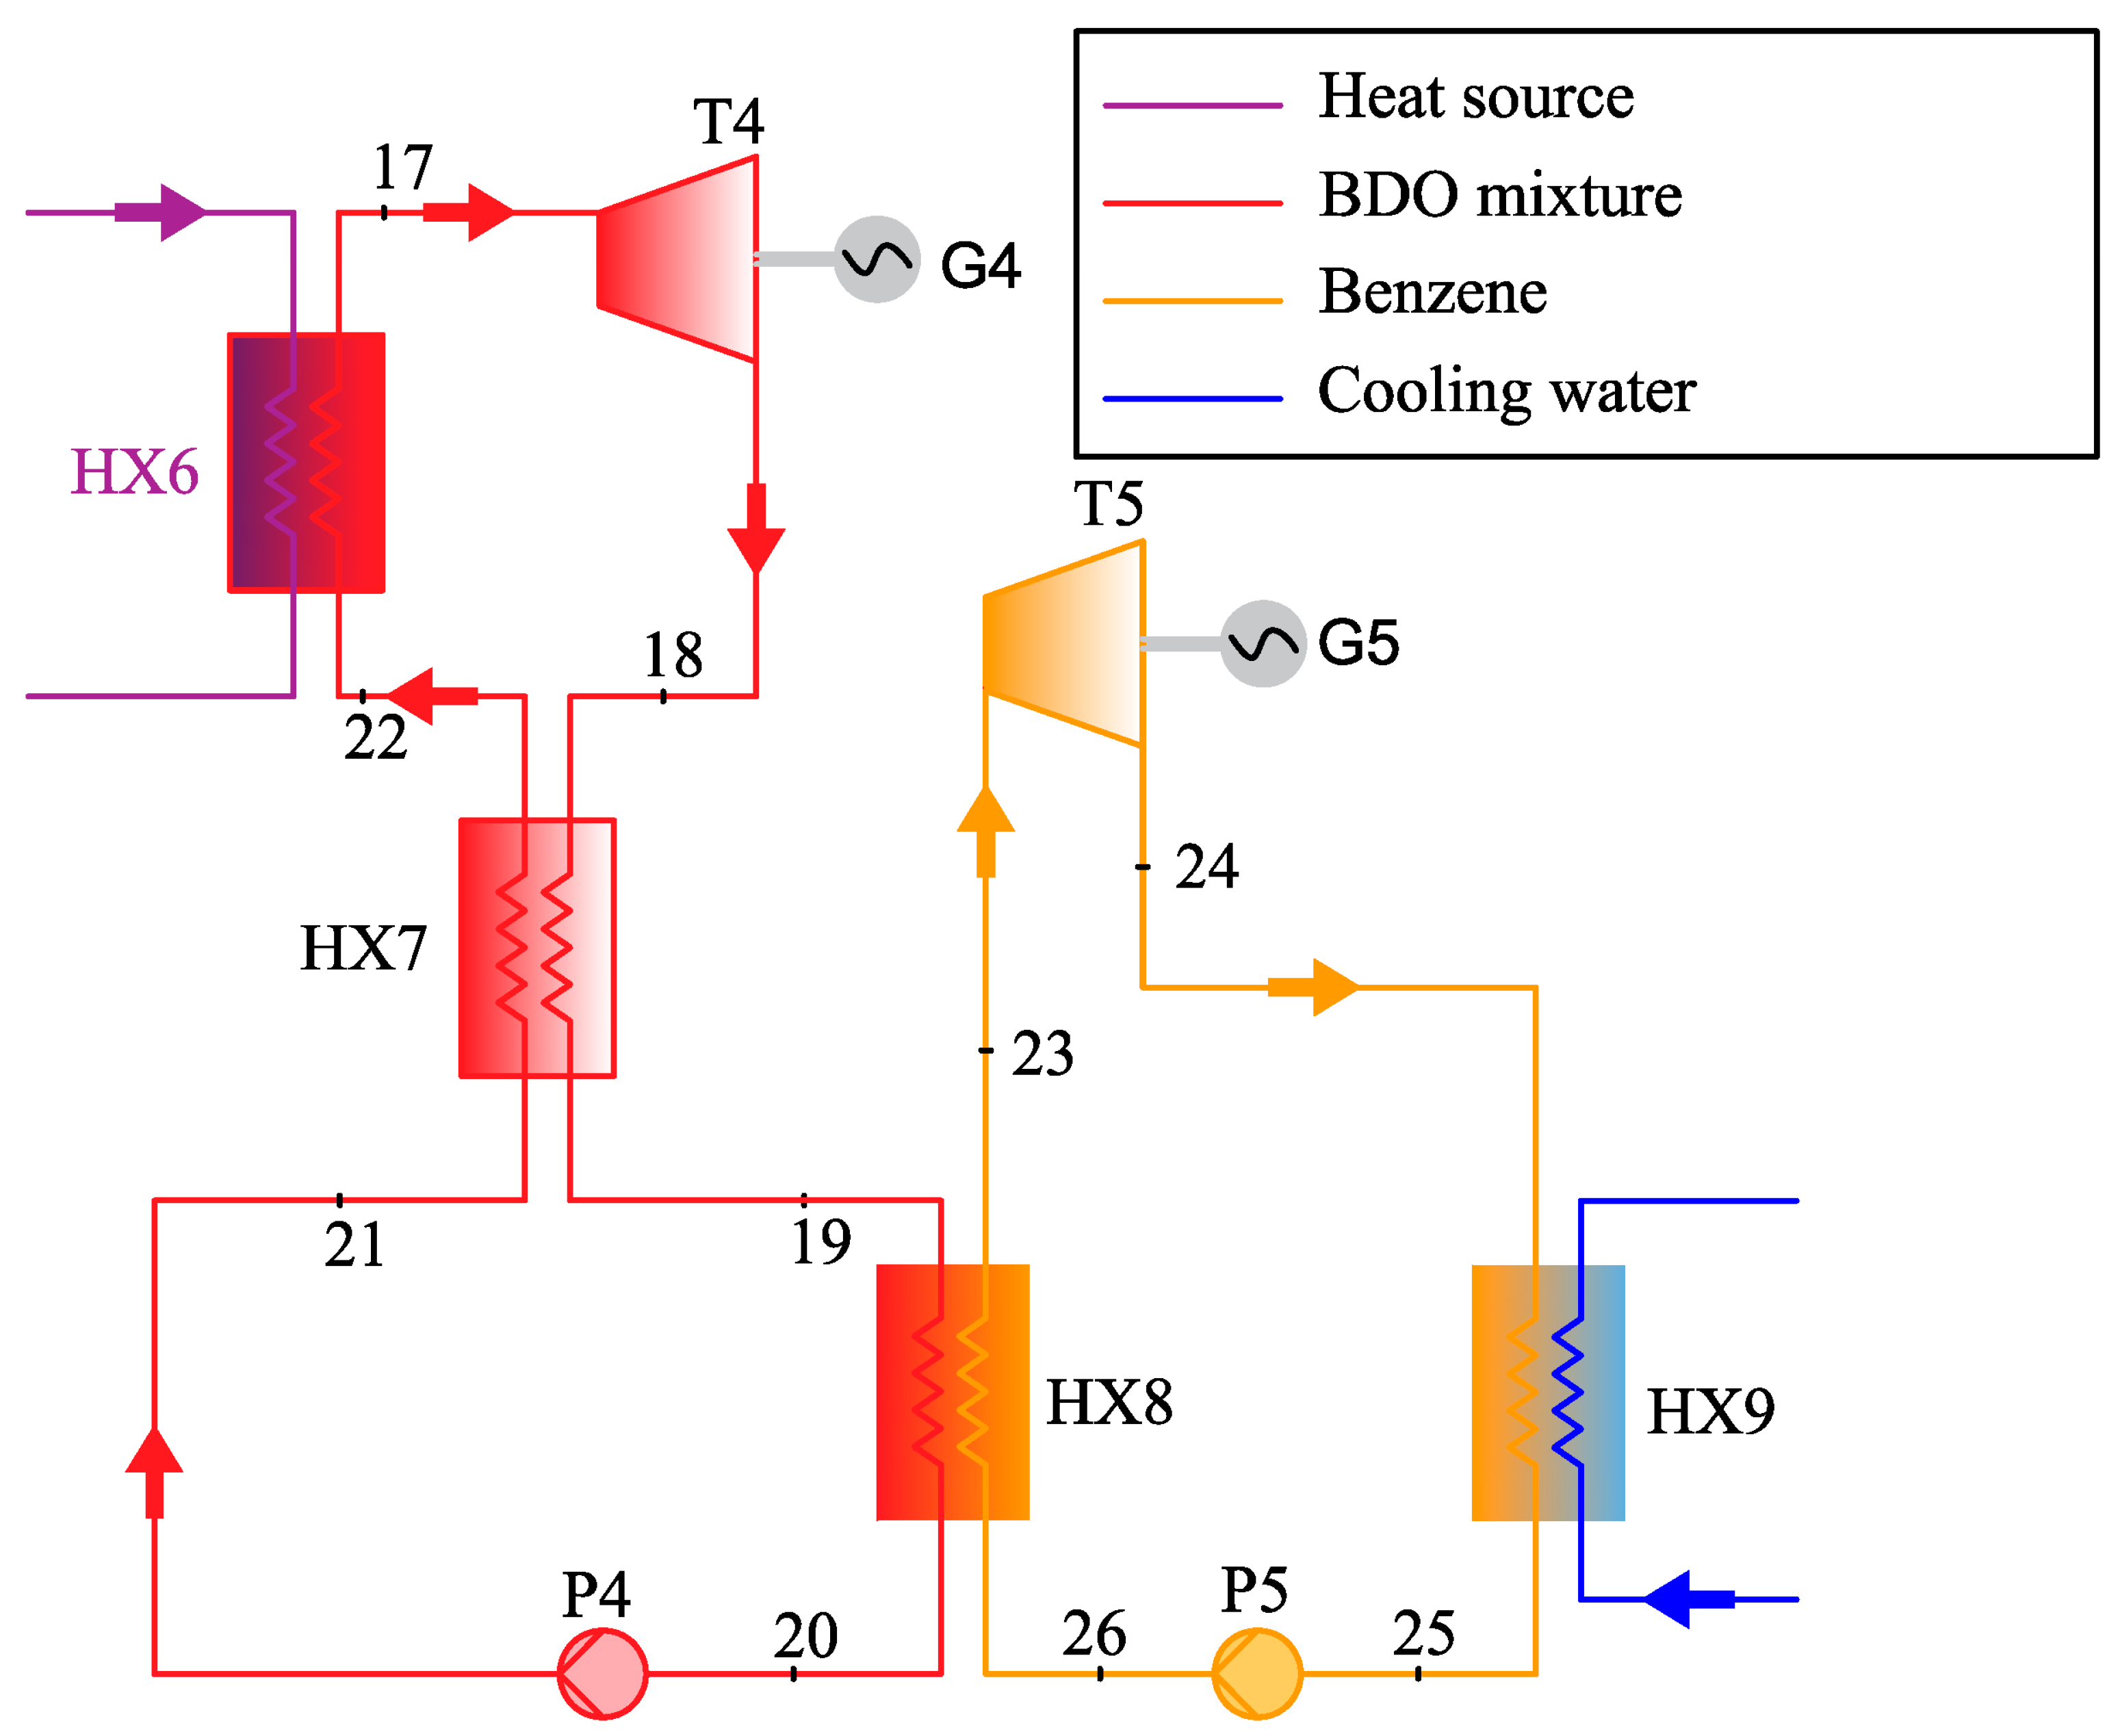
A BDO cycle bottomed by a benzene cycle is depicted in
Figure 13 as a reference to determine whether the proposed TORC can boost efficiency and drive down cost compared with the cascade ORC. The conditions of cold and heat source are identical to those in Fig 1, as well as the equipment efficiencies. T4 inlet temperature (
) and bottom cycle condensation temperature (
) are respectively 400 °C and 30 °C.
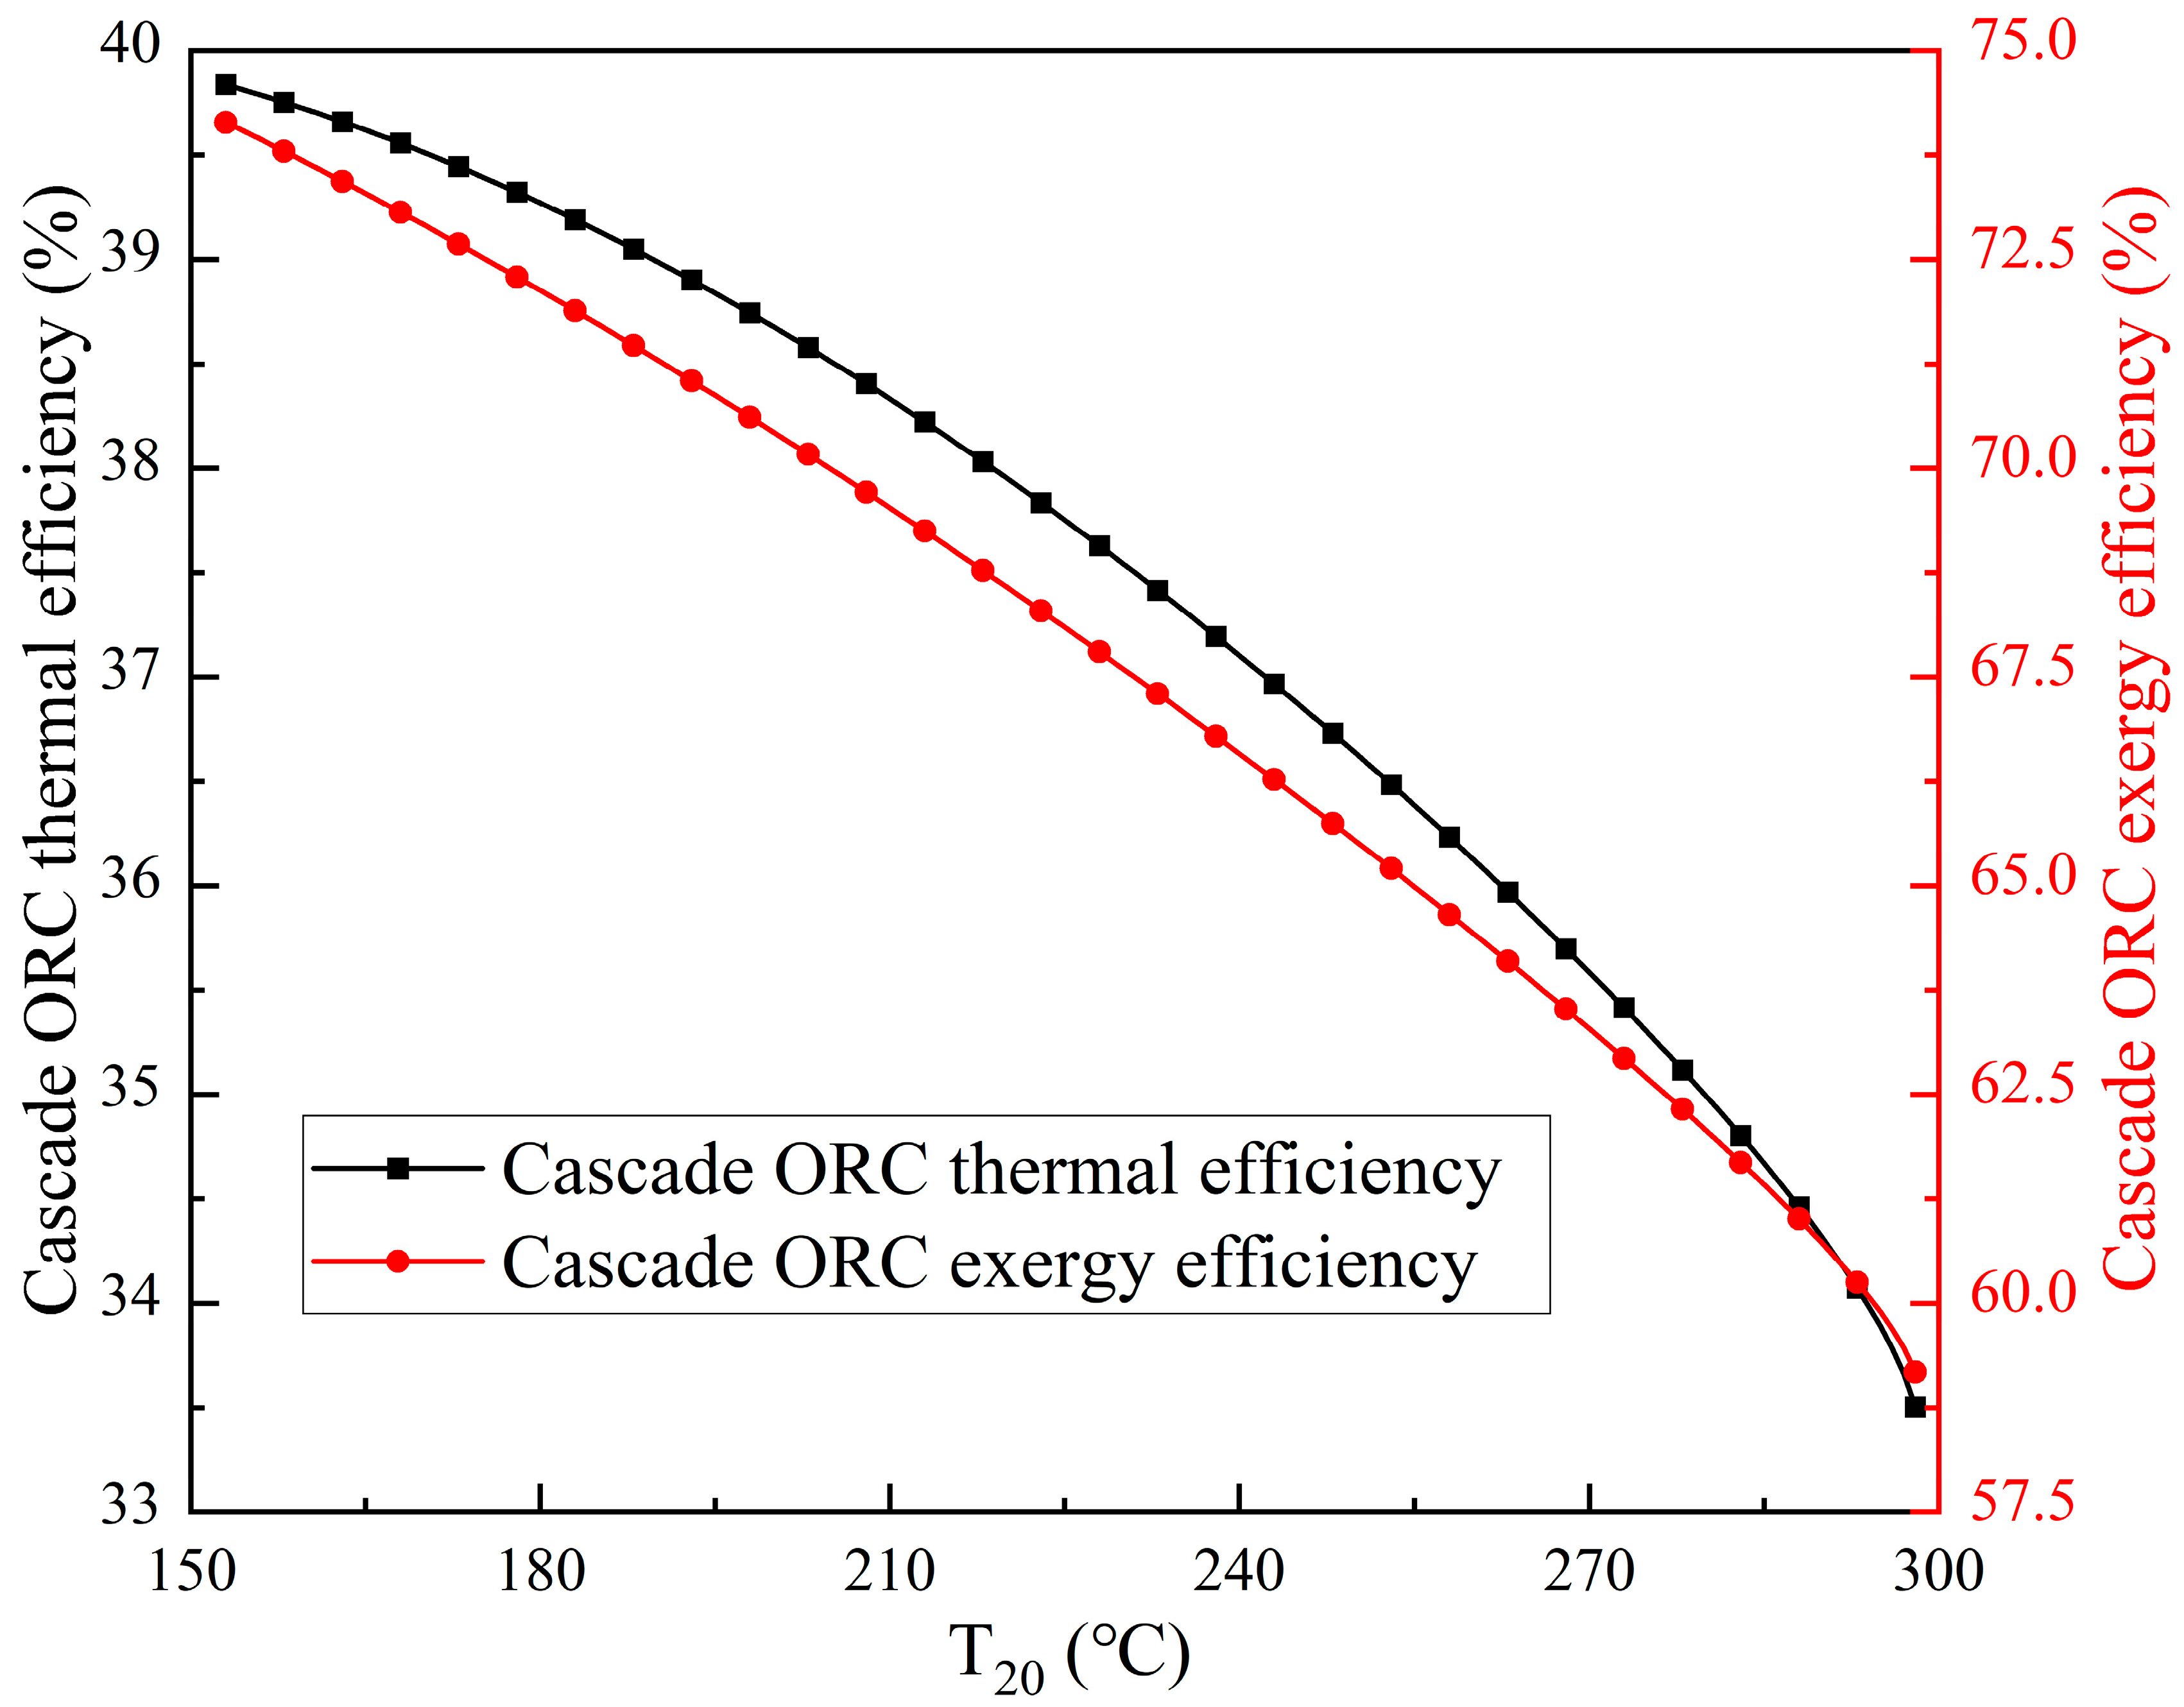
Figure 14 presents the variations of the cascade efficiencies. The maximum thermal and exergy efficiencies are respectively 39.84% and 74.14% at the lowest
of 153 °C.
Table 10 reports the thermodynamic parameters for cascade ORC at the optimum condition.
Table 11 and
Table 12 lists the HX design parameters and initial cost. HX6 and T4 are made of stainless steel due to the 400 °C operation temperature, and the others are carbon steel. The power generated by T4 and T5 is 7.056 MW and 3.297 MW, respectively.
is 36196.2-37335.7 kg and
is 16572.6-16918.2 kg theoretically. In the same vein,
and
are taken as 38000 kg and 18000 kg, respectively. The total cost of the two fluids is 10.02×10
4 $ and the overall cost of the cascade ORC system is 2210.19×10
4 $. It can be calculated that LEC is 0.0308
$/kWh, which is higher than that of the TORC system.
Figure 1.
Schematic diagram of the TORC.
Figure 1.
Schematic diagram of the TORC.
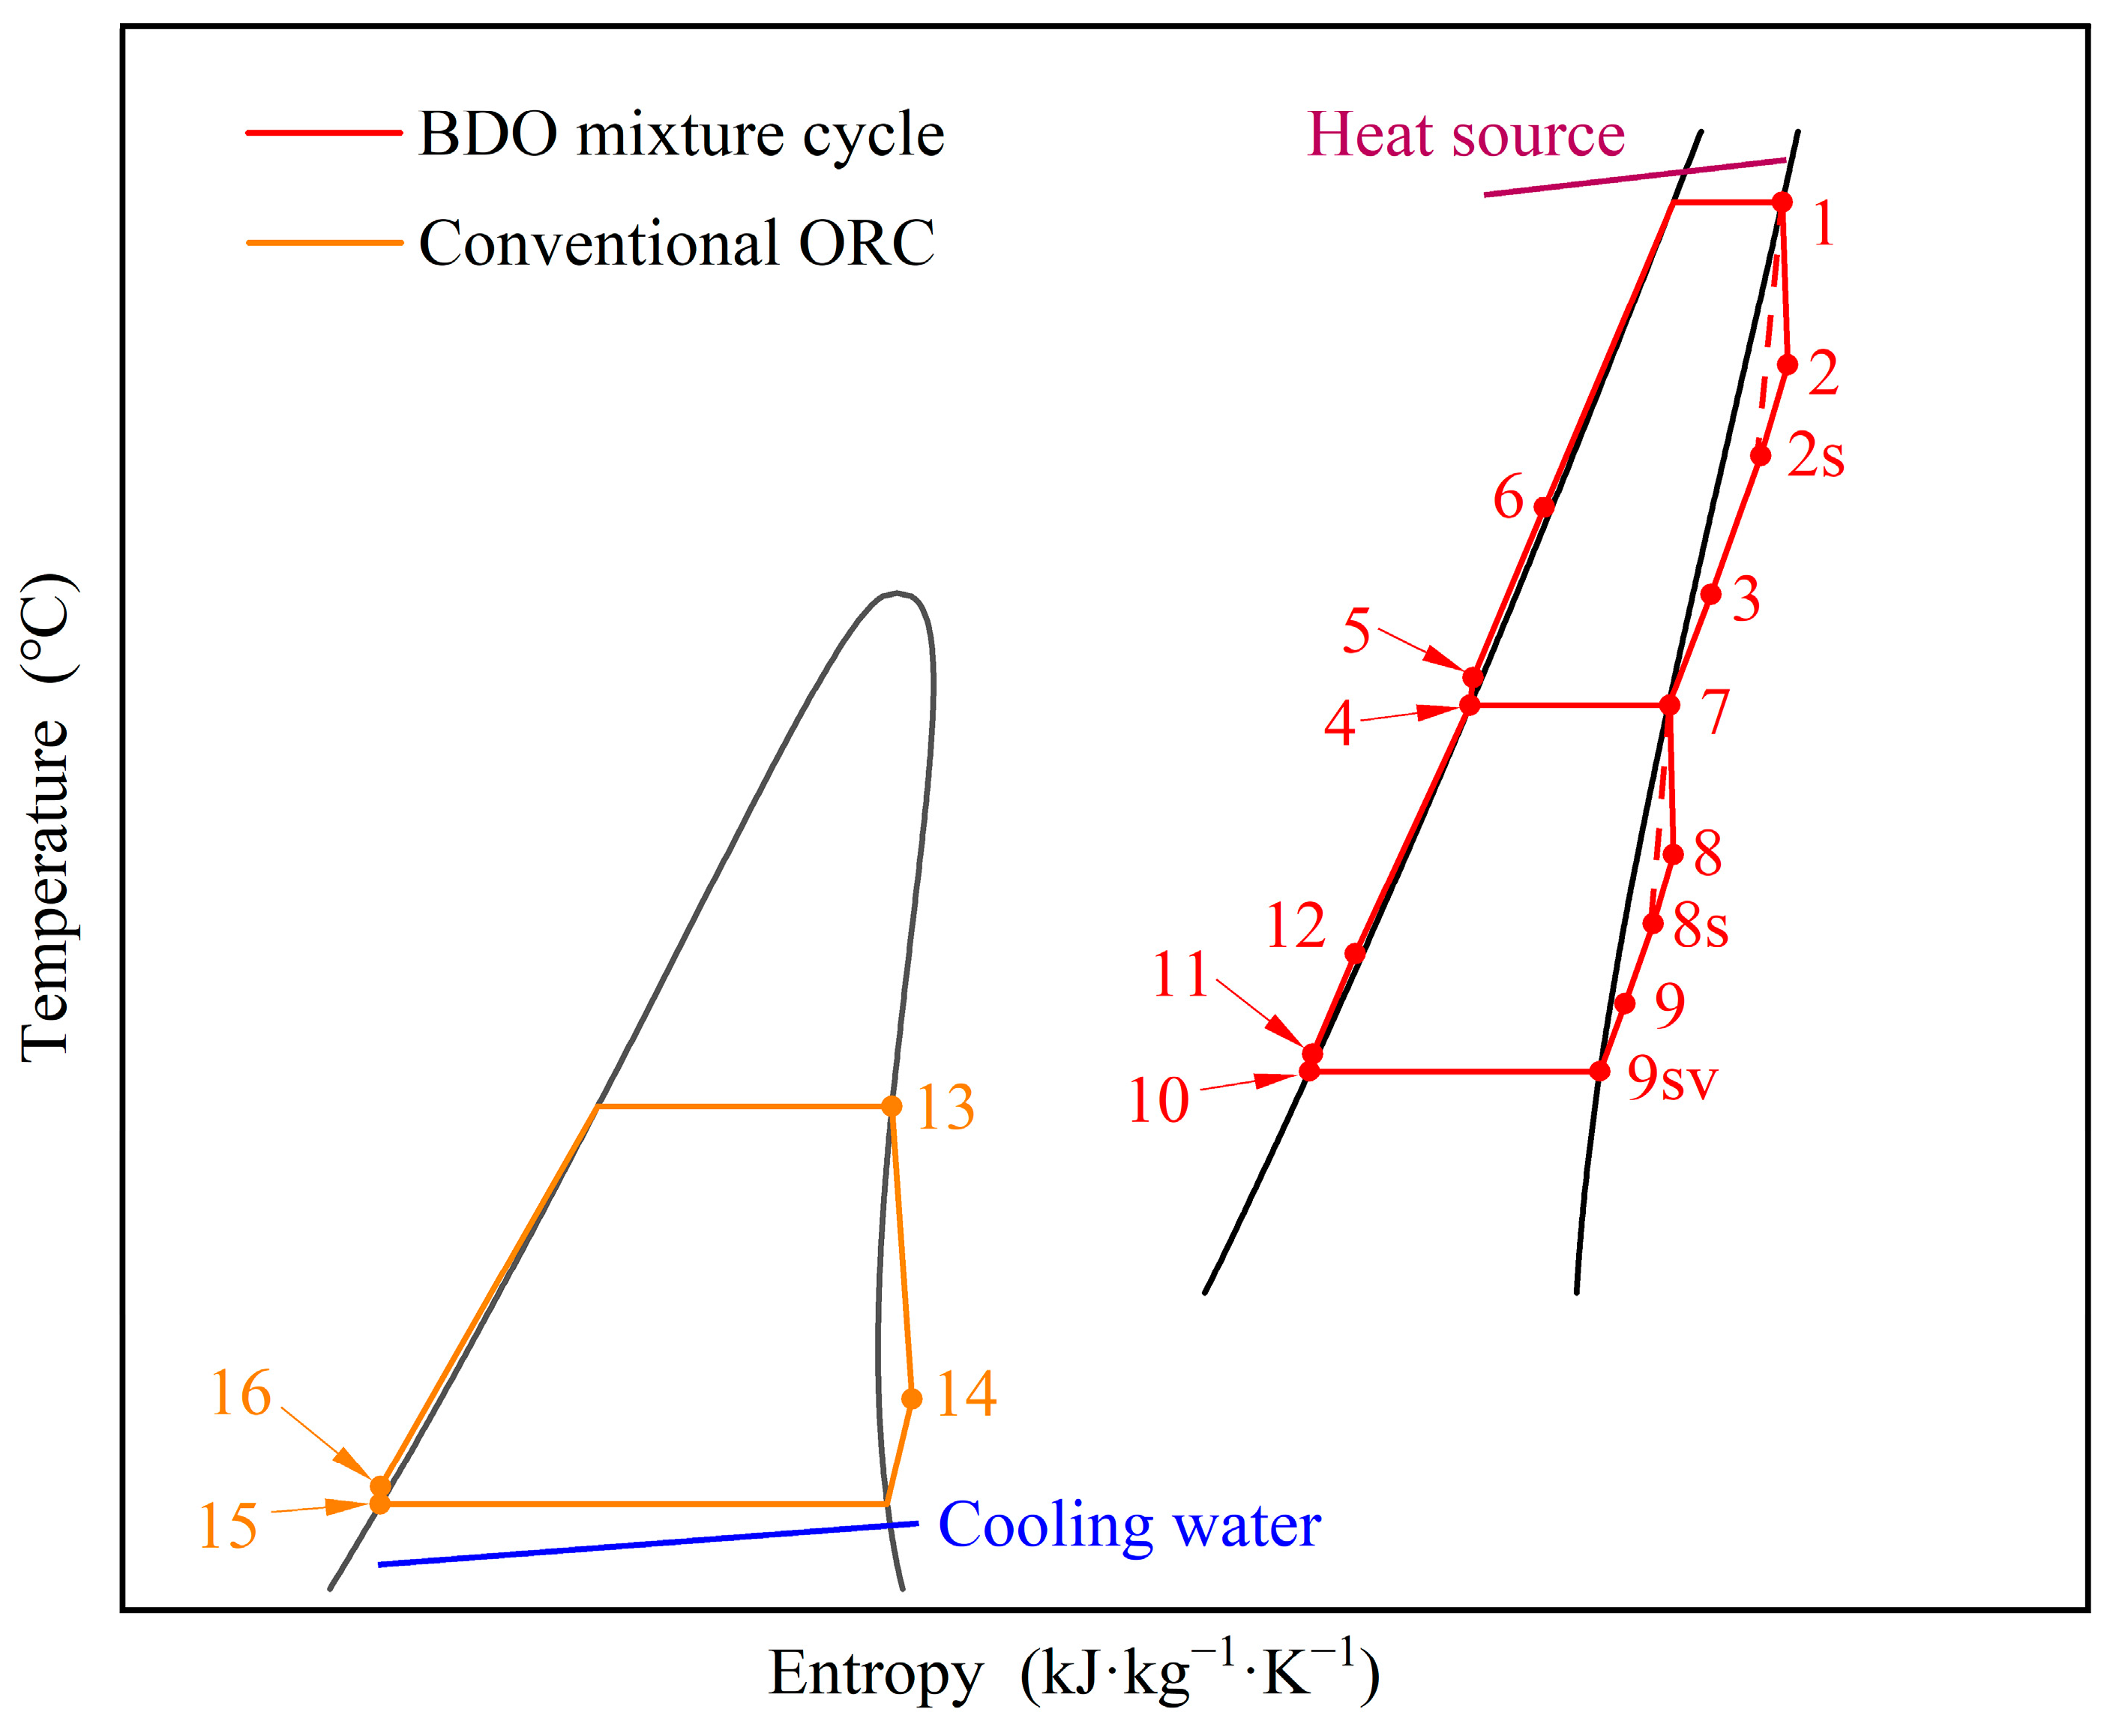
Figure 2.
T-s diagram of the TORC.
Figure 2.
T-s diagram of the TORC.
Figure 3.
Variations of TORC thermal efficiency with and .
Figure 3.
Variations of TORC thermal efficiency with and .
Figure 5.
Variations of subcycle net power outputs for benzene when 153 °C.
Figure 5.
Variations of subcycle net power outputs for benzene when 153 °C.
Figure 6.
Variations of subcycle thermal efficiencies for benzene when 153 °C.
Figure 6.
Variations of subcycle thermal efficiencies for benzene when 153 °C.
Figure 7.
Variations of subcycle mass flow rates for benzene when 153 °C.
Figure 7.
Variations of subcycle mass flow rates for benzene when 153 °C.
Figure 8.
T-Q diagram at the optimal condition.
Figure 8.
T-Q diagram at the optimal condition.
Figure 9.
Entropy generation in the TORC on the use of benzene.
Figure 9.
Entropy generation in the TORC on the use of benzene.
Figure 10.
Variations of TORC exergy efficiency with and .
Figure 10.
Variations of TORC exergy efficiency with and .
Figure 11.
Variations of TORC exergy efficiency with when 153 °C.
Figure 11.
Variations of TORC exergy efficiency with when 153 °C.
Figure 12.
Schemes of the shell and tube HXs.
Figure 12.
Schemes of the shell and tube HXs.
Figure 13.
Schematic diagram of the cascade ORC.
Figure 13.
Schematic diagram of the cascade ORC.
Figure 14.
Variations of the cascade ORC thermal and exergy efficiencies with .
Figure 14.
Variations of the cascade ORC thermal and exergy efficiencies with .
Table 1.
Allowable pressure drop.
Table 1.
Allowable pressure drop.
| Intel pressure (MPa) |
< 0.1 |
0.1-0.17 |
0.17-1.1 |
1.1-3.1 |
3.1-8.1 |
| Allowable pressure drop (MPa) |
p/10 |
0.005-0.035 |
0.035 |
0.035-0.18 |
0.07-0.5 |
Table 2.
Definition of the entropy generation in different components.
Table 2.
Definition of the entropy generation in different components.
| Equipment |
Equation |
| T1 |
|
| T2 |
|
| T3 |
) |
| HX1 |
|
| HX2 |
|
| HX3 |
|
| HX4 |
|
| HX5 |
|
| MHX |
|
| P1 |
|
| P2 |
|
| P3 |
|
Table 3.
Values of constants for pumps.
Table 3.
Values of constants for pumps.
|
|
|
|
|
|
|
|
|
|
| 3.4771 |
0.135 |
0.1438 |
1.89 |
1.35 |
-0.3935 |
0.3957 |
-0.00226 |
1.6 |
1 |
Table 4.
Specific parameters for calculation.
Table 4.
Specific parameters for calculation.
| Parameters |
Design Value |
| Net power output of TORC system [21,41], |
10 MW |
| ORC turbine efficiency [19,32], |
0.85 |
| Pump efficiency [42,43], |
0.8 |
| Generator efficiency [30,34], |
0.95 |
| Efficiencies of HX2 and HX3 [30,35], |
0.7 |
| Minimum heat transfer temperature difference [19,20], |
10 °C |
| Evaporation temperature of the top ORC [21], |
400 °C |
| Condensation temperature of the bottom ORC [20], |
30 °C |
| Ambient temperature [21,44], |
15 °C |
| CEPCI in 2001 [22] |
397 |
| CEPCI in 2020 [45] |
600.6 |
| Interest rate [35], |
5 % |
| Annual operating time [5,46], |
7000 h |
| System life time [34,35], |
20 years |
Table 5.
Thermodynamic parameters at the optimum condition when the bottom cycle fluid is benzene.
Table 5.
Thermodynamic parameters at the optimum condition when the bottom cycle fluid is benzene.
| |
(°C) |
(kPa) |
(kJ/kg) |
(kJ·kg-1·K-1) |
| 1 |
400 |
1090 |
1005.77 |
4.5671 |
| 2 |
353.73 |
105.69 |
932.08 |
4.5879 |
| 3 |
288.49 |
100.69 |
807.64 |
4.3513 |
| 4 |
257 |
100.69 |
457.78 |
3.6941 |
| 5 |
258.52 |
1160 |
459.32 |
3.7004 |
| 6 |
313.23 |
1125 |
583.76 |
3.9230 |
| 7 |
257 |
100.69 |
751.76 |
4.2489 |
| 8 |
214.62 |
6.33 |
683.11 |
4.2739 |
| 9 |
172.27 |
5.70 |
617.41 |
4.1222 |
| 10 |
153 |
5.13 |
243.32 |
3.2450 |
| 11 |
152.99 |
105.69 |
243.45 |
3.2450 |
| 12 |
186.39 |
100.69 |
309.14 |
3.3934 |
| 13 |
143 |
503.67 |
469.98 |
1.1532 |
| 14 |
53.41 |
17.61 |
364.65 |
1.2116 |
| 15 |
30 |
15.92 |
-91.39 |
-0.2784 |
| 16 |
30.21 |
538.67 |
-90.64 |
-0.2779 |
Table 6.
Results of the parameters corresponds to the maximum .
Table 6.
Results of the parameters corresponds to the maximum .
| |
Top ORC |
Middle ORC |
Bottom ORC |
TORC |
|
(kg/s) |
57.99 |
45.84 |
30.59 |
—— |
|
(MW) |
4.27 |
3.15 |
3.23 |
10.65 |
|
(MW) |
0.089 |
0.006 |
0.023 |
0.118 |
|
(MW) |
3.97 |
2.98 |
3.05 |
10 |
|
(MW) |
24.47 |
20.29 |
17.15 |
24.47 |
|
(%) |
16.22 |
14.71 |
17.76 |
40.86 |
|
(%) |
28.95 |
33.19 |
67.17 |
72.94 |
Table 7.
Design parameters of different HXs.
Table 7.
Design parameters of different HXs.
| |
HX1 |
HX2 |
HX3 |
HX4 |
HX5 |
| Type |
BJM |
BES |
BEM |
BEM |
BJM |
Shell side heat transfer coefficient,
W/m2·K |
68345 |
311.75 |
223.80 |
247.43 |
1486.3 |
Tube side heat transfer coefficient,
W/m2·K |
1135.3 |
684.35 |
210.49 |
609.96 |
11485 |
| Shell ID, mm |
2100 |
1700 |
1900 |
1900 |
1400 |
| Tube length, m |
16 |
144 |
9 |
10 |
10 |
| Ratio of tube length and shell ID |
7.62 |
88.24 |
4.74 |
5.26 |
7.14 |
| Tube count |
3359 |
2774 |
4972 |
4612 |
2506 |
Overall heat transfer coefficient,
W/m2·K |
611.36 |
181.64 |
91.51 |
152.48 |
819.90 |
| Heat duty, MW |
27.230 |
7.9854 |
3.3410 |
9.2282 |
14.362 |
| Baffle central spacing, mm |
800 |
1000 |
800 |
800 |
1000 |
| Effective mean temperature difference, °C |
16 |
21.9 |
16.2 |
24.7 |
13.3 |
| Area, m2
|
3118.9 |
2291.8 |
2631.4 |
2716.2 |
1475.4 |
| Over design, % |
12.27 |
14.13 |
16.60 |
10.71 |
11.78 |
Table 8.
Values of constants for HXs and turbines.
Table 8.
Values of constants for HXs and turbines.
| |
|
|
|
| HX1 |
2.9 |
1 |
1 |
| HX2 |
1 |
1 |
1 |
| HX3 |
1 |
1 |
1 |
| HX4 |
1 |
1.3 |
1 |
| HX5 |
1 |
1.3 |
1 |
| T1 |
3.2 |
1 |
1 |
| T2 |
1 |
1.3 |
1 |
| T3 |
1 |
1 |
1 |
Table 9.
Investment cost of each component.
Table 9.
Investment cost of each component.
| Component |
Cost (×104 $) |
Component |
Cost (×104 $) |
Component |
Cost (×104 $) |
| HX1 |
173.73 |
HX2 |
48.58 |
HX3 |
53.37 |
| HX4 |
70.89 |
HX5 |
46.81 |
T1 |
1010.74 |
| T2 |
331.46 |
T3 |
259.67 |
P1 |
12.10 |
| P2 |
2.92 |
P3 |
5.28 |
G1 |
24.32 |
| G2 |
18.19 |
G3 |
18.65 |
|
|
Table 10.
Thermodynamic parameters of the cascade ORC at the optimum condition.
Table 10.
Thermodynamic parameters of the cascade ORC at the optimum condition.
| |
(°C) |
(kPa) |
(kJ/kg) |
(kJ·kg-1·K-1) |
| 17 |
400 |
1090 |
1005.77 |
4.5671 |
| 18 |
302.54 |
6.33 |
835.25 |
4.6201 |
| 19 |
203.75 |
5.7 |
665.75 |
4.2270 |
| 20 |
153 |
5.13 |
243.32 |
3.245 |
| 21 |
155.68 |
1160 |
244.83 |
3.2571 |
| 22 |
238.96 |
1125 |
414.33 |
3.6174 |
| 23 |
143 |
503.67 |
469.98 |
1.1532 |
| 24 |
53.03 |
17.61 |
364.23 |
1.2119 |
| 25 |
30 |
15.92 |
-91.39 |
-0.2784 |
| 26 |
30.21 |
538.67 |
-90.79 |
-0.2779 |
Table 11.
Design parameters of the HXs in cascade ORC.
Table 11.
Design parameters of the HXs in cascade ORC.
| |
HX6 |
HX7 |
HX8 |
HX9 |
| Type |
BJM |
BES |
BES |
BJM |
Shell side heat transfer coefficient,
W/m2·K |
70939 |
190.63 |
953.18 |
1439.4 |
Tube side heat transfer coefficient,
W/m2·K |
976.58 |
434.62 |
564.03 |
9541.7 |
| Shell ID, mm |
2000 |
1800 |
2100 |
1500 |
| Tube length, m |
14 |
13 |
16 |
8 |
| Ratio of tube length and shell ID |
7 |
7.22 |
7.62 |
5.33 |
| Tube count |
2978 |
2774 |
5246 |
2535 |
Overall heat transfer coefficient,
W/m2·K |
576.69 |
116.22 |
267.68 |
791.08 |
| Heat duty, MW |
26.878 |
7.7654 |
17.345 |
13.718 |
| Baffle central spacing, mm |
800 |
1000 |
800 |
1000 |
| Effective mean temperature difference, °C |
22.0 |
35 |
13.5 |
14.1 |
| Area, m2
|
2427.1 |
2126.3 |
5581.4 |
1382.0 |
| Over design, % |
14.54 |
11.41 |
16.27 |
12.28 |
Table 12.
Investment cost of each component in cascade ORC.
Table 12.
Investment cost of each component in cascade ORC.
| Component |
Cost (×104 $) |
Component |
Cost (×104 $) |
Component |
Cost (×104 $) |
| HX6 |
146.50 |
HX7 |
46.17 |
HX8 |
111.42 |
| HX9 |
44.78 |
T4 |
1435.81 |
T5 |
342.46 |
| P4 |
9.52 |
P5 |
5.34 |
G4 |
39.17 |
| G5 |
19.01 |
|
|
|
|
