Preprint
Article

Impact of Separator Thickness on Relationship between Temperature Distribution and Mass & Current Density Distribution in Single Cell of HT-PEFC

Altmetrics

Downloads

95

Views

37

Comments

0

Submitted:

01 November 2023

Posted:

01 November 2023

You are already at the latest version

Alerts
Abstract
For the polymer electrolyte fuel cell (PEFC), the separator thickness plays an important role to determine the weight, the volume and the costs of the PEFC. In addition, thermal management, i.e. temperature distribution is also important for the PEFC system to obtain higher performance. However, there were few reports investigating the relationship between the temperature distribution and the power generation performance such as current density distribution of PEFC operated at higher temperature (HT-PEFC). The aim of this study is to clarify the impact of separator thickness on the relationship between the temperature distribution and the current density distribution of HT-PEFC. This study has also investigated the impact of separator thickness on the relationship between the temperature distribution and the gases such as H2, O2 and the current density distribution of HT-PEFC numerically using CFD software COMSOL Multiphysics. The separator thicknesses of 2.0 mm, 1.5 mm and 1.0 mm were studied. In the study, the operation temperature and the relative humidity (RH) of supply gas were also changed. As a result, it was revealed that the optimum separator thickness was 2.0 mm to obtain higher power generation of HT-PEFC. Since the heat capacity in the case of the separator thickness of 2.0 mm was the largest among the separators investigated in this study, the dehydration of PEM and catalyst layer was smaller compared with the thinner separator thicknesses. It was also revealed that the impacts of separator thickness on distribution of gases, e.g. O2, H2O, and current density distribution became larger under higher temperature and lower RH conditions. This study also concluded that the tendency of temperature distribution matched those of O2, H2O and current density distributions.
Keywords: 
Subject: Engineering  -   Energy and Fuel Technology

1. Introduction

The Japanese New Energy and Industry Technology Development Organization (NEDO) that is a Japanese government agency has announced that polymer electrolyte membrane fuel cell (PEMFC) should be worked at higher temperature such as 363 K and 373 K for the application use of stationary and vehicle, respectively, during the period from 2020 to 2025 in road map 2017 [1]. On the other hand, PEMFC which uses Nafion membrane for a polymer electrolyte membrane (PEM) generally is usually worked below 353 K [2,3,4]. The merits for PEMFC operated at higher temperature (HT-PEMFC) include (i) kinetic improvement of catalyst, (ii) down scale effect of the cooling system for the mobility application thanks to increase in temperature gap between PEMFC stack and coolant, and (iii) enhancement of CO endurance allowing the purity of H2 production from hydrocarbon such as CH4 [5]. On the other hand, the following issues which should be overcome: (i) degradation of PEM because of thermal expansion and shrinkage, (ii) electrode erosion, (iii) uneven profile of gas flow, gas pressure, temperature, voltage and current density in PEMFC [6]. In addition, the uneven profiles of H2, O2, H2O, temperature and current density would undermine the power generation characteristics as well as the operation life of PEMFC when operated at higher temperature than usual.
The authors had already investigated the effect of thickness of PEM and gas diffusion layer (GDL) as well as micro porous layer (MPL) on the coupling phenomena of HT-PEMFC worked at 363 K and 373 K experimentally and numerically [7,8,9,10,11]. Moreover, the effect of separator thickness on H2, O2, H2O and current density distributions had been investigated numerically [12] and that on the temperature profile on separator’s back surface experimentally [13]. According to recent works except for the authors’ studies [12,13], the impact of interdigitated flow field of separator on mass transport and electrochemical reaction in HT-PEMFC was investigated by CFD software COMCOL Multiphysics [14]. Compared the performance of interdigitated flow filed with that of parallel flow field, the increase in current density with air stoichiometry in the case of integrated flow field was approximately three times as large as that in the case of parallel flow filed. On the other hand, the polarization curve in the case of interdigitated flow field was almost same as that in the case of single channel serpentine flow field. Though the relationship between O2 distribution or pressure distribution and the power generation performance was discussed, that between the temperature distribution and the power generation performance was not investigated. The other numerical study using CFD software COMCOL Multiphysics reported that three different types of cathode-enhanced mass transfer flow fields, i.e. tapered, staggered-blocked and blocked were designed and compared their performances [15]. As a result, the tapered flow field was the optimum design for HT-PEMFC due to the superior performance and lower flow resistance. Though the relation between the power generation characteristics and O2 profile or flow filed distribution was discussed, that between the power generation characteristics and the temperature distribution was not studied. Regarding the general PEMFC operated below 353 K, the several flow fields of separator such as a modified parallel flow field [16], a blocked flow field [17], a modified serpentine wave flow filed [18], a straight channel with baffled obstacles [19] and an ultrathin steel separator whose thickness was 0.1 mm [20] were investigated. Since the weight ratio of separator to that of total cell is approximately 80 % [21], it is important to optimize the design of separator. Especially, the separator thickness provides a big impact on the weight, volume and cost of cell. In addition, a thermal management is important to realize higher performance for the application usage of PEMFC system [22]. However, there are few reports investigating the relation between the temperature profile and the power generation characteristics e.g. current density profile of HT-PEMFC. Therefore, we aim to reveal the impact of separator thickness on the relationship between the temperature distribution and the current density distribution of HT-PEMFC. We have investigated the impact of separator thickness on the relationship between the temperature profile and the current density profile of HT-PEMFC numerically using CFD software COMSOL Multiphysics. The relation between the temperature profile and not only the current density profile but also the mass such as O2 and H2O profiles are also discussed. The separator thickness is changed by 2.0 mm, 1.5 mm and 1.0 mm. The separator thickness of 2.0 mm consists of the saddle thickness = 1.0 mm and the channel height = 1.0 mm. The separator thickness of 1.5 mm consists of the saddle thickness = 0.5 mm and the channel height = 1.0 mm. The separator thickness of 1.0 mm consists of the saddle thickness = 0.5 mm and the channel height = 0.5 mm. Regarding PEM and GDL, this study adopts Nafion NRE-211 and TGP-H-030, respectively. This selection follows the results obtained by the previous studies conducted by the authors which optimized the thickness of PEM and GDL [7,8,10,11]. This study changes the operation temperature by 353 K, 363 K and 373 K to compare the characteristics of HT-PEMFC with that of general PEMFC. This study also examines changing the relative humidity (RH) of supply gases at the anode = 80 %RH and cathode = 80 %RH (A80%RH-C80%RH), anode = 80 %RH and cathode = 40 %RH (A80%RH-C40%RH), anode = 40 %RH and cathode = 80 %RH (A40%RH-C80%RH) and anode = 40 %RH and cathode = 40 %RH (A40%RH-C40%RH).

2. Numerical Simulation Procedure

2.1. Considered Governing Equations

This study has conducted the numerical simulation by a multi-physics software COMSOL Multiphysics, ver. 6.1. This COMSOL Multiphysics has a simulation function code consisting of Brinkman formula, Maxwell-Stefan formula, Butler-Volmer formula and heat transfer formula considering the heat generated by over-potentials, thermal conduction through each component in the cell and thermal convection via the flow through the channel as well as transferring from the exhaust gas to the ambient air. Some researchers carried out the numerical simulation using COMSOL Multiphysics for HT-PEMFC [4,14,15,23,24,25], which reported the temperature, gases and current density distributions well. Therefore, this software was used in the present study for the numerical simulation of HT-PEMFC.
Firstly, the continuity formula treating the gas species in porous material in single PEMFC, e.g., catalyst layer, MPL, GDL and the gas channel, can be defined, as following:
t ε p ρ + ρ u = Q m
where εp is the porosity of porous material (-), ρ is the gas density (kg/m3), u is the gas velocity vector (m/s), Qm is the mass source term balancing this equation (kg/(m3·s)) and t is the time (s).
Brinkman formula considering the relationship between the gas pressure and gas flow velocity which is solved in porous material in single PEMFC, e.g., catalyst layer, MPL, GDL and the gas channel, can be defined, as following:
ρ ε p u t + u u ε p = p + 1 ε p μ u + u T 2 3 μ u I κ 1 μ + Q m ε p 2 u + F
where p is the gas pressure (Pa), μ is the gas viscosity (Pa·s), I is the unit vector (-), κ is the permeability of porous material (m2), and F is the force vector (kg/(m2·s2)) such as a gravity. Maxwell–Stefan formula treating the mass transfer phenomena, i.e. the diffusion phenomenon, ion transfer phenomenon as well as convection transfer phenomenon can be defined, as following:
N i = D i C i z i u m , i F C i φ l + C i u = J i + C i u
C i t + N i = R i , t o t
where Ni indicates the vector molar flow rate on the interface between PEM and catalyst layer (mol/(m2·s)), Di indicates the diffusion constant of gas (m2/s), Ci indicates the ion i concentration (mol/m3), zi indicates the ion valence (-), um, i indicates the ion i mobility ((s·mol)/kg), F indicates the Faraday constant (C/mol), φl indicates the electrical potential of liquid material [25] (V), J i indicates the molar flow rate of the convection transfer phenomenon (mol/(m2·s)) and Ri, tot indicates the species’ reaction rate (mol/(m3·s)).
Butler–Volmer formula treats the electrochemical reaction phenomenon, as following:
i = i 0 exp α a F η R T exp α c F η R T
η = φ s φ l E e q
where i is the current density (A/m2), i0 is the exchange current density (A/m2), αa is the charge transfer coefficient at anode side (-), η is the activation over-potential [26] (V), R is the gas constant (J/(mol·K)), T is the operating temperature (K), αc is the charge transfer constant at the cathode side (-), φs is the electrical potential of solid material [26] (V), Eeq is the equilibrium electric voltage [26] (V).
Heat transfer equation considering electrochemical reactions are defined as following:
ρ C p u T = k T + Q j h + m a v Q m + q 0
Q j h = i s φ s + i l φ l
Q m = η + T δ E e q δ T i
q 0 = h T e x t T
where Cp indicates the constant pressure specific heat (J/(kg·K), k is the thermal conductivity (W/(m·K)), ac means the active area ratio (1/m), i s means the electrode current density vector (A/m2), i l means the electrolyte current density vector (A/m2), h indicates the heat transfer coefficient (W/(m2·K)), Text indicates the external temperature [K].
The model used in this study was the same as the authors’ previous study [12]. Figure 1 illustrates the model for the separator thickness of 2.0 mm, 1.5 mm and 1.0 mm. The structures of these models follow the commercial cell used in the experiments carried out by the authors [8,9,13]. The separator has a serpentine flow channel consisting of five gas channels having a gas channel width of 1.0 mm and gas channel width of 1.0 mm. This cell has five gas channels following the structure of the commercial cell [8,9,13]. Table 1 shows the geometrical parameters used for the model proposed in this study. Table 2 and Table 3 show physical parameters and operation conditions, respectively. We change the initial operation temperature of a cell (Tini) by 353 K, 363 K and 373 K. This study adopts 353 K to compare the characteristics obtained under usual temperature condition with that at higher temperature condition. We also change the RHs of supply gases i.e. A80%RH-C80%RH, A80%RH-C40%RH, A40%RH-C80%RH and A40%RH-C40%RH. We examine the flow rate of supply gas in case of the stoichiometric ratio (s.r.) of 1.5, where the volume flow rate of supply gas at the anode side and the cathode side is equal to 0.210 NL/min and 0.105 NL/min, respectively. The s.r. of 1.0 indicating the flow rate of supply gas can be expressed by Equation (11).
C H 2 = I z H 2 F
where CH2 is the molar flow rate of H2 which is consumed in the electrochemical reaction (mol/s), I is the loaded current (A) and zH2 is the electrons moles which are exchanged in the reaction (= 2) (-), CH2 is the molar flow rate for s.r. = 1.0. The CO2 is the molar flow rate of O2 which is consumed in the electrochemical reaction (mol/s). The CO2 is half of CH2 (refer to Equation (12)).
H2 + 1/2 O2 = H2O
Higher operation temperature will cause PEM drying, which increases an ionic resistance, an ohmic loss and a material degradation [40]. As a result, it is meaningful to manage and control the temperature profile in the cell for the purpose of promotion of power generation performance. Especially, an O2 reduction reaction produces the heat and H2O as well as consumes O2, resulting that the complex phenomena occur in the cathode side. These phenomena occur on the interface between PEM and catalyst layer at the cathode side mainly. Since the power generation performance is influenced by temperature and humidification, this study focuses on the mass such as O2 and H2O distributions, the temperature distribution and the current density distribution on the interface between PEM and catalyst layer at the cathode side.
We have adopted the analysis points from A to K which follow the authors’ previous studies [11,12] to examine the impact of separator thickness on the mass such as O2 and H2O distributions, the temperature profile and the current density profile. We have conducted the analysis on the averaged value on the cross-sectional area on the interface between PEM and catalyst layer at the cathode side, covering parts under the gas channel as well as those under the rib.

3. Results and Discussion

3.1. Comparison of Temperature Profile

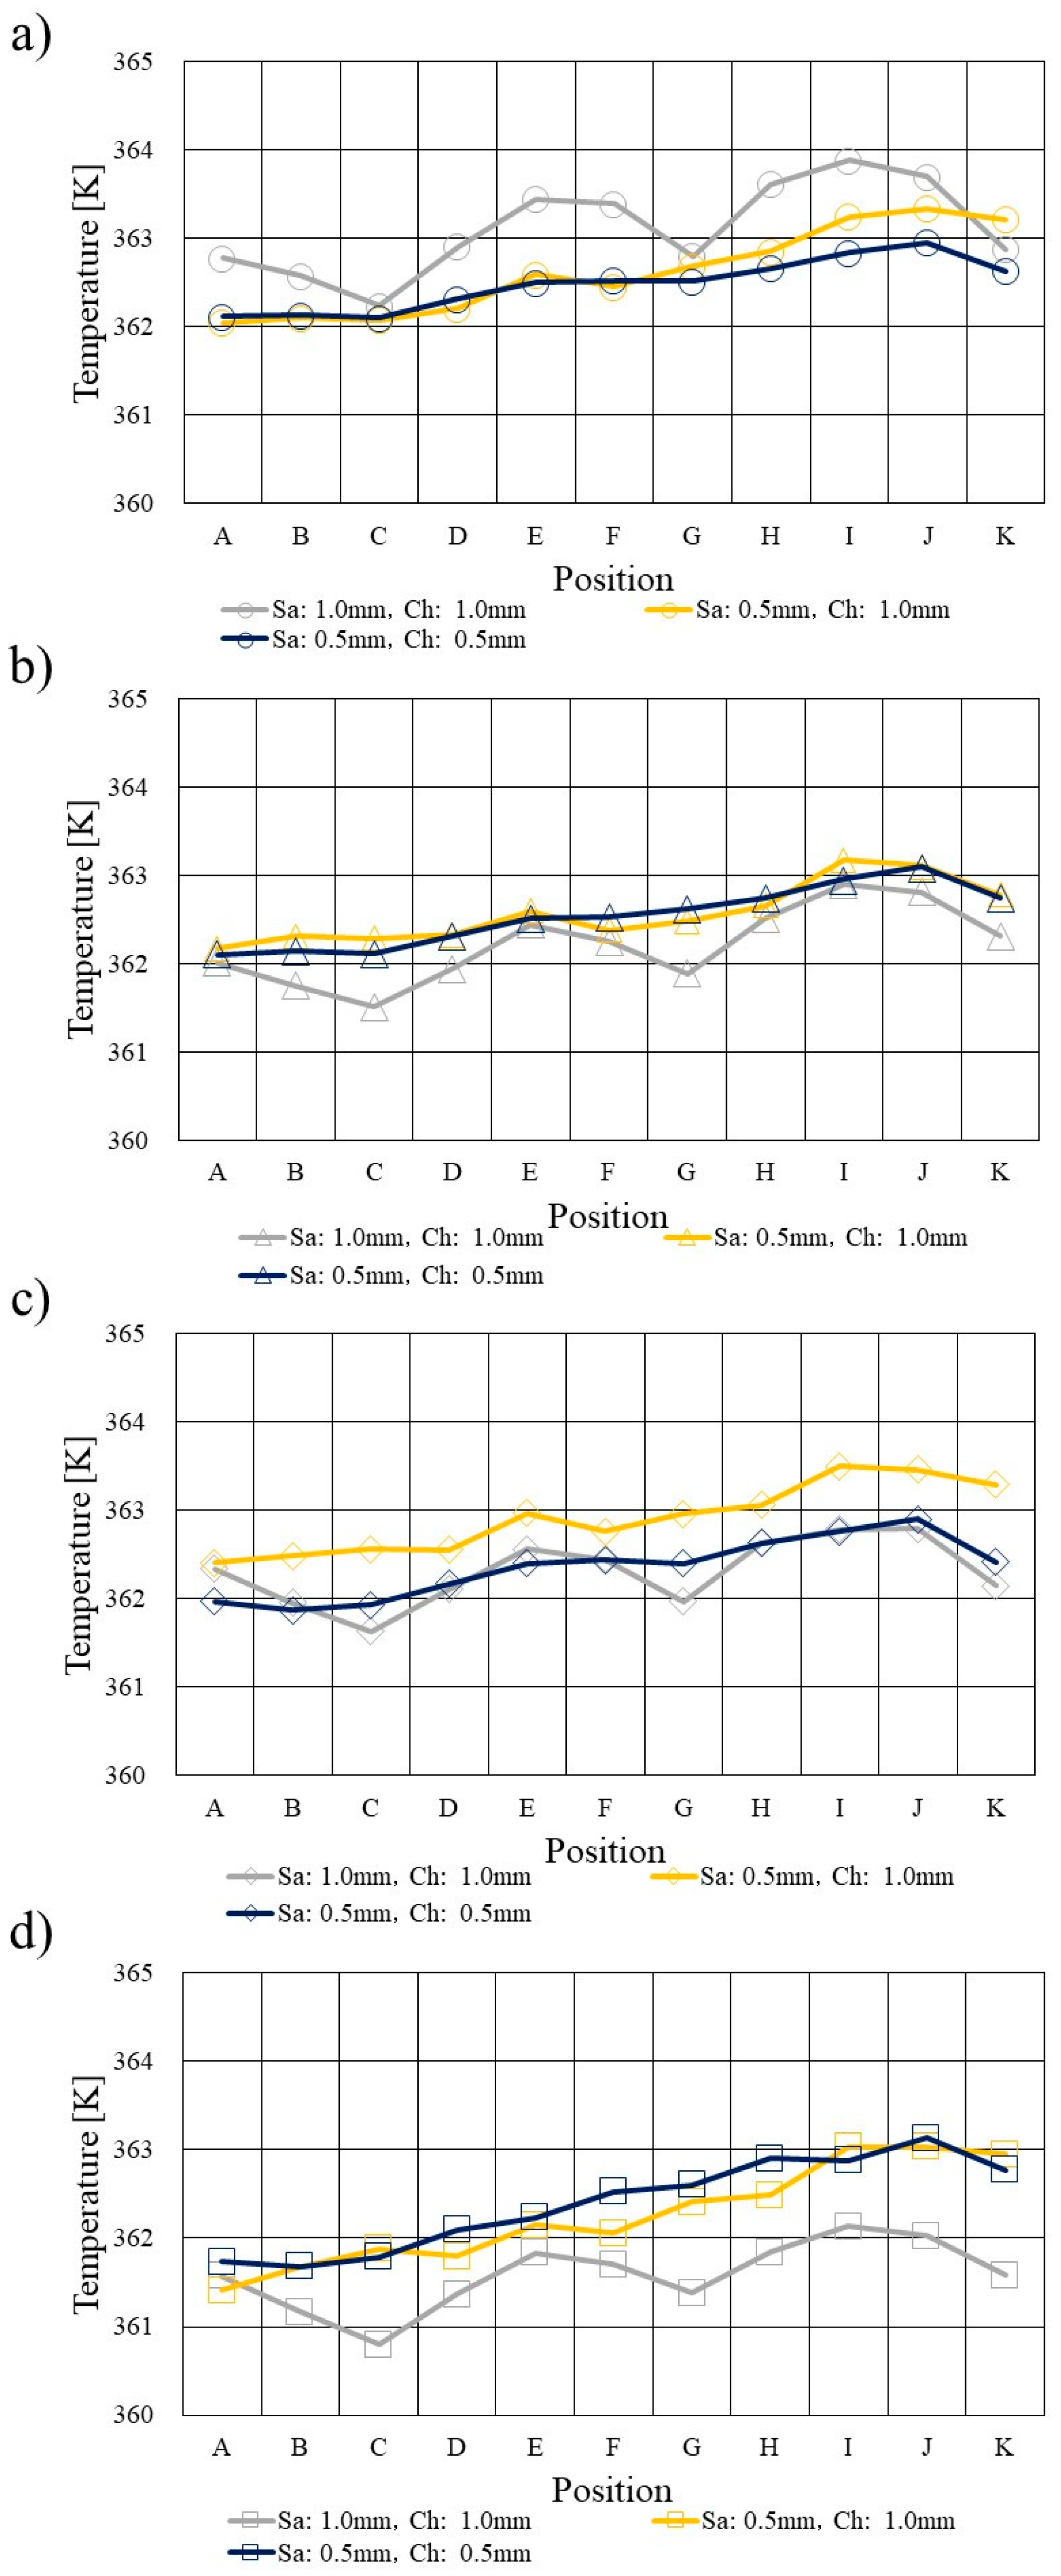
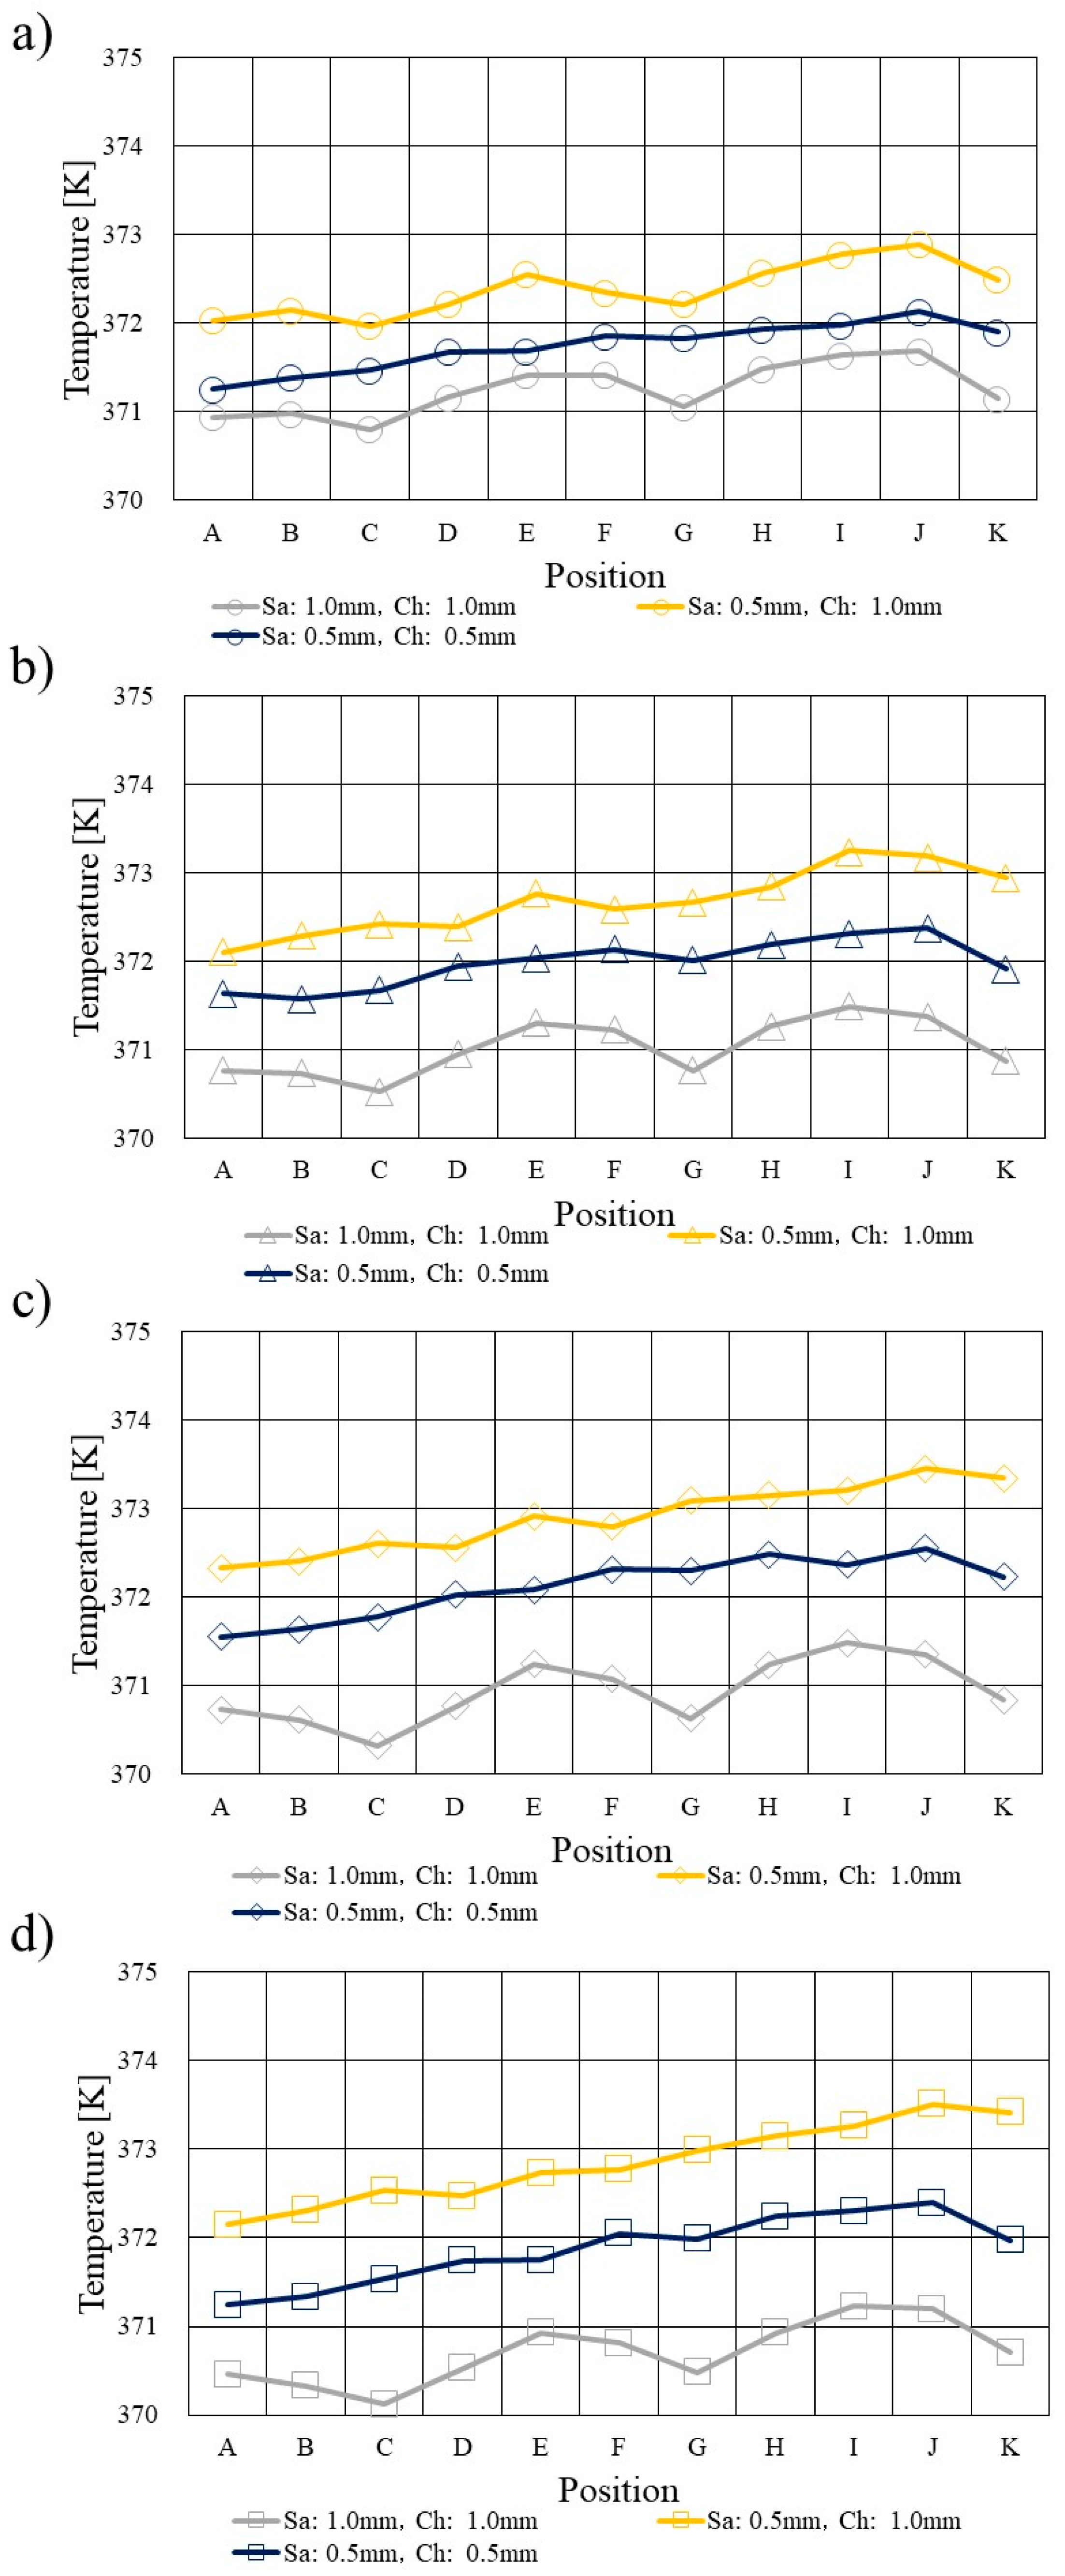
Figure 2, Figure 3 and Figure 4 show temperature distributions calculated by 3D numerical simulation model at Tini = 353 K, 363 K and 373 K, respectively. In these figures, the saddle thickness and the channel height are expressed by Sa and Ch, respectively. The effect of separator thickness on temperature profile is examined. Moreover, RH of supply gases is also varied.
It is known from Figure 2, Figure 3 and Figure 4 that the increase in temperature on the interface between PEM and catalyst layer at the cathode side from the inlet of cell to the outlet of cell is smaller with the increase in Tini irrespective of RH of supply gas. It is known that the saturation pressure of H2O increases with the temperature exponentially [41], resulting in easy dehydration of PEM at higher temperature than usual. Namely, it can be easy to reduce the proton conductivity of PEM at higher temperature, causing the decrease in power generation performance at higher temperature because of big ohmic loss. As a result, the generated heat decreases. Since we assume the excess amount of gas which is larger than s.r. = 1.0 as the inlet gas flow rate, the generated heat is accumulated along with the gas flow through the gas channel [42]. Therefore, the temperature on the interface between PEM and catalyst layer at the cathode side rises from the inlet of cell to the outlet of cell.
Regarding the impact of separator thickness, the temperature change from the inlet of cell to the outlet of cell, i.e. the temperature fluctuation such as increase and the decrease along the gas flow, at Tini = 353 K and 363 K is larger when the separator thickness is 2.0 mm consisting of the saddle thickness = 1.0 mm and the channel height = 1.0 mm. Because the heat capacity of the separator thickness of 2.0 mm is the biggest among the separators investigated in this study, the dehydration of PEM and catalyst layer would be lower compared to the thinner separator thicknesses [12]. Consequently, it is thought that the power generation performance is improved with the increase in the separator thickness [12]. The reason why the temperature decreases at the positions of C, G and K because of the increase in the separator thickness and RH of supply gases occur is discussed in the following sections.

3.2. Comparison of O2 Distribution

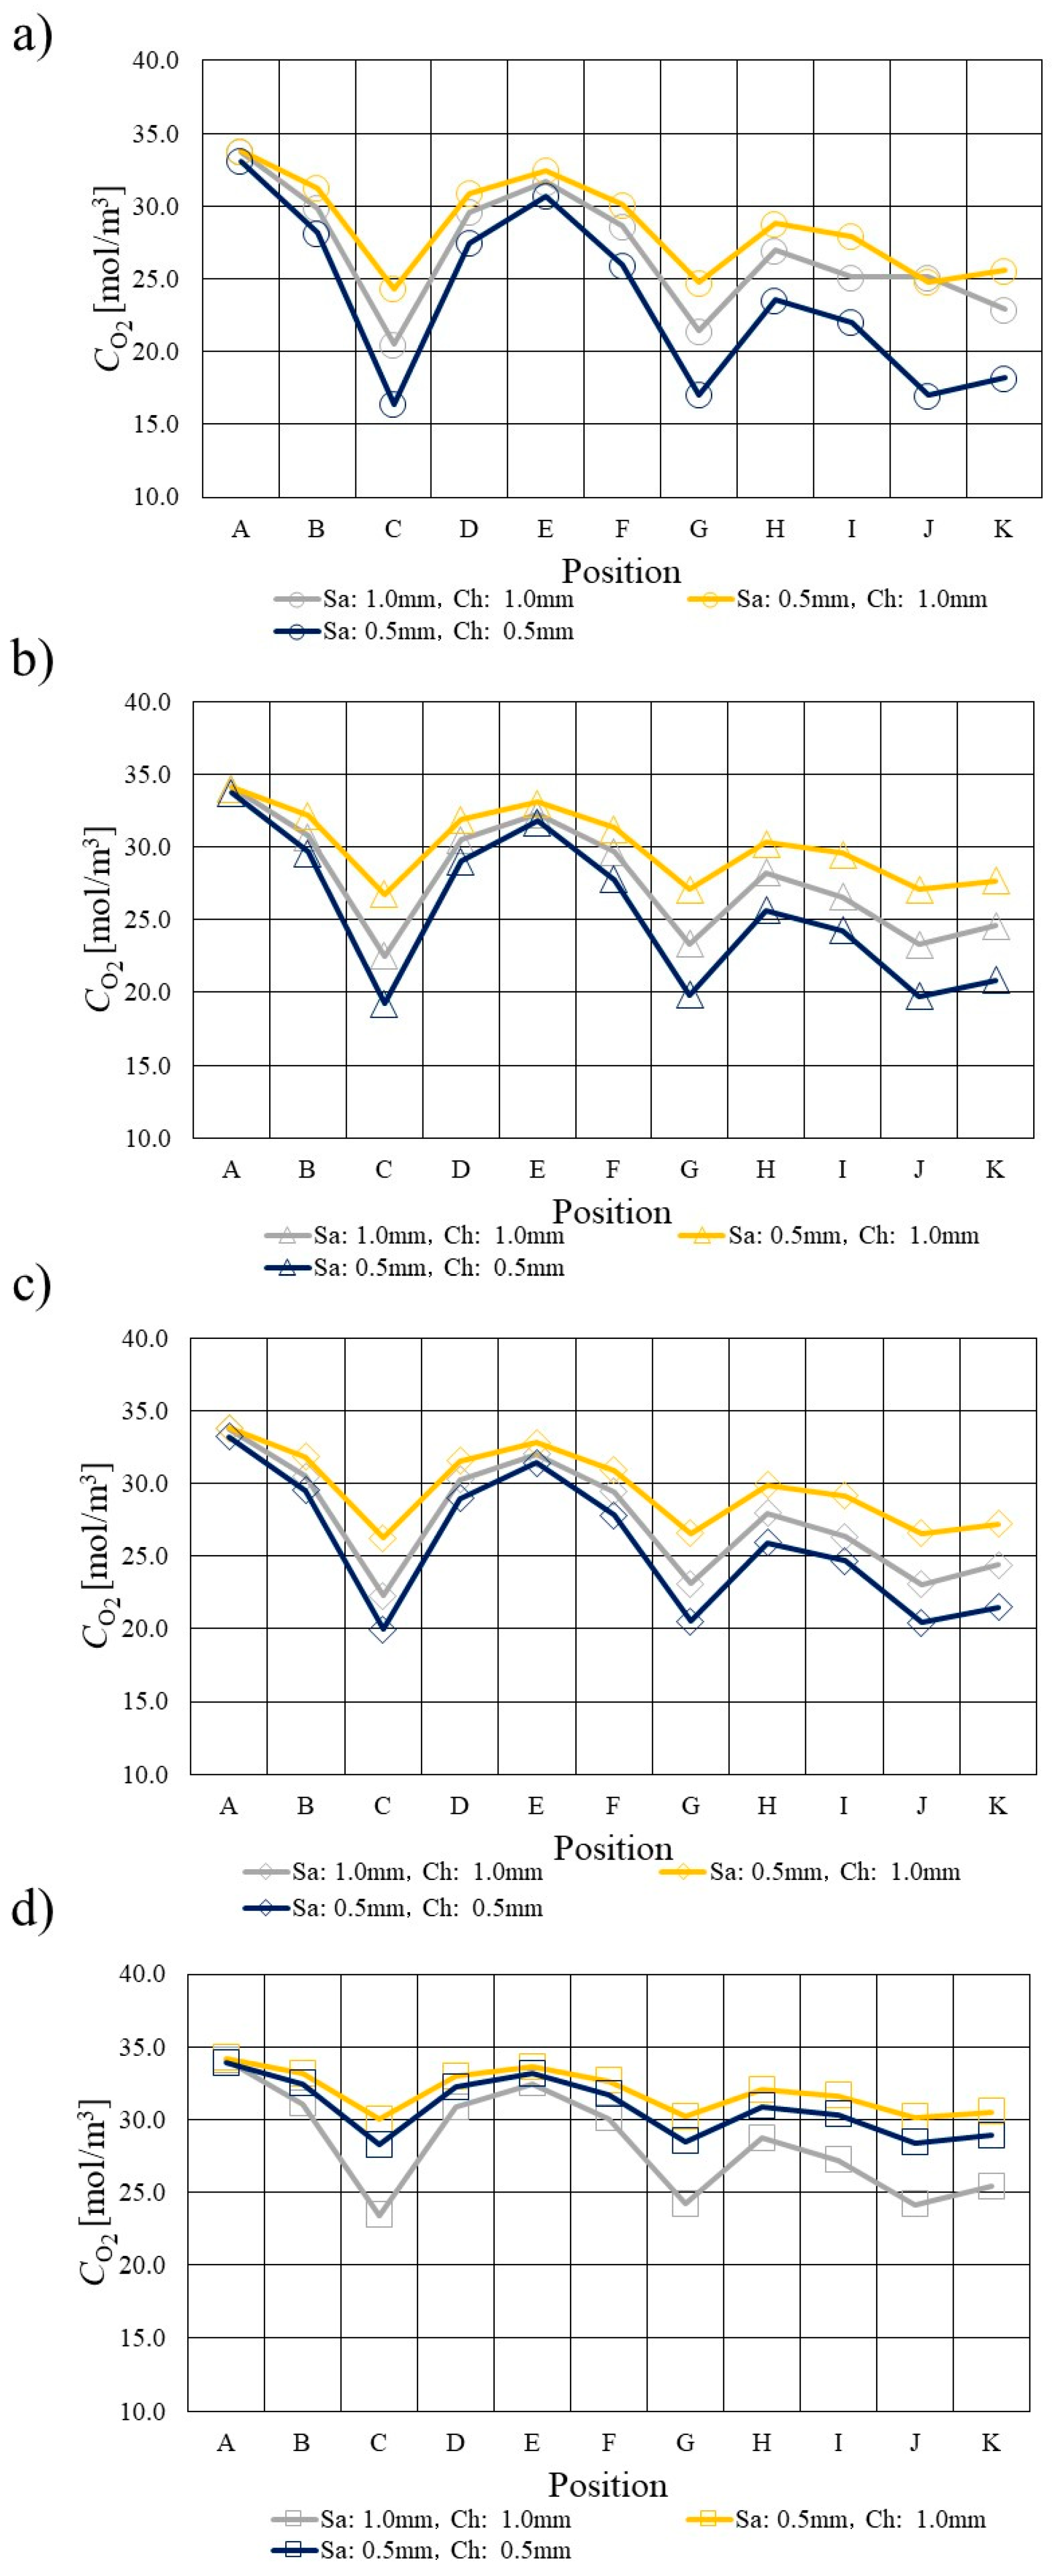
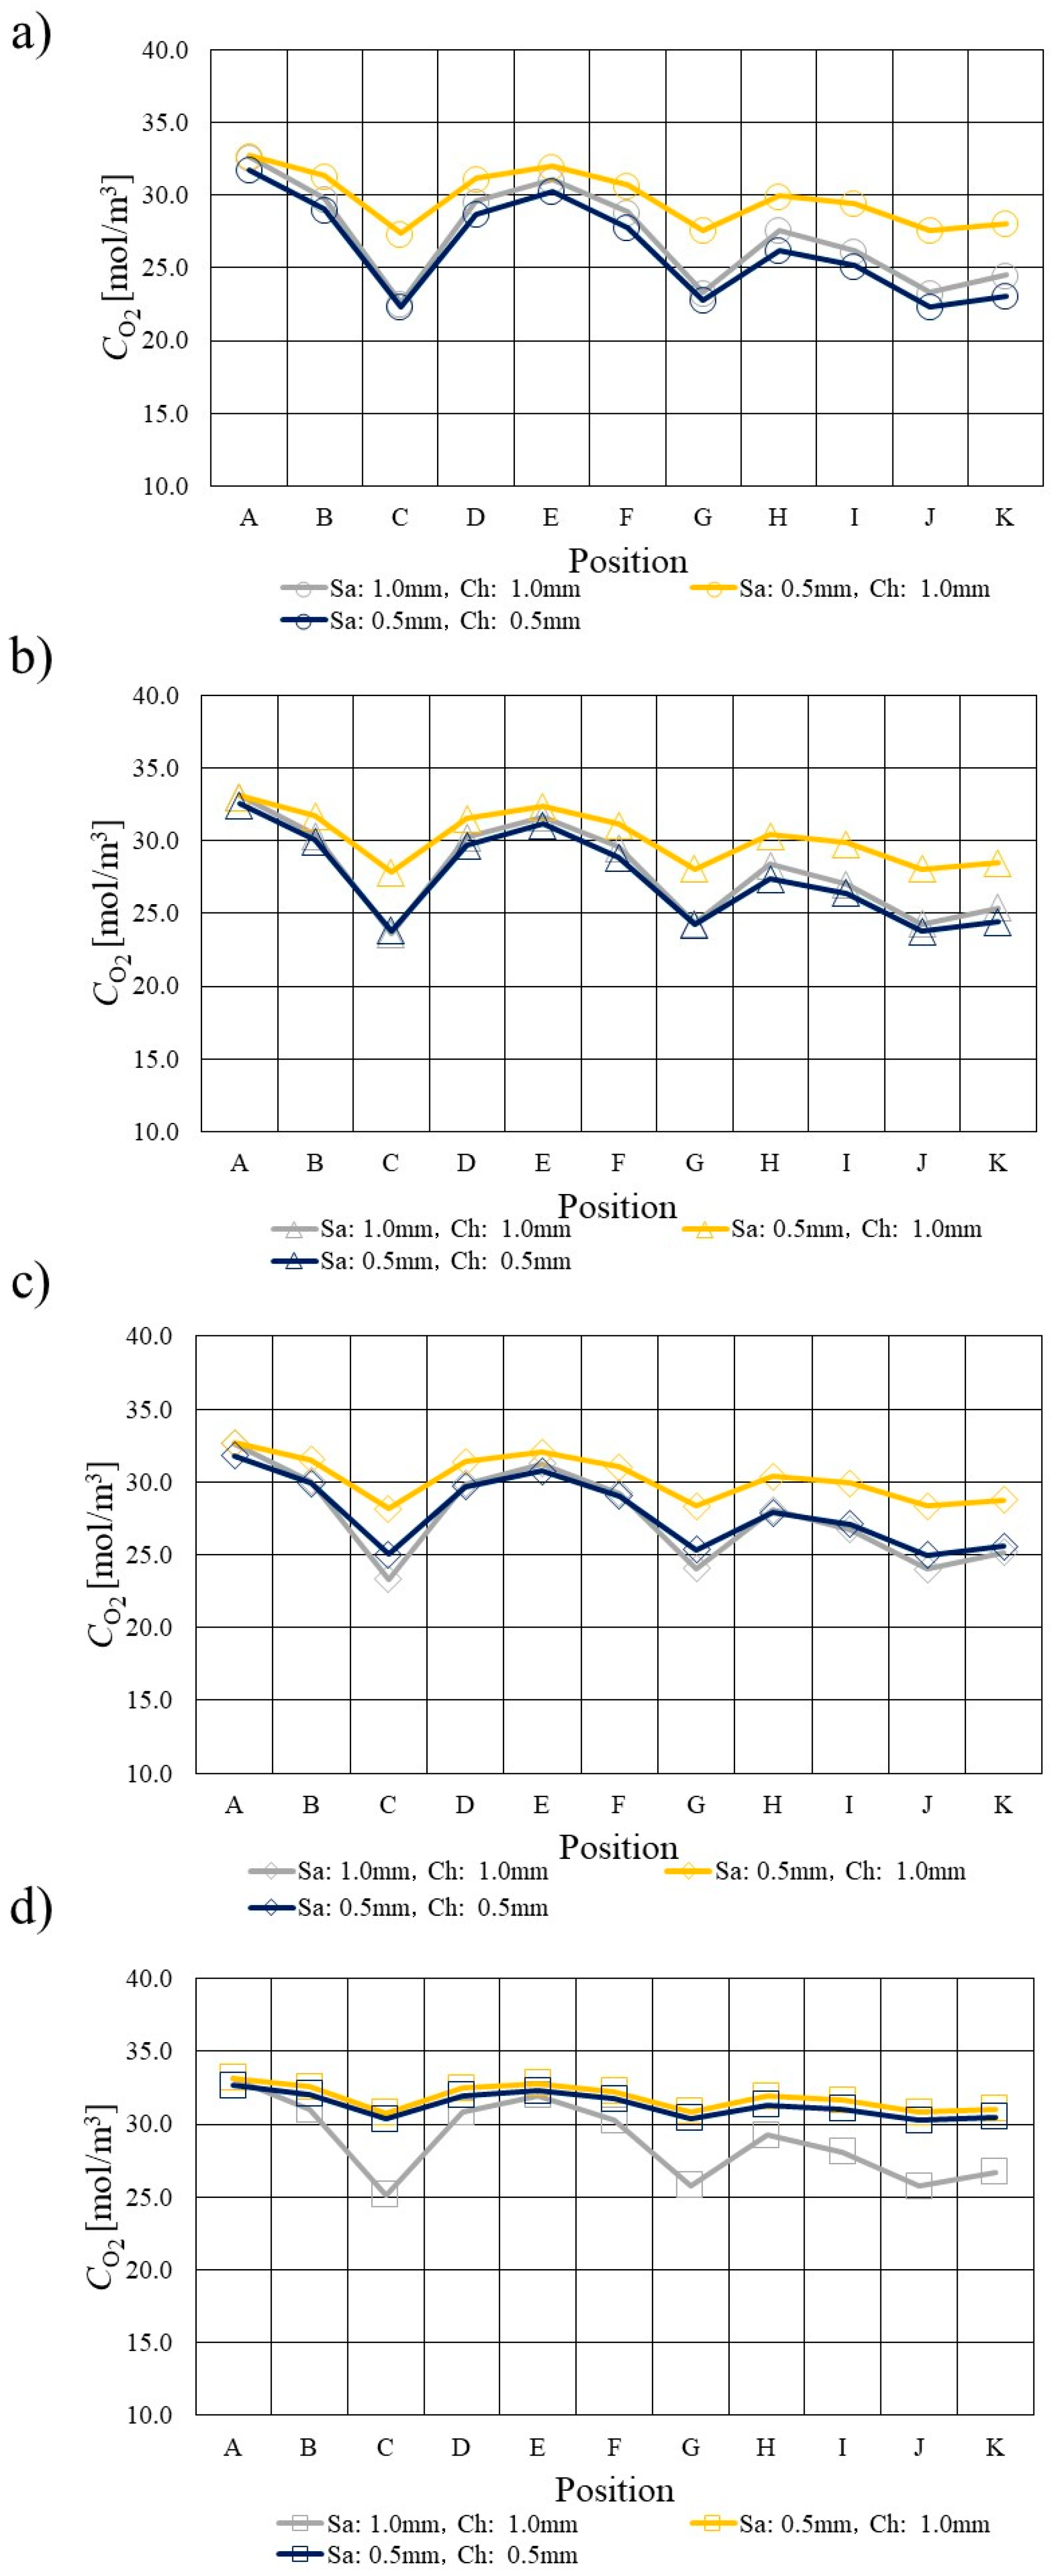
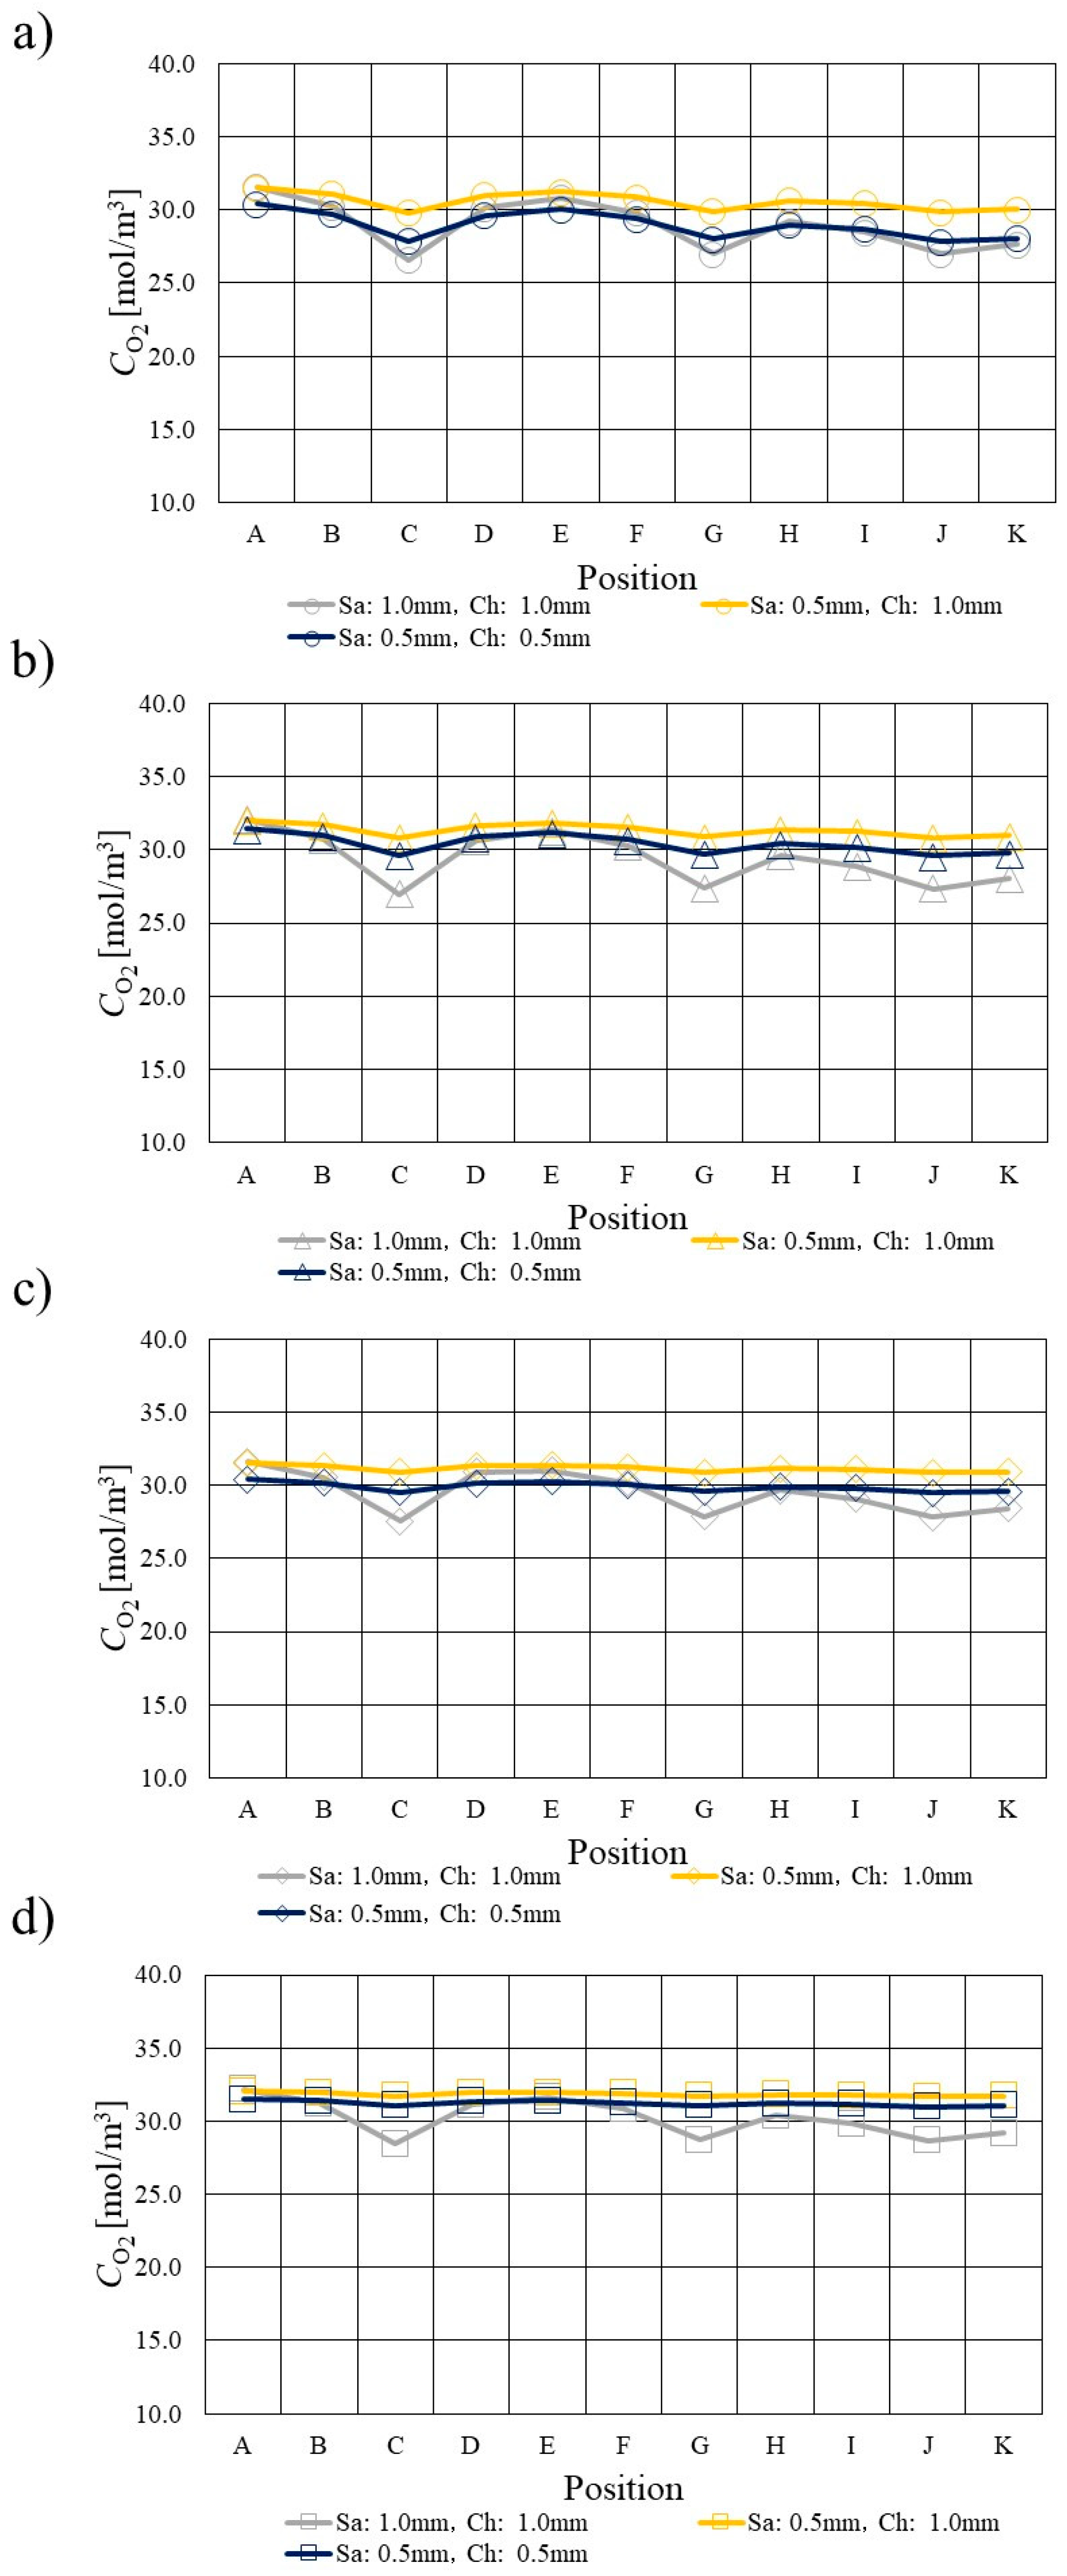
Figure 5, Figure 6 and Figure 7 show O2 distributions which are calculated by 3D numerical simulation model at Tini = 353 K, 363 K and 373 K, respectively. The impact of separator thickness on O2 distribution is investigated. Moreover, RH of supply gases is also changed.
It is seen from Figure 5, Figure 6 and Figure 7 that the decrease in the molar concentration of O2 (CO2) from the inlet of cell to the outlet of cell, i.e. the consumption of O2, becomes smaller with the increase in Tini and the decrease in RH of supply gas irrespective of separator thickness. The O2 reduction reaction is carried out along the gas channel [43]. It is known that the saturation pressure of H2O increases with the temperature exponentially [41] as described above, resulting in easy dehydration of PEM at higher temperature than usual. The proton conductivity of PEM reduces under higher temperature and low RH conditions due to the dehydration of PEM [43]. As a result, the ohmic over-potential becomes larger. On the other hand, the ionomer in the catalyst layer at the cathode side is not easy to be humidified by H2O migrated through PEM from the anode side to the cathode side, which is significant issue for the performance of O2 reduction reaction at the cathode side [12,41]. The big ohmic over-potential is provided due to ionic and electronic resistances. The ionic resistance is related with the resistance of PEM as well as the ionomer of catalyst layer [44]. Therefore, the decrease in the molar concentration of O2 from the inlet of cell to the outlet of cell is smaller with the increase in Tini as well as the decrease in RH of supply gas due to lower humidification.
As to the impact of separator thickness, it is seen from Figure 5, Figure 6 and Figure 7 that the molar concentration of O2 drops at analysis positions of C, G and J (and K) when the separator thickness is 2.0 mm, especially at Tini = 353 K and for A80%RH-C80%RH, which matches approximately the points of the temperature drop shown in Figure 2, Figure 3 and Figure 4. The heat capacity of the separator thickness of 2.0 mm is the biggest among the separators investigated in this study, resulting that the dry up of PEM and catalyst layer would be lower compared to the thinner separator thicknesses [12]. In addition, the humidification of PEM and catalyst layer is higher for A80%RH-C80%RH. Consequently, the O2 reduction reaction generating H2O is improved with the increase in the separator thickness and RH of supply gas. The analysis points of C and G are located at the corner parts of the serpentine separator. Therefore, it can be thought H2O accumulate there [45,46]. Additionally, it is considered that H2O remaining in gas flowing through the gas channel accumulates near the outlet of cell [9,47], which means the analysis points of J and K. As a result, the O2 diffusion is inhibited at analysis positions of C, G and J (and K) [13], causing the reduction of the molar concentration of O2. The impacts of separator thickness as discussed above become larger under higher temperature and lower RH conditions, which are thought to be easy dehydration conditions.

3.3. Comparison of H2O Profile

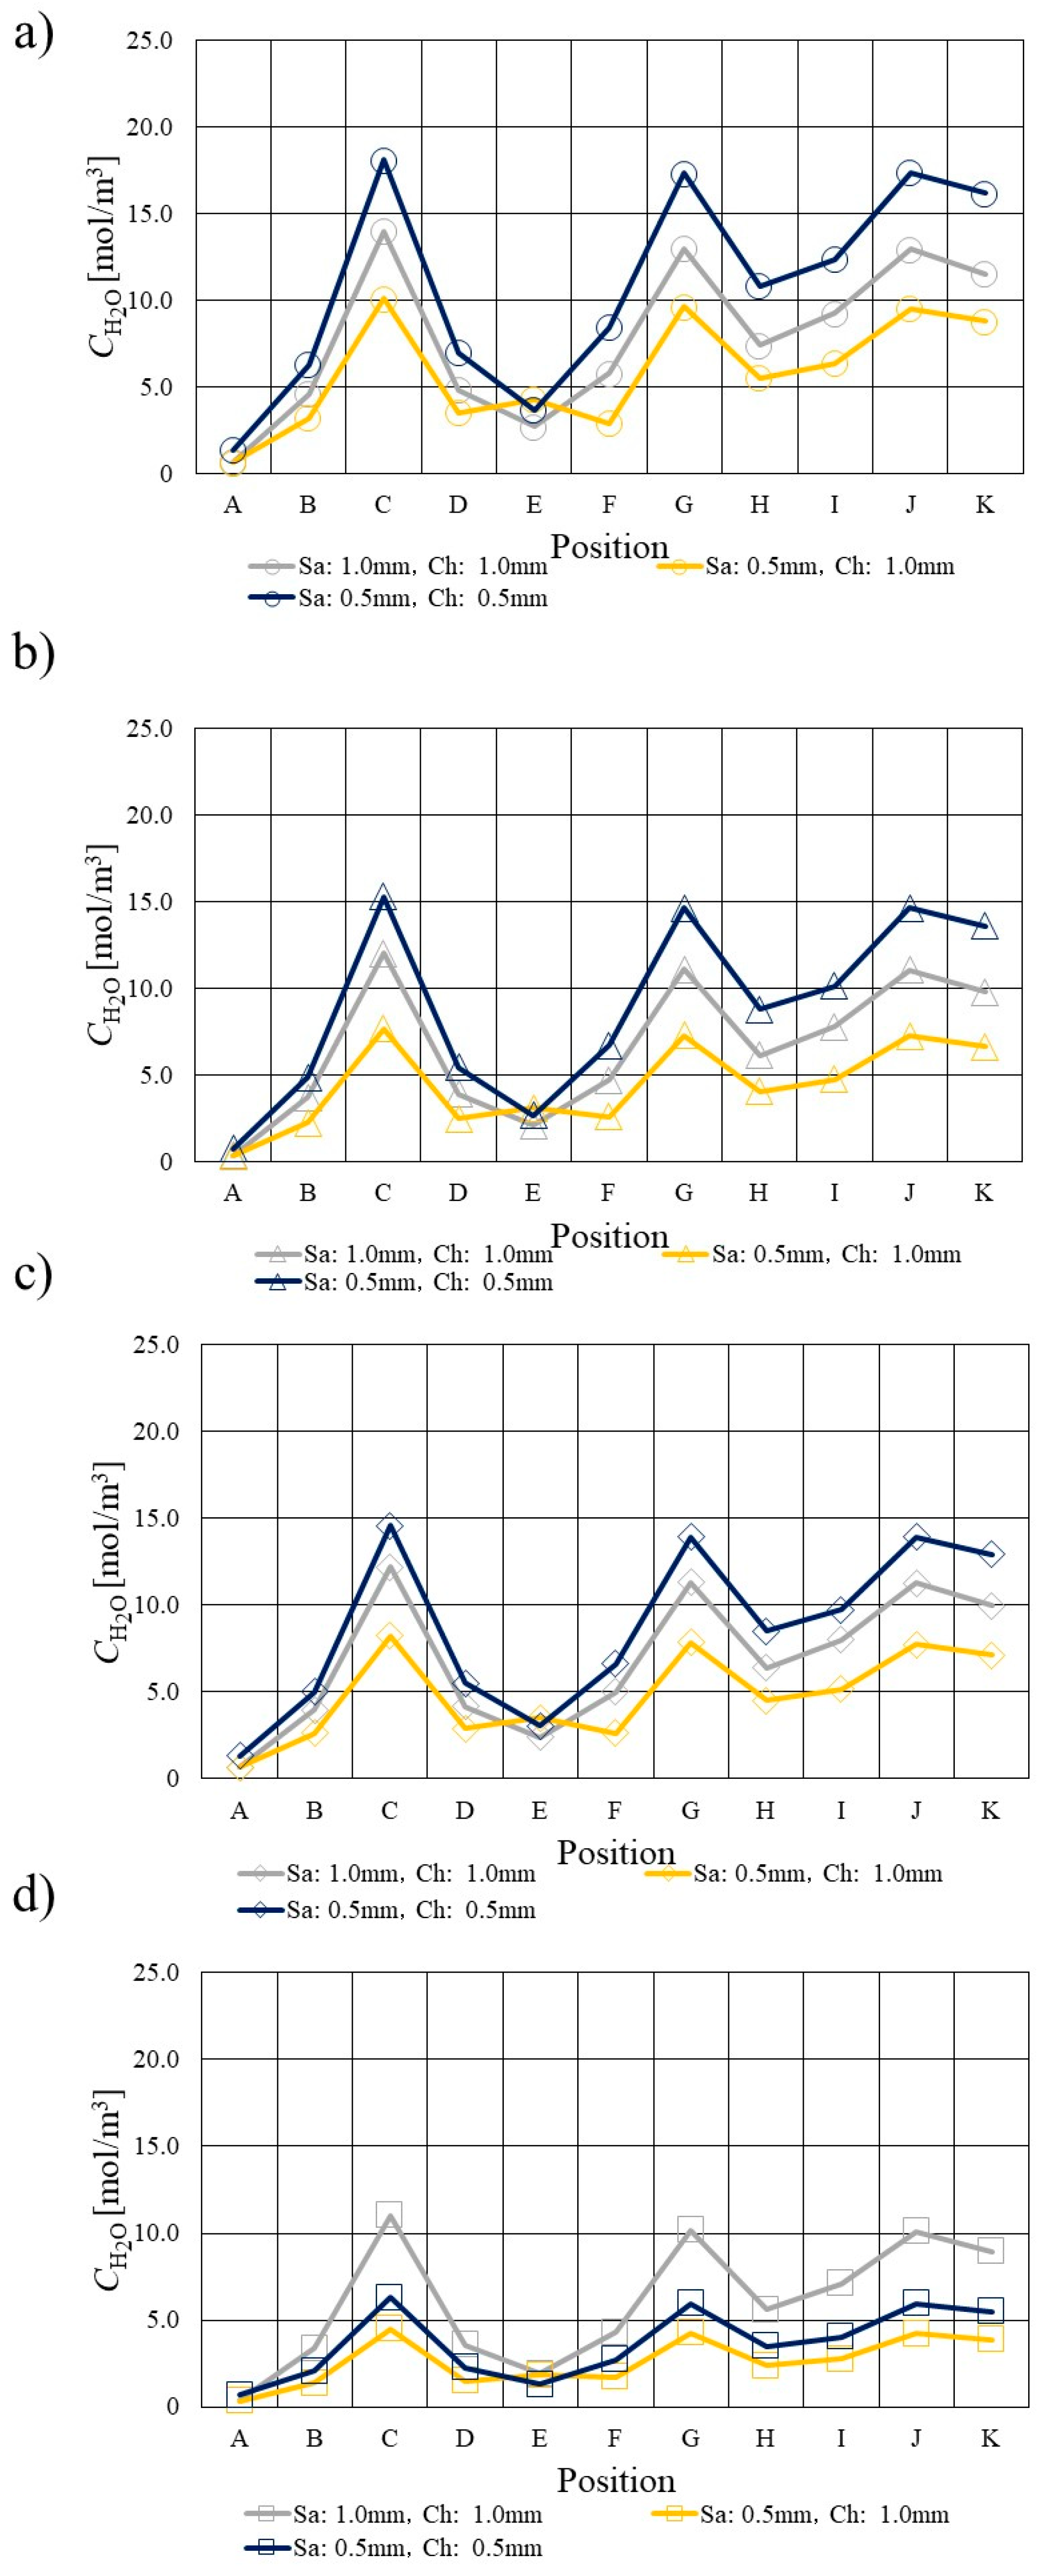
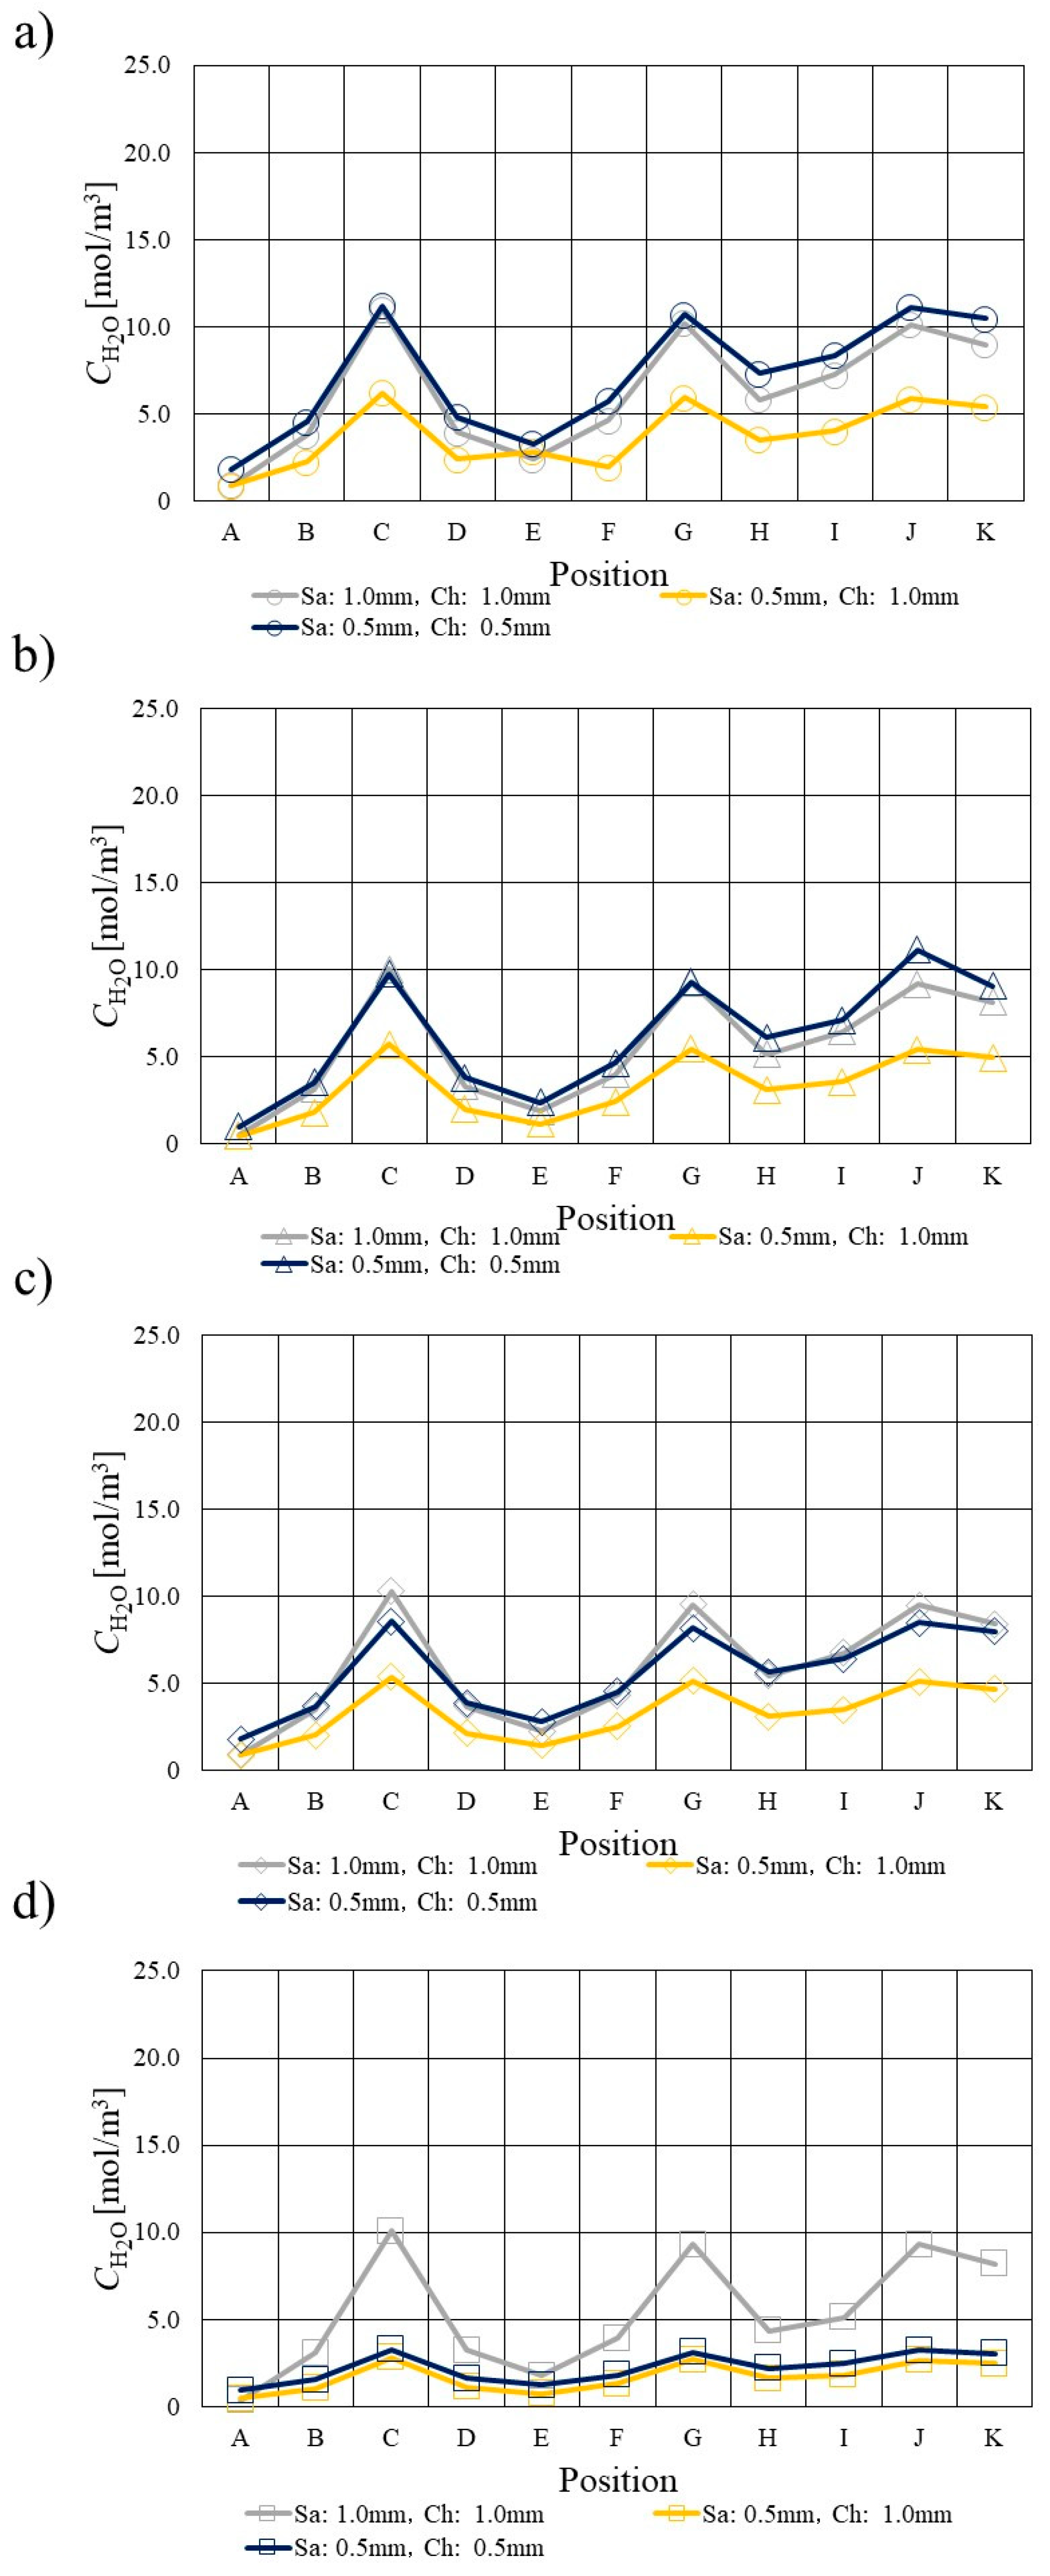
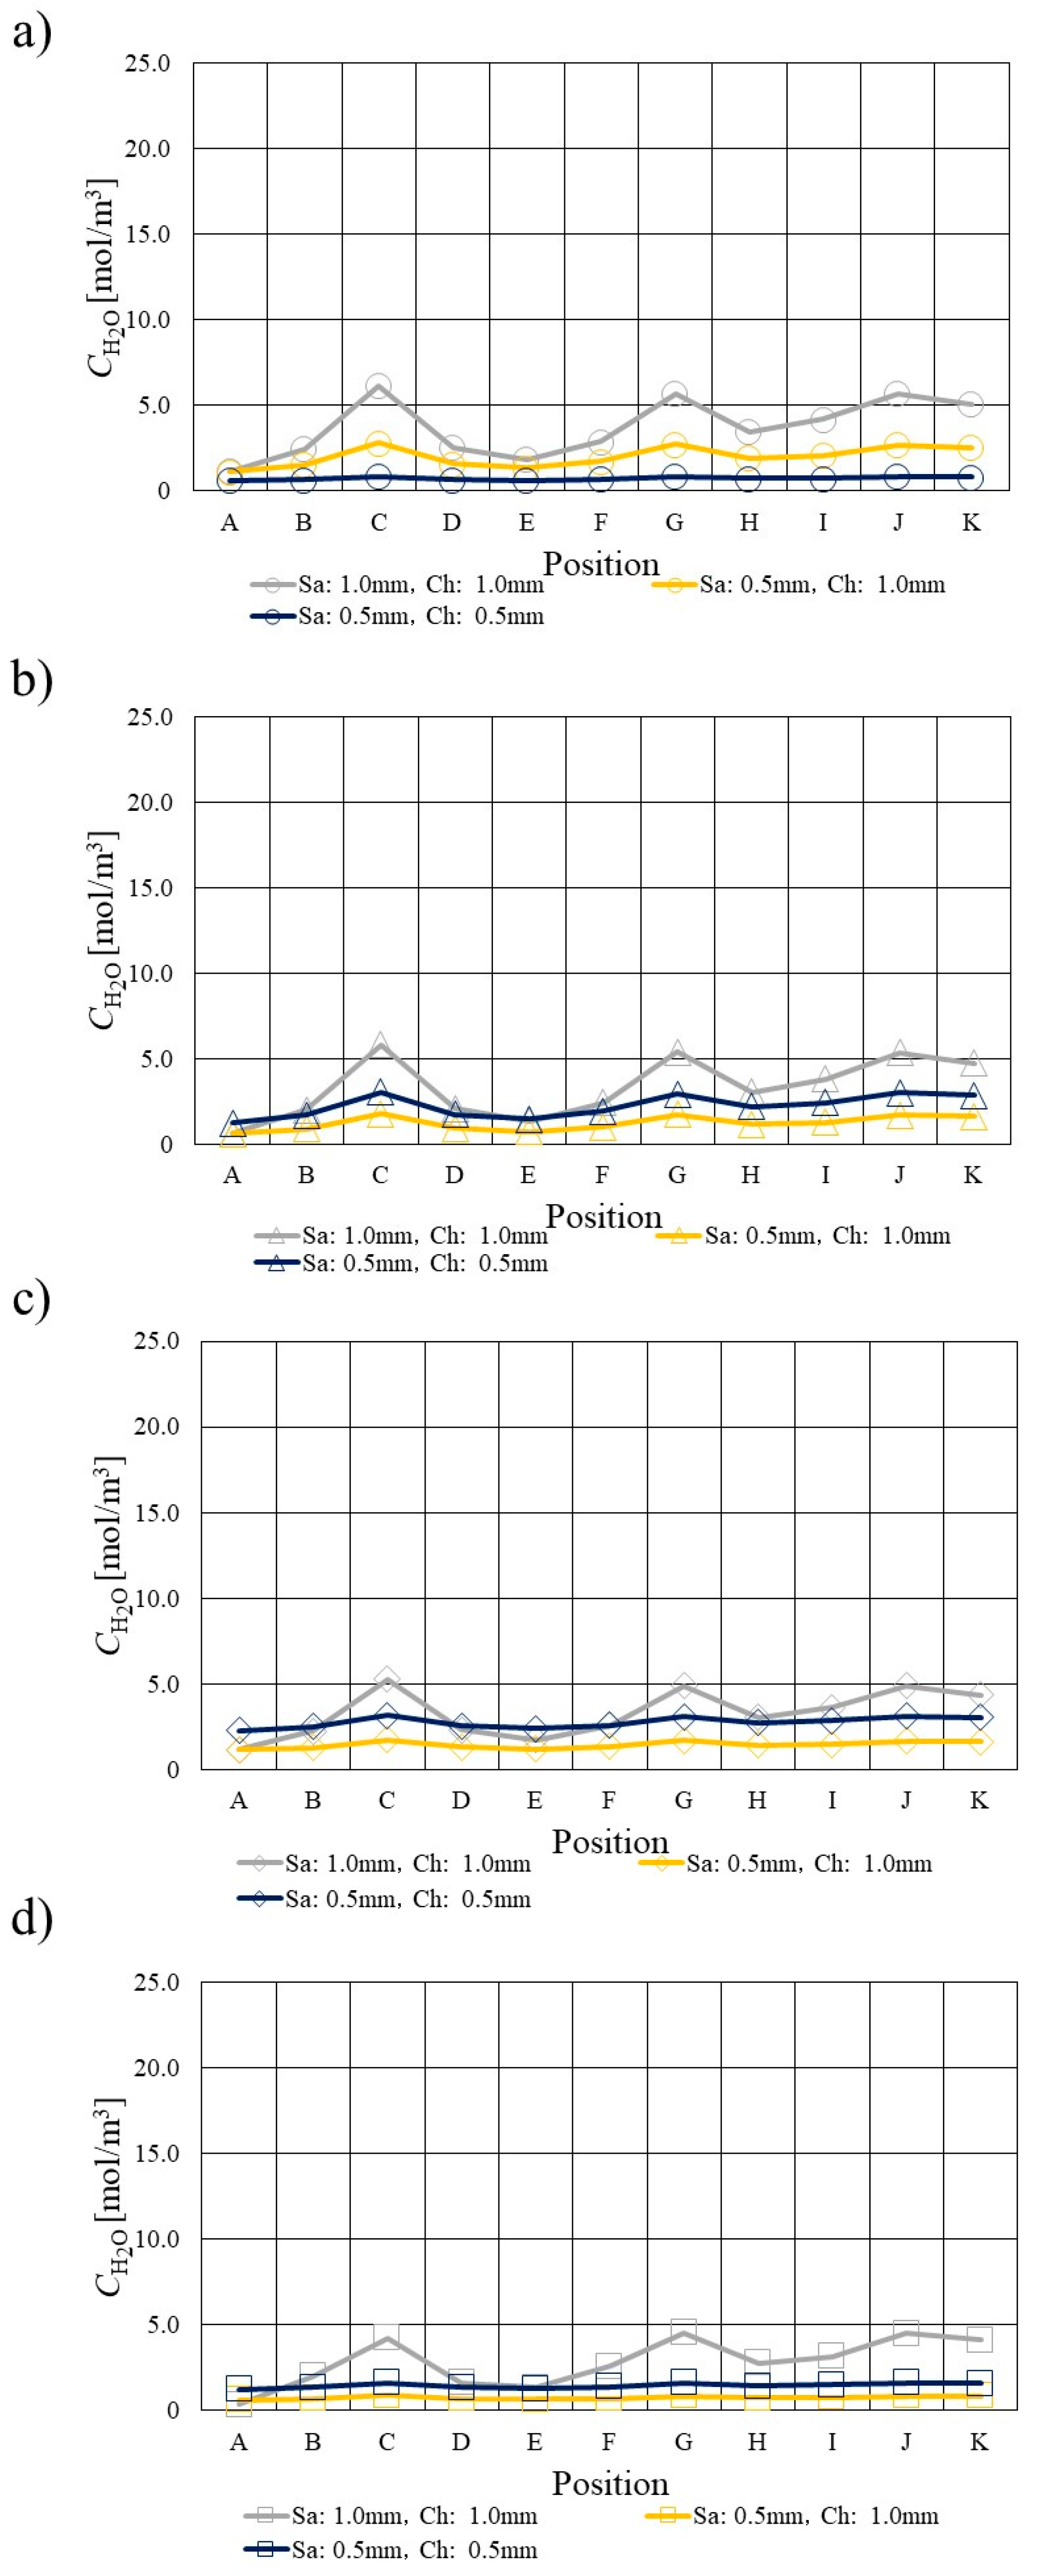
Figure 8, Figure 9 and Figure 10 show H2O profiles calculated using 3D numerical simulation model at Tini = 353 K, 363 K and 373 K, respectively. The impact of separator thickness on H2O profile is investigated. Moreover, RH of supply gases is also changed.
It is seen from Figure 8, Figure 9 and Figure 10 that the increase in the molar concentration of H2O (CH2O) from the inlet of cell to the outlet of cell becomes smaller with the increase in Tini and the decrease in RH of supply gas irrespective of separator thickness. It is considered that H2O remaining in gas flowing through the gas channel accumulates along the gas flow [45,46]. It is known that the saturation pressure of H2O increases with the temperature exponentially [41], resulting in easy dehydration of PEM at higher temperature than usual. The proton conductivity of PEM reduces under higher temperature and low RH conditions due to the dehydration of PEM [43], causing larger ohmic over-potential. On the other hand, the ionomer in the catalyst layer at the cathode side is not easy to be humidified by H2O migrated through PEM from the anode side to the cathode side. It is significant for the performance of O2 reduction reaction at the cathode side [12,41]. The big ohmic over-potential is provided due to ionic and electronic resistances. The ionic resistance is related with the resistance of PEM as well as the ionomer of catalyst layer [44]. Since the humidification is lower under higher temperature and low RH conditions, the performance of O2 reduction reaction generating H2O is smaller.
As to the impact of separator thickness, it is known from Figure 8, Figure 9 and Figure 10 that the molar concentration of H2O increases at analysis positions of C, G and J when the separator thickness is 2.0 mm, especially at Tini = 353 K and for A80%RH-C80%RH, which matches approximately the points of the temperature drop shown in Figure 2, Figure 3 and Figure 4. The heat capacity of the separator thickness of 2.0 mm is the biggest among the separators investigated in this study, resulting that the dry up of PEM and catalyst layer would be lower compared to the thinner separator thicknesses [12]. In addition, the humidification of PEM and catalyst layer is larger for A80%RH-C80%RH. Consequently, the O2 reduction reaction generating H2O is improved with the increase in the separator thickness and RH of supply gas. The analysis points of C and G are located at the corner parts of the serpentine separator. Therefore, it is thought H2O may accumulate there [45,46]. Additionally, we can claim that H2O remaining in gas flowing through the gas channel accumulates near the outlet of cell [9,47], i.e. the analysis points of J and K. Consequently, the molar concentration of H2O rises at the analysis points of C, G and J. As a result, the O2 diffusion is inhibited, the O2 reduction reaction is not carried out well there. Consequently, the heat generated by O2 reduction reaction decreases at the analysis points of C, G and J, causing the temperature drop. The impacts of separator thickness as discussed above become larger under higher temperature and lower RH conditions, which are thought to be easy dehydration conditions.
From this study, the saturation is below 1.0 under the investigated conditions, resulting that it can be thought the phase condition of H2O is vapor. Therefore, the assumption that H2O is a vapor is valid in this study.

3.4. Comparison of Current Density Profile

Figure 11, Figure 12 and Figure 13 show current density profiles calculated using 3D numerical simulation model at Tini = 353 K, 363 K and 373 K, respectively. The impact of separator thickness on current density profile is investigated. Furthermore, RH of supply gases is also changed.
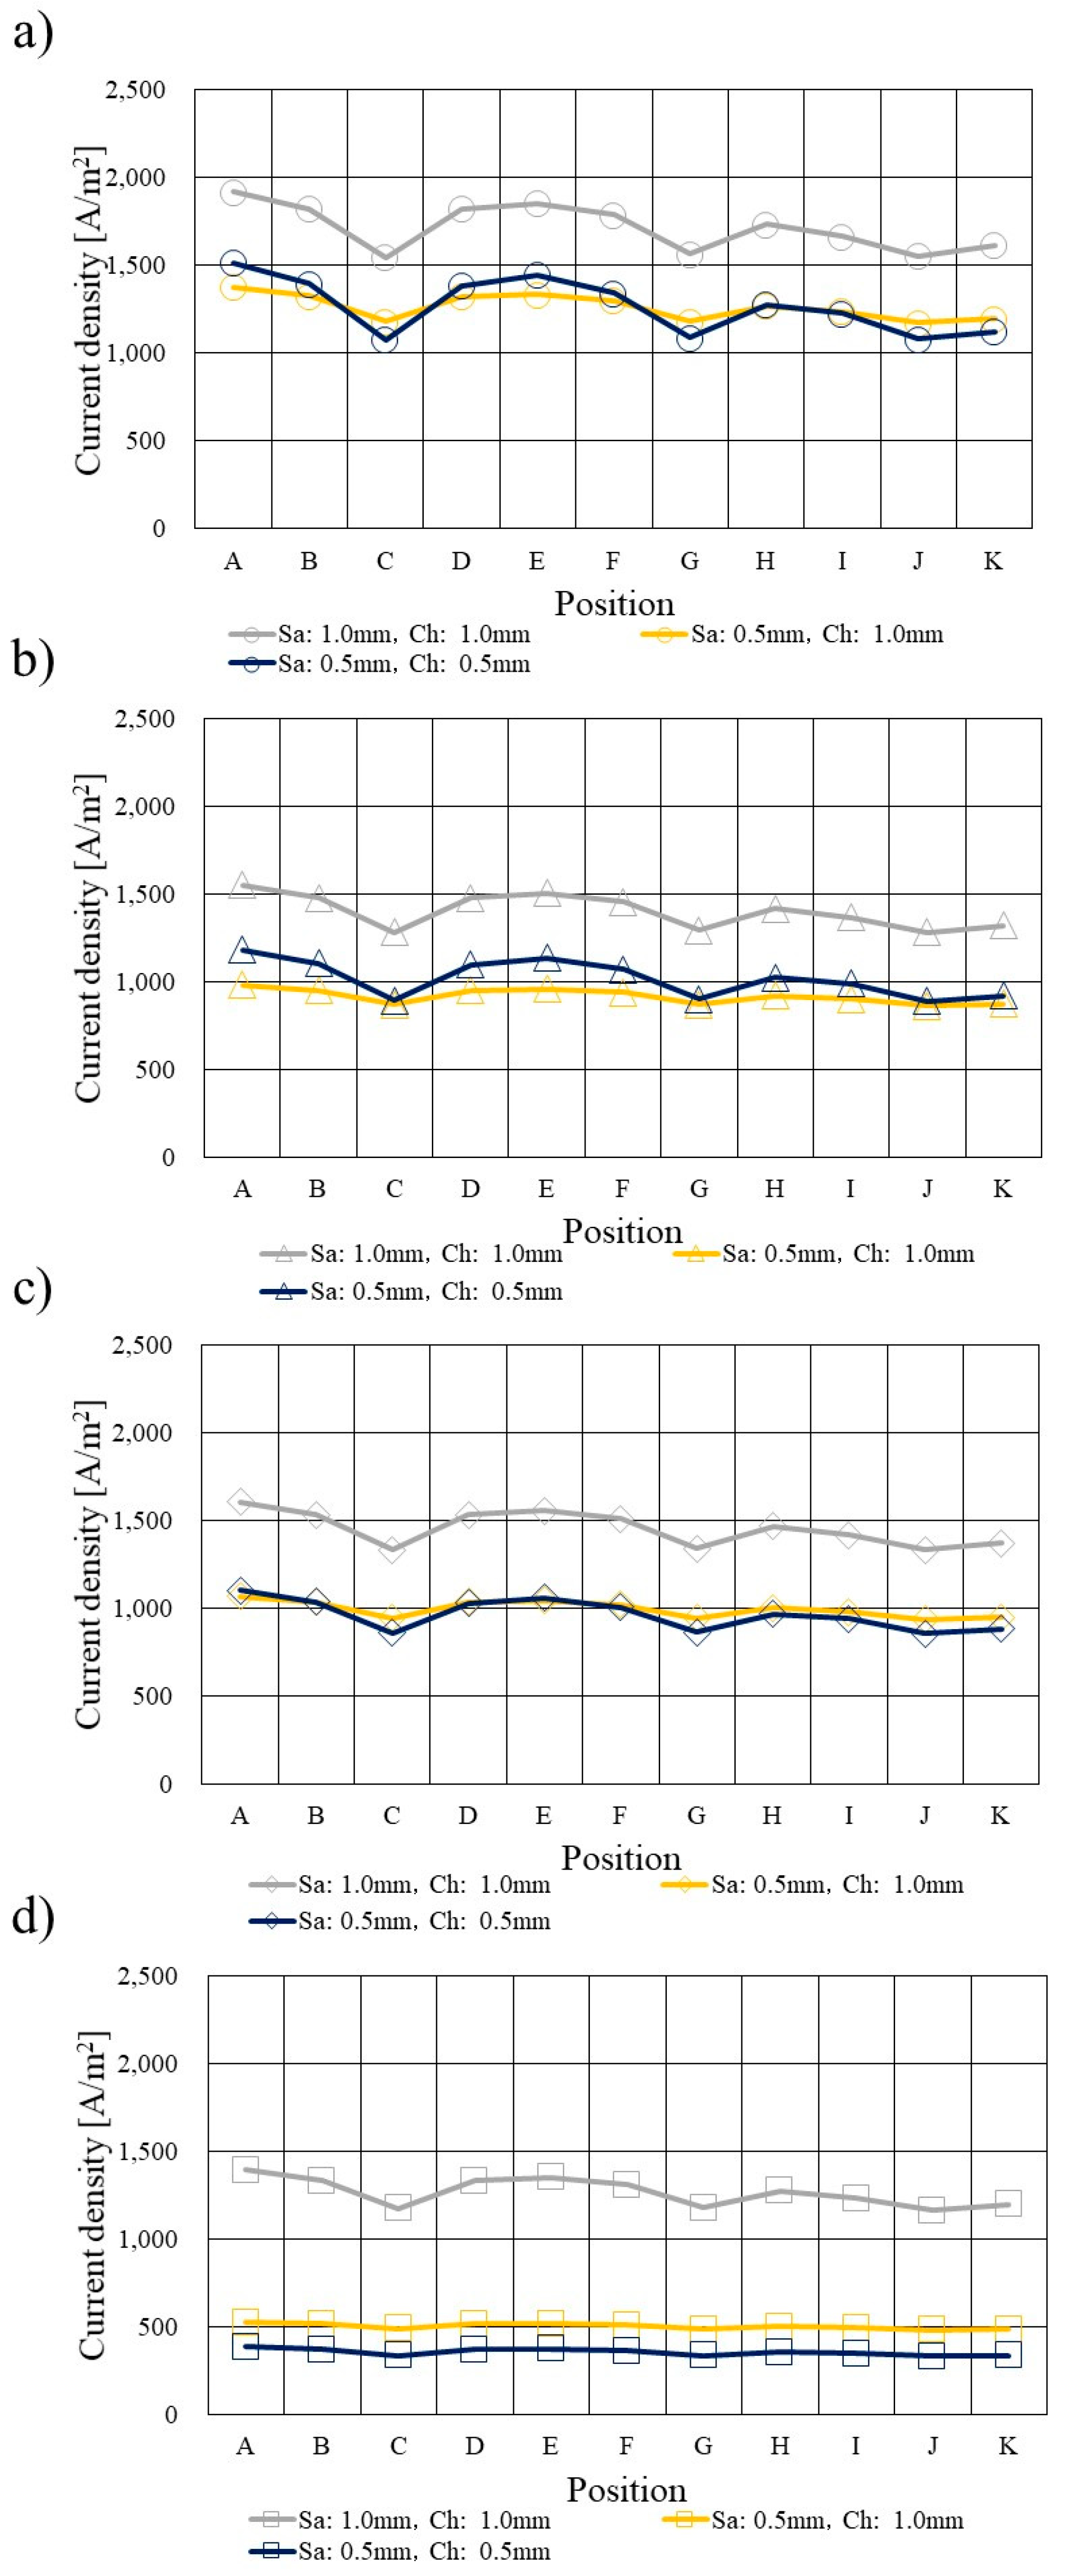
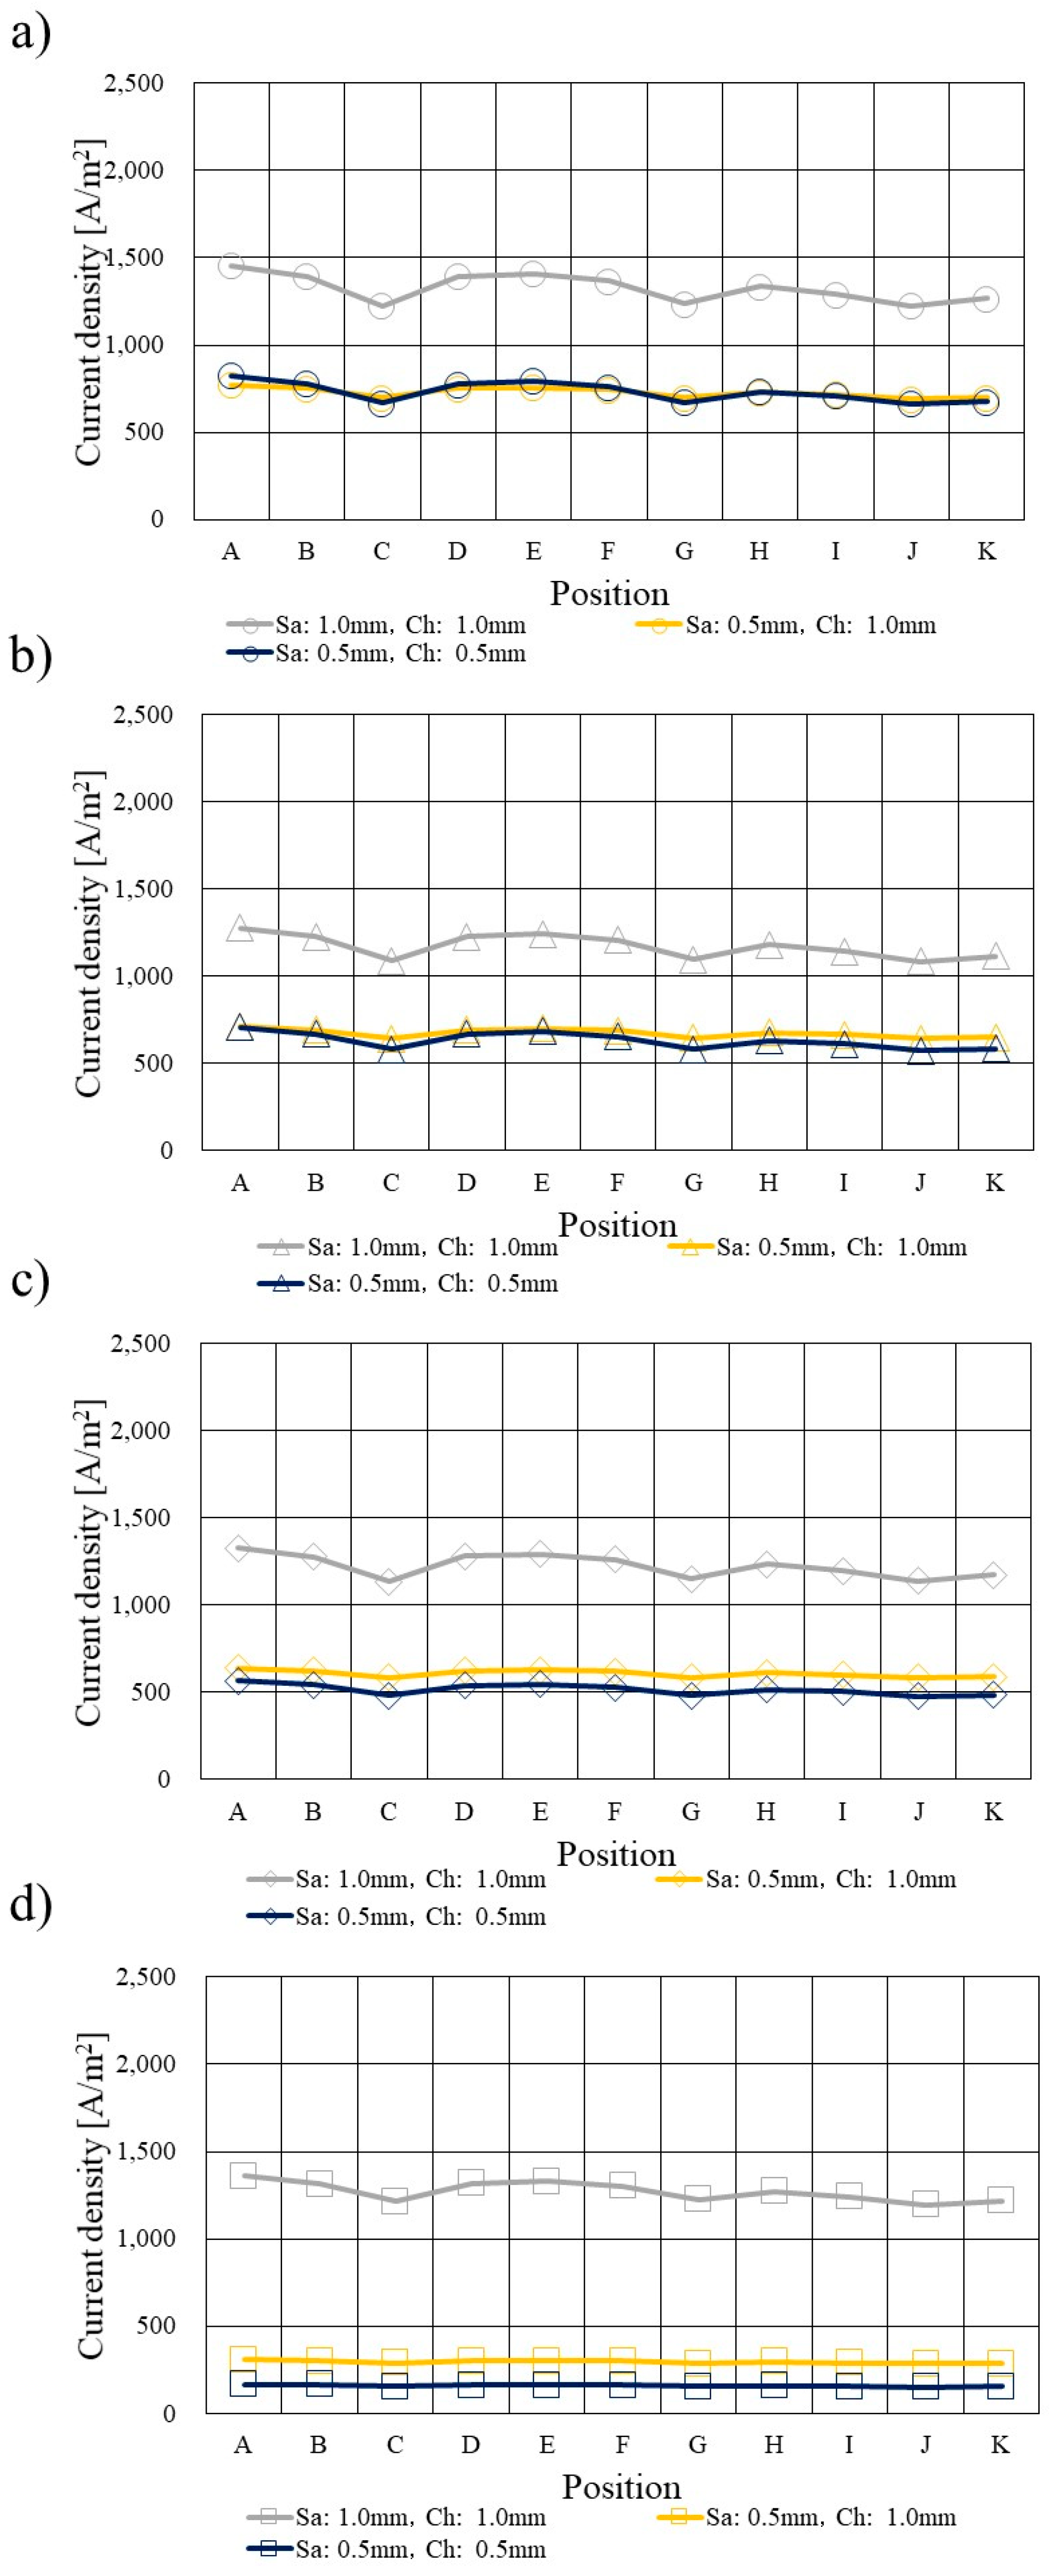
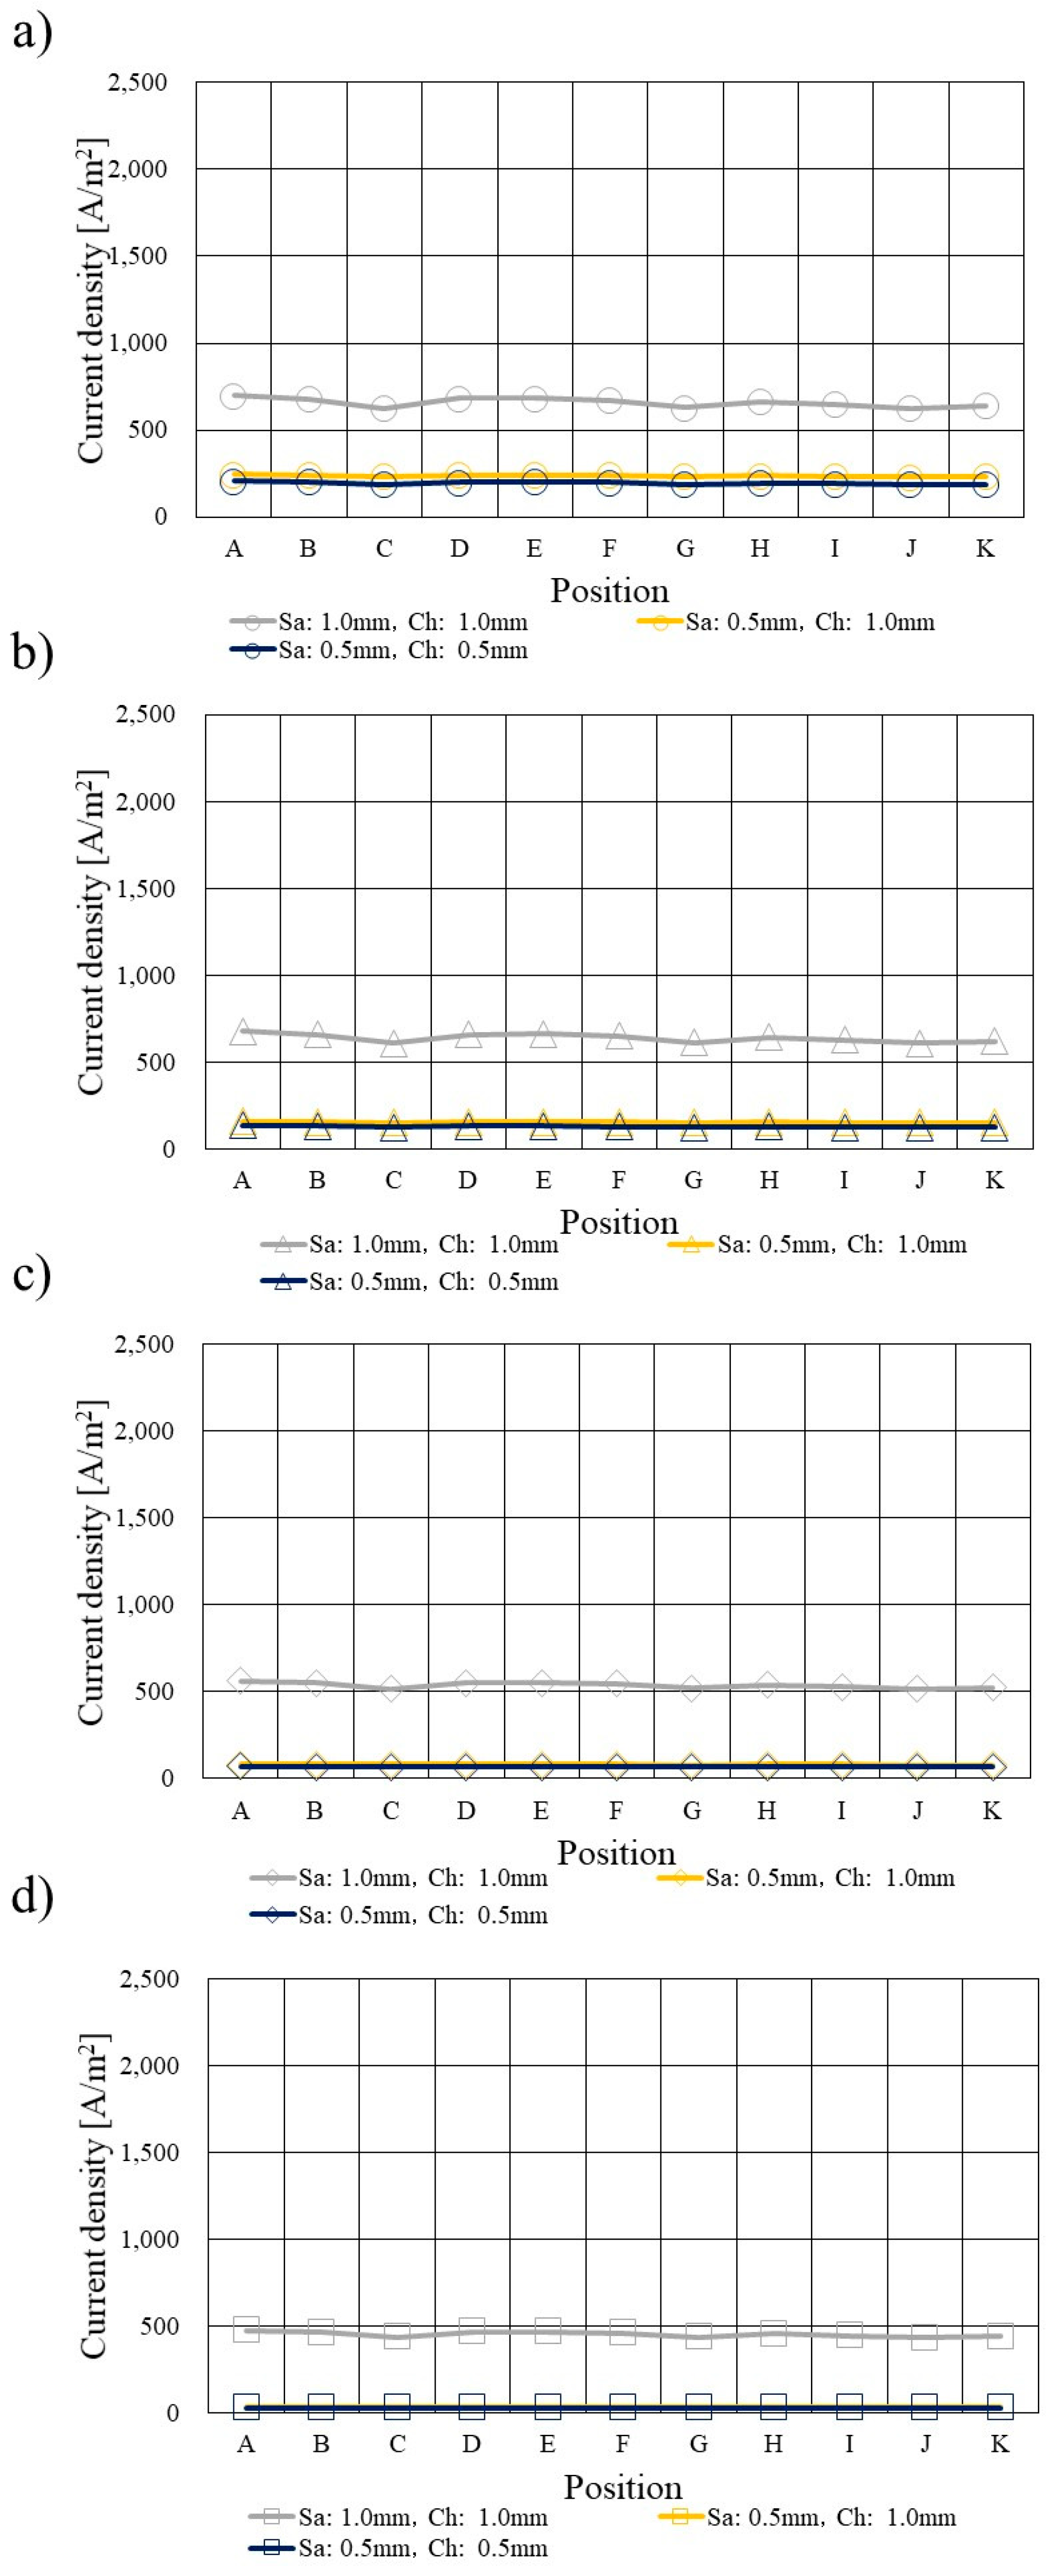
It can be found from Figure 11, Figure 12 and Figure 13 that the current density drops with the increase in Tini and the decrease in RH of supply gas irrespective of separator thickness. It is known that the saturation pressure of H2O increases with the temperature exponentially [41] as described above, resulting in easy dehydration of PEM at higher temperature than usual. The proton conductivity of PEM reduces under higher temperature and low RH conditions since PEM is dehydrated [43]. Therefore, the ohmic over-potential becomes larger. On the other hand, the ionomer in the catalyst layer at the cathode side is not easy to be humidified by H2O migrated through PEM from the anode side to the cathode side, which is significant for the performance of O2 reduction reaction at the cathode side [12,41]. The big ohmic over-potential is provided due to ionic and electronic resistances. The ionic resistance is related with the resistance of PEM as well as the ionomer of catalyst layer [44]. Therefore, the current density reduces with the increase in Tini and the decrease in RH of supply gas due to lower humidification.
According to Figure 11, Figure 12 and Figure 13, the current density drops from the inlet of cell to the outlet of cell. H2 and O2 are consumed along with the gas channel, resulting that the driving force for the diffusion toward the catalyst layer reduces along with the gas channel. As a result, the current density reduces from the inlet of cell to the outlet of cell.
Regarding the impact of separator thickness, it can be found from Figure 11, Figure 12 and Figure 13 that the current density drops at analysis positions of C, G and J when the separator thickness is 2.0 mm, especially at Tini = 353 K and for A80%RH-C80%RH, which matches approximately the points of the temperature drop shown in Figure 2, Figure 3 and Figure 4. The heat capacity of the separator thickness of 2.0 mm is the biggest among the separators investigated in this study. Therefore, the humidification of PEM and catalyst layer would be lower compared to the thinner separator thicknesses [12]. Additionally, the humidification of PEM and catalyst layer is larger for A80%RH-C80%RH. Consequently, the O2 reduction, which generates H2O, is improved with the increase in the separator thickness and RH of supply gas. The analysis points of C and G are located at the corner parts of the serpentine separator. Therefore, H2O may accumulate there [45,46]. Moreover, it is considered that H2O remaining in gas flowing through the gas channel accumulates near the outlet of cell [9,47], i.e. the analysis points of J and K, resulting in the increase in the molar concentration of H2O at the analysis points of C, G and J. As a result, the O2 diffusion is inhibited, causing that the O2 reduction reaction is not carried out well there. We can also claim that the concentration over-potential is larger there. Consequently, the current density drops at the analysis points of C, G and J, causing the temperature drops shown in Figure 2, Figure 3 and Figure 4. The impacts of separator thickness as discussed above become larger under higher temperature and lower RH conditions, which are thought to be easy dehydration conditions.
From the current study, the optimum separator thickness is 2.0 mm to realize higher power generation performance. However, the optimum separator thickness for HT-PEMFC depends on the thermal design. If a separator could be designed, which could remove the generated heat smoothly, the separator thickness would be thinner. Since the weight ratio of separator to that of total cell is approximately 80 % [21], the thinner separator is desirable. This may be the direction for future work on this topic.

4. Conclusions

We have examined the impact of separator thickness on the relationship between the temperature profile and not only the current density profile but also the profiles of gases, e.g. O2 and H2O. The numerical simulation by CFD software COMSOL Multiphysics has been carried out. In the study, the operation temperature was set at 353 K, 363 K and 373 K respectively to compare the characteristics of HT-PEMFC with that of general PEMFC. The following conclusions which have been obtained from the study include:
(i) The increase in temperature on the interface between PEM and catalyst layer at the cathode side from the inlet of cell to the outlet of cell was smaller with the increase in Tini irrespective of RH of supply gas.
(ii) The temperature change from the inlet of cell to the outlet of cell in the case of Tini = 353 K or 363 K was larger for the separator thickness of 2.0 mm. Since the heat capacity when the separator thickness was 2.0 mm was the largest among the separators examined in this study, while the dry up of PEM and catalyst layer was lower compared to the thinner separator thicknesses. Since the O2 reduction reaction generating H2O was improved with the increase in the separator thickness, the heat generated by O2 reduction reaction increased. As a result, the temperature increased.
(iii) The decrease in the molar concentration of O2 from the inlet of cell to the outlet of cell was smaller with the increase in Tini and the decrease in RH of supply gas due to lower humidification.
(iv) The molar concentration of O2 dropped at analysis positions of C, G and J (and K) for the separator thickness of 2.0 mm, especially at Tini = 353 K and for A80%RH-C80%RH, matching approximately the points of the temperature drop. The effect of separator thickness on O2 distribution became larger under higher temperature and lower RH conditions.
(v) The increase in the molar concentration of H2O from the inlet of cell to the outlet of cell became smaller with the increase in Tini and the decrease in RH of supply gas irrespective of separator thickness.
(vi) The molar concentration of H2O increased at analysis positions of C, G and J for the separator thickness of 2.0 mm, especially at Tini = 353 K as well as for A80%RH-C80%RH, matching approximately the points of the temperature drop. The impact of separator thickness on H2O profile became larger under higher temperature and lower RH conditions.
(vii) The current density decreased with the increase in Tini and the decrease in RH of supply gas irrespective of separator thickness.
(viii) The current density decreased at analysis positions of C, G and J in for the separator thickness of 2.0 mm, especially at Tini = 353 K and for A80%RH-C80%RH, matching approximately the analysis points of the temperature drop. The impact of separator thickness on current profile became larger under higher temperature and lower RH conditions.
(ix) The optimum separator thickness was 2.0 mm to realize higher power generation performance. If a separator which could remove the generated heat smoothly could be made, the separator thickness could be thinner.

Author Contributions

Conceptualization and writing — original draft preparation, A.N.; methodology and software, D.M. and T.K.; data curation, S.I.; writing—review and editing, E.H. All authors have read and agreed to the published version of the manuscript.

Funding

This work was funded by Mie University.

Data Availability Statement

Not applicable.

Conflicts of Interest

The authors declare no conflict of interest.

References

  1. NEDO (New Energy and Industry Technology Development Organization). Available online: http://www.nedo.go.jp/cotent/100871973 (in Japanese; accessed on 2, October, 2023).
  2. Zhang, G.; Kandlikar, S. G. A. Critical Review of Cooling Technique in Proton Exchange Membrane Fuel Cell Stacks. Int. J. Hydrogen Energy 2012, 37, 2412-2429.
  3. Agbossou, K.; Kolhe, M.; Hamelin, J.; Bose, T. K. Performance of a Stand-Alone Renewable Energy System Based on Energy Storage as Hydrogen. IEEE Transactions on Energy Conversion 2004, 19, 633-640.
  4. Zhang, J.; Zhang, C.; Hao D.; Ni M.; Huang S.; Liu D.; Zheng, Y. 3D Non-isothermal Dynamic Simulation of High Temperature Proton Exchange Membrane Fuel Cell in Start-up Process. International Journal of Hydrogen Energy 2021, 46, 2577-2593.
  5. Li, Q.; He, R.; Jensen, J. O.; Bjerrum, N. J. Approaches and Recent Development Polymer Electrolyte Membrane for Fuel Cells Operating above 100 ℃. Chemistry of Materials 2003, 15, 4896-4915.
  6. Lee, C. Y.; Wng, F.; Kuo, Y. W.; Tsai, C. H.; Cheng, Y. T.; Cheng, C. K.; Lin, J. T. In-situ Measurement of High-temperature Proton Exchange Membrane Fuel Cell Stack Using Flexible Five-in-one Micro Sensor. Sensors 2016, 16. [CrossRef]
  7. Nishimura, A.; Sato, A.; Yoshimura, M.; Kamiya, S.; Hirota, M. Impact of Thickness of Polymer Electrolyte Membrane on Temperature Distribution in Single Cell of Polymer Electrolyte Fuel Cell Operated at High Temperature. J. Energy Power Eng. 2018, 12, 80–92.
  8. Nishimura, A.; Kamiya, S.; Okado, T.; Sato, Y.; Hirota, M.; Kolhe, M.L. Heat and Mass Transfer Analysis in Single Cell of PEFC Using Different PEM and GDL at Higher Temperature. Int. J. Hydrog. Energy 2019, 44, 29631–29640.
  9. Nishimura, A.; Okado, T.; Kojima, Y.; Hirota, M.; Hu, E. Impact of MPL on Temperature Distribution in Single Polymer Fuel Cell with Various Thickness of Polymer Electrolyte Membrane. energies 2020, 13, 10, jttps://doi.10.3390/en13102499.
  10. Nishimura, A.; Yamamoto, K.; Okado, T.; Kojima, Y.; Hirota, M.; Kolhe, M.L. Impact Analysis of MPL and PEM Thickness on Temperature Distribution within PEFC Operating at Relatively Higher Temperature. Energy 2020, 205, 117875. [CrossRef]
  11. Nishimura, A.; Toyoda, K.; Kojima, Y.; Ito, S.; Hu, E. Numerical Simulation on Impacts of Thickness of Nafion Series Membranes and Relative Humidity on PEMFC Operated at 363 K and 373 K. Energies 2021, 14, 8256. [CrossRef]
  12. Nishimura, A.; Mishima, D.; Toyoda, K.; Ito, S.; Kolhe, L. M. Numerical Simulation on Effect of Separator Thickness on Coupling Phenomena in Single Cell of PEFC under Higher Temperature Operation Condition at 363 K and 373 K. Energies 2023, 16, 606. [CrossRef]
  13. Nishimura, A.; Kojima, Y.; Ito, S.; Hu, E. Impacts of Separator Thickness on Temperature Distribution and Power Generation Characteristics of a Single PEMFC Operated at Higher Temperature of 363 and 373 K. Energies 2022, 15, 1558. [CrossRef]
  14. Agarwal, H.; Thosar, U. A.; Bhat, D. S.; Lele, K. A. Interdigitated Flow Filed Impact on Mass Transport and Electrochemical Reaction in High-temperature Polymer Electrolyte Fuel Cell. Journal of Power Sources 2022, 532, 231319. [CrossRef]
  15. Cai, L.; Zhang, J.; Zhang, C.; Zhou, J.; Zeng, T.; Yi, F.; Hu, D.; Zhang, X. Numerical Investigation of Enhanced Mass Transfer Flow Field on Performance Improvement of High-temperature Proton Exchange Membrane Fuel Cell. Fuel Cells 2023, 23, 251-263.
  16. Hazar, H.; Yilmaz, M.; Sevinc, H. A Comparative Analysis of a Novel Flow Filed Pattern with Different Channel Size Configurations. Fuel 2022, 319, 123867. [CrossRef]
  17. Zuo, Q.; Li, Q.; Chen, W.; Peng, R.; Zhu, X.; Xie, Y.; Tang, Y.; Shen, Z.; Yang, X. Optimization of Blocked Field Performance of Proton Exchange Membrane Fuel Cell with Auxiliary Channels. Int. J. Hydrog. Energy 2022, 47, 39943-39960.
  18. Yan, F.; Pei, X.; Yao, J. Numerical Simulation of Performance Improvement of PEMFC by Four-serpentine Wave Flow Field. Ionics 2023, 29, 695-709.
  19. Yu, D.; Yu, S. Analysis of Flow Variation in a Straight Channel with Baffled Obstacles on a Bipolar Plate in a Proton-exchange Membrane Fuel Cell. International Journal of Automotive Technology 2023, 24, 3, 759-771.
  20. Yu, X.; Luo, X.; Tu, Z. Development of a Compact High-power Density Air-cooled Proton Exchange Membrane Fuel Cell Stack with Ultrathin Bipolar Plates. Energy 2023, 270, 126936. [CrossRef]
  21. Kahraman, H.; Orhan, M. F. Flow Filed Bipolar Plate in a Proton Exchange Membrane Fuel Cell: Analysis & Modeling. Energy Conversion and Management 2017, 133, 363-384.
  22. Han, Y.; Zhuge, W.; Peng, J.; Qian, Y.; Ming, P.; Zhang, Y. A Novel Heat Pipe Bipolar Plate for Proton Exchange Membrane Fuel Cells. Energy Conversion and Management 2023, 284, 116945. [CrossRef]
  23. Kanchan, B.K.; Randive, P.; Pati, S. Implications of Non-uniform Porosity Distribution in Gas Diffusion Layer on the Performance of a High Temperature PEM Fuel Cell. Int. J. Hydrog. Energy 2021, 46, 18571–18588.
  24. Das, S.K.; Gibson, H.A. These Dimensional Multi-Physics Modeling and Simulation for Assessment of Mass Transport Impact on the Performance of a High Temperature Polymer Electrolyte Membrane Fuel Cell. J. Power Sources 2021, 499, 161–188.
  25. Panesi, A.R.Q.; Silva, R.P.; Cunha, E.F.; Korkischko, I.; Santiago, E.I. Three-dimensional CFD Modeling of H2/O2 HT-PEMFC Based on H3PO4-doped PBI Membranes. Ionics 2021, 27, 3461–3475.
  26. Penga, Z.; Tolj, I.; Barbir, F. Computational Fluid Dynamics Study of PEM Fuel Cell Performance. Int. J. Hydrog. Energy 2016, 41, 17585–17594.
  27. Copper, N.J.; Santamaria, A.D.; Becton, M.K.; Park, J.W. Neutron Radiography Measurements of In-situ PEMFC Liquid Water Saturation in 2D & 3D Morphology Gas Diffusion Layers. Int. J. Hydrog. Energy 2017, 42, 16269–16278.
  28. The Japan Society of Mechanical Engineers. JSME Heat Transfer Handbook, 1st ed.; The Japan Society of Mechanical Engineers; Maruzen: Tokyo, Japan, 1993; p. 387.
  29. Freunberger, S.A.; Reum, M.; Evertz, J.; Wokuan, A.; Buchi, F.M. Measuring the Current Distribution in PEFCs with Sub-Millimeter Resolution. J. Electrochem. Soc. 2006, 153, A2158–A2165.
  30. Nishimura, A.; Shibuya, K.; Morimoto, A.; Tanaka, S.; Hirota, M.; Nakamura, M.; Kojima, Y.; Narita, M.; Hu, E. Dominant Factor and Mechanism of Coupling Phenomena in Single Cell of Polymer Electrolyte Fuel Cell. Appl. Energy 2012, 1, 73–79.
  31. Xia, L.; Ni, M.; He, Q.; Xu, Q.; Cheng, C. Optimization of Gas Diffusion Layer in High Temperature PEMFC with the Focuses on Thickness and Porosity. Appl. Energy 2021, 300, 117357. [CrossRef]
  32. TORAY. Available online: http://www.cf-composites.toray/ja/resources/data_sheets/ (assessed on 4 October 2023).
  33. Kang, K.; Ju, H. Numerical Modeling and Analysis of Micro-porous Layer Effects in Polymer Electrolyte Fuel Cells. J. Power Sources 2006, 194, 763–773.
  34. Bit Tech. Product Catalog; Bit Tech.: Gosyogawara, Japan, 2008; p. 1.
  35. Reid, R.C.; Prausnitz, J.M.; Poling, B.E. The Properties of Gases and Liquids, 1st ed.; McGraw-Hill: New York, NY, USA, 1987; p. 591.
  36. Merck. Available online: http://www.sigmaaldrich.com/japan/materialscience/alternative/nafion.html (assessed on 4 October 2023).
  37. Senn, S.M.; Poulikakos, D. Polymer Electrolyte Fuel Cells with Porous Materials as Fluid Distributors and Comparisons with Traditional Channeled Systems. Trans. ASME 2004, 126, 410–418.
  38. Takayama, T. Numerical Simulation of Transient Internal States of PEFC Cell and Stack Considering Control of Anode System. Res. Rep. Mizuho Res. Technol. 2018, 9, 1–14.
  39. Rostami, L.; Nejad, P.M.G.; Vatani, A. A Numerical Investigation of Serpentine Flow Channel with Different Bend Sizes in Polymer Electrolyte Membrane Fuel Cells. Energy 2016, 97, 400–410.
  40. Huang, Y.; Xiao, X.; Kang, H.; Lv, J.; Zeng, R.; Shen, J. Thermal Management of Polymer Electrolyte Membrane Fuel Cells: A Critical Review of Heat Transfer Mechanisms, Cooling Approaches, and Advanced Cooling Techniques Analysis. Energy Conversion and Management 2022, 254, 115221. [CrossRef]
  41. Xing, L.; Das, P. K.; Song, X.; Mamlouk, M.; Scott, K. Numerical Analysis of the Optimum Membrane/Ionomer Water Content of PEMFCs: The Interface of Nafion Ionomer Content and Cathode Relative Humidity. Applied Energy 2015, 138, 242-257.
  42. Nishimura, A.; Toyoda, K.; Mishima, D.; Hu, R. Numerical Analysis on Temperature Distribution in a Single Cell of PEFC Operated at Higher Temperature by 1D Heat Transfer Model and 3D Multi-physics Simulation Model. Energy and Power Engineering 2023, 15, 205-227.
  43. Nishimura, A.; Toyoda, K.; Mishima, D.; Ito, S.; Hu, E. Numerical Analysis on Impact of Thickness of PEM and GDL with and without MPL on Coupling Phenomena in PEFC Operated at Higher Temperature Such as 363 K and 373 K. Energies 2022, 15, 5936. [CrossRef]
  44. Salomov, U. R.; Chiavazzo, E.; Fasano, M.; Asinari, P. Pore- and Macro-scale Simulations of High Temperature Proton Exchange Fuel Cell Cells – HTPEMFC – and Possible Strategies for Enhancing Durability. Int. J. Hydrogen Energy 2017, 42, 26730-26743.
  45. Quan, P.; Lai, M. C. Numerical Study of Water Management in the Air Flow Channel of a PEM Fuel Cell Cathode. J. Power Sources 2007, 164, 222-237.
  46. Jiao, K.; Park, J.; Li, X. Experimental Investigation on Liquid Water Removal from the Gas Diffusion Layer by Reaction Flow in PEM Fuel Cell. Appl. Energy 2010, 87, 2770-2777.
  47. Nishimura, A.; Yoshimura, M.; Kamiya, S.; Hirota, M.; Hu, E. Impact of Relative Humidity of Supply Gas on Temperature Distribution in Single Cell of Polymer Electrolyte Fuel Cell when Operated at High Temperature. J. Energy Power Eng. 2017, 11, 706-718.
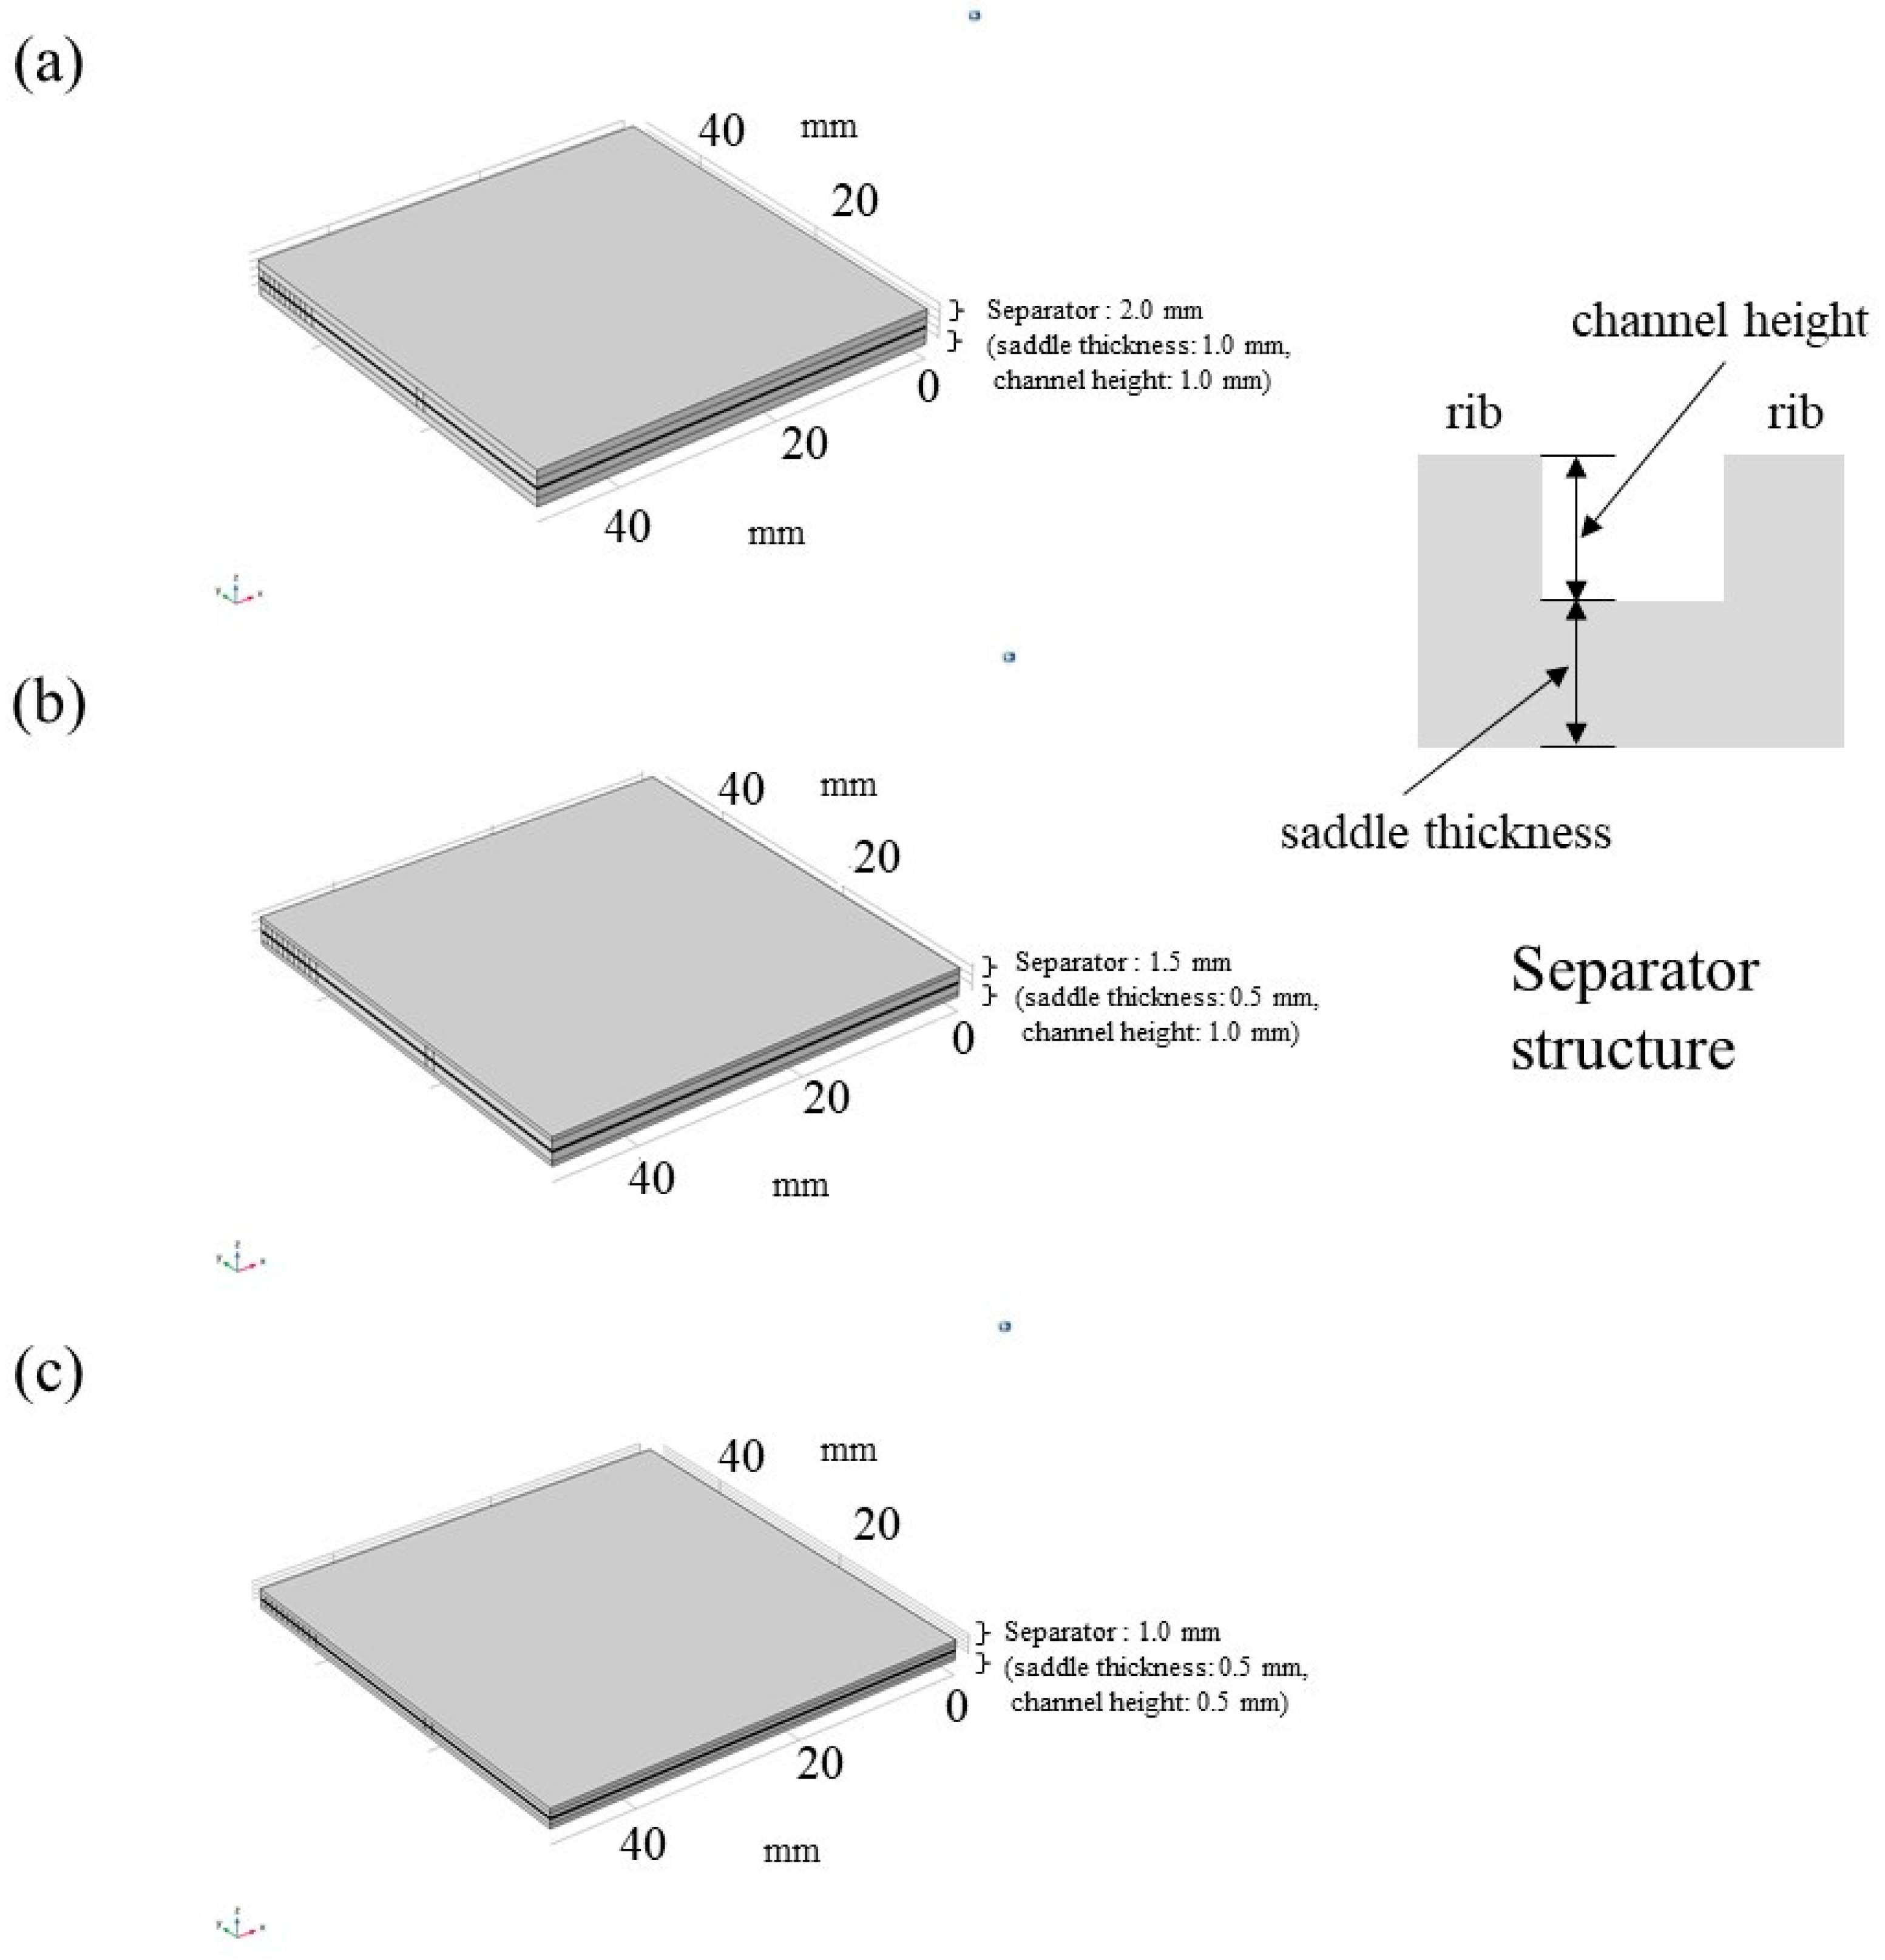
Figure 1. 3D model simulated for single HT-PEMFC.
Preprints 89343 g001
Figure 2. Comparison investigation on temperature profile among different separator thicknesses at Tini = 353 K (a): A80%RH-C80%RH, b): A80%RH-C40%RH, c): A40%RH-C80%RH, d): A40%RH-C40%RH).
Preprints 89343 g002
Figure 3. Comparison investigation on temperature profile among different separator thicknesses at Tini = 363 K (a): A80%RH-C80%RH, b): A80%RH-C40%RH, c): A40%RH-C80%RH, d): A40%RH-C40%RH).
Preprints 89343 g003
Figure 4. Comparison investigation on temperature profile among different separator thicknesses at Tini = 373 K (a): A80%RH-C80%RH, b): A80%RH-C40%RH, c): A40%RH-C80%RH, d): A40%RH-C40%RH).
Preprints 89343 g004
Figure 5. Comparison investigation on O2 profile among different separator thicknesses at Tini = 353 K (a): A80%RH-C80%RH, b): A80%RH-C40%RH, c): A40%RH-C80%RH, d): A40%RH-C40%RH).
Preprints 89343 g005
Figure 6. Comparison investigation on O2 profile among different separator thicknesses at Tini = 363 K (a): A80%RH-C80%RH, b): A80%RH-C40%RH, c): A40%RH-C80%RH, d): A40%RH-C40%RH).
Preprints 89343 g006
Figure 7. Comparison investigation on O2 profile among different separator thicknesses at Tini = 373 K (a): A80%RH-C80%RH, b): A80%RH-C40%RH, c): A40%RH-C80%RH, d): A40%RH-C40%RH).
Preprints 89343 g007
Figure 8. Comparison investigation on H2O profile among various separator thicknesses at Tini = 353 K (a): A80%RH-C80%RH, b): A80%RH-C40%RH, c): A40%RH-C80%RH, d): A40%RH-C40%RH).
Preprints 89343 g008
Figure 9. Comparison investigation on H2O profile among various separator thicknesses at Tini = 363 K (a): A80%RH-C80%RH, b): A80%RH-C40%RH, c): A40%RH-C80%RH, d): A40%RH-C40%RH).
Preprints 89343 g009
Figure 10. Comparison investigation on H2O profile among various separator thicknesses at Tini = 373 K (a): A80%RH-C80%RH, b): A80%RH-C40%RH, c): A40%RH-C80%RH, d): A40%RH-C40%RH).
Preprints 89343 g010
Figure 11. Comparison investigation on current density profile among different separator thicknesses at Tini = 353 K (a): A80%RH-C80%RH, b): A80%RH-C40%RH, c): A40%RH-C80%RH, d): A40%RH-C40%RH).
Preprints 89343 g011
Figure 12. Comparison investigation on current density profile among different separator thicknesses at Tini = 363 K (a): A80%RH-C80%RH, b): A80%RH-C40%RH, c): A40%RH-C80%RH, d): A40%RH-C40%RH).
Preprints 89343 g012
Figure 13. Comparison investigation on current density profile among different separator thicknesses at Tini = 373 K (a): A80%RH-C80%RH, b): A80%RH-C40%RH, c): A40%RH-C80%RH, d): A40%RH-C40%RH).
Preprints 89343 g013
Table 1. Geometrical parameters for components of model simulating single HT-PEMFC. [7,10,14,27,28,29,30].
Components of single cell Each size [mm] Specification
PEM Width: 50.0,
Length: 50.0,
Depth: 0.025
Nafion NRE-211 (manufactured by Du Pont Corp.)
Catalyst layer Width: 50.0,
Length: 50.0,
Depth: 0.01
Pt/C
(Weight percentage of Pt: 20)
MPL Width: 50.0,
Length: 50.0,
Depth: 0.003
PTFE + carbon black
GDL Width: 50.0,
Length: 50.0,
Depth: 0.11
TGP-H-030 (produced by Toray Corp.)
Separator Width: 75.4,
Length: 75.4,
Depth: 2.0
(saddle thickness: 1.0, channel height: 1.0),
1.5 (saddle thickness: 0.5, channel height: 1.0),
1.0 (saddle thickness: 0.5, channel height: 0.5);
Width: 50.0,
Length: 50.0
(as to gas supply area)
Carbon graphite,
serpentine flow
Table 2. Physical parameters for gases, components of cell as well as electrochemical reactions.
Physical parameters Values
Gas density (H2) [kg/m3] 7.10×10⁻² (@ 353 K), 6.89×10⁻² (@ 363 K),
6.69×10⁻² (@ 373 K) [27]
Gas density (O2) [kg/m3] 1.11 (@ 353 K), 1.08 (@ 363 K), 1.05 (@ 373 K) [27]
Gas density (H2O) [kg/m3] 2.95×10⁻¹ (@ 353 K), 4.26×10⁻¹ (@ 363 K),
6.01×10⁻¹ (@ 373 K) [27]
Pressure of supply gas at inlet of cell (absolute based) (MPa) 0.4 [13]
Gas viscosity (H2) [Pa·s] 9.96×10⁻⁶ (@ 353 K), 1.02×10⁻⁵ (@ 363 K),
1.03×10⁻⁵ (@ 373 K) [27]
Gas viscosity (O2) [Pa·s] 2.35×10⁻⁵ (@ 353 K), 2.40×10⁻⁵ (@ 363 K),
2.45×10⁻⁵ (@ 373 K) [27]
Gas viscosity (H2O) [Pa·s] 1.16×10⁻⁵ (@ 353 K), 1.19×10⁻⁵ (@ 363 K),
1.23×10⁻⁵ (@ 373 K) [27]
Binary diffusion constant (H2 - H2O) [m2/s] 9.27×10⁻⁵ [28]
Binary diffusion constant (O2 - H2O) [m2/s] 3.57×10⁻⁵ [28]
Porosity (catalyst layer) [-] 0.78 [7,10,29,30,31]
Permeability (catalyst layer) [m2] 8.69×10⁻¹² [7,10,29,30,31]
Thermal conductivity (catalyst layer)
[(W/(m·K))]
1.70 [32]
Porosity (MPL) [-] 0.60 [7,10,29,30,31]
Permeability (MPL) [m2] 1.00×10⁻¹³ [7,10,29,30,31]
Thermal conductivity (MPL)
[(W/(m·K))]
1.00 [33]
Porosity (GDL) [-] 0.78 [7,10,29,30,31]
Permeability (GDL) [m2] 8.69×10⁻¹² [7,10,29,30,31]
Thermal conductivity (GDL)
[(W/(m·K))]
1.70 [32]
Porosity (separator) [-] 0.15 [34]
Permeability (separator) [m2] 1.50×10⁻⁵ [34]
Thermal conductivity (separator)
[(W/(m·K))]
0.151 [34]
Conductivity (PEM) [S/m] 10 [35]
Conductivity (catalyst layer) [S/m] 53 [36]
Conductivity (MPL) [S/m] 1000 [37]
Conductivity (GDL) [S/m] 1250 [33]
Conductivity (separator) [S/m] 83000 [34]
Reference equilibrium voltage (Anode) [V] 0
Reference equilibrium voltage (Cathode) [V] 1.229
Reference exchange current density (Anode) [A/m2] 1000 [32]
Reference exchange current density (Cathode) [A/m2] 1 [32]
Charge transfer constant (Anode) [-] 0.5 [38]
Charge transfer constant (Cathode) [-] 0.5 [39]
Table 3. Considered operation conditions of power generation.
Operation parameters Conditions
The initial temperature of cell (Tini) (K) 353, 363, 373
Total cell voltage (V) Experimental data are used [8,9,13]
Supply gas condition Anode Cathode
Gas type H2 O2
Temperature of supply gas at inlet of cell (K) 353, 363, 373 353, 363, 373
RH of supply gas (%RH) 40, 80 40, 80
Pressure of supply gas at inlet of cell (absolute based) (MPa) 0.4 0.4
Flow rate of supply gas at inlet of cell (NL/min) (Stoichiometric ratio (-)) 0.210 (1.5) 0.105 (1.5)
Disclaimer/Publisher’s Note: The statements, opinions and data contained in all publications are solely those of the individual author(s) and contributor(s) and not of MDPI and/or the editor(s). MDPI and/or the editor(s) disclaim responsibility for any injury to people or property resulting from any ideas, methods, instructions or products referred to in the content.
Copyright: This open access article is published under a Creative Commons CC BY 4.0 license, which permit the free download, distribution, and reuse, provided that the author and preprint are cited in any reuse.
Prerpints.org logo

Preprints.org is a free preprint server supported by MDPI in Basel, Switzerland.

Subscribe

© 2024 MDPI (Basel, Switzerland) unless otherwise stated