I. INTRODUCTION
Now a days, quantum mechanics is widely used in the new technologies to understand the quantum phenomenon and to conduct computations. In the current era, the noisy nature of the technologies, measuring and finding fidelity of quantum hardware to undersatnd the limitation of these devices and quantifying progress but still need to be improved. With the help of classical computations, the quantum computing technology offers fundamental phenomenon to solve different computational problems and enhance the more efficient of problem solving. The experimental results are encourging and quantum computors may be available commercially within a few years. For the demonstration of power of quantum computers, one of the most famous algorithms is Shor’s prime factorization algorithm. The main differance between the power of classical and quantum computing is explainable via breaking speed of the Rivest-Shamir Adleman (RSA) algorithm. We need billions of years to solve this computational problem but a quantum computoer can solve it within a few hours. In 1994, this algorithm is the main casue of the "big bang" of the quantum computers and the evaluation of quantum computing.
Gauss’s law of electrostatics
Gauss’s Law for magnetostatics
Ampere’s law
Where
and
are electric and magnetic fields,
is the free charge density,
is the free current density,
is the electric displacement and
is a quantity sometimes called magnetizing force. The relationship between the magnetic field and magnetizing force is
. the variable
,
and
are space permittivity, relative permittivity, free space permeability, and relative permeability respectively.
The light wave which is an electromagnetic wave comprises propagating electric and magnetic fields which propagate energy without moving matter. We can compute this energy using “poynting vector”
The poynting Vector, it combines the intensity (Which is explain as the energy flow per unit area in Wm
−2) The time averaged poyntiny vector is given,
This shows that the electromagnetic wave intensity is directly proportional to the squared amplitude of the electric field, and
is called the medium reflective index.
II. THEORY
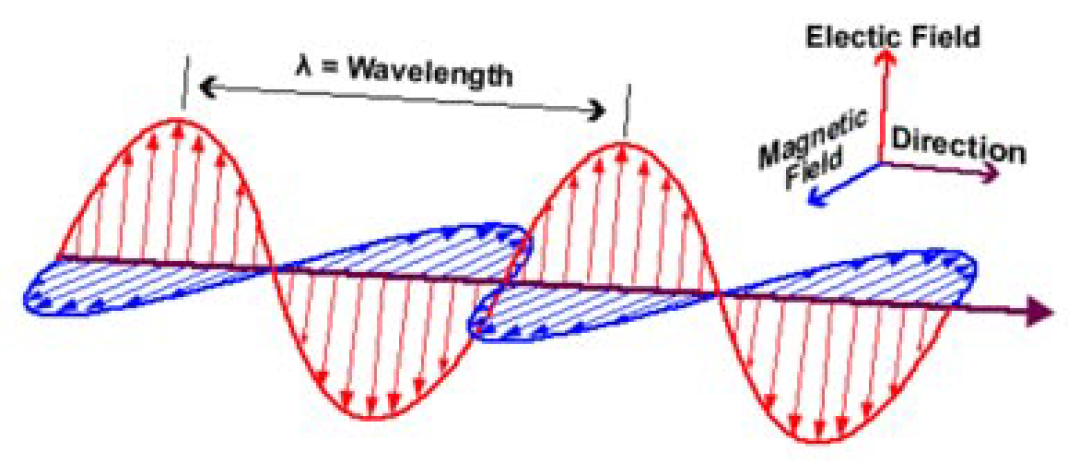
An electromagnetic wave is a transverse wave, and the Electric field E is perpendicular to the direction of propagation of waves. This is called polarization. If the light wave propagates in the Z direction and the electric field can point in any arbitrary direction in an X-Y plane. As shown in
Figure 1.
Using Maxwell’s Equation solutions we can find the total electric field as,
where
) is a polarization vector and
is amplitude of the electrical field.Due to
factor, as the wave moves, the polarization vector may change its orientation in space.
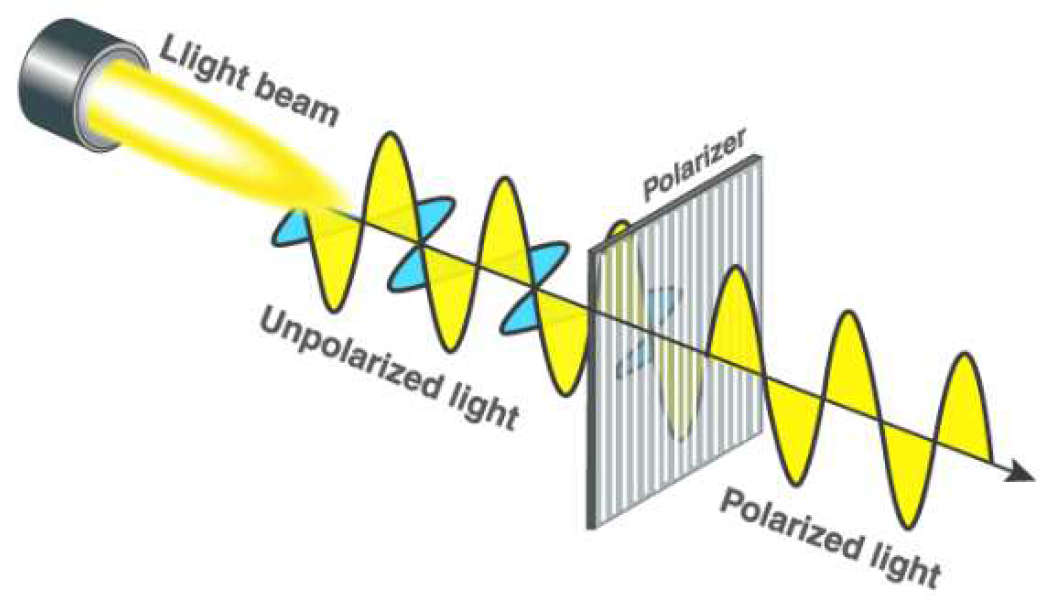
For example, the sunlight (electromagnetic wave) passes through the vacuum and reaches the earth. As the light wave, which is unpolarized light passes through a polarizer, we will get polarized light. Unpolarized waves are light waves in which the vibration occurs in all planes. On the other hand, polarized waves are light waves in which the vibrations occur in only a single plane. As shown in
Figure 2.
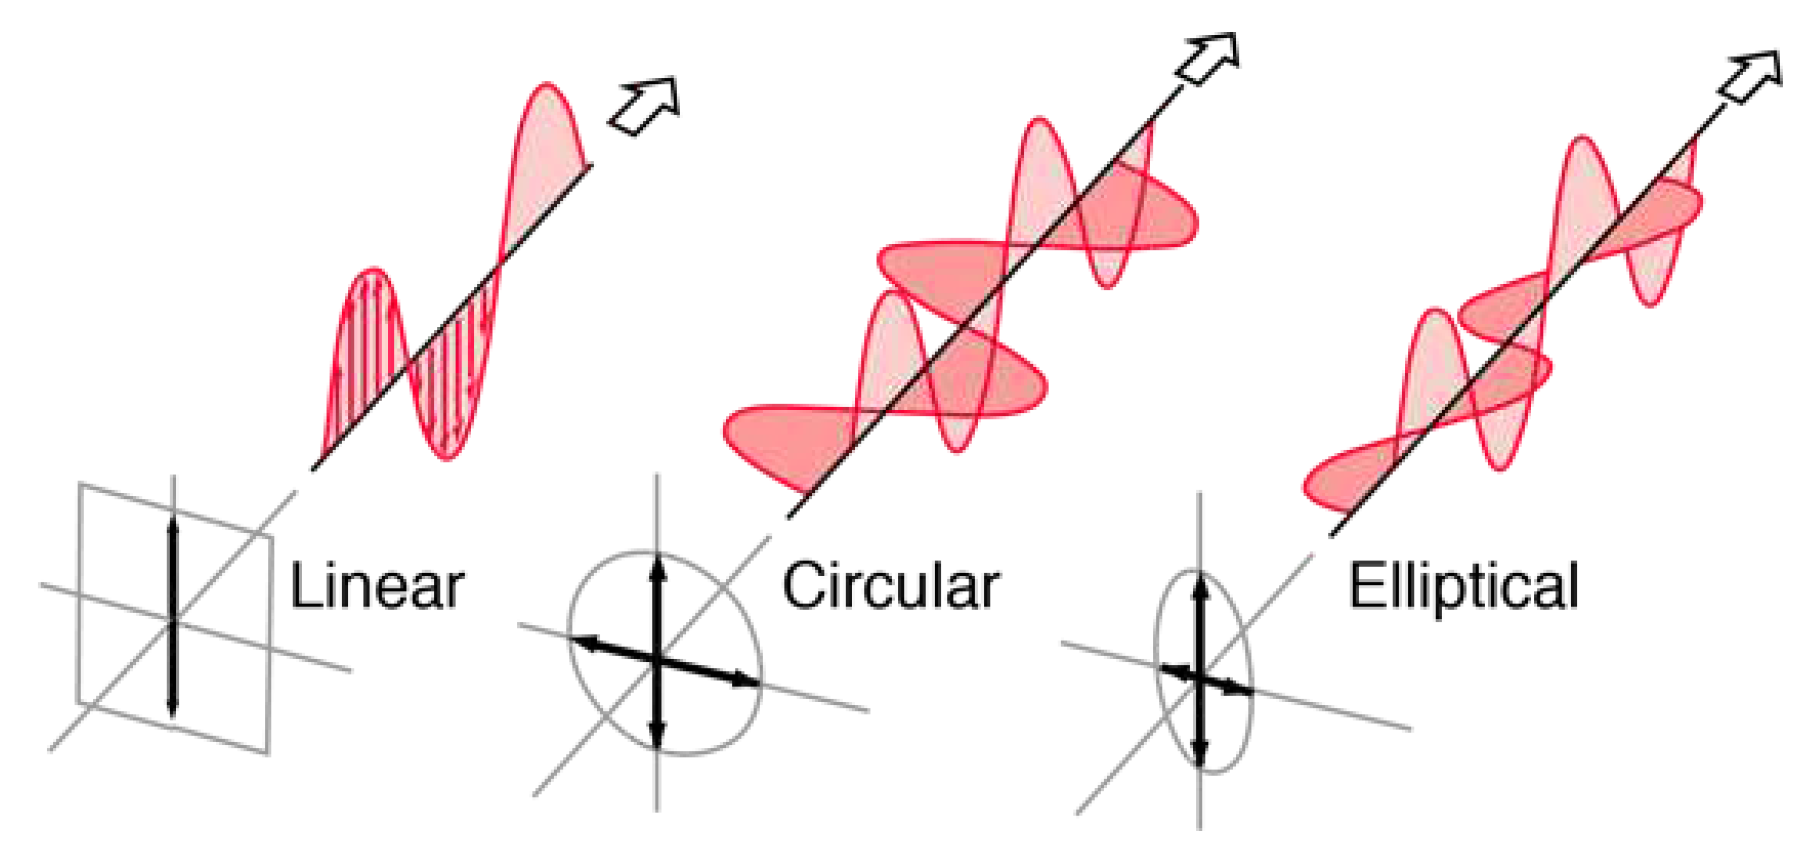
Classification of polarization are as linear, circular and elliptical polarization. If the light is composed of two wave plans and has equal amplitude with a phase difference of 0°, then the light is said to be linear polarized. If the light is composed with equal amplitude and a phase difference of 90°, then the polarization is circular. And if the two planes’ waves with differing amplitude are related in phase by 90°or the relative phase is other than 90°, then the light wave is said to be elliptically polarized (as shown in
Figure 3)
Spontaneous parametric downconversion
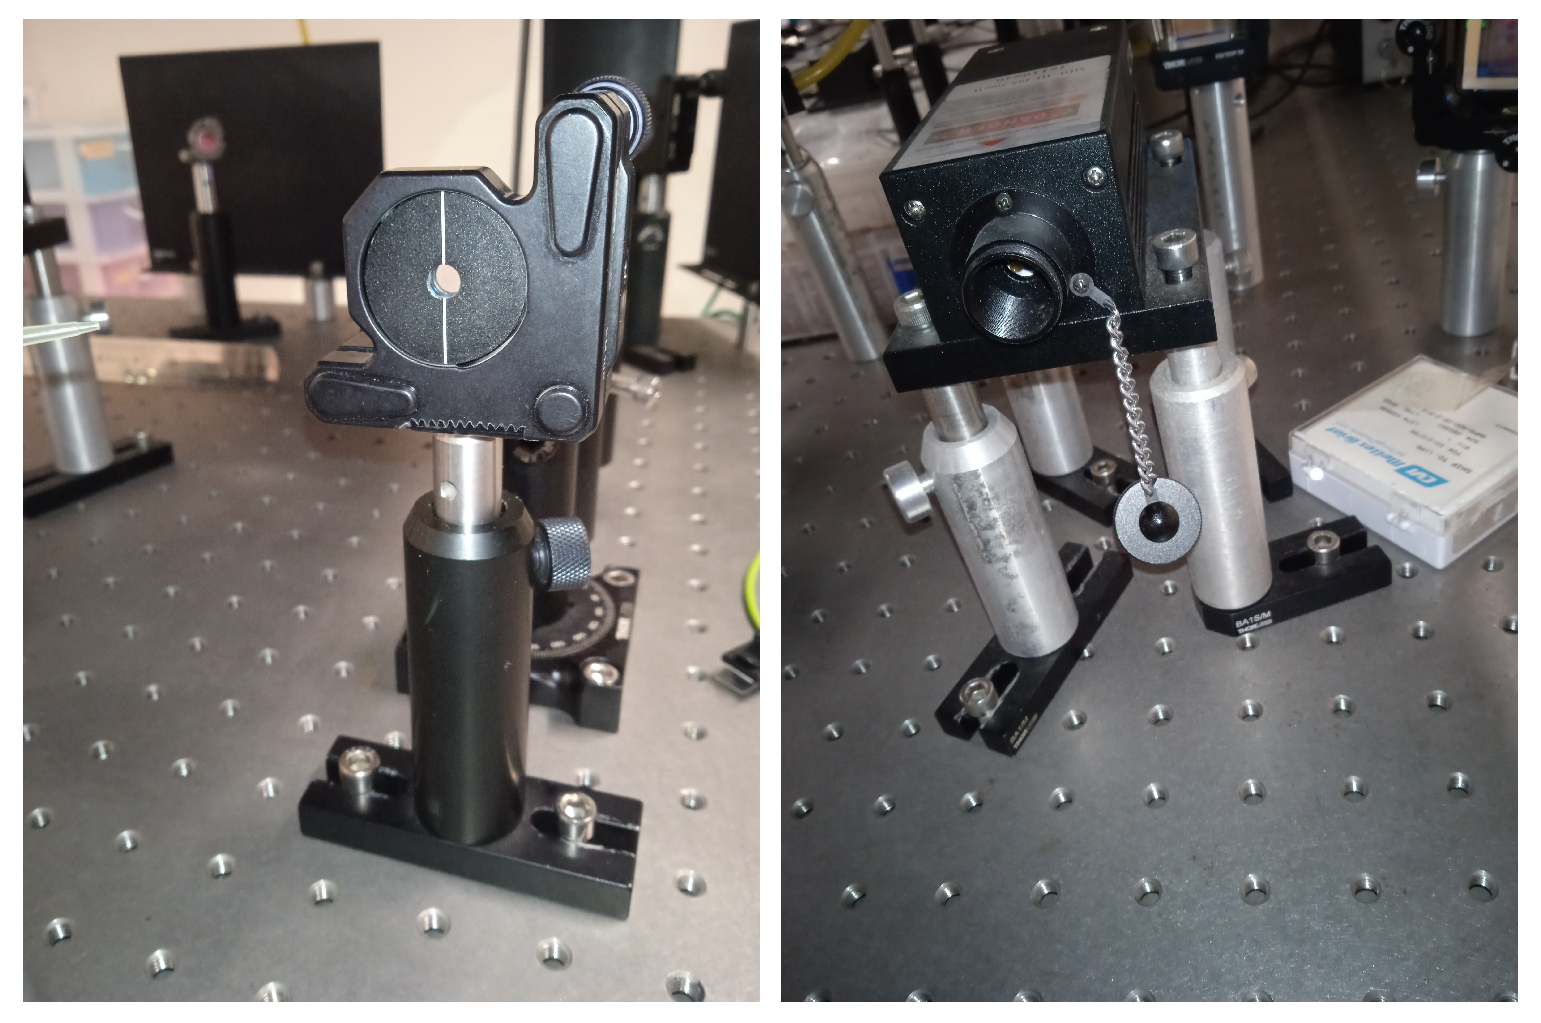
The general components we used during the experiment are a light source, light detection system, and coincident counting unit. In a light source, the photon pairs are produced through the nonlinear process of downconversion. The highly inefficient light needs to pump with a sufficiently bright light source such as a laser (used quickly for alignment)—the violet-blue laser of
vertically polarized use see
Figure 4(b). The high nominal power of
can be controlled by rotating the knob. Before falling the laser on the downconversion crystal, the laser passes through a half-wave plate, which is used for adjusting the laser polarization.
The downconversion is achieved in two stacked Beta-barium borate(BBO, BaB2O4) see
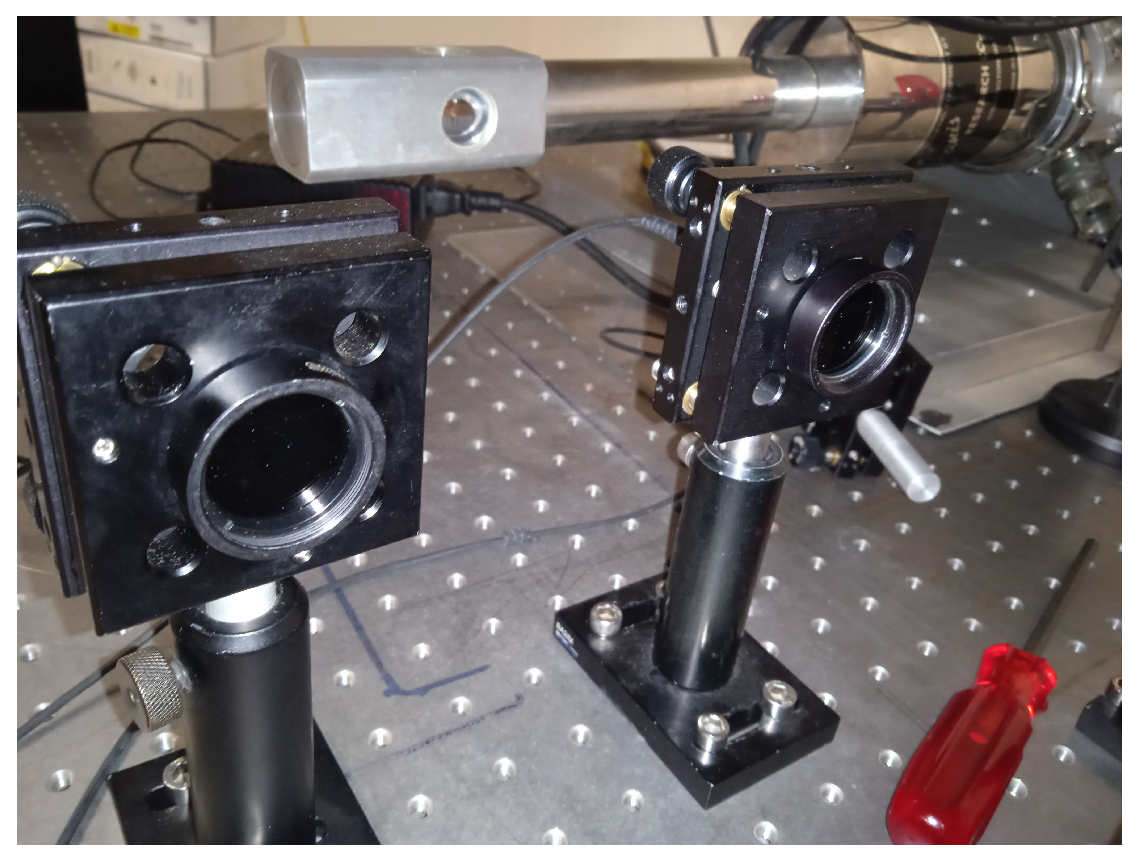
Figure 4 (a). Silica gel beneath and a gentle nitrogen flow are used to protect the crystal from moisture. The quality of the light source can be measured in single, and coincidence counts rates, which are measured in counts per second (cps).Our experiment achieved maximum single-photon detection rates of around 70,000 cps and coincidence counts rates of 3000 cps between the single and idler beams.The detectors are placed on kinematic mounts see
Figure 5.
The light Collection optics help adjust and reject background light in the light detection. The Optical fibers help to make the system flexible and efficient. We used the single photon counting module (SPCM) to detect incoming photons see
Figure 6. The filters are used in front of the detectors to block the scattered light and protect the SPCM from damage. These filters block light smaller than 780nm and transmit light on a higher wavelength. In SPCM, we have four independent avalanche photodiodes (APDs) channels, which can detect the photons between wavelengths 400nm to 1060nm and have a dead time of 50ns between pulses. Sometimes thermal fluctuations can cause the APDs to register the photons even when there is no light incident on APDs. These are called dark counts. For the dark counts, the manufacturer has to mention the dark count’s rate in the APDs.
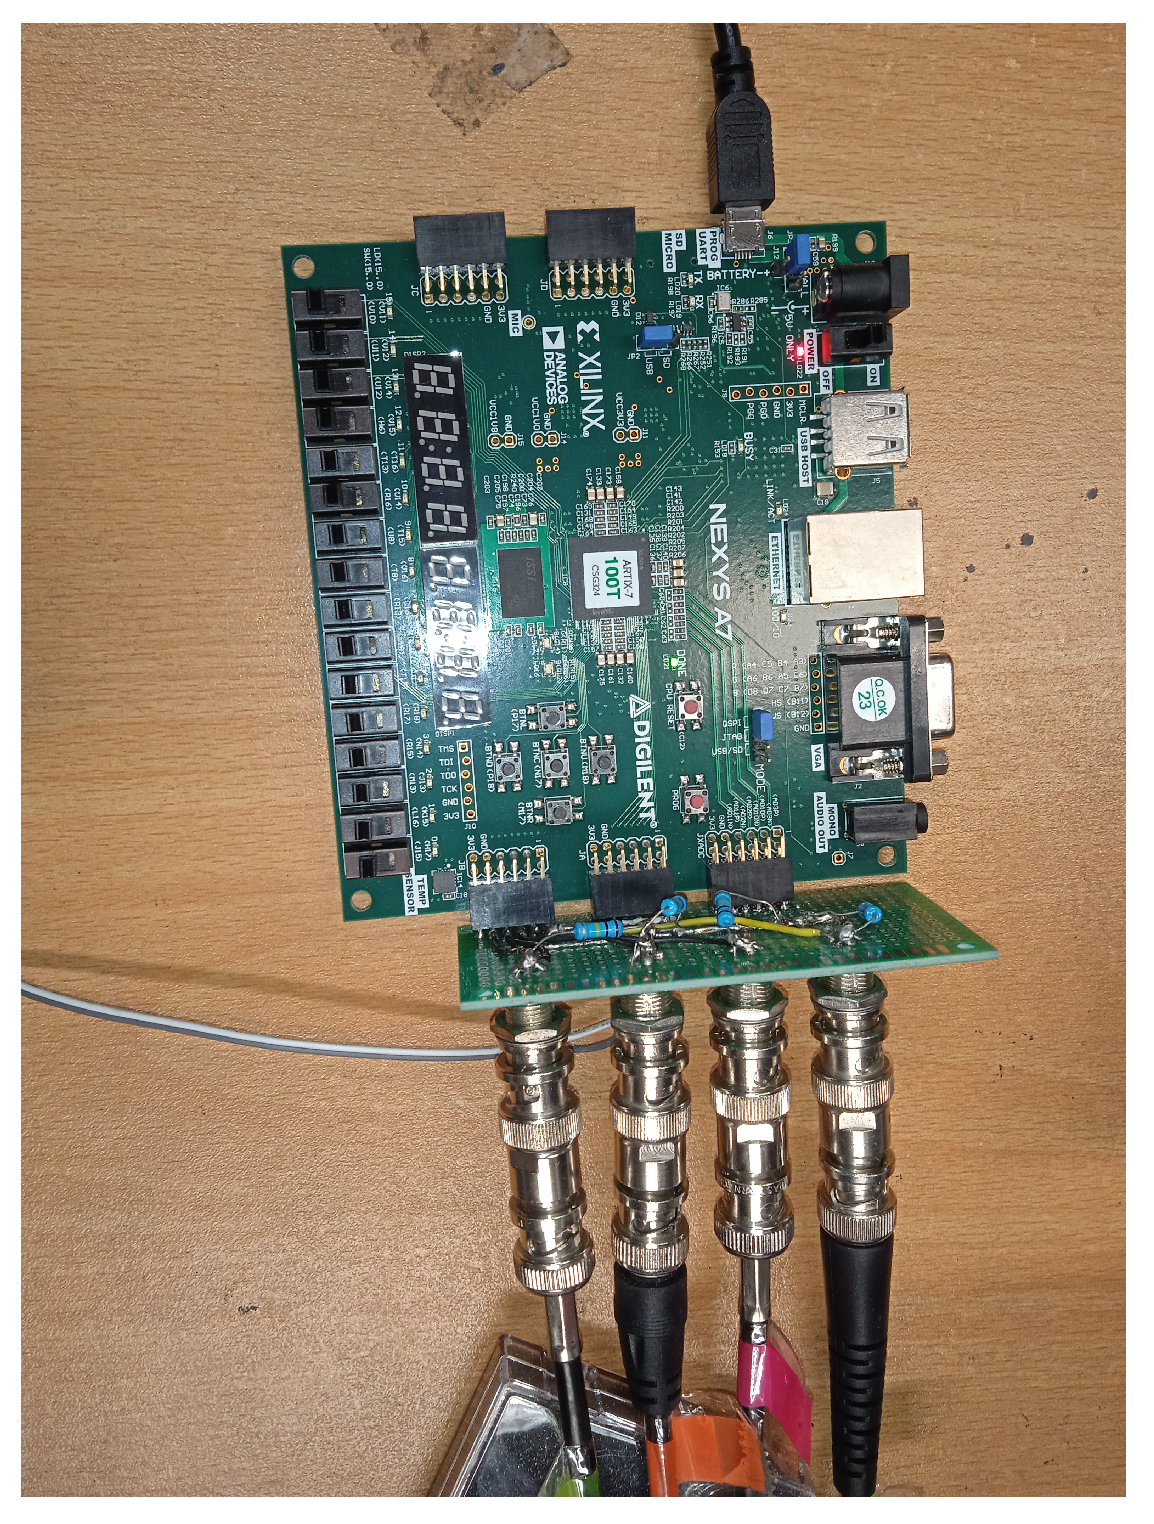
In the coincidence counting unit, two or more particles are detected simultaneously at different detectors. Coincidence counts play an important role in our experiment to understand the quantum characteristics of the correlated light source in quantum optics. We experimented with quantum optics and used coincidence counting based on the field-programmable gate array(FPGA). It develops the minimalist version of such a coincidence counting unit. The pulse generated by SPCM is counted as a CCU based on FPGA see the
Figure 6.
Proof of existence of photons In this experiment, we want to investigate the properties and verification of the quantization of light. Experimentally, we want to establish the existence of a single photon, which should show the “grainy-ness” of individual photons, and treats should be like light field quantum mechanically. In other words, the experiment should not be explained using the classical wave theory of light. This experiment was first performed and tested by Hanbury Brown and Twiss in 1956. They studied the second-order (intensity) correlation in light, the groundwork of modern quantum optics, and the measurement of anti-bunching of photons. In our experiment, we want to demonstrate that we consider the classical nature of light, which ends with the prediction of 2nd order degree coherence known as g
2(0). The experiment which is understudied, if the measurement gives the value of g
2(0) less than 1. We can say that classical theories are not explaining the optical field. In this experiment, the quantum state would show the maximum violation of g
2(0)
and proof of the granular nature of light (single photon state).Now we will see the photodetection process and the classical and quantum nature of light using g
2(0). We are introducing another beam of light which is gained from polarizing beam splitter (PBS) and falls on detector
.When the incident light falls on polarizing beam splitter (PBS) and follows the mechanism as.
and
are intensity falling on detectors and
is delay time. For the classical field, we want to investigate the intensity correlation at
=0 and the equation will become,
Which yields,
For the semiclassical view, the photoelectrons are generated randomly due to incidents of electromagnetic waves. So, the equation gives us the information about the semiclassical view of photodetection,
The probability of registering a photodetection at detector B within a small interval
.Which we can easily find by multiplying the average photodetection rate with
. For quantum view, the three detectors are used in this experiment, we are experimenting with the addition of third detector A and we already observed the g2(0)
with two detectors. Now, to find out the quantum nature of light, we have to follow the expression for g
2 at
=0 as,
,
,
, and
are the number of counts at detector A, BB and their correlations. We should not expect the ideal measurement, Which yields the g
2 =0. This is because of the presence of accidental coincidences. In order to find the propagation of error in the correlation function due to the accidental counts as,
Single-photon interference and quantum eraser
This experiment will observe the single photons that travel through the interferometer, and single photons will interfere. As we have already implemented the second-order correlation measurements in the previous experiment, proof of the existence of photons and interferometer measurements are simultaneously in the same experiment. So, before we go into the details of this experiment, we must understand some basics about this experiment: interference and quantum erasure. If the light passes through the interferometer, the extent to which the interferometer pattern can be visible is dependent upon ’which-way,’ or ’which-path’ information is available to the observer. In principle, we have two ways to understand it better; that is, if the observer have or finds out the information about the path followed by the light traveling through the interferometer, we will not observe any interference if the observer has no information, in principle also, about the path of light. Then very high interference pattern will be visible. Some experiments have been designed such that we can change between the full information and no information about the path followed by the light by making some minor changes in the experiments. Now we will see what happens when we have information and no information about the path of light. If the which-path information is unavailable, then we can say to be ’erased.’ In this way, the erasure results in the visibility of high interference fringes. This type of interferometer is usually called a ’quantum eraser.’ There are multiple ways to make a quantum eraser. As we discussed earlier, we can set the polarizer into the path of light on which beam we want to erase. The polarizer can be oriented to keep or erase the which-way information, and thus we can change the interference visibility.
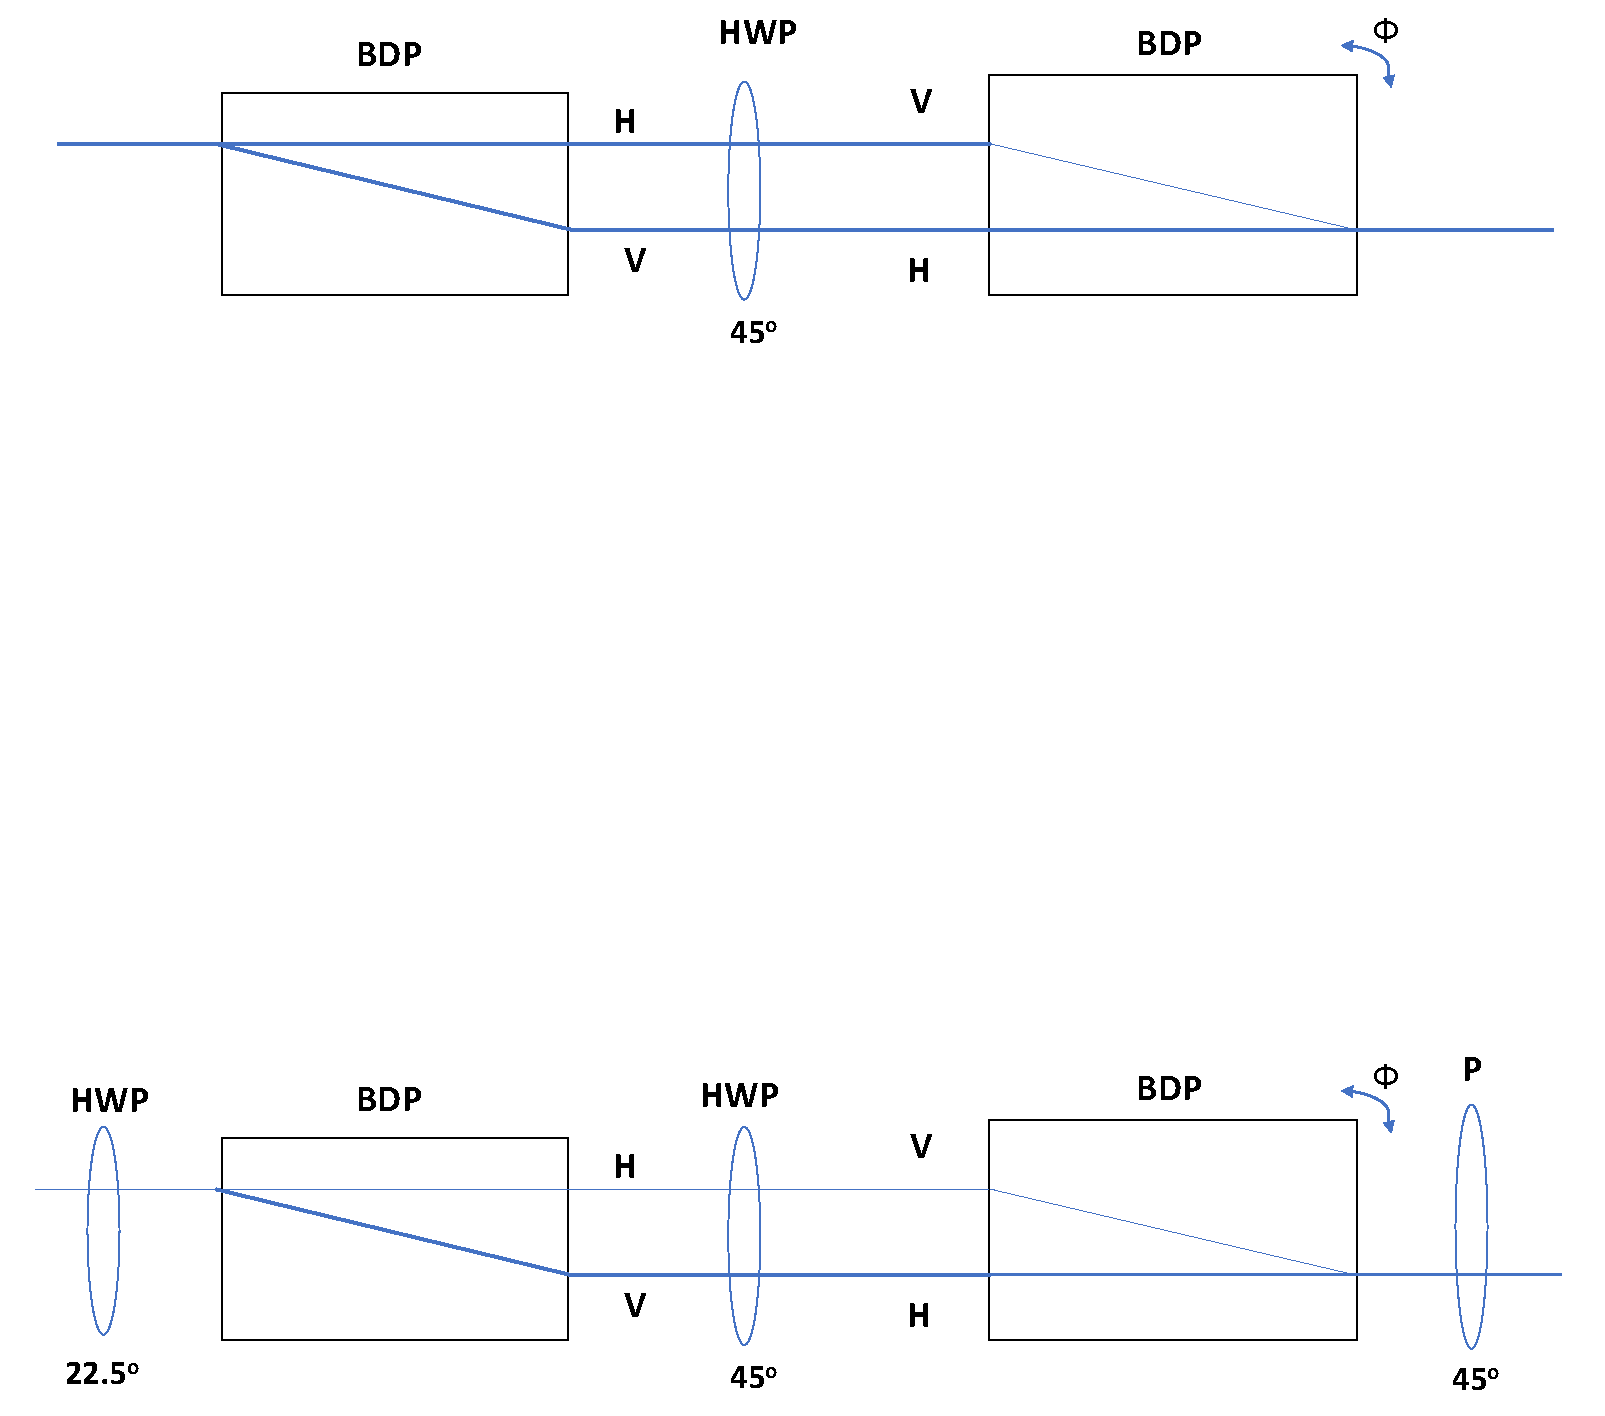
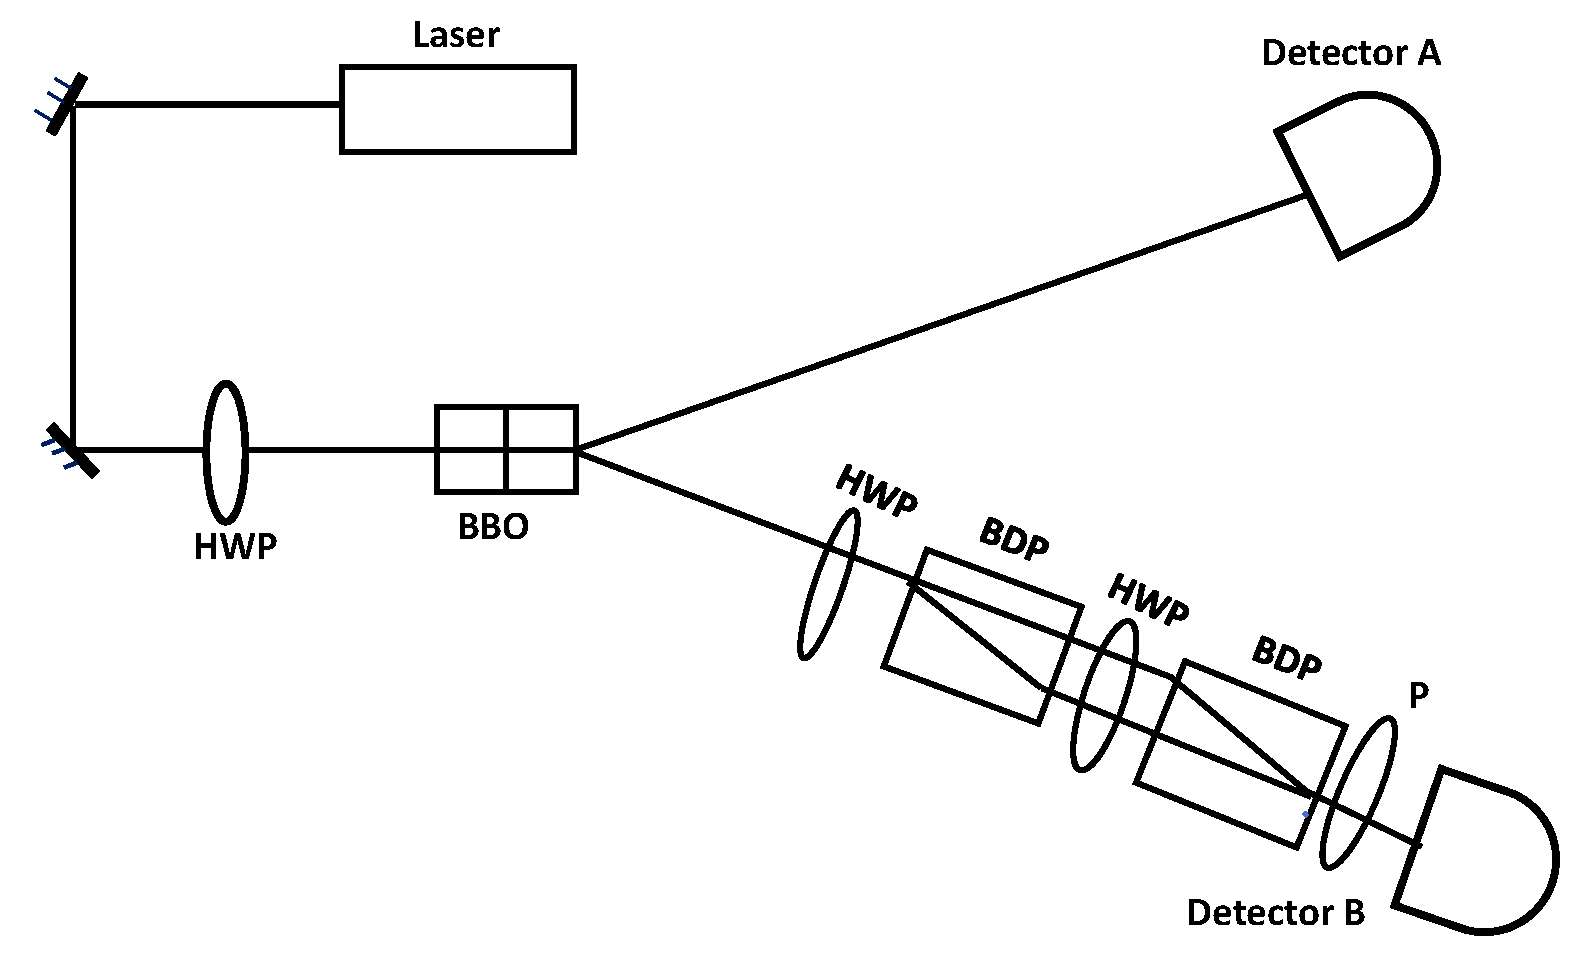
Let us suppose the idler and signal photons are correlated in their polarization states. If the photons pass through the interferometer on such photon polarization, we can make a suitable measurement of the idler photon polarization to determine the which-path way information of signal photons. So, interference fringes do not seem in such a case. The which-path information must be erased from both beams to observe the interferences. We can do this by modifying the idler polarization measurement. Before moving toward the experimental procedure, we have to understand our polarization interferometer. Suppose the figure shows the two-beam displacing polarization (BDPs) and half-wave plate (HWP) arrangement. If the linearly polarized light is coming from the left side, in the first BDP, the horizontally polarized and vertically polarized component is separated, and the HWP flips the separated component and recombines in the second BDP. We can change the path difference between these two beams by changing the tilt of the second BDP. This path difference leads to phase shift
between the incoming light’s vertical and horizontal polarization components. This optical arrangement effect can be expressed in this operator
The two beams overlap upon the second BDP seen in the
Figure 7(a). However, still, we do not have to interfere because of the orthogonal polarization. For the interference, we have to place a linear polarizer to the right of the second BDP and orient it at 45°. The polarizer project the coming photon into the
state. Suppose polarization interferometer input polarization state of being
and the state after the second BDP as
The beam with a polarization state leads through the polarization and falls on the detector. If we set the first HWP at
(see
Figure 7(b)) and the polarization oriented at alfa, the probability of photodetection will as
If theta = 45o, probability will reduce to
So we can get the interference pattern by changing the
. The which-way information has been ’erased’ and interference fringes are predicted in this interferometer arrangement. For the angle as
, the probability results as
We can state that the probability of photodetection is independent of the path difference. We can also say that changing the path difference will cause no change in the photodetection because the which-path information will be available at horizontal (
) or vertical (
). So, we set the polarization as above to get the interference
III. EXPERIMENTAL SETUP AND PROCEDURE
Spontaneous parametric downconversion is the heart of all quantum optics experiments, and the process is called downconversion. The frequency of the output beings is smaller than the input frequency. One photon of one frequency produce two photons, half of the original frequency. The downconverted photons are used as a light source to study the peculiar quantum nature of light. This process is ’spontaneous’ till no signal and idler beam in the inputs. The downconverted photons are always emitted in pairs. Exercise properly coupled downconverted photons beams into the detector optical fiber and maximized the coincident counts of the two beams. We got the vertically polarized light from the violet-blue laser box, and after reflecting through the two mirrors, it falls on the BBO crystal after passing through the half-wave plate. Which is placed between the BBO and 2nd mirror for phase shift see
Figure 8. After passing through the BBO crystal, the laser light is downconverted, which converts the vertically polarized to horizontally polarized pair photon as,
And after passing through the BBO. The downconverted photon detects on detectors, and we can see it in the CCU Computer system through FPGA.
For the alignment of the downconversion crystal, use the backpropagation laser on both detectors, and fall the back laser on the BBO crystal (downconversion crystal) at the same height. For alignment of detector A, fall the back laser on the BBO crystal from detector A see
Figure 9(a). Turn on the violet-blue laser to see the number of counts on the computer. Rotate the half-wave plate from 0 to 180 degrees and find the maximum number of counts. We can say that detector A is well aligned by achieving the maximum number of counts. The same procedure for detector B to check the alignment with the BBO crystal see
Figure 9(b) .
After getting the maximum counts on both detectors, it’s time to align the BBO crystal. Set the HWP to 45 degrees, and it is because at this angle, the X-Y plane of BBO crystal is orthogonal to each other, and we will find no difference in detecting horizontally and vertically photons. To see if the BBO crystal is aligned or not. We have to see the maximum number of coincidence counts.Once we achieved the maximum number of counts, we can say that the BBO crystals are well aligned.
For the
proof of the existence of photons, we must proceed from our previous experiment with the addition of detector
, PBS, and another HWP (placed between PBS and BBO) see
Figure 10(c).
The PBS is placed just about 4 inches from detector B and should be perpendicular to the laser. Using the back laser, we must align the detector such that the laser should pass through the PBS. To check, both reflected and transmitted laser is well aligned. Placed the back laser at both detectors B and one by one and made sure the laser spot on the transmission side should be same place.
We have already aligned the detector A and detector B previously. Now we have aligned the additional detector
see
Figure 10(a),(b). When we turn on the laser and reflect from two mirrors and then passes through the first HWP, which is set at 45° (see
Figure 9(c). After downconversion from BBO. The signal beams strike on PBS, which transmits the half laser and the half reflects to detector B and detector
respectively. Counts registered at Detector A, B, and
, and coincidence AB,
,
, and
.
After the alignment of BBO crystals, we rotate the first HWP from 0 degrees to 180 degrees and the second HWP at 0 degree and get the coincidence counts of AB and
see
Figure 9(c). After passing through BBO, the laser may be vertically or horizontally polarized. When the signal beam passes through the PBS, it allows the horizontally polarized photons to pass through and reflect the vertically polarized photons. We get coincidence counts AB and
as
and
polarized photons, which we separate the horizontally and vertically polarized photons. Now the setup to measure three-detectors g
2. Set the second HWP at 22.6° and rotate the first HWP again. We get the coincidence counts of AB and
. To investigate the g
2 further, repeat the three-detector experiment for different values of time delay
; we take delay time up to
. Introduce detector B signal by passing it through the delay generator and taking the values. Now the same process for detector
to get total values.
for the
Single-photon interference and quantum eraser, make the setup as we have already done in the previous experiment. Make sure the detectors A and B are aligned. Take the backpropagation laser (alignment) and set it to the back of the detector B (see
Figure 8(b)). Place the first BDP in front of the detector B. make sure the back-laser beam strikes the center of the BDP and produces the two beams. These beams should fall on the center of the BBO crystals. An HWP is placed next to the first BDP and set at 45°. Now placed the second BDP in front of HWP. Make sure the two beams come from the first BDP, fall on the second BDP, and produce a single beam. This single beam should strike the center of the BBO crystal if the final beam does not strike the BBO. Then move the detector B slightly about
to the left side (see
Figure 11), then set the complete interferometer setup again, and the final single beam should fall on the center of the BBO shown in the figure. Places the polarizer at the end of the interferometer. Also, place the stepper motor at the edge of the second BDP to rotate with very small phase-shifting
.
In this experiment, we observe the interferometer’s output by changing the orientation of the wave plates. The idea for setting the HWP is to get the interference, which erases the available information for the path of light. As we have already done the alignment part of this experiment, we have to make arrangements for the setup to create interference. Turn on the pump beam, and the HWP of BBO is oriented such that downconverted photons should be horizontally polarized. This means the photons that enter the interferometer are horizontally polarized. Now set the first HWP after BBO oriented at
, and the HWP between the BDPs is oriented at 45°. So, for the different polarization orientations, we must observe the coincidence counts NAB measured against the path difference influenced by the stepper motor. The coincidence counts are correlated for the accidental coincidences and are plotted. The interference fringes visibility is calculated by using the following formula.
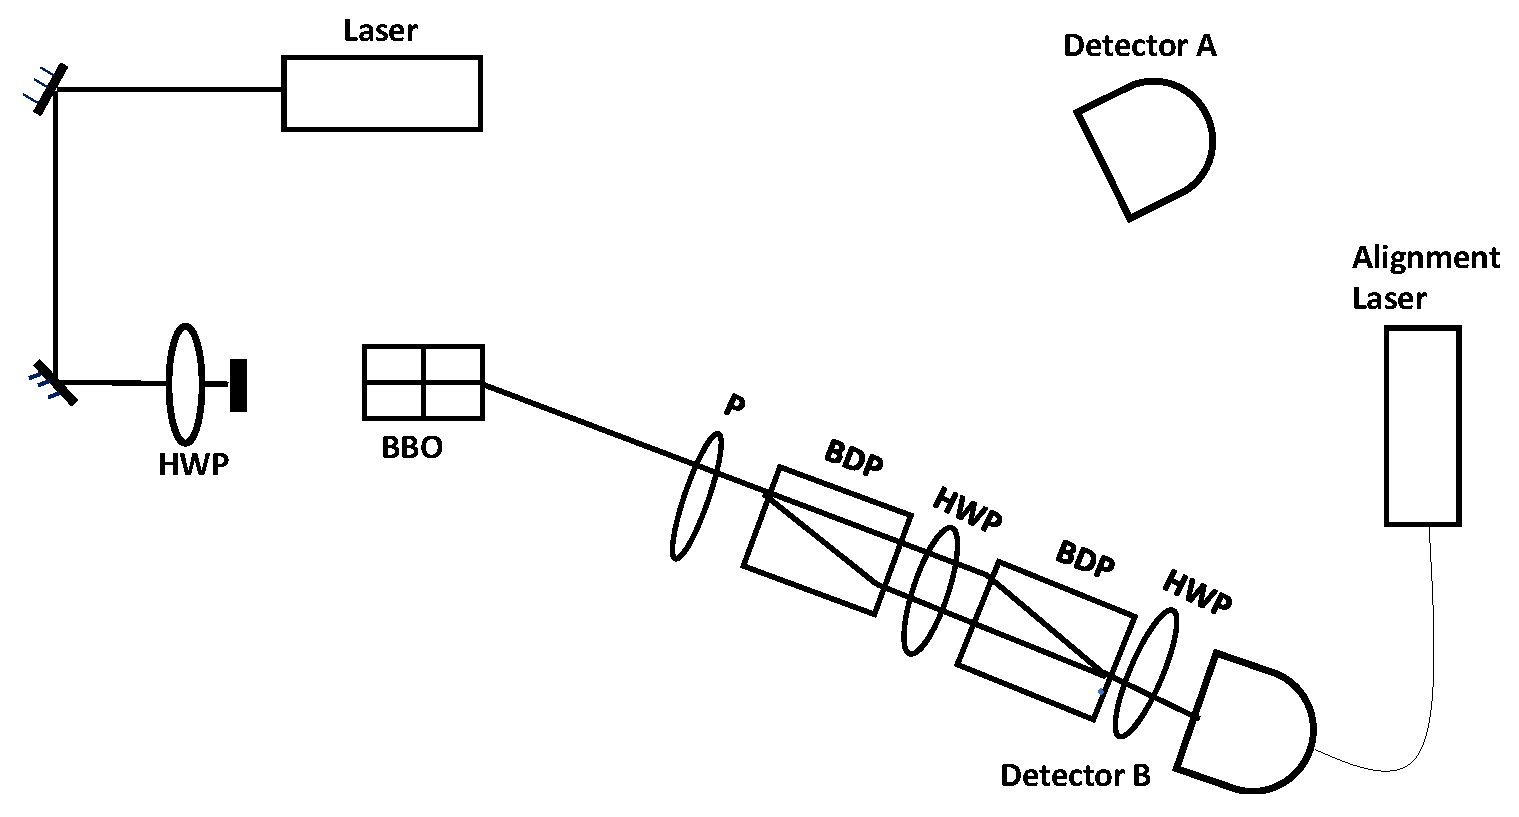
The polarizer is oriented at 45° to get the high interference visibility and oriented at 0° and 90° for the low visibility. In other words, the setting the angle of the polarizer at 0° and 90° means the which-way information is known, and which-way information erases at 45° (see
Figure 12)
IV. RESULTS AND CONCLUSION
for the Spontaneous parametric downconversion,When BBO crystals are unaligned, we find the maximum number of counts that’s mean we got maximum horizontal photons on detector A and laser beam aligned with one of the BBO crystal.
Variations in the number of counts happen by changing the angle of HWP. Because after passing the vertically polarized light through the BBO, it downconverted to horizontally polarized light pair and by changing angle its changes the polarization, see
Figure 13(a)(circle dots). Same case for the second laser of photons on detector B see
Figure 13(b)(circle dots) and their coincidence counts. see
Figure 13(c)(circle dots).
Align both crystals of BBO by taking the HWP angle at 45 degrees and try to register the maximum number of counts on detectors. After getting the maximum number of counts we can say that both crystals of BBO are well aligned. Now by changing the angle of HWP, we find negligible variation in the number of counts because the BBO crystals aligned.see
Figure 13(c) (square dots)
We can conclude that when the BBO crystals are unaligned and we find variation in the number of counts on both detectors and their coincidences. It is because the laser light only aligns with one of the crystals of BBO. When the BBO crystals are well aligned and we find negligible variation in the number of counts on detectors and their coincidences because the detectors unable to find a difference whether the laser is come vertically or horizontally due alignment of BBO crystals.
for the proof of existance of photons,We get variation in coincidence counts AB and
w.r.t to change in orientation of pump beam. We get
on AB coincidence and
on
counts see
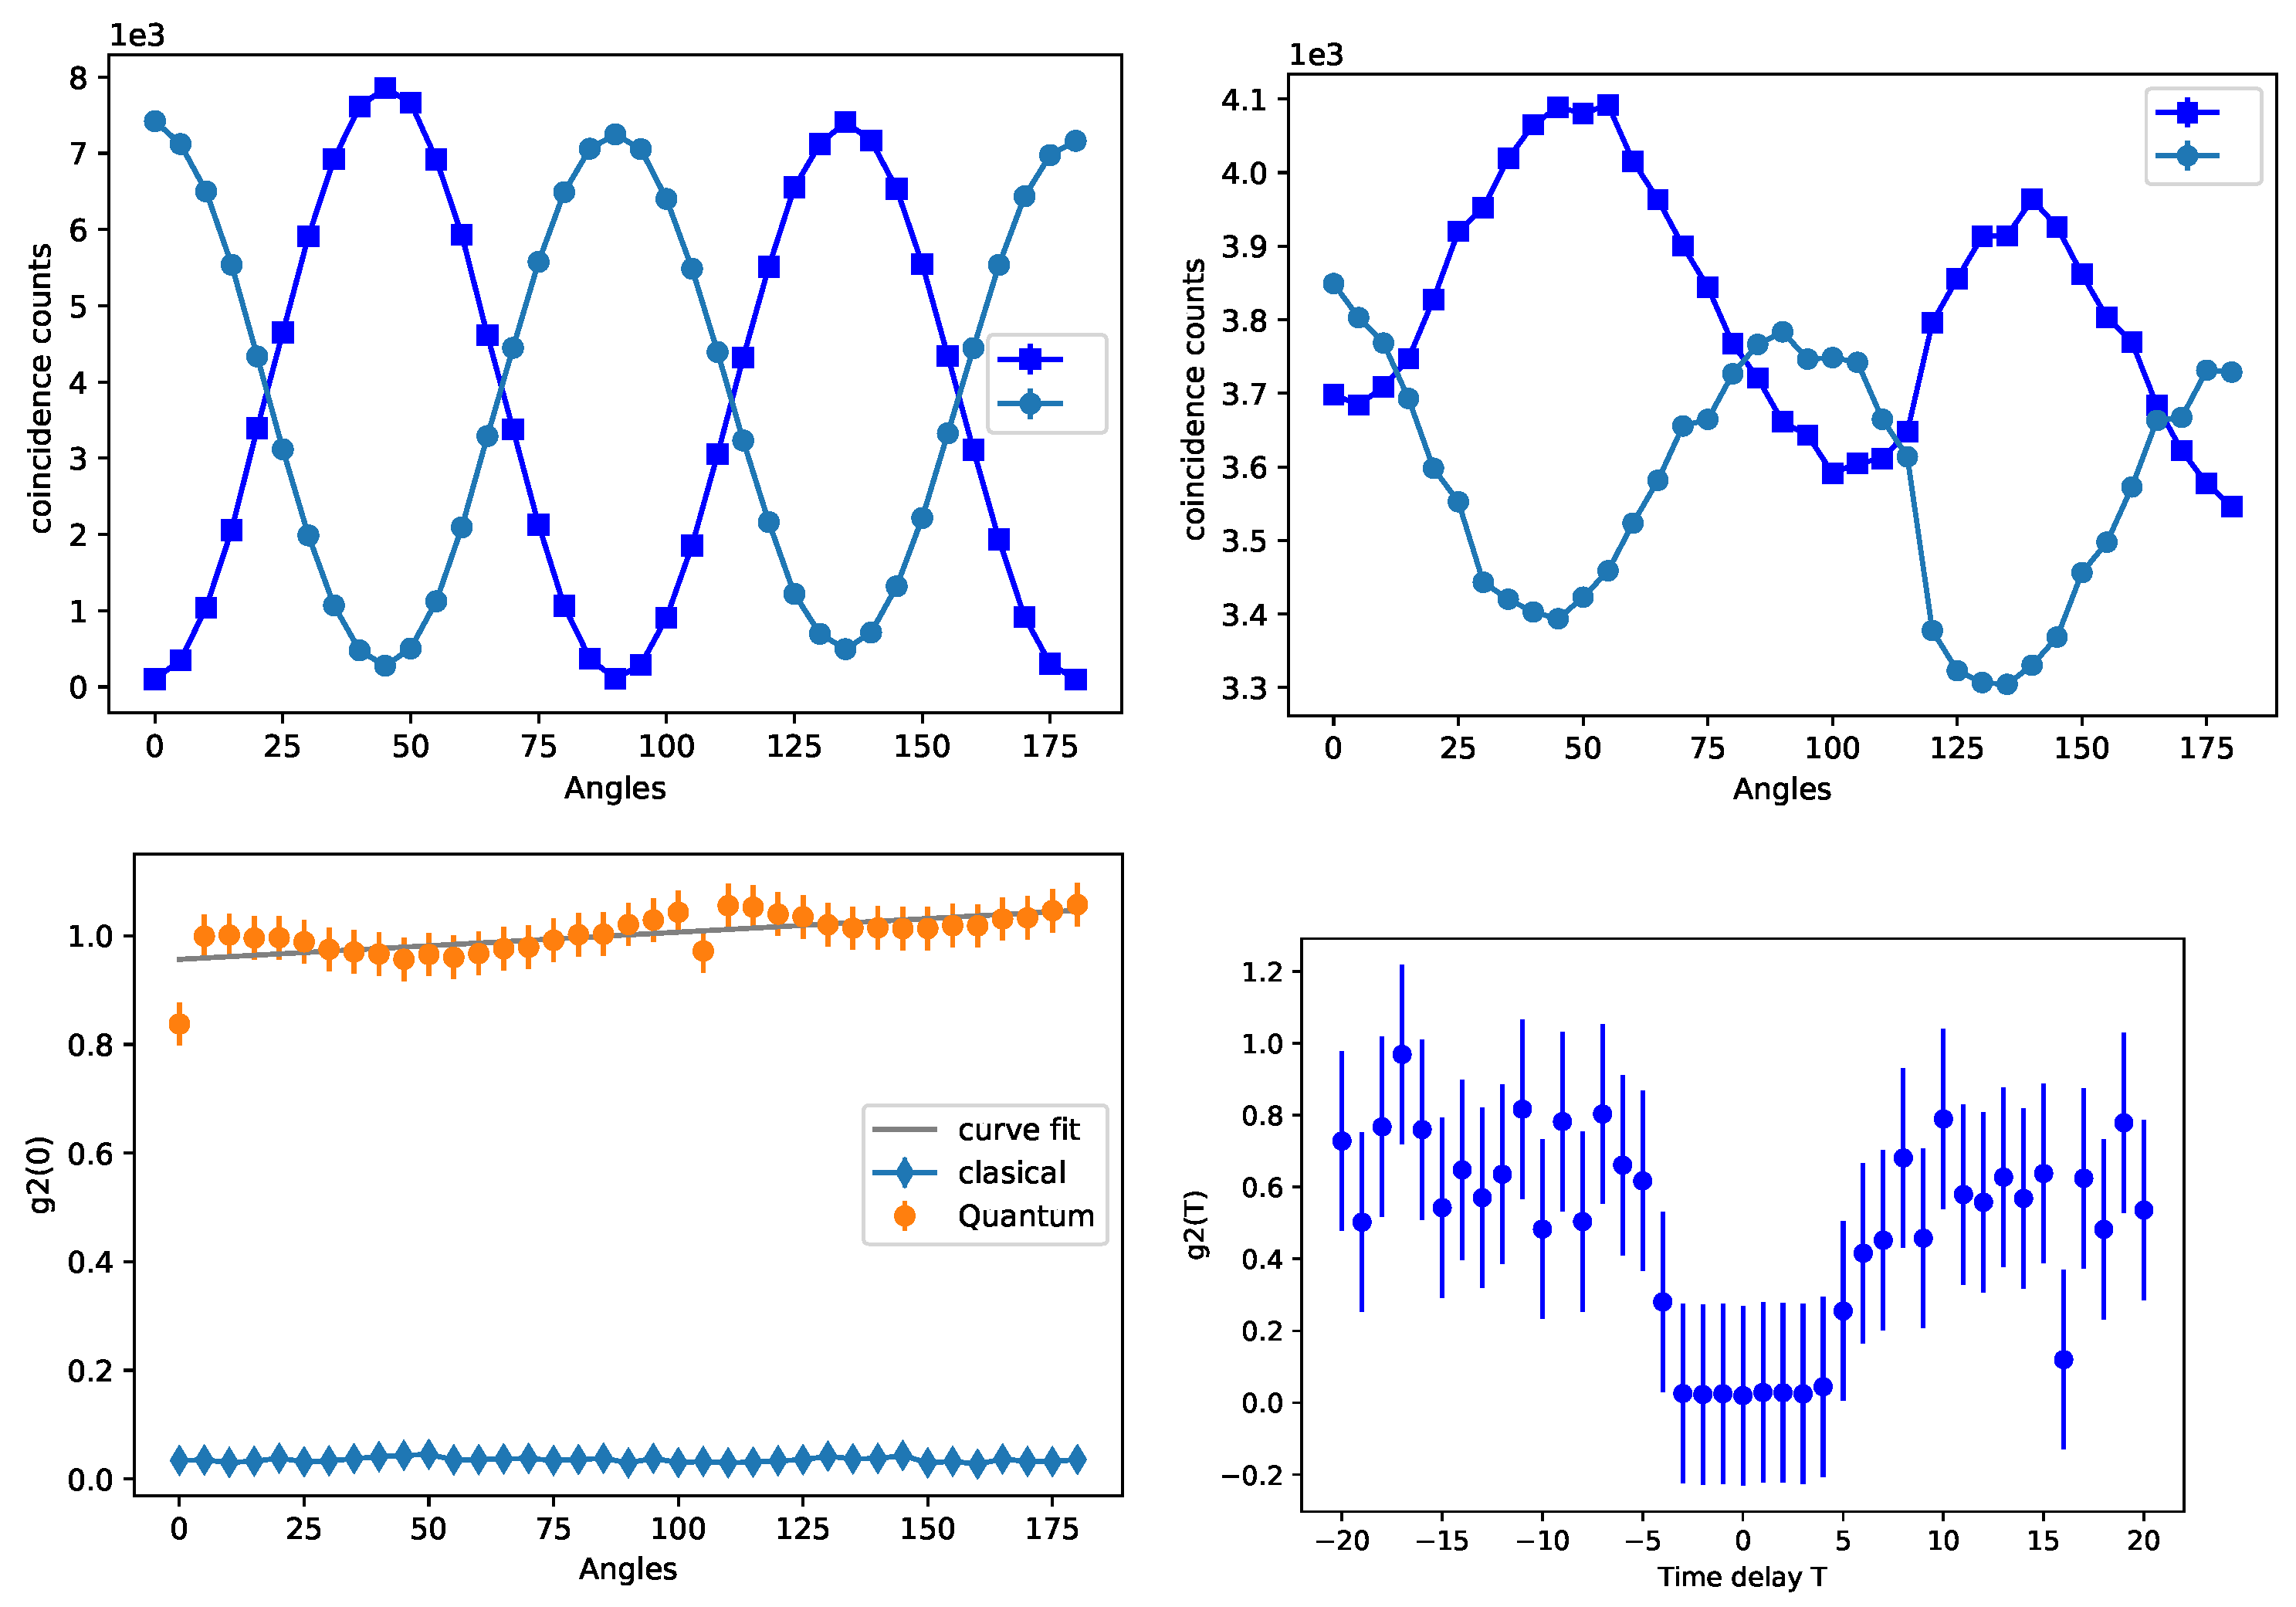
Figure 14(a). In the three detectors experiment, we take the second PBS at
and the pump beam HWP at 0° to get the maximum counts. Changing the pump beam’s orientation shows variation in coincidences see
Figure 14(b).
as shown in the maximum number of counts on detector B. It does not get a minimum number of counts due to the angle of beam splitter’s HWP and the same procedure for
. We take an orientation steps of 5°. Because of accidental counts, graphs show emergence on B minima and
maxima. After calculating the g
2 for classical and quantum view, we end up with the graph shown in the
Figure 14(c). When we add the delay time with data acquisition time for
see
Figure 14(d) and we get the correlation function plot corresponding to anti-bunched.
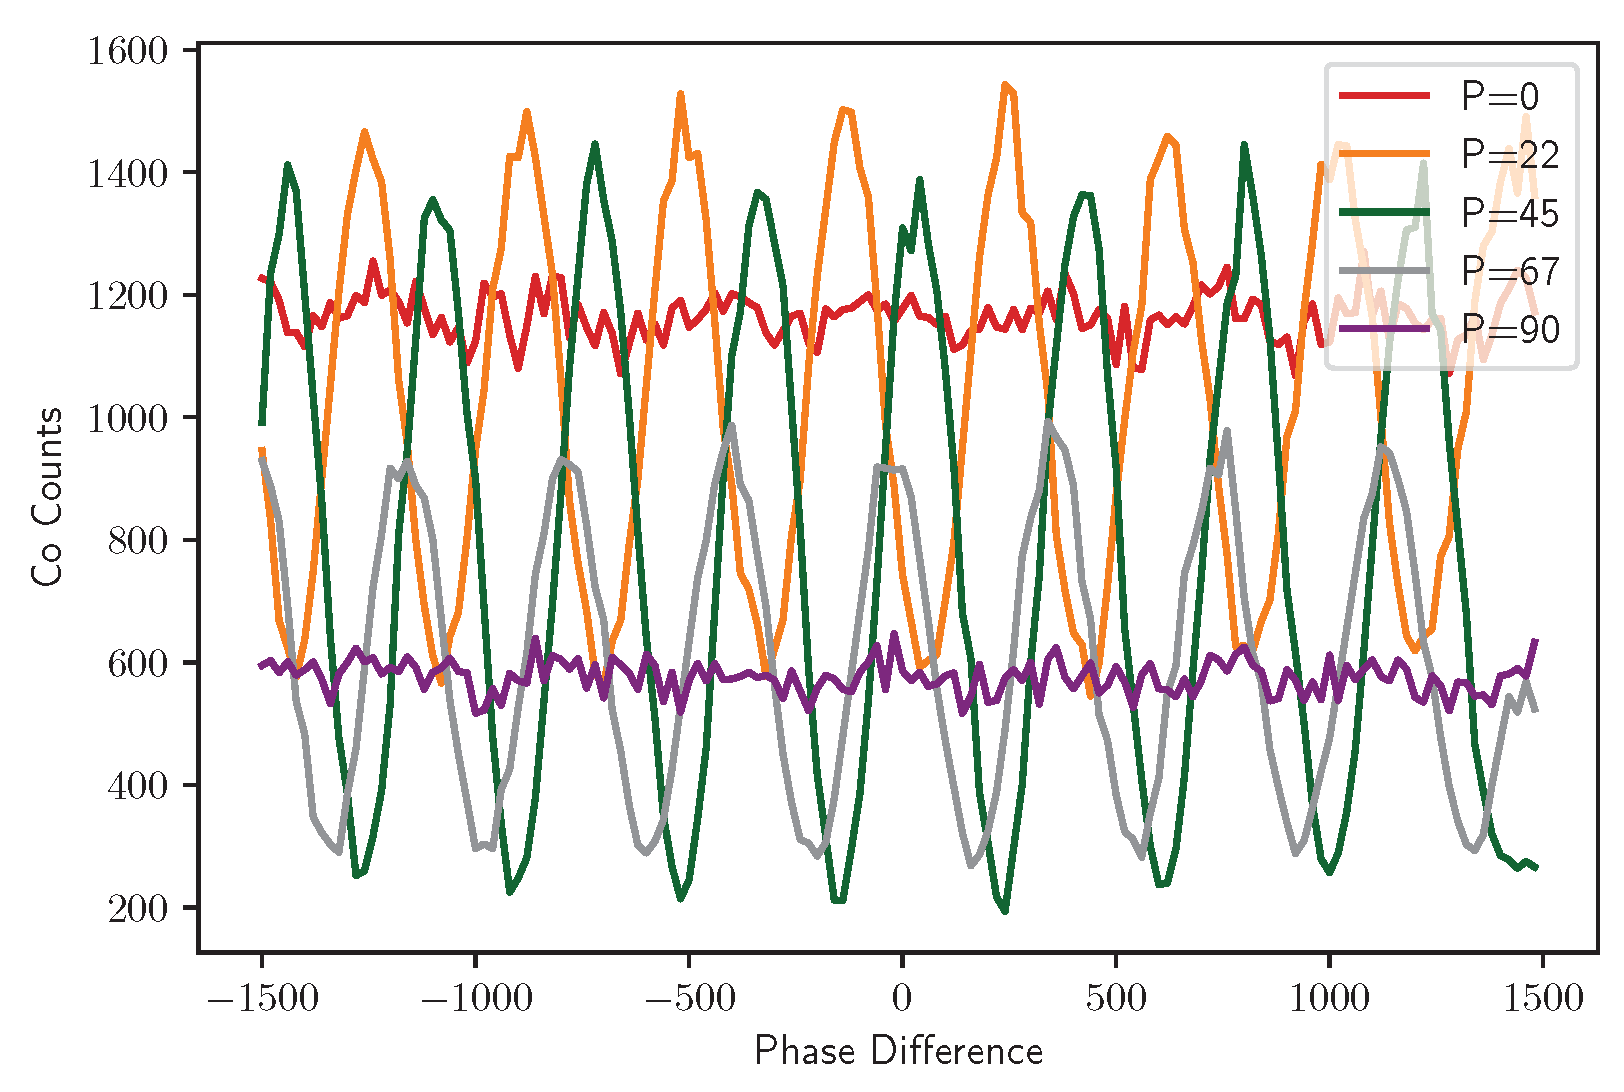
Single-photon interference and quantum eraser We can conclude that if we want to observe interference by single-photons by using an interferometer placed in the path to the idler beam. We can say that if you have information on the which-way path of the light, we will not observe any interference. If you have no information about which-way the light followed the path, you can observe the interference. We can erase the information about the path of light by using a polarizer after getting the light from the interferometer. As results are shown in the
Figure 15, if we set the angle of the polarizer at 0° or 90° we did not erase the information of the path of light, which means we did not observe the interference. If we set the polarizer angle at 45°, we erase the light path information. So, in this way, we can easily get the interference by making the phase shifts difference between vertical and horizontal polarization by using a stepper motor on the second BDP. We also faced the offset of about 3° in the polarizer, and we minus this offset from the original angles of the polarizer, which measured the value.
Figure 1.
Electromagnetic wave having electric field and magnetic field perpendicular to each other and moving in direction of propagation of wave [1].
Figure 1.
Electromagnetic wave having electric field and magnetic field perpendicular to each other and moving in direction of propagation of wave [1].
Figure 2.
A beam of light (unpolarized) passes through polarizer(in figure linear polarizer used) and allow only a single plane wave to pass through it [2].
Figure 2.
A beam of light (unpolarized) passes through polarizer(in figure linear polarizer used) and allow only a single plane wave to pass through it [2].
Figure 3.
Classification of polarization. linear, circular and elliptical polarization and the arrows show the direction of propagation of waves [3].
Figure 3.
Classification of polarization. linear, circular and elliptical polarization and the arrows show the direction of propagation of waves [3].
Figure 4.
(a) Beta-barium borate (BBO) on kinematic mounts.(b) A laser of and is used as pump laser for the singal-photon experiment.
Figure 4.
(a) Beta-barium borate (BBO) on kinematic mounts.(b) A laser of and is used as pump laser for the singal-photon experiment.
Figure 5.
The fiber coupling lanses are placed in the kinamatic mounts to collect the downconverted photons. Fiber-to-fiber couples, whose role is to couple the light between the fibers.
Figure 5.
The fiber coupling lanses are placed in the kinamatic mounts to collect the downconverted photons. Fiber-to-fiber couples, whose role is to couple the light between the fibers.
Figure 6.
the single- photon counting module(SPCM), which has four independent APS detectors. The photodetection output pulses are transmitted through the BNC terminal.
Figure 6.
the single- photon counting module(SPCM), which has four independent APS detectors. The photodetection output pulses are transmitted through the BNC terminal.
Figure 7.
(a) polarization interferometer contains two beam displacingg polarization BDP and one half-wave plate (HWP).(b) includes an additional HWP and polarizer (P) represents horizontally(vertically) polarized light. tells us about the phase shift between the H and V components intoduced by the interferometer.
Figure 8.
The experimental setup for detector A and B with pump beam with the angle of 30°.
Figure 8.
The experimental setup for detector A and B with pump beam with the angle of 30°.
Figure 9.
(a)The experimental setup for detector A with back laser for the alignment.(b) The experimental setup for detector B with back laser for the alignment.
Figure 9.
(a)The experimental setup for detector A with back laser for the alignment.(b) The experimental setup for detector B with back laser for the alignment.
Figure 10.
(a)The experimental setup for detector B with back laser for the alignment.(b) The experimental setup for detector with back laser for the alignment.(c)The experimental setup for detector A, B and with the pump laser.
Figure 10.
(a)The experimental setup for detector B with back laser for the alignment.(b) The experimental setup for detector with back laser for the alignment.(c)The experimental setup for detector A, B and with the pump laser.
Figure 11.
Rough alignment of the interferometer and detector is moved 4mm to the left and interferometer elements are palced and aligned.
Figure 11.
Rough alignment of the interferometer and detector is moved 4mm to the left and interferometer elements are palced and aligned.
Figure 12.
schematic diagram of the single-photon interfwerometer and eraser experiment.the signal downconverted photons beam move to detector A and idler downconverted photons beam goes toward detector B passes through the polarization interferometer.
Figure 12.
schematic diagram of the single-photon interfwerometer and eraser experiment.the signal downconverted photons beam move to detector A and idler downconverted photons beam goes toward detector B passes through the polarization interferometer.
Figure 13.
(a)Before and After the alignment shows the maximum number of counts on detector A.(b)Before and After the alignment shows the maximum number of counts on detector B (c)Before and After the alignment shows the maximum number of counts of coincidences of AB.
Figure 13.
(a)Before and After the alignment shows the maximum number of counts on detector A.(b)Before and After the alignment shows the maximum number of counts on detector B (c)Before and After the alignment shows the maximum number of counts of coincidences of AB.
Figure 14.
(a)the coincidence counts for AB(squared dot) and (circle dot) with the orientation of the pump beam’s HWP and set the PBS’s HWP at 0° (b)the coincidence counts for AB(squared dot) and (circle dot) with the orientation of the pump beam’s HWP and set the PBS’s HWP at 22.6° (c)the classical(orange dot) and quantum view(blue dot) after solving the g2(0) equation (d) Experimentally measured for g2() for the single-photon source.
Figure 15.
shows the variation of the detected conincidence counts with respect to the change in the phase difference for the different polarizer angles.
Figure 15.
shows the variation of the detected conincidence counts with respect to the change in the phase difference for the different polarizer angles.
