Submitted:
31 October 2023
Posted:
01 November 2023
You are already at the latest version
Abstract
Keywords:
1. Introduction
2. Materials and Methods
2.1. Identification and Features Analysis of MADS-Box Family in Mango
2.2. Phylogenetic Tree, Gene Structure and Conserved Motif Analysis of MiMADS Genes
2.3. Chromosomal Distribution, Gene Duplication, and Ka/Ks Analysis of MiMADS Genes
2.4. Cis-element Analysis of MiMADS Proteins
2.5. Interaction Networks Analysis of MiMADS Proteins
2.6. Plant Materials Collection and Expression Analyses Based on Publicly Available RNA-seq
3. Results
3.1. Identification of MADS Proteins in Mango
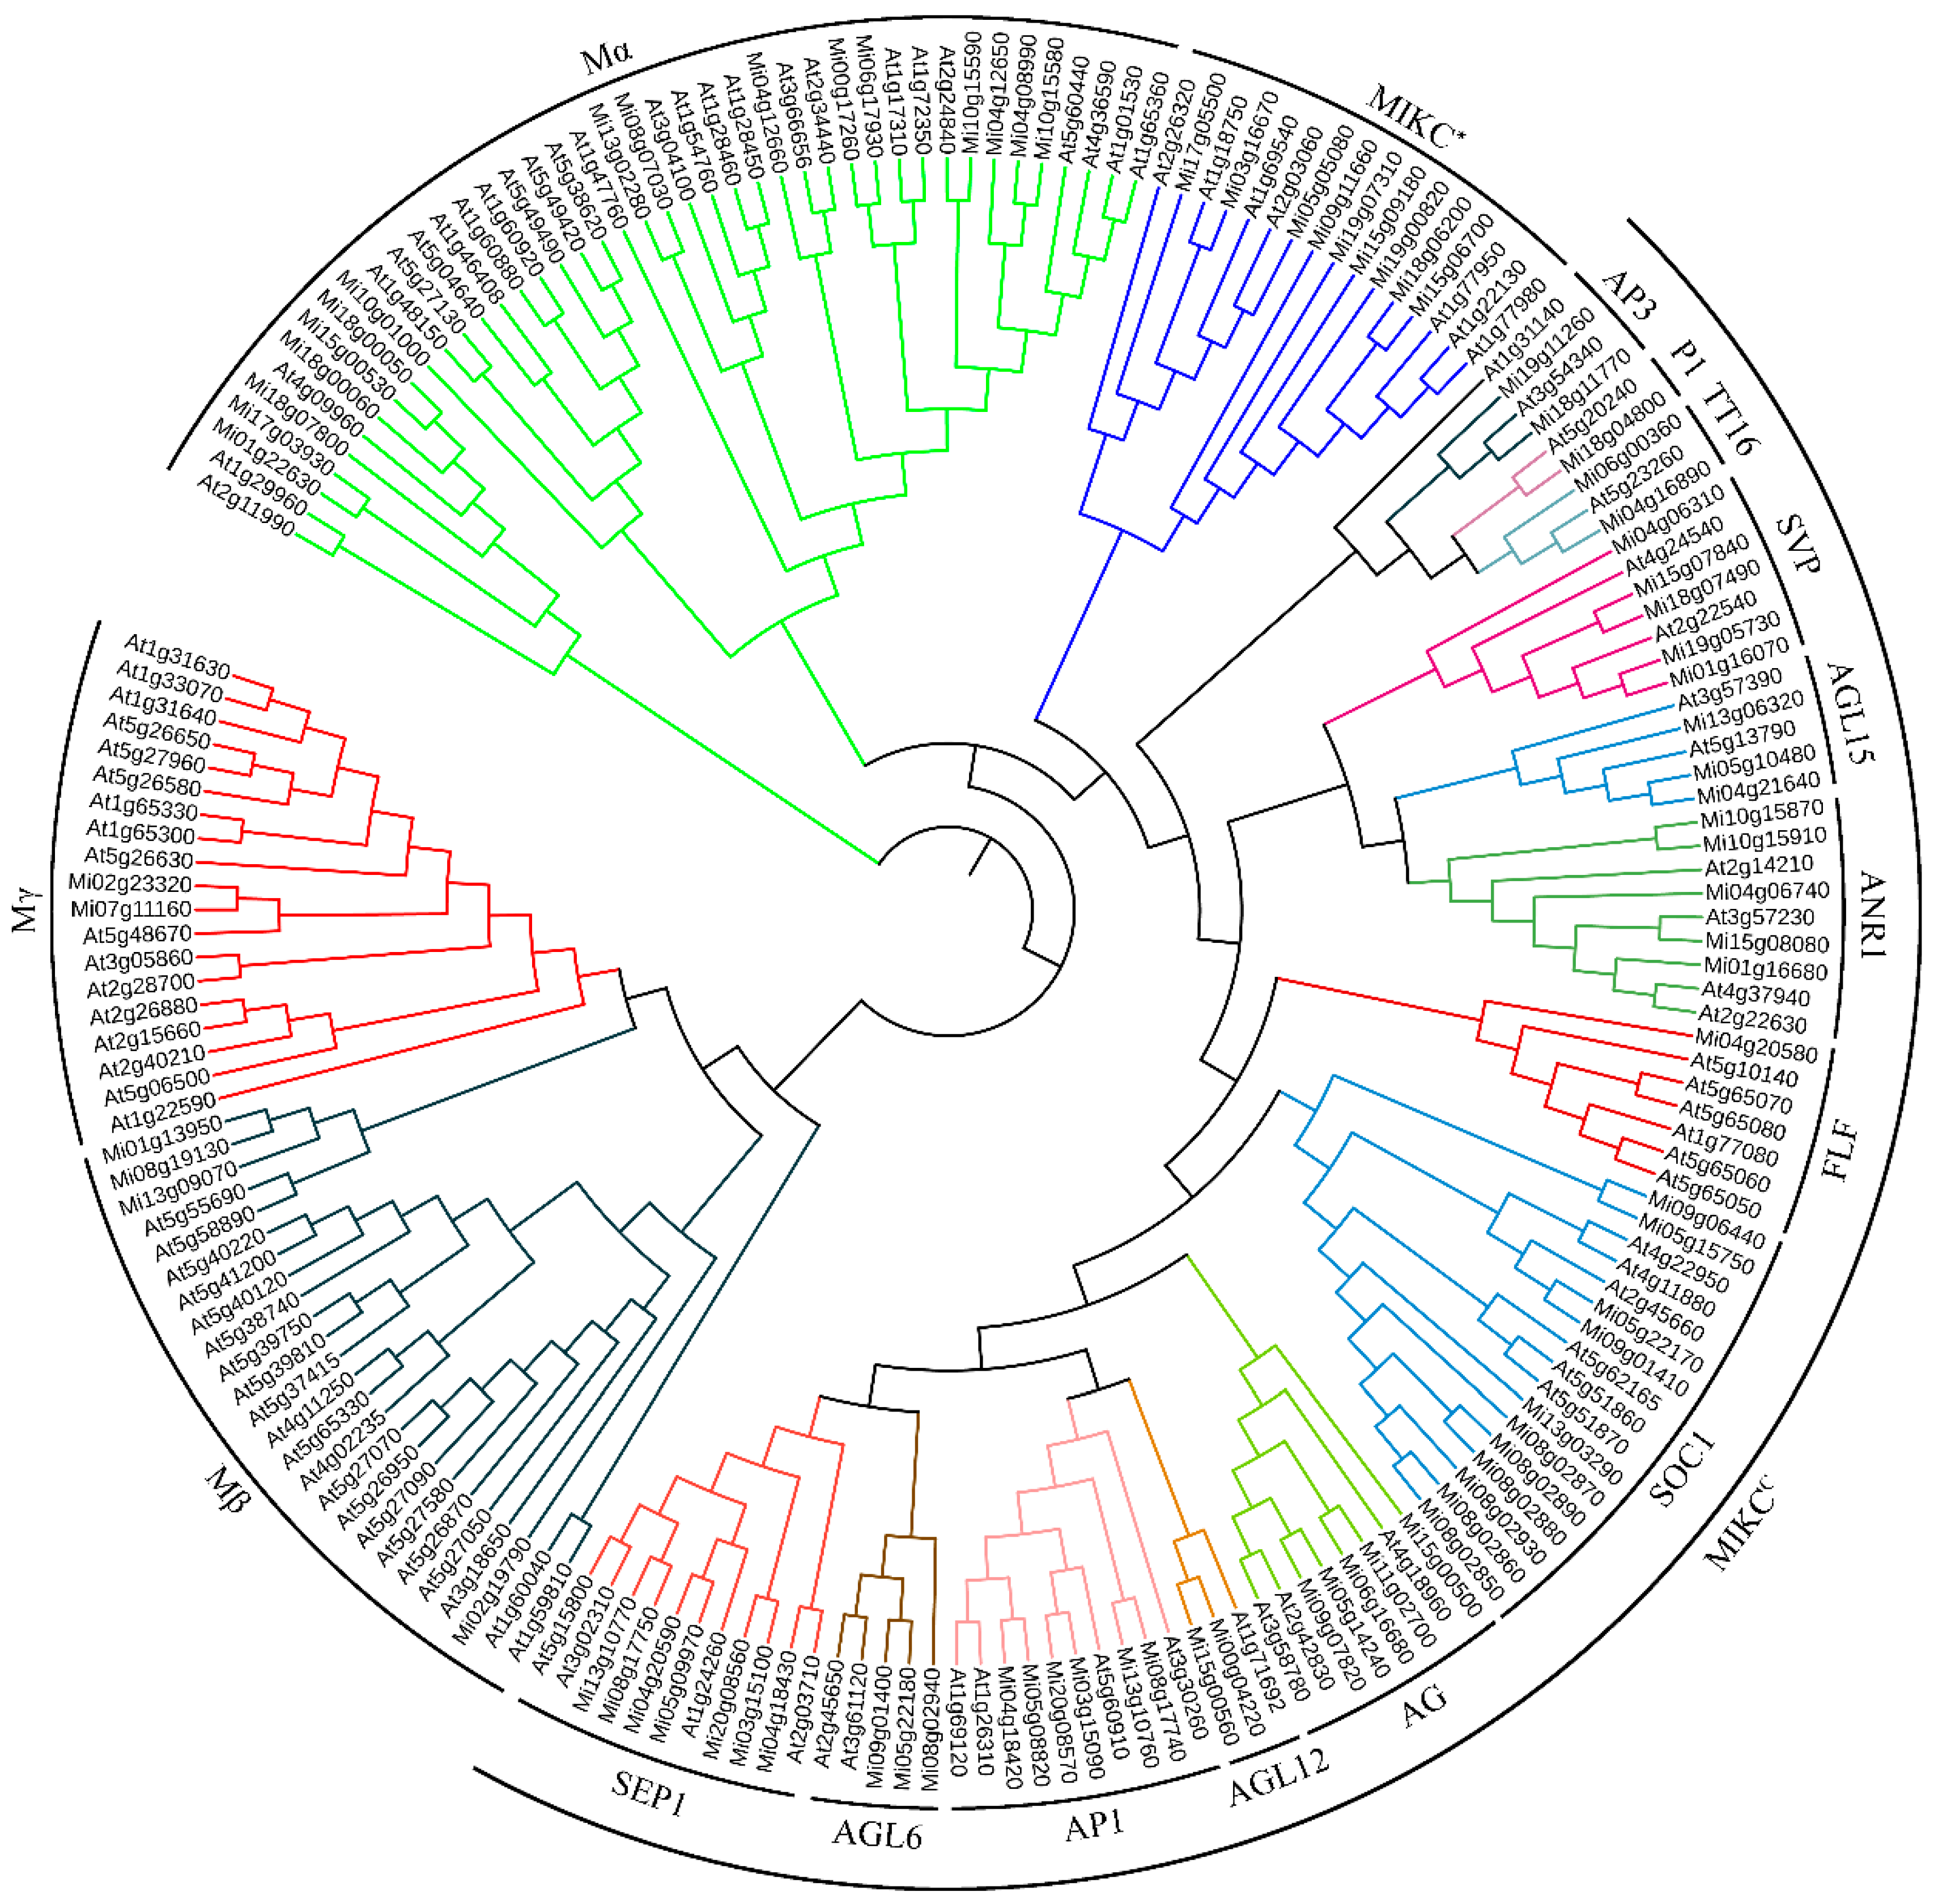
3.2. Phylogenetic Relationships of the MiMADS Proteins
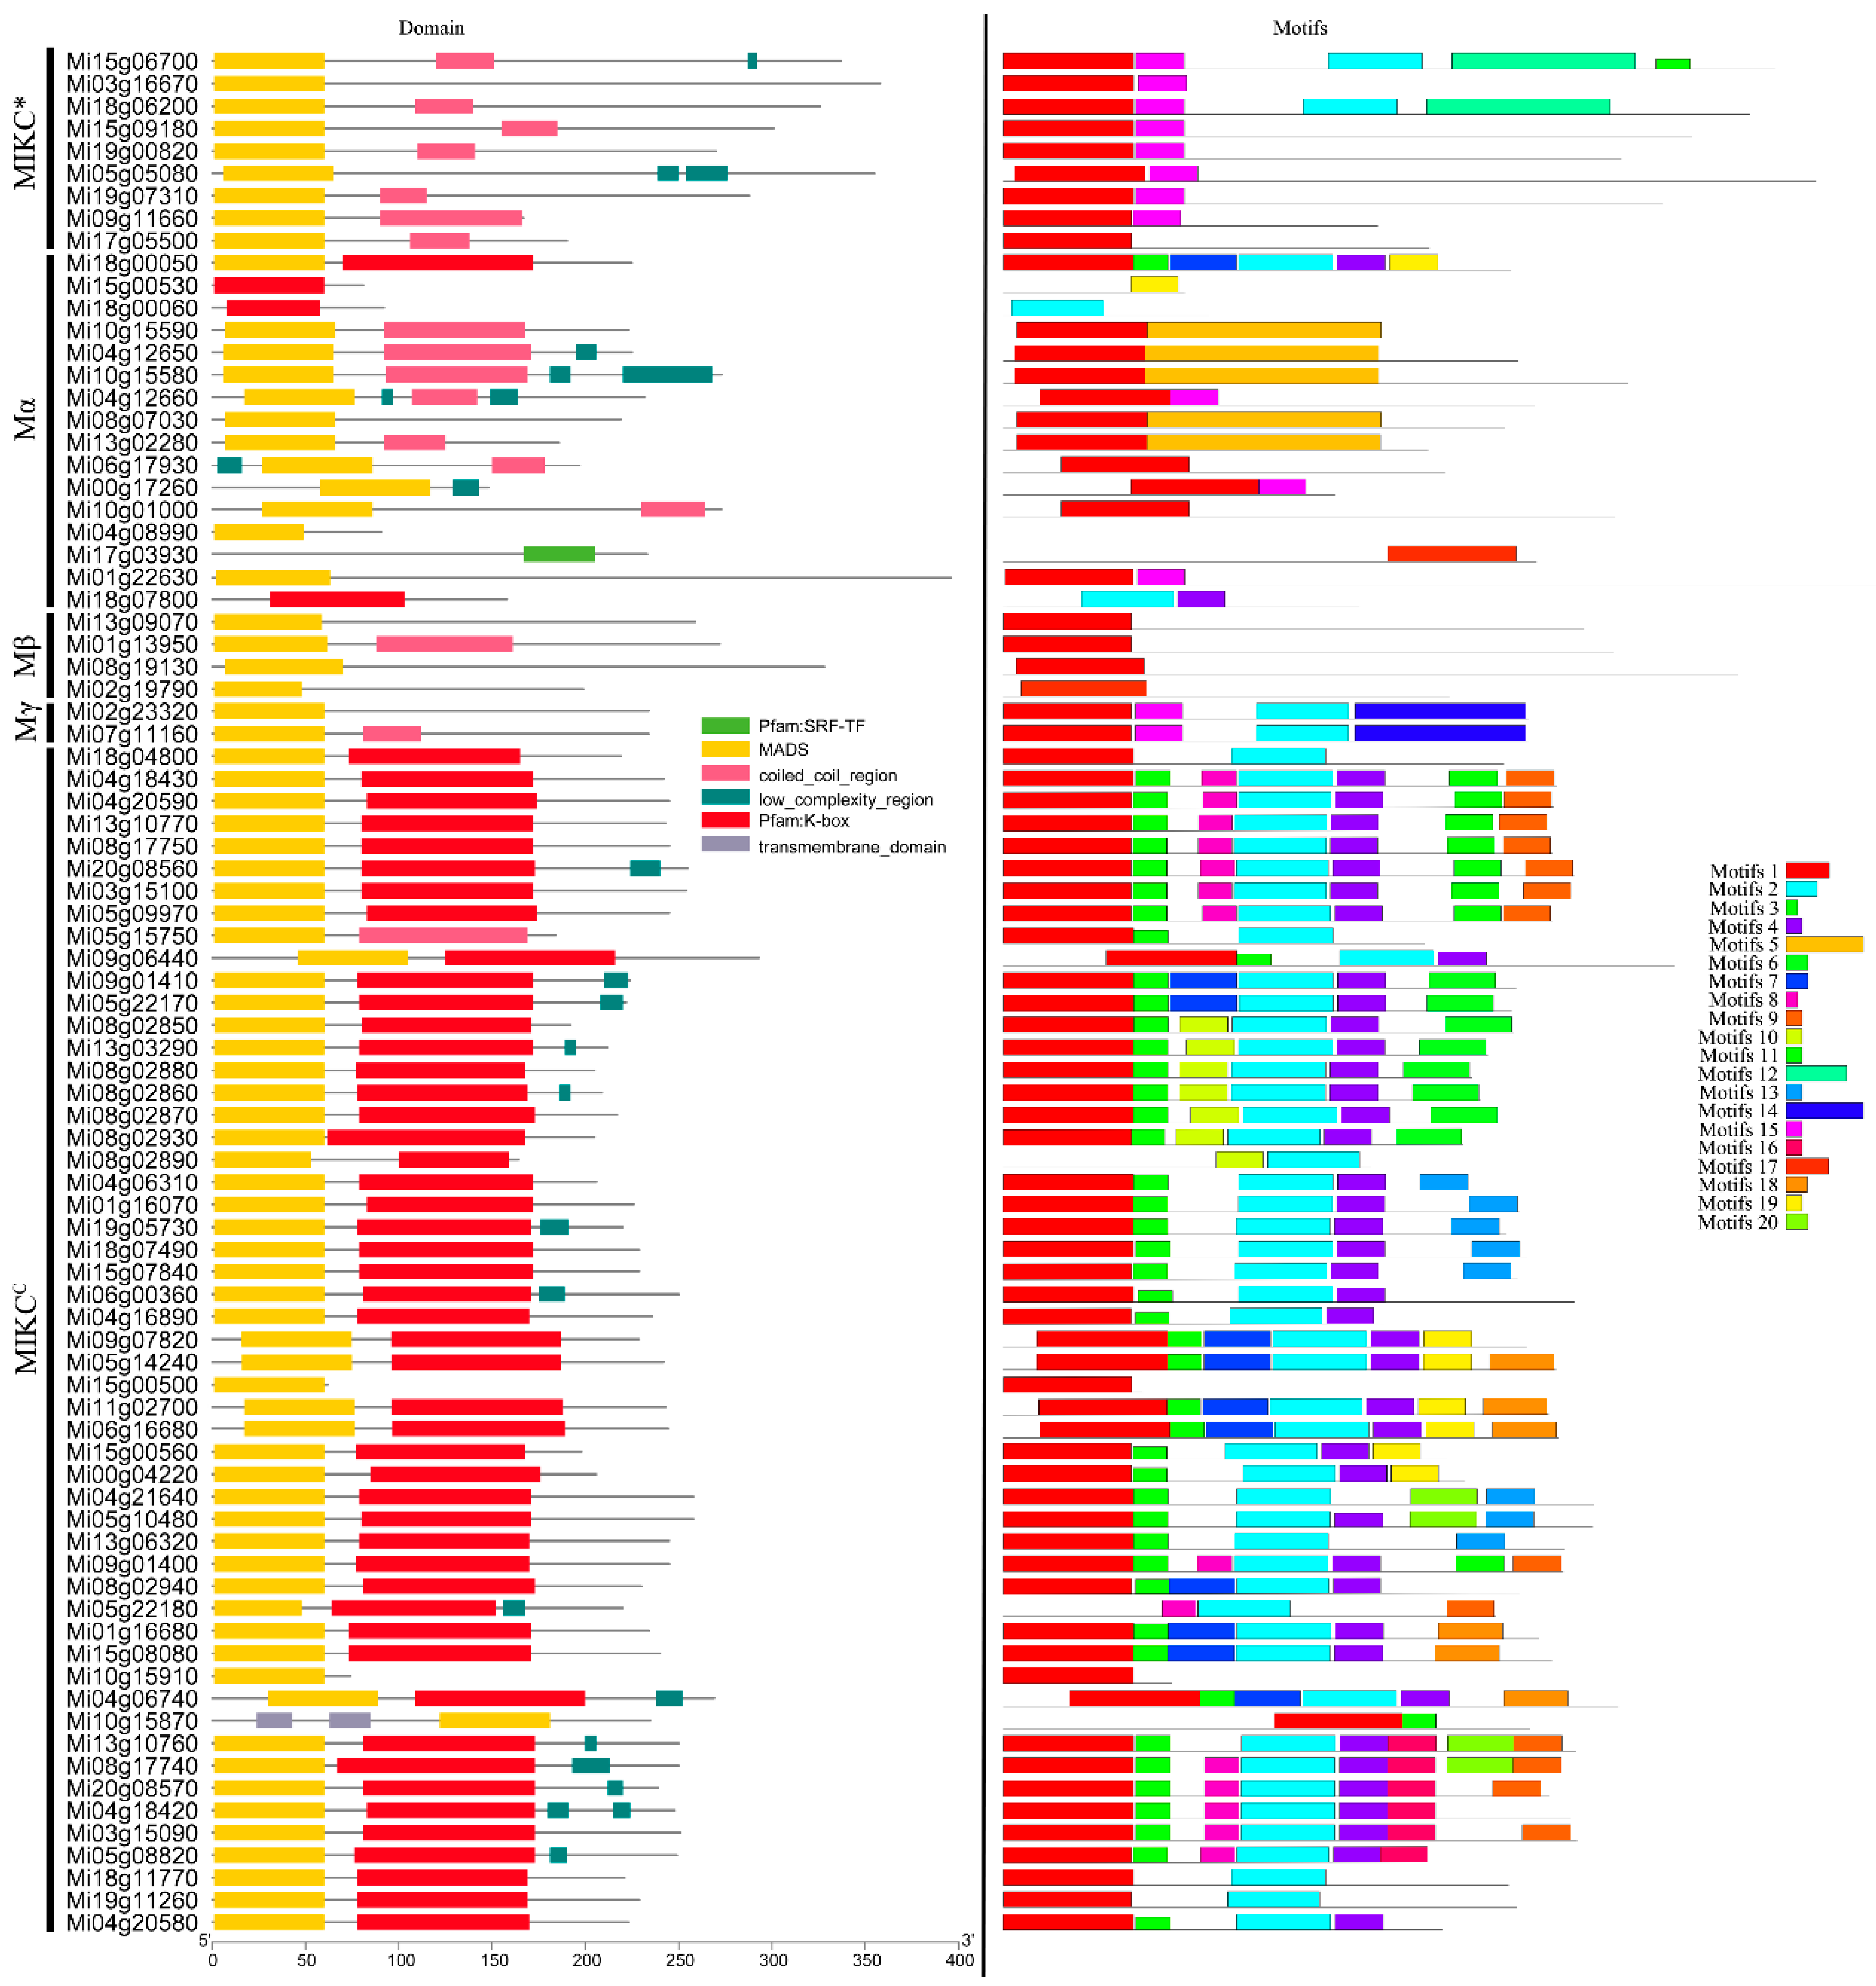
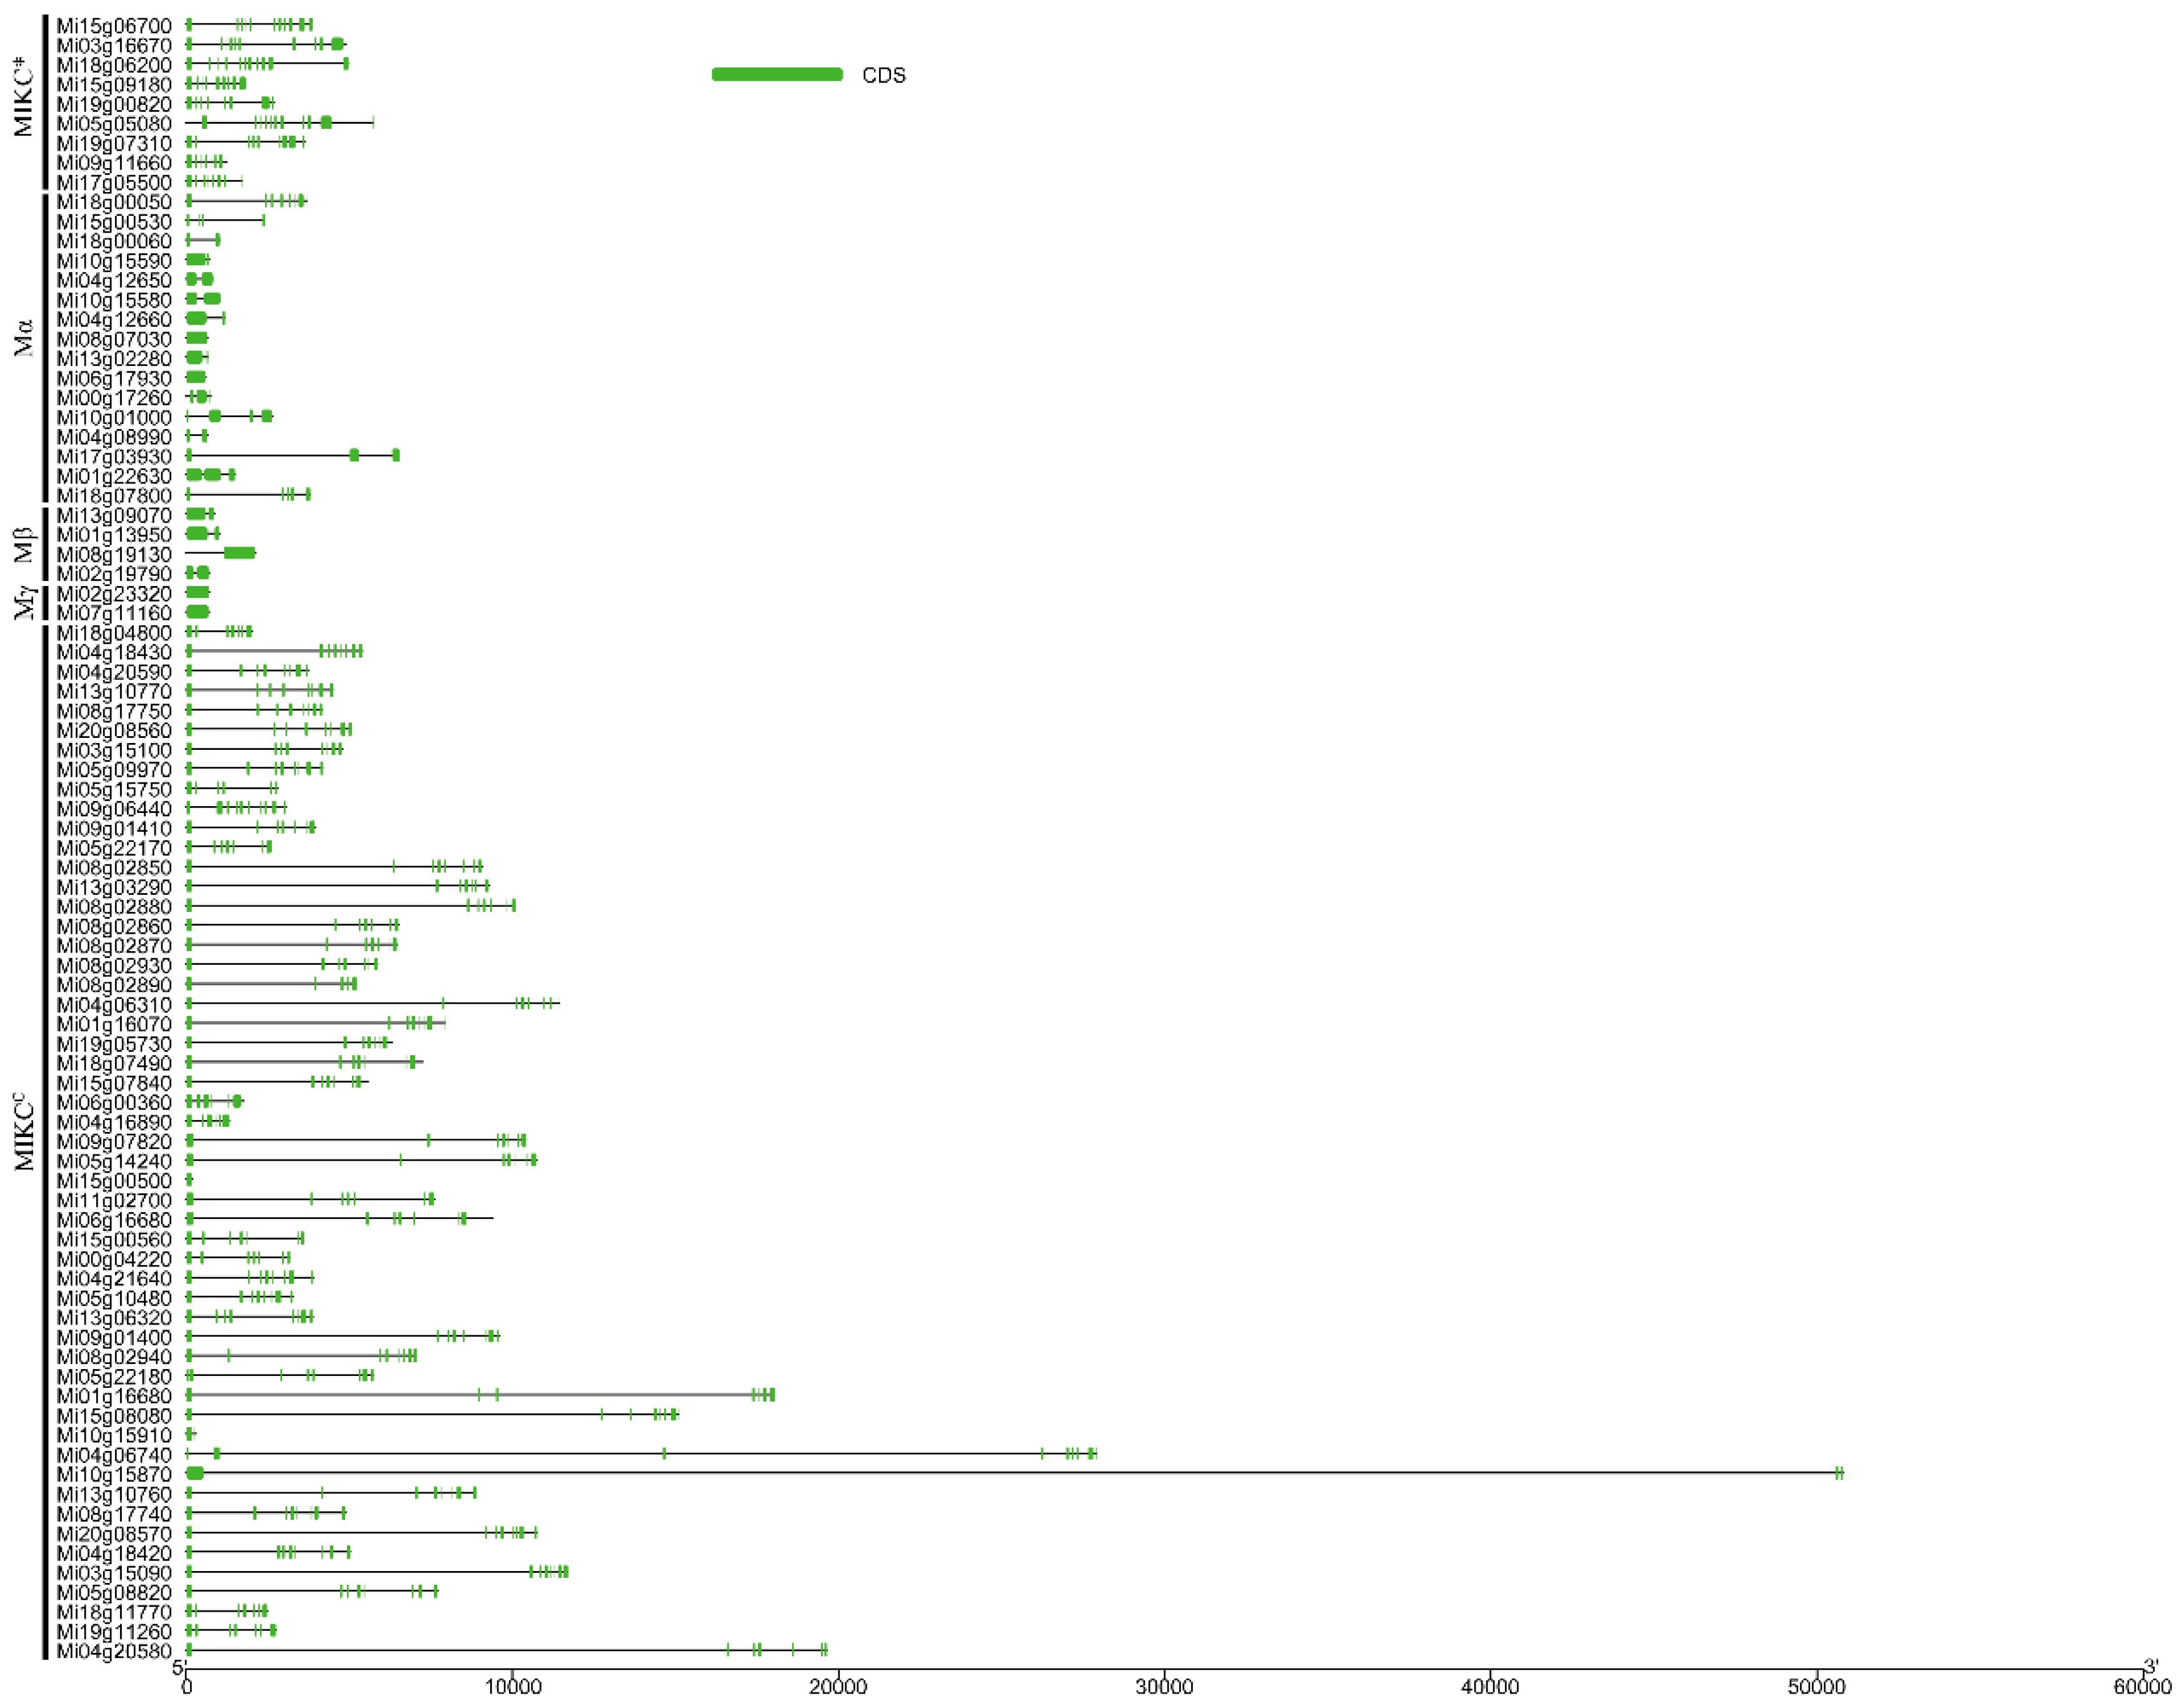
3.3. Gene Structure and Conserved Motifs in MiMADS Proteins
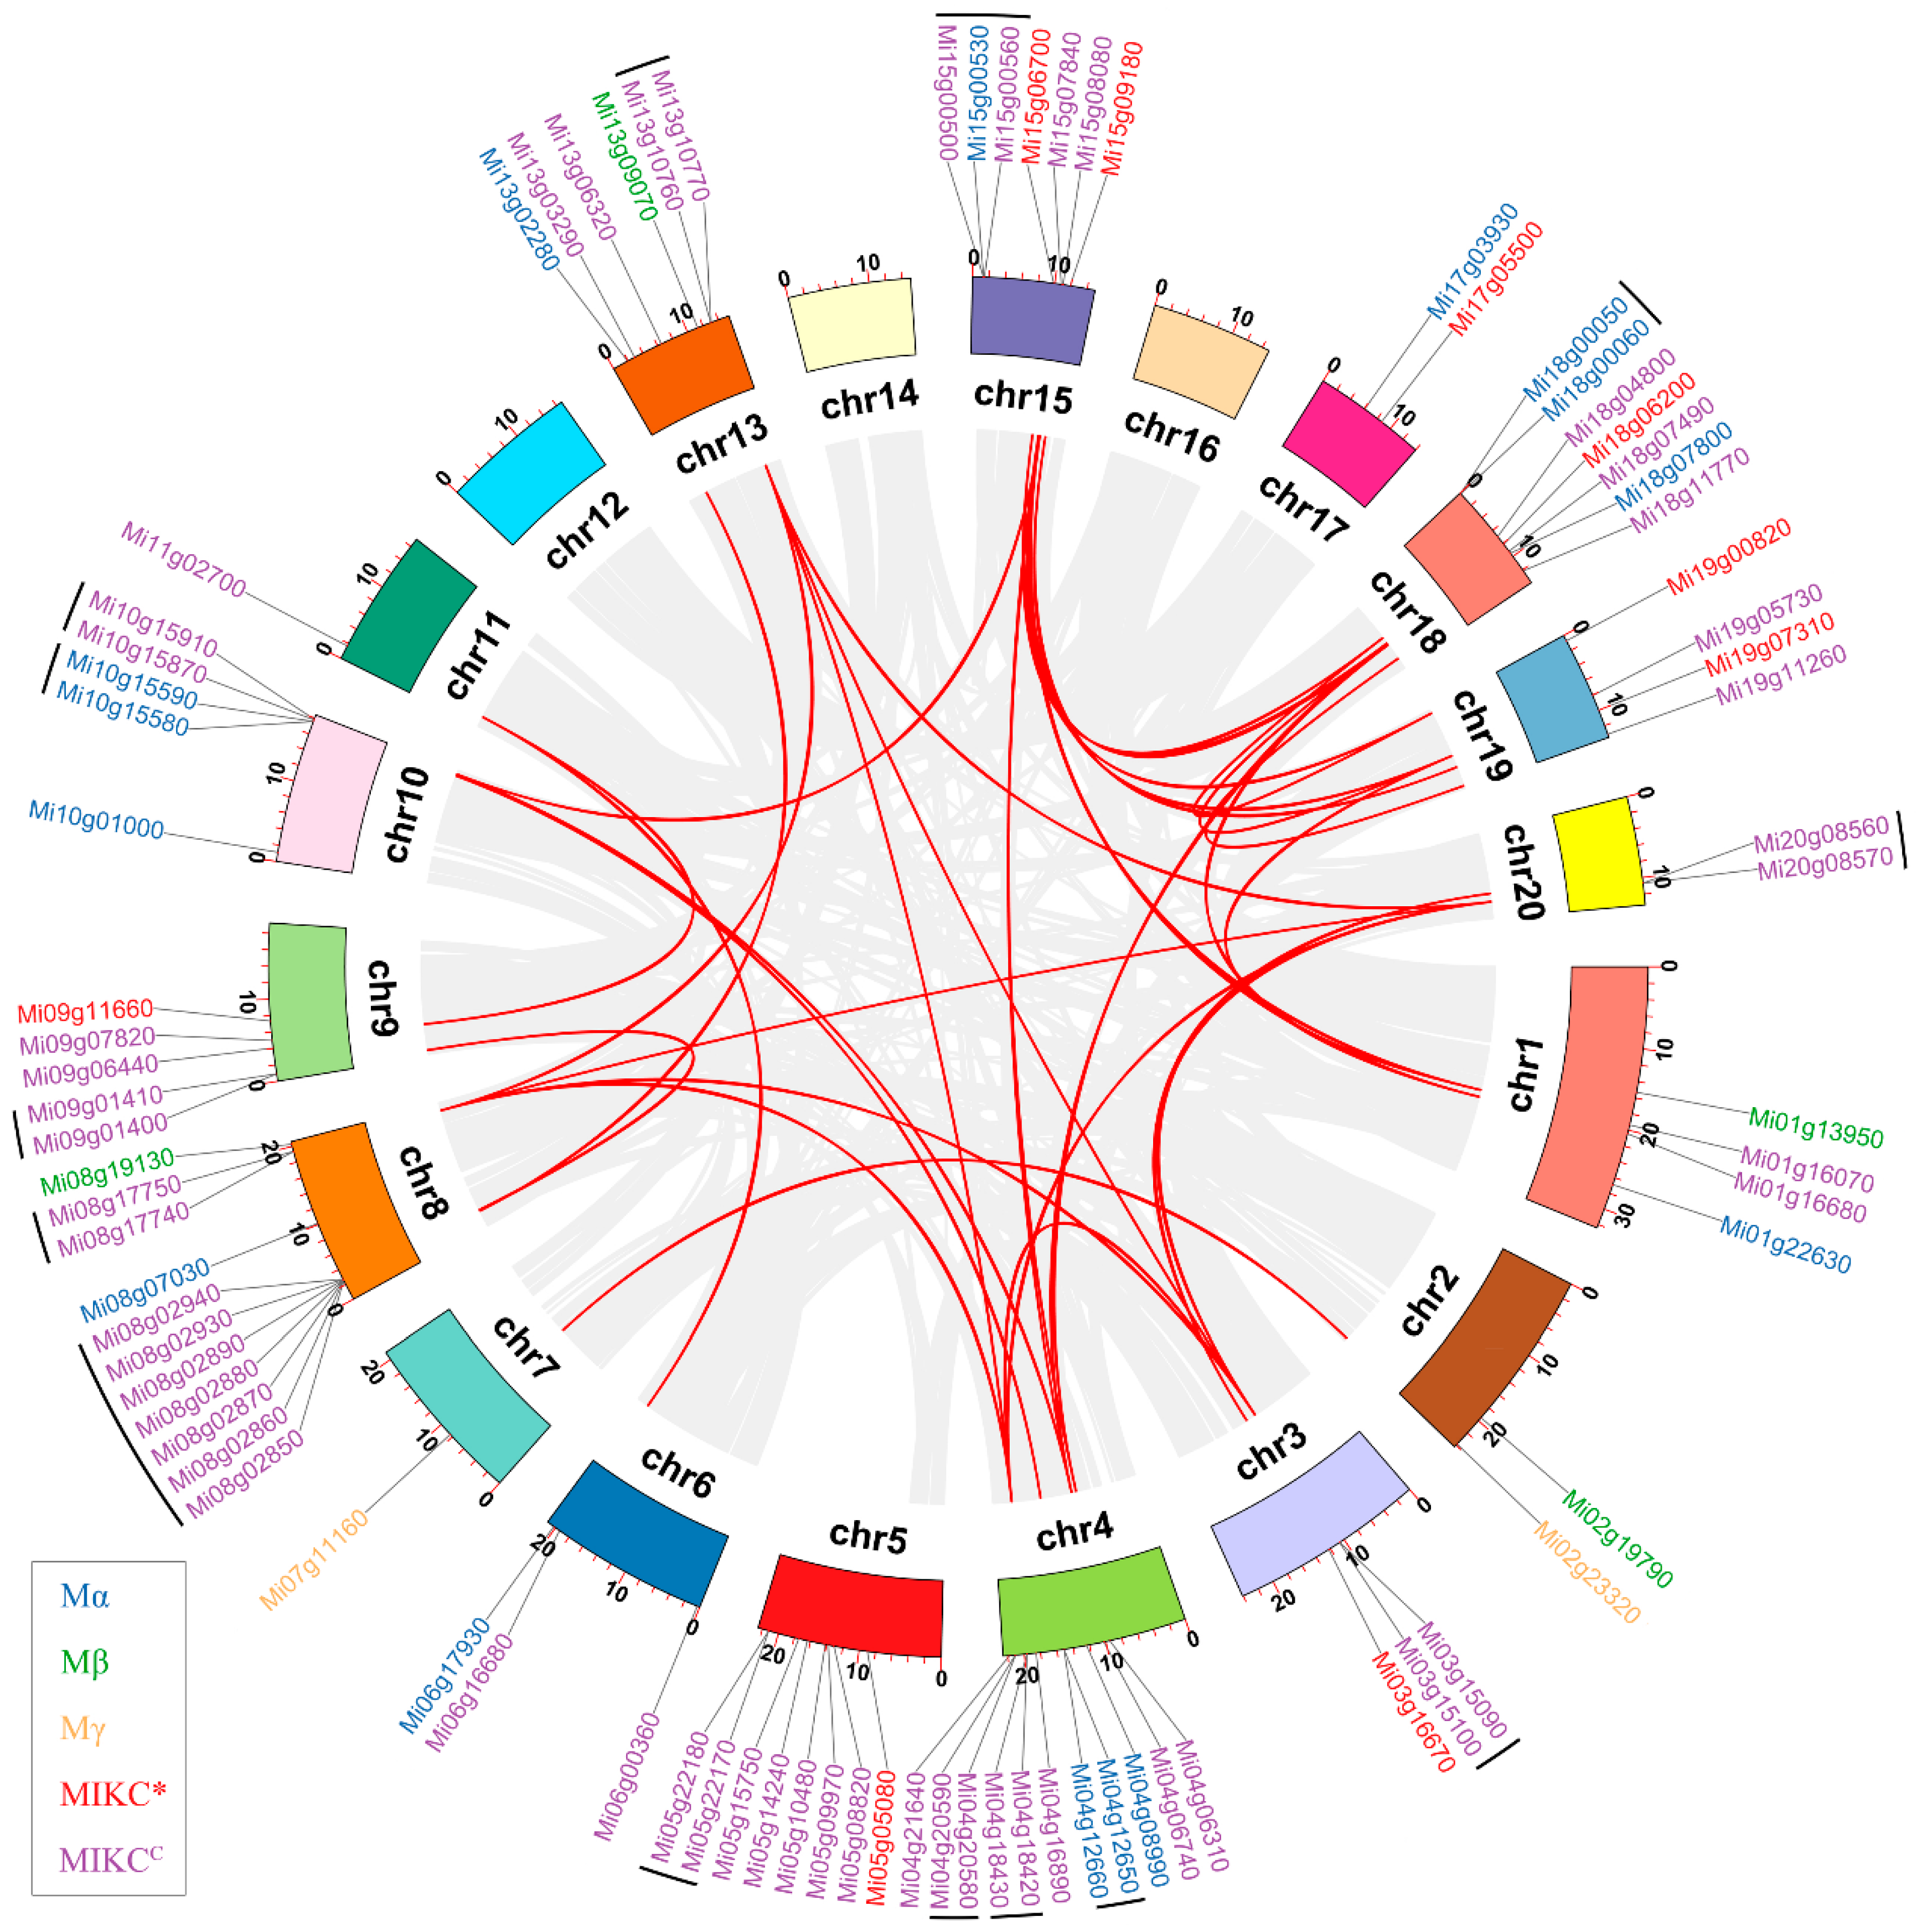
3.4. Chromosomal Localization and Gene Duplication of MiMADS Genes
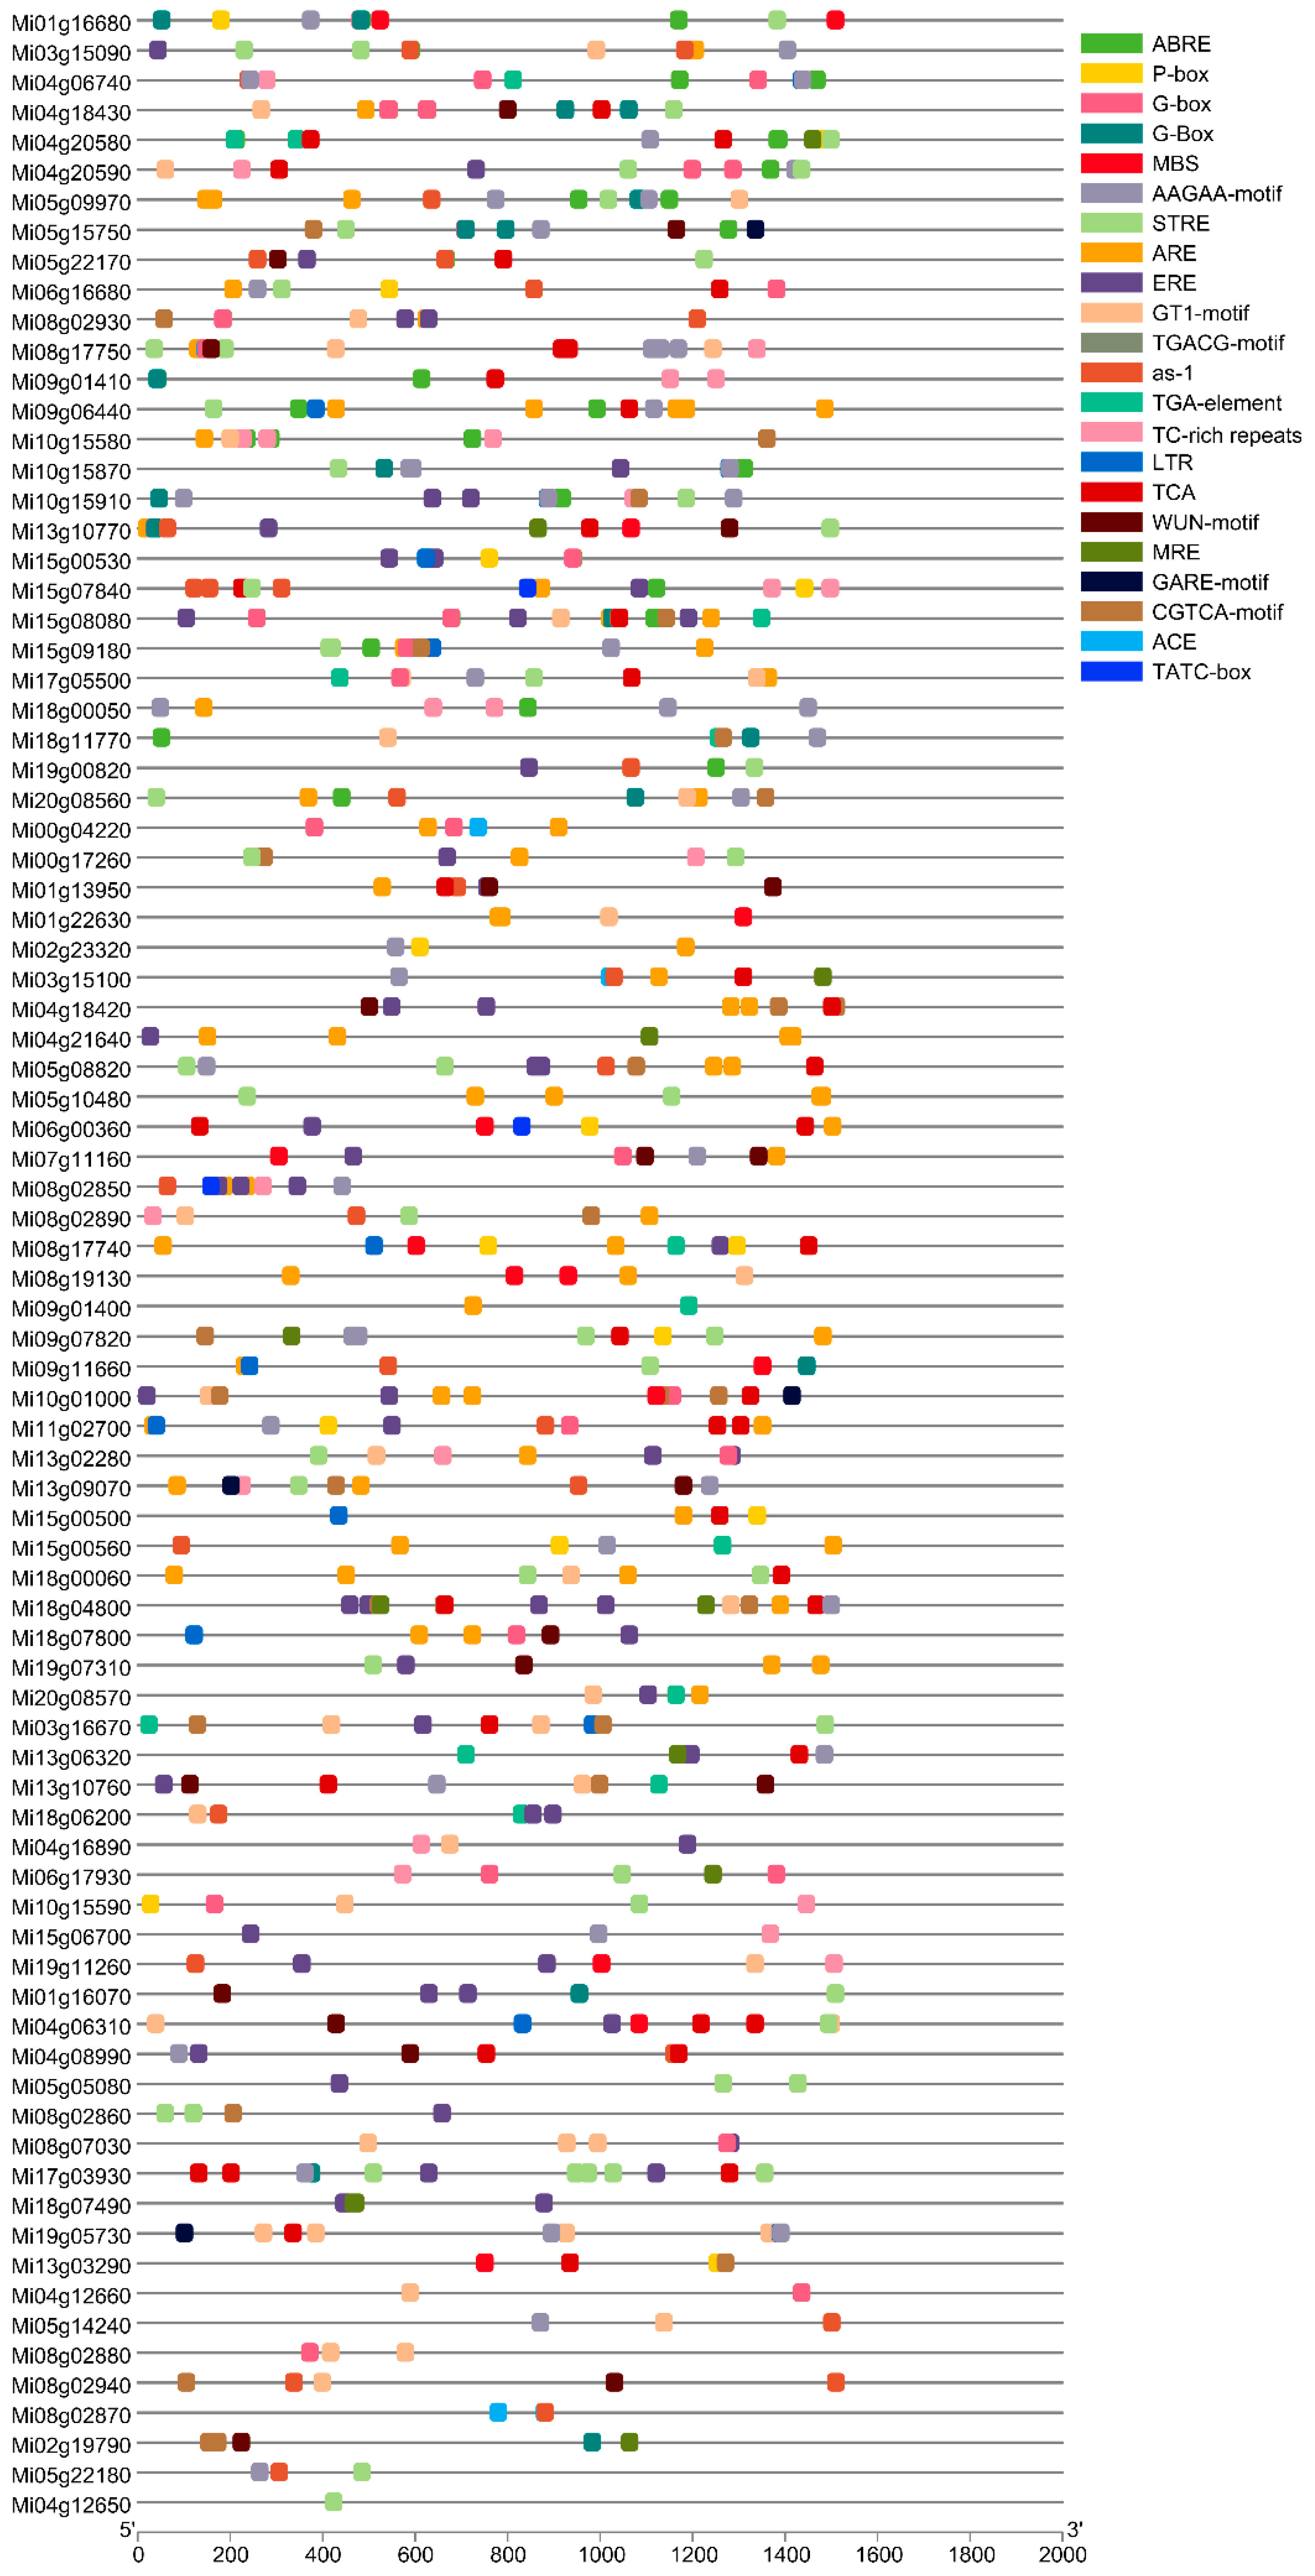
3.5. Promoter Analysis of MADS Gene Family
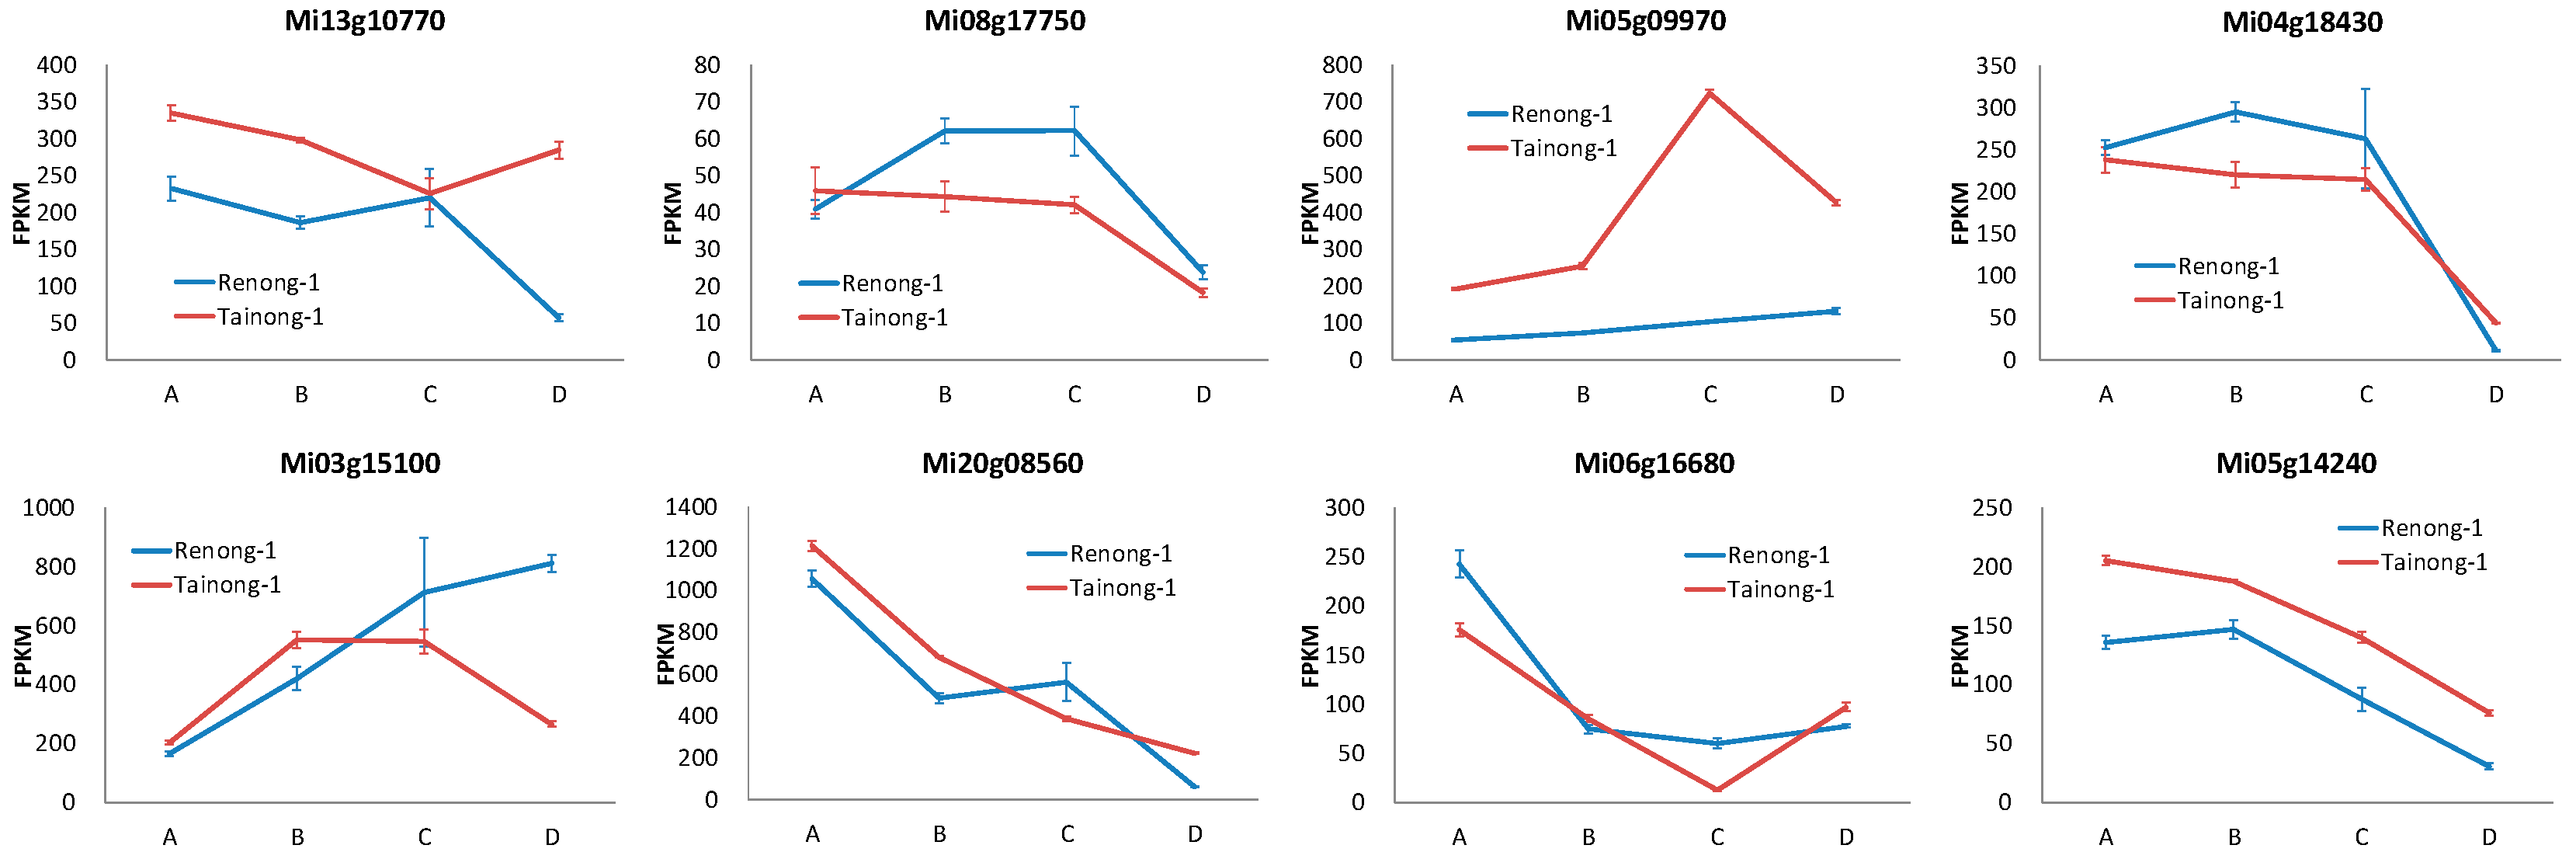
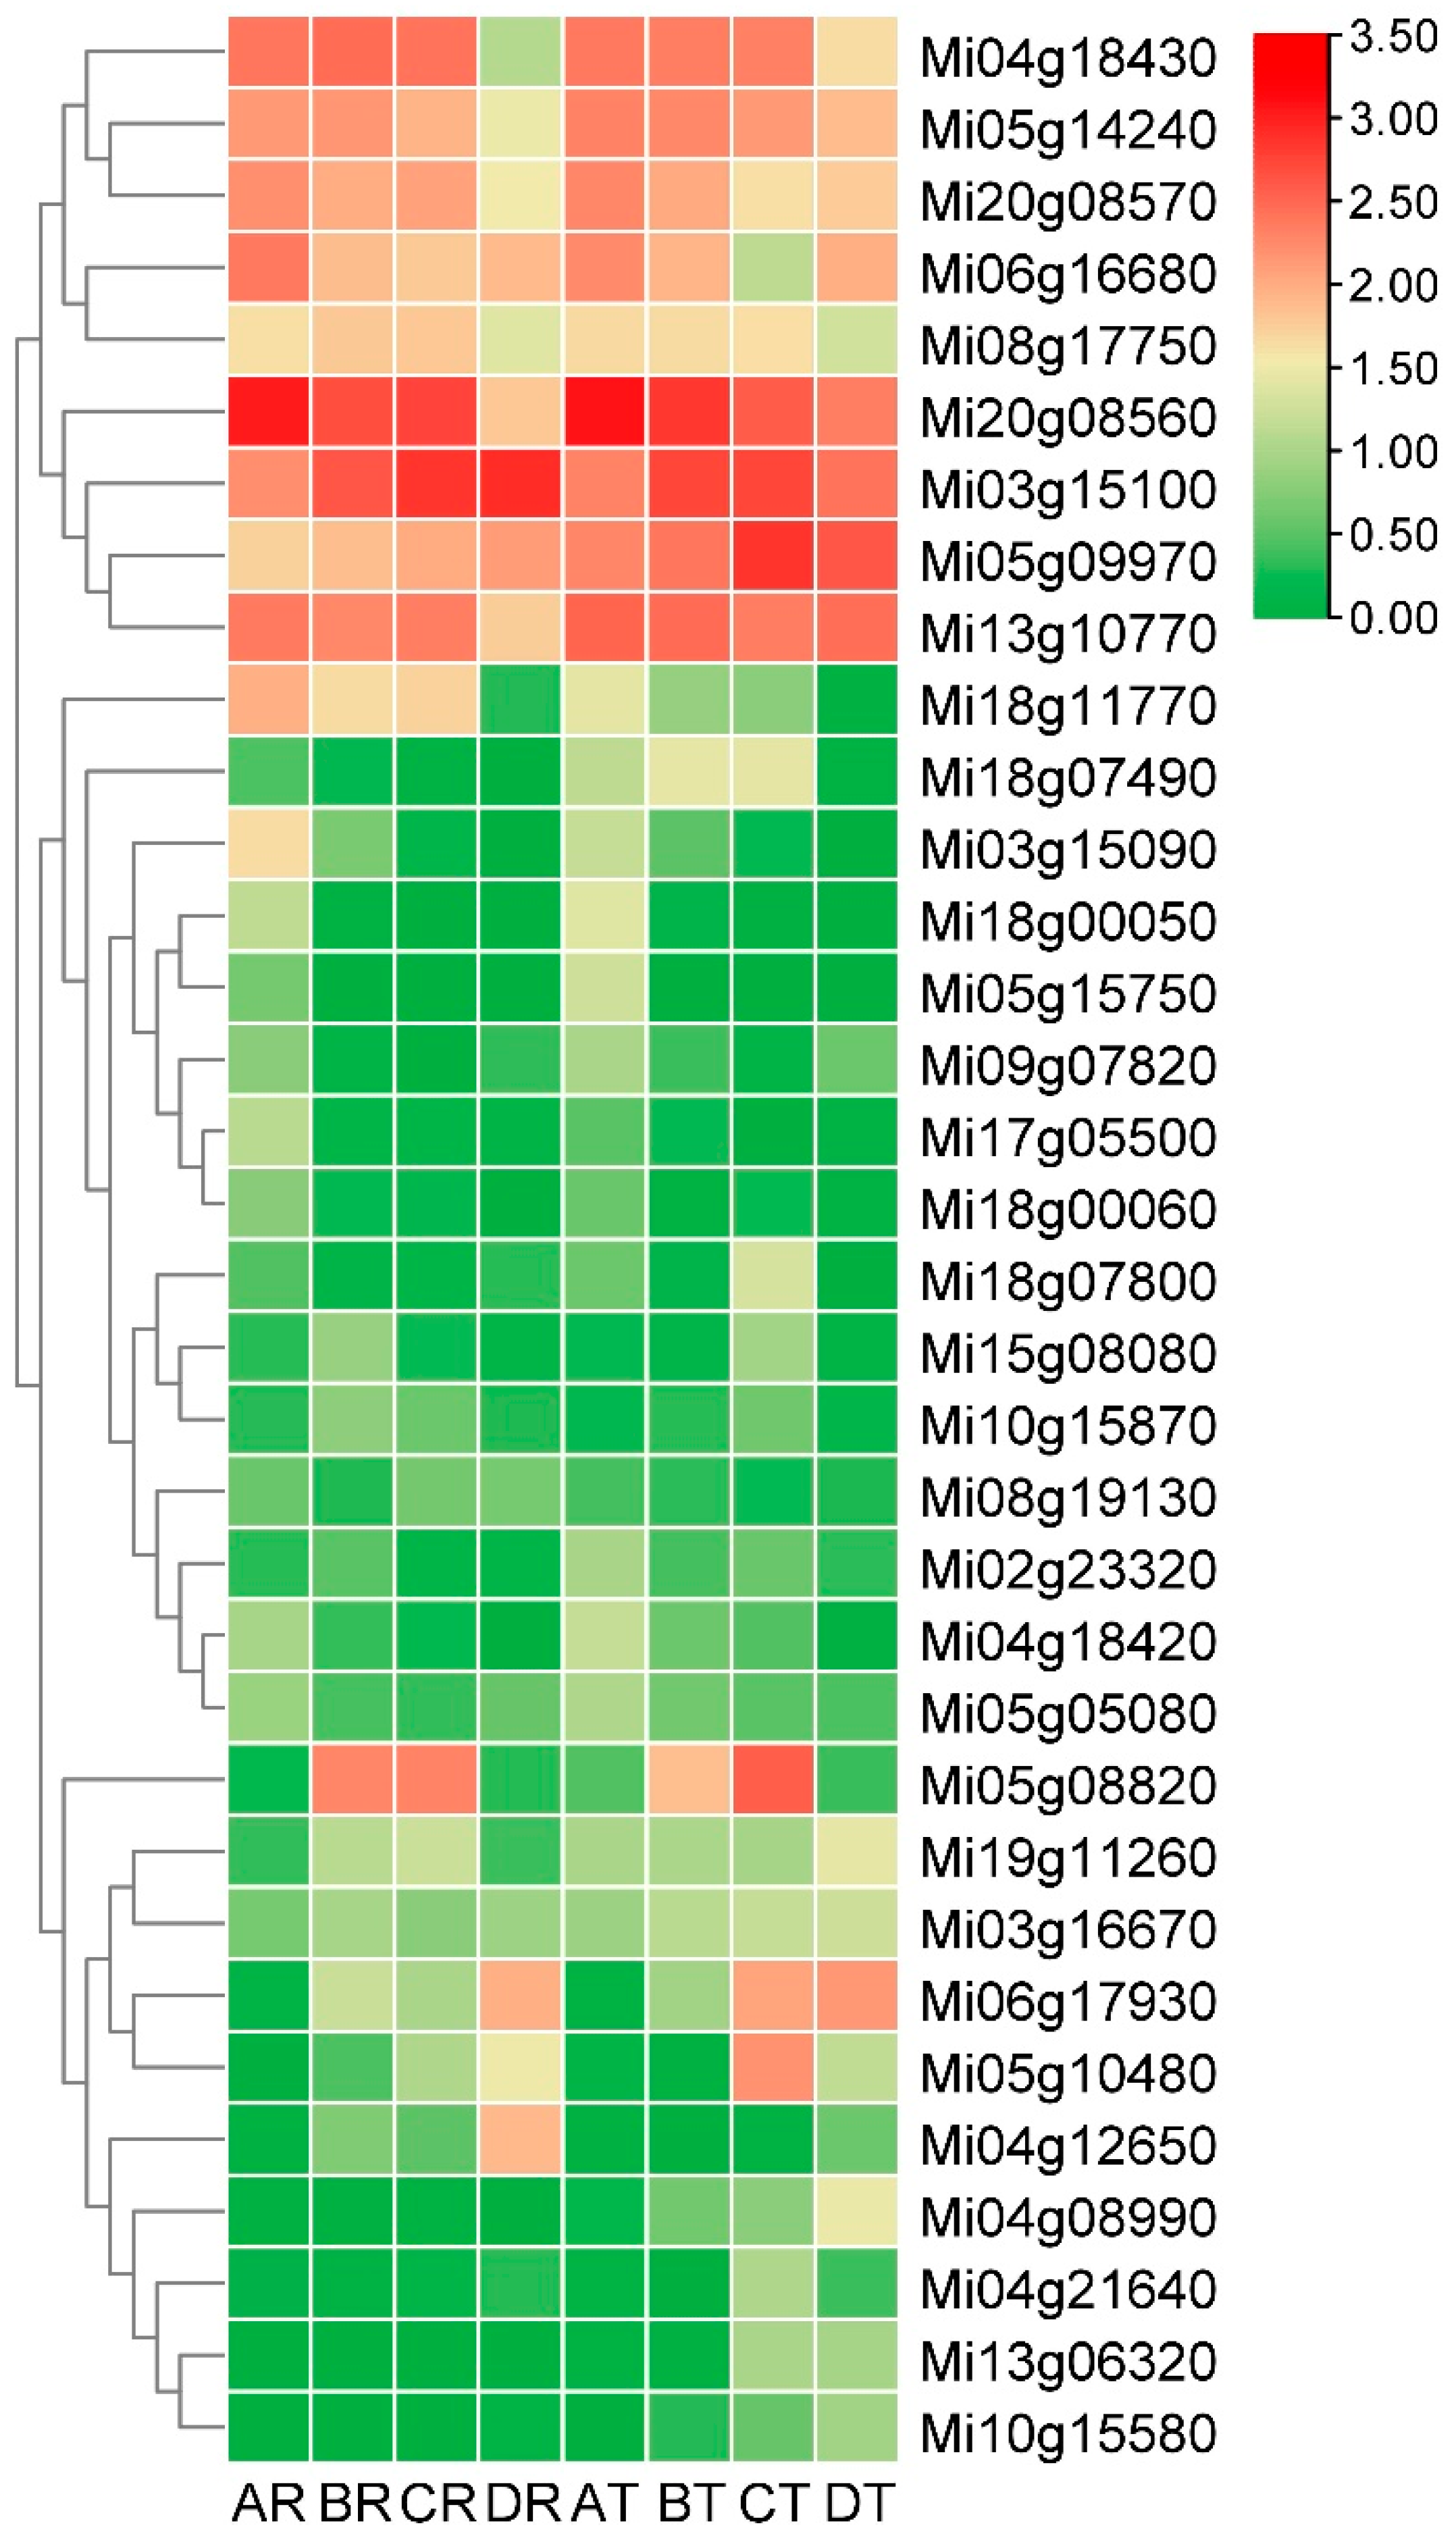
3.6. Screening of Early and Late Maturation Related MADS and Expression Paterns Analysis
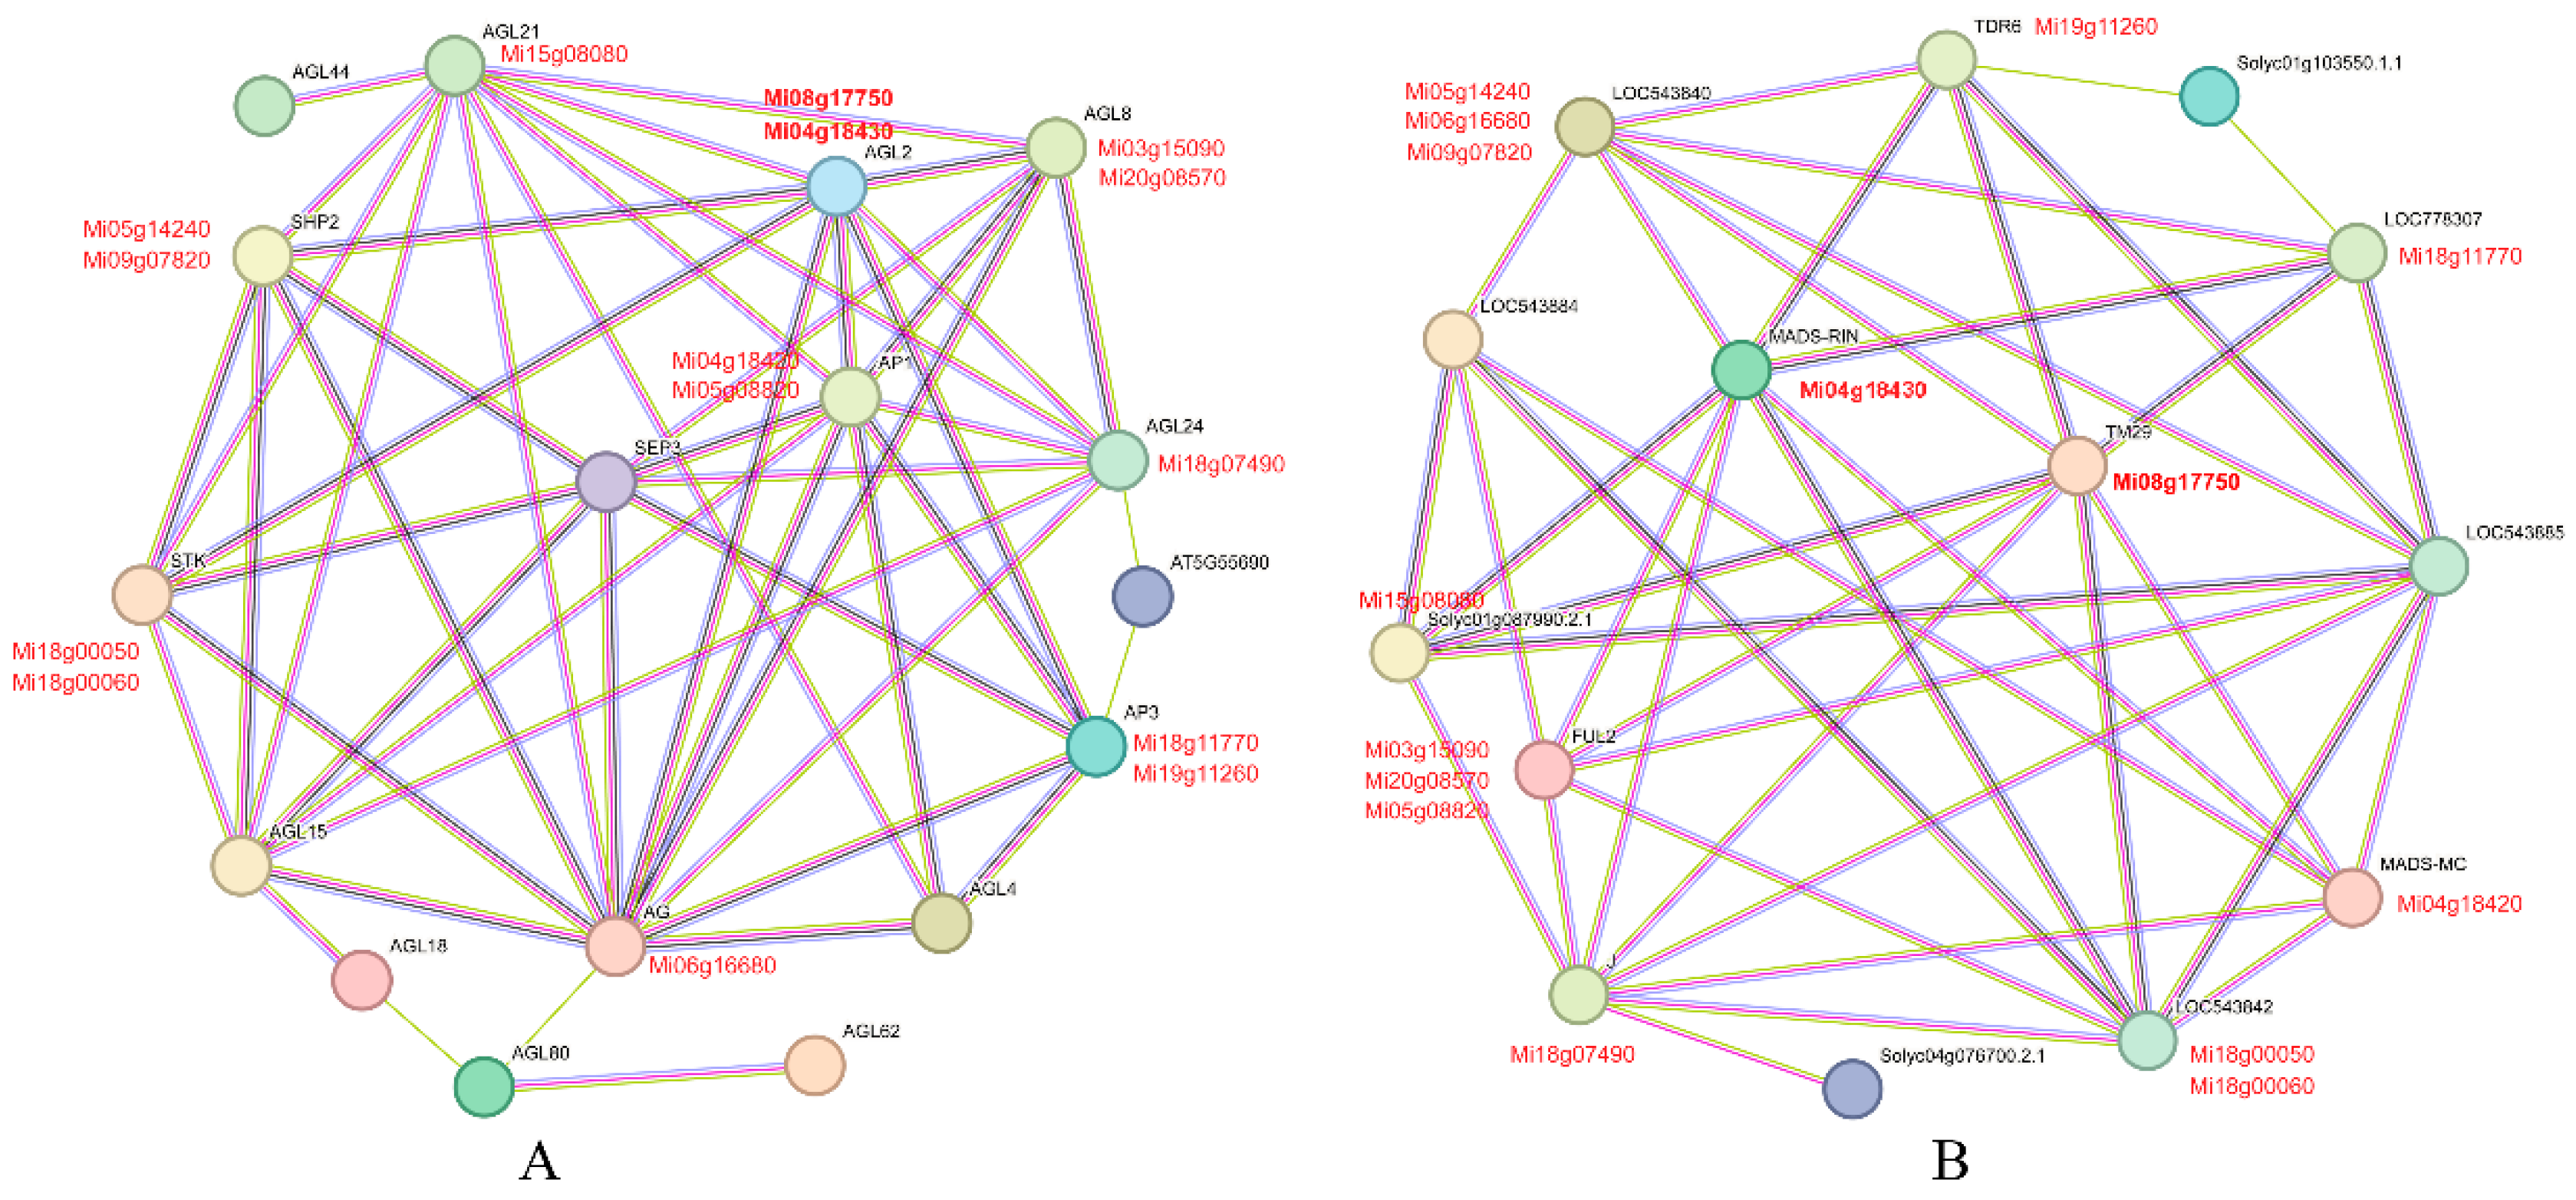
3.7. Protein Interaction Network Analysis of the MiMADS genes
4. Discussion
5. Conclusions
Supplementary Materials
Author Contributions
Funding
Data Availability Statement
Acknowledgments
Conflicts of Interest
References
- Riechmann J.L; Heard J.; Martin G.; Reuber L.; Jiang C.; Keddie J.; Adam L.; Pineda O.; Ratcliffe O.J.; Samaha R.R.; Creelman R.; Pilgrim M.; Broun P.; Zhang J.Z.; Ghandehari D.; Sherman B.K.; Yu G. Arabidopsis transcription factors: genome-wide comparative analysis among eukaryotes. Science 2000, 290(5499), 2105–2110. [CrossRef] [PubMed]
- Messenguy F.; Dubois E. Role of MADS box proteins and their cofactors in combinatorial control of gene expression and cell development. Gene 2003, 316, 1–21. [CrossRef] [PubMed]
- Alvarez-Buylla E.R.; Liljegren S.J.; Pelaz S.; Gold S.E.; Burgeff C.; Ditta G.S.; Vergara-Silva F.; Yanofsky M.F. MADS-box gene evolution beyond flowers: expression in pollen, endosperm, guard cells, roots and trichomes. Plant J. 2000, 24(4), 457–466. [CrossRef] [PubMed]
- Parenicová L.; de Folter S.; Kieffer M.; Horner D.S.; Favalli C.; Busscher J.; Cook H.E.; Ingram R.M.; Kater M.M.; Davies B.; Angenent G.C.; Colombo L. Molecular and phylogenetic analyses of the complete MADS-box transcription factor family in Arabidopsis: new openings to the MADS world. Plant Cell 2003, 15(7), 1538–1551. [CrossRef] [PubMed] [PubMed Central]
- Henschel K.; Kofuji R.; Hasebe M.; Saedler H.; Münster T.; Theissen G. Two ancient classes of MIKC-type MADS-box genes are present in the moss Physcomitrella patens. Mol Biol Evol. 2002, 19(6), 801–814. [CrossRef] [PubMed]
- Kwantes M.; Liebsch D.; Verelst W. How MIKC* MADS-box genes originated and evidence for their conserved function throughout the evolution of vascular plant gametophytes. Mol Biol Evol. 2012, 29(1), 293–302. [CrossRef] [PubMed]
- Falavigna V.; Severing E.; Lai X.; Estevan J.; Farrera I.; Hugouvieux V.; Revers L.F.; Zubieta C.; Coupland G.; Costes E.; Andrés F. Unraveling the role of MADS transcription factor complexes in apple tree dormancy. New Phytol. 2021, 232(5), 2071–2088. [CrossRef] [PubMed] [PubMed Central]
- Wang Z.; Wang F.; Hong Y.; Yao J.; Ren Z.; Shi H.; Zhu J.K. The flowering repressor SVP confers drought resistance in Arabidopsis by regulating abscisic acid catabolism. Mol Plant. 2018, 1184–1197. [CrossRef]
- Chen R.; Ma J.; Luo D.; Hou X.; Ma F.; Zhang Y.; Meng Y.; Zhang H.; Guo W. CaMADS, a MADS-box transcription factor from pepper, plays an important role in the response to cold, salt, and osmotic stress. Plant Sci. 2019, 280, 164–174. [CrossRef]
- Ratcliffe O.J.; Kumimoto R.W.; Wong B.J.; Riechmann J.L. Analysis of the Arabidopsis MADS AFFECTING FLOWERING gene family: MAF2 prevents vernalization by short periods of cold. Plant Cell 2003, 15(5), 1159–1169. [CrossRef] [PubMed] [PubMed Central]
- Liao W.Y.; Lin L.F.; Lin M.D.; Hsieh S.C.; Li A.Y.; Tsay Y.S.; Chou M.L. Overexpression of Lilium formosanum MADS-box (LFMADS) causing floral defects while promoting flowering in Arabidopsis thaliana, whereas only affecting floral transition time in Nicotiana tabacum. Int J Mol Sci. 2018, 19(8), 2217. [CrossRef] [PubMed] [PubMed Central]
- Benlloch R.; Roque E.; Ferrándiz C.; Cosson V.; Caballero T.; Penmetsa R.V.; Beltrán J.P.; Cañas L.A.; Ratet P.; Madueño F. Analysis of B function in legumes: PISTILLATA proteins do not require the PI motif for floral organ development in Medicago truncatula. Plant J. 2009, 60(1), 102–111. [CrossRef] [PubMed]
- Ferrario S.; Shchennikova A.V.; Franken J.; Immink R.G.; Angenent G.C. Control of floral meristem determinacy in petunia by MADS-box transcription factors. Plant Physiol. 2006, 140(3), 890–898. [CrossRef] [PubMed] [PubMed Central]
- Yu X.; Chen G.; Guo X.; Lu Y.; Zhang J.; Hu J.; Tian S.; Hu Z. Silencing SiAGL6, a tomato AGAMOUS-LIKE6 lineage gene, generates fused sepal and green petal. Plant Cell Rep. 2017, 36(6), 959–969. [CrossRef] [PubMed]
- Li N.; Huang B.; Tang N.; Jian W.; Zou J.; Chen J.; Cao H.; Habib S.; Dong X.; Wei W.; Gao Y.; Li Z. The MADS-box gene SiMBP21 regulates sepal size mediated by ethylene and auxin in tomato. Plant Cell Physiol. 2017, 58(12), 2241–2256. [CrossRef] [PubMed]
- Pelaz S.; Ditta G.S.; Baumann E.; Wisman E.; Yanofsky M.F. B and C floral organ identity functions require SEPALLATA MADS-box genes. Nature 2000, 405(6783), 200–203. [CrossRef] [PubMed]
- Pan. I.L.; Mcquinn R.; Giovannoni J.J.; Irish, V.F. Functional diversification of AGAMOUS lineage genes in regulating tomato flower and fruit development. J. Exp. Bot. 2010, 61(6), 1795–1806. [CrossRef] [PubMed] [PubMed Central]
- Giménez E.; Pineda B.; Capel J.; Antón M.T.; Atarés A.; Pérez-Martín F.; García-Sogo B.; Angosto T.; Moreno V.; Lozano R. Functional analysis of the Arlequin mutant corroborates the essential role of the Arlequin/TAGL1 gene during reproductive development of tomato. PLoS One 2010, 5(12), e14427. [CrossRef] [PubMed] [PubMed Central]
- Guo X.; Chen G.; Naeem M.; Yu X.; Tang B.; Li A.; Hu Z. The MADS-box gene SiMBP11 regulates plant architecture and affects reproductive development in tomato plants. Plant Sci. 2017, 258, 90–101. [CrossRef] [PubMed]
- Mizzotti C.; Mendes M.A.; Caporali E.; Schnittger A.; Kater M.M.; Battaglia R.; Colombo L. The MADS box genes SEEDSTICK and ARABIDOPSIS Bsister play a maternal role in fertilization and seed development. Plant J. 2012, 70(3), 409–420. [CrossRef] [PubMed]
- Malabarba J.; Buffon V.; Mariath J.E.A.; Gaeta M.L.; Dornelas M.C.; Margis-Pinheiro M.; Pasquali G.; Revers L.F. The MADS-box gene Agamous-like 11 is essential for seed morphogenesis in grapevine. J Exp Bot. 2017, 68(7), 1493–1506. [CrossRef] [PubMed]
- Chen C.; Begcy K.; Liu K.; Folsom J.J.; Wang Z.; Zhang C.; Walia H. Heat stress yields a unique MADS box transcription factor in determining seed size and thermal sensitivity. Plant Physiol. 2016, 171(1), 606–622. [CrossRef] [PubMed] [PubMed Central]
- Nesi N.; Debeaujon I.; Jond C.; Stewart A.J.; Jenkins G.I.; Caboche M.; Lepiniec L. The TRANSPARENT TESTA16 locus encodes the ARABIDOPSIS BSISTER MADS domain protein and is required for proper development and pigmentation of the seed coat. Plant Cell 2002, 14(10), 2463–2479. [CrossRef] [PubMed] [PubMed Central]
- Tapia-López R.; García-Ponce B.; Dubrovsky J.G.; Garay-Arroyo A.; Pérez-Ruíz R.V.; Kim S.H.; Acevedo F.; Pelaz S.; Alvarez-Buylla E.R. An AGAMOUS-related MADS-box gene, XAL1 (AGL12), regulates root meristem cell proliferation and flowering transition in Arabidopsis. Plant Physiol. 2008, 146(3), 1182–1192. [CrossRef] [PubMed] [PubMed Central]
- Li A.; Chen G.; Yu X.; Zhu Z.; Zhang L.; Zhou S.; Hu Z. The tomato MADS-box gene SiMBP9 negatively regulates lateral root formation and apical dominance by reducing auxin biosynthesis and transport. Plant Cell Rep. 2019, 38(8), 951–963. [CrossRef] [PubMed]
- Ferrándiz C.; Fourquin C. Role of the FUL-SHP network in the evolution of fruit morphology and function. J Exp Bot. 2014, 65(16), 4505–4513. [CrossRef] [PubMed]
- Ferrándiz C.; Liljegren S.J.; Yanofsky M.F. Negative regulation of the SHATTERPROOF genes by FRUITFULL during Arabidopsis fruit development. Science 2000, 289(5478), 436–438. [CrossRef] [PubMed]
- Huang B.; Routaboul J.M.; Liu M.; Deng W.; Maza E.; Mila I.; Hu G.; Zouine M.; Frasse P.; Vrebalov J.T.; Giovannoni J.J.; Li Z.; van der Rest B.; Bouzayen M. Overexpression of the class D MADS-box gene Si-AGL11 impacts fleshy tissue differentiation and structure in tomato fruits. J Exp Bot. 2017, 68(17), 4869–4884. [CrossRef] [PubMed]
- Kang I.H.; Steffen J.G.; Portereiko M.F.; Lloyd A.; Drews G.N. The AGL62 MADS domain protein regulates cellularization during endosperm development in Arabidopsis. Plant Cell 2008, 20(3), 635–647. [CrossRef] [PubMed] [PubMed Central]
- Karlova R.; Chapman N.; David K.; Angenent G.C.; Seymour G.B.; de Maagd R.A. Transcriptional control of fleshy fruit development and ripening. J Exp Bot. 2014, 65(16), 4527–4541. [CrossRef] [PubMed]
- Causier B.; Kieffer M.; Davies B. Plant biology. MADS-box genes reach maturity. Science 2002, 296(5566), 275–276. [CrossRef] [PubMed]
- Fujisawa M.; Shima Y.; Higuchi N.; Nakano T.; Koyama Y.; Kasumi T.; Ito Y. Direct targets of the tomato-ripening regulator RIN identified by transcriptome and chromatin immunoprecipitation analyses. Planta 2012, 235(6), 1107–1122. [CrossRef] [PubMed]
- Qin G.; Wang Y.; Cao B.; Wang W.; Tian S. Unraveling the regulatory network of the MADS box transcription factor RIN in fruit ripening. Plant J. 2012, 70(2), 243–255. [CrossRef] [PubMed]
- Martel C.; Vrebalov J.; Tafelmeyer P.; Giovannoni J.J. The tomato MADS-box transcription factor RIPENING INHIBITOR interacts with promoters involved in numerous ripening processes in a COLORLESS NONRIPENING-dependent manner. Plant Physiol. 2011, 157(3), 1568–1579. [CrossRef] [PubMed] [PubMed Central]
- Vrebalov J.; Pan I.L.; Arroyo A.J.; McQuinn R.; Chung M.; Poole M.; Rose J.; Seymour G.; Grandillo S.; Giovannoni J.; Irish V.F. Fleshy fruit expansion and ripening are regulated by the tomato SHATTERPROOF gene TAGL1. Plant Cell 2009, 21(10), 3041–3062. [CrossRef] [PubMed] [PubMed Central]
- Dong T.; Hu Z.; Deng L.; Wang Y.; Zhu M.; Zhang J.; Chen G. A tomato MADS-box transcription factor, SiMADS1, acts as a negative regulator of fruit ripening. Plant Physiol. 2013, 163(2), 1026–1036. [CrossRef] [PubMed] [PubMed Central]
- Xie Q.; Hu Z.; Zhu Z.; Dong T.; Zhao Z.; Cui B.; Chen G. Overexpression of a novel MADS-box gene SiFYFL delays senescence, fruit ripening and abscission in tomato. Sci Rep. 2014, 4, 4367. [CrossRef] [PubMed] [PubMed Central]
- Wang S.; Lu G.; Hou Z.; Luo Z.; Wang T.; Li H.; Zhang J.; Ye Z. Members of the tomato FRUITFULL MADS-box family regulate style abscission and fruit ripening. J Exp Bot. 2014, 65(12), 3005–3014. [CrossRef] [PubMed] [PubMed Central]
- Shima Y.; Kitagawa M.; Fujisawa M.; Nakano T.; Kato H.; Kimbara J.; Kasumi T.; Ito Y. Tomato FRUITFULL homologues act in fruit ripening via forming MADS-box transcription factor complexes with RIN. Plant Mol Biol. 2013, 82(4-5), 427–438. [CrossRef] [PubMed]
- Yin W.; Hu Z.; Cui B.; Guo X.; Hu J.; Zhu Z.; Chen G. Suppression of the MADS-box gene SiMBP8 accelerates fruit ripening of tomato (Solanum lycopersicum). Plant Physiol Biochem. 2017, 118, 235–244. [CrossRef] [PubMed]
- Zhang J.; Hu Z.; Yao Q.; Guo X.; Nguyen V.; Li F.; Chen G. A tomato MADS-box protein, SiCMB1, regulates ethylene biosynthesis and carotenoid accumulation during fruit ripening. Sci Rep. 2018, 8(1), 3413. [CrossRef] [PubMed] [PubMed Central]
- Seymour G.B.; Ryder C.D.; Cevik V.; Hammond J.P.; Popovich A.; King G.J.; Vrebalov J.; Giovannoni J.J.; Manning K. A SEPALLATA gene is involved in the development and ripening of strawberry (Fragaria × ananassa Duch.) fruit, a non-climacteric tissue. J Exp Bot. 2011, 62(3), 1179–1188. [CrossRef] [PubMed] [PubMed Central]
- Lu W.; Chen J.; Ren X.; Yuan J.; Han X.; Mao L. Ying T. Luo Z. One novel strawberry MADS-box transcription factor FaMADS1a acts as a negative regulator in fruit ripening. Sci. Hortic. 2018, 227, 124–131. [CrossRef]
- Liu J.; Xu B.; Hu L.; Li M.; Su W.; Wu J.; Yang J.; Jin Z. Involvement of a banana MADS-box transcription factor gene in ethylene-induced fruit ripening. Plant Cell Rep. 2009, 28(1), 103–111. [CrossRef] [PubMed]
- Elitzur T.; Vrebalov J.; Giovannoni J.J.; Goldschmidt E.E.; Friedman H. The regulation of MADS-box gene expression during ripening of banana and their regulatory interaction with ethylene. J Exp Bot. 2010, 61(5), 1523–1535. [CrossRef] [PubMed] [PubMed Central]
- Elitzur T.; Yakir E.; Quansah L.; Fei Z.; Vrebalov J.; Khayat E.; Giovannoni J.J.; Friedman H. Banana MaMADS transcription factors are necessary for fruit ripening and molecular tools to promote shelf-life and food security. Plant Physiol. 2016, 171(1), 380–391. [CrossRef] [PubMed] [PubMed Central]
- Fu C.C.; Chen H.J.; Gao H.Y.; Wang S.L.; Han Y.C. Papaya CpMADS4 and CpNAC3 co-operatively regulate ethylene signal genes CpERF9 and CpEIL5 during fruit ripening. Postharvest Biol. Technol. 2021, 175, 111485. [CrossRef]
- Lu S.; Zhang Y.; Zhu K.; Yang W.; Ye J.; Chai L.; Xu Q.; Deng X. The citrus transcription factor CsMADS6 modulates carotenoid metabolism by directly regulating carotenogenic genes. Plant Physiol. 2018, 176(4), 2657–2676. [CrossRef] [PubMed] [PubMed Central]
- Gomez-Lim M.A. Mango fruit ripening: physiology and molecular biology. Acta Hortic. 1993, 341, 484–499. [CrossRef]
- Wang P.; Luo Y.; Huang J.; Gao S.; Zhu G.; Dang Z.; Gai J.; Yang M.; Zhu M.; Zhang H.; Ye X.; Gao A.; Tan X.; Wang S.; Wu S.; Cahoon E.B.; Bai B.; Zhao Z.; Li Q.; Wei J.; Chen H.; Luo R.; Gong D.; Tang K.; Zhang B.; Ni Z.; Huang G.; Hu S.; Chen Y. The genome evolution and domestication of tropical fruit mango. Genome Biol. 2020, 21(1), 60. [CrossRef] [PubMed] [PubMed Central]
- Eddy S.R. Accelerated profile HMM Searches. PLoS Comput Biol, 2011, 7(10), e1002195. [CrossRef] [PubMed] [PubMed Central]
- Chen C.; Chen H.; Zhang Y.; Thomas H.R.; Frank M.H.; He Y.; Xia R. TBtools: An integrative toolkit developed for interactive analyses of big biological data. Mol Plant. 2020, 13(8), 1194–1202. [CrossRef] [PubMed]
- Horton P.; Park K.J.; Obayashi T.; Fujita N.; Harada H.; Adams-Collier CJ.; Nakai K. WoLF PSORT: protein localization predictor. Nucleic Acids Res. 2007, 35(Web Server issue), W585–587. [CrossRef] [PubMed] [PubMed Central]
- Letunic I.; Doerks T.; Bork P. SMART 7: recent updates to the protein domain annotation resource. Nucleic Acids Res. 2012, 40(Database issue), D302–305. [CrossRef] [PubMed] [PubMed Central]
- Lescot M.; Déhais P.; Thijs G.; Marchal K.; Moreau Y.; Van de Peer Y.; Rouzé P.; Rombauts S. PlantCARE, a database of plant cis-acting regulatory elements and a portal to tools for in silico analysis of promoter sequences. Nucleic Acids Res. 2002, 30(1), 325–327. [CrossRef] [PubMed] [PubMed Central]
- Li L.; Wu H.X.; Ma X.W.; Xu W.T.; Liang Q.Z.; Zhan R.L.; Wang S.B. Transcriptional mechanism of differential sugar accumulation in pulp of two contrasting mango (Mangifera indica L.) cultivars. Genomics 2020, 112(6), 4505–4515. [CrossRef] [PubMed]
- Pertea M.; Kim D.; Pertea G.M.; Leek J.T.; Salzberg S.L. Transcript-level expression analysis of RNA-seq experiments with HISAT, String Tie and Ballgown. Nat Protoc. 2016, 11(9), 1650–1667. [CrossRef] [PubMed] [PubMed Central]
- Kofuji R.; Sumikawa N.; Yamasaki M.; Kondo K.; Ueda K.; Ito M.; Hasebe M. Evolution and divergence of the MADS-box gene family based on genome-wide expression analyses. Mol Biol Evol. 2003, 20(12), 1963–1977. [CrossRef] [PubMed]
- Lin H.; Zhu W.; Silva J.C.; Gu X.; Buell C.R. Intron gain and loss in segmentally duplicated genes in rice. Genome Biol. 2006, 7(5), R41. [CrossRef] [PubMed] [PubMed Central]
- Davies B.; Egea-Cortines M.; de Andrade Silva E.; Saedler H.; Sommer H. Multiple interactions amongst floral homeotic MADS box proteins. EMBO J. 1996, 15(16), 4330–4343. [PubMed] [PubMed Central]
- Lyons E.; Pedersen B.; Kane J.; Alam M.; Ming R.; Tang H.; Wang X.; Bowers J.; Paterson A.; Lisch D.; Freeling M. Finding and comparing syntenic regions among Arabidopsis and the outgroups papaya, poplar, and grape: CoGe with rosids. Plant Physiol. 2008, 148(4), 1772–1781. [CrossRef] [PubMed] [PubMed Central]
- Becker A.; Theissen G. The major clades of MADS-box genes and their role in the development and evolution of flowering plants. Mol Phylogenet Evol. 2003, 29(3), 464–489. [CrossRef] [PubMed]
- Irish V.F. The evolution of floral homeotic gene function. Bioessays 2003, 25(7), 637–646. [CrossRef] [PubMed]
- Schilling S.; Pan S.; Kennedy A.; Melzer R. MADS-box genes and crop domestication: the jack of all traits. J Exp Bot. 2018, 69(7), 1447–1469. [CrossRef] [PubMed]
- Arora R.; Agarwal P.; Ray S.; Singh A.K.; Singh V.P.; Tyagi A.K.; Kapoor S. MADS-box gene family in rice: genome-wide identification, organization and expression profiling during reproductive development and stress. BMC Genom. 2007, 8, 242. [CrossRef] [PubMed] [PubMed Central]
- Wang Y.; Zhang J.; Hu Z.; Guo X.; Tian S.; Chen G. Genome-wide analysis of the MADS-box transcription factor family in Solanum lycopersicum. Int J Mol Sci. 2019, 20(12), 2961. [CrossRef] [PubMed] [PubMed Central]
- Gao H.; Wang Z.; Li S.; Hou M.; Zhou Y.; Zhao Y.; Li G.; Zhao H.; Ma H. Genome-wide survey of potato MADS-box genes reveals that StMADS1 and StMADS13 are putative downstream targets of tuberigen StSP6A. BMC Genom. 2018, 19(1), 726. [CrossRef] [PubMed] [PubMed Central]
- Raza Q.; Riaz A.; Atif R.M.; Hussain B.; Rana I.A.; Ali Z.; Budak H.; Alaraidh I.A. Genome-wide diversity of MADS-box genes in bread wheat is associated with its rapid global adaptability. Front Genet. 2022, 12, 818880. [CrossRef] [PubMed] [PubMed Central]
- Hu L.; Liu S. Genome-wide analysis of the MADS-box gene family in cucumber. Genome 2012, 55(3), 245–256. [CrossRef] [PubMed]
- Saha G.; Park J.I.; Jung H.J.; Ahmed N.U.; Kayum M.A.; Chung M.Y.; Hur Y.; Cho Y.G.; Watanabe M.; Nou I.S. Genome-wide identification and characterization of MADS-box family genes related to organ development and stress resistance in Brassica rapa. BMC Genom. 2015, 16(1), 178. [CrossRef] [PubMed] [PubMed Central]
- Li C.; Wang Y.; Xu L.; Nie S.; Chen Y.; Liang D.; Sun X.; Karanja B.K.; Luo X.; Liu L. Genome-wide characterization of the MADS-box gene family in radish (Raphanus sativus L.) and assessment of its roles in flowering and floral organogenesis. Front Plant Sci. 2016, 7, 1390. [CrossRef] [PubMed] [PubMed Central]
- Wei X.; Wang L.; Yu J.; Zhang Y.; Li D.; Zhang X. Genome-wide identification and analysis of the MADS-box gene family in sesame. Gene 2015, 569(1), 66–76. [CrossRef] [PubMed]
- Wang P.; Wang S.; Chen Y.; Xu X.; Guang X.; Zhang Y. Genome-wide Analysis of the MADS-Box Gene Family in Watermelon. Comput Biol Chem. 2019, 80, 341–350. [CrossRef] [PubMed]
- Zhang Y.; Tang D.; Lin X.; Ding M.; Tong Z. Genome-wide identification of MADS-box family genes in moso bamboo (Phyllostachys edulis) and a functional analysis of PeMADS5 in flowering. BMC Plant Biol. 2018, 18(1), 176. [CrossRef] [PubMed] [PubMed Central]
- ZhaoY.; Li X.; Chen W.; Peng X.; Cheng X.; Zhu S.; Cheng B. Whole-genome survey and characterization of MADS-box gene family in maize and sorghum. Plant Cell Tissue Organ Cult. 2011, 105(2), 159–173. [CrossRef]
- Tian Y.; Dong Q.; Ji Z.; Chi F.; Cong P.; Zhou Z. Genome-wide identification and analysis of the MADS-box gene family in apple. Gene 2015, 555(2), 277–290. [CrossRef] [PubMed]
- Won S.Y.; Jung J.A.; Kim J.S. Genome-wide analysis of the MADS-Box gene family in Chrysanthemum. Comput Biol Chem. 2021, 90, 107424. [CrossRef] [PubMed]
- Chen Q.; Li J.; Yang F. Genome-wide analysis of the MADS-box transcription factor family in Solanum melongena. Int J Mol Sci. 2023, 24(1), 826. [CrossRef] [PubMed] [PubMed Central]
- Wang X.; Huang Q.; Shen Z.; Baron G.C.; Li X.; Lu X.; Li Y.; Chen W.; Xu L.; Lv J.; Li W.; Zong Y.; Guo W. Genome-wide identification and analysis of the MADS-Box transcription factor genes in blueberry (Vaccinium spp.) and their expression pattern during fruit ripening. Plants (Basel) 2023, 12(7), 1424. [CrossRef] [PubMed] [PubMed Central]
- Cheng S.; Jia M.; Su L.; Liu X.; Chu Q.; He Z.; Zhou X.; Lu W.; Jiang C. Genome-wide identification of the MADS-box gene family during male and female flower development in chayote (Sechium edule). Int J Mol Sci. 2023, 24(7), 6114. [CrossRef] [PubMed] [PubMed Central]
- Leseberg C.H.; Li A.; Kang H.; Duvall M.; Mao L. Genome-wide analysis of the MADS-box gene family in Populus trichocarpa. Gene 2006, 378, 84–94. [CrossRef] [PubMed]
- Wang R.; Ming M.; Li J.; Shi D.; Qiao X.; Li L.; Zhang S.; Wu J. Genome-wide identification of the MADS-box transcription factor family in pear (Pyrus bretschneideri) reveals evolution and functional divergence. Peer J. 2017, 5, e3776. [CrossRef] [PubMed] [PubMed Central]
- Liu J.; Zhang J.; Zhang J.; Miao H.; Wang J.; Gao P.; Hu W.; Jia C.; Wang Z.; Xu B.; Jin Z. Genome-wide analysis of banana MADS-box family closely related to fruit development and ripening. Sci Rep. 2017, 7(1), 3467. [CrossRef] [PubMed] [PubMed Central]
- Díaz-Riquelme J.; Lijavetzky D.; Martínez-Zapater J.M.; Carmona M.J. Genome-wide analysis of MIKCC-type MADS box genes in grapevine. Plant Physiol. 2009, 149(1), 354–369. [CrossRef] [PubMed] [PubMed Central]
- Shu Y.; Yu D.; Wang D.; Guo D.; Guo C. Genome-wide survey and expression analysis of the MADS-box gene family in soybean. Mol Biol Rep. 2013, 40(6), 3901–3911. [CrossRef] [PubMed]
- Lin Y.; Qi X.; Wan Y.; Chen Z.; Fang H.; Liang C. Genome-wide analysis of the MADS-box gene family in Lonicera japonica and a proposed floral organ identity model. BMC Genom. 2023, 24(1), 447. [CrossRef] [PubMed] [PubMed Central]
- Zhao D.; Chen Z.; Xu L.; Zhang L.; Zou Q. Genome-wide analysis of the MADS-Box gene family in maize: gene structure, evolution, and relationships. Genes (Basel) 2021, 12(12), 1956. [CrossRef] [PubMed] [PubMed Central]
- Sun F.; Fang H.; Wen X.; Zhang L. Phylogenetic and expression analysis of MADS-box gene family in Rhododendron ovatum. Chinese Bulletin of Botany 2023, 58(3), 404–416. [CrossRef]
- Gramzow L.; Theißen G. Phylogenomics reveals surprising sets of essential and dispensable clades of MIKC(c)-group MADS-box genes in flowering plants. J Exp Zool B Mol Dev Evol. 2015, 324(4), 353–362. [CrossRef] [PubMed]
- Wang L.; Yin X.; Cheng C.; Wang H.; Guo R.; Xu X.; Zhao J.; Zheng Y.; Wang X. Evolutionary and expression analysis of a MADS-box gene superfamily involved in ovule development of seeded and seedless grapevines. Mol Genet Genomics. 2015, 290(3), 825–846. [CrossRef] [PubMed]
- Wang B.; Hu W.; Fang Y.; Feng X.; Fang J.; Zou T.; Zheng S.; Ming R.; Zhang J. Comparative analysis of the MADS-Box genes revealed their potential functions for flower and fruit development in longan (Dimocarpus longan). Front Plant Sci. 2022, 12, 813798. [CrossRef] [PubMed] [PubMed Central]
- Zhao W.; Zhang L.L.; Xu Z.S.; Fu L.; Pang H.X.; Ma Y.Z.; Min D.H. Genome-Wide analysis of MADS-Box genes in foxtail millet (Setaria italica L.) and functional assessment of the role of SiMADS51 in the drought stress response. Front Plant Sci. 2021, 12, 659474. [CrossRef] [PubMed] [PubMed Central]
- Alhindi T.; Al-Abdallat A.M. Genome-wide identification and analysis of the MADS-box gene family in American beautyberry (Callicarpa americana). Plants (Basel) 2021, 10(9), 1805. [CrossRef] [PubMed] [PubMed Central]
- Guan H.; Wang H.; Huang J.; Liu M.; Chen T.; Shan X.; Chen H.; Shen J. Genome-wide identification and expression analysis of MADS-Box family genes in litchi (Litchi chinensis Sonn.) and their involvement in floral sex determination. Plants (Basel) 2021, 10(10), 2142. [CrossRef] [PubMed] [PubMed Central]
- Gramzow L.; Ritz M.S.; Theissen G. On the origin of MADS-domain transcription factors. Trends Genet. 2010, 26(4), 149–153. [CrossRef] [PubMed]
- Qu Y.; Kong W.; Wang Q.; Fu X. Genome-wide identification MIKC-Type MADS-Box gene family and their roles during development of floral buds in wheel wingnut (Cyclocarya paliurus). Int J Mol Sci. 2021, 22(18), 10128. [CrossRef] [PubMed] [PubMed Central]
- Huo S.; Li Y.; Li R.; Chen R.; Xing H.; Wang J.; Zhao Y.; Song X. Genome-wide analysis of the MADS-box gene family in Rhododendron hainanense Merr. and expression analysis under heat and waterlogging stresses. Ind Crops Prod. 2021, 172, 114007. [CrossRef]
- Liu M.; Fu Q.; Ma Z.; Sun W.; Huang L.; Wu Q.; Tang Z.; Bu T.; Li C.; Chen H. Genome-wide investigation of the MADS gene family and dehulling genes in tartary buckwheat (Fagopyrum tataricum). Planta 2019, 249(5), 1301–1318. [CrossRef] [PubMed]
- Liu J.; Liu M.; Wang J.; Zhang J.; Miao H.; Wang Z.; Jia C.; Zhang J.; Xu B.; Jin Z. Transcription factor MaMADS36 plays a central role in regulating banana fruit ripening. J Exp Bot. 2021, 72(20), 7078–7091. [CrossRef] [PubMed]
- Wang Y.; Nie F.; Shahid M.Q.; Baloch F.S. Molecular footprints of selection effects and whole genome duplication (WGD) events in three blueberry species: detected by transcriptome dataset. BMC Plant Biol. 2020, 20(1), 250. [CrossRef] [PubMed] [PubMed Central]

Disclaimer/Publisher’s Note: The statements, opinions and data contained in all publications are solely those of the individual author(s) and contributor(s) and not of MDPI and/or the editor(s). MDPI and/or the editor(s) disclaim responsibility for any injury to people or property resulting from any ideas, methods, instructions or products referred to in the content. |
© 2023 by the authors. Licensee MDPI, Basel, Switzerland. This article is an open access article distributed under the terms and conditions of the Creative Commons Attribution (CC BY) license (http://creativecommons.org/licenses/by/4.0/).


