Preprint
Article

Effects of Joint Assimilation of FY-4A AGRI and Ground-based Microwave Radiometer on a Heavy Rainfall in Kaifeng Area of Central China in the Summer of 2022

Altmetrics

Downloads

117

Views

37

Comments

0

This version is not peer-reviewed

Submitted:

01 November 2023

Posted:

01 November 2023

You are already at the latest version

Alerts
Abstract
This study aims to evaluate the combined assimilation of AGRI infrared radiance and ground-based MWR (Microwave Radiometer) data for predicting short-duration heavy rainfall. The WRFDA 4.3 framework is utilized to establish the data assimilation interface. The structural characteristics of this joint assimilation approach are analyzed using a typical heavy rainfall event in the Kaifeng region of Central China. The findings indicate the following: (1) The joint assimilation of FY-4A AGRI and ground-based MWR data effectively corrects the initial moisture content in model simulations. Data assimilation significantly improves the simulation of 24-hour accumulated rainfall. Furthermore, the joint assimilation of AGRI radiance and MWR data outperforms assimilating either of them individually; (2) In the heavy rainfall stage, from the low level to the high level, strong upward movement occurs in the center of the rainstorm. The water vapor in the process of this rainstorm mainly comes from the westward air transport in front of the high trough. The water vapor is continuously transported to the heavy rainfall belt through this channel, providing sufficient water vapor for the maintenance of the rainstorm; (3) The combination of the interaction between high and low level vorticity and divergence in the atmosphere and the vertical upward movement, the emergence of low level jet and the generation of unstable energy in the atmospheric environment jointly lead to the occurrence of the rainstorm process; and (4) The terrain-sensitive experiment results show that, the existence of the topography of Taihang Mountain changes the precipitation in Kaifeng area, and reducing the terrain height will lead to a 50%-60% decrease in the overall precipitation of the precipitation center, and the precipitation range will also be greatly reduced. An increase of more than 50% in terrain height will lead to an increase in precipitation center, precipitation range and precipitation intensity, and an increase of 10%-20% in overall precipitation; An increase of more than 75% in the terrain height will cause the rain belt to shift eastward by about 0.5°E, and the precipitation center will shift significantly eastward. When the terrain height increased by more than 100%, the precipitation did not continue to increase, which was basically the same as the control test. This paper provides a valuable basis for further improving the application of FY-4A AGRI radiance and ground-based microwave radiometer in numerical weather models.
Keywords: 
Subject: Environmental and Earth Sciences  -   Atmospheric Science and Meteorology

1. Introduction

The Intergovernmental Panel on Climate Change (IPCC) Sixth Assessment Report indicates that global warming will lead to an increase in extreme precipitation events [1]. In the past 50 years, both the duration and amount of extreme precipitation in China have shown an upward trend [2]. Due to the significant hazards posed by heavy rainfall, which directly impacts economic growth and people’s livelihoods, research on the characteristics and causes of extreme rainfall has been ongoing both domestically and internationally [3,4,5,6,7,8,9,10]. China is located in the East Asian monsoon region, characterized by complex topography and distinct spatiotemporal climate distribution. The occurrence of heavy rainfall is related to the position of the summer monsoon belt, and there are significant regional differences in the areas affected by heavy rain. Gao et al. (2003) summarized the progress in the study of mechanisms, numerical simulations, and prediction methods of heavy rainfall [11]. Bao (2007) conducted statistical analysis of the large-scale circulation background and typical features of persistent heavy rainfall in certain regions of China, summarizing the commonalities and typical characteristics of persistent heavy rainfall under the control of large-scale circulation [12]. As a major agricultural province in China, Henan Province is frequently plagued by meteorological disasters. In August 1975, a severe rainfall event occurred in the Zhumadian area, known as the “758” Henan heavy rainfall event, with a maximum daily accumulated precipitation of 198.5 mm. Luo et al. (2020) pointed out that this heavy rainfall event was mainly caused by the interaction between a typhoon and a westerly trough [13]. From July 19th to 21st, 2021, continuous heavy rainfall occurred in most parts of Henan Province, with a maximum accumulated precipitation exceeding 700 mm. The floods severely affected 14.786 million people in Henan Province, resulting in over 350 deaths and direct economic losses exceeding RMB 120 billion. Within 24 hours at the Zhengzhou station (20:00 on July 19th to 20:00 on the 20th, Beijing time), the precipitation reached 552.5 mm, with an hourly precipitation of 201.9 mm from 16:00 to 17:00, breaking the historical record since the establishment of the Zhengzhou station. It was named the “720” Zhengzhou heavy rainfall event, with hourly precipitation surpassing the records of the “758” Henan heavy rainfall event and the historical records of hourly precipitation on land in China. Gao et al. (2022) conducted a comprehensive analysis of the mechanisms behind this heavy rainfall event, highlighting that it was primarily caused by the abnormal northward extension of the subtropical high-pressure system, which hindered the northward movement of the “Fireworks” typhoon. Simultaneously, a water vapor belt originating from Hunan and Hubei provinces guided a large amount of water vapor carried by the “Fireworks” typhoon. Eventually, it encountered the southward-moving cold air blocking in Zhengzhou, and The formation of this heavy rainfall event can be attributed to multiple factors, including the impact of the Funiu Mountains and Taihang Mountains [10].
To fulfill the requirements of high impact weather forecasting and warning, numeric weather prediction has made notable progress in the realms of numerical simulation theory, computational power, and observational capacity [14]. Currently, extensive efforts are underway to improve the forecasting accuracy of high-resolution numerical weather prediction models in predicting severe mesoscale rainstorms induced by weather systems at various scales [15,16,17]. However, due to the highly non-linear nature of the atmosphere, NWP models are prone to forecast errors caused by the initial conditions. Thus, Data Assimilation (DA) techniques play a crucial role in integrating information from background fields and observational data to obtain an optimal initial condition. This aspect holds great significance in the field of numerical weather prediction research [18,19,20]. Besides the continuous advancement of assimilation methods, studies have been conducted on the assimilation of diverse observational data sources [21,22,23,24]. Geostationary satellite data offers several benefits, including high spatial-temporal resolution and decreased vulnerability to geographical constraints. As a result, it serves as a valuable supplement to observations. This supplementation has the potential to optimize initial conditions, leading to improvements in numerical weather prediction [25,26,27]. Fengyun-4A (FY-4A), the inaugural test satellite of China’s second-generation geostationary meteorological satellite system, was successfully launched on 11 December 2016. This milestone marked a significant advancement in the FY-4 geostationary system. FY-4A takes into account the demands of atmospheric science, marine science, and environmental science, demonstrating significant potential for wide-ranging applications [28]. The FY-4A geostationary satellite is equipped with various meteorological instruments, such as the Geostationary Interferometric Infrared Sounder (GIIRS), the Lightning Mapping Imager (LMI) [29]. In comparison to the Visible Infrared Spin-Scan Radiometer (VISSR) on the FY-2 geostationary satellite, the FY-4A AGRI offers a greater number of spectral bands, as well as higher temporal and spatial resolutions, enabling the provision of more precise atmospheric information. By assimilating AGRI radiance data, the advancement of numerical weather prediction operations in China can be bolstered. This, in turn, enables the optimal utilization of meteorological satellite data within the nation [30,31]. Radiance assimilation has primarily been employed in clear-sky conditions, disregarding the critical cloud and precipitation properties captured by all-sky radiance, holds significant value in enhancing heavy rainfall simulation [32]. The assimilation of all-sky radiance presents a significant challenge due to the complex and nonlinear nature of cloud-related processes. This is primarily attributed to the high sensitivity of infrared radiances to clouds, resulting in limited predictability [33,34,35]. Consequently, many operational centers have already implemented clear-sky radiance assimilation, as it has demonstrated its impact on improving numerical weather prediction skills [32].
The ground-based microwave radiometer (MWR) operates as a passive remote sensing instrument, allowing for continuous unattended operations [36,37]. In addition, MWR provides uninterrupted temperature and humidity profiles, which serve as a valuable complement to sounding observations. Hence, the assimilation of MWR data can enhance weather forecasts of NWP models. For instance, a case study was conducted in Beijing to assess heavy rainfall by assimilating data from seven ground-based MWRs using 3-Dimensional Variational Assimilation (3DVAR) [38]. Nevertheless, MWR’s utilization remains insufficient. Accurately representing the moisture field in the initial conditions of NWP models is challenging due to its high spatial and temporal heterogeneity [39]. Moisture, being a vital thermodynamic parameter, plays a crucial role in simulating various physical processes. Moreover, atmospheric moisture stands as a key determinant influencing the initiation and progression of deep convection. As a result, any initial errors in moisture have a direct impact on the simulation of cloud distribution and subsequent precipitation [40]. While AGRI lacks the ability to observe the planetary boundary layers (PBL), this limitation can be compensated by employing ground-based MWR, specifically designed for profiling observations within the PBL. Through the joint assimilation of multiple data, it is possible to rectify the initial moisture conditions in model simulations effectively [41].
Kaifeng City is located in the eastern plain of Henan Province of Central China (Figure 1b), it has low-lying terrain, slow river outflow velocity, and is highly vulnerable to urban flooding, road traffic paralysis, casualties, and other serious risks during heavy rainfall events. Previous studies on heavy rainfall in Kaifeng mainly focused on the analysis of meteorological conditions and physical quantity diagnostics related to rainfall occurrence [42,43,44]. There is an urgent need to utilize numerical simulation methods to investigate the mesoscale system structure and formation mechanisms during the occurrence and maintenance phase of heavy rainfall in this region. The experiments conducted in this study are built upon the Data Assimilation (WRFDA) v4.3 of the Weather Research and Forecasting model. As the AGRI observation operator, we selected RTTOV (version 12.1) for the research. Furthermore, the ground-based MWR provided temperature and humidity profiles, which were assimilated concurrently. By combining these two datasets through joint assimilation techniques, enhanced initial and simulated moisture conditions have been achieved, leading to more accurate forecasts of convective rainfall. Based on the above research, the structural characteristics and influencing mechanisms of this heavy rain in Kaifeng are examined from the perspectives of water vapor, dynamics, topography, and other factors. Through these research efforts, we can enhance understanding of the occurrence and development process of such extreme precipitation events under complex terrain conditions, and also provide scientific basis and support for future forecasting and warning of heavy rain weather.

2. Materials and Methods

2.1. The Heavy Rainfall Case

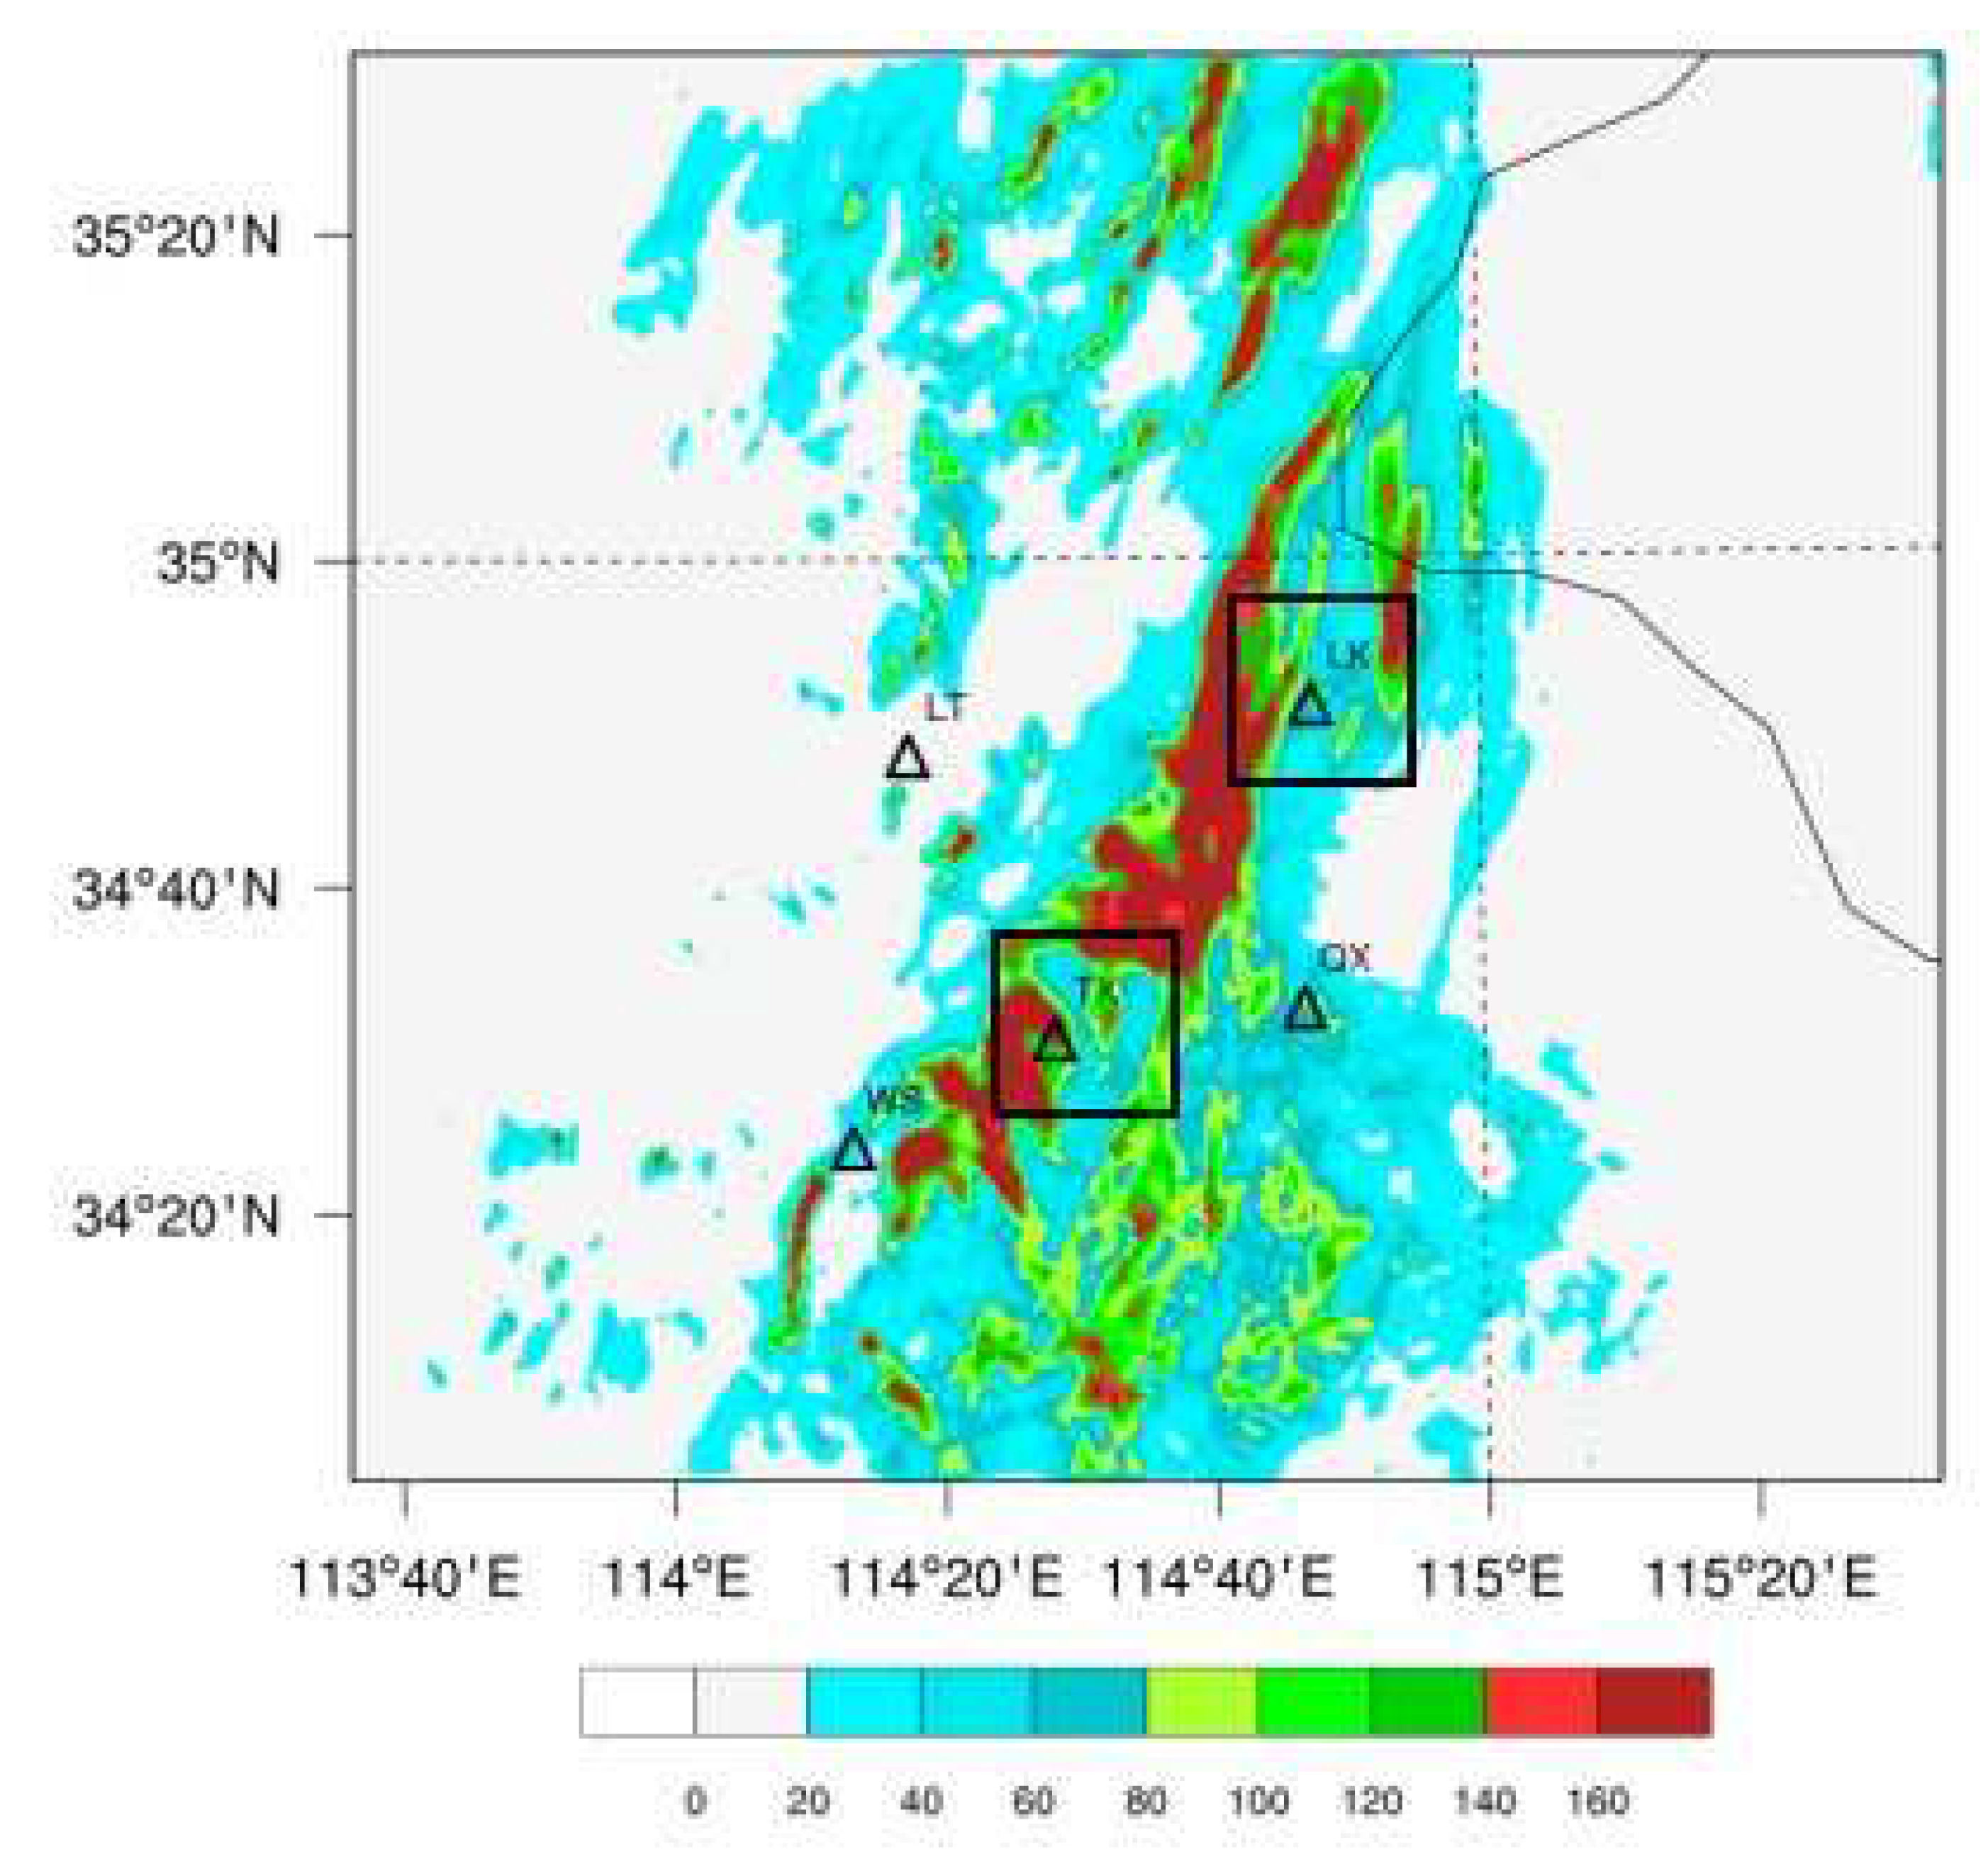
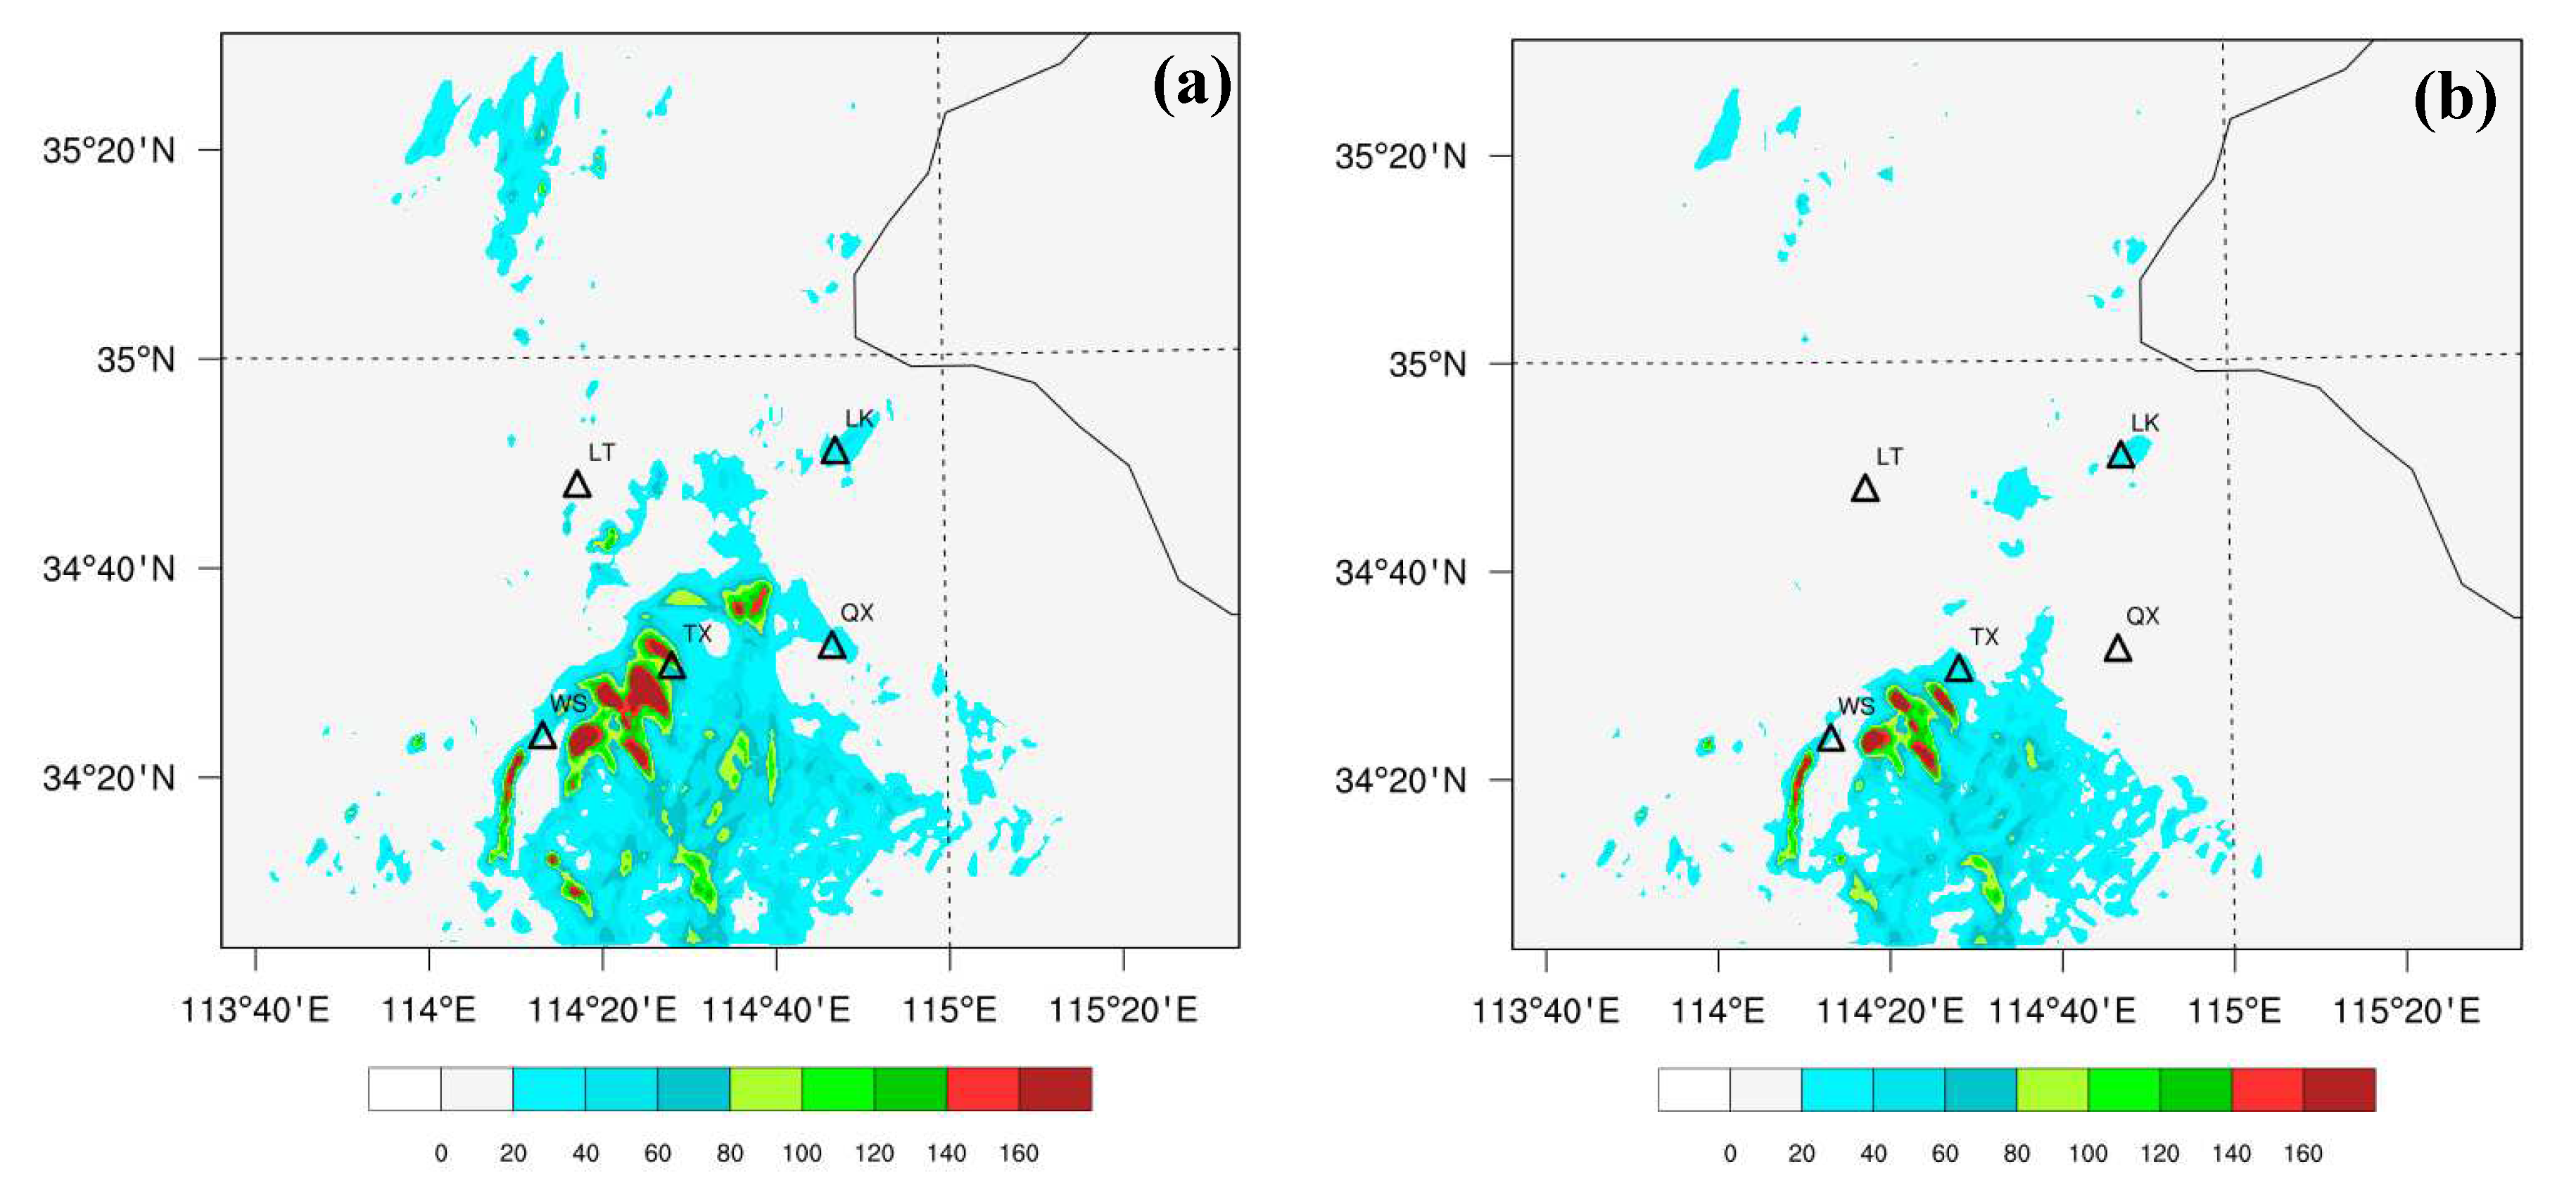
On July 3, 2022, a storm weather event occurred in Henan. As can be seen from the 24-hour cumulative precipitation distribution (Figure 1), the main precipitation area was in the central part of Henan. The heavy rainfall belt ran along the Nanyang-Pingdingshan-Zhengzhou-Kaifeng-Xinxiang (NY-PDS-ZZ-KF-XX) line, with the whole rain belt displaying a northeast-southwest trend (Figure 1b). There were two strong rainfall centers in Kaifeng, both exceeding 140 mm. One center was located in Tongxu County (TX), and the other was in Lankao County (LK). Compared to the precipitation in Tongxu and Lankao, the rainfall intensity in Qixian(QX), Weishi (WS), and Longting District(LT) was relatively smaller (Figure 2). Overall, eastern Kaifeng had more rainfall than its mid-western counterpart, showing a significant uneven spatial distribution and strong local and extreme characteristics. The primary period for this downpour was from 08:00 on July 3rd to 00:00 on July 4th (Figure 1d). The formation mechanism of this heavy rain event was different from that of the “758” and “720” due to the absence of sufficient water vapor provided by a typhoon. Although meteorological personnel forecasted the approximate affected area and location of this heavy rain, the forecast was much weaker than the actual observations in terms of specific precipitation intensity and impact range. This had a significant impact on people’s travel and safety, highlighting the urgent need to investigate this heavy rain process.

2.2. The Model

WRFDA is the assimilation system used in the WRF, as a widely used data assimilation system, WRFDA has a wide range of uses in both scientific research and business work, whcih enables the incorporation of diverse observational data, including surface weather stations, radiosondes, radars, satellites. There are many assimilation methods available in WRFDA, including 3D variational 3DVAR, 4D variational FRI-4DVAR, multi-resolution 3rd/4th dimensional variational MRI-3/4DVAR, ensemble extended Kalman filter ETKF, and mixed data assimilation Hybrid-3D/4DEnVar. In this study, we selected the 3DVAR method to carry out assimilation experiments and research. The equation is presented below:
J ( x ) = 1 2 ( x x b ) T B 1 ( x x b ) + 1 2 ( y H ( x ) ) T R 1 ( y H ( x ) )
In Equation (1), x is the atmospheric state vector, x b is the background information. H is the observation operator, y is the observation vector. B and R are the covariance matrices for background error and observation error, respectively.
RTTOV (Radiative Transfer for TOVS) is an NWP/SAF (Numerical Weather Prediction / Satellite Application) under EUMETSAT (European Organisation for the Exploitation of Meteorological Satellites). Facilities), is a radiative transfer model [45,46]. At present, RTTOV is widely used in various numerical assimilation modules, mainly for the assimilation of satellite data of visible, infrared and microwave channels of passive detection satellites. It provides valuable information on atmospheric states. Therefore, we have chosen to utilize RTTOV v12.1 as the observation operator for FY-4A radiance data.

2.2. AGRI Radiance and MWR Data

The new-generation geostationary satellite FY-4A, from China, is equipped with an Advanced Geostationary Radiance Imager (AGRI). This instrument has 14 channels and is capable of scanning at five-minute intervals, offering a sub-satellite point resolution ranging from 0.5 to 4 km [47]. When contrasted with the Visible Infrared Spin-Scan Radiometer (VISSR) aboard the FY-2 geostationary satellite, AGRI of FY-4A offers superior features; it possesses more spectral bands and delivers higher spatial and temporal resolution data. This enables it to offer more precise atmospheric state information. Regardless, there hasn’t been any record yet regarding the direct assimilation of FY-4A AGRI datasets in literature. At academic conferences, some researchers have presented on the utilization of FY4A AGRI WV channels radiance assimilation within the context of the Global/Regional Assimilation and Prediction System (GRAPES) global model. According to their findings, assimilating the clear-sky WV channels of AGRI into the system resulted in a somewhat positive impact on the mid-troposphere’s moisture field in East Asia [47]. Notably, AGRI exhibits high temporal resolution, completing a full-disk observation in approximately 15 minutes. It generates one full-disk image per hour, three consecutive full-disk images every 3 hours (totaling 40 full-disk images daily), and captures an image of the Chinese region [48]. In this study, we primarily focus on assimilating FY-4A AGRI channels 9–14.
The Microwave Radiometer (MWR) captures atmospheric emissions in the microwave band of the spectrum and translates them into parameters like temperature, relative humidity, and absolute humidity. Significant research has been dedicated to exploring the retrieval techniques of ground-based MWRs. When utilized for Numerical Weather Prediction (NWP), MWR soundings have been found to exhibit accuracy on par with radiosonde soundings [49]. Several studies incorporating MWR retrieval profiles have demonstrated their potential in enhancing the forecast of local weather phenomena [50,51,52,53,54]. The RPG-HATPRO MWR system consists of 14 channels, which are divided into seven K-band channels for water vapor profile retrieval and seven V-band channels (oxygen band) for temperature profile retrieval. The inversion software, provided by the MWR manufacturers, is utilized to generate level-2 products. These products include temperature and relative humidity profiles [54,55].

2.3. Quality Control

In the 3DVar data assimilation method, it is necessary to assume that both the observation error and background error follow unbiased Gaussian distributions [56]. Determining the atmospheric state involves an optimal, unbiased linear method that is contingent on background conditions and their corresponding error covariance matrix, in addition to observation [57,58]. As data assimilation is executed, data quality control (QC) plays a critical role in meeting the requirements of the assimilation system. The accuracy of numerical prediction is directly impacted by the quality of the QC process [59,60].
Infrared (IR) radiance from satellites barely infiltrates clouds, capturing only data from above the cloud tops. Moreover, rapid radiative transfer models struggle to accurately simulate Brightness Temperature (BT) in IR channels within cloudy regions. Consequently, for this study, cloud-affected pixels were omitted from AGRI’s level 1 radiance data, assimilating only clear-sky radiance. Cloud detection was facilitated by the National Satellite Meteorological Center’s Cloud Mask product (link), which boasts a resolution of 4 km at level 2 [61,62]. These Cloud Mask products have four tiers – confidently clear, probably clear, probably cloudy, and confidently cloudy. Only pixels deemed “confidently clear” were assimilated into this study. Further, satellite zenith angles under 60° were solely selected due to severe pixel distortions at larger angles. The high-resolution AGRI radiance data can result in increased computational cost and elevated observation error correlation. To circumvent such issues, a thinning mesh of 20 km was used to select observational data. This is approximately 3-6 times the horizontal resolution of the WRF model employed in this study, helping to avoid model noise [61,62].
Moreover, to mitigate systematic errors within the data, we applied extra quality control measures during the AGRI assimilation process. Before carrying out minimization in WRFDA, certain pixels were eliminated from the AGRI dataset, including: Innovations (the difference between observed and simulated Brightness Temperature (BT)) surpassing 1.5 K, a value slightly above the statistical bias of observation-minus-background (OMB) BT over a two-month period. Innovations exceeding three times the standard deviation of the observation error. Cloud liquid water paths going beyond 0.05 kg/m², ensuring that the background pixels are also clear-sky. These QC steps considerably enhanced the quality of AGRI data. In this reseach, the variational bias correction method, as described in [56] and [63], is employed to mitigate biases in the AGRI assimilation. At each assimilation time step, the method incorporates a correction term to modify the observation operator:
H ~ ( x , β ) = H ( x ) + β 0 + i = 1 N p β i p i
In Equation (2), H and H ~ ( x , β ) , represent the observation operators before and after the bias correction, respectively. x is the atmospheric state vector, while β 0 signifies the constant bias term. p i and β i are the i-th predictor and the corresponding bias correction coefficients, respectively.
This research utilizes the temperature and relative humidity profiles obtained from the MWR. Extensive documentation has shown that significant observation errors may arise during the retrieval of relative humidity from ground-based MWR systems [64,65]. Consequently, quality control (QC) of MWR observations becomes imperative for conducting variational data assimilation. In this study, we utilize the Quality Control (QC) scheme proposed in [64], which consists of checks for extreme values, time consistency, and vertical consistency. Additionally, before performing data assimilations, we apply a bias correction technique to the MWR profiles using sounding observations:
x ~ M = x M + i = 1 n ( x M i x T K i ) n
In Equation (3), The MWR observation before bias correction is denoted as x M , and after bias correction, it is denoted as x ~ M , the sounding observation is represented by x T K , the variable n signifies the number of samples.

2.4. Model Configureurations and Experiment Design
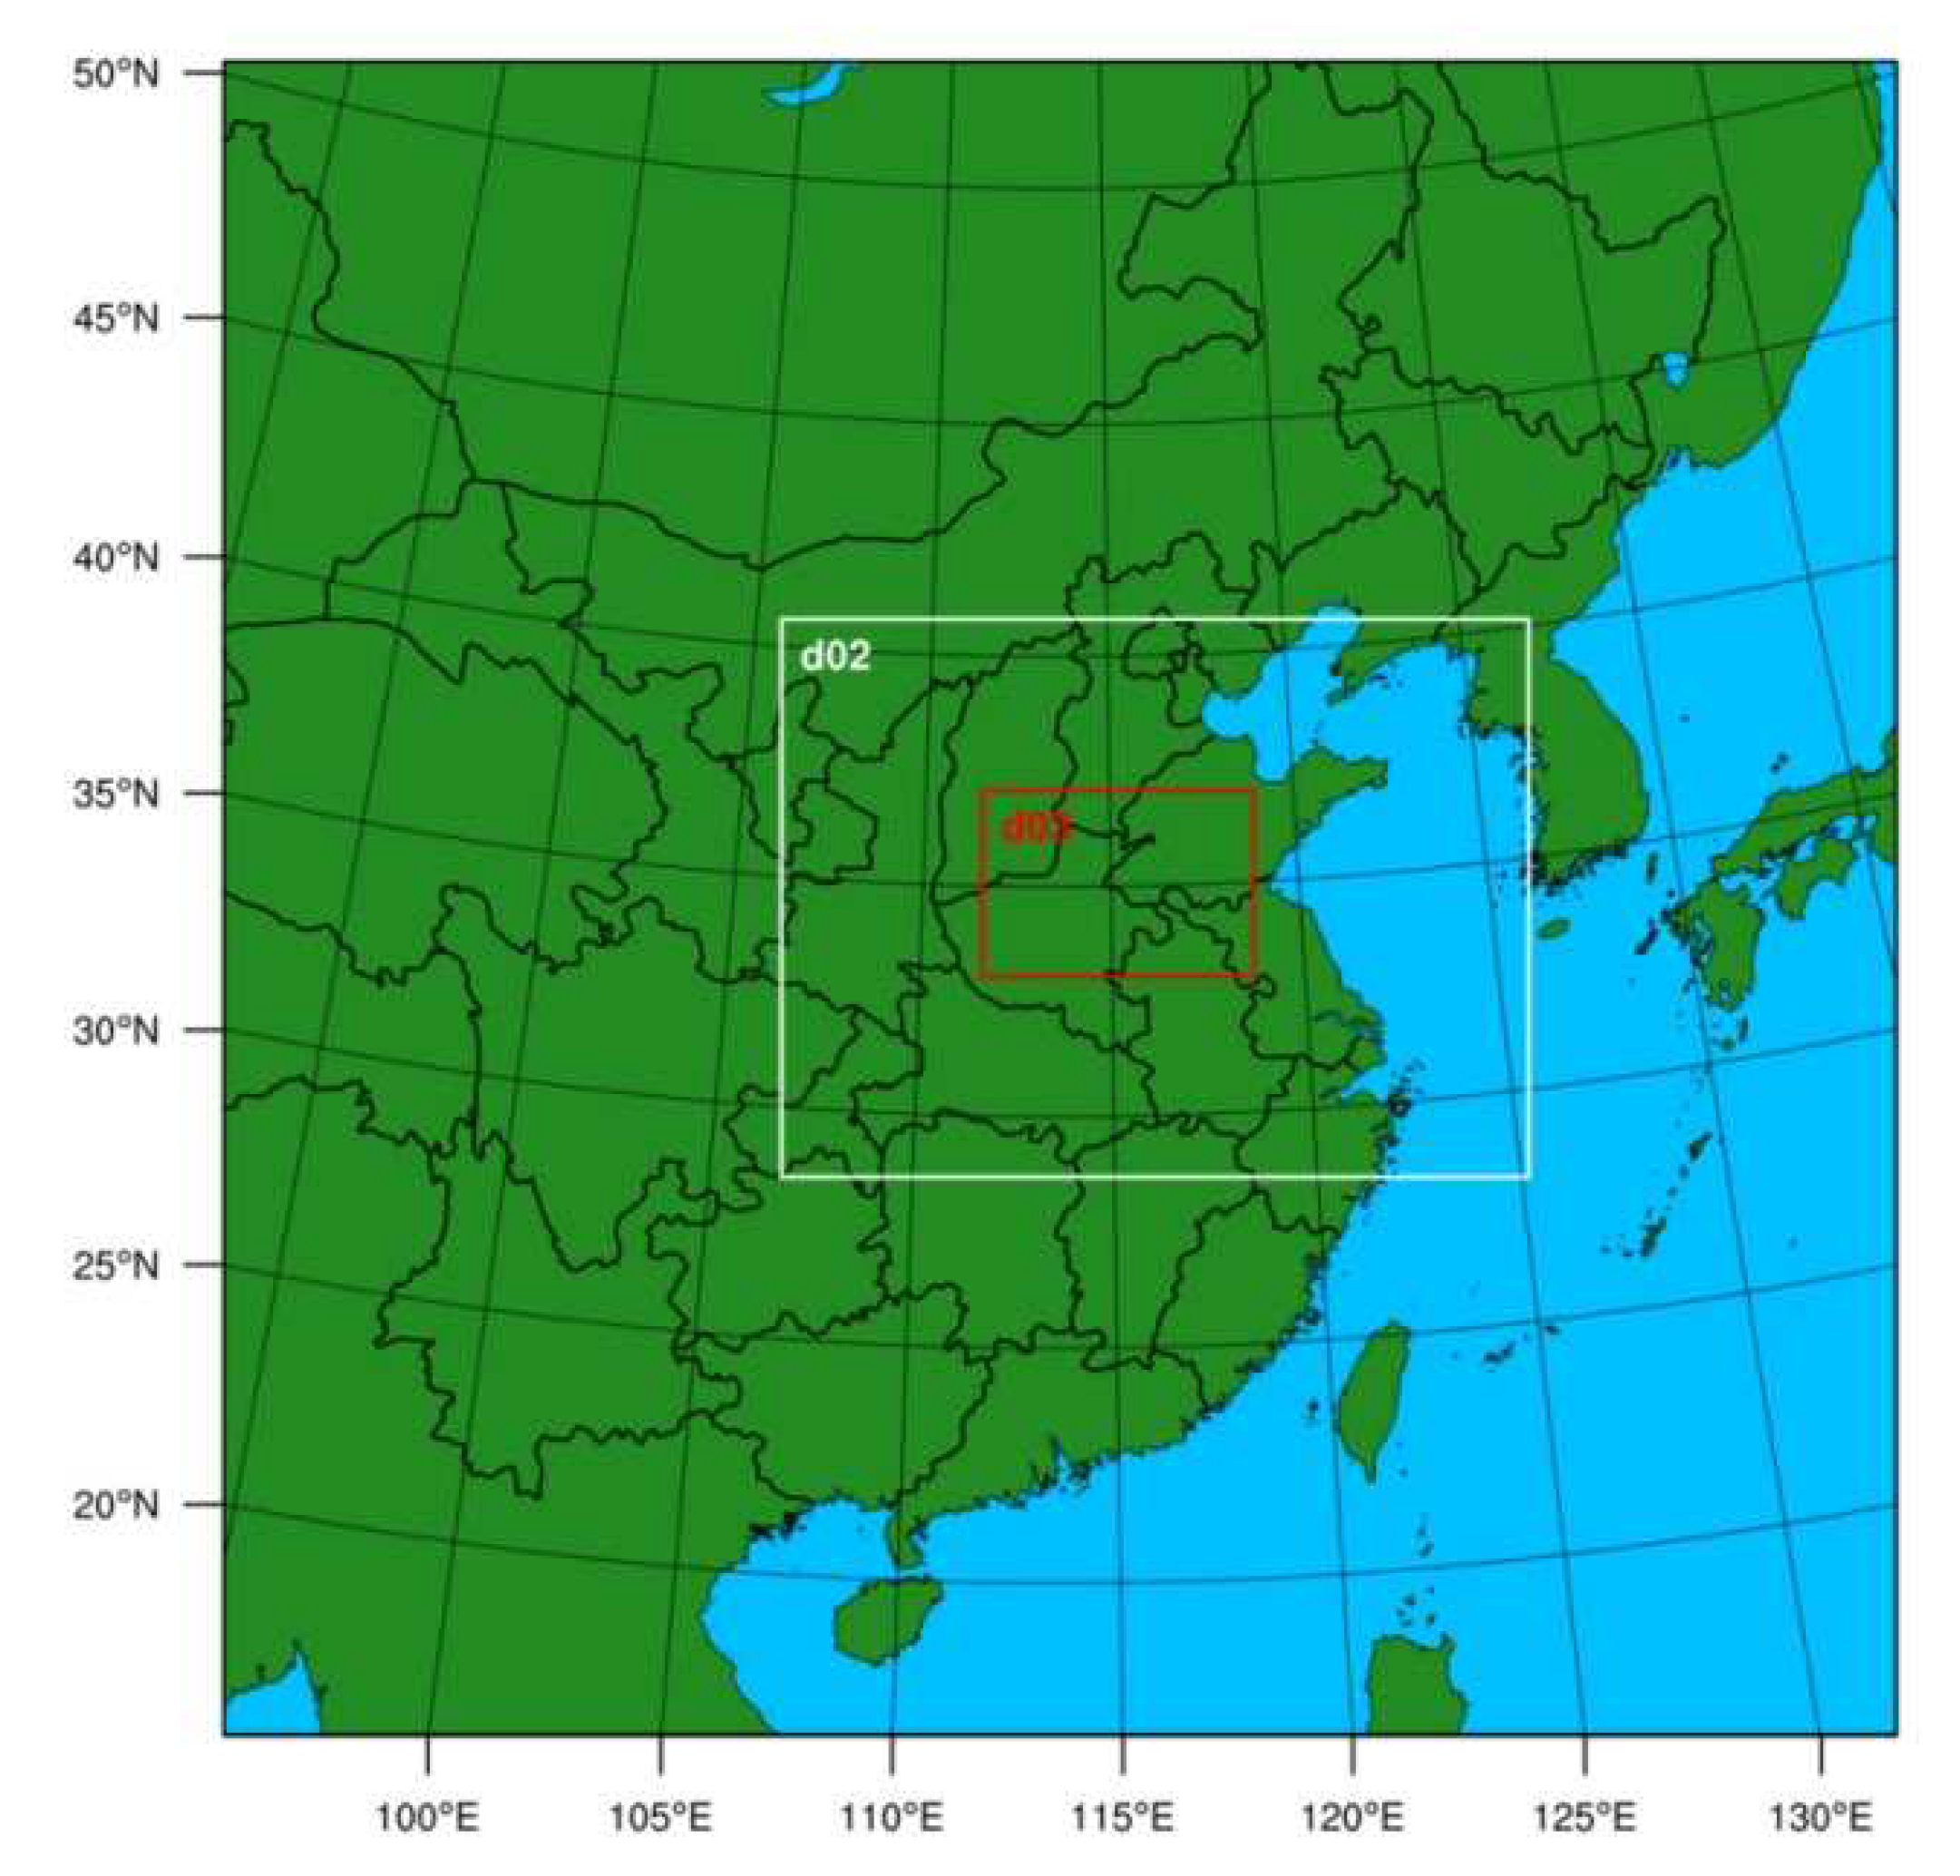
In this research, the WRFv4.3 model and its associated 3DVAR system were utilized to conduct the experiment. The simulated region consisted of three nested domains with grid sizes set at 151×151, 202×151, and 220×151. These domains had corresponding grid spacings of 27 km, 9 km, and 3 km, respectively. The model employed 50 layers for the vertical dimension, with a top pressure level of 50 hPa. The physical parameterizations used in this study are as follows: 1) Microphysics scheme: WSM6.2) Planetary boundary layer scheme: Yonsei University (YSU) scheme. 3) Land-surface model: Noah model. 4) Longwave radiance scheme: Rapid Radiative Transfer Model (RRTM) scheme. 5) Shortwave radiance scheme: Goddard scheme. 6) Cumulus scheme: Kain-Fritsch scheme [67] for d02 and d03 domains, with cumulus parameterization disabled for d01. All experiments use the same parameters.
Some schemes, such as WSM6 microphysical scheme, the Kain-Fritsch cumulus, is determined by previous extensive research [68], which demonstrated that these parameterization schemes have been shown to be more effective in generating heavy rainfall in mid-latitudes. In this study, we utilize NCEP FNL from 1 to 31 July 2022 for model simulation initialization. The NCEP FNL analysis is obtained from https://rda.ucar.edu /datasets/ ds083.2/. Initiation of the experiment takes place at 00 UTC, on July 3. Details pertaining to four separate experiments conducted have been outlined in Table 1. These include an initial control run devoid of data assimilation (CTRL), another one with only temperature alongside humidity profiles exclusively from seven MWRs (Test1), a third one involving assimilation of radiance from FY-4A AGRI (Test2), and a final experiment that brings together both the assimilation of FY-4A AGRI and MWRs (Test3).
Figure 3. Simulation Area of WRF Model.
Preprints 89386 g003

3. Results

3.1. The Impact of Data Assimilation on Humidity Condition

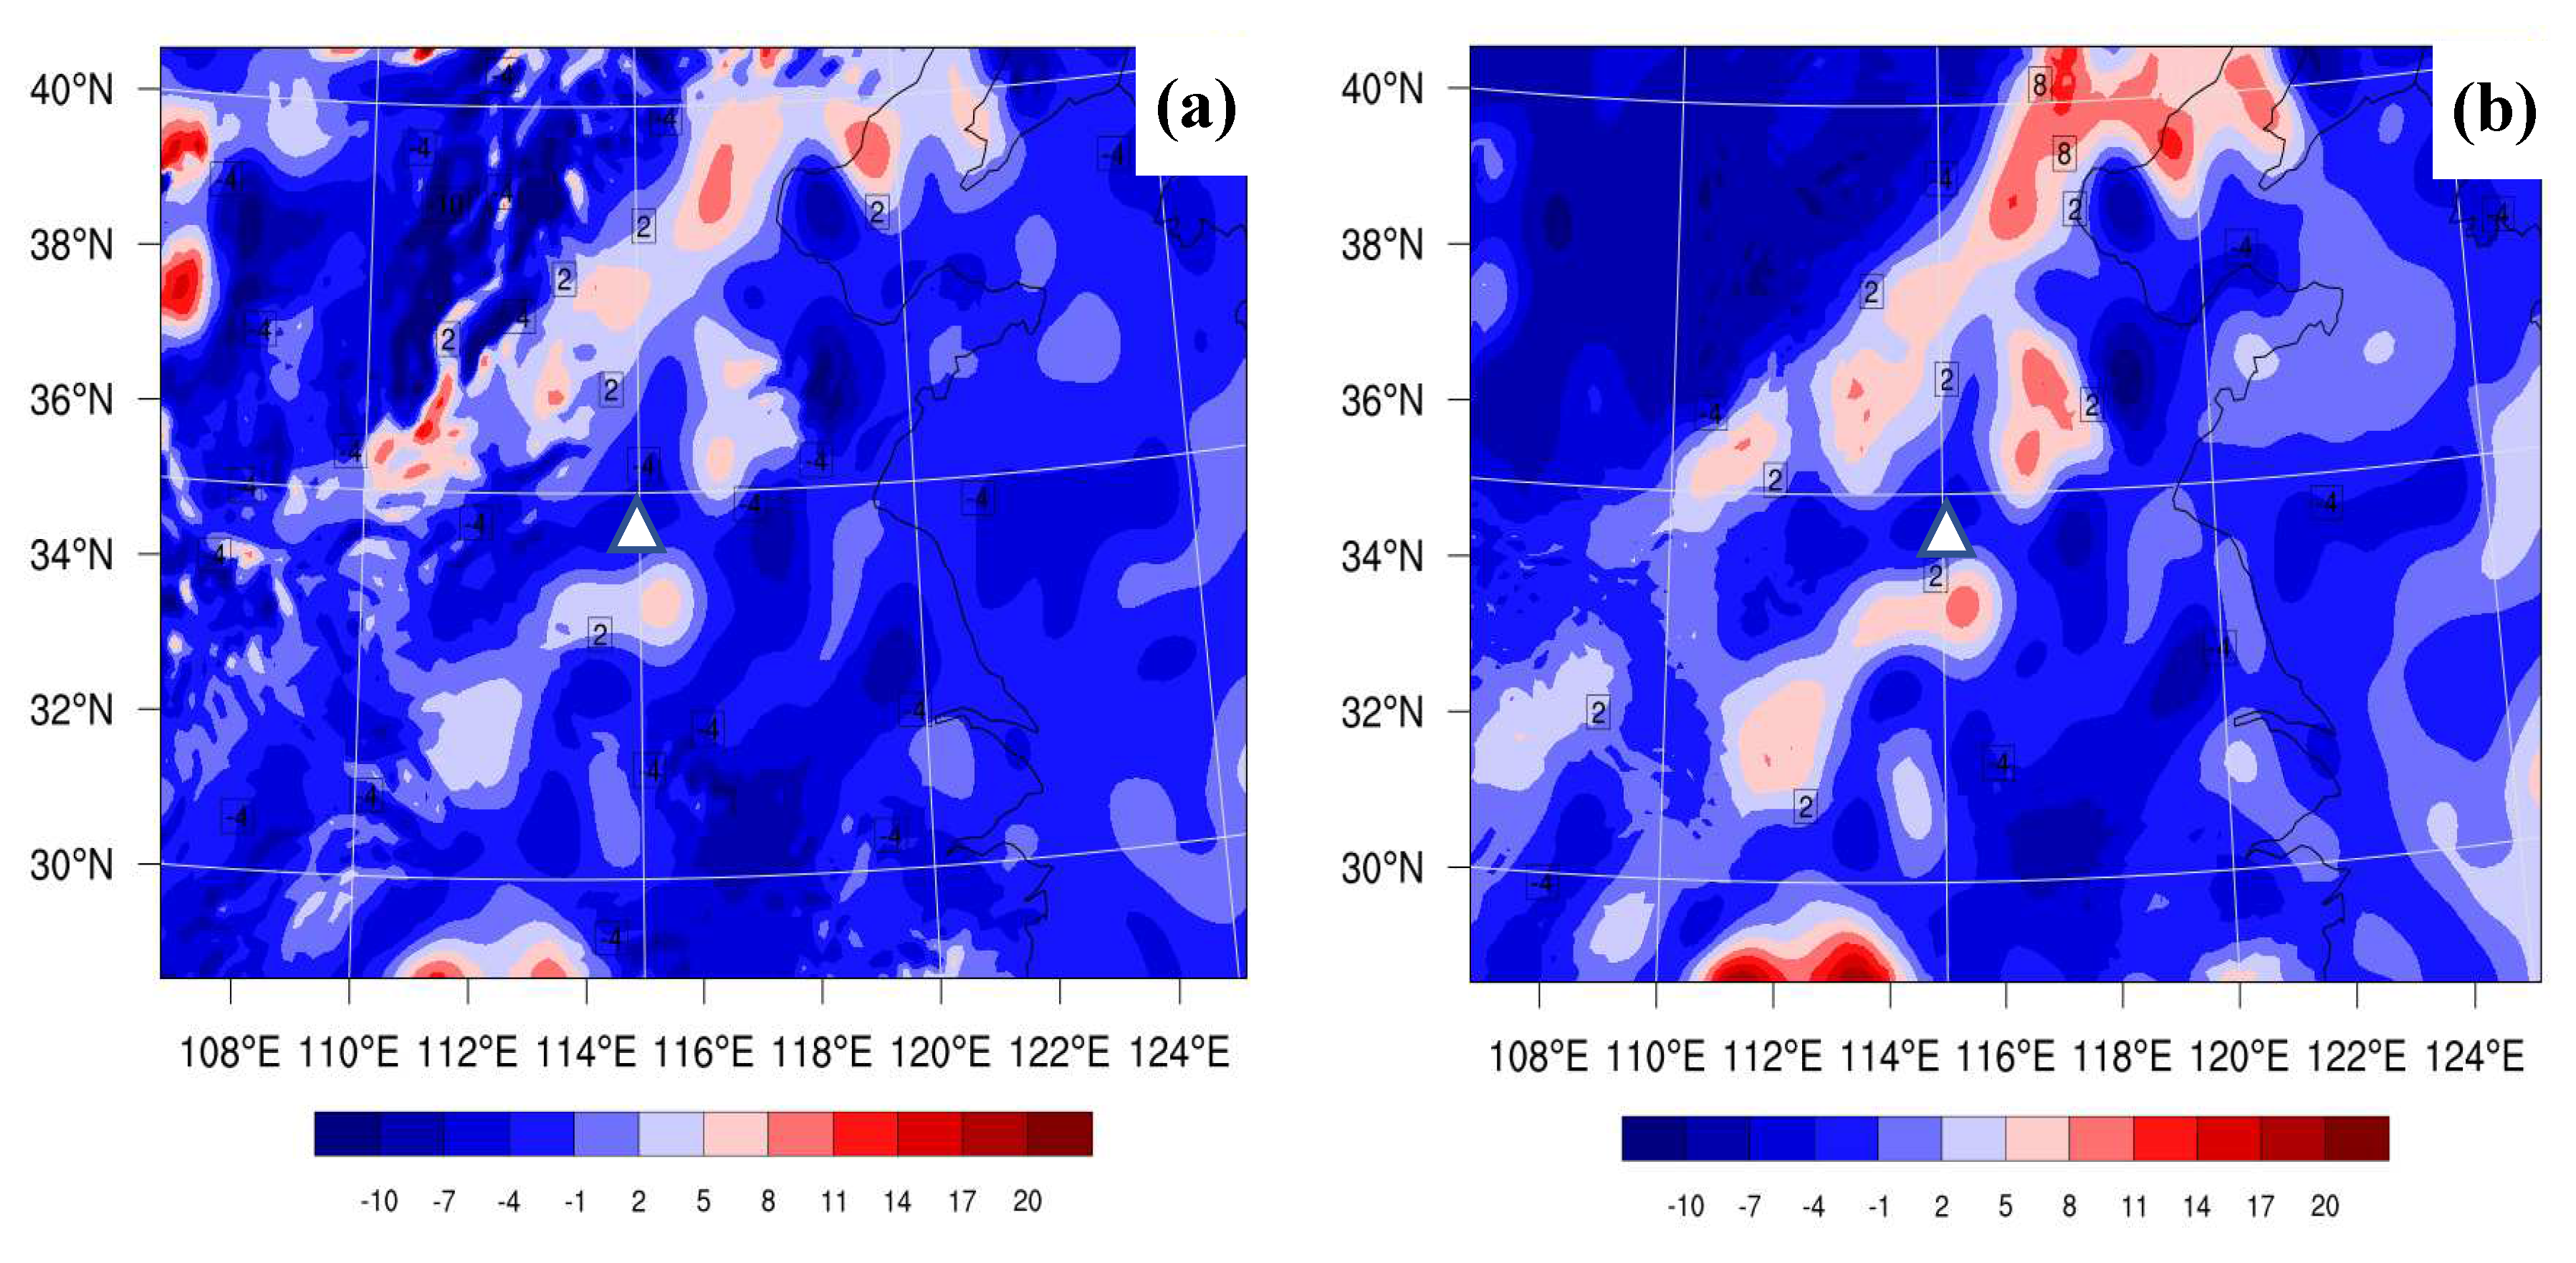
Figure 4 displays the evaluation of initial humidity increments for three distinct data assimilation experiments. The goal is to assess the singular and collective effects of the two types of assimilated data sources. The Test1 experiment, illustrated in Figure 4a, shows that the increments of specific humidity at an altitude of 850 hPa are distributed in a symmetrical pattern over the region of Kaifeng. Conversely, in the Test2 experiment (Figure 4b), the humidity increments at 500 hPa primarily concentrate over the regions experiencing heavy rainfall, as indicated in Figure 2, extending towards the central southern part of Kaifeng. Significantly, the Test3 experiment (seen in Figure 4c) presents a progressive alteration in humidity increments, which aligns with results from the Test2 experiment. This observation indicates that the incorporation of AGRI radiance predominantly impacts the moisture content in the middle-upper strata. Furthermore, when assimilating both FY-4A AGRI and terrestrial MWR data, the results appear beneficial. The aforementioned analysis underscores the effectiveness of combining FY-4A AGRI and land-based MWR data in refining initial moisture conditions within model simulations.

3.2. The Effects of Data Assimilation on 24-h Accumulated Rainfall Forecast

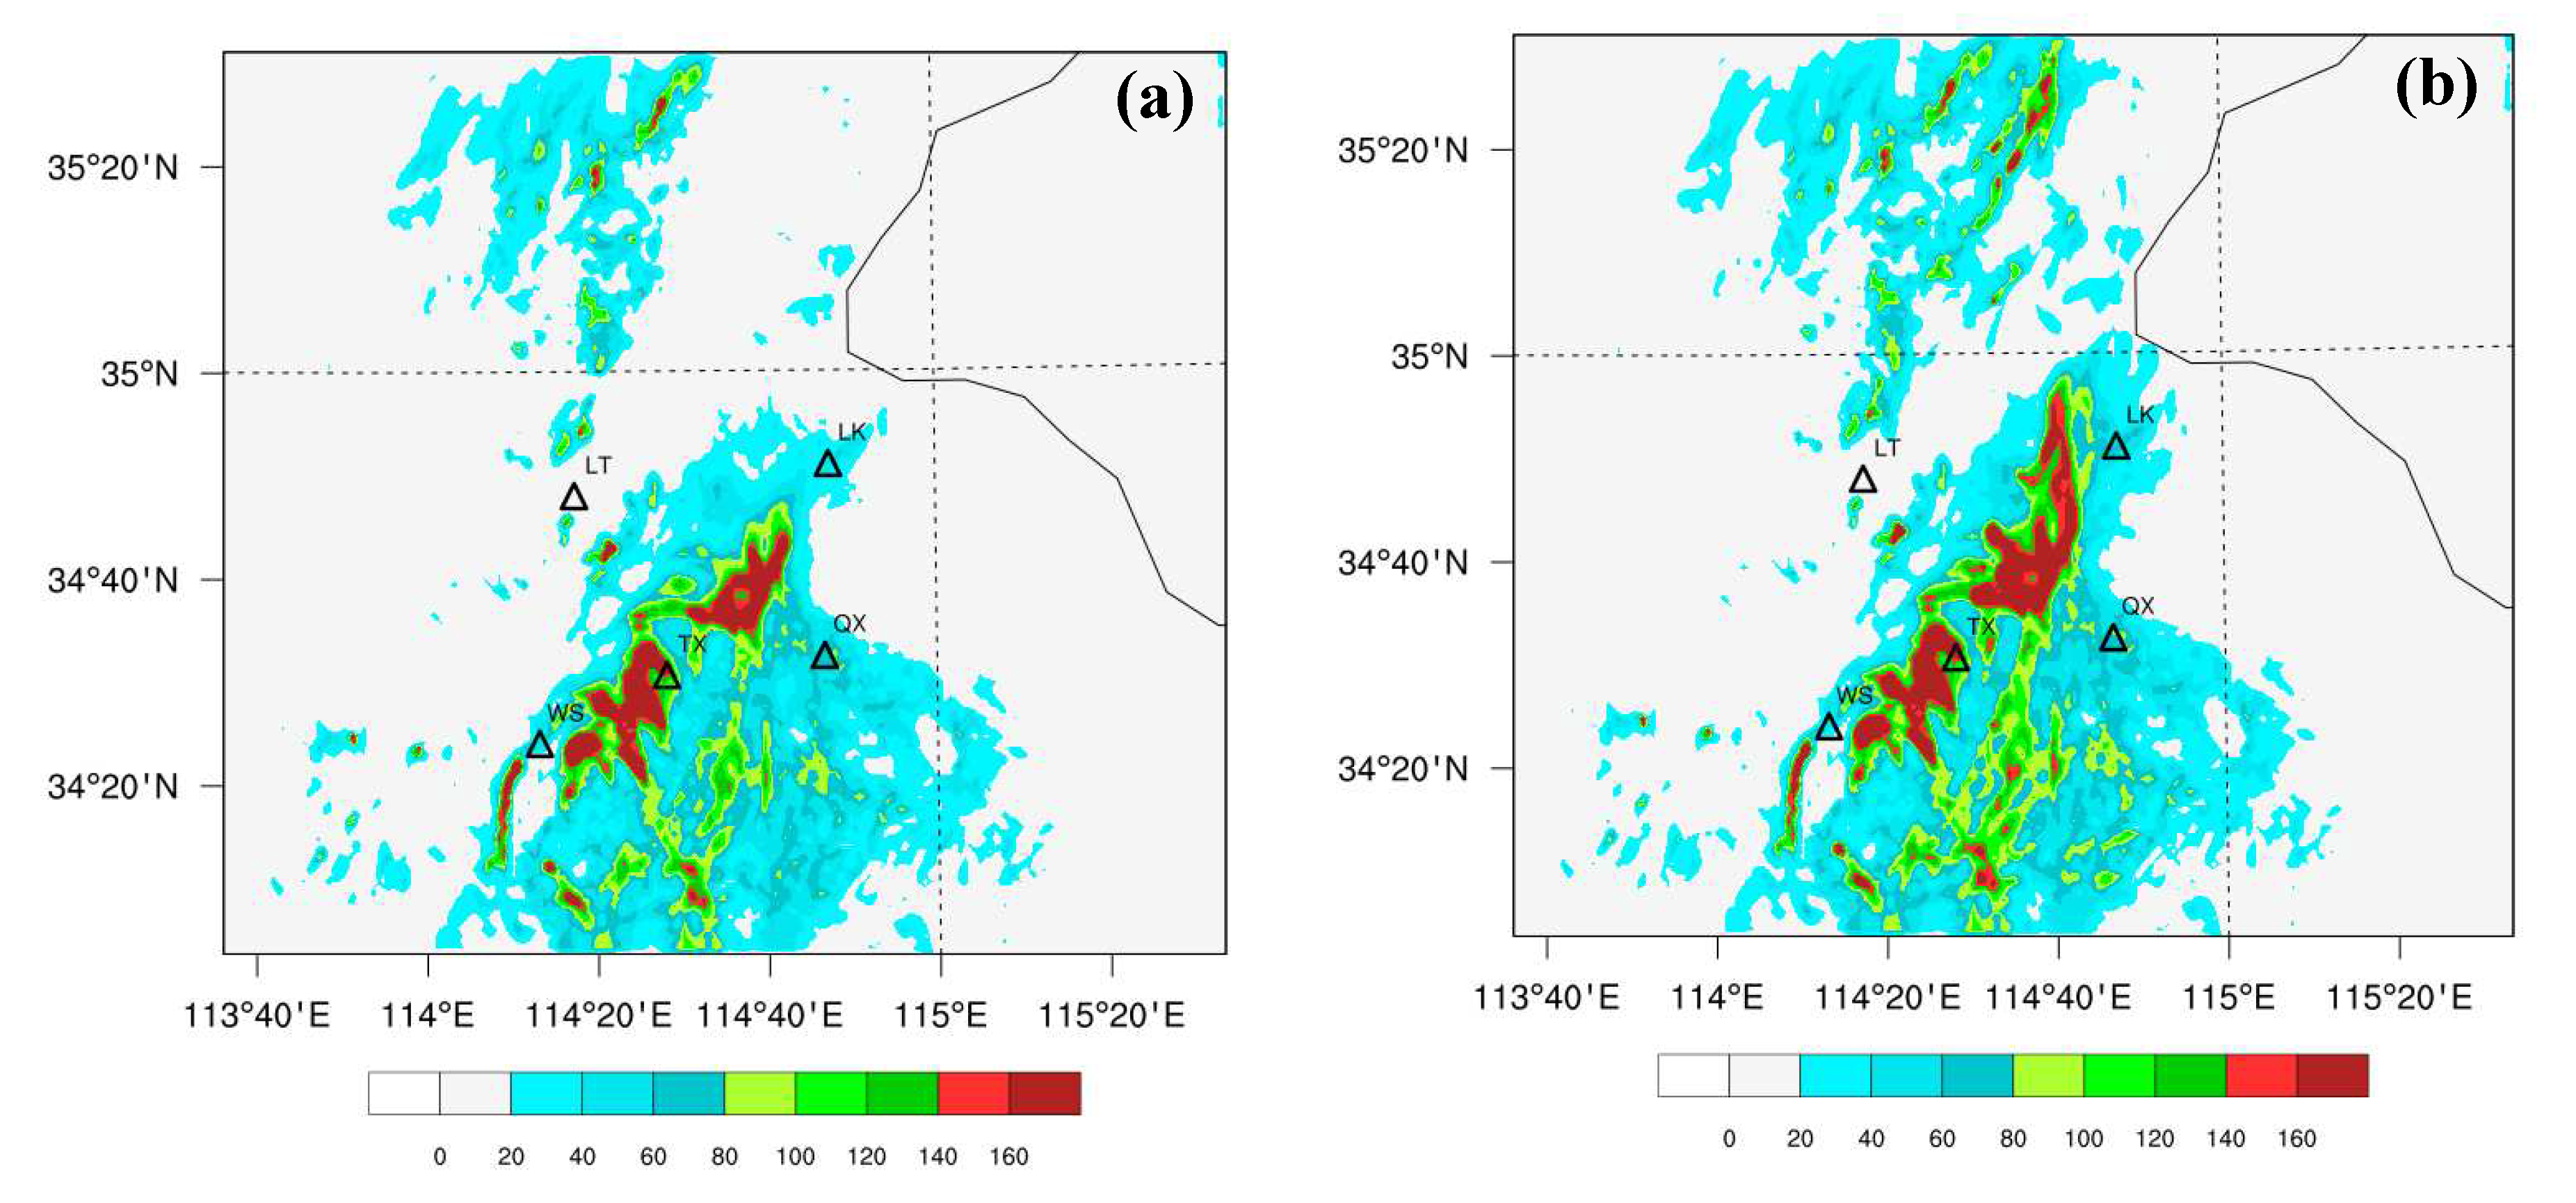
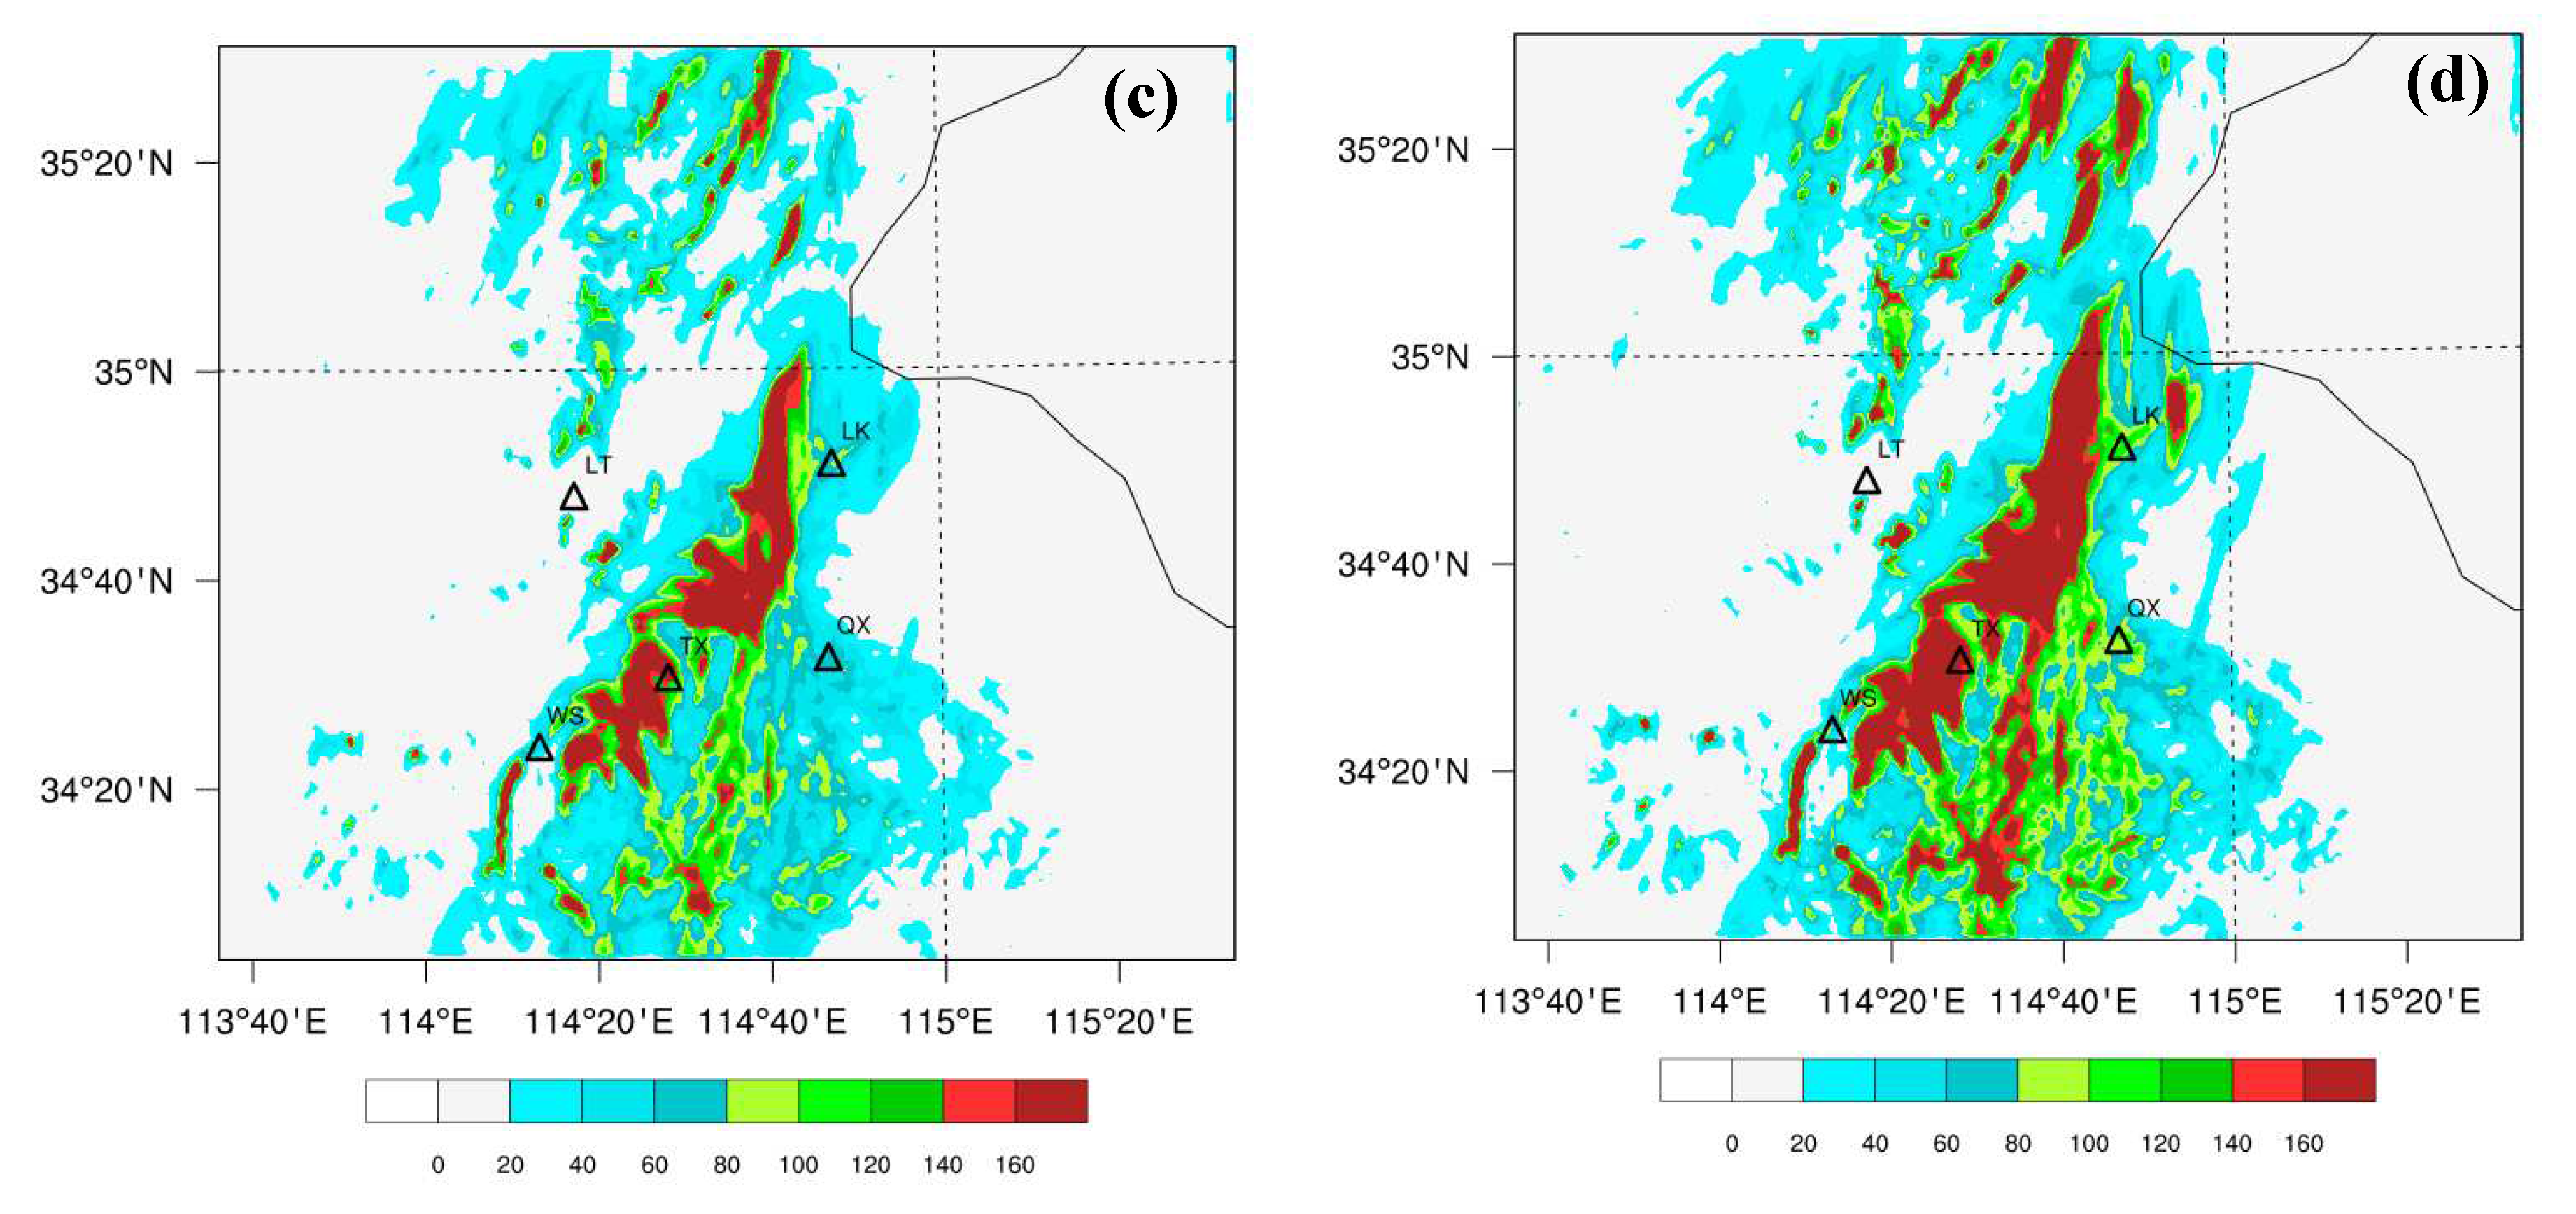
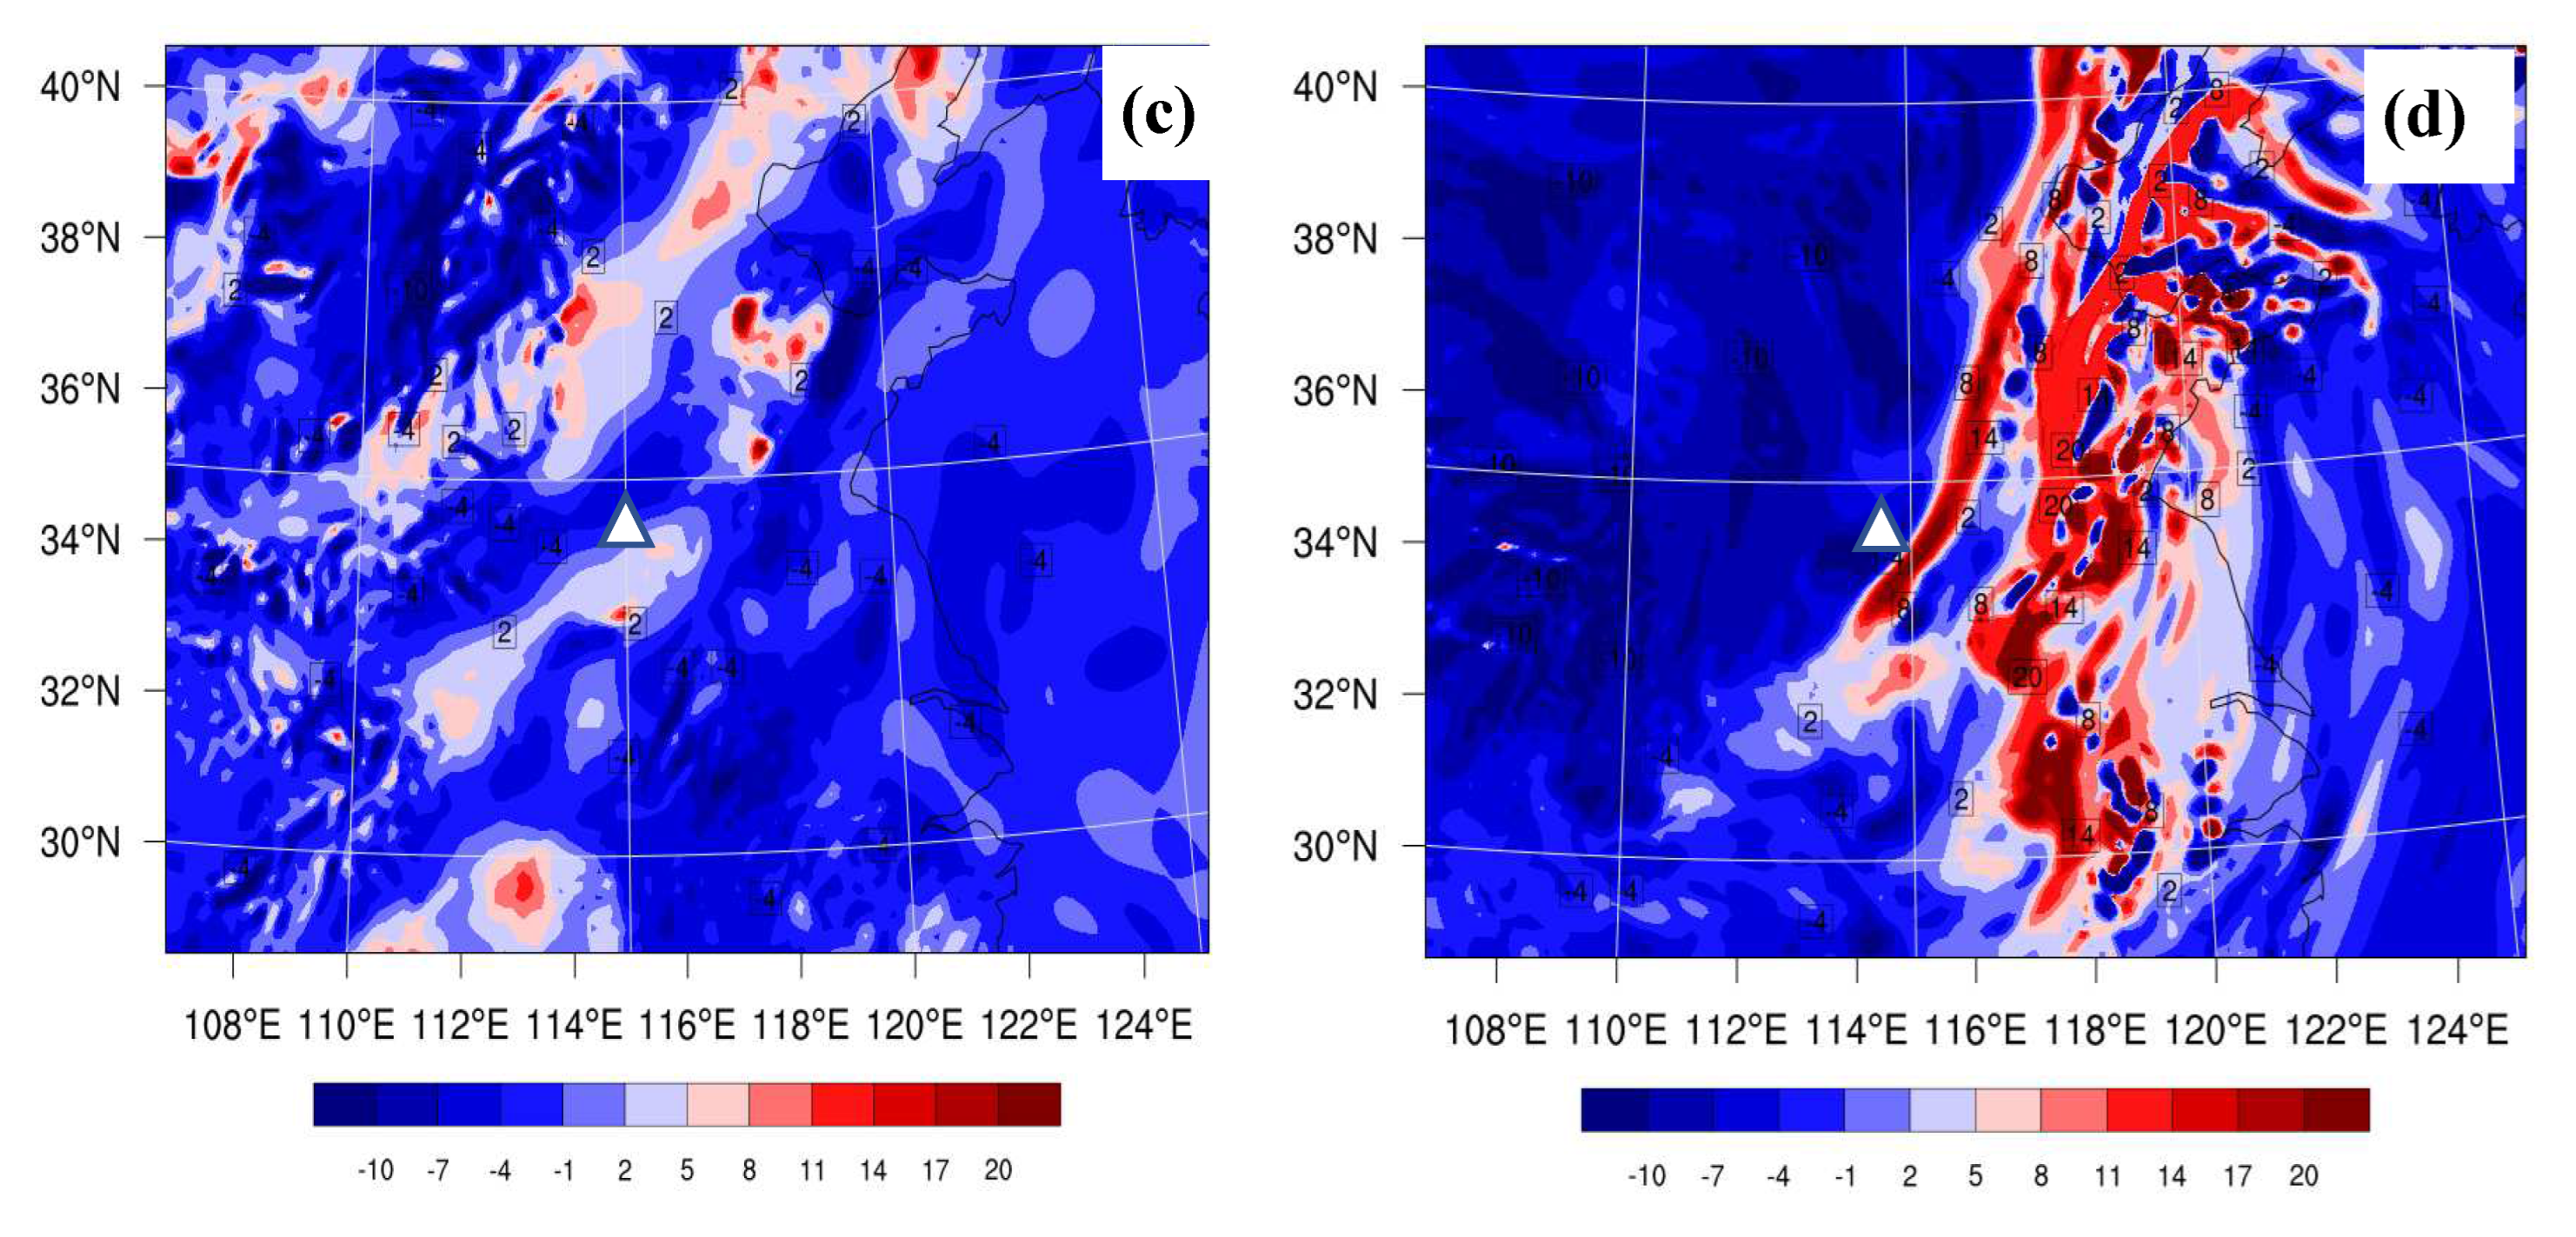
The predictive capability of numerical models plays a crucial role in evaluating their performance in forecasting precipitation. The 24-hour accumulated precipitation results derived from four distinct experiments are depicted in Figure 5. In the CTRL experiment (Figure 5a), the predicted rainfall volumes in the northern and eastern zones fail to mirror the observed intense rainfall data (Figure 2). Moreover, a notable underestimation is evident in the central region, specifically Kaifeng. Conversely, the Test1 experiment (Figure 5b), which integrates MWR assimilation, allows for effective adjustment of the 24-hour rainfall forecasts within the Kaifeng region. This notwithstanding, only minor deviations can be discerned in the northern and eastern sectors when compared with the CTRL experiment. In contrast, the Test2 experiment (Figure 5c) aligns more closely with the observed rainfall distribution (Figure 2). The previously understated rainfall near the Kaifeng region in the CTRL experiment is significantly amended in the Test2 experiment. Moreover, the predicted maximum rainfall center and strength in the Test2 experiment bear strong resemblance to the actual observations (Figure 2). More so, the Test3 experiment (Figure 5d) accentuates both the intensity and distribution of rainfall, particularly in the Kaifeng region, when compared to the Test2 experiment. The simulated 24-hour rainfall accumulation in the Kaifeng region is nearly identical to the observed value (Figure 2). These insights indicate that joint assimilation of AGRI radiance alongside terrestrial MWR data considerably bolsters the forecast accuracy of short-term heavy rainfall events. Our subsequent analysis will leverage the high spatiotemporal resolution data generated by the numerical model to examine various aspects, including the upper-level field, wind patterns, moisture conditions, mesoscale features, and the influence of topography during the heavy rainfall event.

4. Discussion

4.1. Height and Wind Fields Analysis

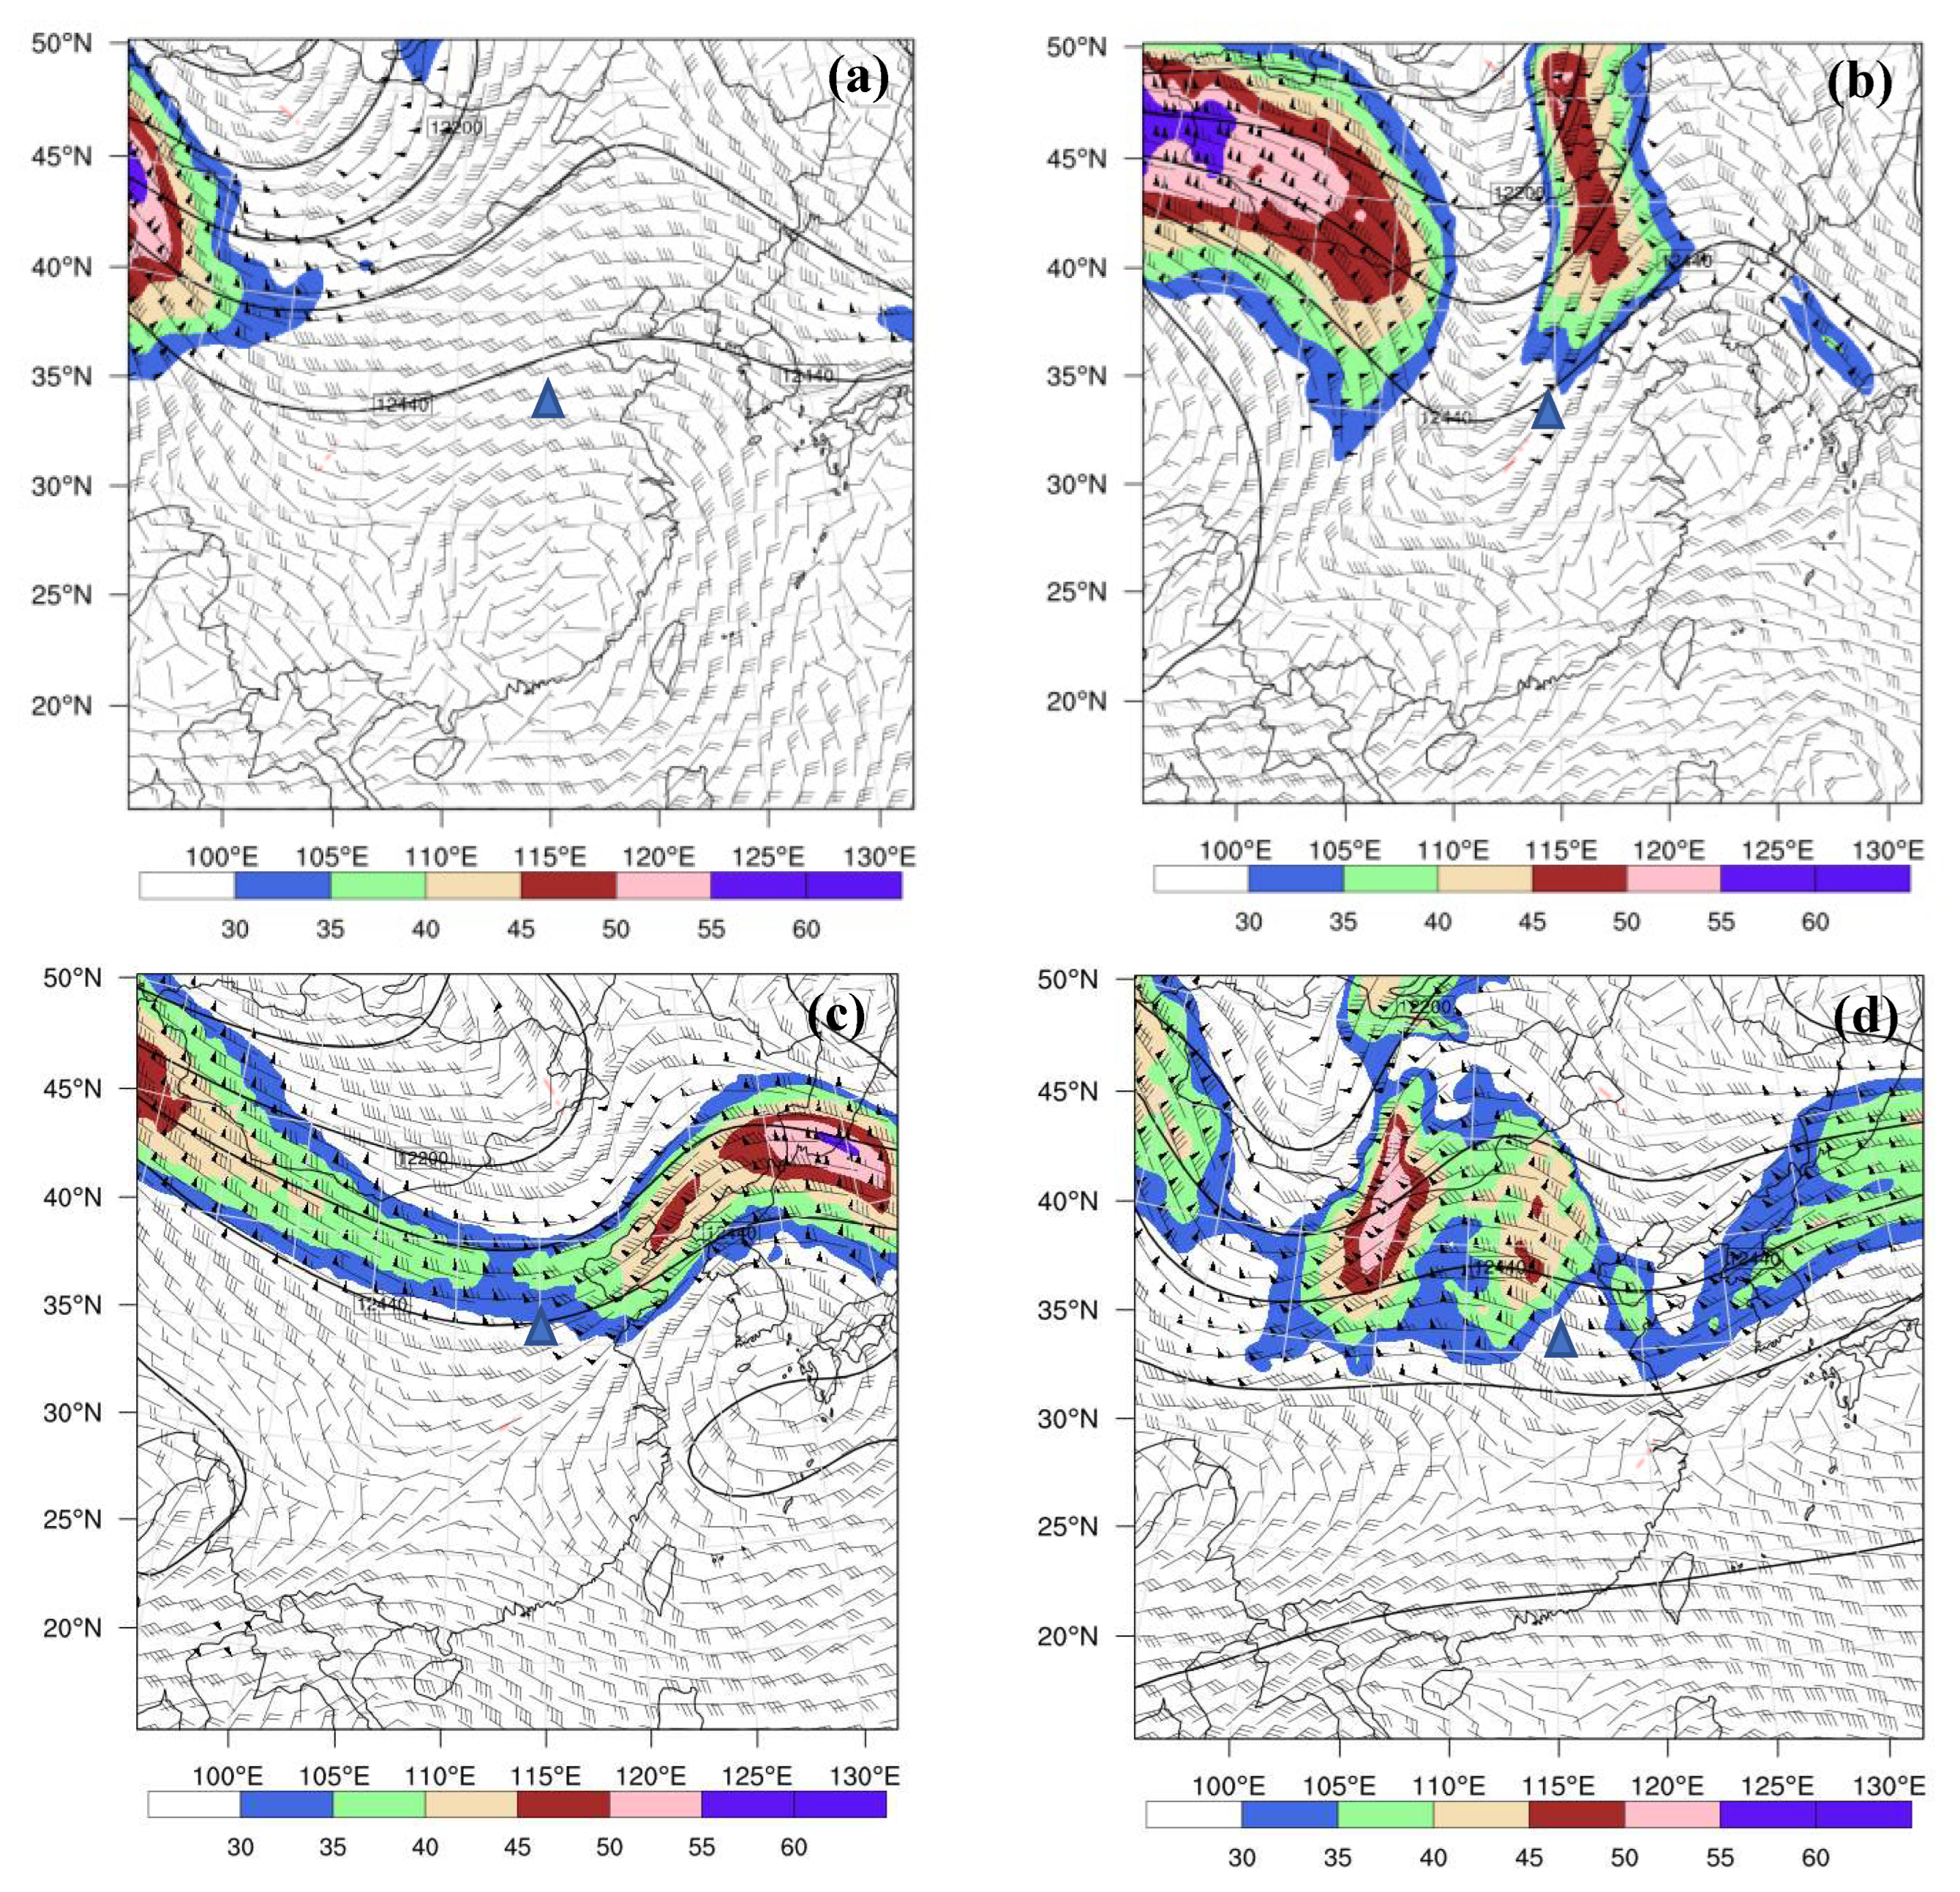
Figure 6 displays the 200hPa geopotential height field, wind field, and jet stream region on July 3, 2022. Prior to the occurrence of heavy rainfall at 02:00 (Figure 6a), there is a broad and deep high-altitude trough over the Mongolian Plateau and southern Gansu Province, exhibiting a north-to-south distribution pattern. On the southwest side of this trough (35°N-50°N, 90°E-100°E), there is a distinct high-altitude jet stream band with a core intensity exceeding 50m/s. The Kaifeng area is located southeast of the jet stream region but still relatively far from the trough. By 14:00 on July 3 (Figure 6b), as the high-altitude trough continues to move eastward and deepen, two jet streams appear over mainland China. One is located in the western region around Gansu (32°N-50°N, 90°E-110°E), while the other is situated in the eastern region around North China (35°N-50°N, 113°E-120°E). The core intensity of the western jet stream reaches more than 55m/s, while the eastern jet stream maintains an intensity of over 45m/s. The Kaifeng area is positioned in the southeastern part of the trough, close to the eastern jet stream. The strong warm and moist airflow prevails ahead of the trough, which is favorable for vertical moisture transport. By 20:00 on July 3 (Figure 6c), the high-altitude trough continues to move eastward and lift northward, causing the merger of the two jet streams into an east-west-oriented high-altitude jet stream band with a core intensity exceeding 50m/s. The Kaifeng area is situated in the southwestern part of the trough. Under the control and influence of northwest sinking airflow behind the trough, the weather gradually transitions to sunny conditions. By 08:00 on July 4 (Figure 6d), the main system has moved far away from the Kaifeng region. Under the influence of northwest sinking airflow ahead of the trough ridge, the weather becomes sunny.

4.2. Water Vapor Condition Analysis

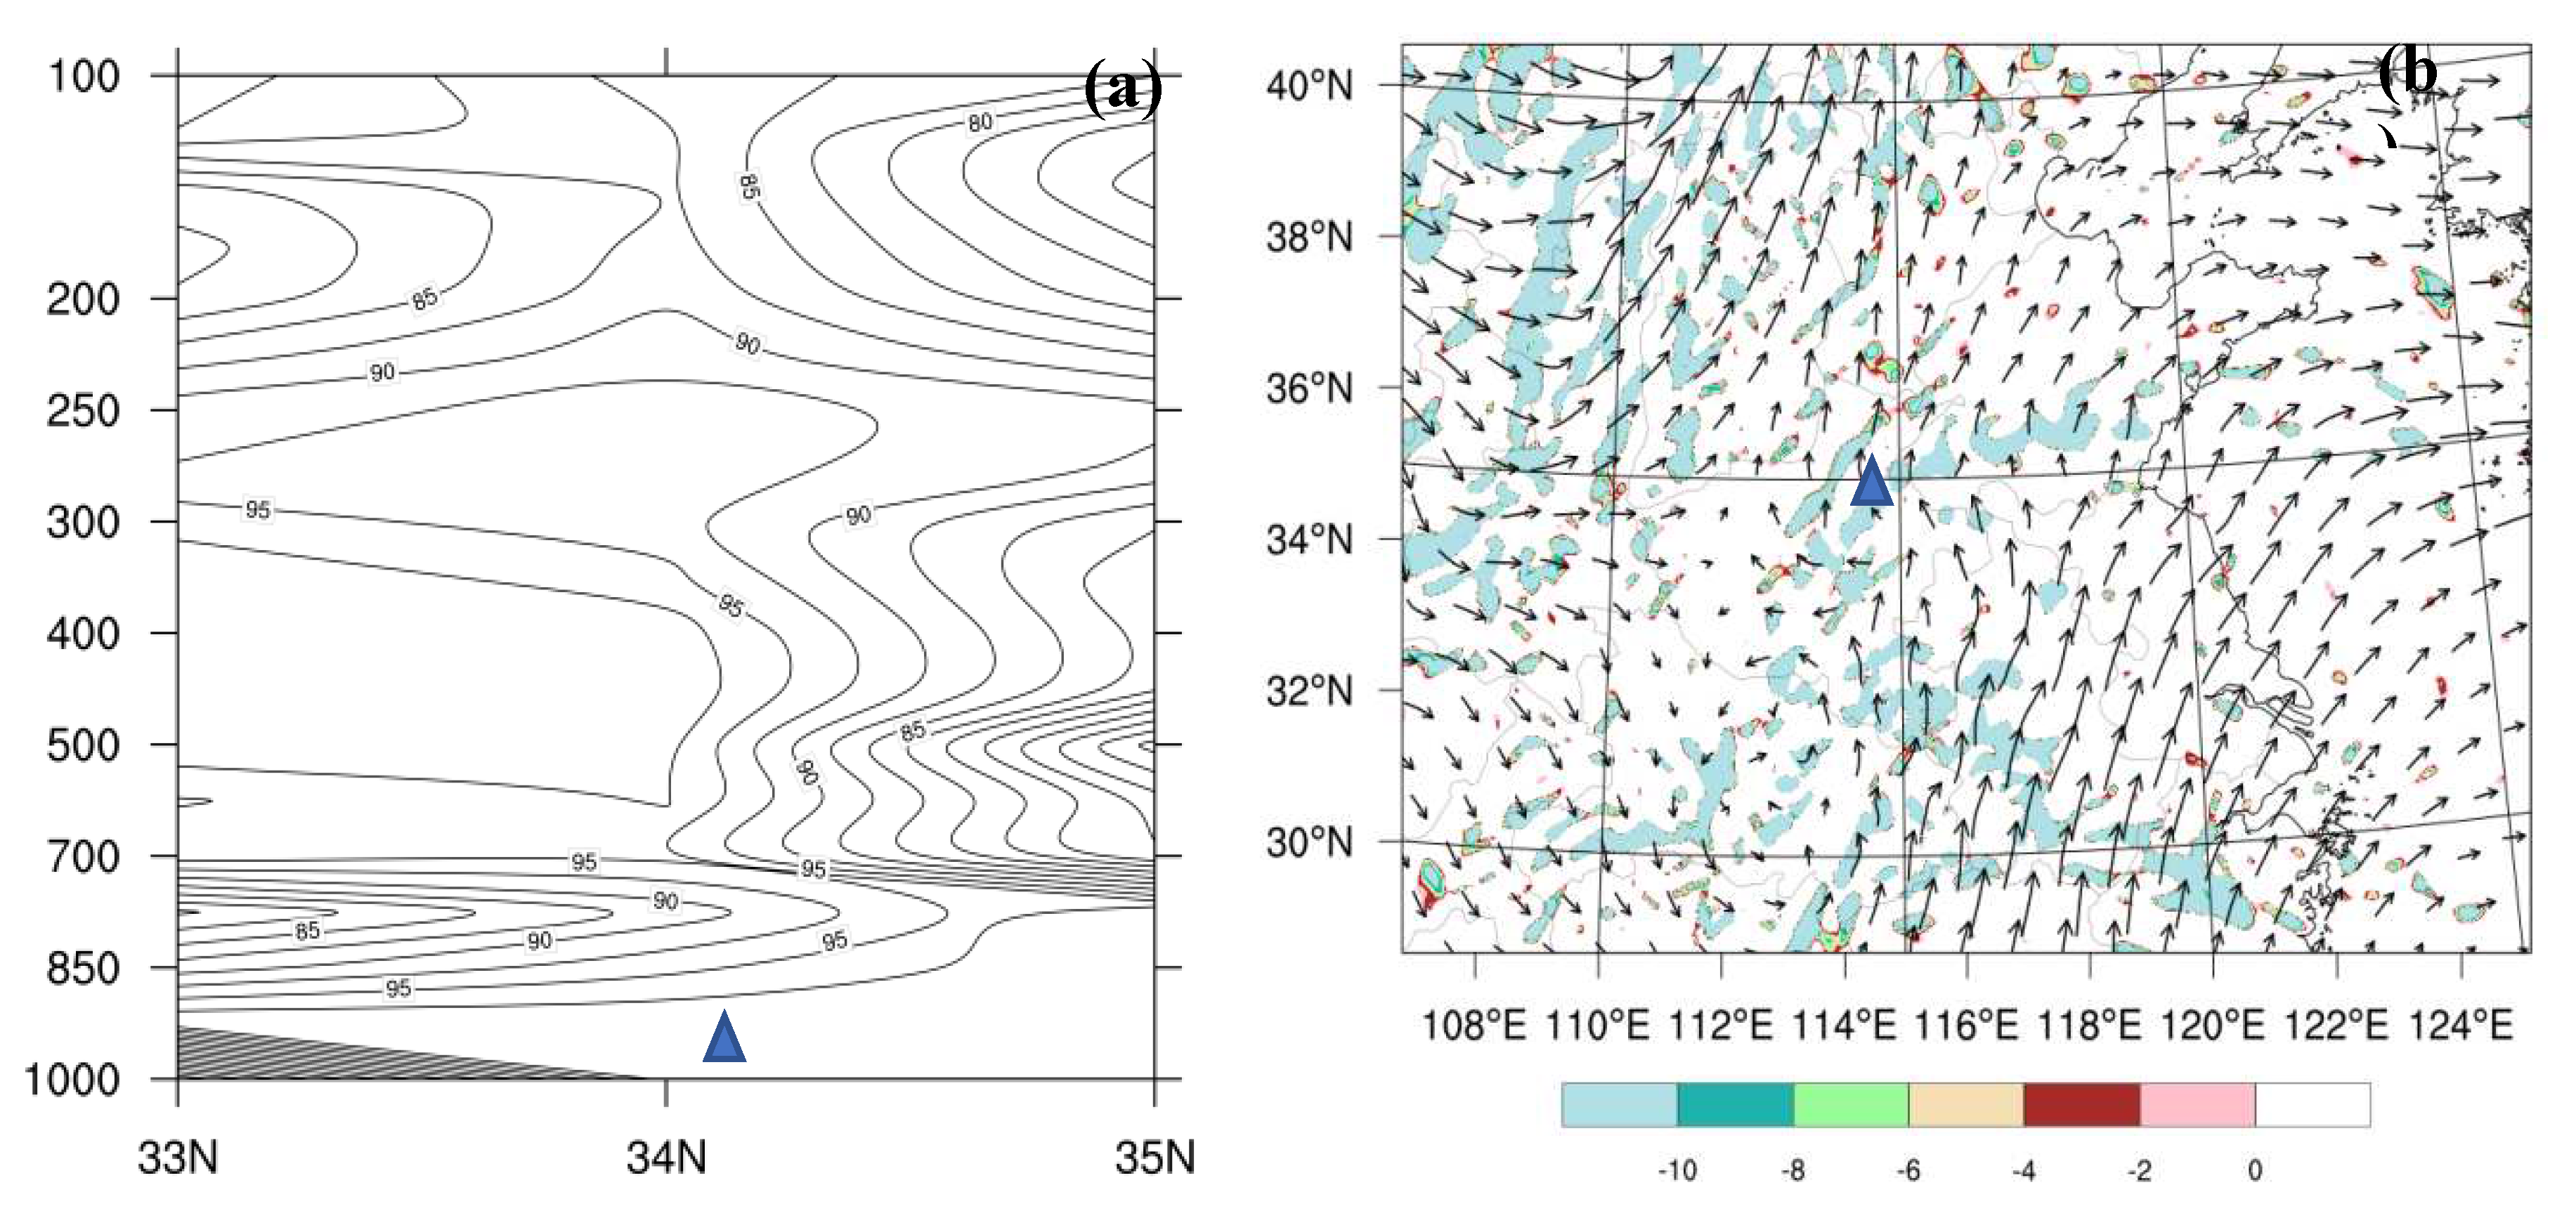
During the occurrence and development of heavy rainfall, moisture conditions play a crucial role. The higher the humidity and the thicker the moist layer, the more likely it is for heavy rainfall weather to form and develop. Figure 7a shows the vertical profile of relative humidity at 14:00 on July 3, 2022. By analyzing this profile, we can observe that due to the upward motion of the upper-level trough, a large amount of warm and moist air rises to the height of the troposphere, with relative humidity exceeding 90% between 850hPa and 300hPa. Combining this with the 700hPa water vapor flux map (Figure 7b), we can see a distinct water vapor transport channel near 114°E, where water vapor is continuously transported to the precipitation area. As mentioned earlier, the Kaifeng area is located in the southeastern region ahead of the trough. Under the influence of southwestward airflow ahead of the trough, a significant amount of water vapor is transported to the Kaifeng area. Over the precipitation area, a strong negative divergence of water vapor flux is observed, and multiple convergence centers appear near the Kaifeng area, with center intensities reaching -10.0×10⁻⁶·g·cm-2·hPa-1·s-1. The analysis above demonstrates that the Kaifeng area has high humidity and strong convergence, which provide favorable moisture conditions for the formation and development of heavy rainfall.

4.3. Dynamic Condition Analysis

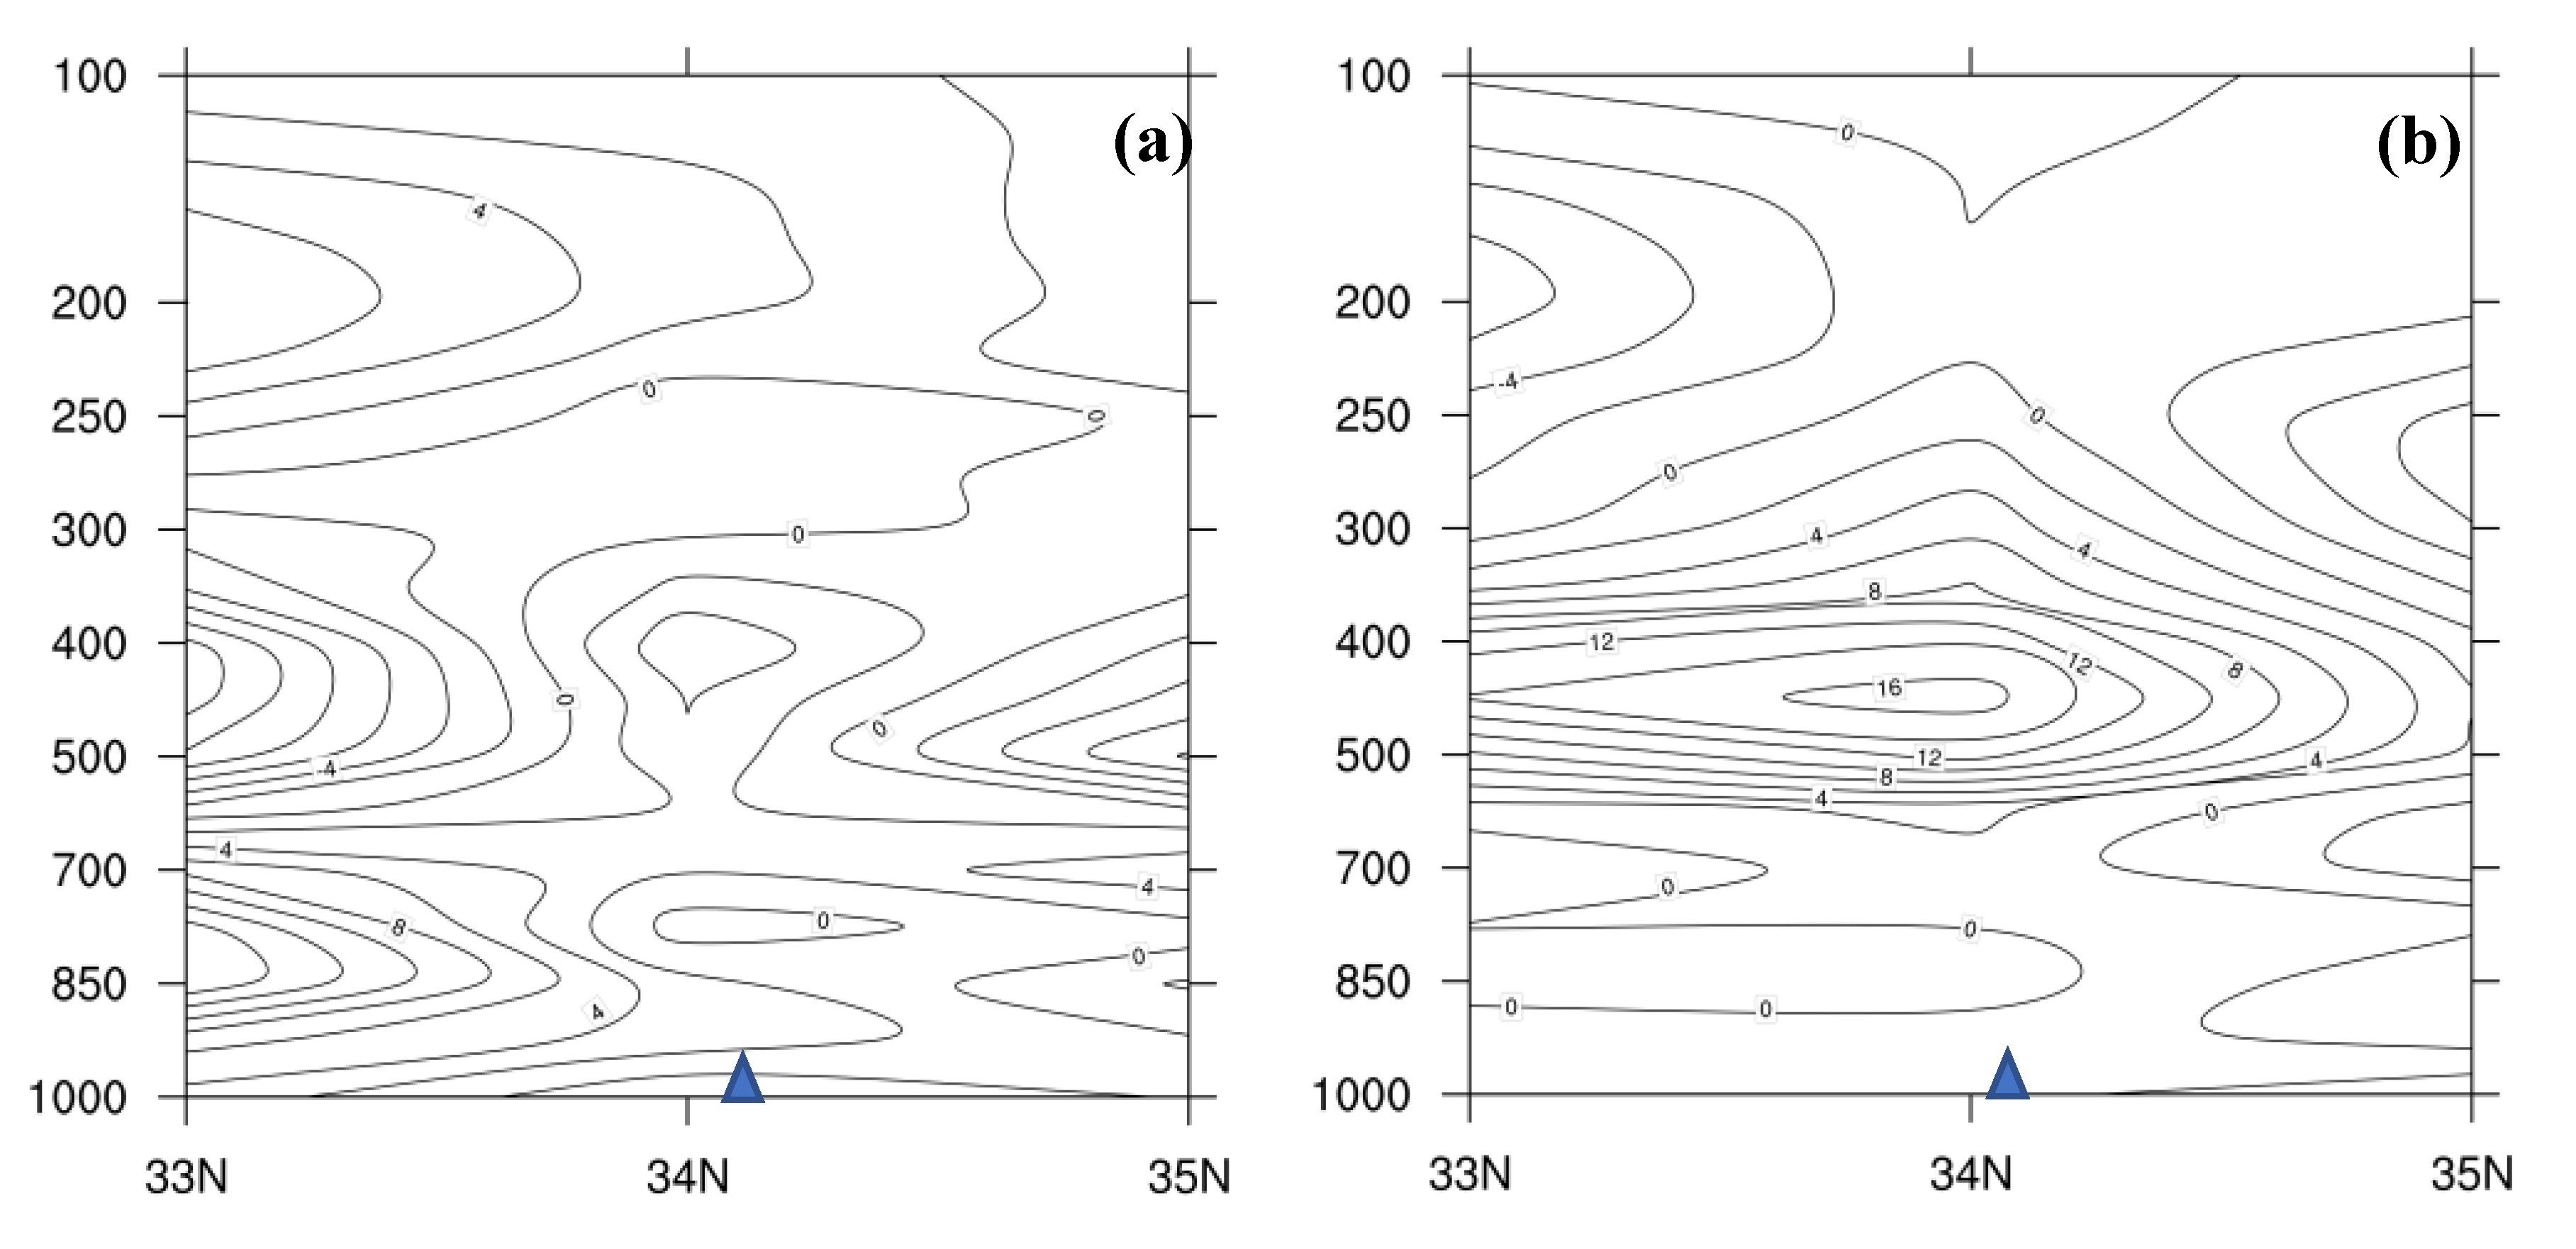
During the occurrence and development of weather systems, strong upward motion in the vertical direction is an important condition for the formation and development of the system. Heat, momentum, water vapor, and other factors can be transported to the upper atmosphere through the vertical upward motion of air, resulting in the generation of precipitation [69]. Figure 8 shows the vertical velocity profiles at 02:00, 14:00, 20:00 on July 3, and 08:00 on July 4. By analyzing these profiles, it can be observed that there is a significant upward motion around 14:00. The vertical motion over the Kaifeng area is vigorous from the lower levels to the higher levels of the atmosphere, particularly between 850hPa and 400hPa, where the vertical motion is the strongest. The maximum vertical velocity is reached around 450hPa, with a value of 16 Pa/s. The analysis above indicates that during the period of heavy rainfall in the Kaifeng area, convective activity is strong. The intense vertical upward motion triggers atmospheric convection and leads to the release of unstable energy in the atmosphere, thereby sustaining and intensifying convective weather.
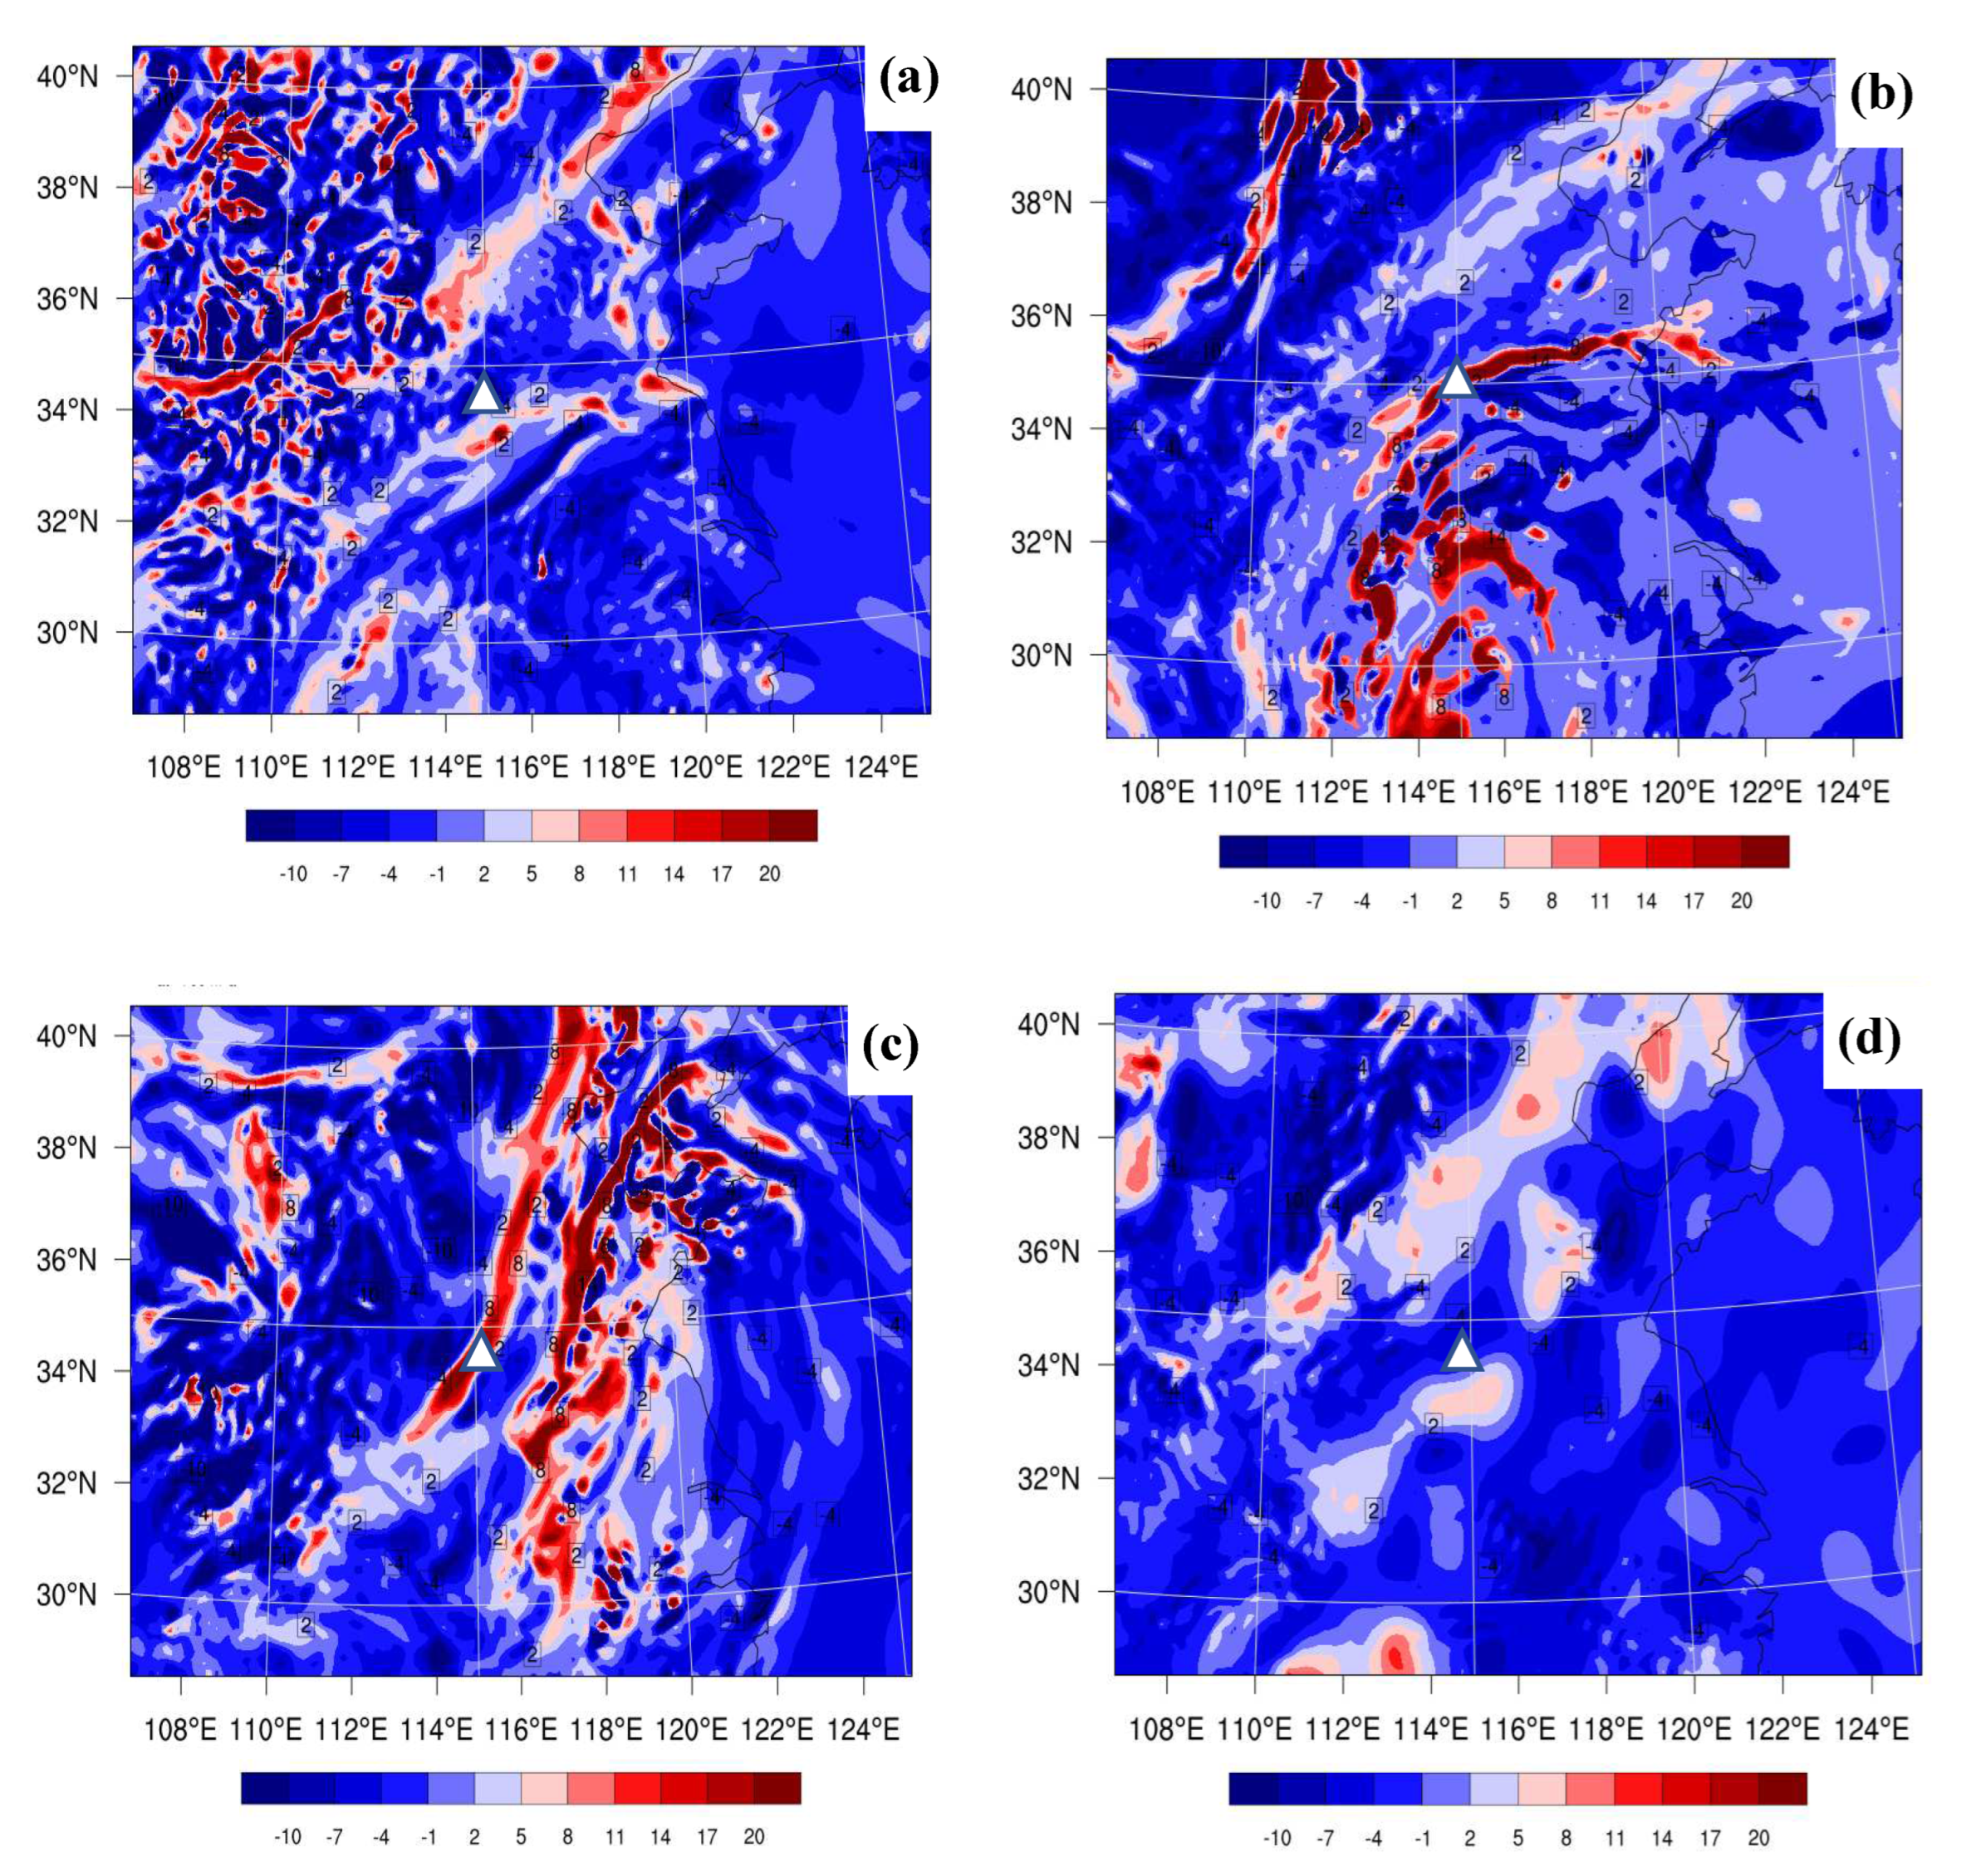
Figure 9 shows the 500hPa upper-level divergence field at 02:00, 14:00, 20:00 on July 3, and 08:00 on July 4. At 02:00 on July 3 (Figure 9a), before the occurrence of precipitation, the upper-level jet stream above the Kaifeng area is weak. The divergence motion is mainly concentrated on one side of the jet stream entrance and is relatively weak in intensity. At 14:00 on July 3 (Figure 9b), as the trough deepens, the upper-level jet stream strengthens, and the meridional extent of the upper-level jet stream axis over the Kaifeng area increases. Due to the closer proximity of the jet stream entrance region to the Kaifeng area, the divergence motion in this area intensifies. The divergence action leads to the adjustment of atmospheric mass, causing vertical motion to occur below and thus forcing precipitation. By 20:00 on July 3 (Figure 9c), as the trough continues to move eastward and lift northward, the center of maximum divergence is located in the central part of Inner Mongolia, Hebei, and Henan. Subsequently, the upper-level jet stream continuously moves northeastward, and the divergence region shifts from Henan to Liaoning, resulting in a weakening of precipitation over the Kaifeng area (Figure 9d). Figure 10 presents the distribution of 700hPa divergence during the occurrence and development of heavy rainfall at 02:00, 14:00, 20:00 on July 3, and 08:00 on July 4. It can be observed that there is strong convergence in the direction of the movement of the upper-level trough, causing strong convergence motion in that direction. The convergence centers correspond well with the divergence centers on the right side of the jet stream entrance region. This conFigureuration of upper-level divergence and lower-level convergence enhances the vertical upward motion over the Kaifeng area, providing better dynamic conditions for the generation and development of heavy rainfall.
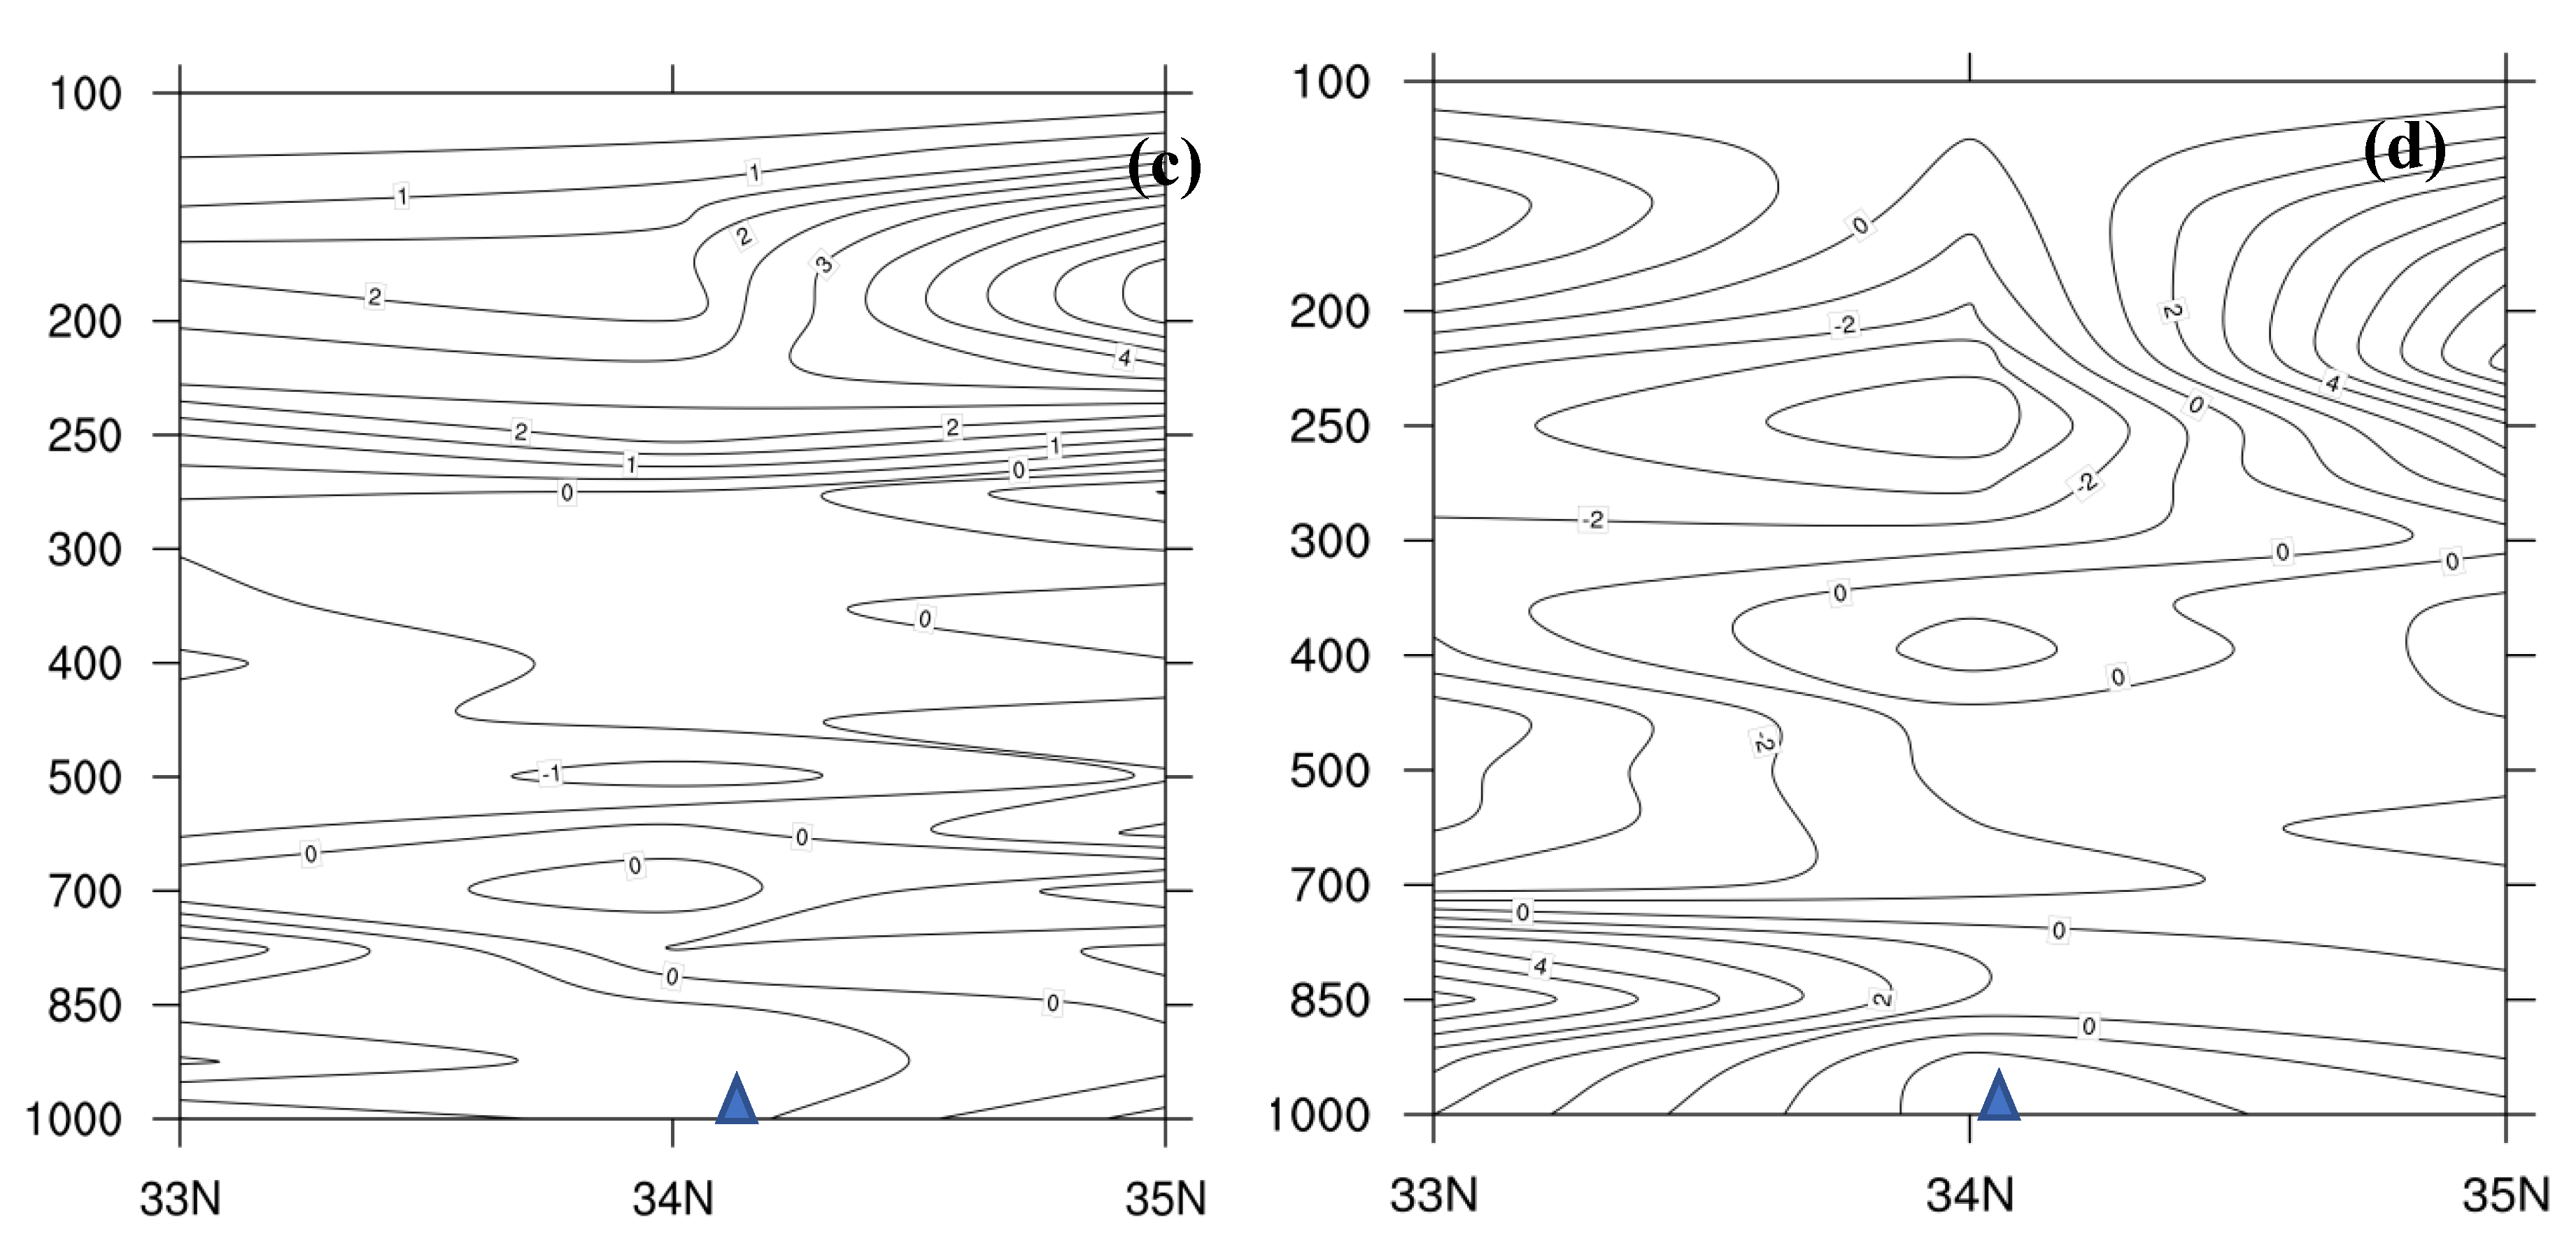
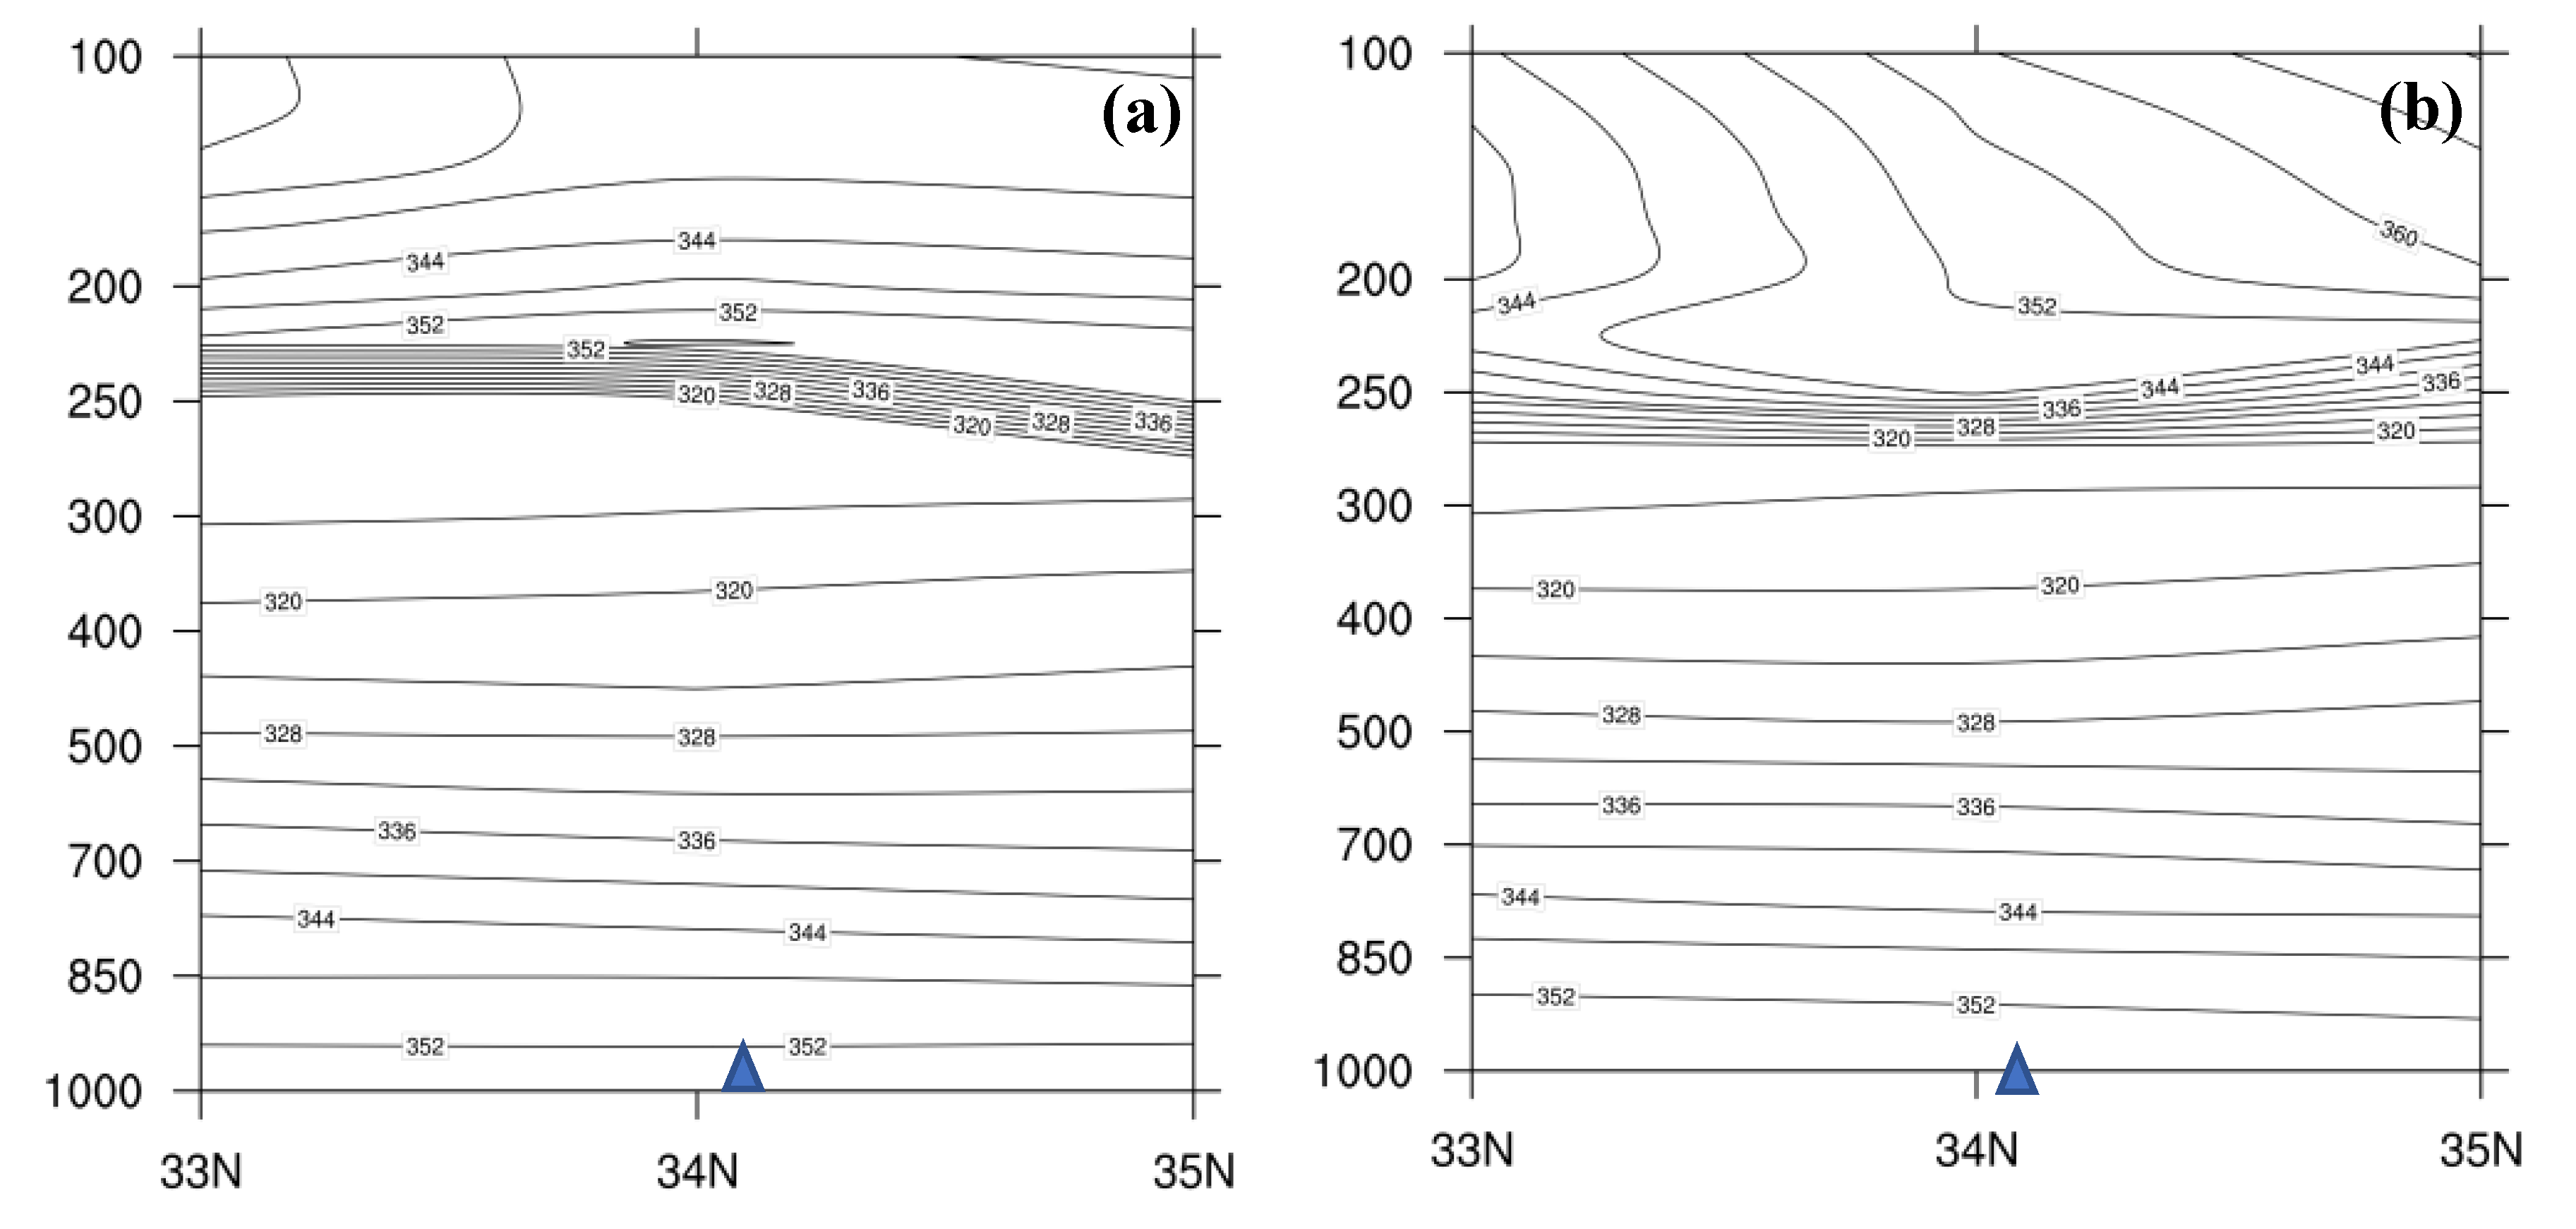
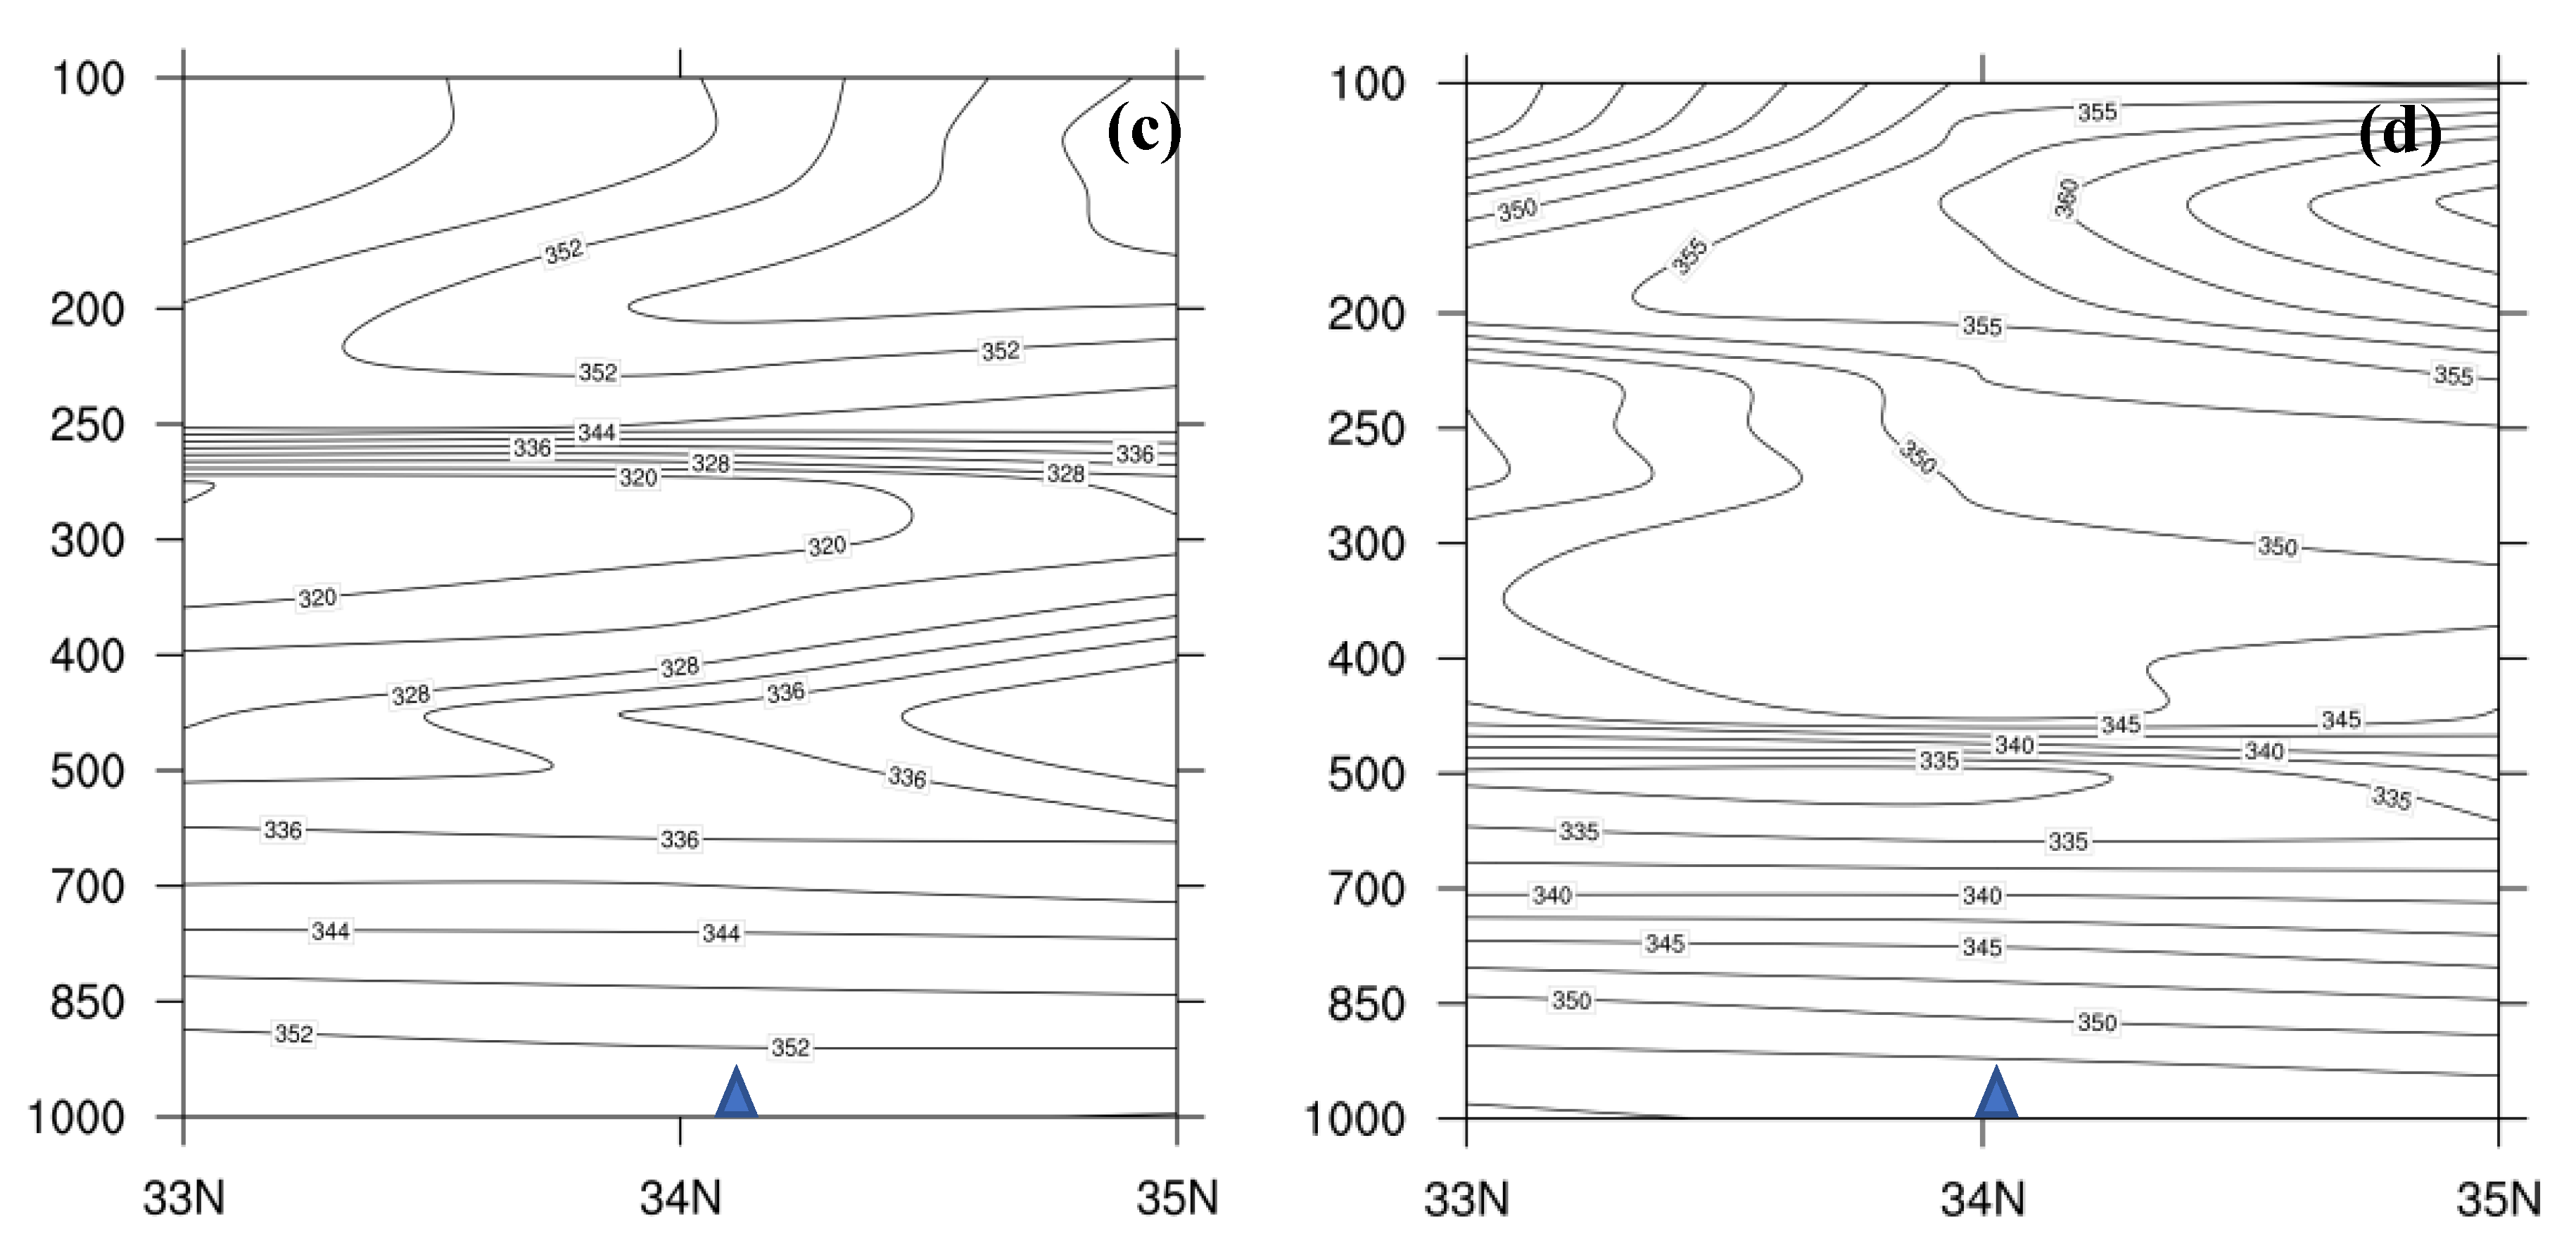
Equivalent potential temperature ( θ s e ) is a key indicator of atmospheric stability. Figure 11 shows the vertical profile of θ s e at 02:00, 14:00, and 20:00 on July 3, as well as at 08:00 on July 4. It can be observed that during the occurrence and development of heavy rainfall, the value of θ s e / z in the Kaifeng area from ground level to 300hPa is less than 0, indicating that θ s e shows a decreasing trend with increasing height.The results illustrate that the middle and lower atmospheric stratification in the Kaifeng area is in an unstable state,there is strong upward motion in the vertical direction, and under the influence of this upward motion, moisture and energy from the lower levels are continuously transported to higher altitudes.
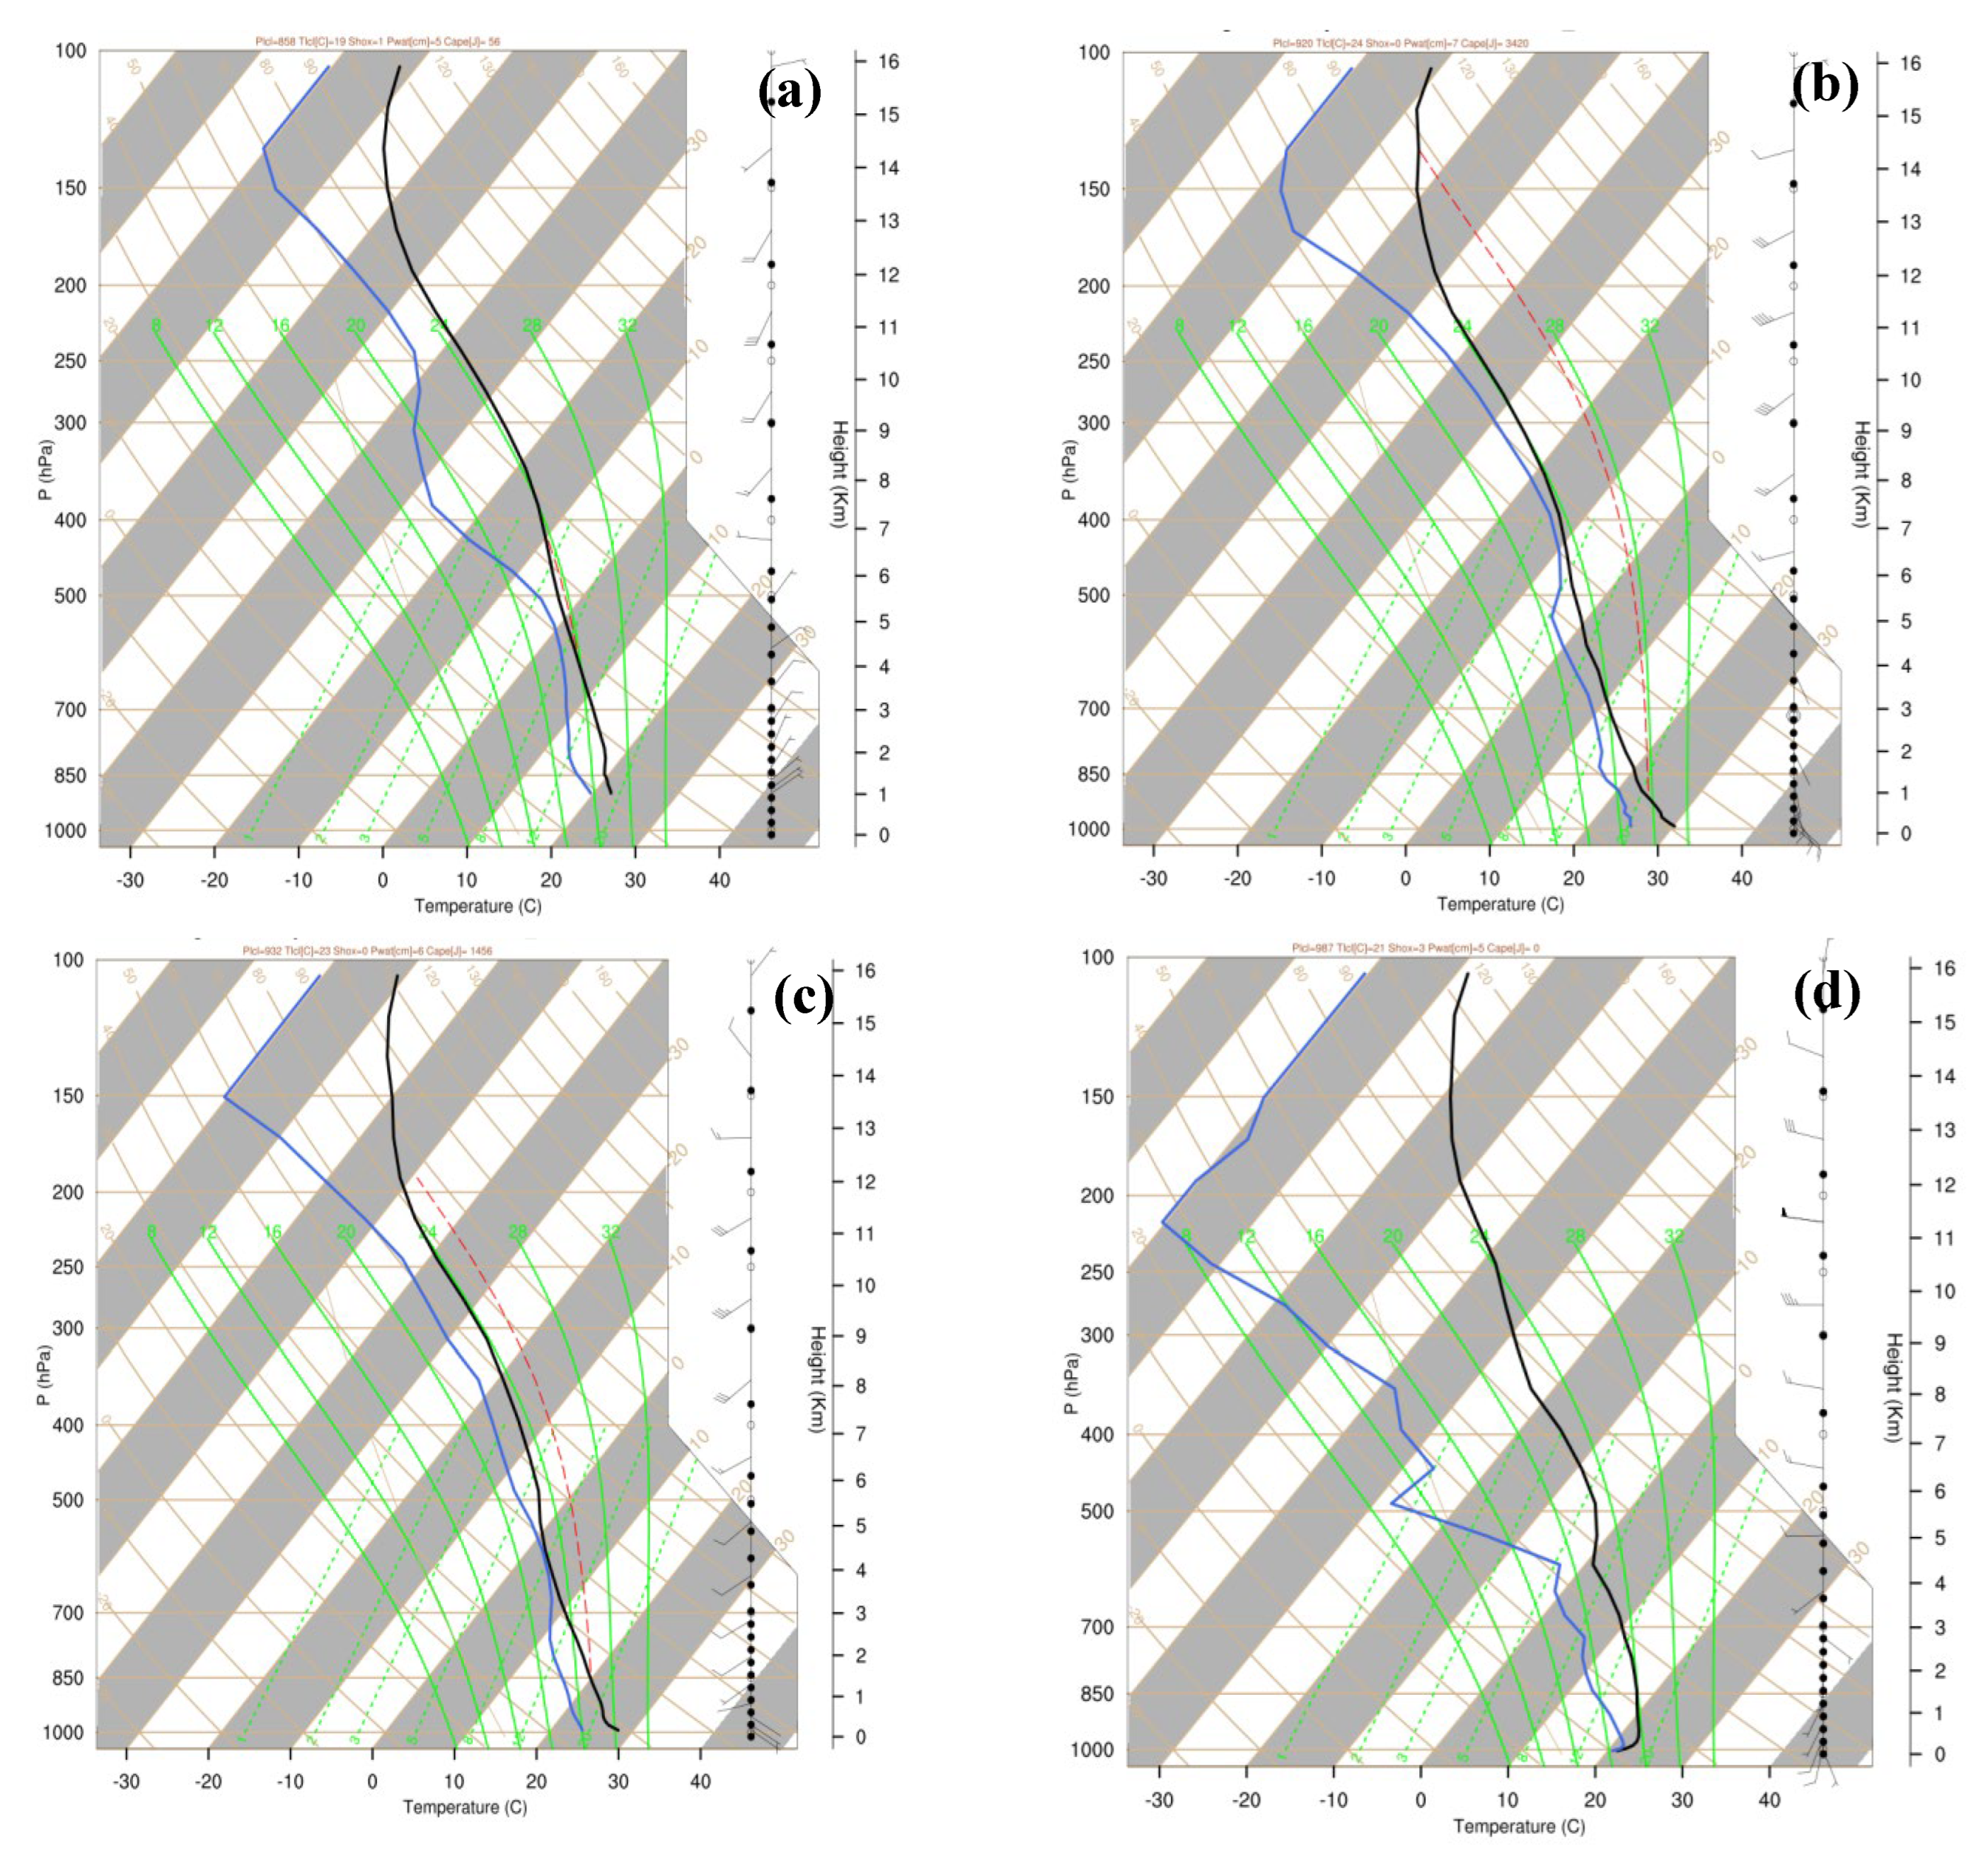
Figure 12 presents the sounding curves from the Kaifeng station on July 3-4, 2022. From the Figure, it can be observed that at 02:00 on July 3, the relative humidity between 850hPa and 500hPa is relatively high in the region. The convective available potential energy (CAPE) is measured at 56 J/kg (Figure 12a), indicating a relatively weak convective development at this time. Consequently, the Kaifeng area experiences only light and sporadic precipitation. As the upper-level trough moves eastward and intensifies, the Kaifeng area gradually situates itself ahead of the trough. Under the control of warm and moist southwest airflow, the humidity in the upper atmosphere over Kaifeng significantly increases, resulting in a continuous rise in CAPE. By 14:00 on July 3, the CAPE has reached 3420 J/kg (Figure 12b), a substantial increase of 3364 J/kg compared to 02:00. This rapid accumulation and release of unstable energy create favorable conditions for the occurrence of heavy rainfall. This period coincides with the peak of precipitation in Kaifeng, which is consistent with the observed precipitation records. By 20:00 on July 3, as the upper-level trough continues to move northeastward, Kaifeng gradually transitions to the rear of the trough, causing a decline in CAPE. Compared to 00:00, the CAPE decreases by 1964 J/kg (Figure 12c). During this time, the main precipitation type in Kaifeng shifts to convective showers. By 08:00 on July 4, as the upper-level trough fully exits the region, the CAPE ultimately reduces to 0 J/kg (Figure 12d). The atmospheric state undergoes a transition from an absolutely unstable condition before the heavy rainfall to an absolutely stable state, marking the end of the precipitation process in Kaifeng. The analysis above demonstrates a consistent relationship between the formation, development, and termination of heavy rainfall and the accumulation, development, and release of CAPE.

4.4. Terrain Condition Analysis

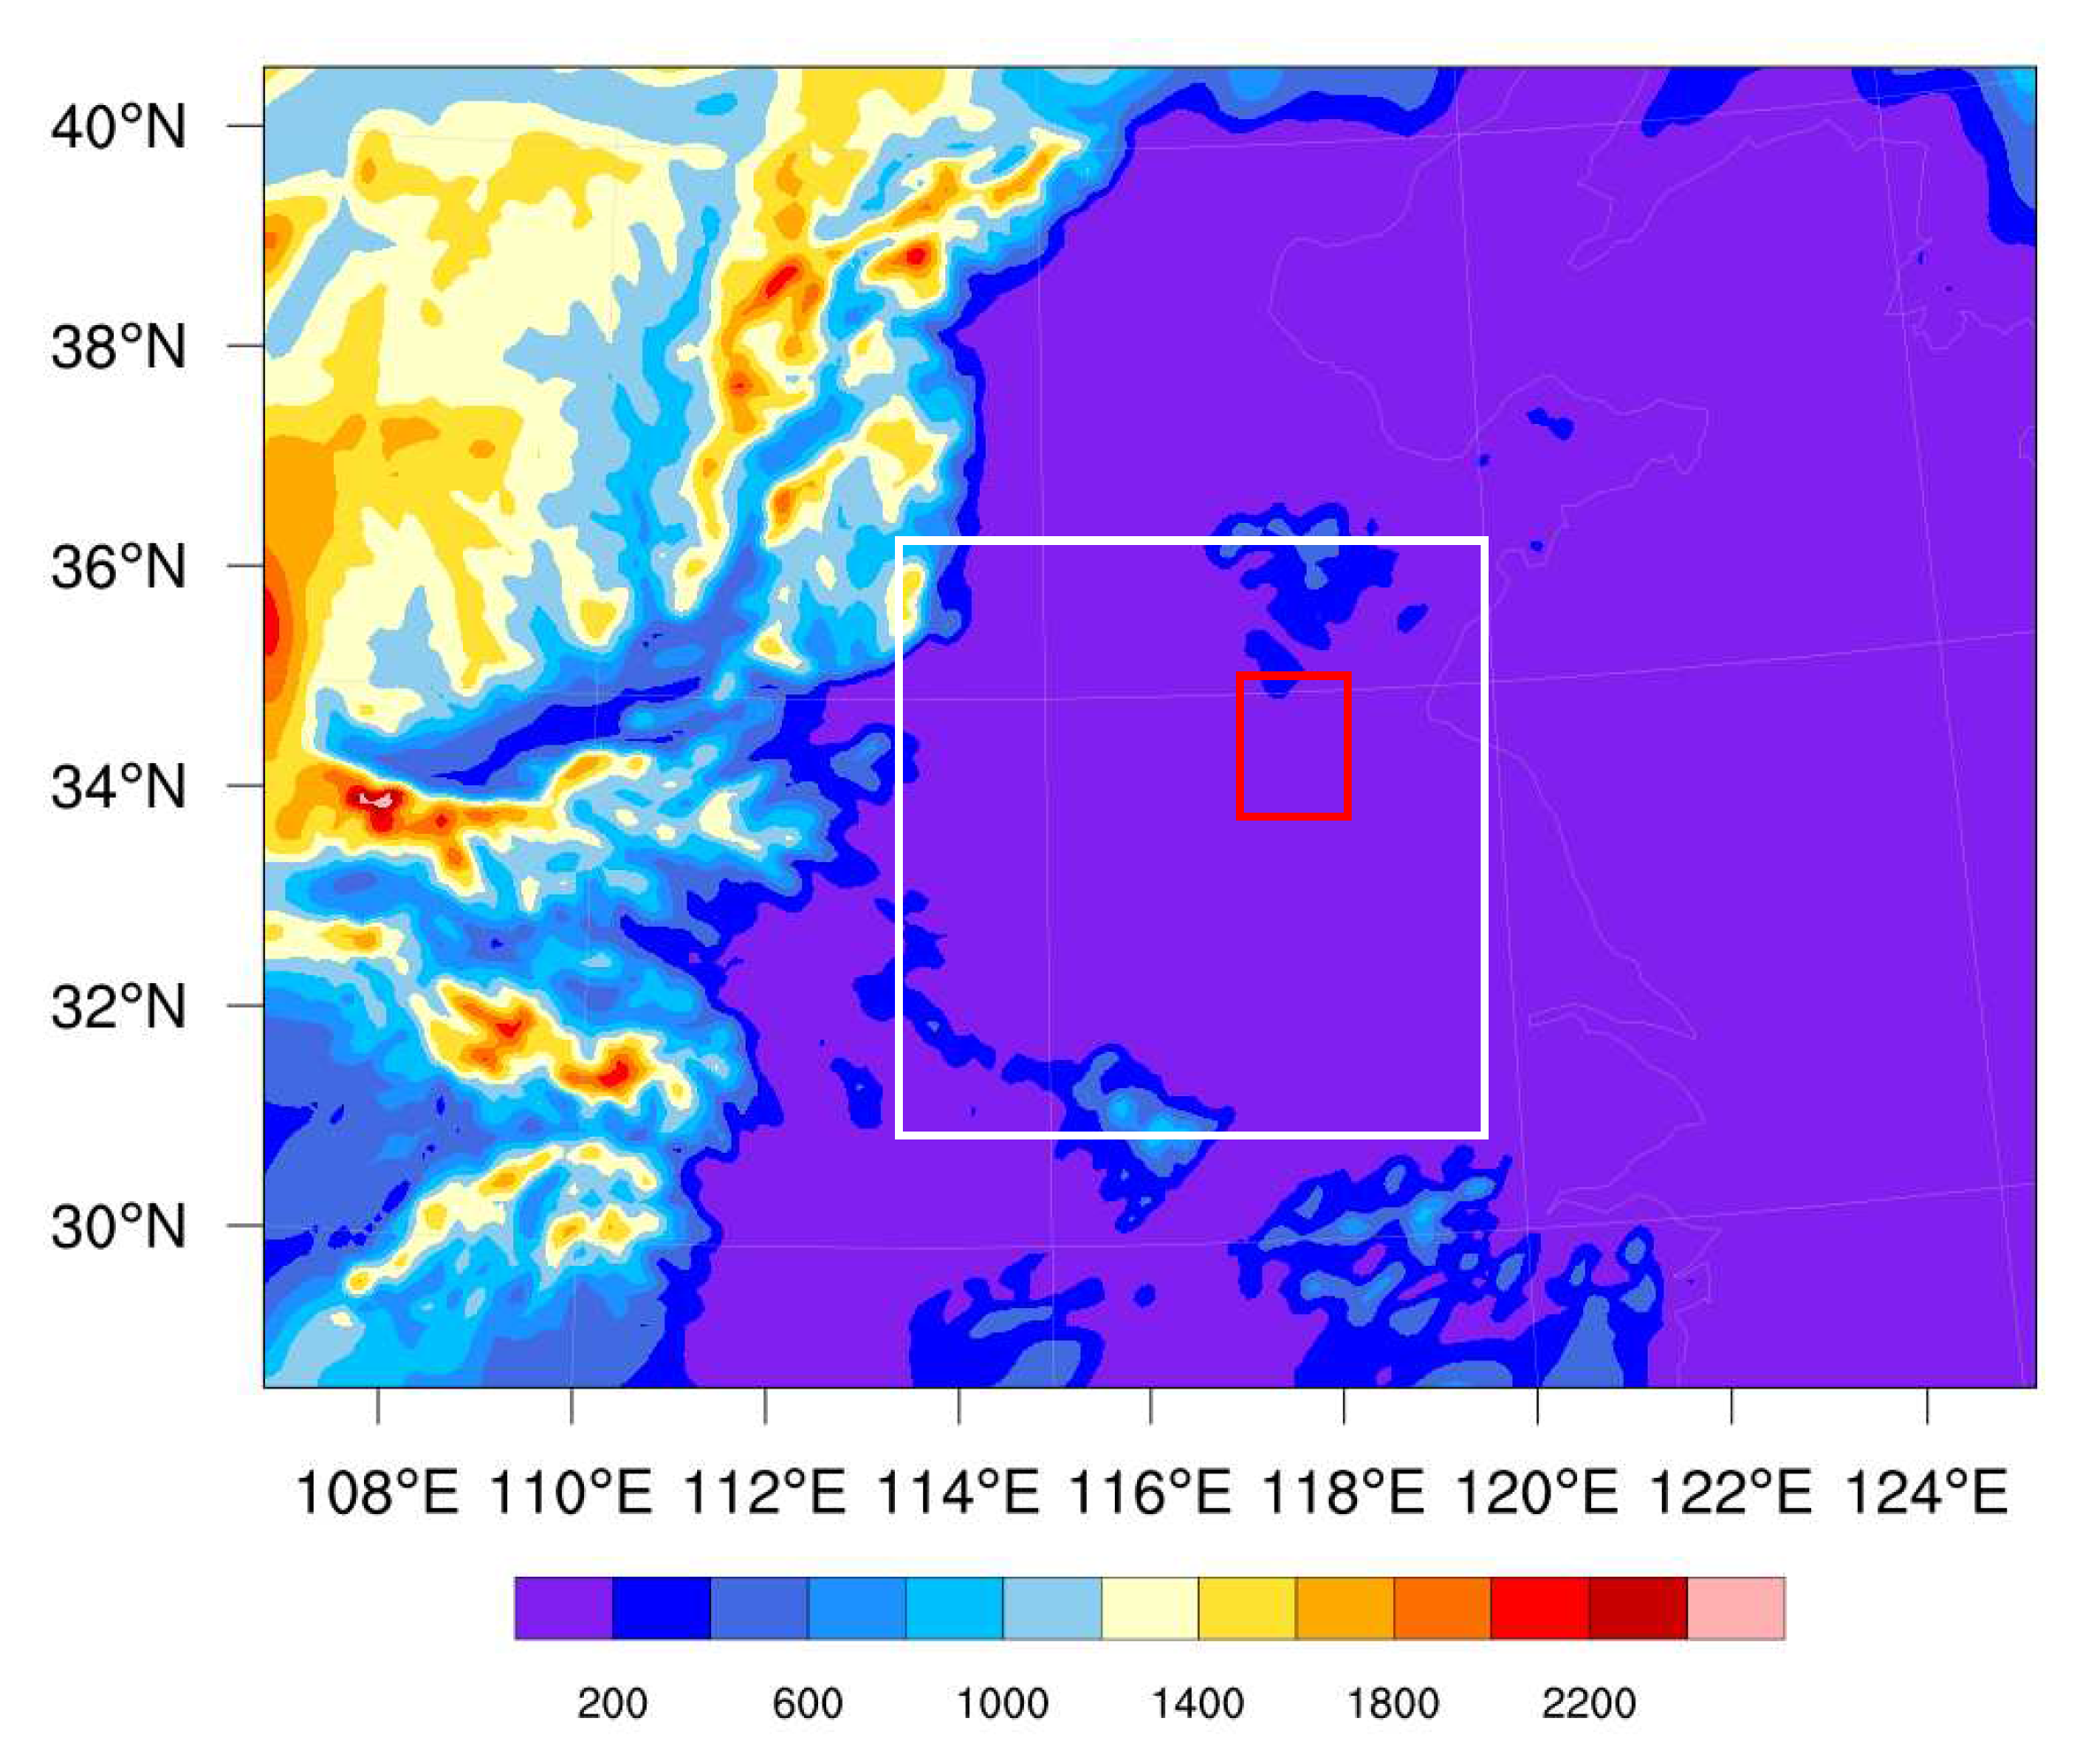
The dynamic lifting mechanism of terrain plays a crucial role in the occurrence and development of precipitation. Conducting terrain-sensitive experiment can effectively grasp the influence and function of terrain factors in the precipitation process. Figure 13 depicts the topography of Henan Province. From the Figure, it can be observed that the overall terrain of Henan Province exhibits a west-high-east-low pattern. To the north, west, and south of the province lie the Taihang Mountains, Funiu Mountains, and Dabie Mountains, respectively, with elevations ranging from 1000 to 2200 meters. In contrast, the area around Kaifeng in the central and eastern parts of Henan is primarily characterized by flat plains, with elevations mostly below 200 meters. The Taihang Mountains mark the eastern boundary of the Loess Plateau and serve as a transition zone between the northern mountains and the plains in Henan.

4.4.1. Experiment Scheme

To investigate the impact of terrain on heavy rainfall, five sets of sensitivity experiments were designed (Table 2). The model employed a nested grid scheme, and the parameterization schemes used were consistent with the control experiment which was named as “CTRL”.
The first set of experiment reducd the elevation of the Taihang Mountains (34.57°N-40.72°N, 110.27°E-114.55°E) by 50% to smooth the west-to-east elevation gradient. This experiment was labeled as “Test1”.
The second set of experiment reducd the elevation of the Taihang Mountains by 75%, this experiment was labeled as “Test2”.
The third set of experiment directly lowered the elevation of the Taihang Mountains by 100%, shifting the transition zone between the plateau and plain to the border area between Shaanxi and Shanxi provinces. This experiment was denoted as “Test3”.
The fourth set of experiment raised the elevation of the Taihang Mountains by 50% relative to the baseline, referred to as “Test4”.
The fifth set of experiment increasd the elevation of the Taihang Mountains by 75%, labeled as “Test5”.
Lastly, the sixth set of experiment focused on elevating the Taihang Mountains by 100%, designated as “Test6”.

4.4.2. Terrain and Precipitation Analysis

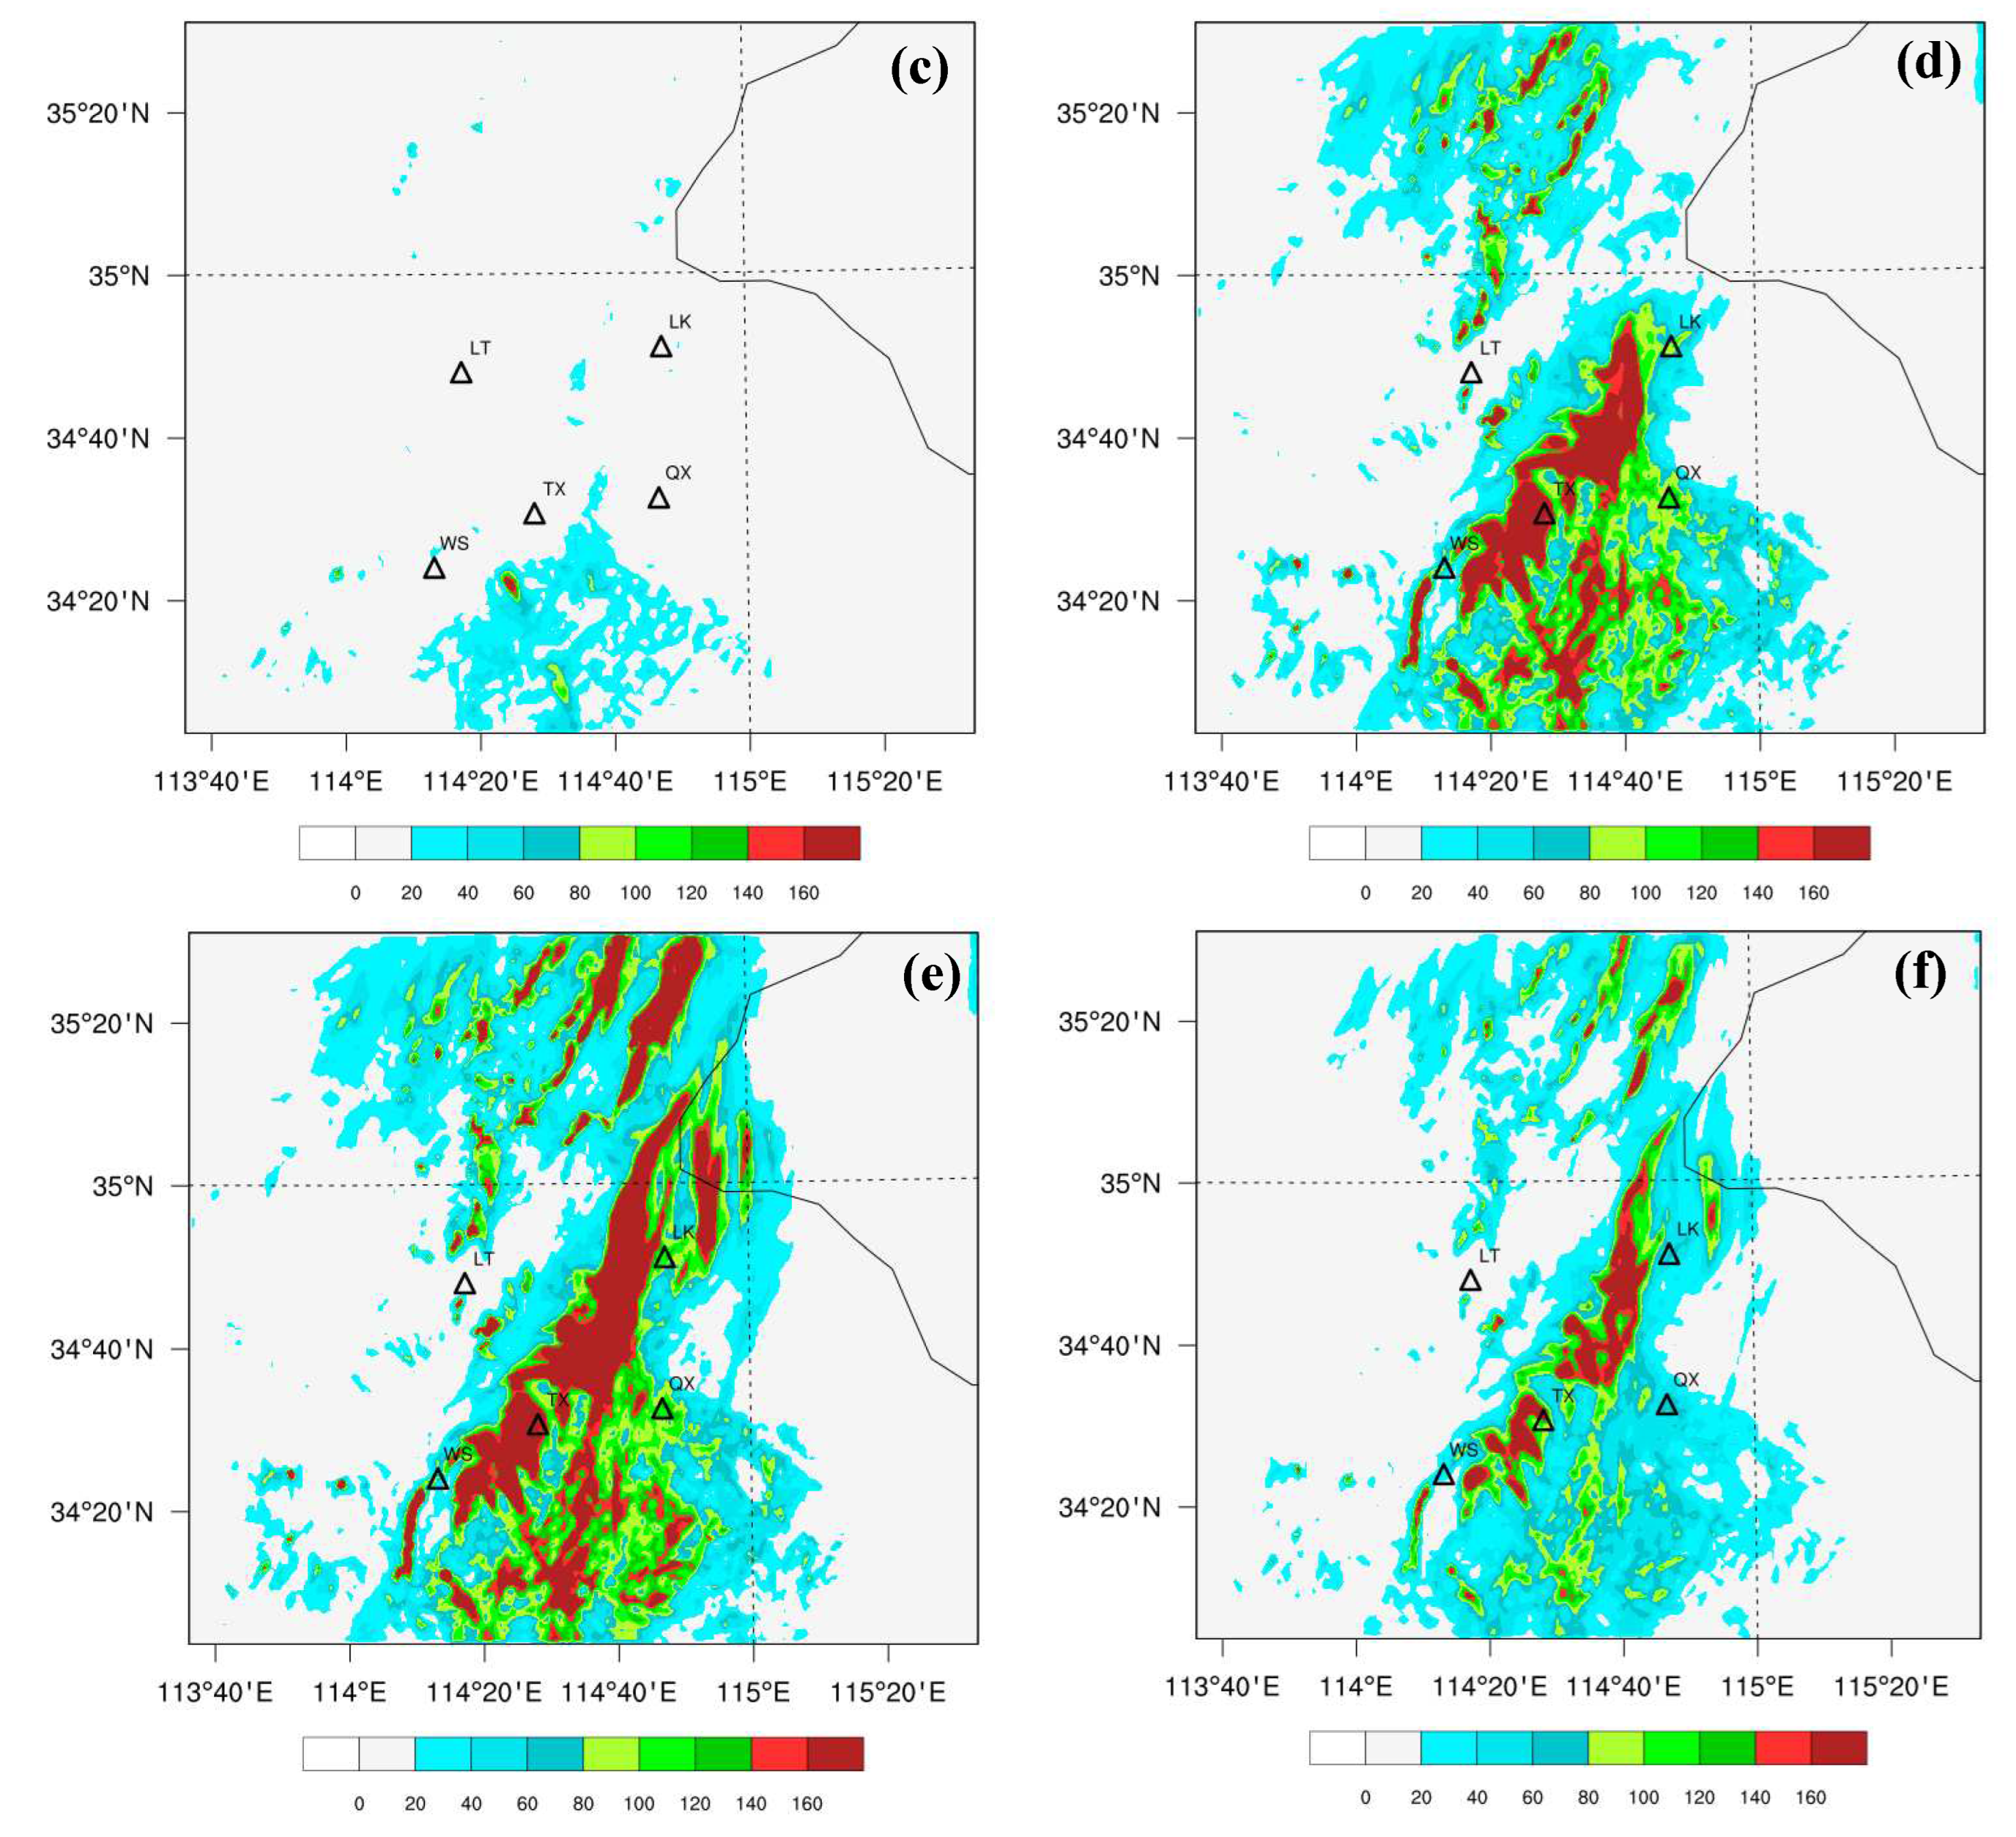
The distribution of 24-hour accumulated precipitation from the five sets of sensitivity experiments and the control experiment reveal significant impacts of altering the terrain in the Taihang Mountains area on precipitation in Kaifeng (Figure 14). When the elevation of the Taihang Mountains is reduced by 50%, compared to the control experiment (Figure 2), the range of heavy rainfall in Kaifeng decreases, and the original precipitation center in the northern part of Kaifeng disappears(Figure 14a). Overall, the intensity of precipitation weakens, with only one out of the five national automatic stations measuring precipitation exceeding 140mm. The central precipitation region concentrates in the southern part of Kaifeng. When the elevation of the Taihang Mountains is lowered by 75%, we can see a further weakening in the extent and intensity of rain areas, particularly in some precipitation centres(Figure 14b). When the elevation of the Taihang Mountains is lowered by 100%, the precipitation center in the southern part of Kaifeng essentially disappears, resulting in a decrease of precipitation by 80-100mm, corresponding to an overall reduction of 50%-60%(Figure 14c). In Kaifeng, only scattered convective precipitation occurs, with no occurrence of heavy rainfall almost. When the elevation of the Taihang Mountains is increased by 50%, the rain belt in this scenario generally maintains a similar direction without significant displacement. However, the overall precipitation center, range, and intensity increase(Figure 14d). Particularly, a new intense precipitation belt forms in the middle to northern parts of Kaifeng, with an overall increase of 10%-20% compared to the control experiment (Figure 2). When the terrain height increases by 75%, it can be observed that the intense precipitation belt noticeably shifts eastward. The precipitation center in the southern part of Kaifeng moves eastward by approximately 0.5°E, and multiple rain belts appear in the northern part of Kaifeng, distributed in a northeast-southwest direction(Figure 14e). Furthermore, when the terrain height increases by 100%, the simulated precipitation is generally consistent with the precipitation in the control experiment (Figure 2 and 14f). However, the overall precipitation decreases by approximately 50% compared to the Test5 experiment. The above analysis indicate that the presence of the Taihang Mountains terrain leads to changes in precipitation in Kaifeng. Compared to the control experiment, reducing the terrain height results in an overall decrease in precipitation intensity by 50%-60% and a significant reduction in the precipitation range. Increasing the terrain height by more than 50% leads to an increase in the precipitation center, range, and intensity, with an overall increase of 10%-20% in precipitation. When the terrain height increases by more than 75%, the rain belt shifts eastward by approximately 0.5°E, and the precipitation center moves noticeably eastward. However, increasing the terrain height by more than 100% does not result in a sustained increase in precipitation, instead, it remains relatively consistent with the control experiment (Figure 2). This may be due to the fact that if the mountain is too high, the water vapor reaches supersaturation as the temperature drops during the updraft, forming topographic rain, during which precipitation increases with altitude. At the same time, the water vapor content in the air begins to decrease, and during the process of continuing to rise, the amount of precipitation begins to decrease, and to a certain altitude, the water vapor content becomes unsaturated again, and there is no precipitation.

4.4.3. Terrain and Jet Stream Analysis

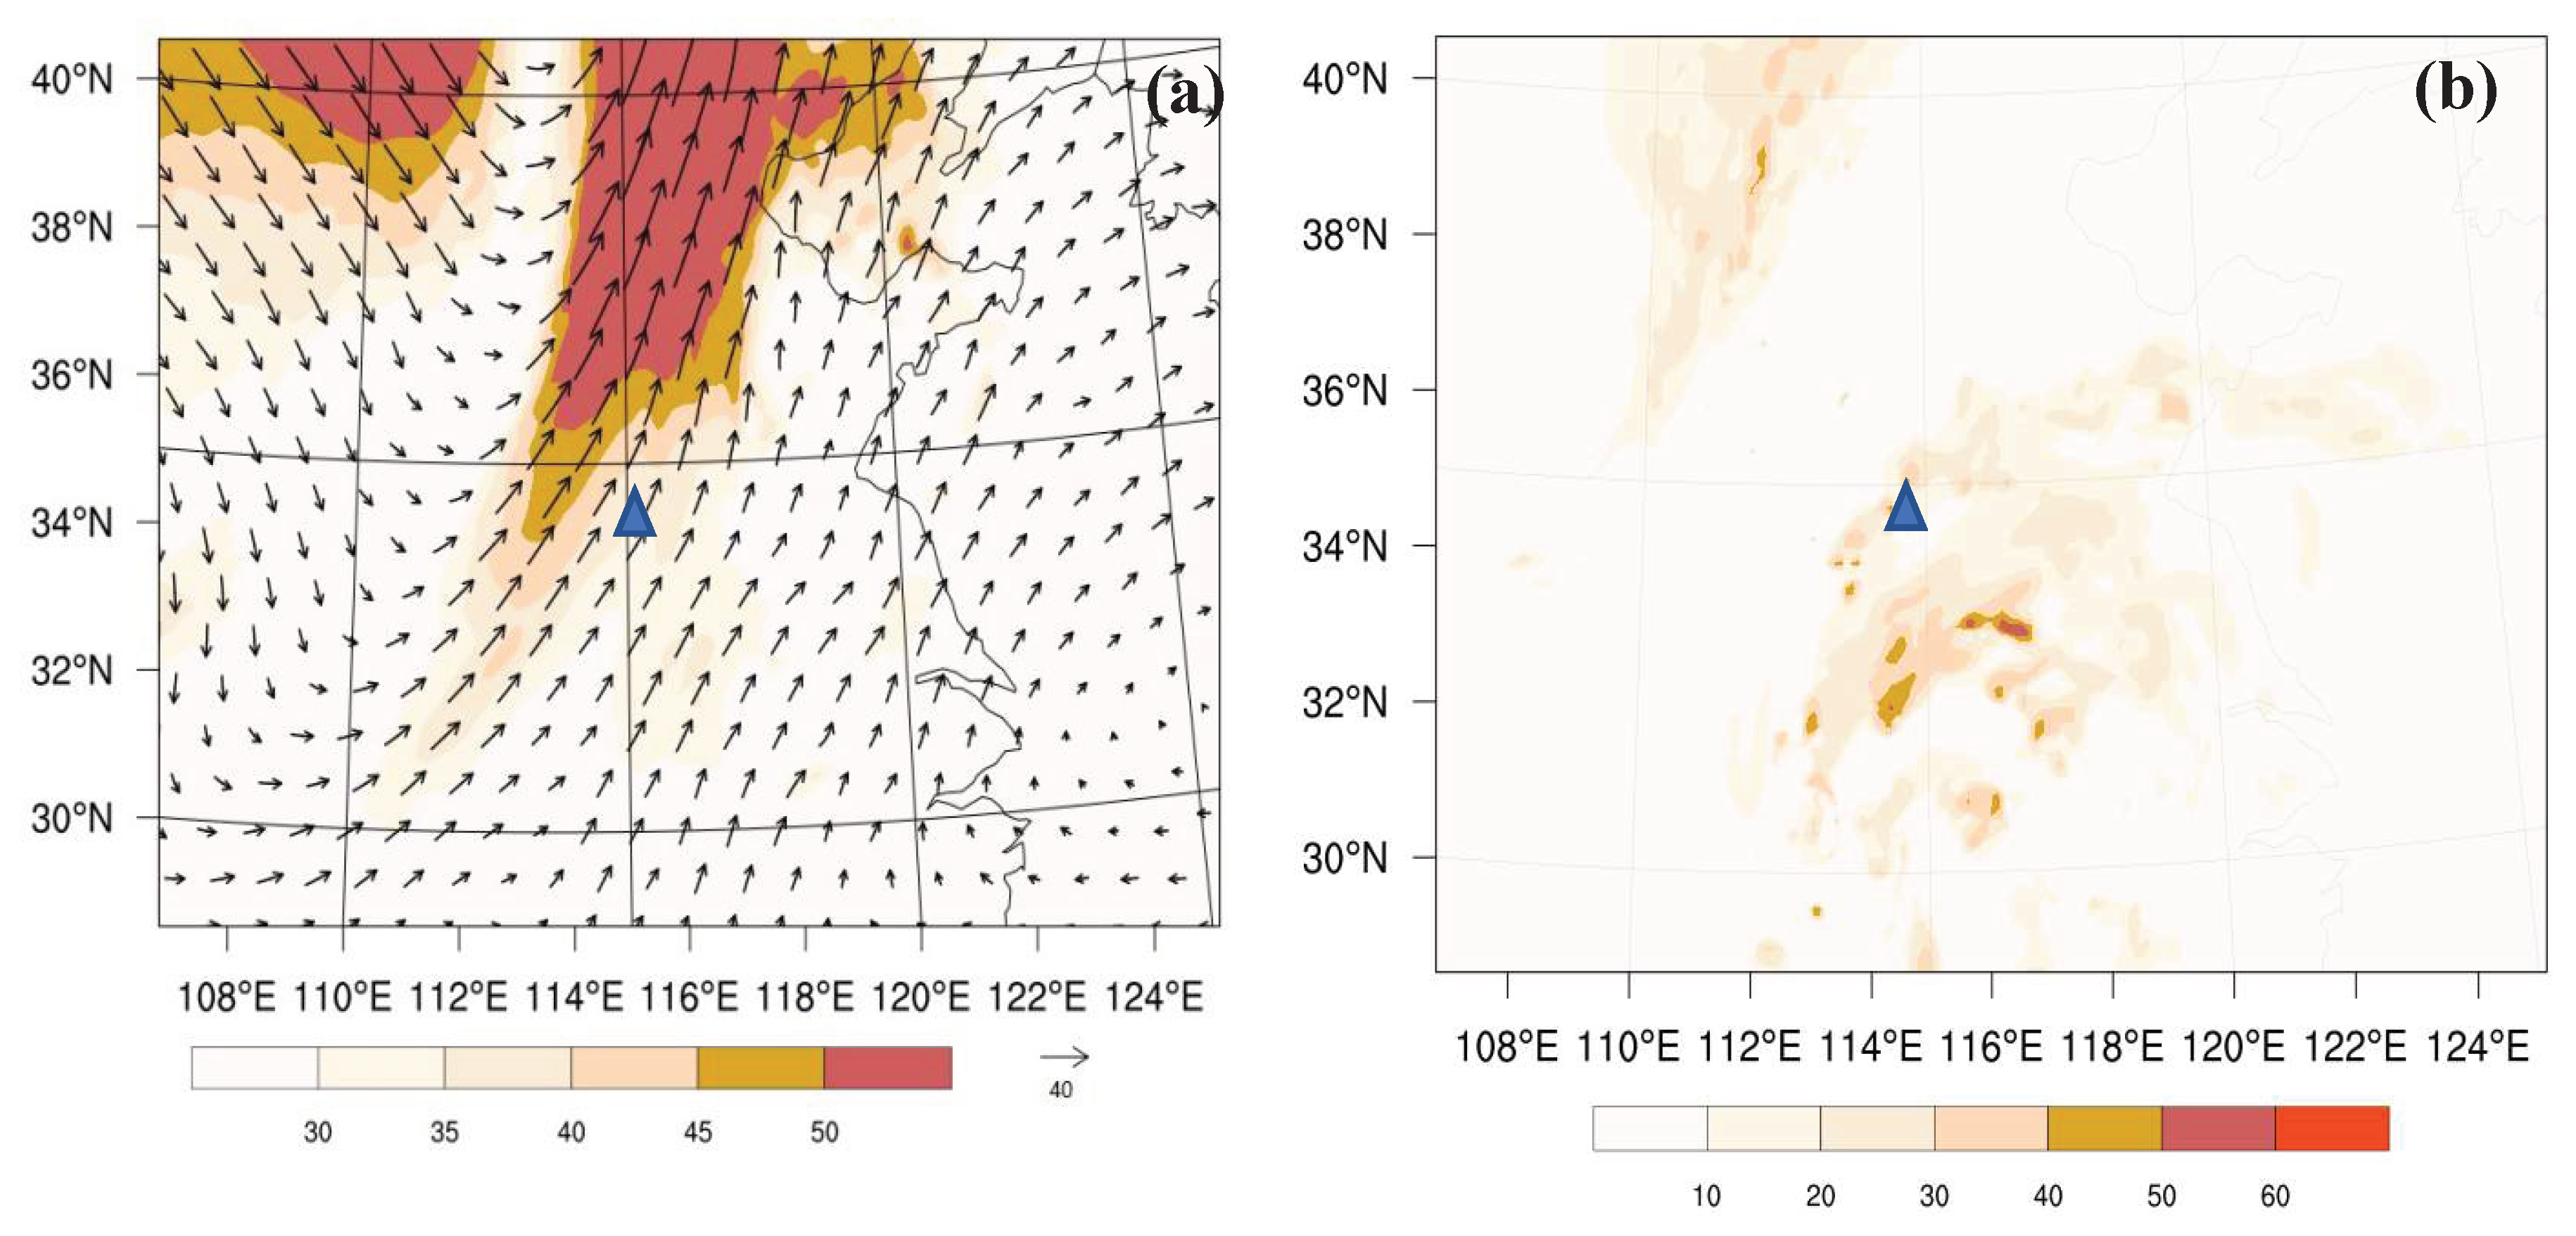
During the occurrence and development of heavy rainfall, the combined effect of low-level jet streams and terrain play an important role [70,71]. The overlay plot of the low-level jet stream and wind field at 850 hPa geopotential height at 14:00 on July 3rd (Figure 15a) indicate that during the period of heavy rainfall, there is a strong and developing low-level jet stream at 850 hPa, the core intensity of the jet stream reaches 50 m/s, with Kaifeng located in the southeast part of the jet stream core, the convergence of wind speeds, coupled with the influence of terrain, lead to intense upward motion in Kaifeng. The distribution of composite radar reflectivity at 14:00 on July 3rd reveals the presence of a strong echo band corresponding to the region (Figure 15b), the overall distribution of the echo band shows a northeast-southwest orientation, with individual areas within the band exhibiting reflectivity intensities above 40 dBZ. This aligns well with the location and intensity of the analyzed heavy rainfall area mentioned earlier. These findings indicate that the presence of the low-level jet stream, combined with the influential role of terrain, actively contributed to the occurrence and development of the heavy rainfall event in Kaifeng.

5. Conclusions

This research intends to scrutinize the influence of unifying AGRI radiance and terrestrial MWR data assimilation on short-term heavy rainfall forecasting. To realize this, a quartet of data assimilation experiments are orchestrated, concentrating on the initial conditions and anticipated variables pertinent to a characteristic, short-lived heavy rainfall occurrence in Kaifeng. Specific analysis encompasses an examination of the structural characteristics and influencing mechanisms of this heavy rainfall event from various perspectives, including water vapor, dynamics, topography, and other factors. The main conclusions are as follows:
(1) At 850 hPa in the MWR assimilation experiment, there is a distribution of humidity increments across the Kaifeng area. In a similar vein, the AGRI assimilation study conducted at 500 hPa primarily identify humidity increments in areas with intense rainfalls. These increments stretch towards Kaifeng’s central south. The assimilation of AGRI radiance majorly influences the moisture content in the layers that are situated towards the middle and upper end. Nonetheless, when AGRI radiance and the MWR data gather from ground sources are assimilated together, improvements are observed throughout the entire column of water vapor. This leads to an enhancement of the initial conditions related to humidity.
(2) Each of the three assimilation experiments displays a marked improvement in the forecast of accumulated rainfall over a period of 24-hours. Temperature and humidity profiles, which are derived from seven dispersed MWRs throughout Kaifeng, serve to rectify the projected heavy rainfall within the region. The incorporation of AGRI radiance aids in refining rainfall predictions in the three zones where heavy rainfall has been observed. Importantly, the combined data assimilation experiment brings about a substantial enhancement in predicting rainfall for the vicinity of Kaifeng, specifically in instances of exceptionally high volumes of rain. As a result, when these two datasets are collectively assimilated, the forecasting of short periods characterized by intense rainfall is visibly improved.
(3) Due to the upward motion associated with the pre-trough ascent of the upper-level trough, a substantial amount of warm and moist air ascends to the convective layer, especially between 850 hPa and 300 hPa, where relative humidity exceeds 90%. Multiple convergence centers are observed near Kaifeng, with a strength of -10.0×10⁻⁶·g·cm-2·hPa-1·s-1. The deep moisture layer, coupled with strong convergence and upward motion, provides favorable conditions for the formation and development of heavy rainfall.
(4) During the occurrence and development of heavy rainfall, the lower and middle troposphere in the Kaifeng area exhibits unstable atmospheric stratification, with strong vertical motion, particularly between 850 hPa and 400 hPa, where the vertical velocity reaches its maximum value of 16 Pa·s-1 around 450 hPa. The conFigureuration of upper-level divergence and lower-level convergence enhances the vertical ascent in the Kaifeng area. The accumulation and release of convective available potential energy correspond to the occurrence and development of heavy rainfall, showing a good consistency between the two. Additionally, there is a strong and developing low-level jet stream at 850 hPa, which, in conjunction with the terrain, actively contributes to the maintenance of heavy rainfall.
(5) The presence of the Taihang Mountains terrain leads to changes in precipitation in Kaifeng. Lowering the terrain height results in an overall decrease in precipitation intensity by 50%-60% and a significant reduction in the precipitation range. Increasing the terrain height by more than 50% leads to an increase in the precipitation center, range, and intensity, with an overall increase of 10%-20% in precipitation. When the terrain height increases by more than 75%, the rain belt shifts eastward by approximately 0.5°E, and the precipitation center moves noticeably eastward. However, increasing the terrain height by more than 100% does not result in a sustained increase in precipitation, instead, it remains relatively consistent with the control experiment.

Author Contributions

Y.L. and Z.G. were responsible for conceptualization, supervision and funding acquisition. J.Z. developed the software and prepared the original draft. J.Z. and Y.J. developed the methodology and carried out formal analysis. Y.L. and Y.J. validated data. Z.G., Y.L., J.Z. and Y.J. were reviewed and edited the text. J.Z. was responsible for visualization. All authors have read and agreed to the published version of the paper.

Funding

This research has been supported by the second batch of service public bidding projects for EHV transmission companies in 2022 (2022-FW-2-ZB) (grant no. CG0100022001526556).

Data Availability Statement

The NCEP FNL (Final) operational global analysis and forecast data are on 0.25-degree by 0.25-degree grids available at https://rda.ucar.edu/datasets/ds083.3/(accessed on 6 July 2023). The FY-4A AGRI radiance data and observation data were obtained from ground automatic weather stations operated by the Henan Provincial Meteorological Bureau. The ground-based MWR data can be available from Meteorological Observation Center of China Meteorological Administration.The Data Assimilation (WRFDA) v4.3 was used to assimilate AGRI infrared radiance and ground-based MWR data, which is available on a server at Nanjing University of Information Science and Technology.

Conflicts of Interest

The authors declare that they have no conflict of interest.

References

  1. Lehner, B.; Döll, P.; Alcamo, J.; Thomas, H.; Frank, K. Estimating the impact of global change on flood and drought risks in Europe: a continental, integrated analysis. Climatic Change 2006, 75, 273–299. [Google Scholar] [CrossRef]
  2. Zhai, P.M.; Wang, C.C.; Li, W. A Review on Study of Change in Precipitation Extremes. Climate Change Research 2007, 3, 144. [Google Scholar]
  3. Tao, S.Y. Heavy Rain in China; Science Press, 1980. [Google Scholar]
  4. Suppiah, R.; Hennessy, K.J. Trends in total rainfall, heavy rain events and number of dry days in Australia, 1910–1990. Int. J.Climatol. 1998, 18, 1141–1164. [Google Scholar] [CrossRef]
  5. Ding, Y.H.; Zhang, J.Y. Meteorological Disaster Series-Heavy Rain and Flood. Beijing: China Meteorological Press. 2009.
  6. Villarini, G.; Smith, J.A.; Baeck, M.L.; Vitolo, R.; Stephenson, D.B.; Krajewski, W.F. On the frequency of heavy rainfall for the Midwest of the United States. Journal of Hydrology 2011, 400, 103–120. [Google Scholar] [CrossRef]
  7. Villarini, G.; Smith, J.A.; Vecchi, G.A. Changing frequency of heavy rainfall over the central United States. Journal of Climate 2013, 26, 351–357. [Google Scholar] [CrossRef]
  8. Lin, J.; Yang, G.M. Spatio-Temporal Characteristics of Rainstorm in China During 1981-2010. Meteorology 2014, 40, 816–826. [Google Scholar] [CrossRef]
  9. Ding, Y.H. The major advances and development process of the theory of heavy rainfalls in China. Torrential Rain and Disasters 2019, 38, 395–406. [Google Scholar]
  10. Gao, Z.; Zhang, J.; Yu, M.; Liu, Z.; Yin, R.; Zhou, S.; Zong, L.; Ning, G.; Xu, X.; Guo, Y.; et al. Role of water vapor modulation from multiple pathways in the occurrence of a record-breaking heavy rainfall event in China in 2021. Earth and Space Science 2022, 9, e2022EA002357. [Google Scholar] [CrossRef]
  11. Gao, S.T.; Zhao, S.X.; Zhou, X.P.; Sun, S.Q.; Tao, S.Y. Progress of Research on sub-synoptic scale and mesoscale Torrential Rain systems. Chinese Journal of Atmospheric Sciences 2003, 27, 618–627. [Google Scholar]
  12. Bao, M. Statistical analysis of continuous rainstorm in China in the past 50 years and its large-scale circulation background. Chinese Journal of Atmospheric Sciences 2007, 31, 779–792. [Google Scholar]
  13. Luo, Y.; Sun, J.; Li, Y.; Xia, R.; Du, Y.; Yang, S.; Zhang, Y.C.; Chen, J.; Dai, K.; Shen, X.S.; et al. Science and prediction of heavy rainfall over China: Research progress since the reform and opening-up of the People’s Republic of China. Acta Meteorologica Sinica 2020, 78, 419–450. [Google Scholar]
  14. Li, Z.C.; Bi, B.G.; Jin, R.H.; Xu, Z.F.; Xue, F. The development and application of the modern weather forecast in China for the recent ten years. Acta Meteorologica Sinica 2014, 72, 1069–1078. (In Chinese) [Google Scholar]
  15. Qin, D.H.; Sun, H.L.; Sun, S.; Liu, Y.J. The strategy of Chinese meteorological Service and development: 2005-2020. Advances in Earth Science 2005, 20, 268–274. [Google Scholar]
  16. Shen, F.; Shu, A.; Li, H.; Xu, D.; Min, J. Assimilation of Himawari-8 imager radiance data with the WRF-3DVAR system for the prediction of Typhoon Soudelor. Natural Hazards Earth Syst. Sci. 2021, 21, 1569–1582. [Google Scholar] [CrossRef]
  17. Xu, D.; Shu, A.; Li, H.; Shen, F.; Min, J.; Su, H. Effects of assimilating clearsky FY-3D MWHS2 radiance on the numerical simulation of tropical storm ampil. Remote Sens. 2021, 13, 2873. [Google Scholar] [CrossRef]
  18. Shen, F.; Min, J. Assimilating AMSU-A radiance data with the WRF hybrid En3DVAR system for track predictions of typhoon megi (2010). Advances in Atmospheric Sciences 2015, 32, 1231–1243. [Google Scholar] [CrossRef]
  19. Xu, D.; Min, J.; Shen, F.; Ban, J.; Chen, P. Assimilation of MWHS radiance data from the FY-3B satellite with the WRF Hybrid-3DVAR system for the forecasting of binary typhoons. Journal of Advances in Modeling Earth Systems 2016, 8, 1014–1028. [Google Scholar] [CrossRef]
  20. Kutty, G.; Muraleedharan, R.; Kesarkar, A.P. Impact of representing model error in a hybrid ensemble-variational data assimilation system for track forecast of tropical cyclones over the Bay of Bengal. Pure and Applied Geophysics 2018, 175, 1155–1167. [Google Scholar] [CrossRef]
  21. De Souza, P.M.M.; Vendrasco, E.P.; Saraiva, I.; Trindade, M.; de Oliveira, M.B.L.; Saraiva, J.; Trindade, M.; Betânia, M.; Oliveira, L.; Saraiva, J.; et al. Impact of radar data assimilation on the simulation of a heavy rainfall event over manaus in the Central Amazon. Pure Appl. Geophys. 2022, 179, 425–440. [Google Scholar] [CrossRef]
  22. Ye, H.; Pan, X.; You, W.; Zhu, X.; Zang, Z.; Wang, D.; Zhang, X.; Hu, Y.; Jin, S. Impact of CALIPSO profile data assimilation on 3-D aerosol improvement in a size-resolved aerosol model. Atmospheric Research 2021, 264, 105877. [Google Scholar] [CrossRef]
  23. Ma, S.; Zhang, W.; Cao, X.Q.; Zhao, Y.; Liu, B. Assimilation of all-sky radiance from the FY-3 MWHS-2 with the Yinhe 4D-Var system. J. Meteor. Res. 2022, 36, 750–766. [Google Scholar] [CrossRef]
  24. Wang, D.C.; You, W.; Zang, Z.L.; Pan, X.B.; Hu, Y.W.; Liang, Y.F. A threedimensional variational data assimilation system for aerosol optical properties based on WRF-chem v4.0: Design, development, and application of assimilating himawari-8 aerosol observations. Geosci. Model. Dev. 2022, 15, 1821–1840. [Google Scholar] [CrossRef]
  25. Yang, C.; Min, J.Z.; Liu, Z.Q. The impact of AMSR2 radiance data assimilation on the analysis and forecast of typhoon son-tinh. Chinese Journal of Atmospheric Sciences 2017, 41, 372–384. (In Chinese) [Google Scholar]
  26. Wang, Y.; Liu, Z.; Yang, S.; Min, J.; Chen, L.; Chen, Y.; Zhang, T. Added value of assimilating Himawari-8 AHI water vapor radiances on analyses and forecasts for “7.19” severe storm over north China. Journal of Geophysical Research Atmospheres 2018, 123, 3374–3394. [Google Scholar] [CrossRef]
  27. Xu, D.; Shu, A.; Li, H.; Shen, F.; Min, J.; Su, H. Effects of assimilating clearsky FY-3D MWHS2 radiance on the numerical simulation of tropical storm ampil. Remote Sens. 2021, 13, 2873. [Google Scholar] [CrossRef]
  28. Dong, Y.H. FY-4 meteorological satellite and its application prospect. Aerosp. Shanghai 2016, 33, 1–8. [Google Scholar]
  29. Yang, J.; Zhang, Z.; Wei, C.; Lu, F.; Guo, Q. Introducing the new generation of Chinese geostationary weather satellites, Fengyun-4. Bulletin of the American Meteorological Society 2017, 98, 1637–1658. [Google Scholar] [CrossRef]
  30. Zhang, X.; Xu, D.; Liu, R.; Shen, F. Impacts of FY-4A AGRI radiance data assimilation on the forecast of the super typhoon “in-fa” (2021). Remote Sens. 2022, 14, 4718. [Google Scholar] [CrossRef]
  31. Shen, F.; Xu, D.; Li, H.; Min, J.; Liu, R. Assimilation of GPM microwave imager radiance data with the WRF hybrid 3DEnVar system for the prediction of typhoon chan-hom (2015). Atmospheric Research 2021, 251, 105422. [Google Scholar] [CrossRef]
  32. Okamoto, K.; Sawada, Y.; Kunii, M. Comparison of assimilating all-sky and clear-sky infrared radiances from Himawari-8 in a mesoscale system. Quarterly Journal of the Royal Meteorological Society 2019, 145, 745–766. [Google Scholar] [CrossRef]
  33. Honda, T.; Kotsuki, S.; Lien, G.Y.; Maejima, Y.; Okamoto, K.; Miyoshi, T. Assimilation of himawari-8 all-sky radiances every 10 minutes: Impact on precipitation and flood risk prediction. Journal of Geophysical Research Atmospheres 2018, 123, 965–976. [Google Scholar] [CrossRef]
  34. Honda, T.; Miyoshi, T.; Lien, G.; Nishizawa, S.; Yoshida, R.; Adachi, S.A.; Terasaki, K.; Okamoto, K.; Tomita, H.; Bessho, K. Assimilating all-sky himawari-8 satellite infrared radiances: A case of typhoon soudelor(2015). Monthly Weather Review 2018, 146, 213–229. [Google Scholar] [CrossRef]
  35. Minamide, M.; Zhang, F. Assimilation of all-sky infrared radiances from himawari-8 and impacts of moisture and hydrometer initialization on convectionpermitting tropical cyclone prediction. Monthly Weather Review 2018, 146, 3241–3258. [Google Scholar] [CrossRef]
  36. Cimini, D.; Westwater, E.R.; Gasiewski, A.J.; Klein, M.; Leuski, V.Y.; Liljegren, J.C. Ground-based millimeter-and submillimeter-wave observations of low vapor and liquid water contents. IEEE Trans. Geoscience Remote Sens. 2007, 45, 2169–2180. [Google Scholar] [CrossRef]
  37. Löhnert, U.; Maier, O. Operational profiling of temperature using ground-based microwave radiometry at Payerne: Prospects and challenges. Atmos. Meas. Tech. 2012, 5, 1121–1134. [Google Scholar] [CrossRef]
  38. Qi, Y.; Fan, S.; Li, B.; Mao, J.; Lin, D. Assimilation of ground-based microwave radiometer on heavy rainfall forecast in beijing. Atmosphere 2021, 13, 74. [Google Scholar] [CrossRef]
  39. Shoji, Y.; Kunii, M.; Saito, K. Mesoscale data assimilation of Myanmar Cyclone Nargis. Part II: Assimilation of GPS-derived precipitable water vapor. J. Meteor. Soc. Japan. 2011, 89, 67–88. [Google Scholar] [CrossRef]
  40. Geng, X.W.; Min, J.Z.; Xu, D.M. Analysis of FY-4A AGRI radiance data bias characteristics and a correction experiment. Chinese Journal of Atmospheric Sciences 2020, 44, 679–694. (In Chinese) [Google Scholar]
  41. Xue, J.S. Scientific issues and perspective of assimilation of meteorolo gical satellite data. Acta Meteorologica Sinica 2009, 67, 903–911. (In Chinese) [Google Scholar]
  42. Wang, Q.Y.; Li, S.X.; Zhang, Y.X. The Diagnosis and Analysis of a Regional Rainstorm Process in Kaifeng. Henan Science 2012, 30, 1142–1145. [Google Scholar]
  43. Ji, C.H.; Lv, Z.Y. Analysis of the Causes of a Local Heavy Rainfall in Kaifeng of Henan Province in 2016. Journal of Anhui Agricultural Sciences 2017, 45, 186–189. [Google Scholar]
  44. Ji, C.H.; Li, S.X. Analysis on Extremity of the “7·19” Severe Rainstorm Process in Kaifeng. Meteorological and Environmental Sciences 2021, 44, 53–62. [Google Scholar]
  45. Saunders, R.; Matricardi, M.; Brunel, P. An improved fast radiative transfer model for assimilation of satellite radiance observations. Quarterly Journal of the Royal Meteorological Society 1999, 125, 1407–1425. [Google Scholar] [CrossRef]
  46. Saunders, R.; Hocking, J.; Turner, E.; Rayer, P.; Rundle, D.; Brunel, P.; Vidot, J.; Roquet, P.; Matricardi, M.; Geer, A.; et al. An update on the RTTOV fast radiative transfer model (currently at version 12). Geosci. Model Dev. 2018, 11, 2717–2737. [Google Scholar] [CrossRef]
  47. Yang, C.; Min, J.Z.; Liu, Z.Q. The impact of AMSR2 radiance data assimilation on the analysis and forecast of typhoon son-tinh. Chinese Journal of Atmospheric Sciences 2017, 41, 372–384. (In Chinese) [Google Scholar]
  48. Zhang, Z.Q.; Lu, F.; Fang, X.; Zhou, Y.Q. Application and development of FY-4 meteorological satellite. Aerospace Shanghai 2017, 34, 8–19. (In Chinese) [Google Scholar]
  49. Ware, R.; Carpenter, R.; Güldner, J.; Liljegren, J.; Nehrkorn, T.; Solheim, F.; Vandenberghe, F. A Multichannel Radiometric Profiler of Temperature, Humidity, and Cloud Liquid. Radio Sci. 2003, 38, 8079. [Google Scholar] [CrossRef]
  50. Caumont, O.; Cimini, D.; Löhnert, U.; Alados-Arboledas, L.; Bleisch, R.; Buffa, F.; Ferrario, M.E.; Haefele, A.; Huet, T.; Madonna, F.; et al. Assimilation of Humidity and Temperature Observations Retrieved from Ground-Based Microwave Radiometers into a Convective-Scale NWP Model. Q. J. R. Meteorol. Soc. 2016, 142, 2692–2704. [Google Scholar] [CrossRef]
  51. He, W.; Chen, H.; Li, J. Influence of Assimilating Ground-Based Microwave Radiometer Data into the WRF Model on Precipitation. Atmos. Ocean. Sci. Lett. 2020, 13, 107–112. [Google Scholar] [CrossRef]
  52. Temimi, M.; Fonseca, R.M.; Nelli, N.R.; Valappil, V.K.; Weston, M.J.; Thota, M.S.; Wehbe, Y.; Yousef, L. On the Analysis of Ground-Based Microwave Radiometer Data during Fog Conditions. Atmos. Res. 2020, 231, 104652. [Google Scholar] [CrossRef]
  53. Qi, Y.; Fan, S.; Li, B.; Mao, J.; Lin, D. Assimilation of ground-based microwave radiometer on heavy rainfall forecast in beijing. Atmosphere 2022, 13, 74. [Google Scholar] [CrossRef]
  54. Qi, Y.; Fan, S.; Mao, J.; Li, B.; Guo, C.; Zhang, S. Impact of Assimilating Ground-Based Microwave Radiometer Data on the Precipitation Bifurcation Forecast: A Case Study in Beijing. Atmosphere 2021, 12, 551. [Google Scholar] [CrossRef]
  55. Guo, C.; Ai, W.; Zhang, X.; Guan, Y.; Liu, Y.; Hu, S.; Zhao, X. Correction of sea surface wind speed based on SAR rainfall grade classification using convolutional neural network. IEEE Journal of Selected Topics in Applied Earth Observations and Remote Sensing 2022, 16, 321–328. [Google Scholar] [CrossRef]
  56. Dee, D.P. Bias and data assimilation. Q. J. R. Meteorological Soc. A J. Atmos. Sci. Appl. meteorology Phys. Oceanogr. 2005, 131, 3323–3343. [Google Scholar] [CrossRef]
  57. Zou, X.; Zeng, Z. A quality control procedure for GPS radio occultation data. Journal of Geop. 2006. [Google Scholar] [CrossRef]
  58. Qin, Z.K.; Zou, X.; Li, G.; Ma, X.L. Quality control of surface station temperature data with non-Gaussian observation-minus-background distributions. Journal of Geophysical Research Atmospheres 2010, 115, D16312. [Google Scholar] [CrossRef]
  59. Min, L.Z.; Sheng, T.L.; Chen, H.S.; Sun, L.P. Numerical experiment on quality control and variational assimilation of satellite image retrieval. Journal of Applied Meteorological Science 2000, 11, 410–418. (In Chinese) [Google Scholar]
  60. Guo, C.; Ai, W.; Hu, S.; Du, X.; Chen, N. Sea surface wind direction retrieval based on convolution neural network and wavelet analysis. IEEE Journal of Selected Topics in Applied Earth Observations and Remote Sensing 2022, 05, 3868–3876. [Google Scholar] [CrossRef]
  61. Min, M. Developing the science product algorithm testbed for Chinese next-generation geostationary meteorological satellites: Fengyun-4 series. Journal of Meteo-rological Research 2017, 31, 708–719. [Google Scholar] [CrossRef]
  62. Wang, X.; Min, M.; Wang, F.; Guo, J.P.; Li, B.; Tang, S. Intercomparisons of cloud mask products among Fengyun-4A, Himawari-8, and MODIS. IEEE Trans. Geosci.Remote Sens. 2019, 57, 8827–8839. [Google Scholar] [CrossRef]
  63. Auligné, T.; McNally, A.P.; Dee, D.P. Adaptive bias correction for satellite data in a numerical weather prediction system. Quarterly Journal of the Royal Meteorological Society 2007, 133, 631–642. [Google Scholar] [CrossRef]
  64. Pan, Y.; Zhang, S.; Li, Q.; Ma, L.; Jiang, S.; Lei, L.; Lyu, W.; Wang, Z. Analysis of convective instability data derived from a ground-based microwave radiometer before triggering operations for artificial lightning. Atmospheric research 2020, 243, 105005. [Google Scholar] [CrossRef]
  65. Posada, R.; García-Ortega, E.; López, L.; Marcos, J.L. A method to improve the accuracy of continuous measuring of vertical profiles of temperature and water vapor density by means of a ground-based microwave radiometer. Atmospheric Research 2013, 122, 43–54. [Google Scholar]
  66. Fu, X.; Tan, J.G. Quality control of temperature and humidity profile retrievals from ground-based microwave radiometer. J. Appl. Meteorological Sci. 2017, 28, 209–217. (In Chinese) [Google Scholar]
  67. Kain, J.S. The Kain-Fritsch convective parameterization: An update. Journal of Applied Meteorology 2004, 43, 170–181. [Google Scholar] [CrossRef]
  68. Tewari, M.; Chen, F.; Dudhia, J.; Ray, P.; Miao, S.; Nikolopoulos, E.; Treinish, L. Understanding the sensitivity of WRF hindcast of Beijing extreme rainfall of 21 July 2012 to microphysics and model initial time. Atmospheric Research 2022, 271, 106085. [Google Scholar] [CrossRef]
  69. Chen, H.Z.; Tang, J.P.A. Mesoscale analysis and diagnose of an extreme bursting torrential rain. Meteorological Science 2009, 29, 797–803. [Google Scholar]
  70. Yang, L.M. Research on a Case of Heavy Rain in Xinjiang from South Asia High Abnormity. Meteorology 2003, 29, 21–25. [Google Scholar]
  71. Huang, W.; Feng, S.; Chen, J. Physical Mechanisms of Summer Precipitation Variations in the Tarim Basin in Northwestern China. Journal of Climate 2015, 28, 3579–3591. [Google Scholar] [CrossRef]
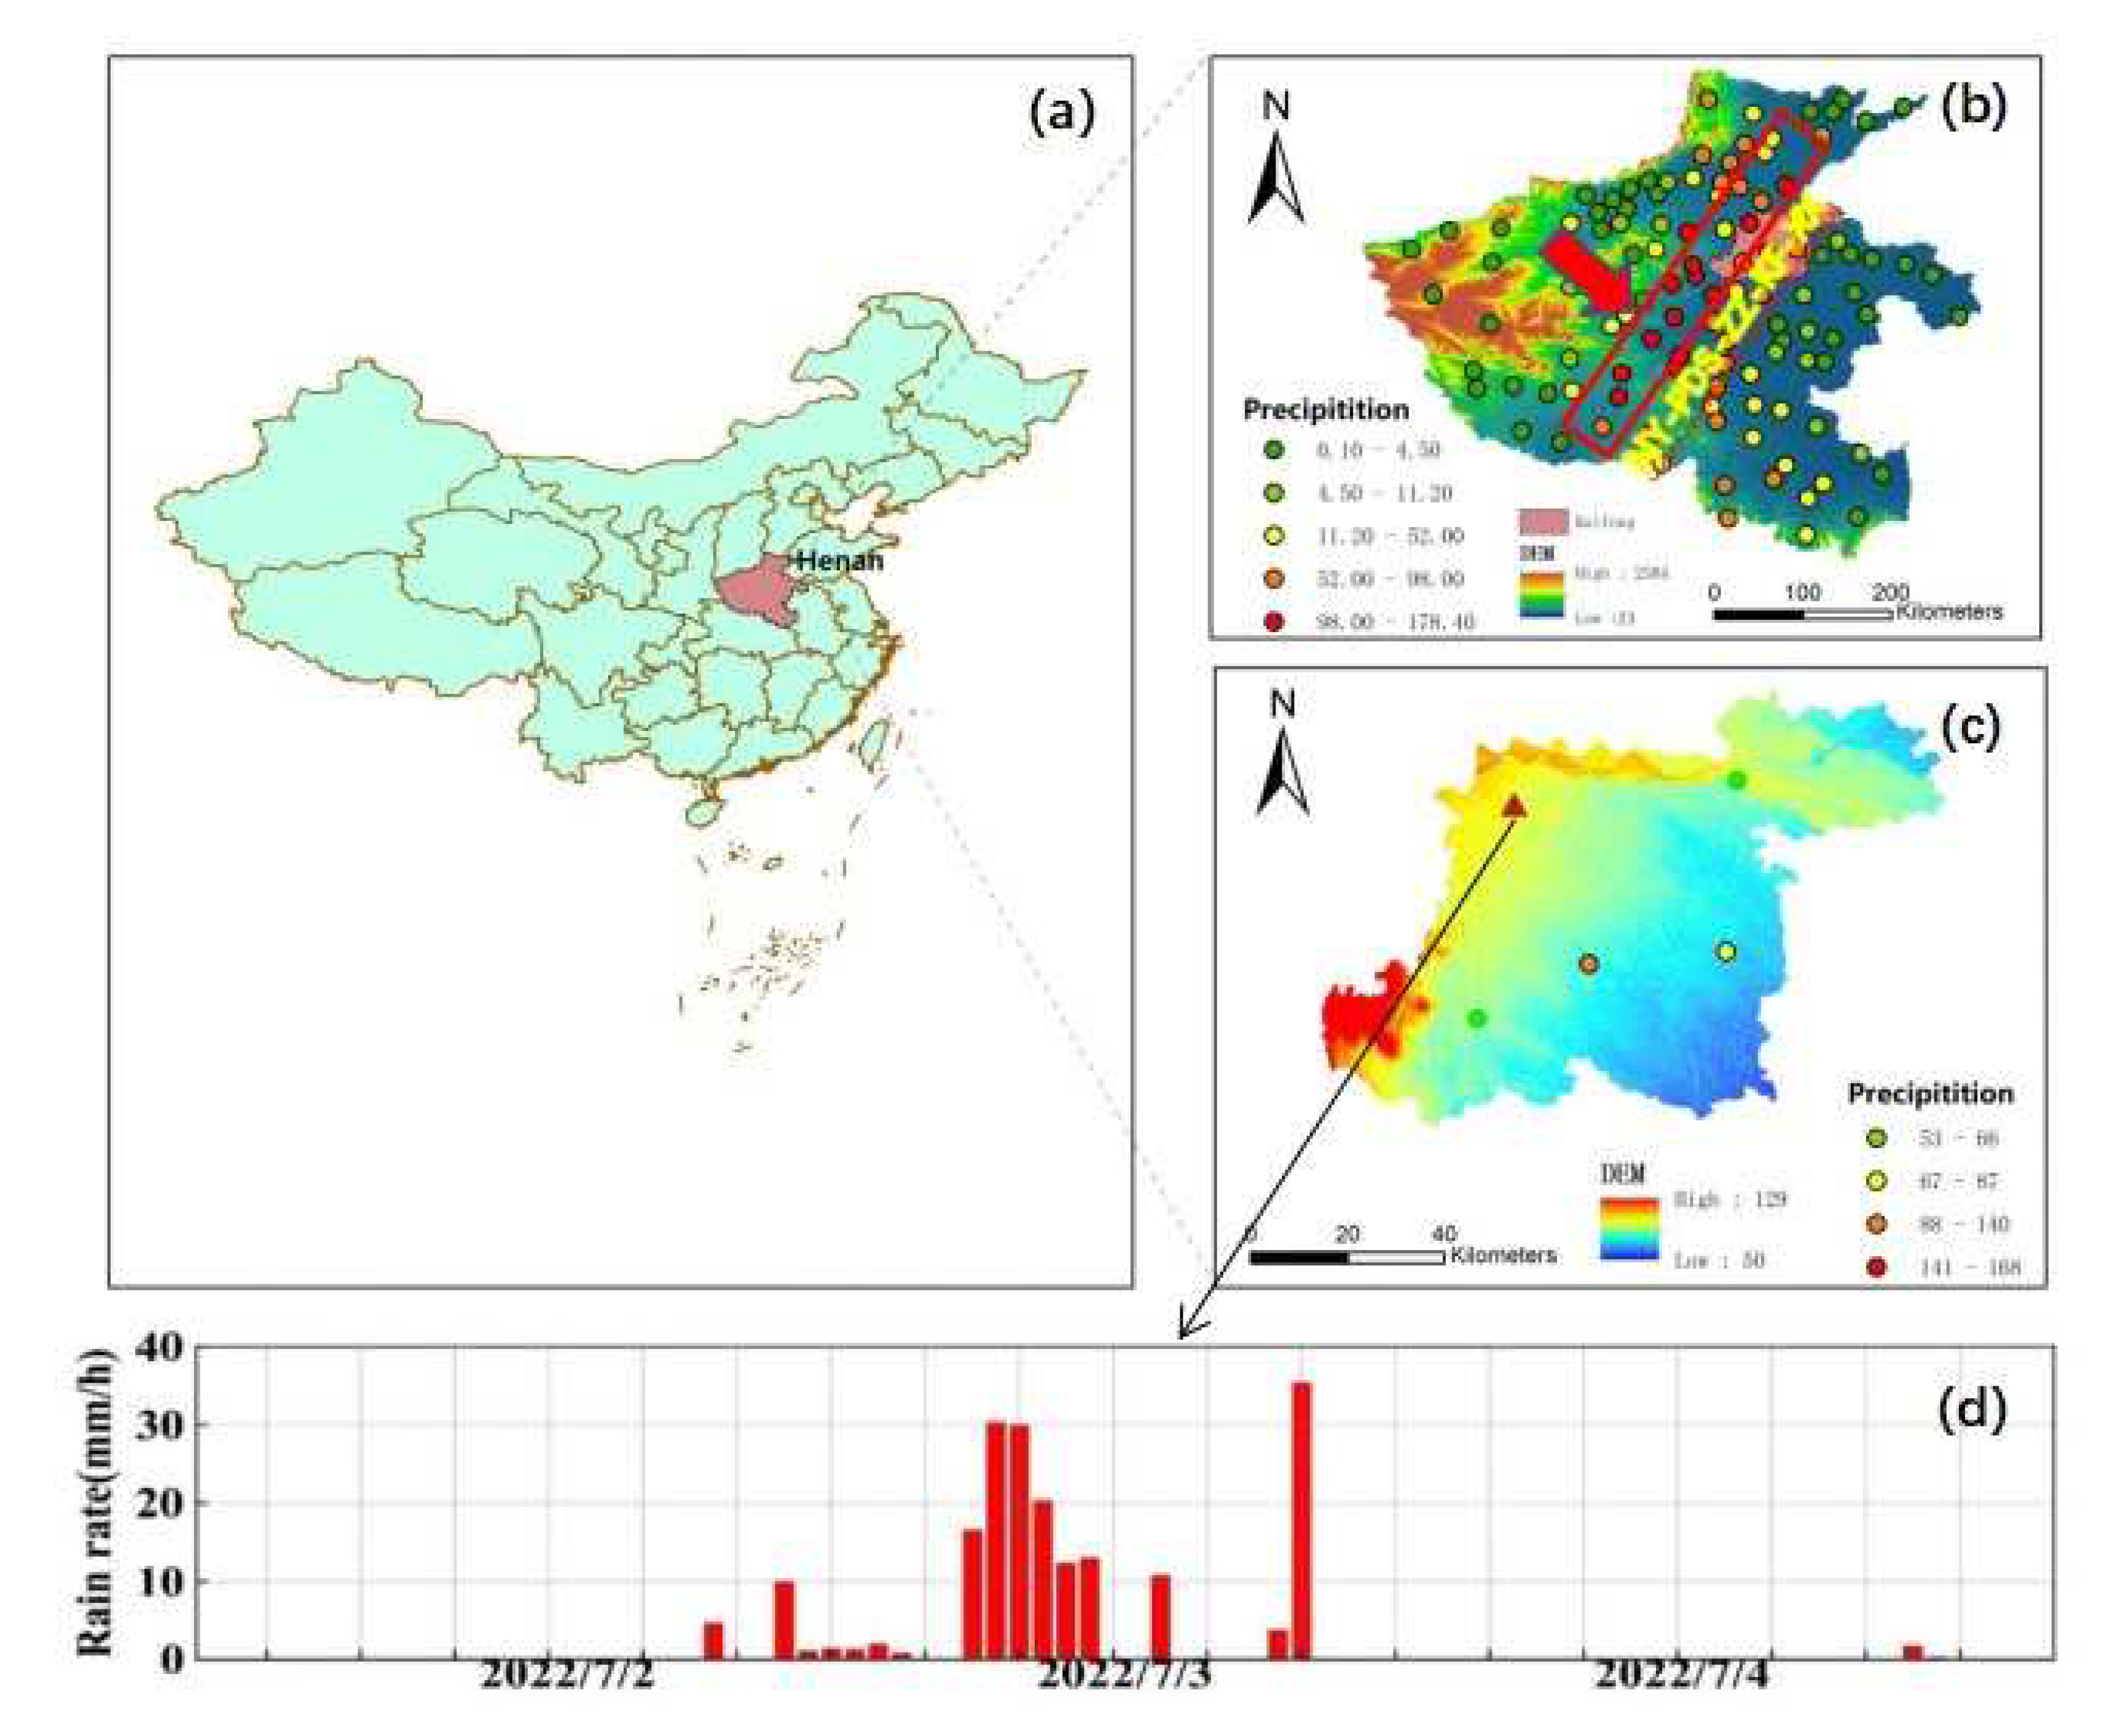
Figure 1. Location of Henan region (a), distribution of 24-hour accumulated Precipitation at national stations in Henan and Kaifeng (b,c), and time series of hourly rainfall recorded at longting station (Station No. 57091) in Kaifeng from 00:00 to 24:00 on July 2-4, 2022 (d).
Preprints 89386 g001
Figure 2. Distribution of 24-h accumulated rainfall starting from 00 UTC on 3 July 2022, in Kaifeng area.
Preprints 89386 g002
Figure 4. Humidity increments (unit: g/kg) by different experiments: Test1 (a), Test2 (b), Test3 (c).
Preprints 89386 g004
Figure 5. Simulated 24-h rainfall accumulation by CTRL (a), Test1 (b),Test2 (c),Test3 (d).
Preprints 89386 g005aPreprints 89386 g005b
Figure 6. 200hPa height field (contour line, unit: gpm), wind field (wind plume, unit: m·s-1), and jet zone (shaded area in the Figure) at 02:00 (a), 14:00 (b), and 20:00 on July 3 (c), and 08:00 (d) on July 4, 2022.
Preprints 89386 g006
Figure 7. Vertical profile of relative humidity at 14:00 on July 3, 2022 (unit:%) (a), 700hPa water vapor flux (unit: g·cm-2·hPa-1·s-1), and water vapor flux divergence (shadow, unit: 10-6·g·cm-2·hPa-1·s-1) (b).
Preprints 89386 g007
Figure 8. Vertical profile of vertical velocity (unit:Pa·s-1) at 02:00 (a), 14:00 (b), and 20:00 (c) on July 3, and 08:00 (d) on July 4, 2022.
Preprints 89386 g008aPreprints 89386 g008b
Figure 9. 500hpa divergence at 02:00 (a), 14:00 (b), and 20:00 (c) on July 3, and 08:00 (d) on July 4, 2022 (unit: 10-5s-1).
Preprints 89386 g009
Figure 10. Divergence of 700hpa at 02:00 (a), 14:00 (b), and 20:00 (c) on July 3, and 08:00 (d) on July 4, 2022 (unit: 10-5s-1).
Preprints 89386 g010aPreprints 89386 g010b
Figure 11. Vertical profile of equivalent potential temperature (unit: K) at 02:00 (a), 14:00 (b), 20:00 (c) on July 3, and 08:00 (d) on July 4, 2022.
Preprints 89386 g011aPreprints 89386 g011b
Figure 12. Sounding curves of Kaifeng railway station at 02:00 (a), 14:00 (b), 20:00 (c) on July 3, and 08:00 (d) on July 4, 2022. Red line: state curve; Blue line: dew point temperature; Black line: temperature profile.
Preprints 89386 g012
Figure 13. Terrain of Henan region (white box represents Henan, and red box represents Kaifeng location).
Preprints 89386 g013
Figure 14. 24-hour accumulated precipitation distribution in Kaifeng area simulated by Test1 (a), Test2 (b), Test3 (c), Test4 (d), Test5 (e) and Test6 (f) from 00:00 on July 3, 2022 to 00:00 on July 4, 2022 (unit: mm).
Preprints 89386 g014aPreprints 89386 g014b
Figure 15. 850hPa wind field (arrow, unit: m·s-1) and jet (colored shadow, unit:m·s-1) (a), and radar combined reflectance energy (shadow area, unit: dbz) (b) at 14:00 on July 3, 2022.
Preprints 89386 g015
Table 1. Assimilation scheme.
Scheme Assimilated Data Assimilation Interval
CTRL No
Test1 temperature and humidity profiles from seven MWRs 1-h
Test2 FY-4A AGRI radiance channels 9–14 1-h
Test3 both FY-4A AGRI and MWR data 1-h
Table 2. Terrain test scheme.
Scheme Changes in Terrain Height/% Latitude/N Longitude/E
CTRL 0 34.57°N-40.72° 110.27°E-114.55°
Test1 -50 34.57°N-40.72° 110.27°E-114.55°
Test2 -75 34.57°N-40.72° 110.27°E-114.55°
Test3 -100 34.57°N-40.72° 110.27°E-114.55°
Test4 +50 34.57°N-40.72° 110.27°E-114.55°
Test5 +75 34.57°N-40.72° 110.27°E-114.55°
Test6 +100 34.57°N-40.72° 110.27°E-114.55°
Disclaimer/Publisher’s Note: The statements, opinions and data contained in all publications are solely those of the individual author(s) and contributor(s) and not of MDPI and/or the editor(s). MDPI and/or the editor(s) disclaim responsibility for any injury to people or property resulting from any ideas, methods, instructions or products referred to in the content.
Copyright: This open access article is published under a Creative Commons CC BY 4.0 license, which permit the free download, distribution, and reuse, provided that the author and preprint are cited in any reuse.
Prerpints.org logo

Preprints.org is a free preprint server supported by MDPI in Basel, Switzerland.

Subscribe

© 2024 MDPI (Basel, Switzerland) unless otherwise stated