1. Introduction
The safety of an embankment dam depends upon geotechnical design consideration, operation and maintenance, potential loads, and possible permissible stresses that it withholds during critical situations [
1,
2]. The steady-state seepage, and fluctuation of the seepage path due to sudden changes in water level in the reservoir have an impact on effective stresses and shear strength of the soil materials influencing slope stability [
3,
4]. The rapid draw-down in the reservoir water level is crucial and most likely to cause a failure of slope [
5]. The less permeable soil materials of the dam decrease the drain rate during the draw-down which has a huge effect on excess pore water pressure. The excess pore water pressure in the dam eventually reduces the resisting force, resulting in less factor of safety against sliding [
6]. The quick reduction of stabilizing water load and excess pore water pressure in the dam destabilized the slope resulting in slope failure [
7].
Duncan, J. M. [
8] has described the state of the art for Limit Equilibrium Method (LEM) and stress based Finite Element Method (FEM), the evolution of computational technique to perform stress-strain distribution in a slope and embankments considering in-situ stress-strain behavior. The LEM is based on the two-equilibrium factor of safety (FOS) equations for the range of inter-slice normal and shear forces. One is based upon the horizontal force and the other is with respect to the moment equilibrium to determine the FOS [
8,
9].
Lane, P [
10] used Bishop and Morgenstern LEM and stress-based FEM for rapid draw-down conditions in an embankment to establish FOS chart where the resulting FOS were found to be more or less similar. Oo,H.Z [
11] applied LEM and FEM to evaluate minimum FOS regarding the stability of the slope due to draw-down and found that the FOS computed with FEM was slightly less than LEM considering stress-strain distribution. Hammouri, N.A [
12] obtained identical critical slip surfaces and illustrated the difference in the percentage of the minimum FOS considering critical slip circles for LEM and FEM. Azadi, A [
13] compared FOS considering different permeability for the case of rapid draw-down and found that FOS increases with the increase in permeability, which is reasonable as higher permeability increases the drain rate. However, the minimum FOS obtained from FEM was a bit lower than LEM as true stress-strain distributions are hard to establish due to the complexity of soil behavior.
Zomorodian, S [
14] studied the impact of upstream horizontal filter material during the rapid draw-down on FOS using LEM and FEM. FOS was increased during the draw-down due to the application of multiple horizontal filters as a result of the quick draining rate. Srivastava, A [
15] demonstrated the influence of permeability on seepage drain rate and slope stability considering different material properties. Gottardi, G [
16] discussed the importance of water content, suction, and its influence on seepage and slope stability. Gottardi, G [
16] also reflects the accurate estimation for the probability of slope failures depending upon the boundary conditions to emphasize the detailed field study. Bhaskar, P [
17] studied the importance of hydraulic properties on transient seepage behavior during the draw-down and analyzed the pore water pressure effects on FOS with the stability chart. Li, Z [
18] applied FEM to study the potential of cracks development and internal erosion in earth-fill dams due to rapid changes in reservoir water level. Alonso Pérez de Agreda [
19] mentioned thirty-three cases of upstream slope failure due to rapid draw-down, describing the critical case San Luis dam, in California (ICOLD, 1980).
In this paper, a case study of the Middle Marsyangdi Hydroelectric Power Project (MMHPP) rock-fill dam has been considered to evaluate the failure of the slope due to 8 hours of rapid draw-down which was undertaken on October 2012 for reservoir flushing [
20]. The presented study attempted to evaluate several FOS methods considering Morgenstern-Price, Spencer, Crops of Engineers
, Lowe-Karafiath, Janbu, Bishop, Ordinary for Limit Equilibrium Method using SLOPE/W and coupled SIGMA/W for stress-based Finite Element Method.
The main objectives of the reservoir draw-down case study:
- To evaluate the approach of LEM and FEM for defining safe allowable draw-down rates.
- To study the influence of change in permeability of upstream dam shell in FOS.
- To examine the effect of horizontal upstream filter material in FOS.
2. Materials and Methods
2.1. Case study
The Middle Marsyangdi Hydroelectric Power Project (MMHPP) with an installed capacity of 70MW and annual design generation of 398 GWh is located in the Lamjung district of western Nepal [
21]. The project was commissioned on the 14
th of December 2008 by Nepal Electricity Authority (NEA) [
20]. The peaking run of the river project consists of a combined concrete and rock-fill dam with a live storage capacity of 1.65 million
[
21].
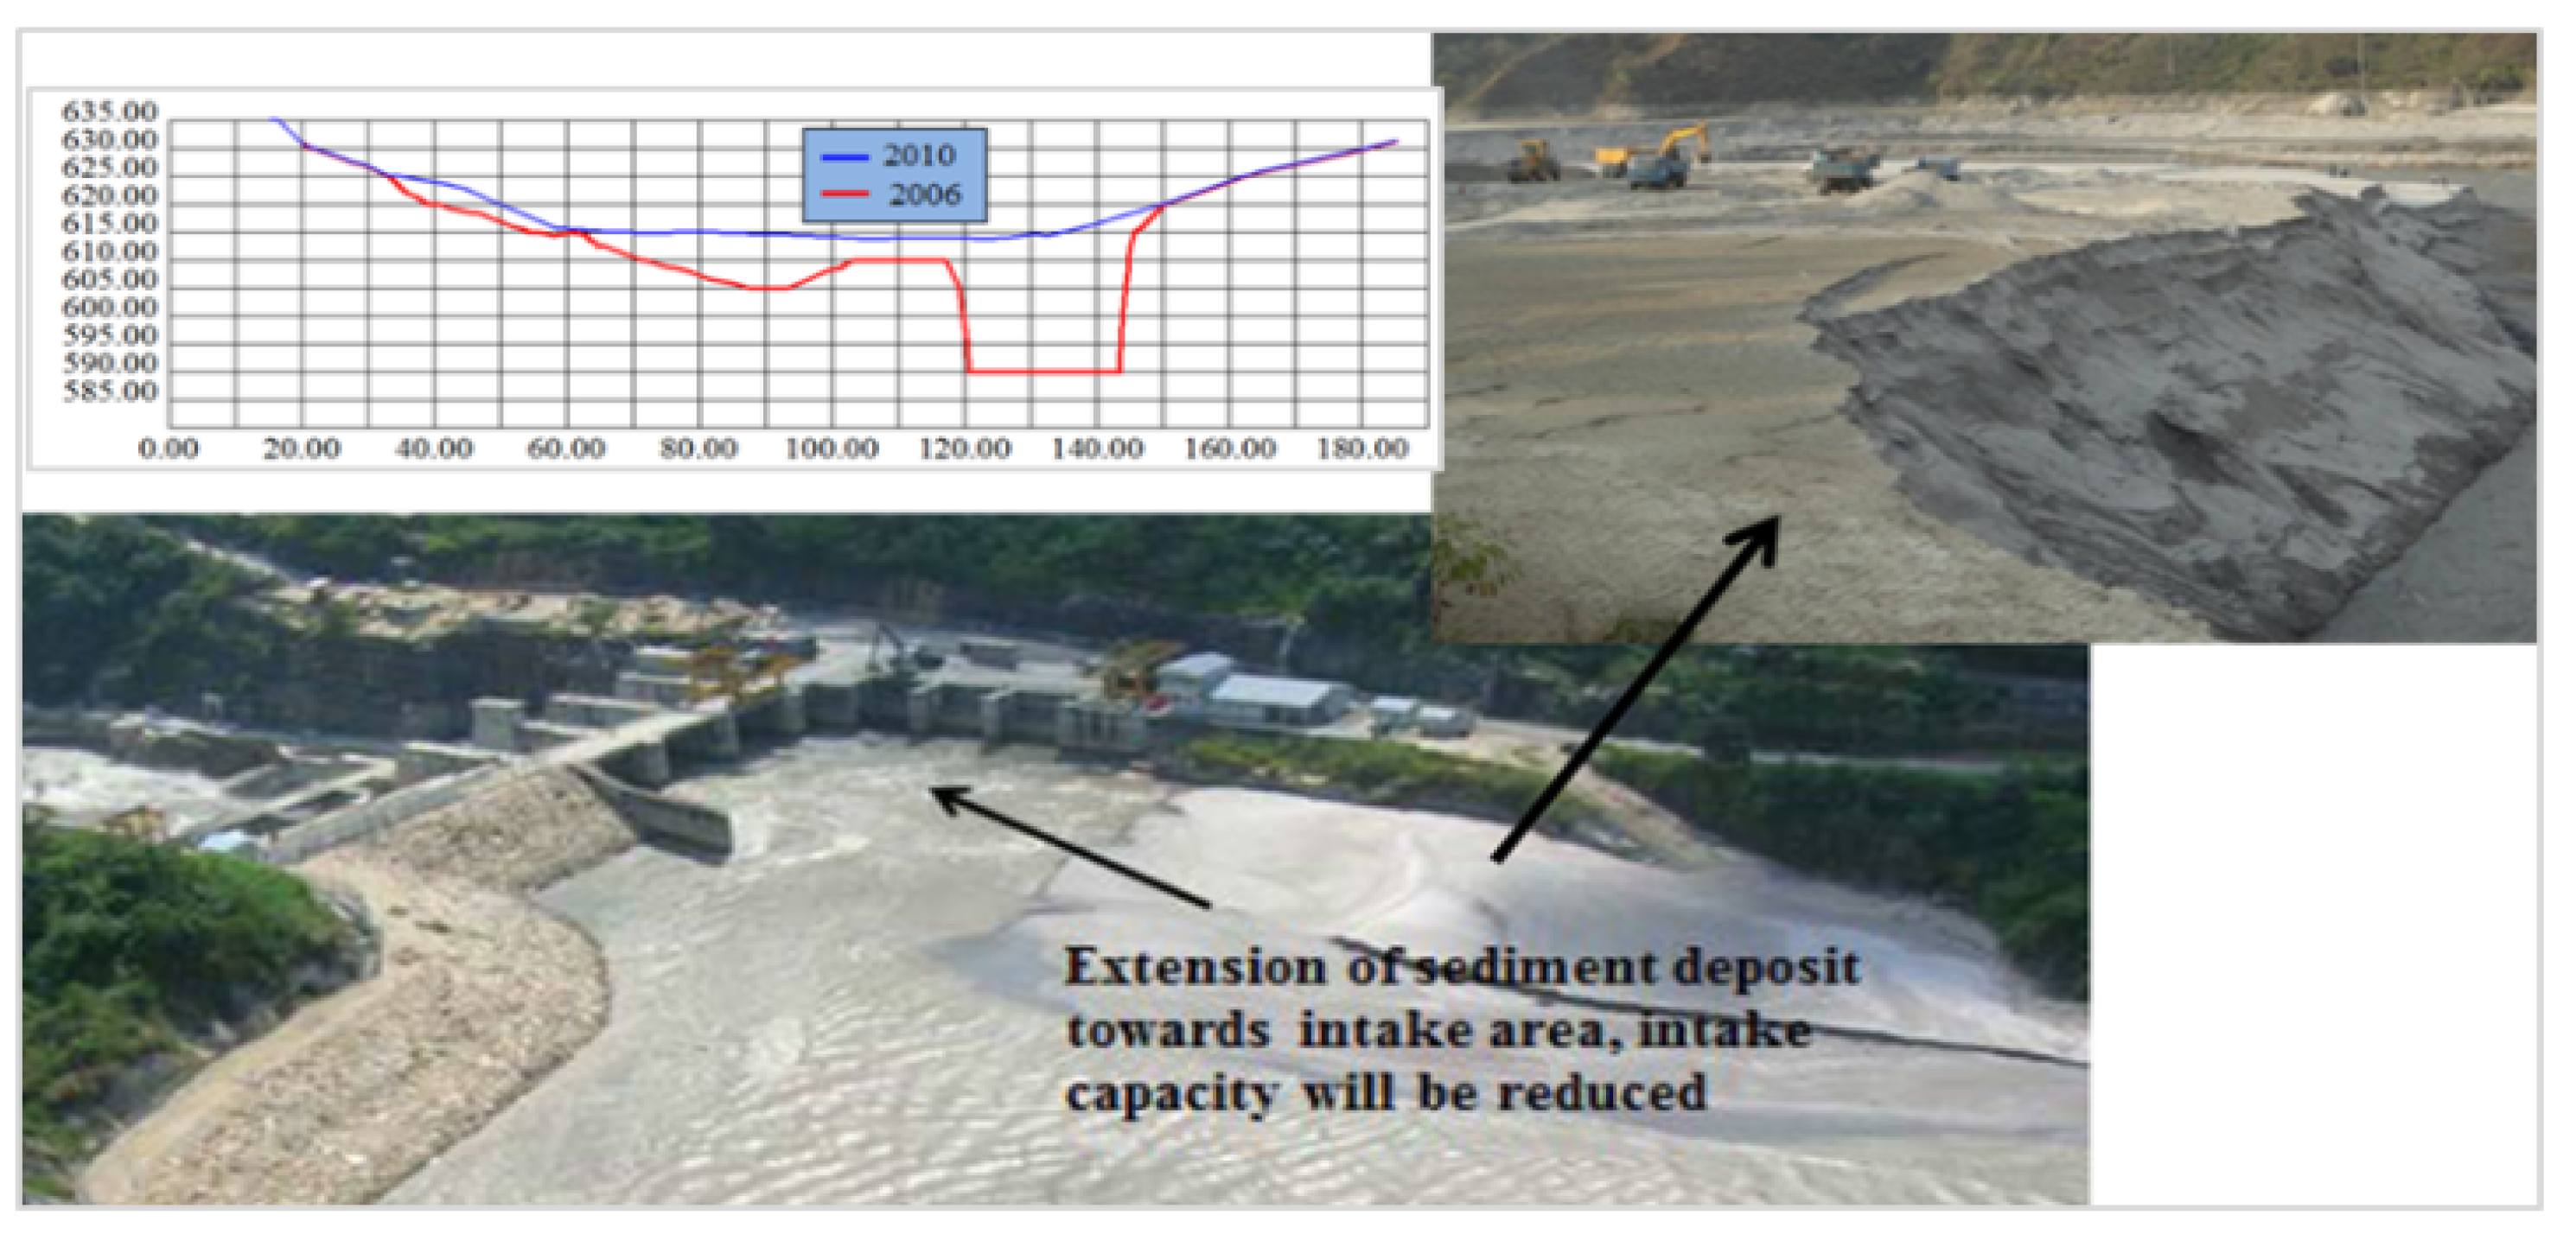
The interventions on steep mountainous rivers like Nepal have to face a lot of sediment issues, a huge amount of sediment is transported during flood events which reduces the storage of the reservoir. Therefore, in October 2012 reservoir flushing was carried out due to a huge amount of sediment deposited on the right bank of the reservoir at the upstream side of the dam,
Figure 1.
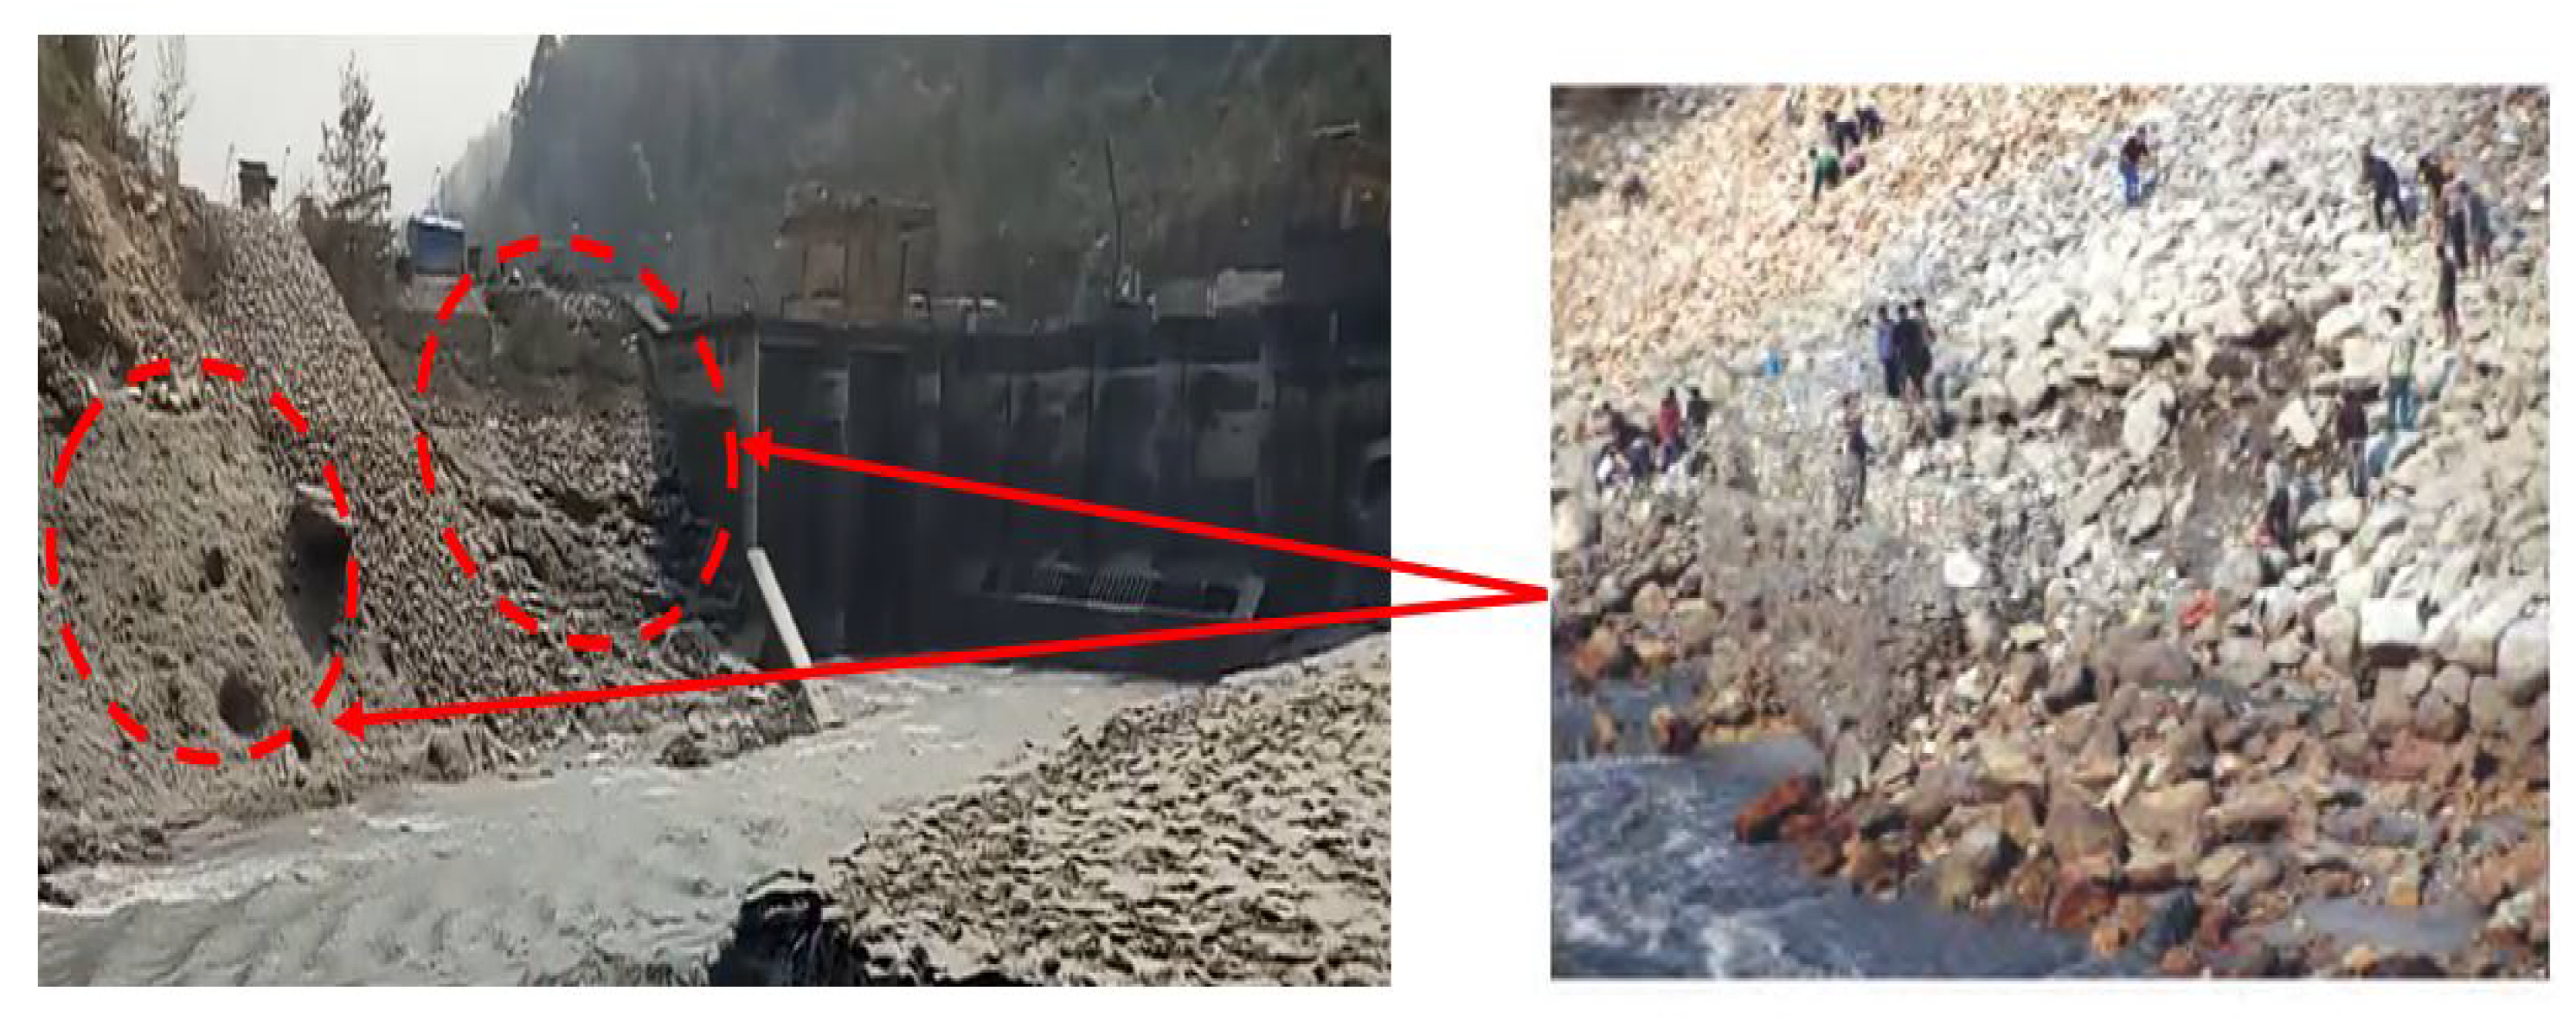
After the 8 hours of draw-down of the water level in the reservoir for flushing, the slope of the rock fill dam was found to be unstable, and repair maintenance of the rip-rap was carried out to stabilize the slope,
Figure 2.
2.2. Material properties
To understand the seepage flow behaviors inside the rock fill dam consisting of various materials, it is essential to define the appropriate parameter as every soil material has its own properties [
16]. MMHPP dam shell consists of a mixture of silty sand, rip-rap consists of boulders, fine filter consists of sand, coarse filter consists of gravel, and clay-core consists of clay. The materials distinguished by the Unified Soil Classification System (USCS) were adopted for parameter values [
22].
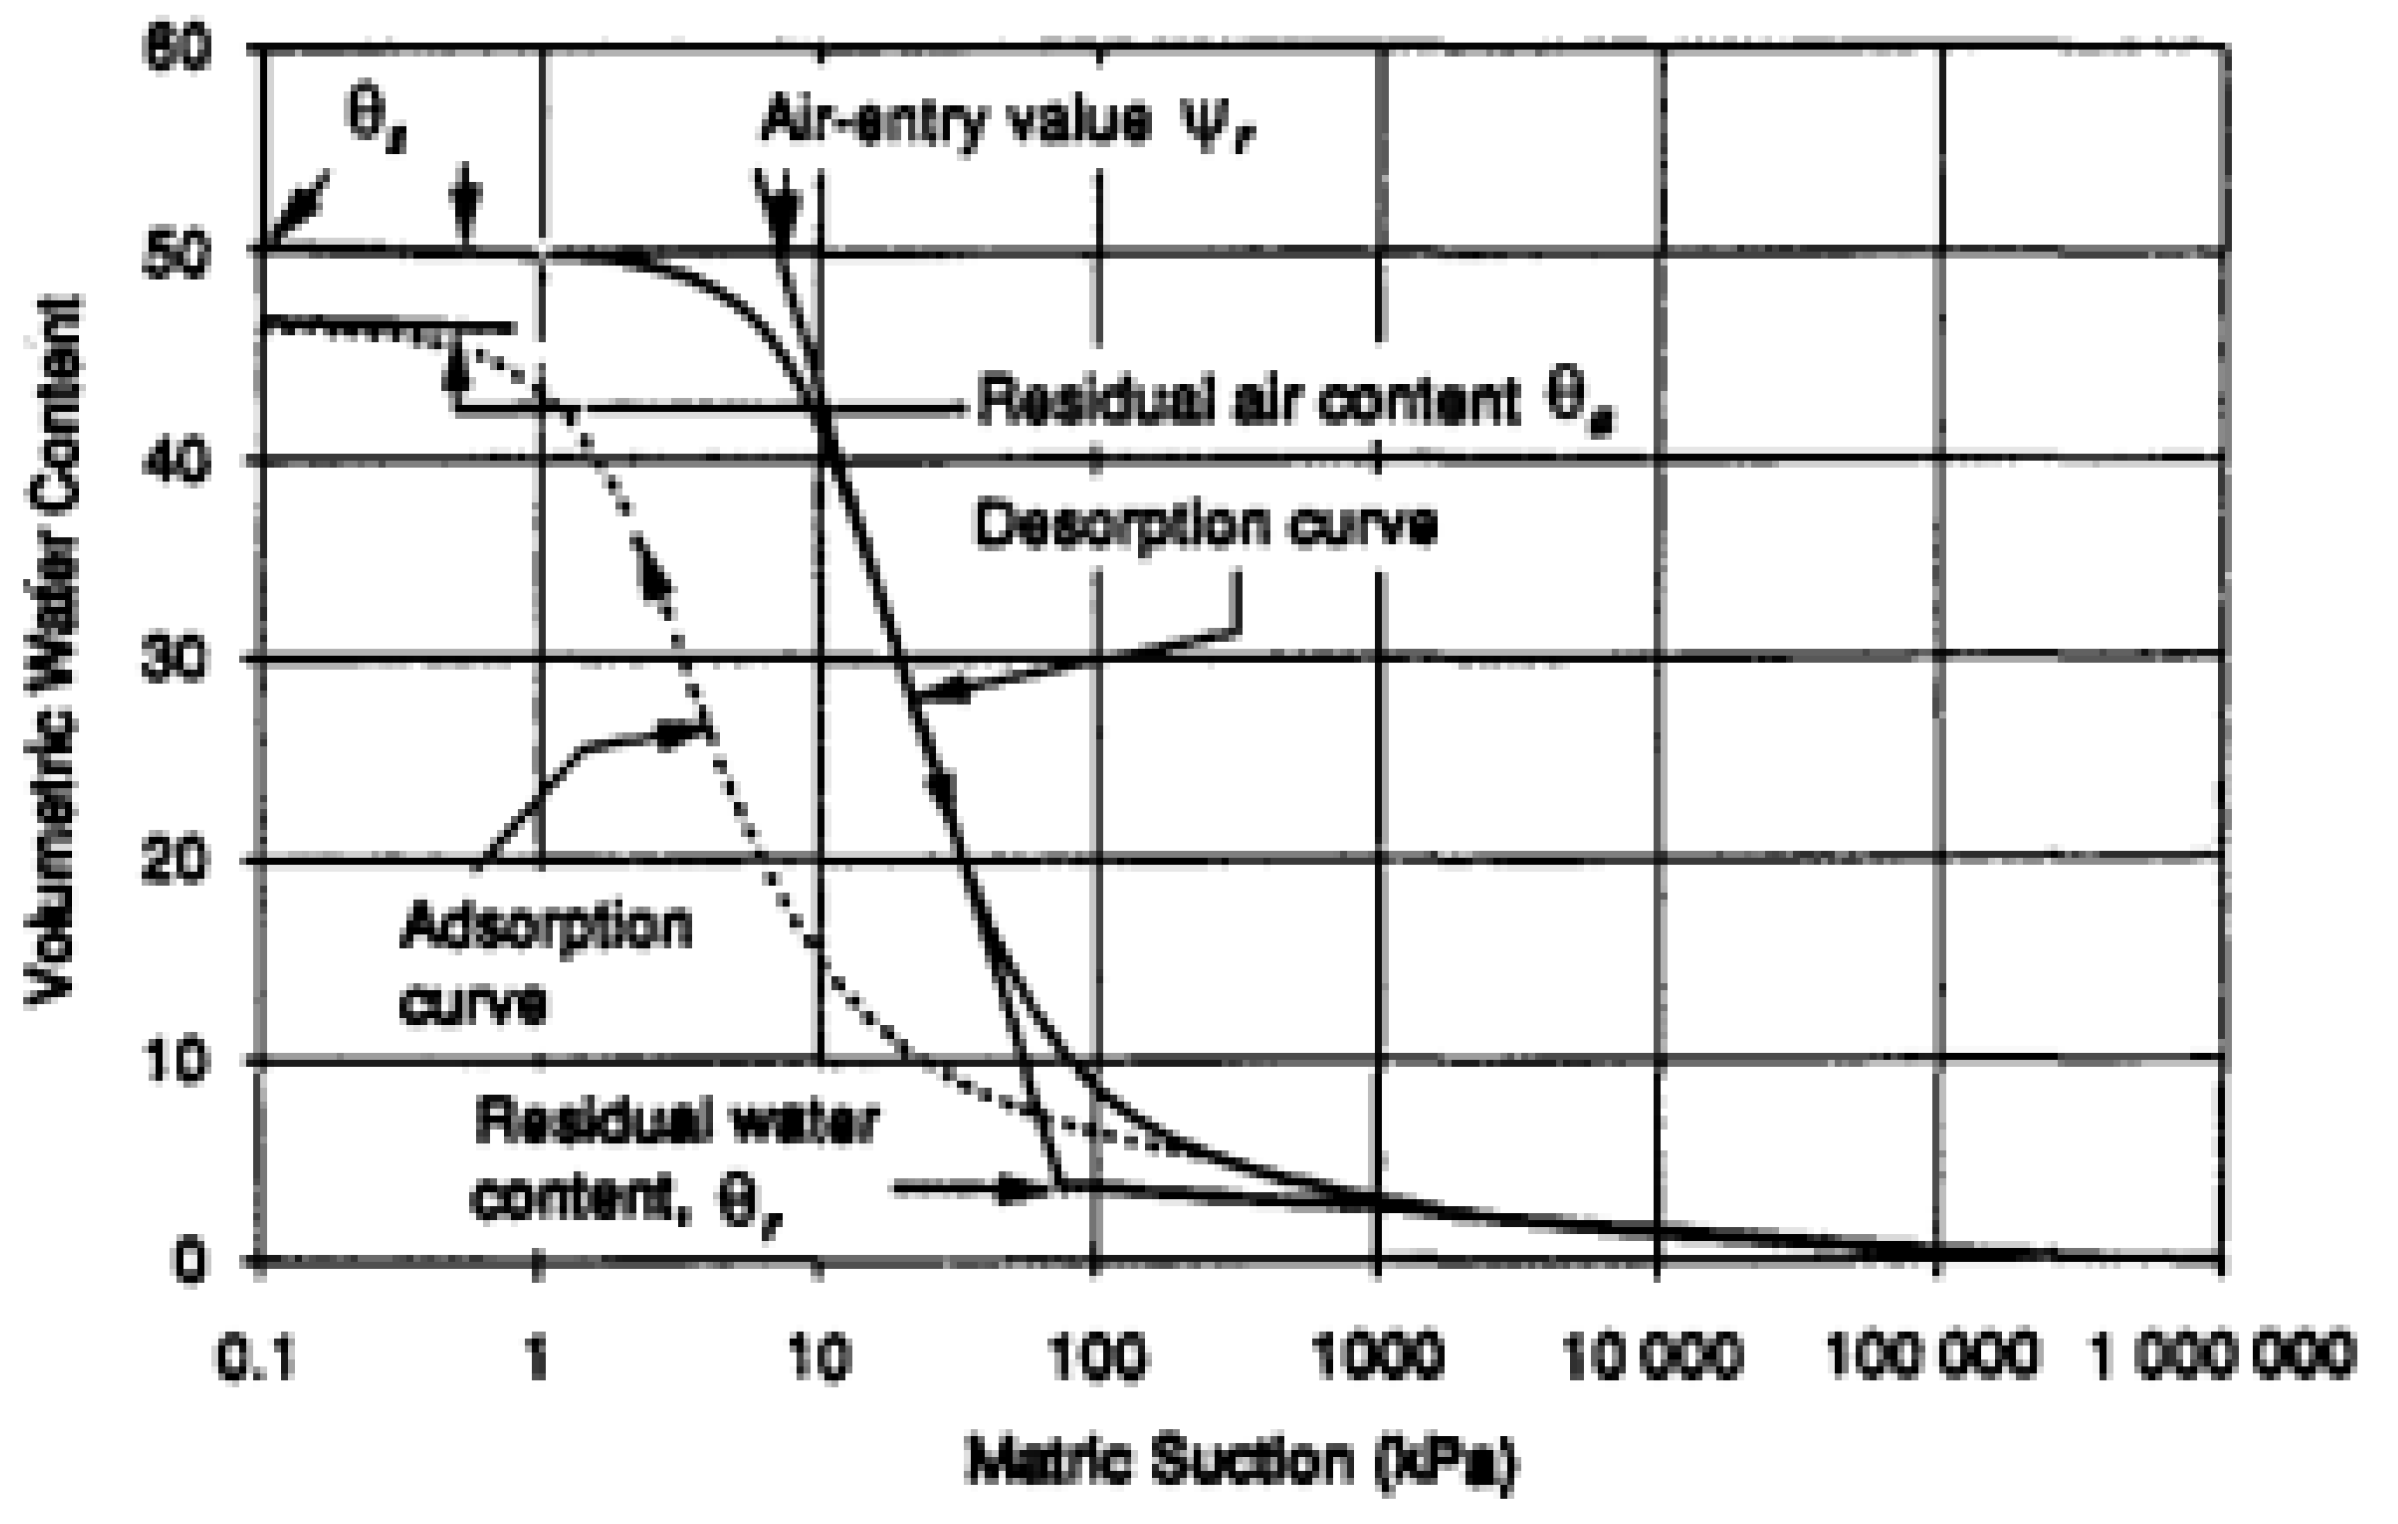
2.2.1. Soil Water Characteristic Curve (SWCC)
The SWCC describes the change in suction pressure due to the air entrainment causing water to drain out from the soil as a result of negative pore water pressure [
23]. The negative pore water pressure changes until it reaches the residual water content, which is considered a fully unsaturated soil condition [
24].
Figure 4.
Soil Water Characteristic Curve, Rahardjo, H [
24].
Figure 4.
Soil Water Characteristic Curve, Rahardjo, H [
24].
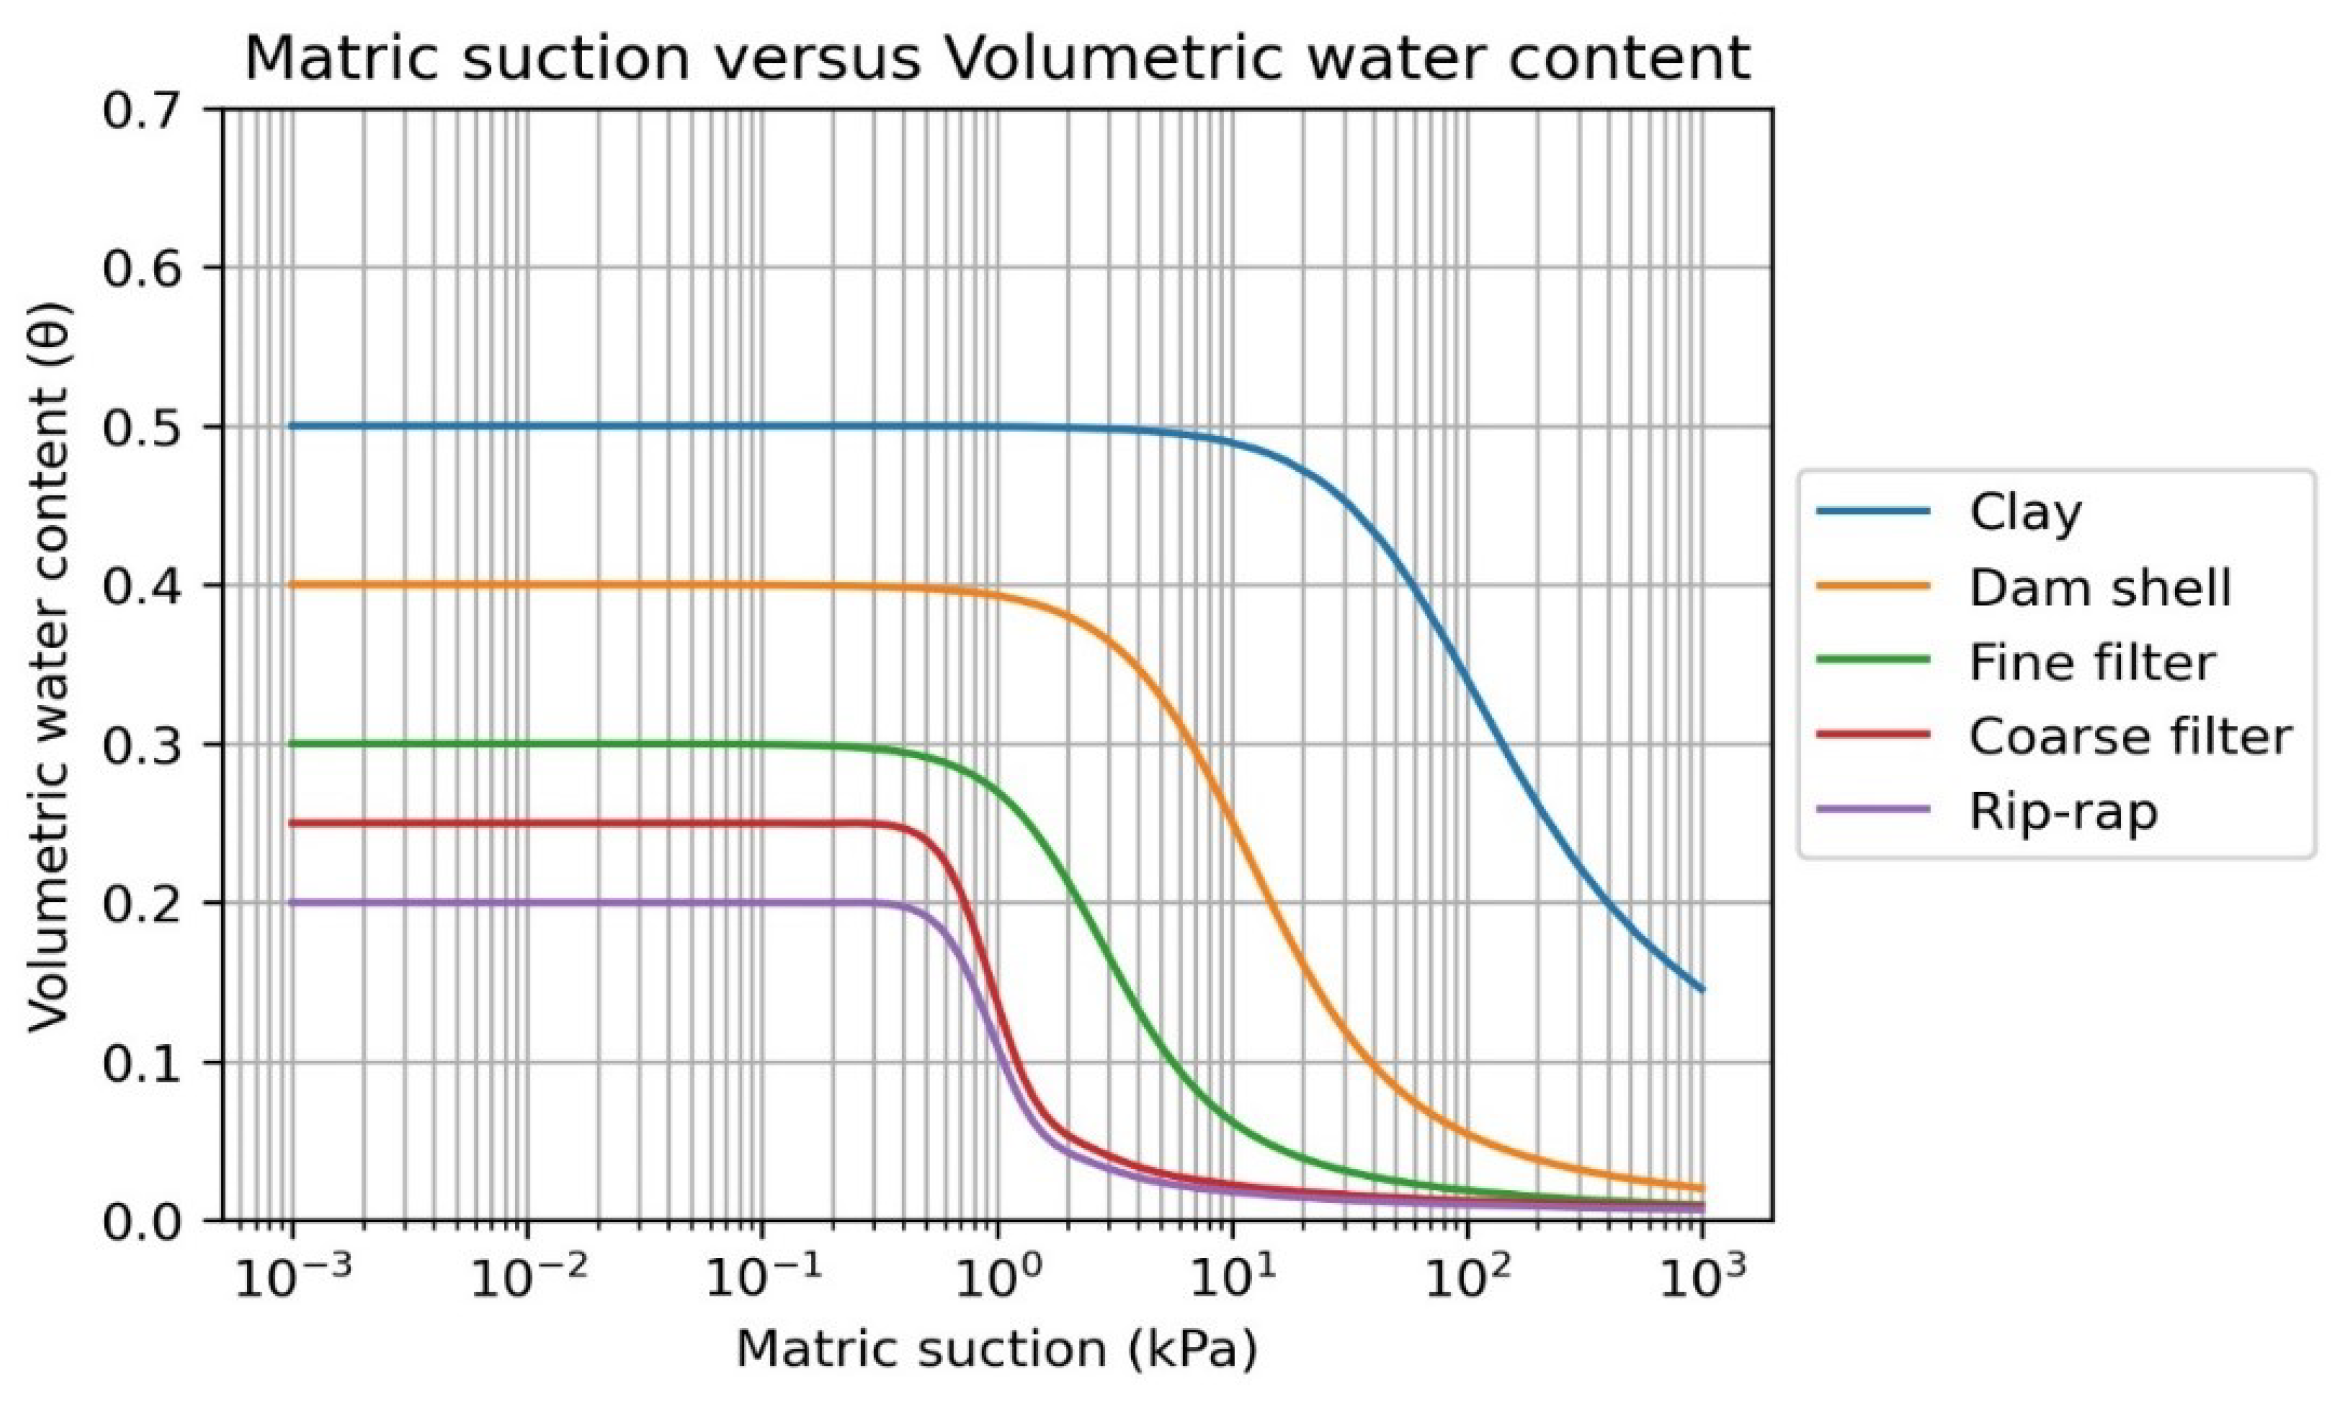
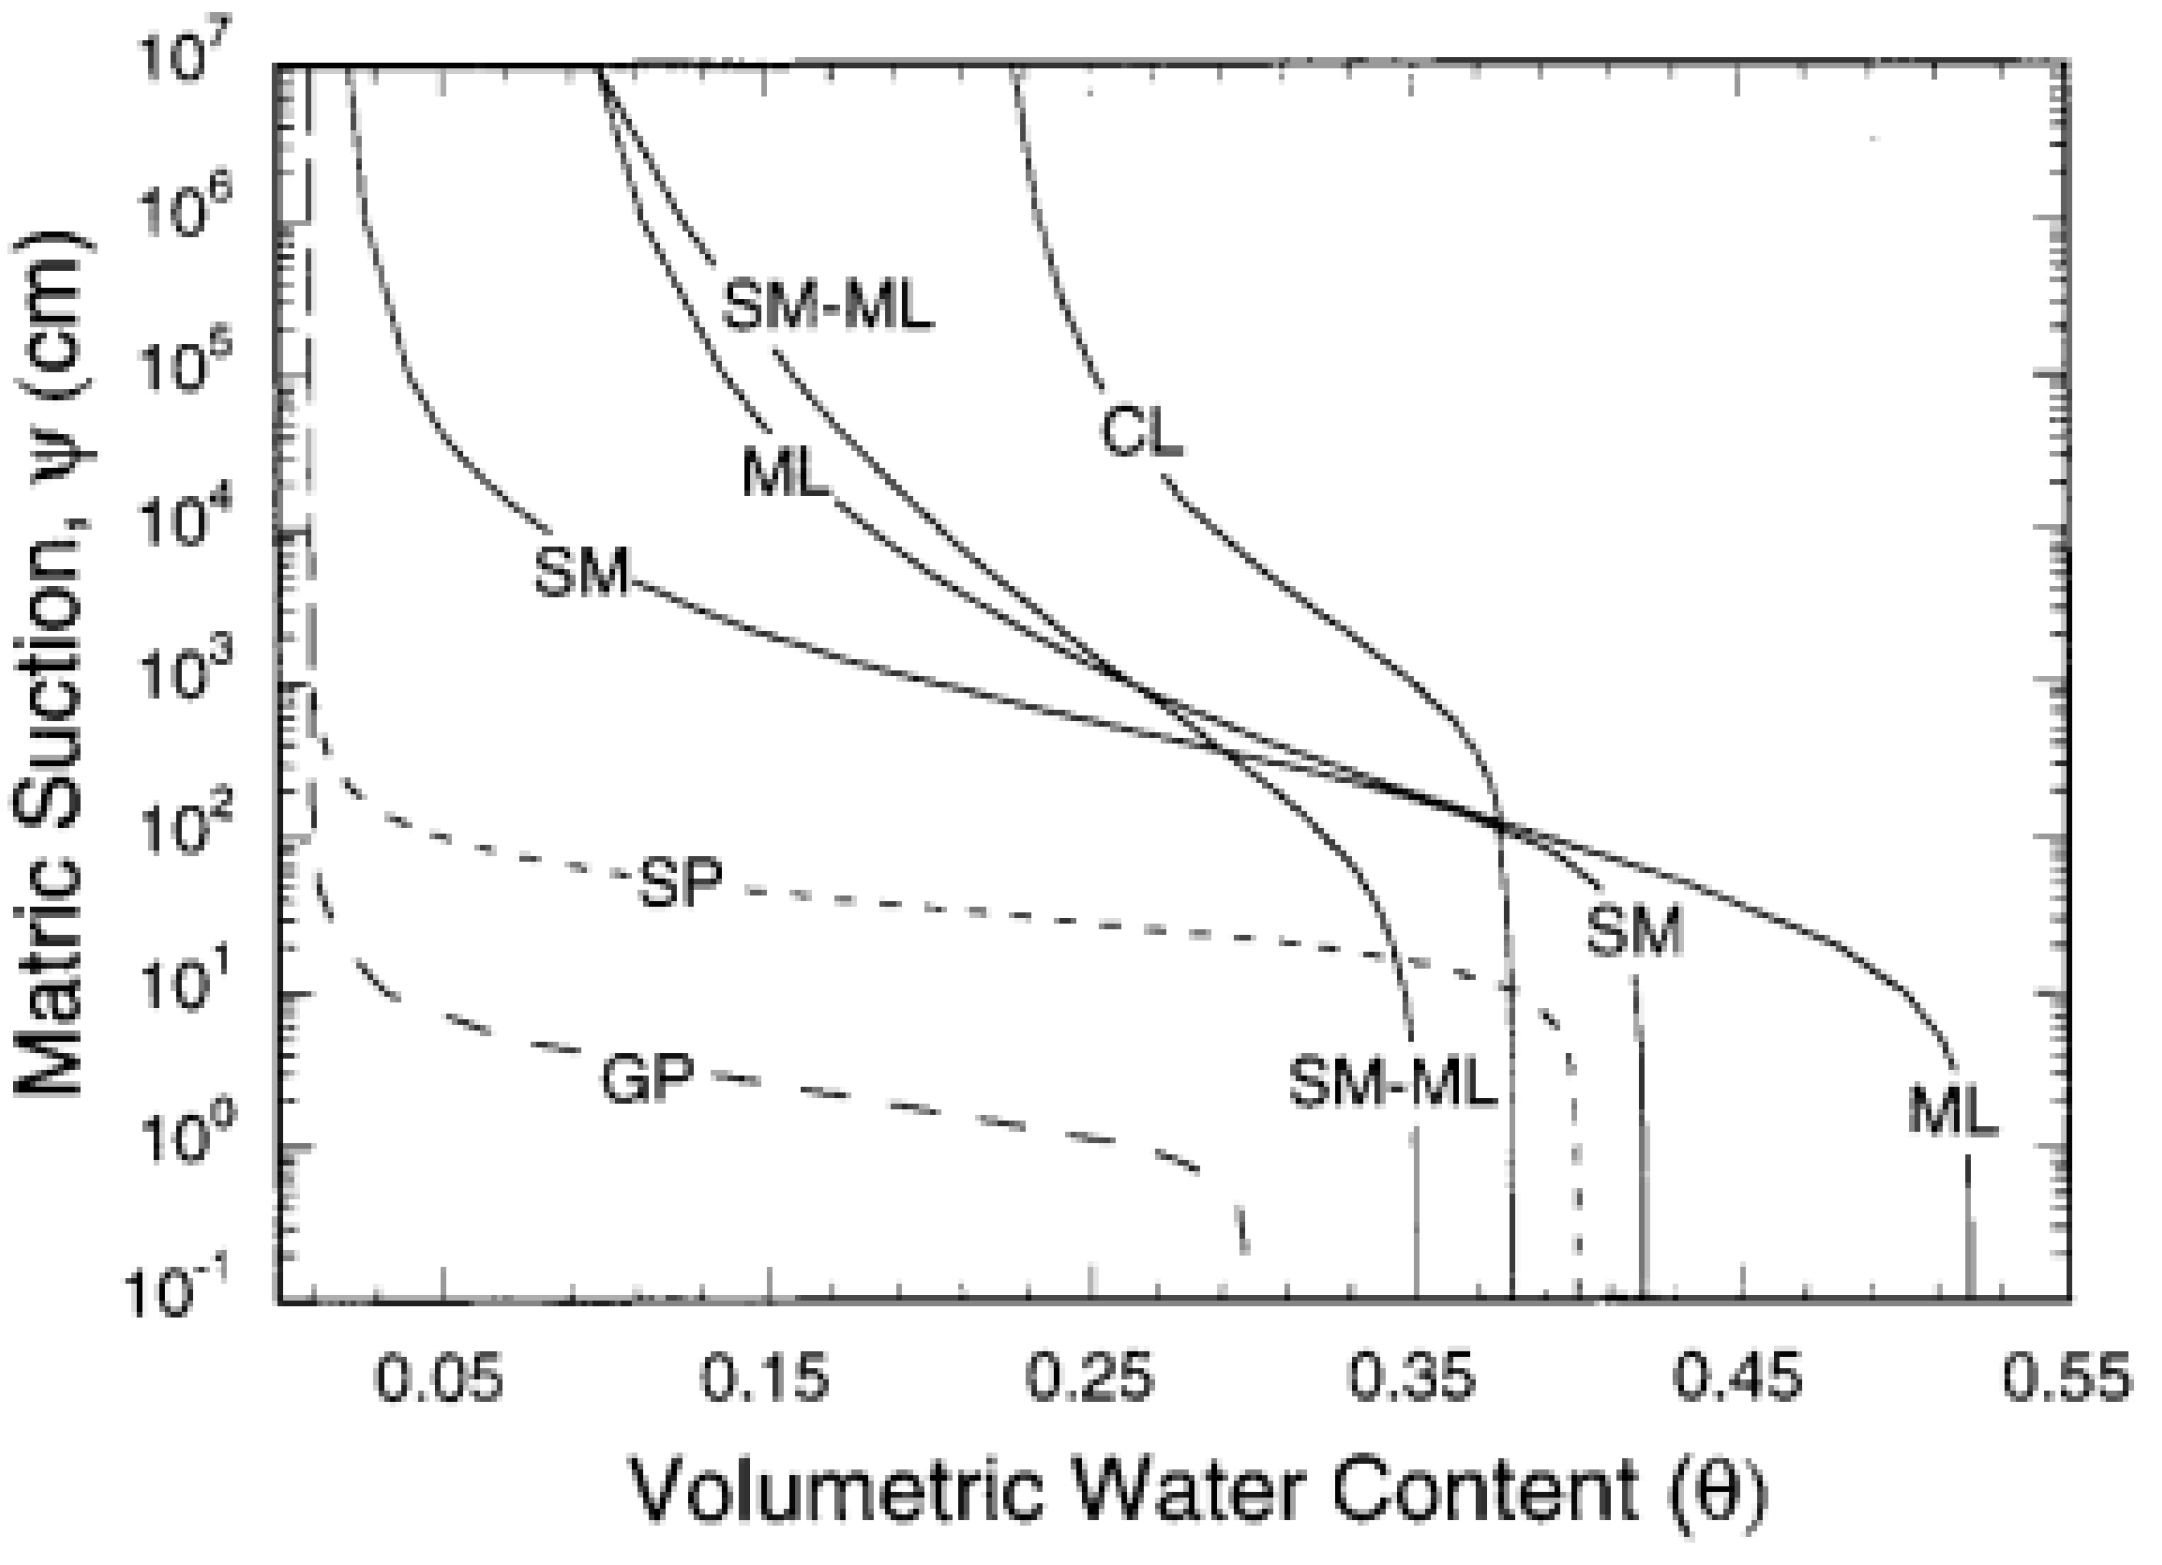
The Soil Water Characteristic Curves for different zonal materials of the dam were adopted based upon the volumetric water content defined by Khire, M.V. and Bosscher, P. J. [
25],
Figure 5. The sample functions based on the specified saturated and residual water content were used to plot a graph between the volumetric water content and matric suction for different soil materials using SEEP/W.
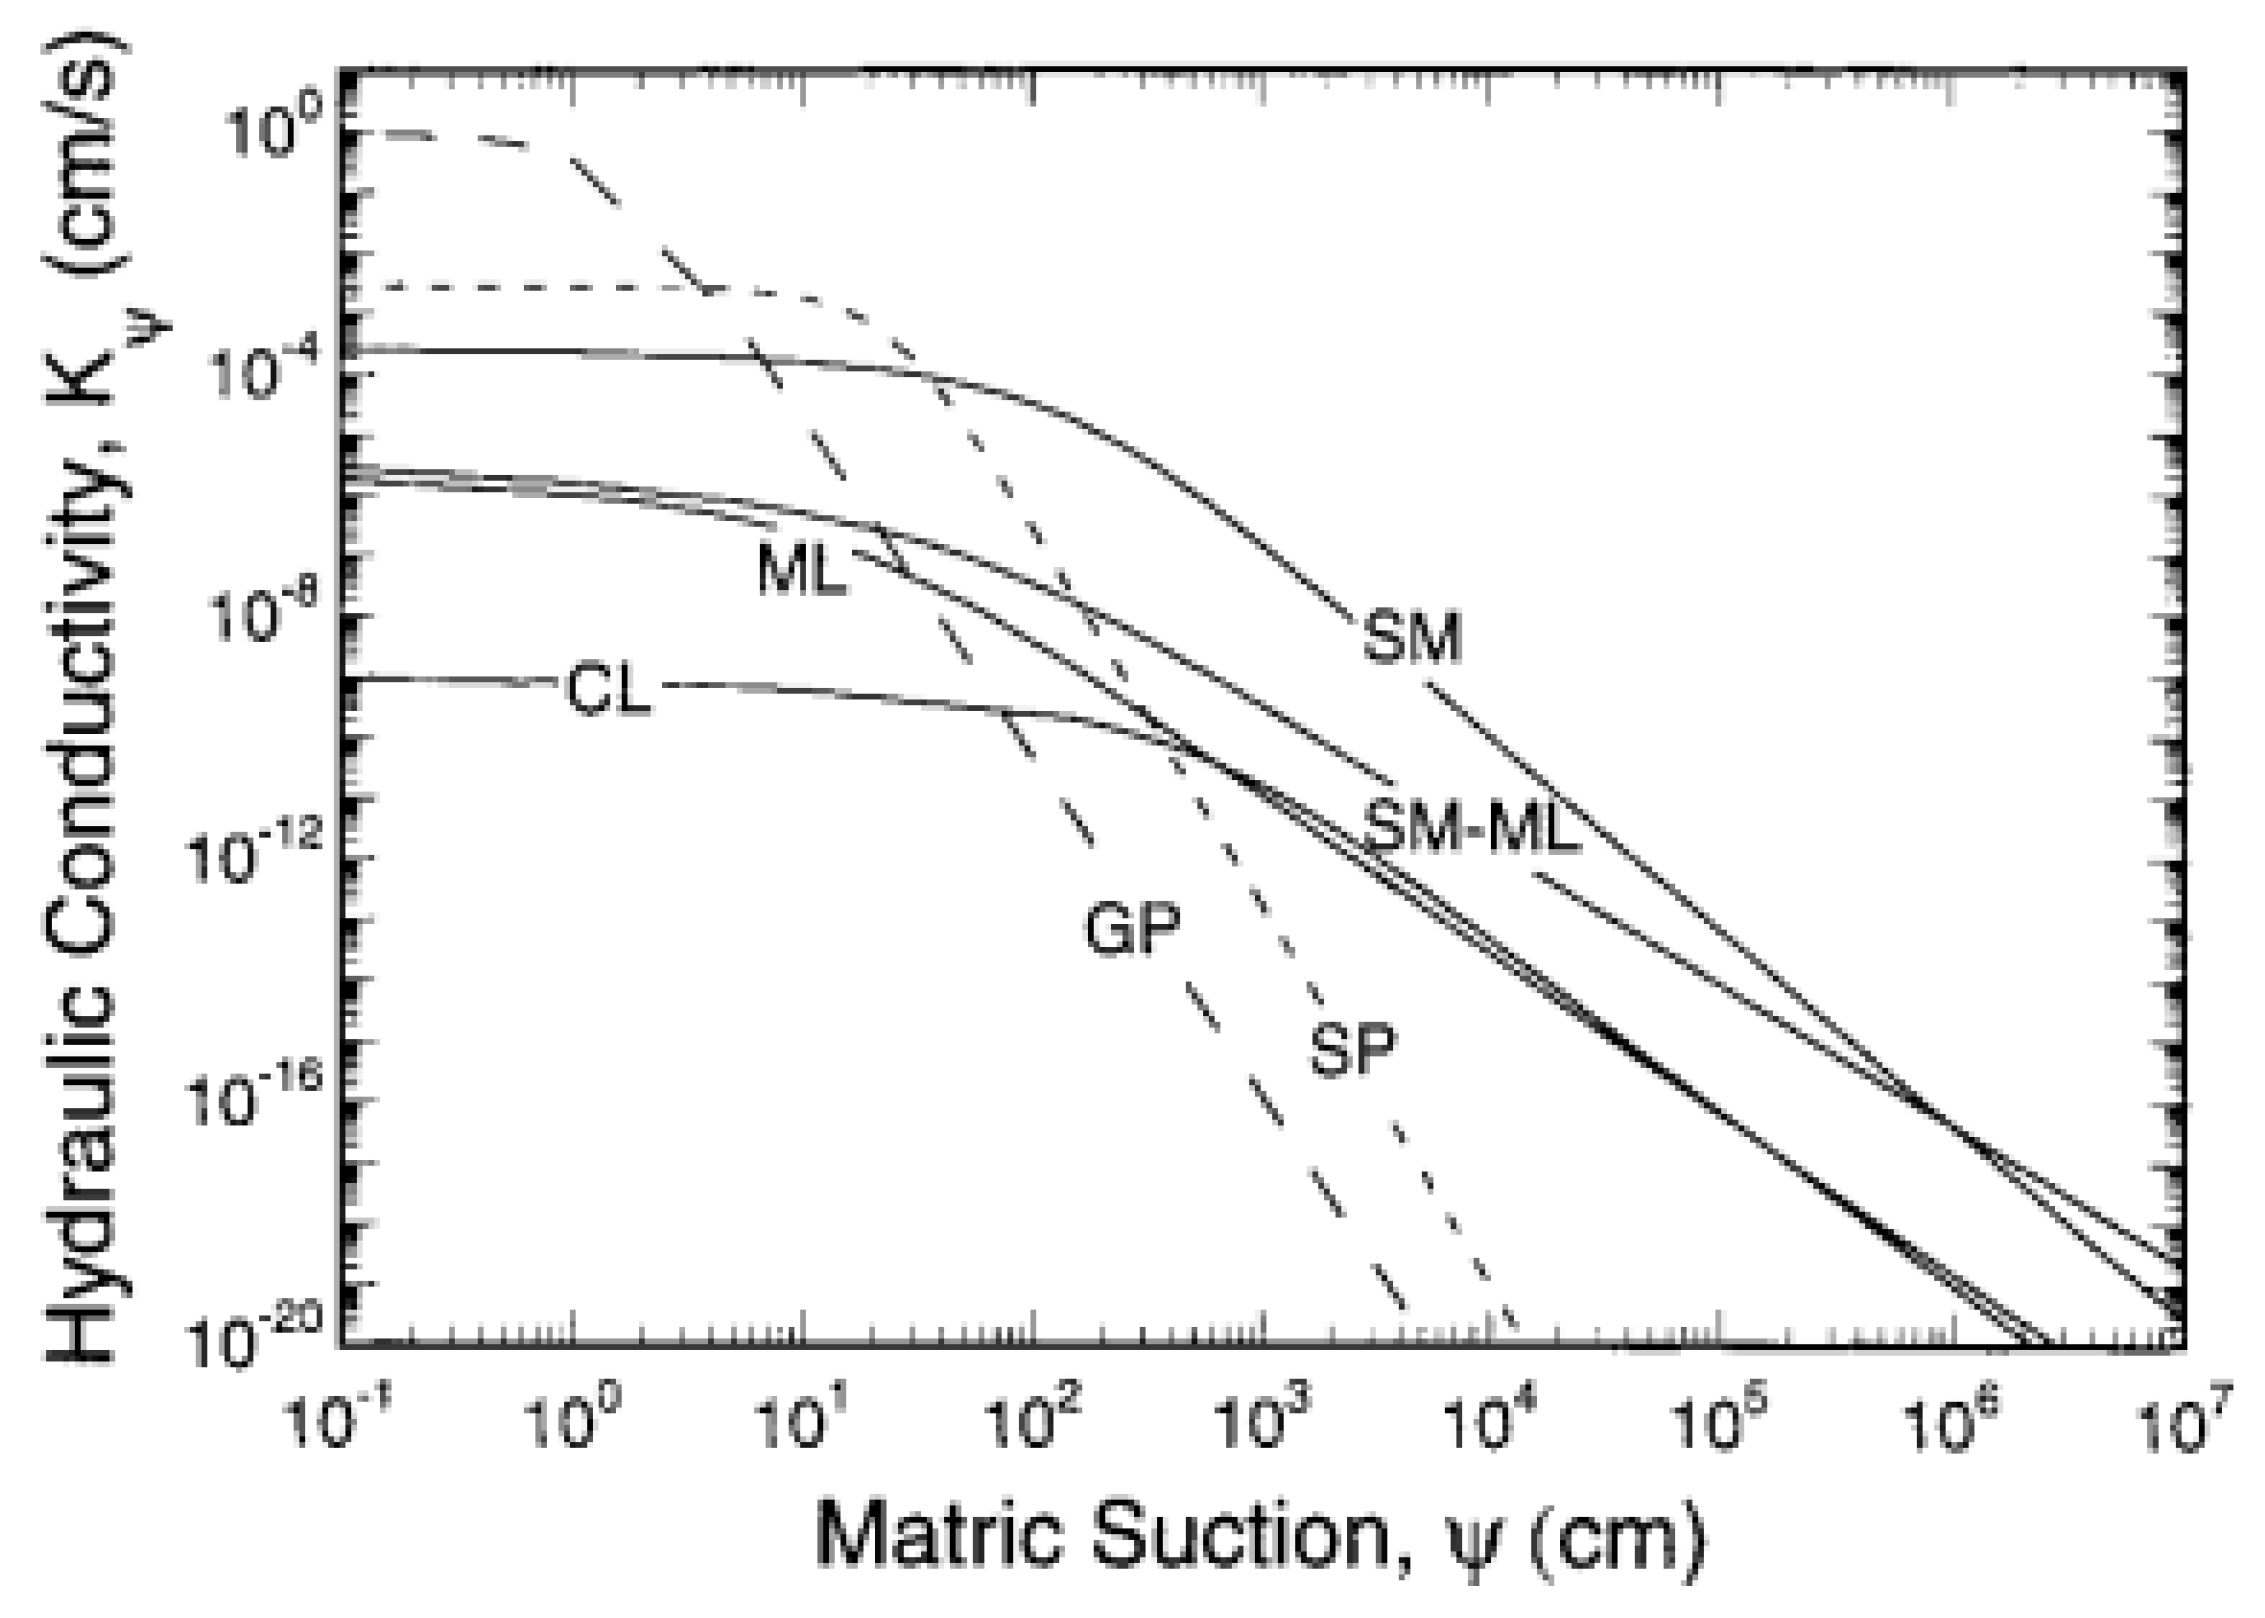
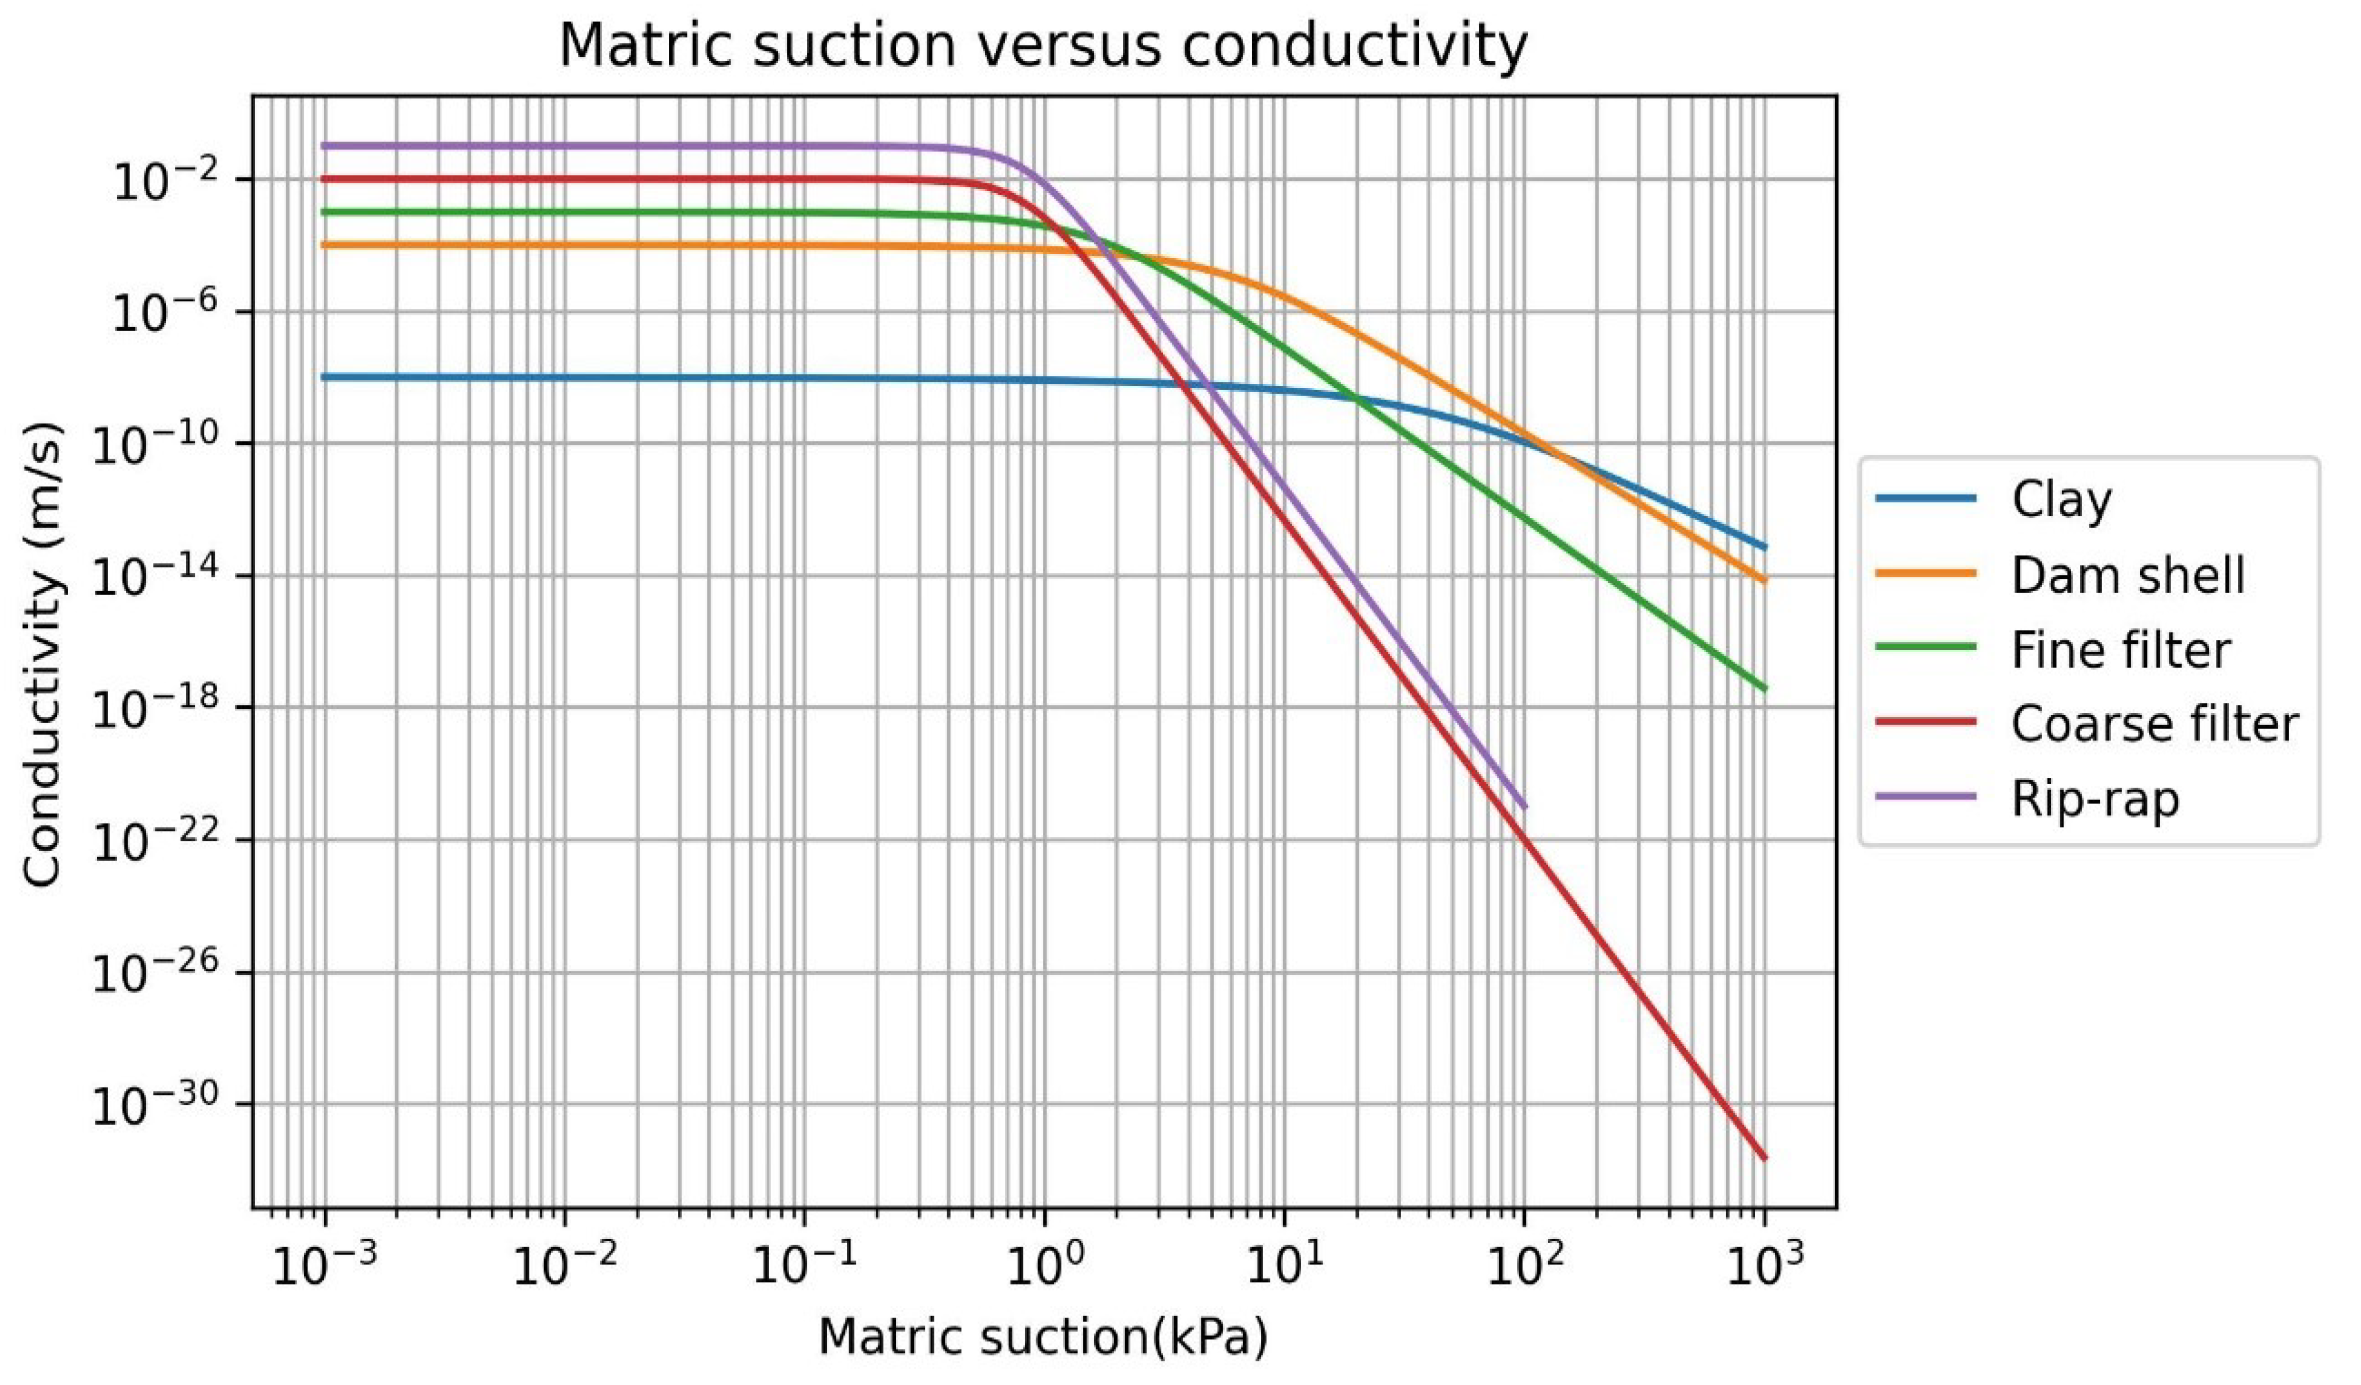
2.2.2. Hydraulic conductivity / Permeability ()
The conductivity defines a fluid flowing through the porous medium under the influence of a hydraulic gradient, expressed in terms of travel distance per time required.
Figure 6.
Hydraulic conductivity versus Matric suction, Khire, M.V., and Bosscher, P. J. [
25].
Figure 6.
Hydraulic conductivity versus Matric suction, Khire, M.V., and Bosscher, P. J. [
25].
Based upon Khire, M.V. and Bosscher, P. J. [
25], hydraulic conductivity was adopted for the different materials used in the dam of MMHPP. The hydraulic conductivity (Van Genuchten, 1980) in relation to the suction range was implemented using SEEP/W.
2.2.3. Angle of friction () and cohesion ()
The angle of internal friction characterizes the shear strength of the soil to slide on the failure plane. Whereas, the cohesive strength of the soil defines the internal bonding or attractive forces between the soil particles, which provides soil materials to retain their shape and resist deformation under loading conditions [
24].
Table 1.
Cohesion and internal angle of friction, Das B. M. [
26].
Table 1.
Cohesion and internal angle of friction, Das B. M. [
26].
| |
Material |
(∘) |
| Soils |
Soft and firm clay of medium to high plasticity, silty clays, loose variable clayey fills, loose sandy silts (use ) |
17-25 |
| |
Stiff sandy clays, gravelly clays, compacted clayey sands and sandy silts, compacted clay fill (use ) |
26-32 |
| |
Gravelly sands, compacted sands, controlled crushed sandstone, and gravel fill, dense well-graded sands (use ) |
32-37 |
| |
Weak weathered rock, controlled fills of roadbase, gravelly and recycled concrete (use ) |
36-43 |
| Rocks |
Chalk |
35 |
| |
Weathered granite |
33 |
| |
Fresh basalt |
37 |
| |
Weak sandstone |
32 |
| |
Weak siltstone |
28 |
| |
Weak mudstone |
32 |
2.2.4. Modules of elasticity (E) and Poisson’s ratio (v)
Modules of elasticity help to determine the stiffness of the material, it shows how the material deforms elastically under applied stress and returns to its original position or deforms permanently [
27]. Whereas, Poisson’s ratio defines the ratio of lateral strain and longitudinal strain [
27],
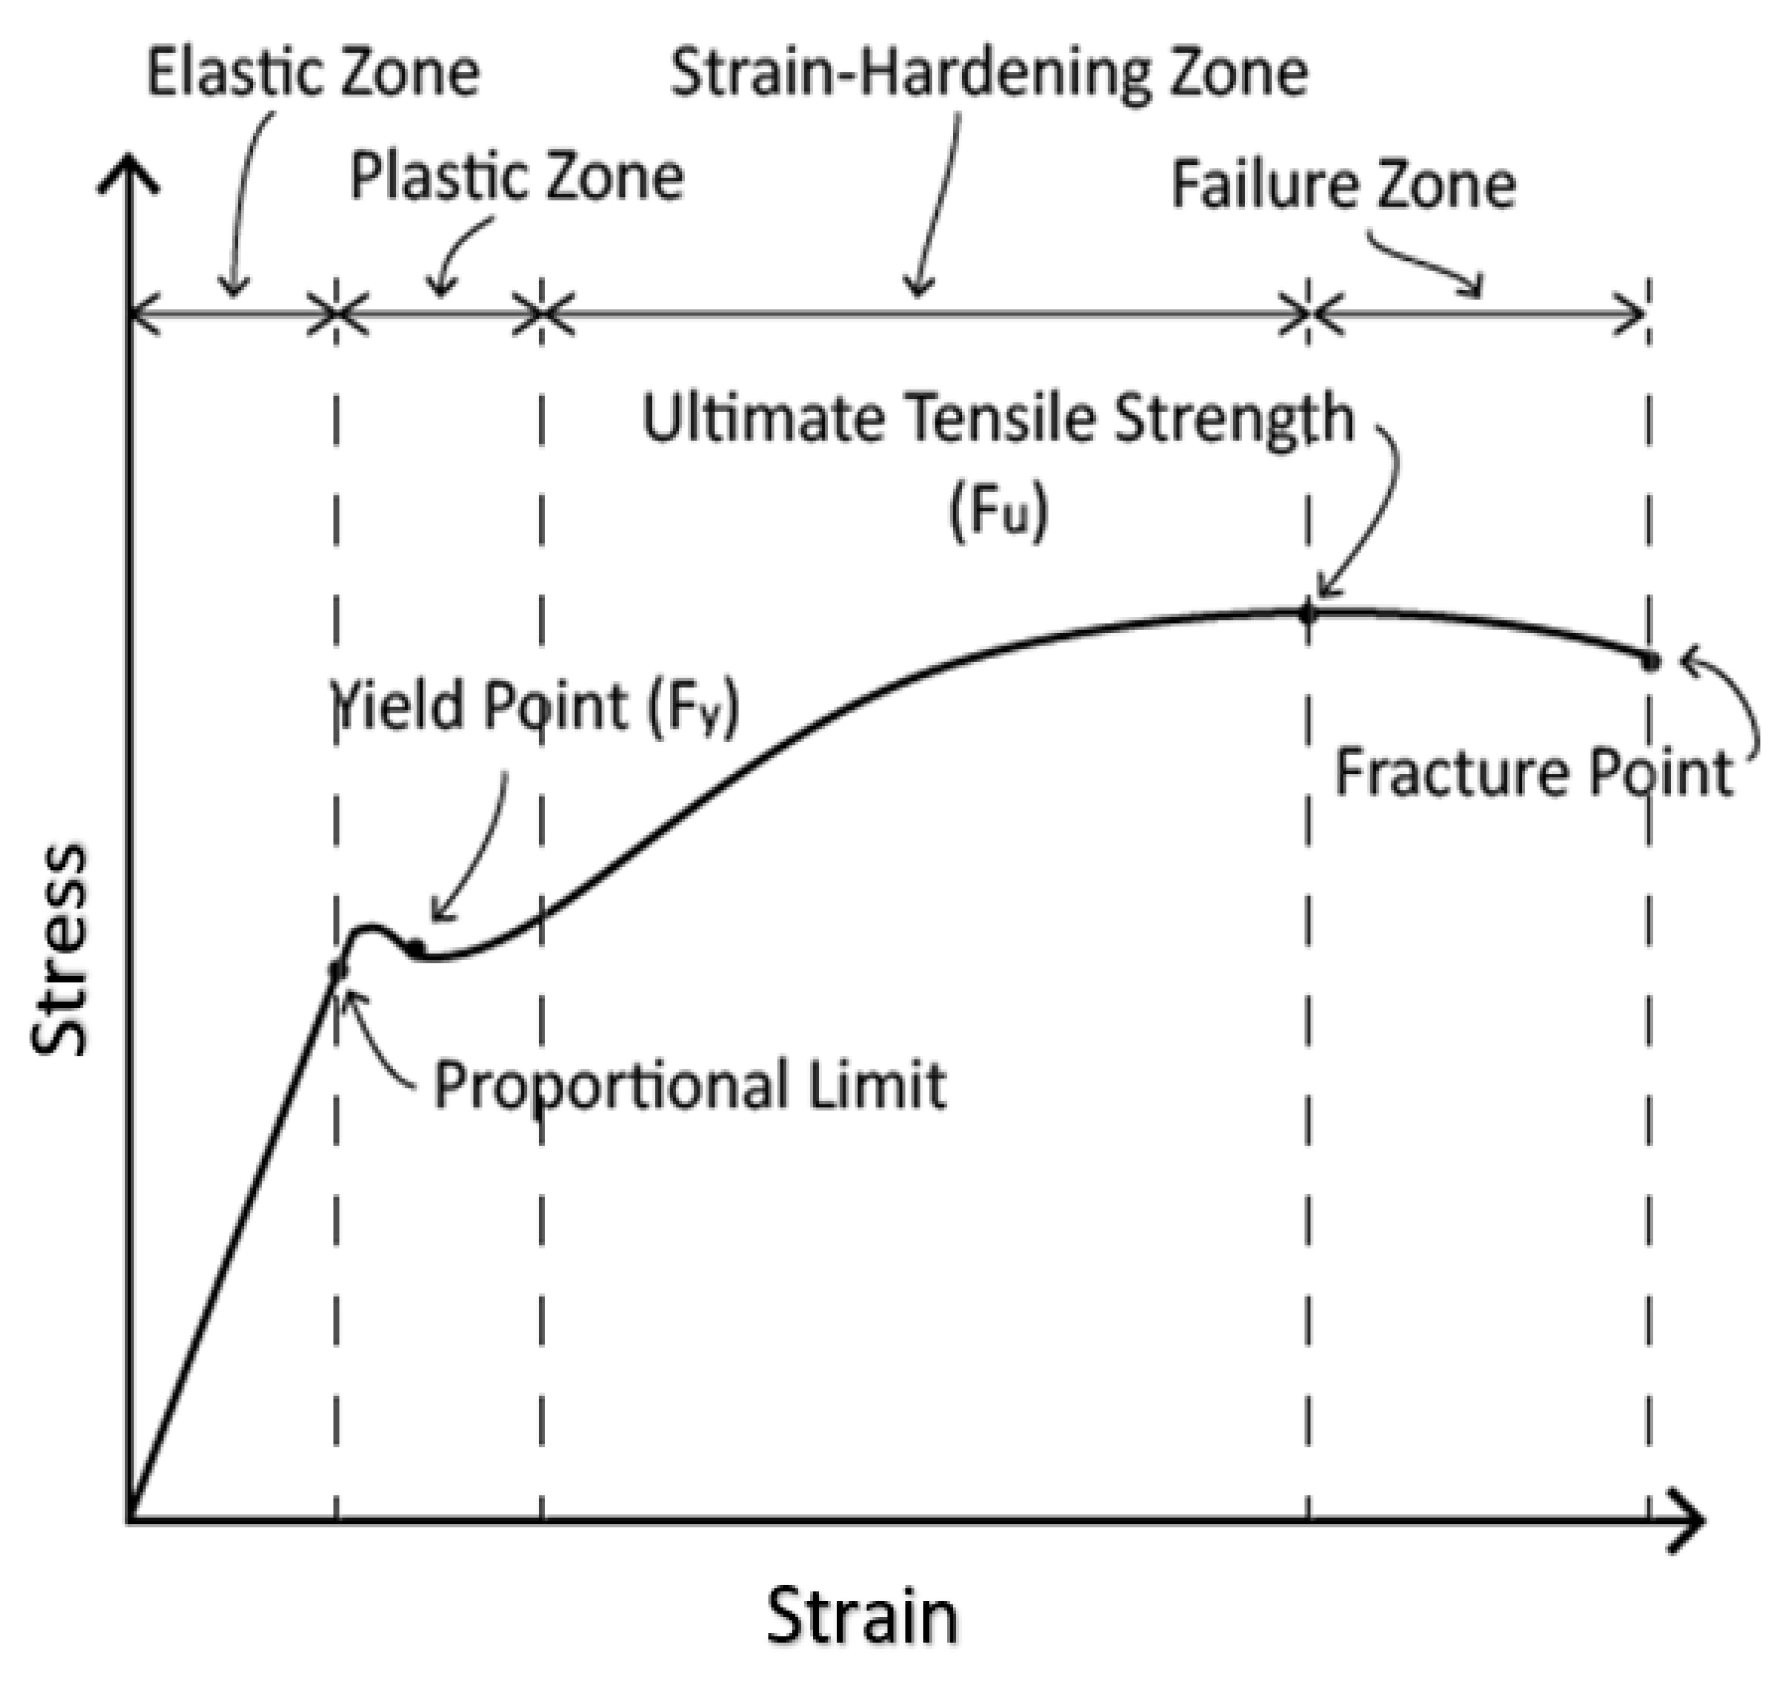
Figure 7, illustrates the relationship between the stress and strain under loading conditions.
The experimental lab test results, elastic constants of various soils modified after U.S. Department of the Navy (1982) and Bowels (1988) (AASHTO Table 10.6.2.2.3b-1) values were adopted to define the Modulus of elasticity and Poisson’s ratio of soil materials for the dam [
28].
Table 2.
Elastic constants of various soils materials, (AASHTO Table 10.6.2.2.3b-1) [
28].
Table 2.
Elastic constants of various soils materials, (AASHTO Table 10.6.2.2.3b-1) [
28].
| Soil type |
Typical range of Young’s Modulus (MN/m²) |
Poisson’s ratio |
| Clay: Soft sensitive |
2.4-14.4 |
0.4-0.5 undrained |
| Medium stiff to stiff |
14.4-48 |
|
| Very stiff |
48-95.7 |
|
| Loess Silt |
14.4-57.5 |
0.1-0.3 |
| |
2-19.2 |
0.3-0.35 |
| Fine Sand: Loose |
7.7-11.5 |
0.25 |
| Medium Dense |
11.5-19.2 |
|
| Dense |
19.2-28.7 |
|
| Sand: Loose |
9.6-28.7 |
0.25-0.35 |
| Medium Dense |
28.7-48 |
0.3-0.4 |
| Dense |
48-76.6 |
|
| Gravel: Loose |
28.7-76.6 |
0.2-0.35 |
| Medium Dense |
76.6-95.7 |
0.3-0.4 |
| Dense |
95.7-191.52 |
|
2.3. Governing equations
2.3.1. Darcy’s Law
SEEP/W has been formulated on the basis that the flow of water through the soil follows Darcy’s law [
28,
29]:
Where,
q= specific discharge
k = hydraulic conductivity and
i = gradient of the total hydraulic head
2.3.2. 2D Partial differential flow water equation
The governing partial differential equation for two-dimensional seepage implemented in SEEP/W:
Where,
H = total head
= hydraulic conductivity in the x- direction
= hydraulic conductivity in the y-direction
Q = applied boundary flux
= volumetric water content
t = time
The GeoStudio solver uses Finite Element Method (FEM) to solve the partial differential equation considering the linear as well as quadratic mesh. For some analyses, such as slope stability and seepage analysis, linear meshes are sufficient to provide accurate results. However, for more complex analyses, such as deformation and stress analysis, quadratic meshes are implemented to capture the curvature and discontinuities of the solution.
2.3.3. Hydraulic conductivity/permeability ()
The hydraulic conductivity (Van Genuchten, 1980) in relation to the suction range has been implemented in the model [
25].
Where,
= hydraulic conductivity
= saturated hydraulic conductivity
a,n,m = curve fitting parameters
n = express as 1/(1-m)
= required suction range
2.3.4. Coefficient of volume compressibility ()
The coefficient of volume compressibility is expressed as the reciprocal of modules of elasticity often considered equivalent to the coefficient obtained from the 1D consolidation test [
27].
Where,
M = modulus of elasticity
= coefficient of compressibility
= initial void ratio
2.3.5. Mohr-Coulomb theory
The shear strength is defined by the Mohr-Coulomb equation [
27]:
Where,
= stress,
= pore-water pressure,
c and are the intercept on the shear stress axis and the slope of the Mohr-Coulomb failure envelope
Figure 8.
Mohr-Coulomb circle with the failure envelope [
27,
30].
Figure 8.
Mohr-Coulomb circle with the failure envelope [
27,
30].
The Mohr-Coulomb equation is modified to account for suction strength [
31]:
Where,
= pore-air pressure,
( – ) = soil suction,
= volumetric water content,
= residual water content,
= saturated water content.
2.3.6. Methods for Factor of Safety (FOS)
Several methods have been developed to evaluate the factor of safety against sliding over the past years. The difference between the methods depends upon the consideration of inter-slice normal and shear forces and relationships, as well as the force and moment equilibrium [
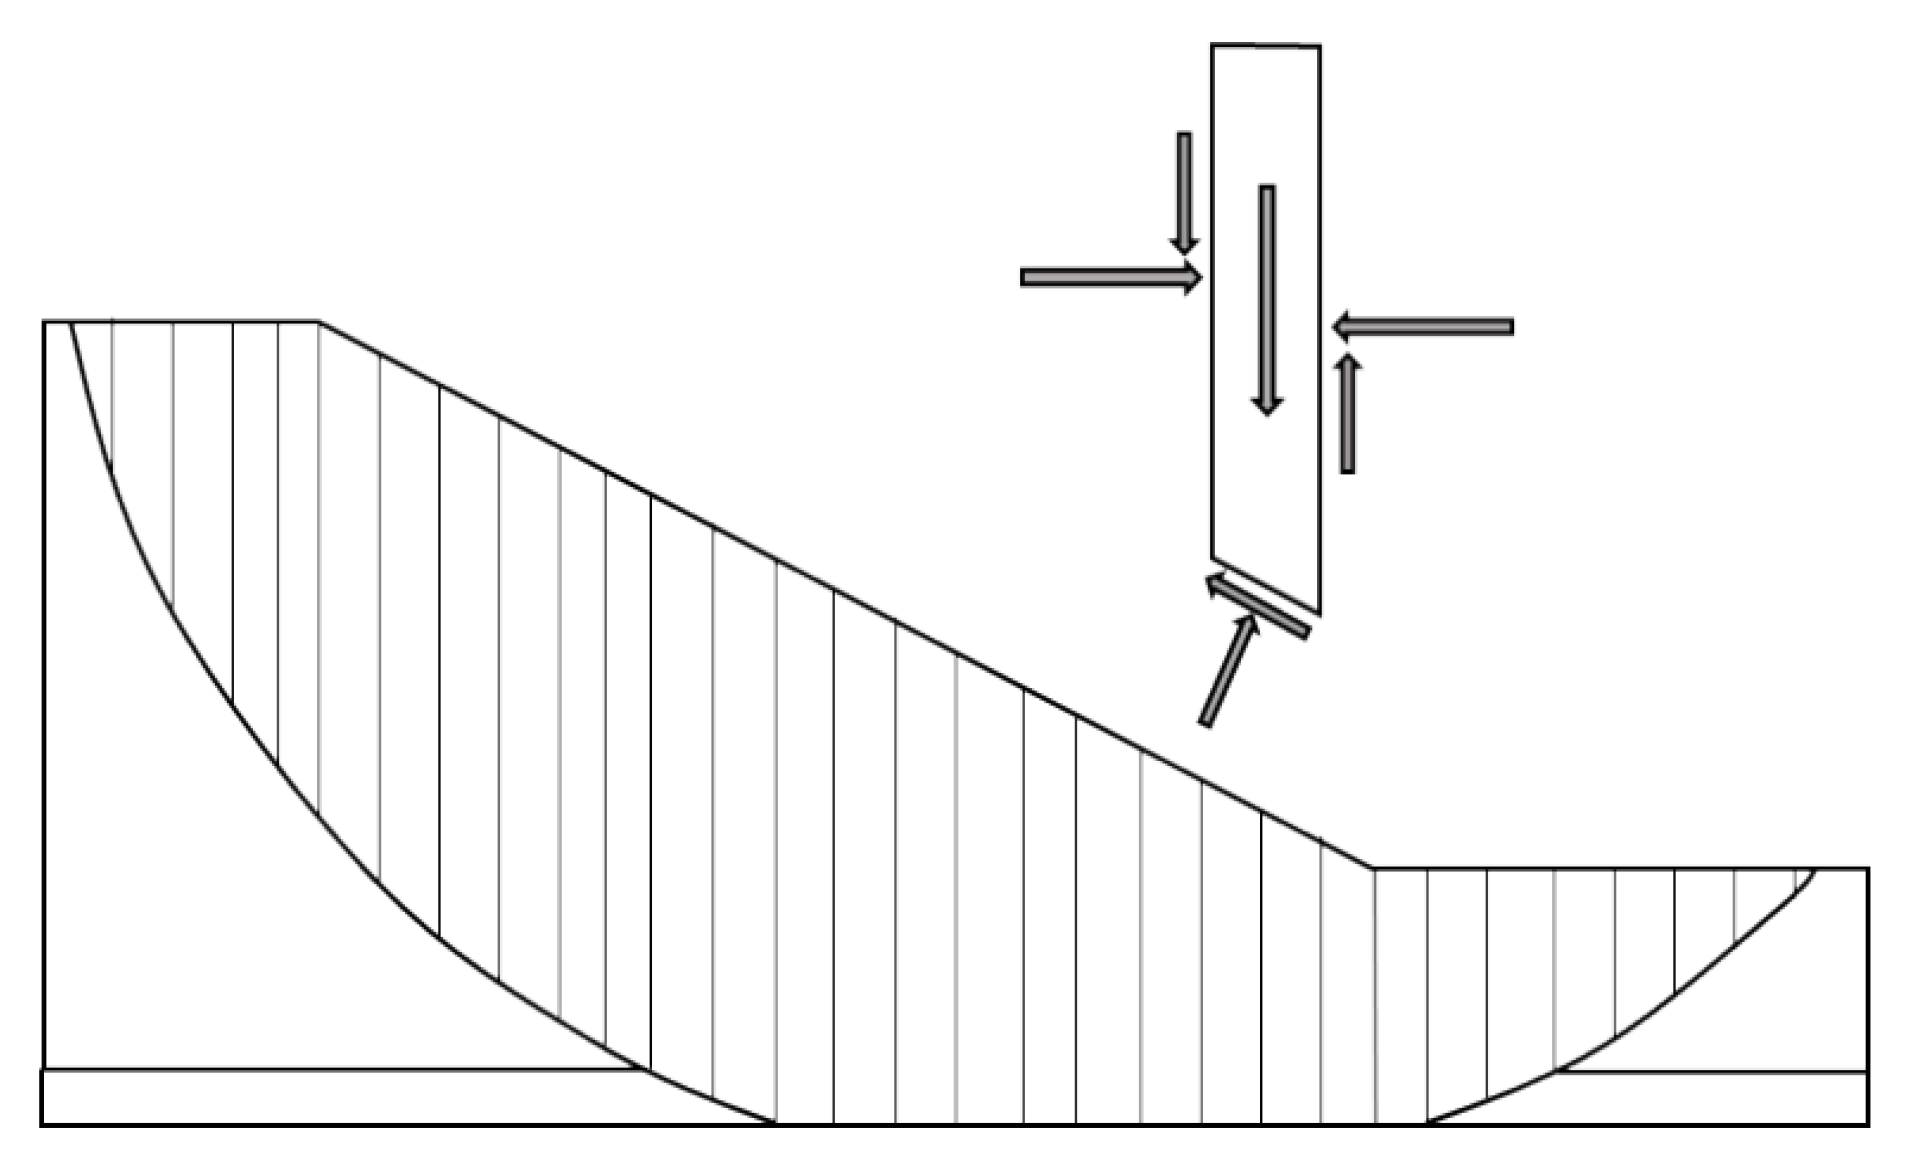
31]. The typical forces acting upon the slice are represented in
Figure 9.
Table 3.
Inter-slice force characteristics and relationships (SLOPE/W) [
31].
Table 3.
Inter-slice force characteristics and relationships (SLOPE/W) [
31].
Table 4.
Equations of statics satisfied (SLOPE/W) [
31].
Table 4.
Equations of statics satisfied (SLOPE/W) [
31].
2.3.7. Limit Equilibrium method:
The GLEM factory of safety for the horizontal force equilibrium (SLOPE/W) [
31]:
The GLEM factory of safety with respect to the moment equilibrium (SLOPE/W) [
31]:
Where,
c = cohesion
= angle of friction
u = pore water pressure
W = slice weight
D = concentrated point load
, R, x, f, d, = geometric parameters
= inclination of slice base
2.3.8. Stress-based FEM method:
The normal force at the base of the slice is primarily unknown in a Limit Equilibrium formulation, plotting the initial in-situ stress distribution provides the stress along the slip surface [
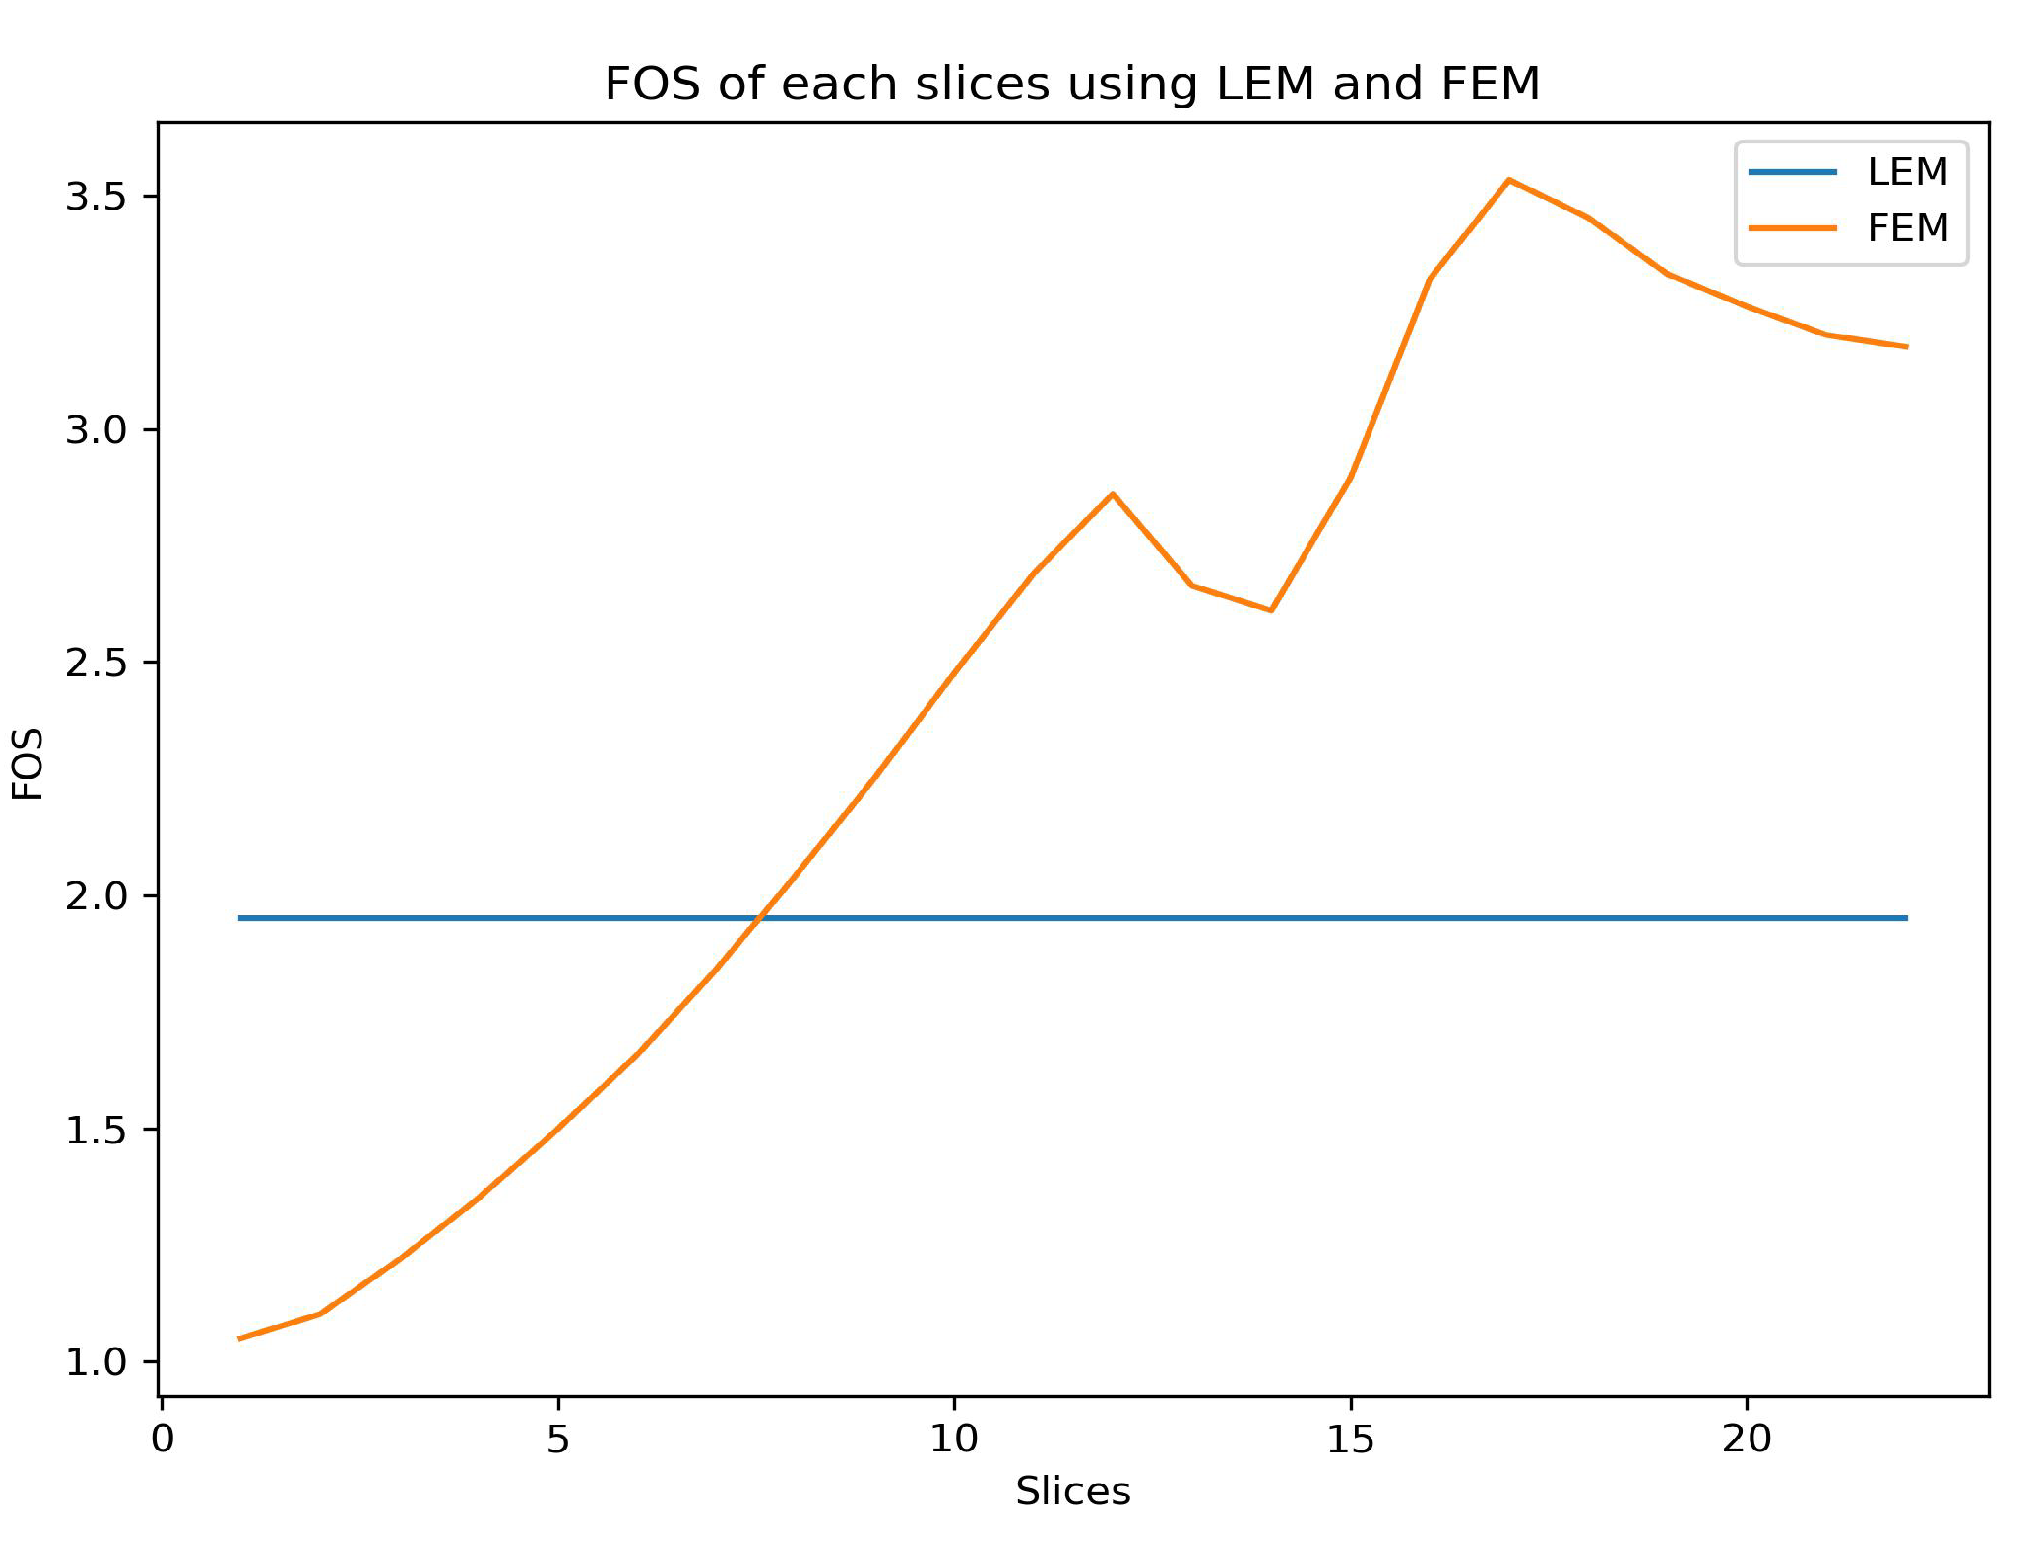
8]. The FEM considers the stress-strain distribution within the soil mass considering the soil properties. Therefore, FOS in each slice is different in stress-based FEM whereas, the FOS is constant for all the slices along the slip circle in LEM [
8].
2.4. Model parameters
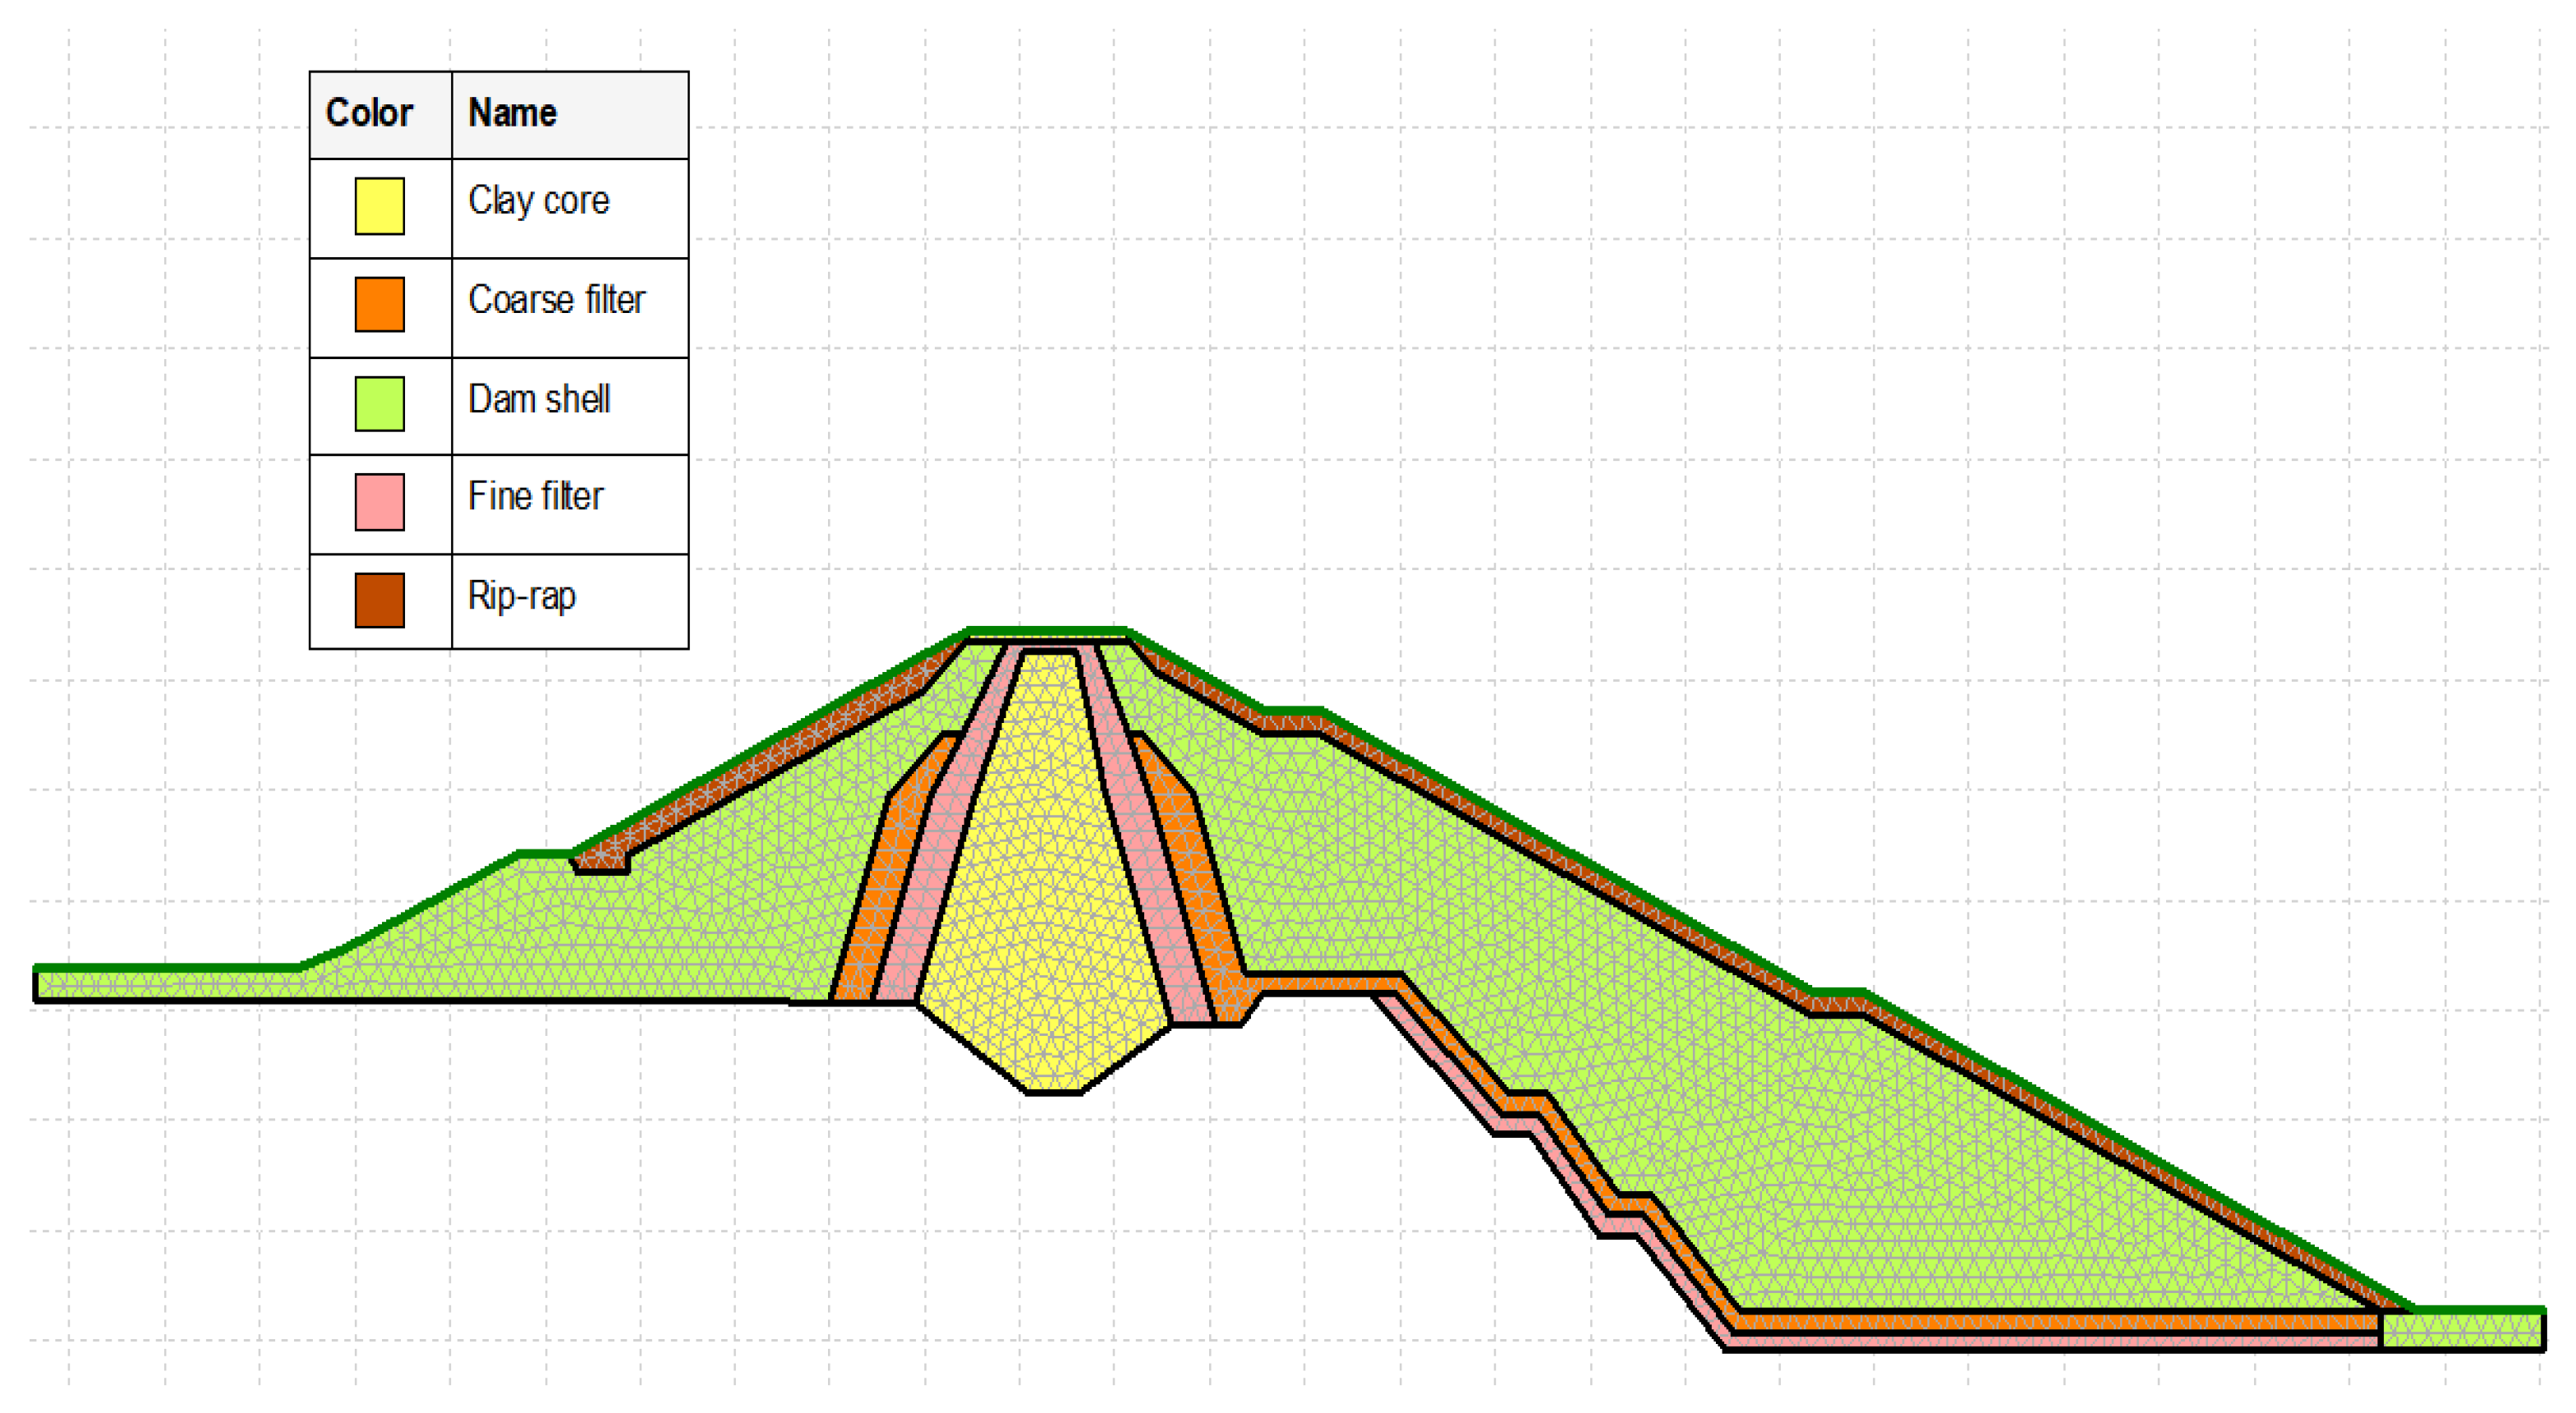
The 2D unstructured meshes consisting of 1995 nodes and 3670 elements were generated with the provided
Table 5 material properties.
Figure 10.
2D geometry section of the dam.
Figure 10.
2D geometry section of the dam.
Table 5.
Material properties of different layers.
Table 5.
Material properties of different layers.
Figure 11.
Volumetric water content versus Matric suction curve
Figure 11.
Volumetric water content versus Matric suction curve
Figure 12.
Hydraulic conductivity versus Matric suction curve
Figure 12.
Hydraulic conductivity versus Matric suction curve
2.4.1. Correlation matrix
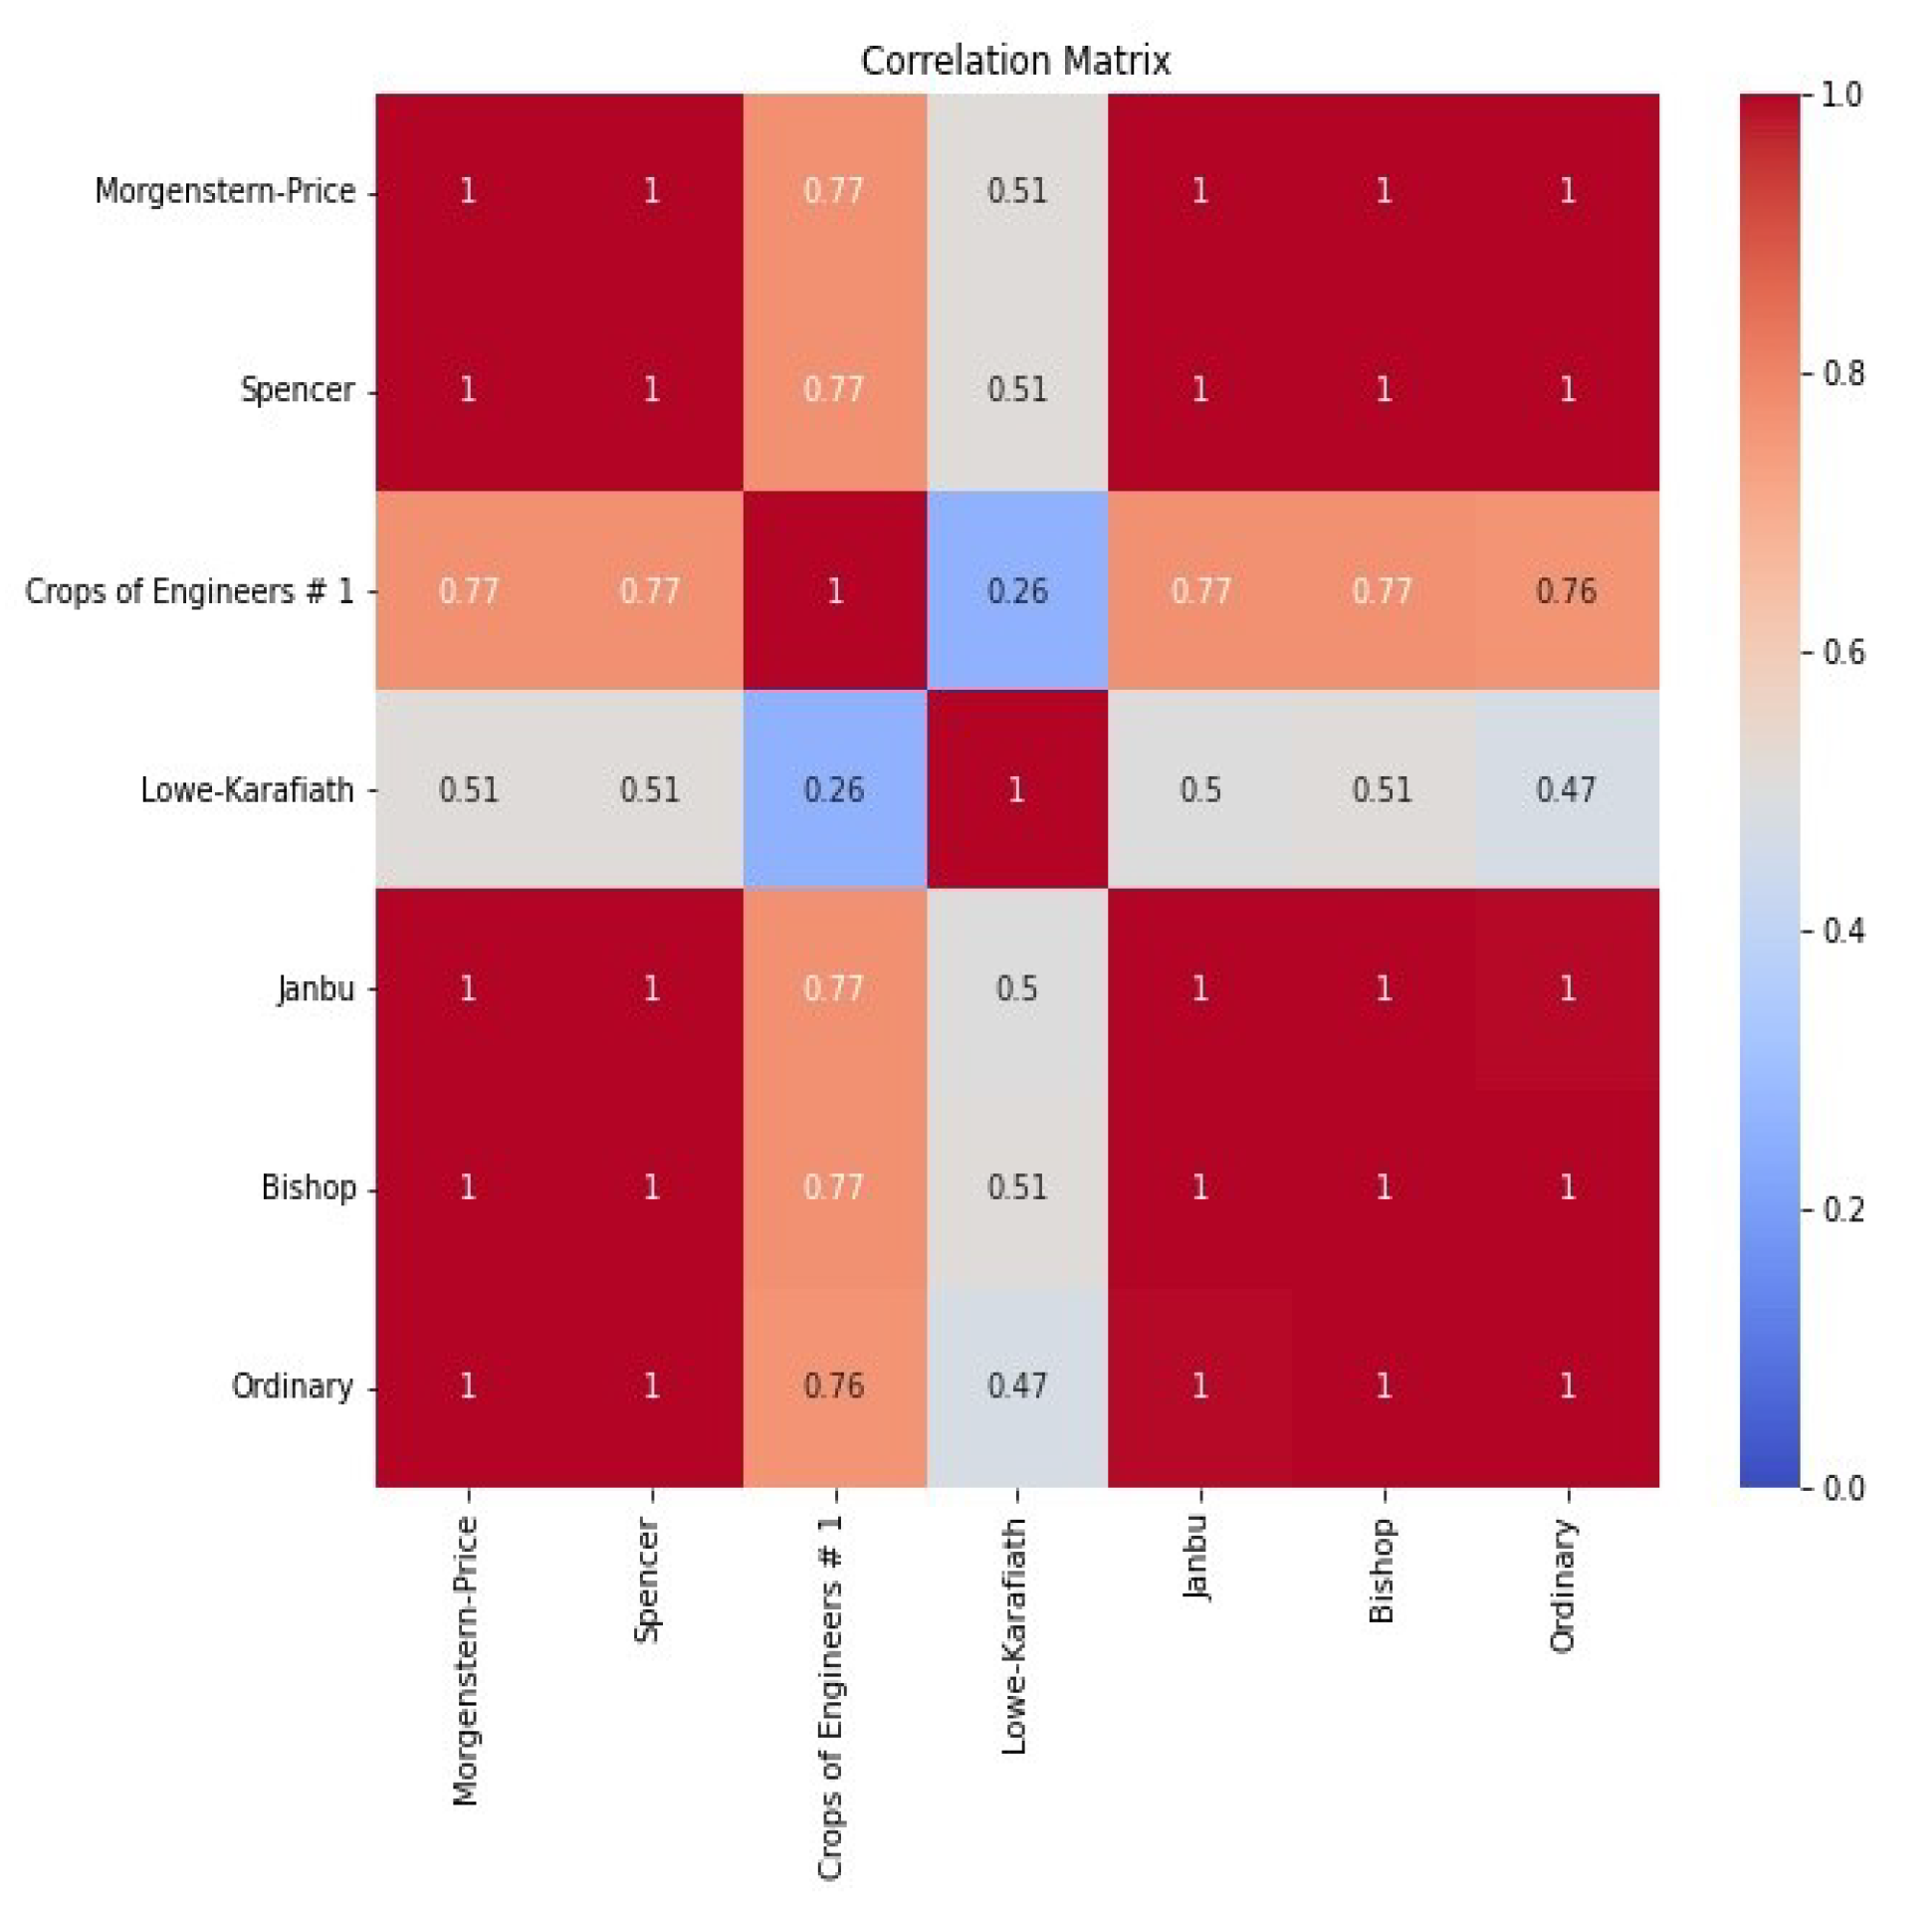
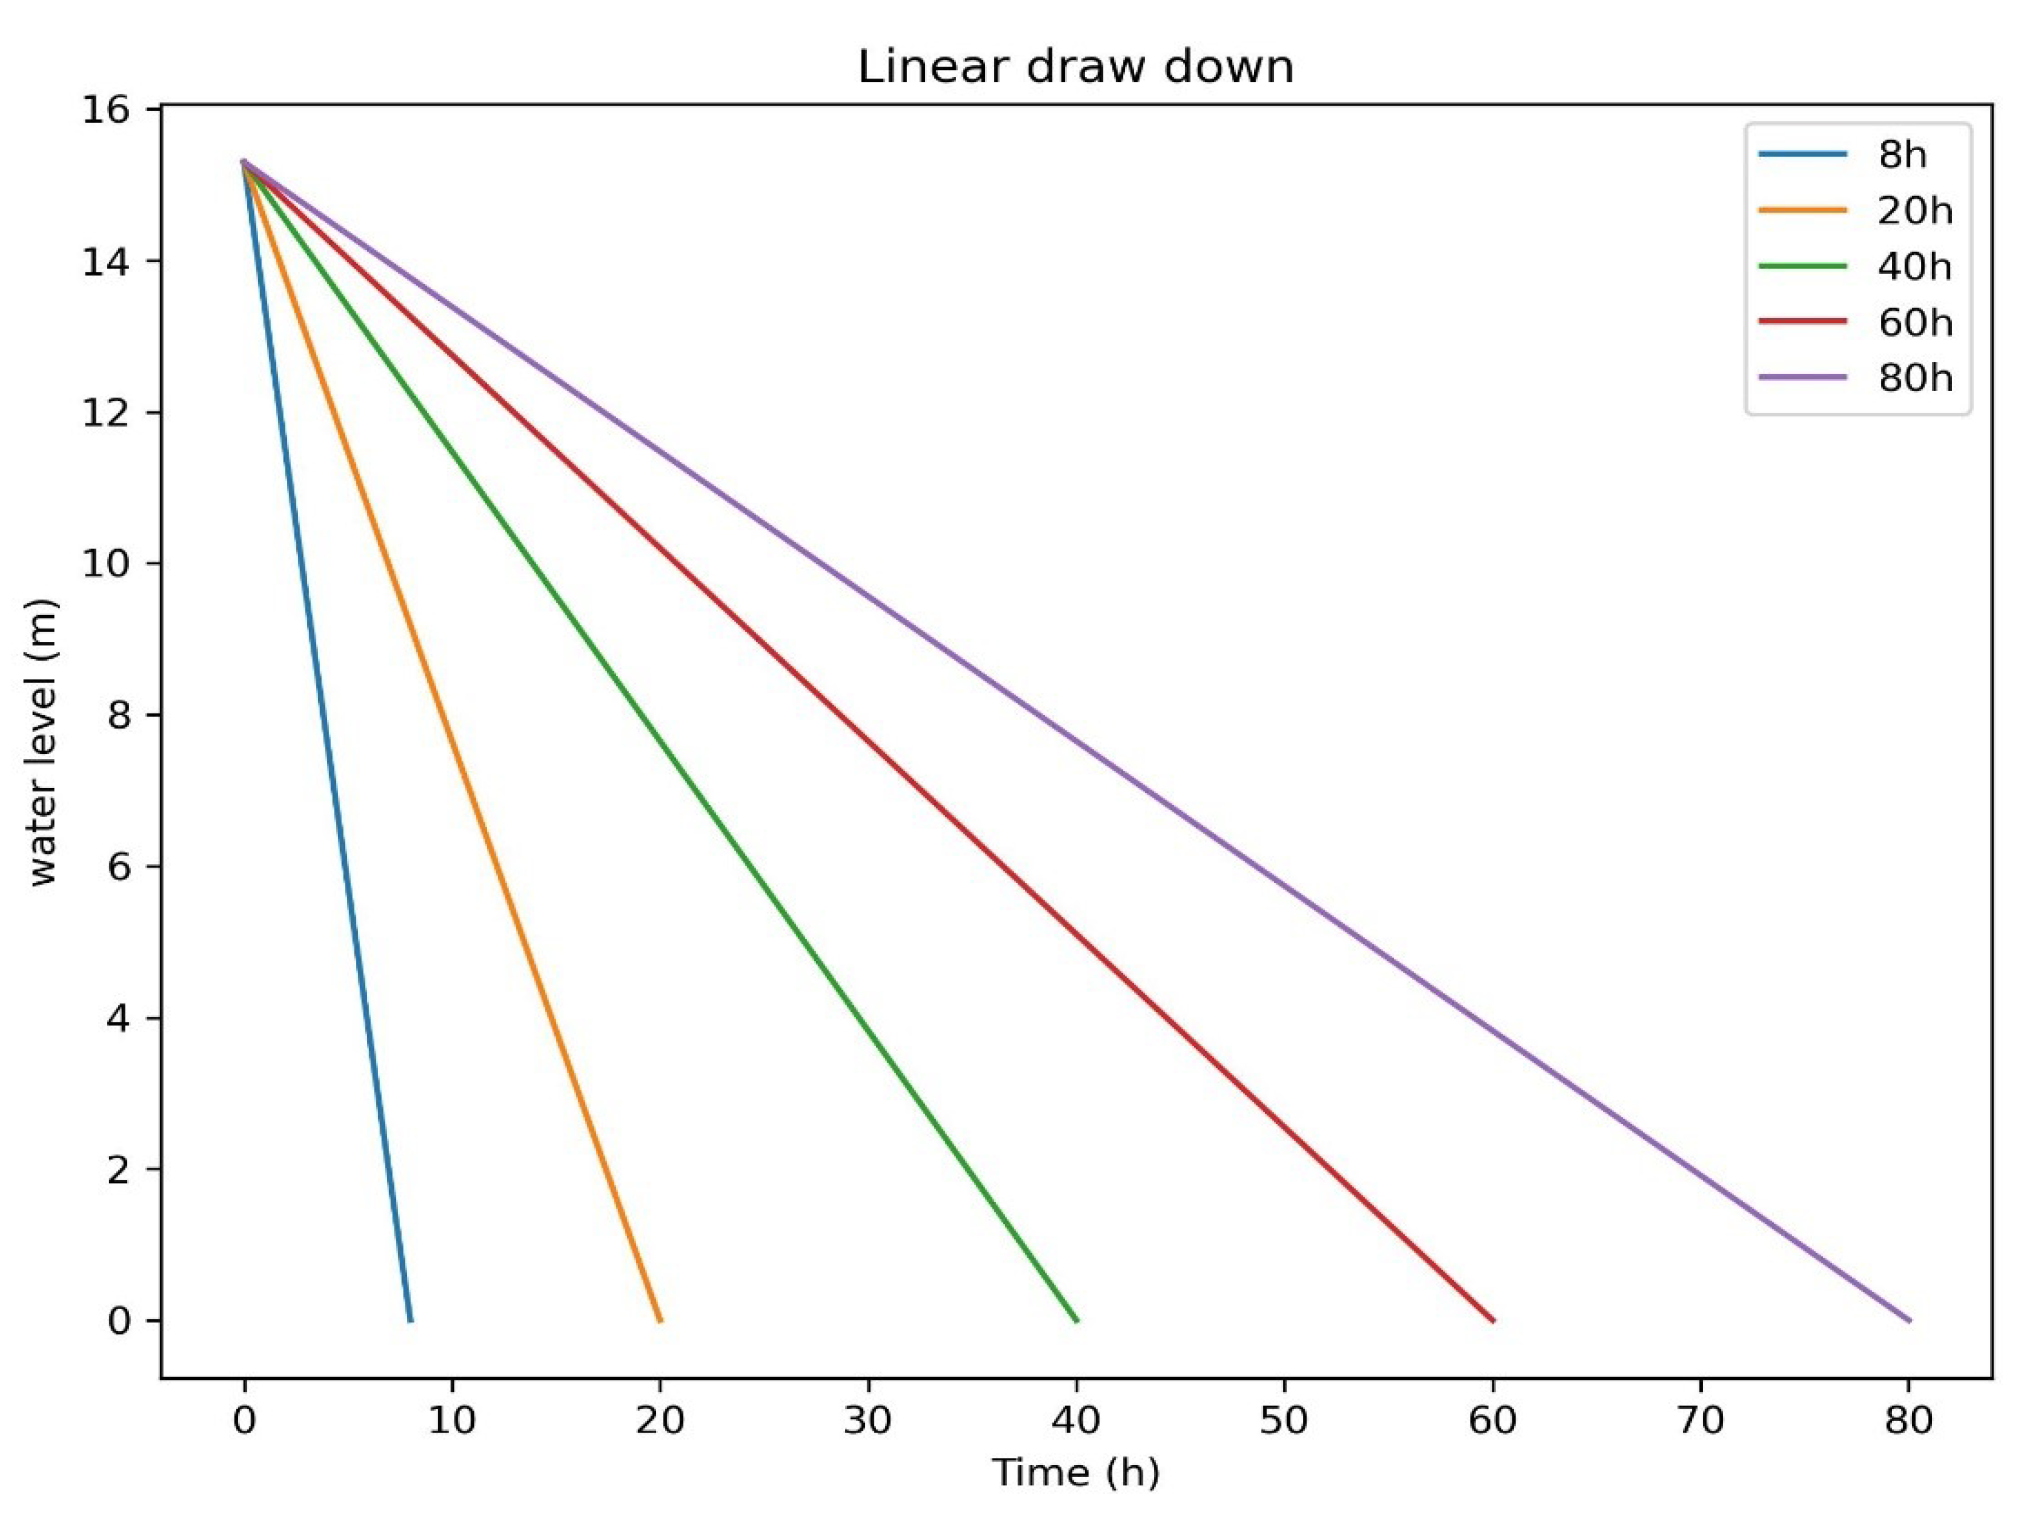
Using a case study of October 2012, a linear draw-down of 8 hours for reservoir flushing was considered. The time-dependent critical FOS correlation matrix was plotted using Morgenstern-Price, Spencer, Crops of Engineers , Lowe-Karafiath, Janbu, Bishop, and Ordinary for the Limit Equilibrium Method.
The Morgenstern-Price, Spencer, Janbu, Bishop, and Ordinary were highly correlated as plotted in
Figure 13. The widely used Morgenstern-Price method was adopted for the LEM as it satisfies both the force and moment equilibrium conditions considering inter-slice normal and shear forces,
Table 3 and
Table 4.
3. Results
3.1. Steady-state
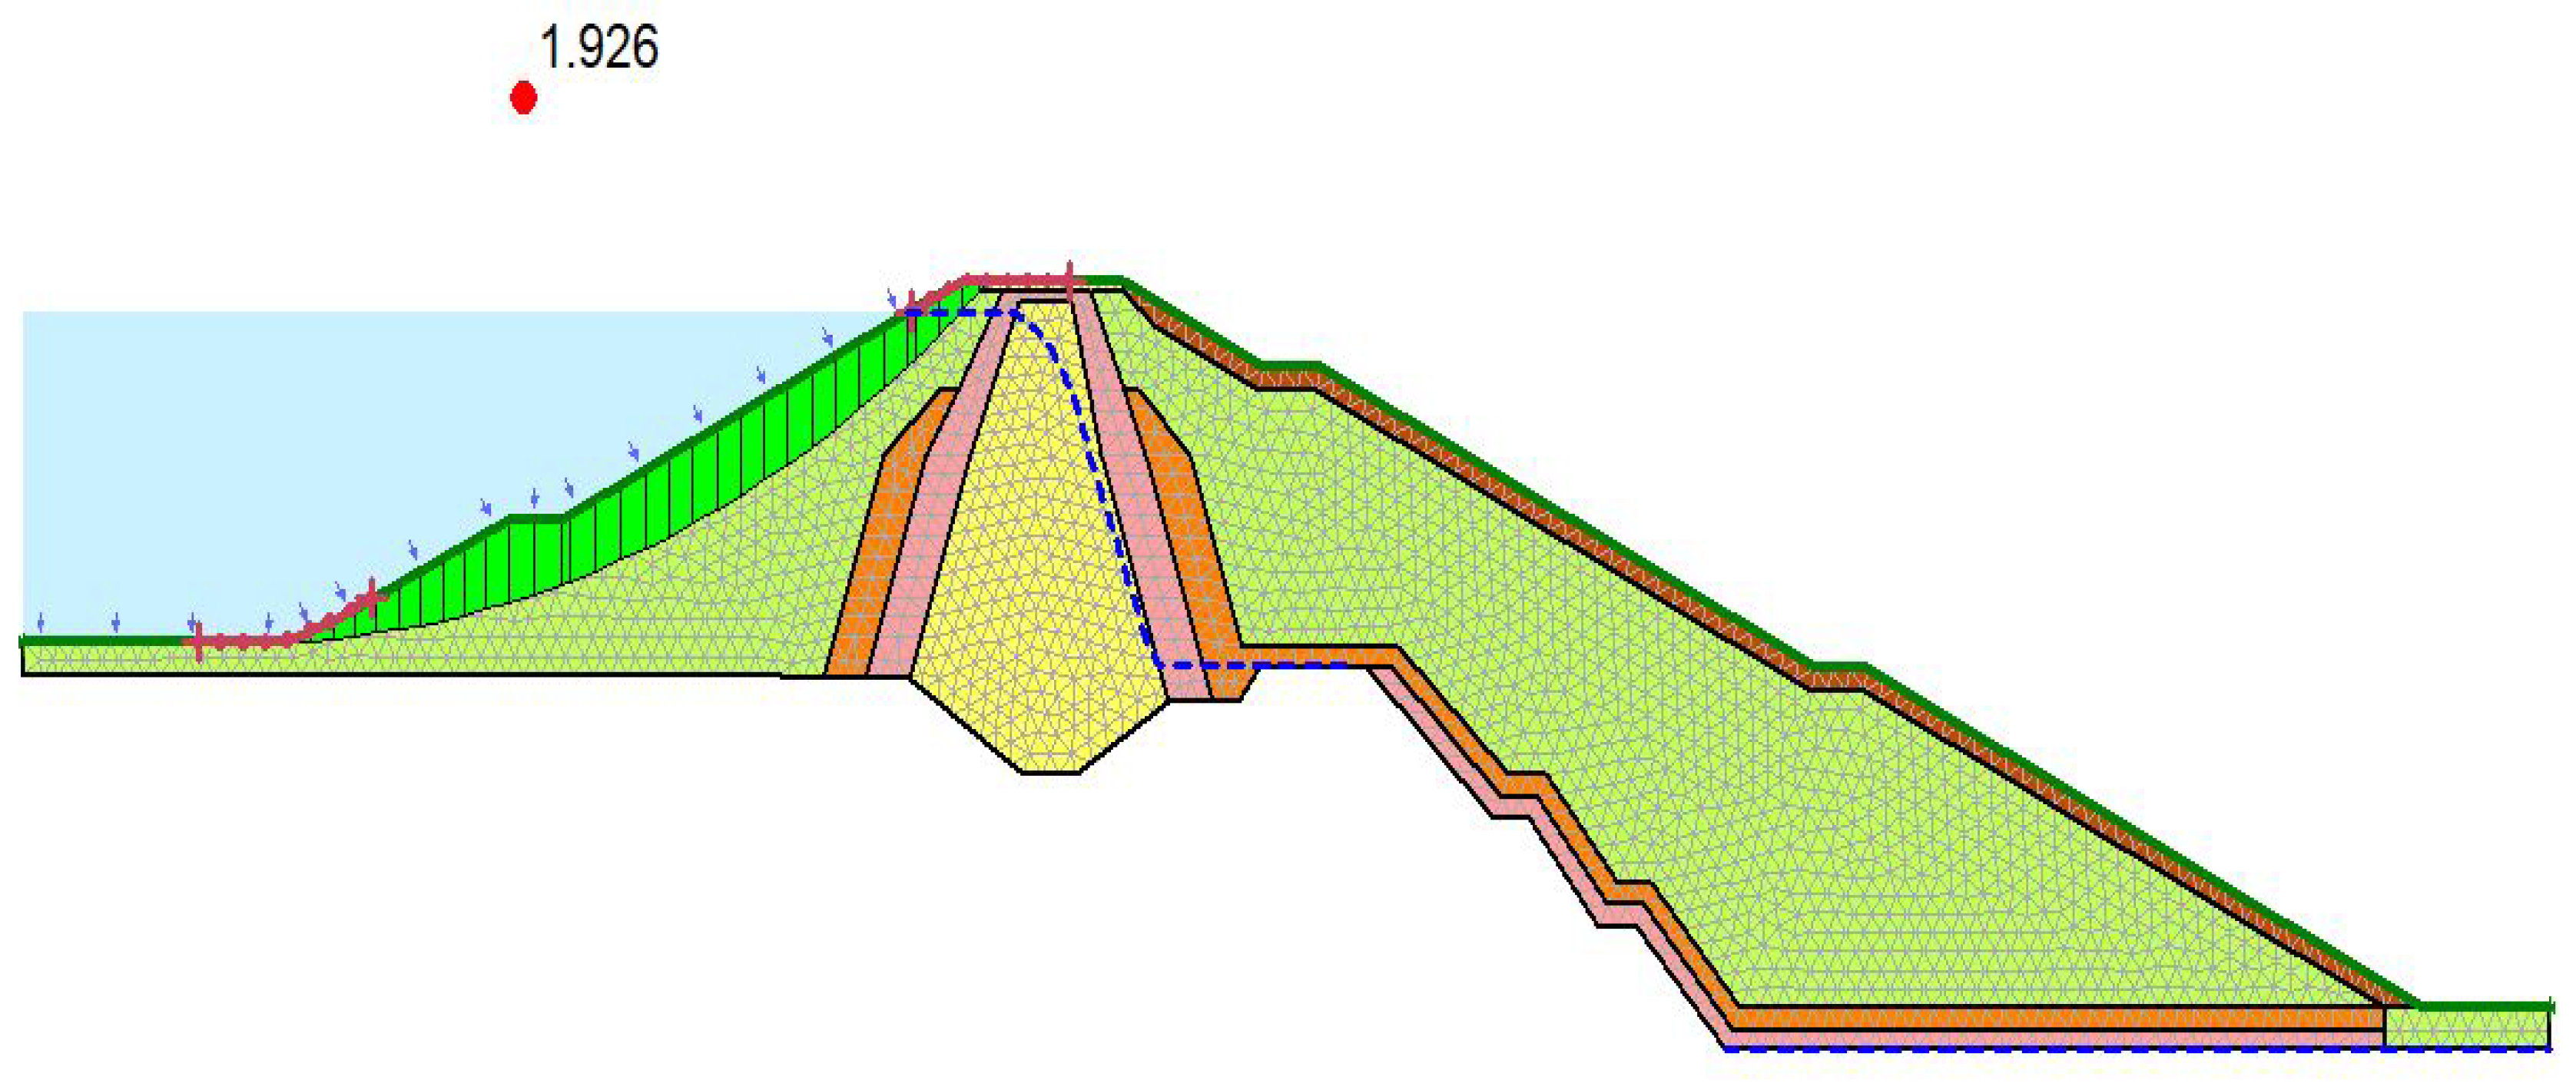
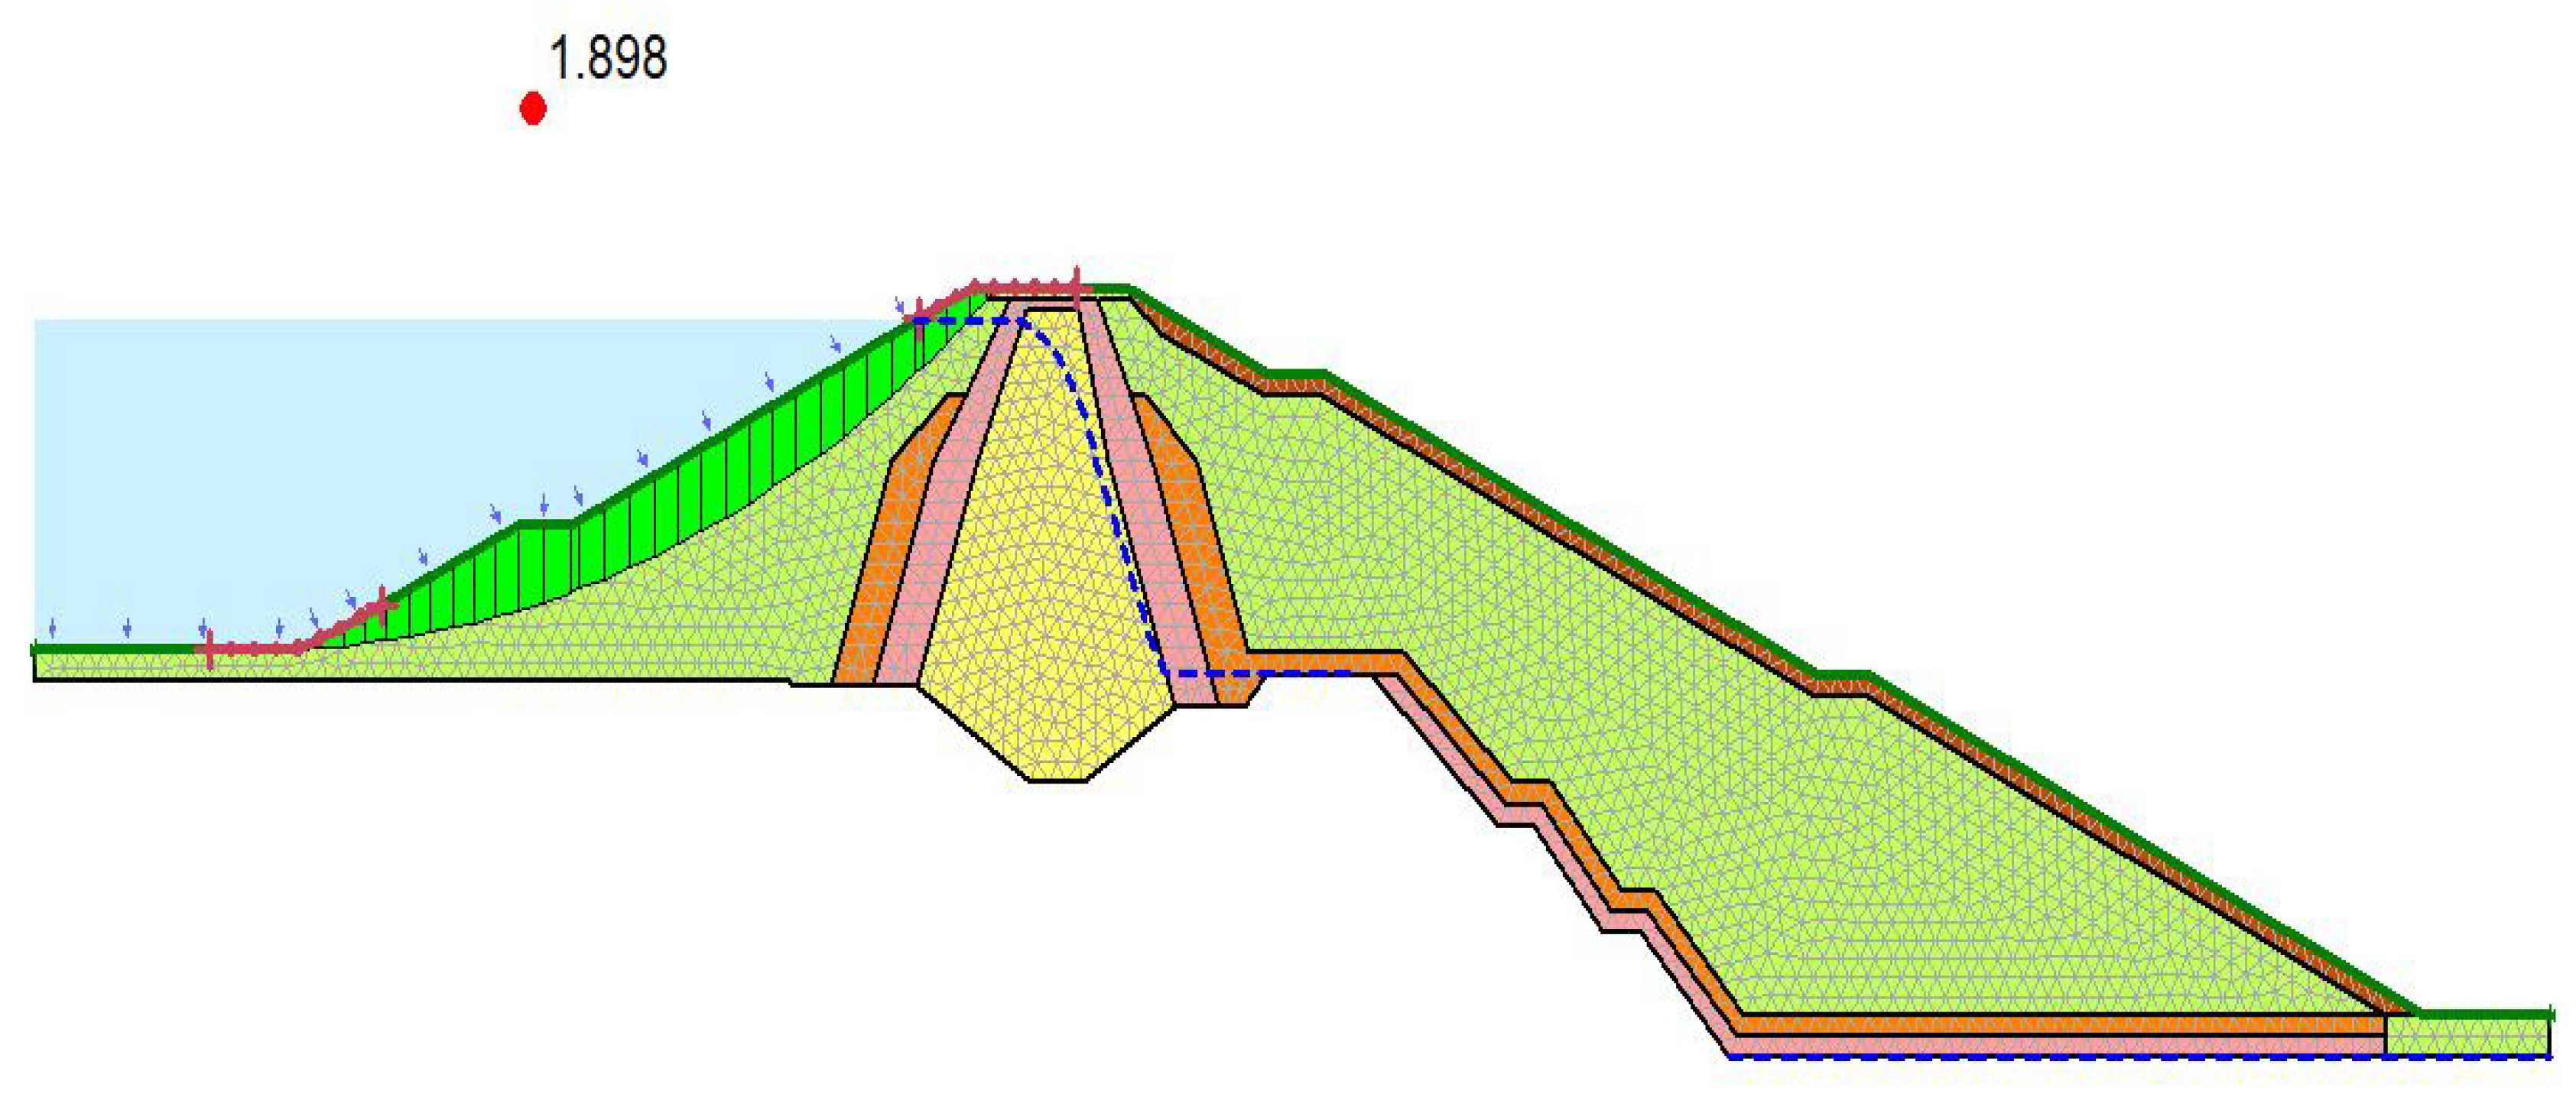
The steady-state FOS was evaluated using LEM and stress-based FEM to analyze the initial state stability of the dam considering the maximum water level in the reservoir.
The Limit Equilibrium Method applied by Morgenstern-Price was adopted to estimate the FOS against sliding at the upstream face of the dam. Whereas the Finite Element stress method applied with in-situ stress was adopted by considering the initial stress of the dam.
Figure 14.
Upstream slope stability analysis using LEM.
Figure 14.
Upstream slope stability analysis using LEM.
The critical slip circle with FOS of 1.92 was evaluated at the upstream side of the dam considering the maximum reservoir water level using LEM.
Figure 15.
Upstream slope stability analysis using FEM
Figure 15.
Upstream slope stability analysis using FEM
The critical slip circle with FOS of 1.89 was evaluated at the upstream side of the dam considering the maximum reservoir water level using stress-based FEM.
3.1.1. Stress distribution
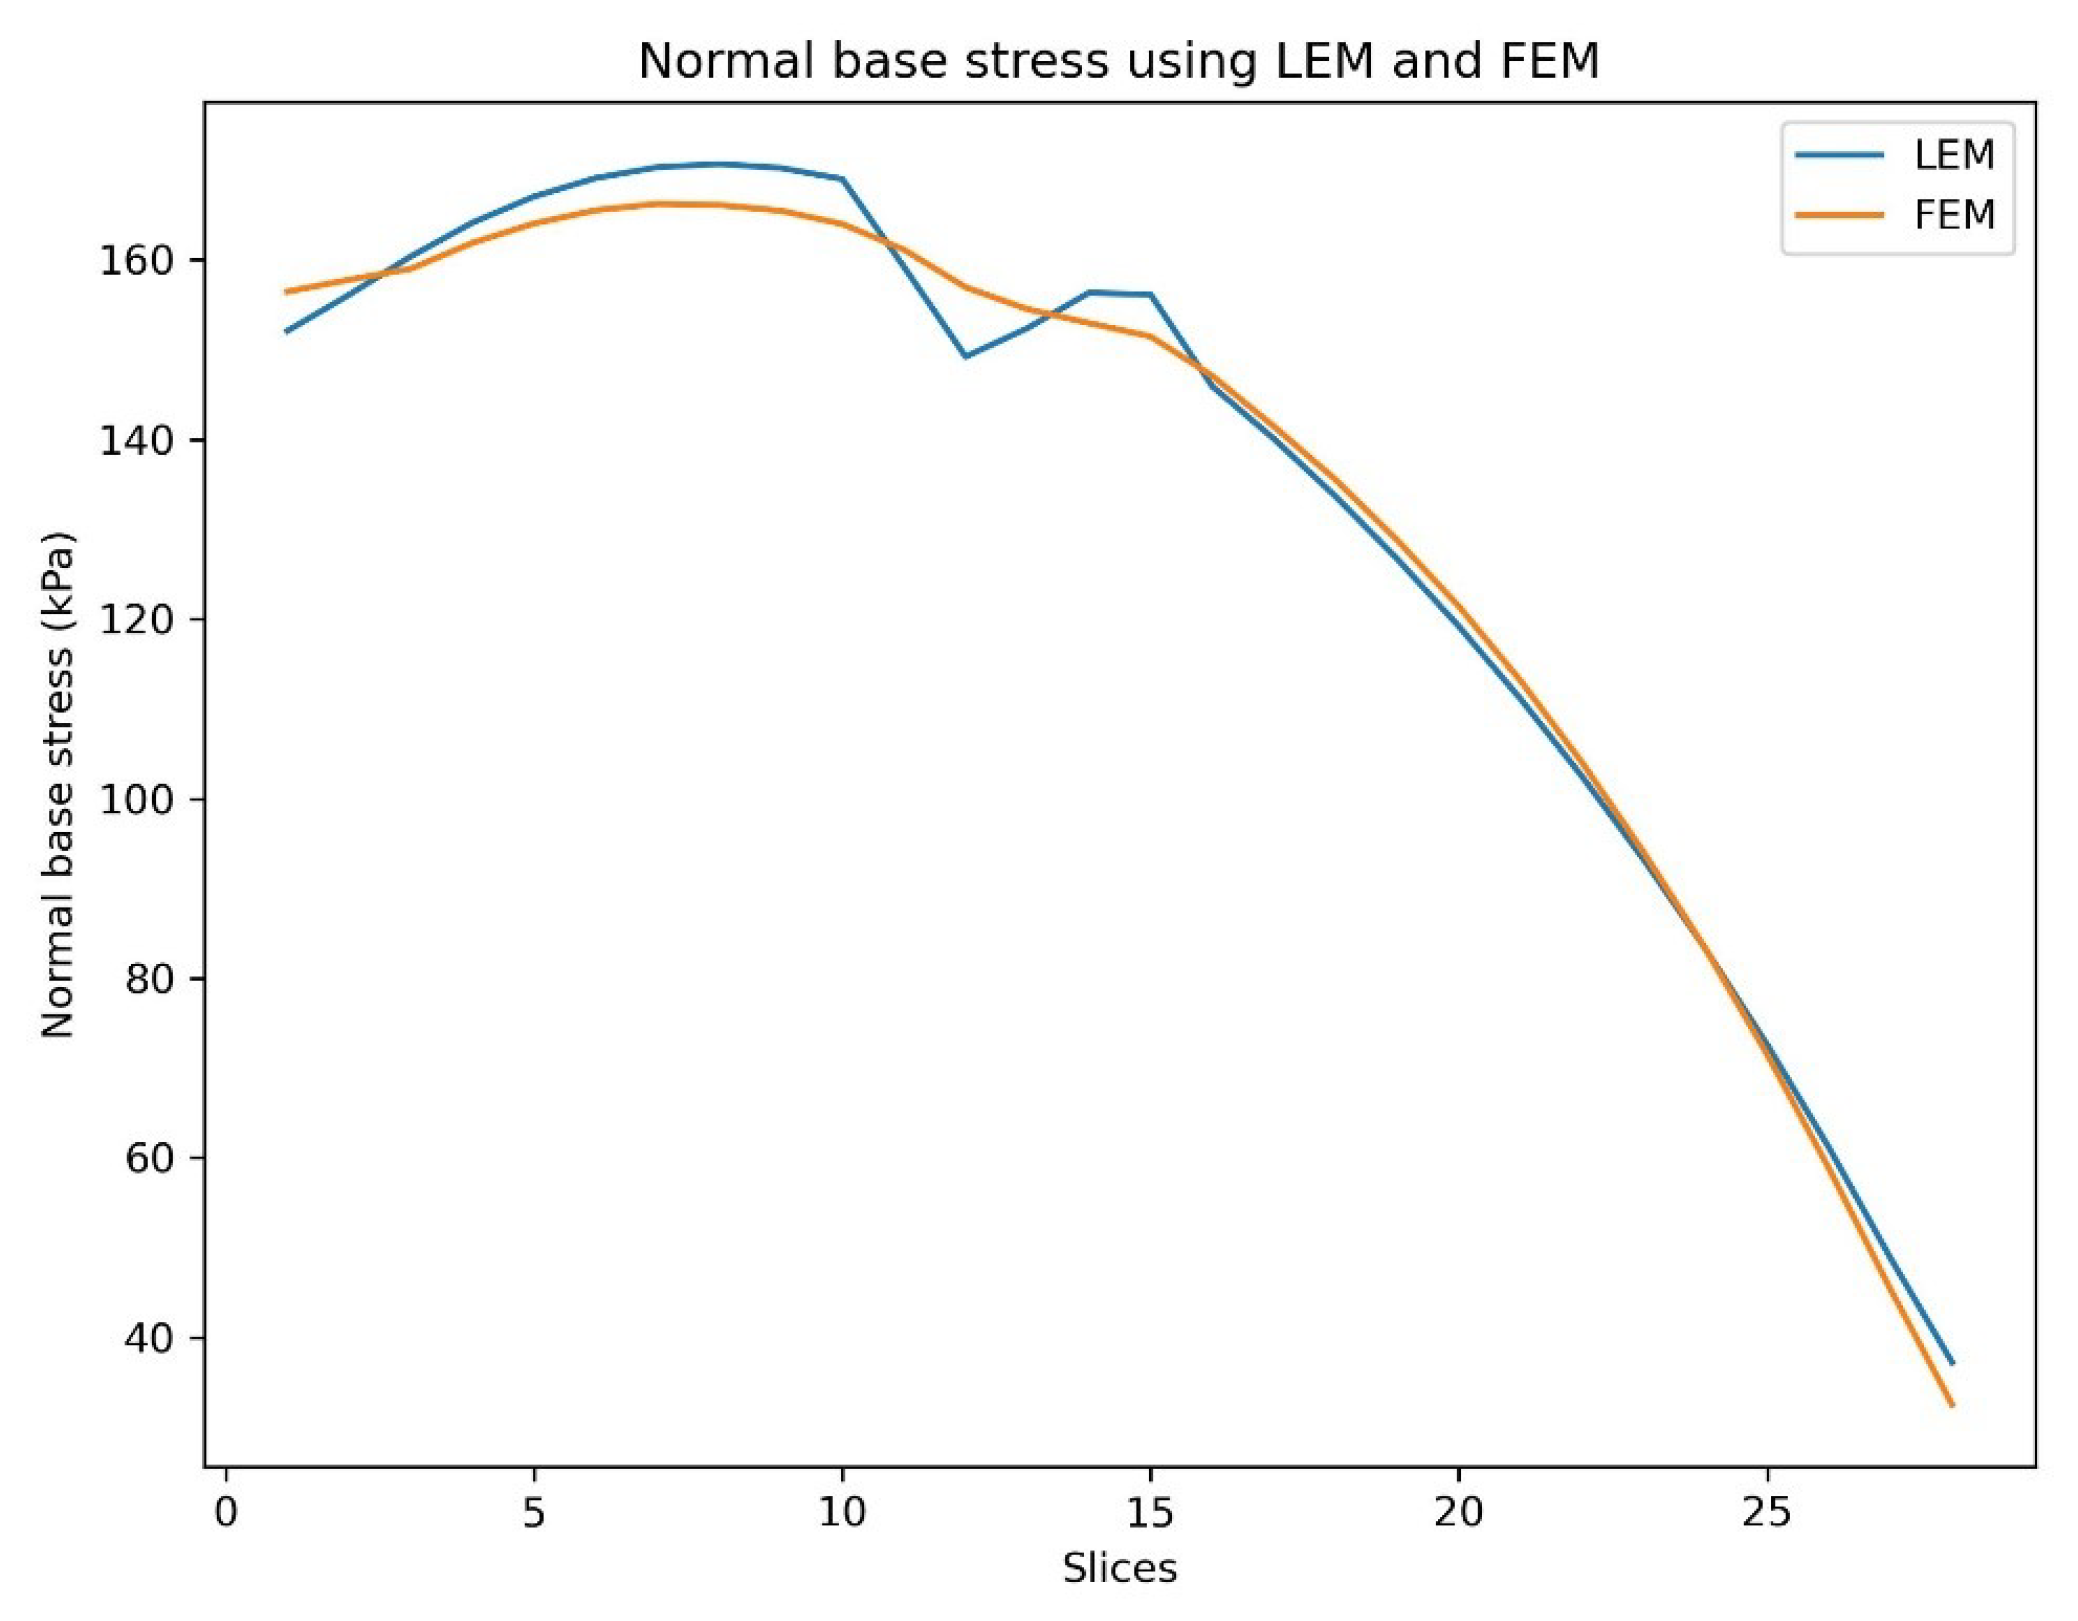
Normal base stress acting upon the slice was evaluated using LEM and FEM. Each slice’s normal base stresses were plotted considering the equal radius i.e. 62.4m of slip circle.
The stress distribution at the base of each slice using LEM and FEM follows more or less the same distribution as illustrated by the results,
Figure 16. The stress distribution-based FEM gives more realistic values than the LEM however, the true stress on the existing ground may not be the same.
3.1.2. Factor of safety (FOS)
The Limit Equilibrium Method assumed that the FOS is the same for all the slices, which is not realistic whereas, stress-based FEM captures all the local factors of safety of each slice assuming the initial in-situ stress distribution as illustrated by the plot,
Figure 17. Therefore, FEM is suitable for small-scale slope stability to capture the local FOS within the slope considering true stress-strain distribution.
3.2. Transient state
The drawing down water level during the flushing of the reservoir is a critical task as the drawn rate directly affects the sliding stability of the slope [
7]. The quick reduction of water load and the change in pore-water pressure inside the fill dam depending upon the soil parameter is necessary to access, to safely regulate the flushing without any instability of the slope.
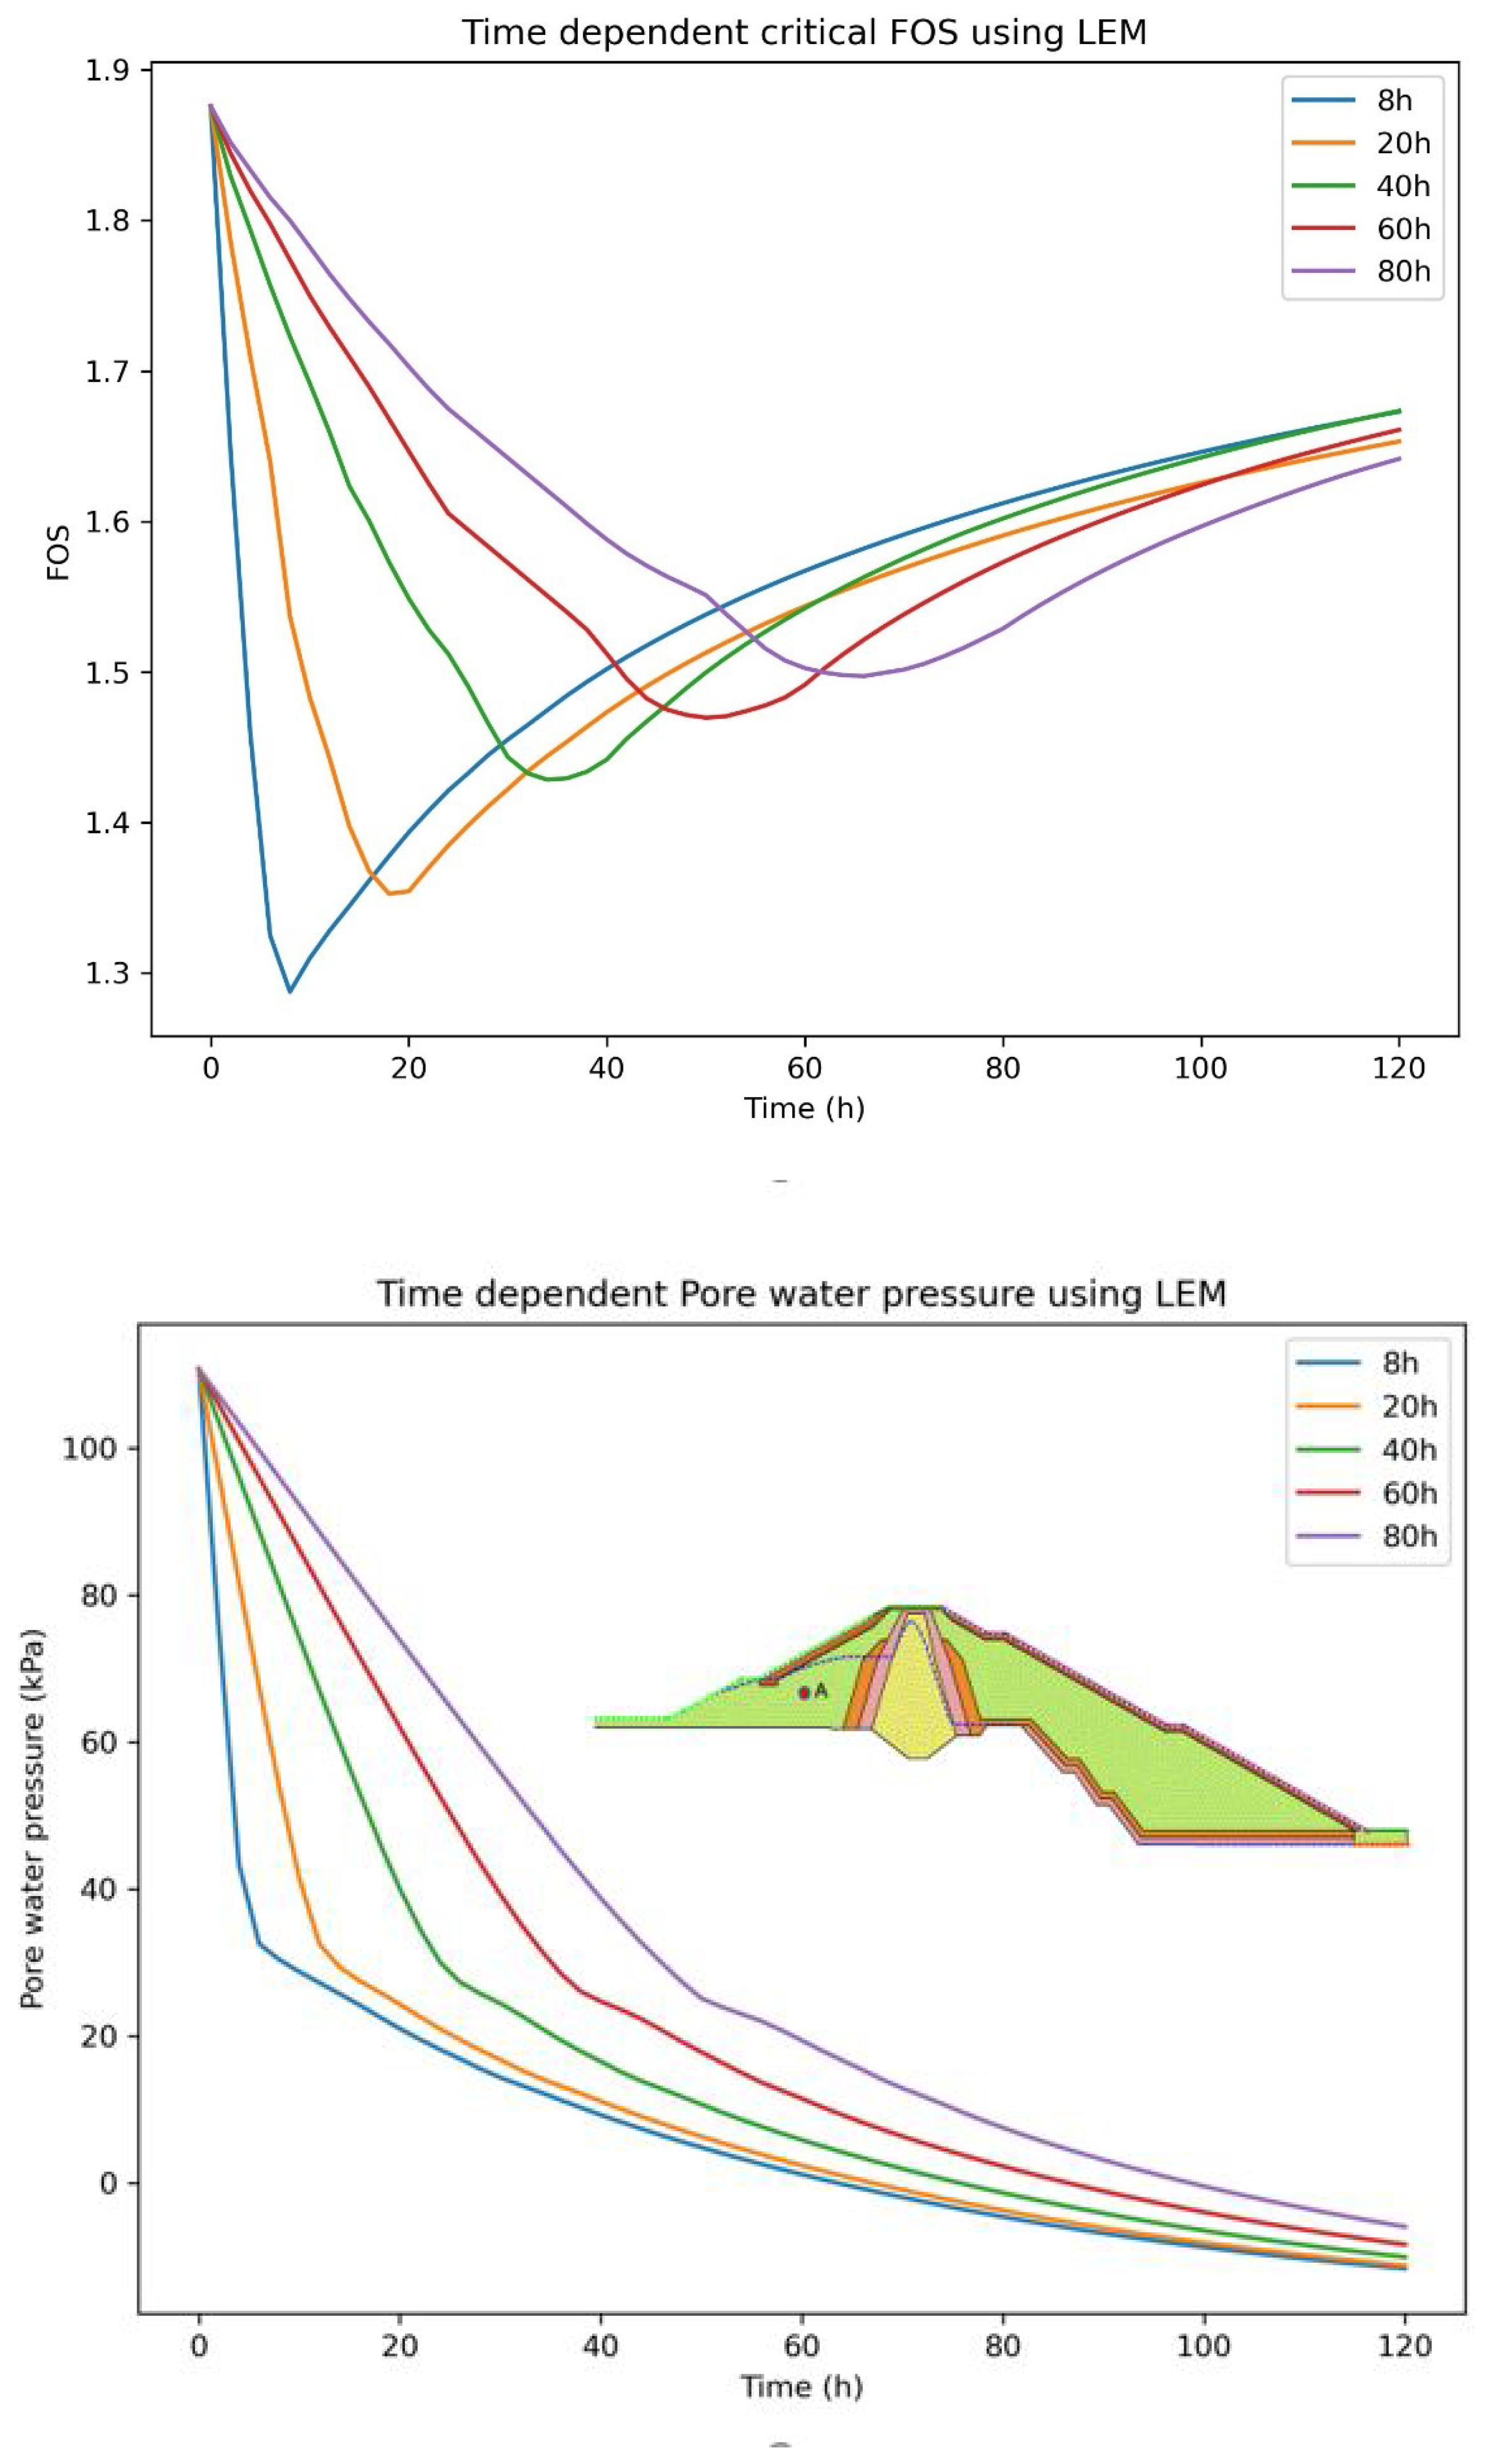
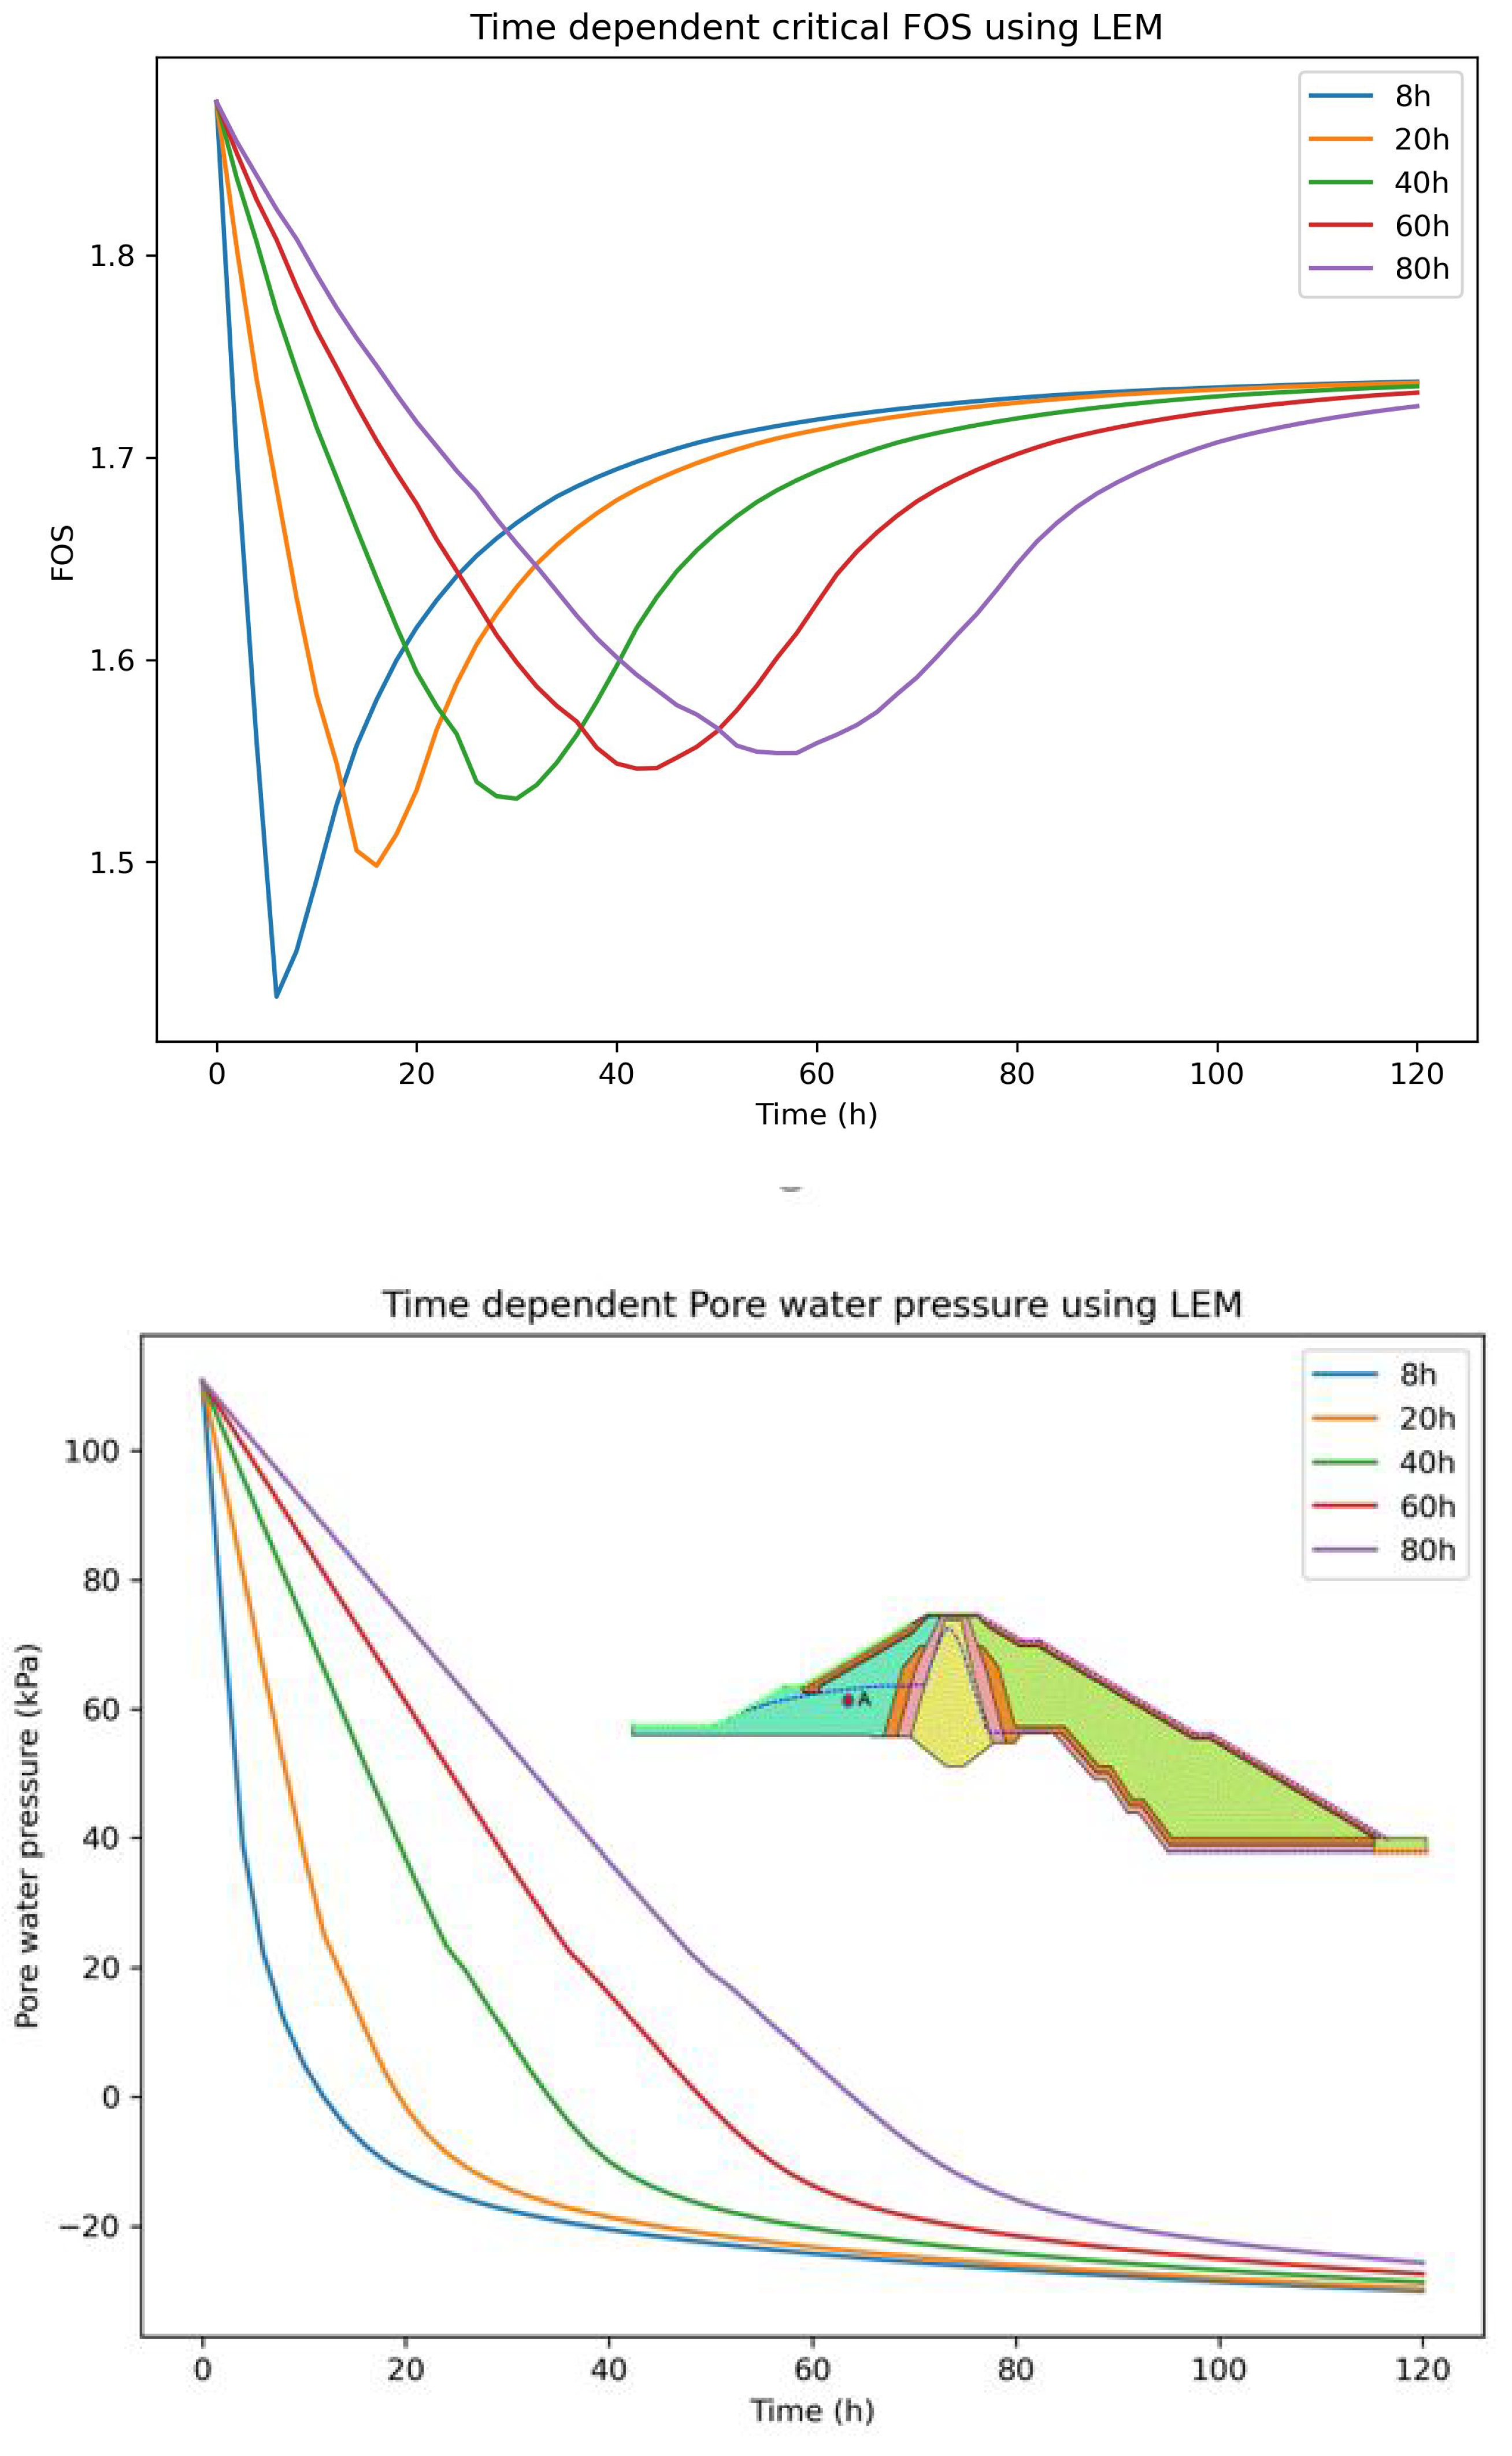
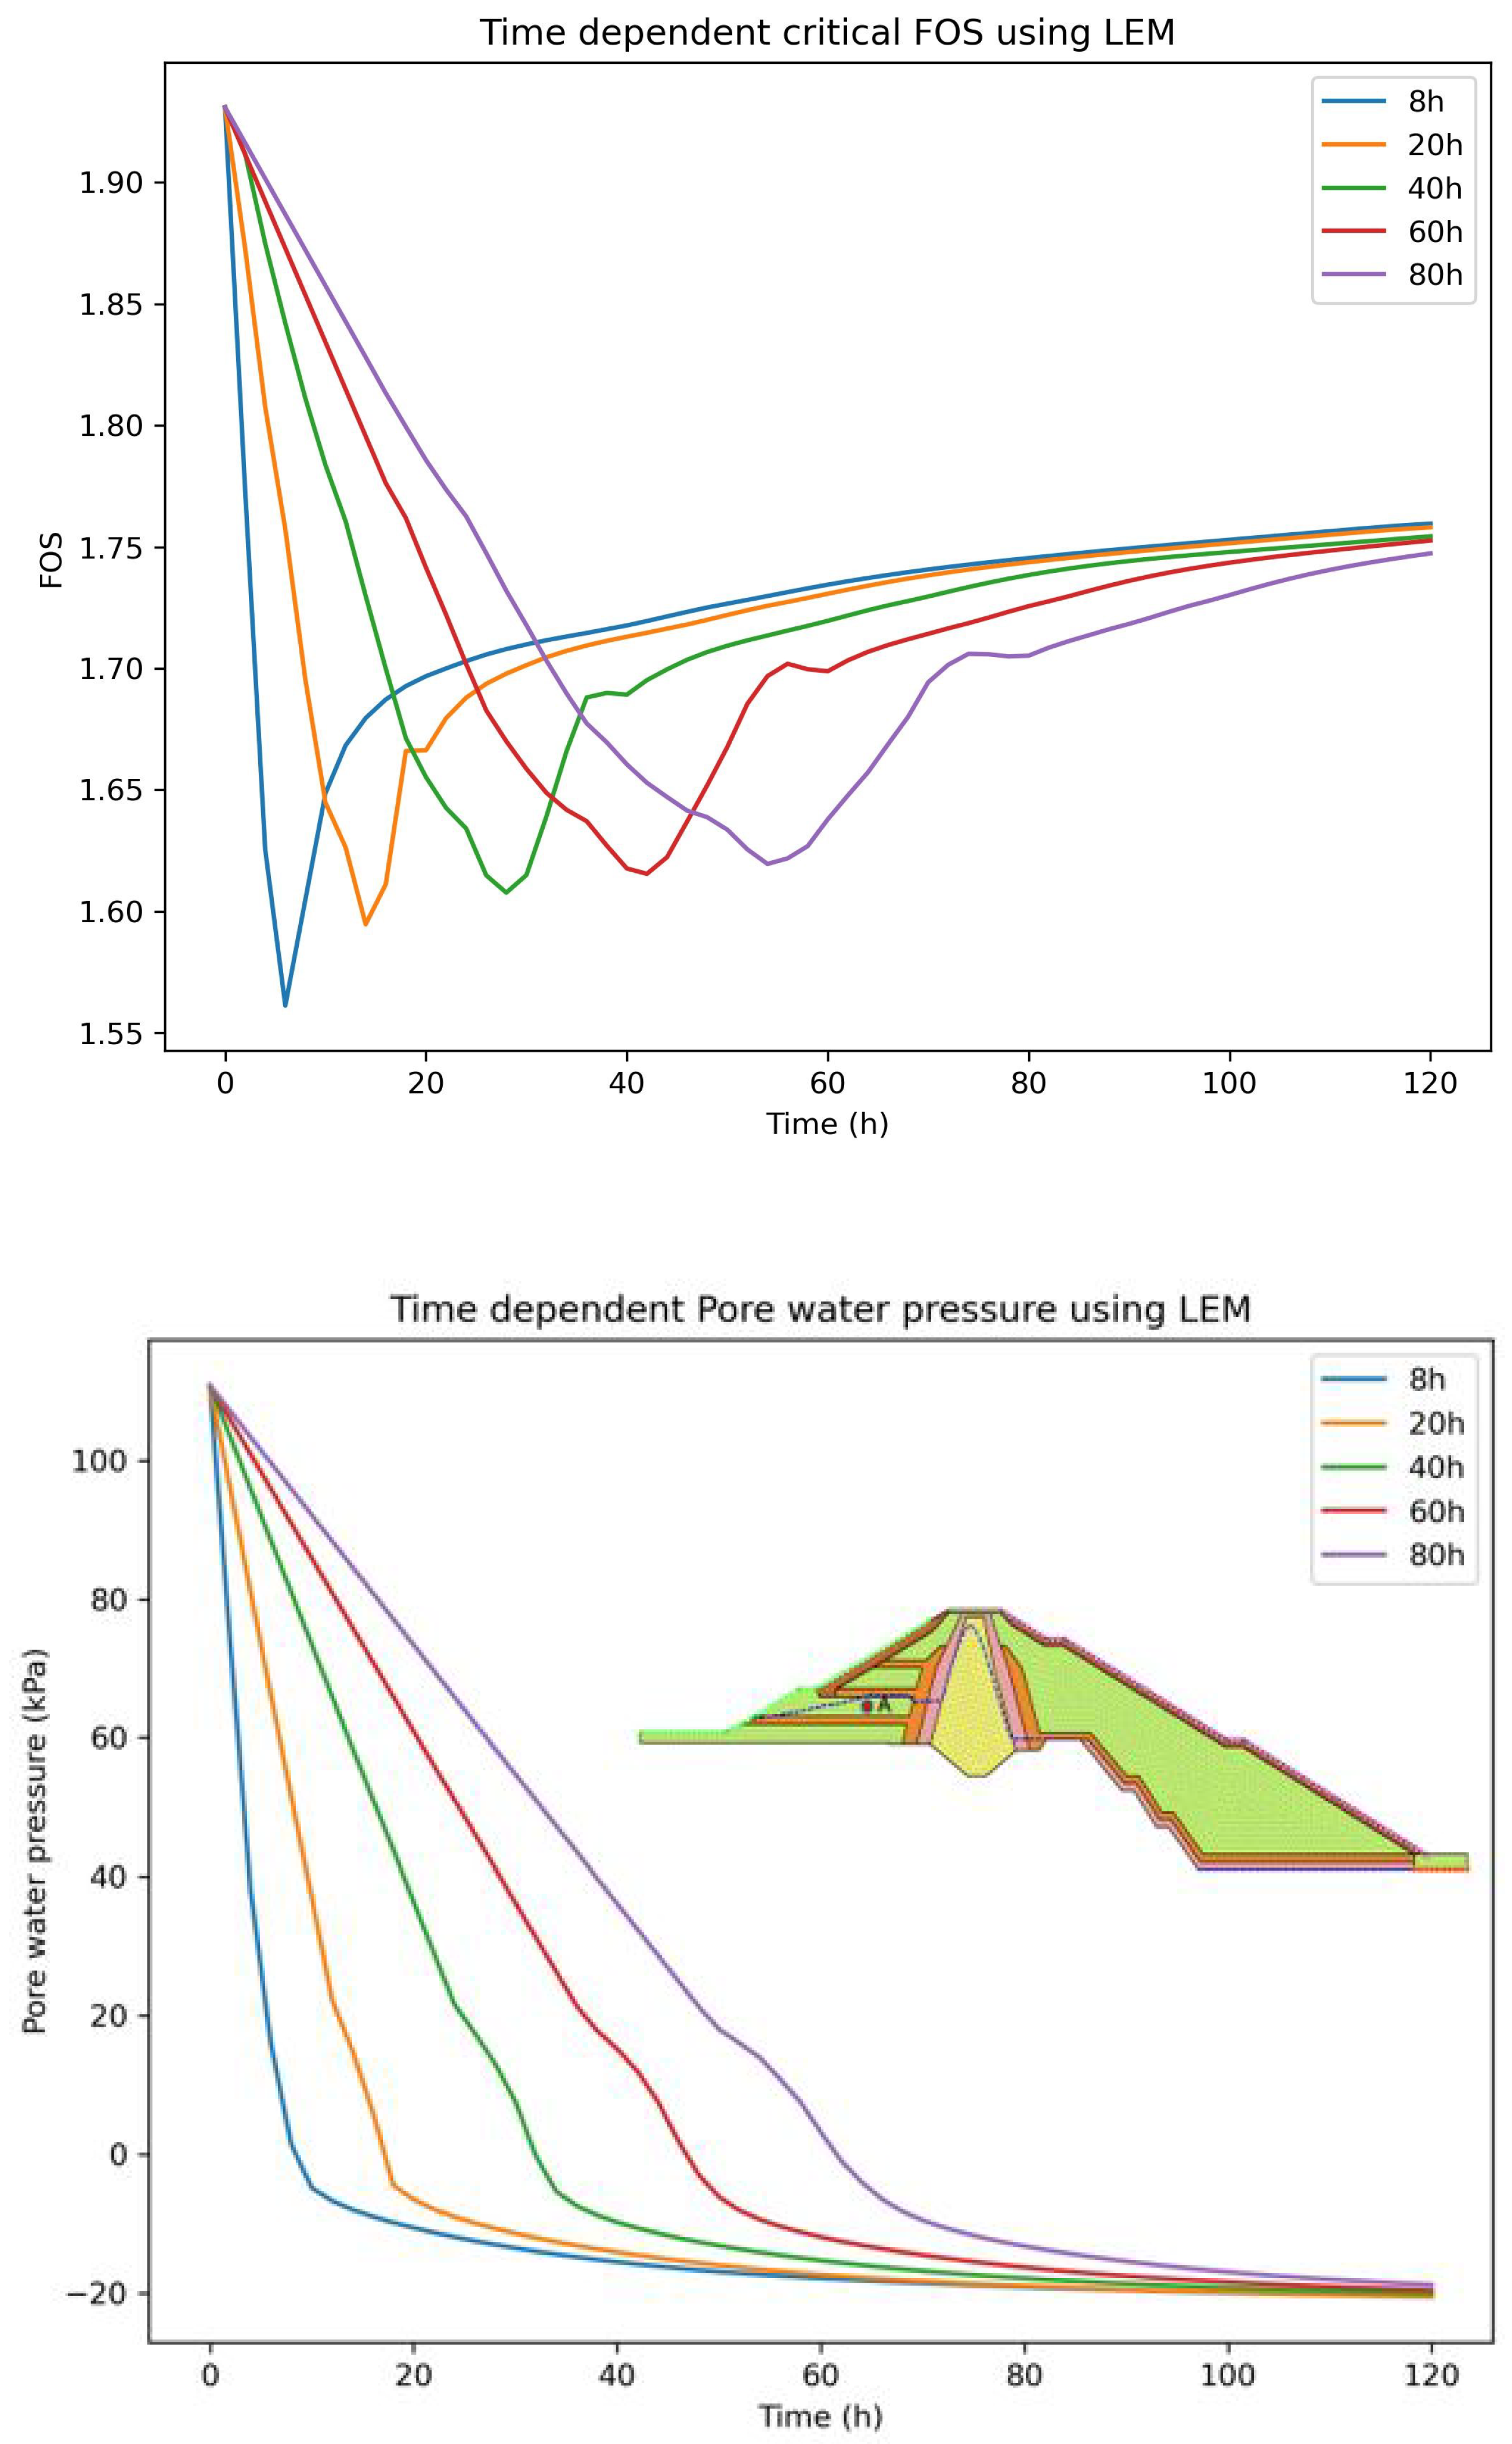
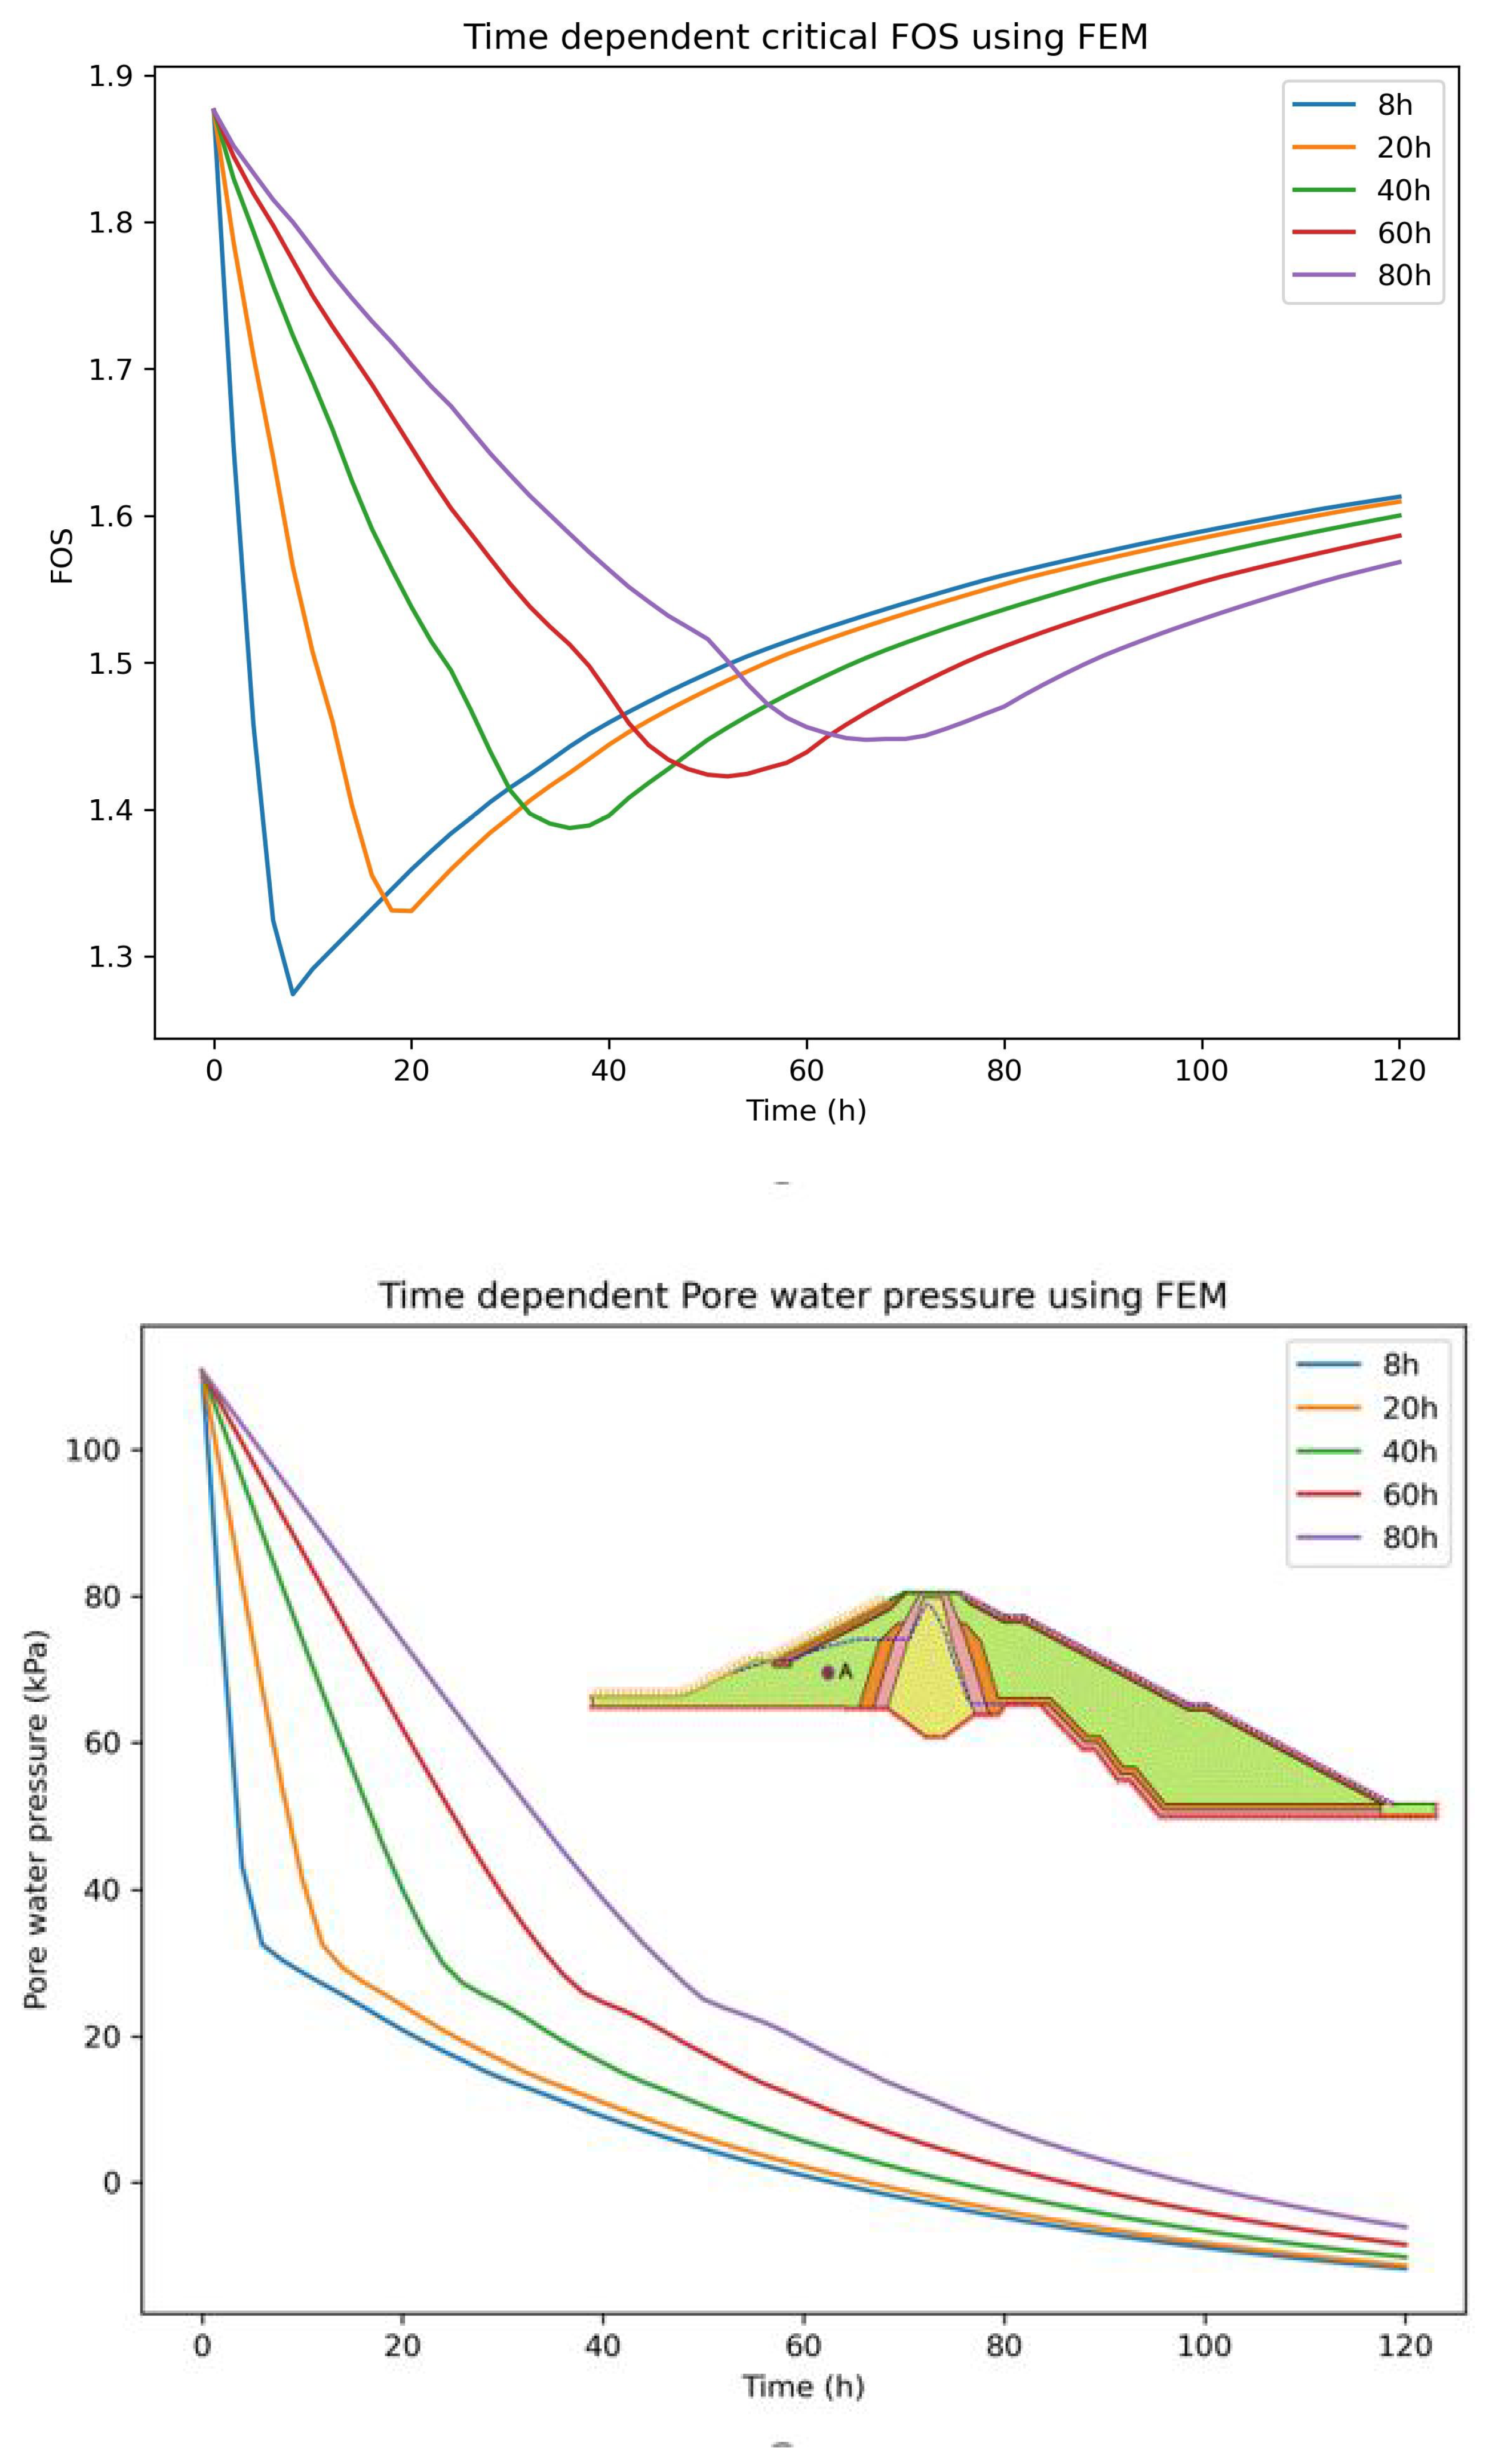
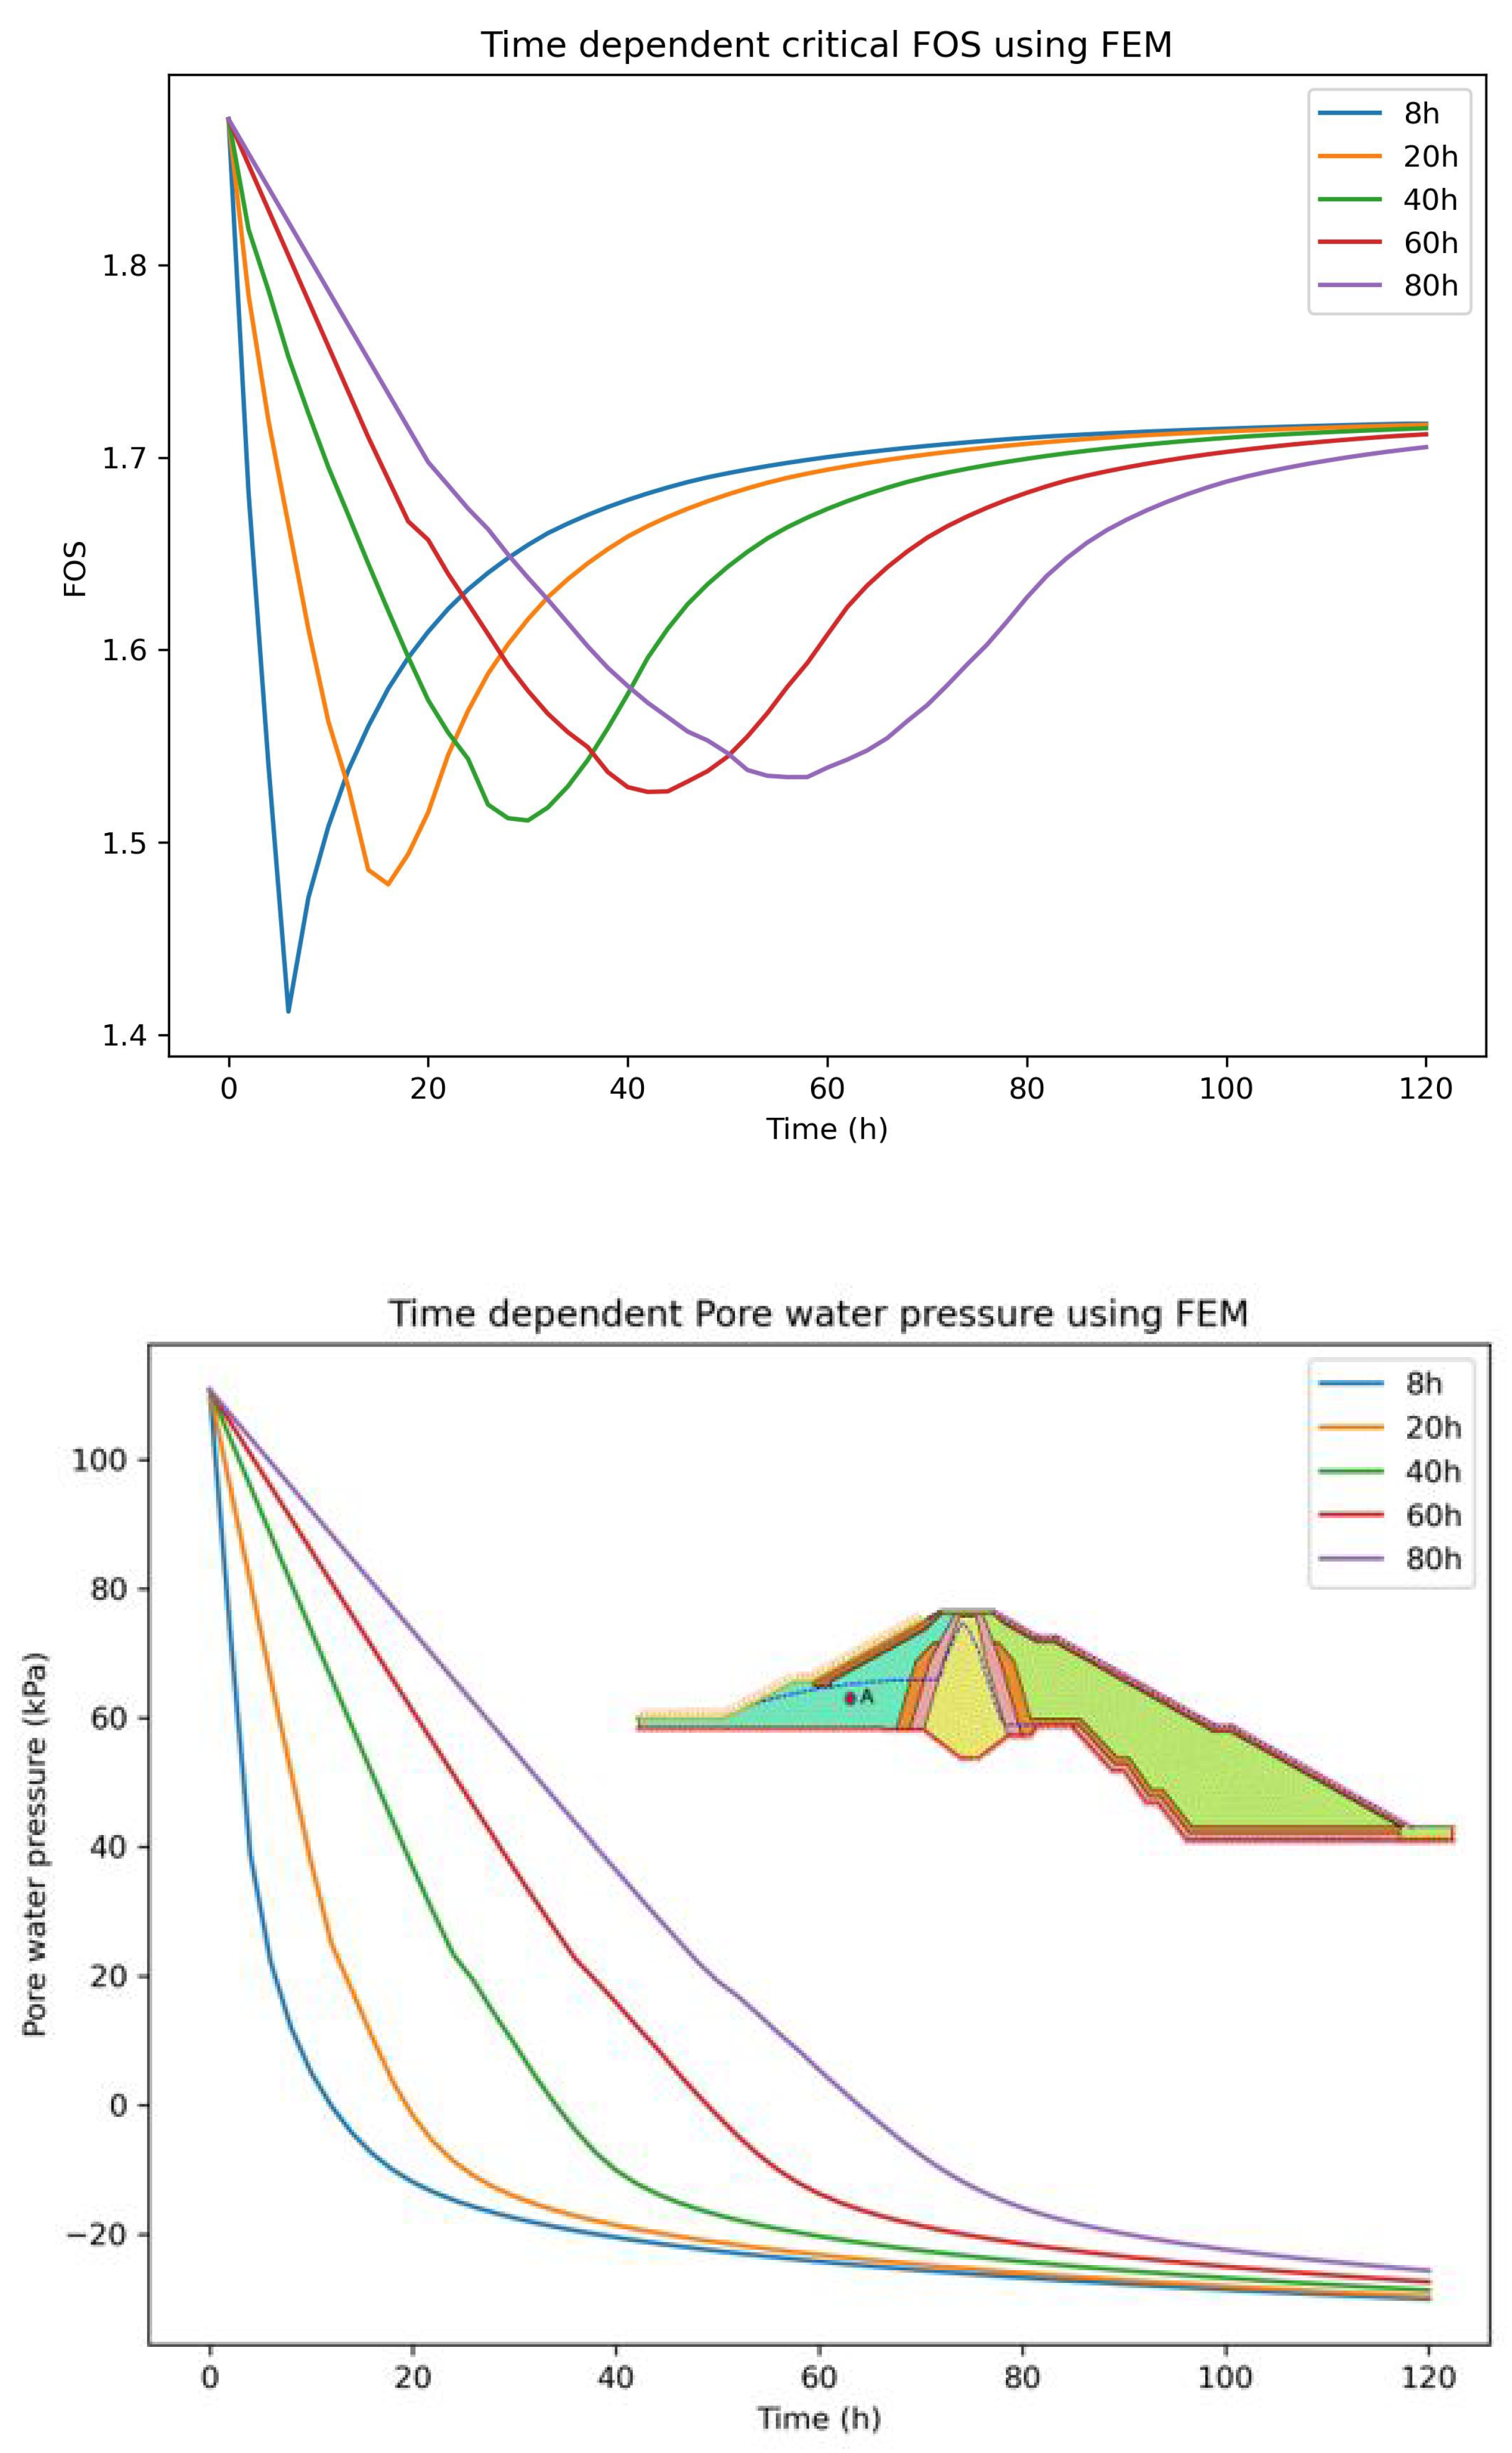
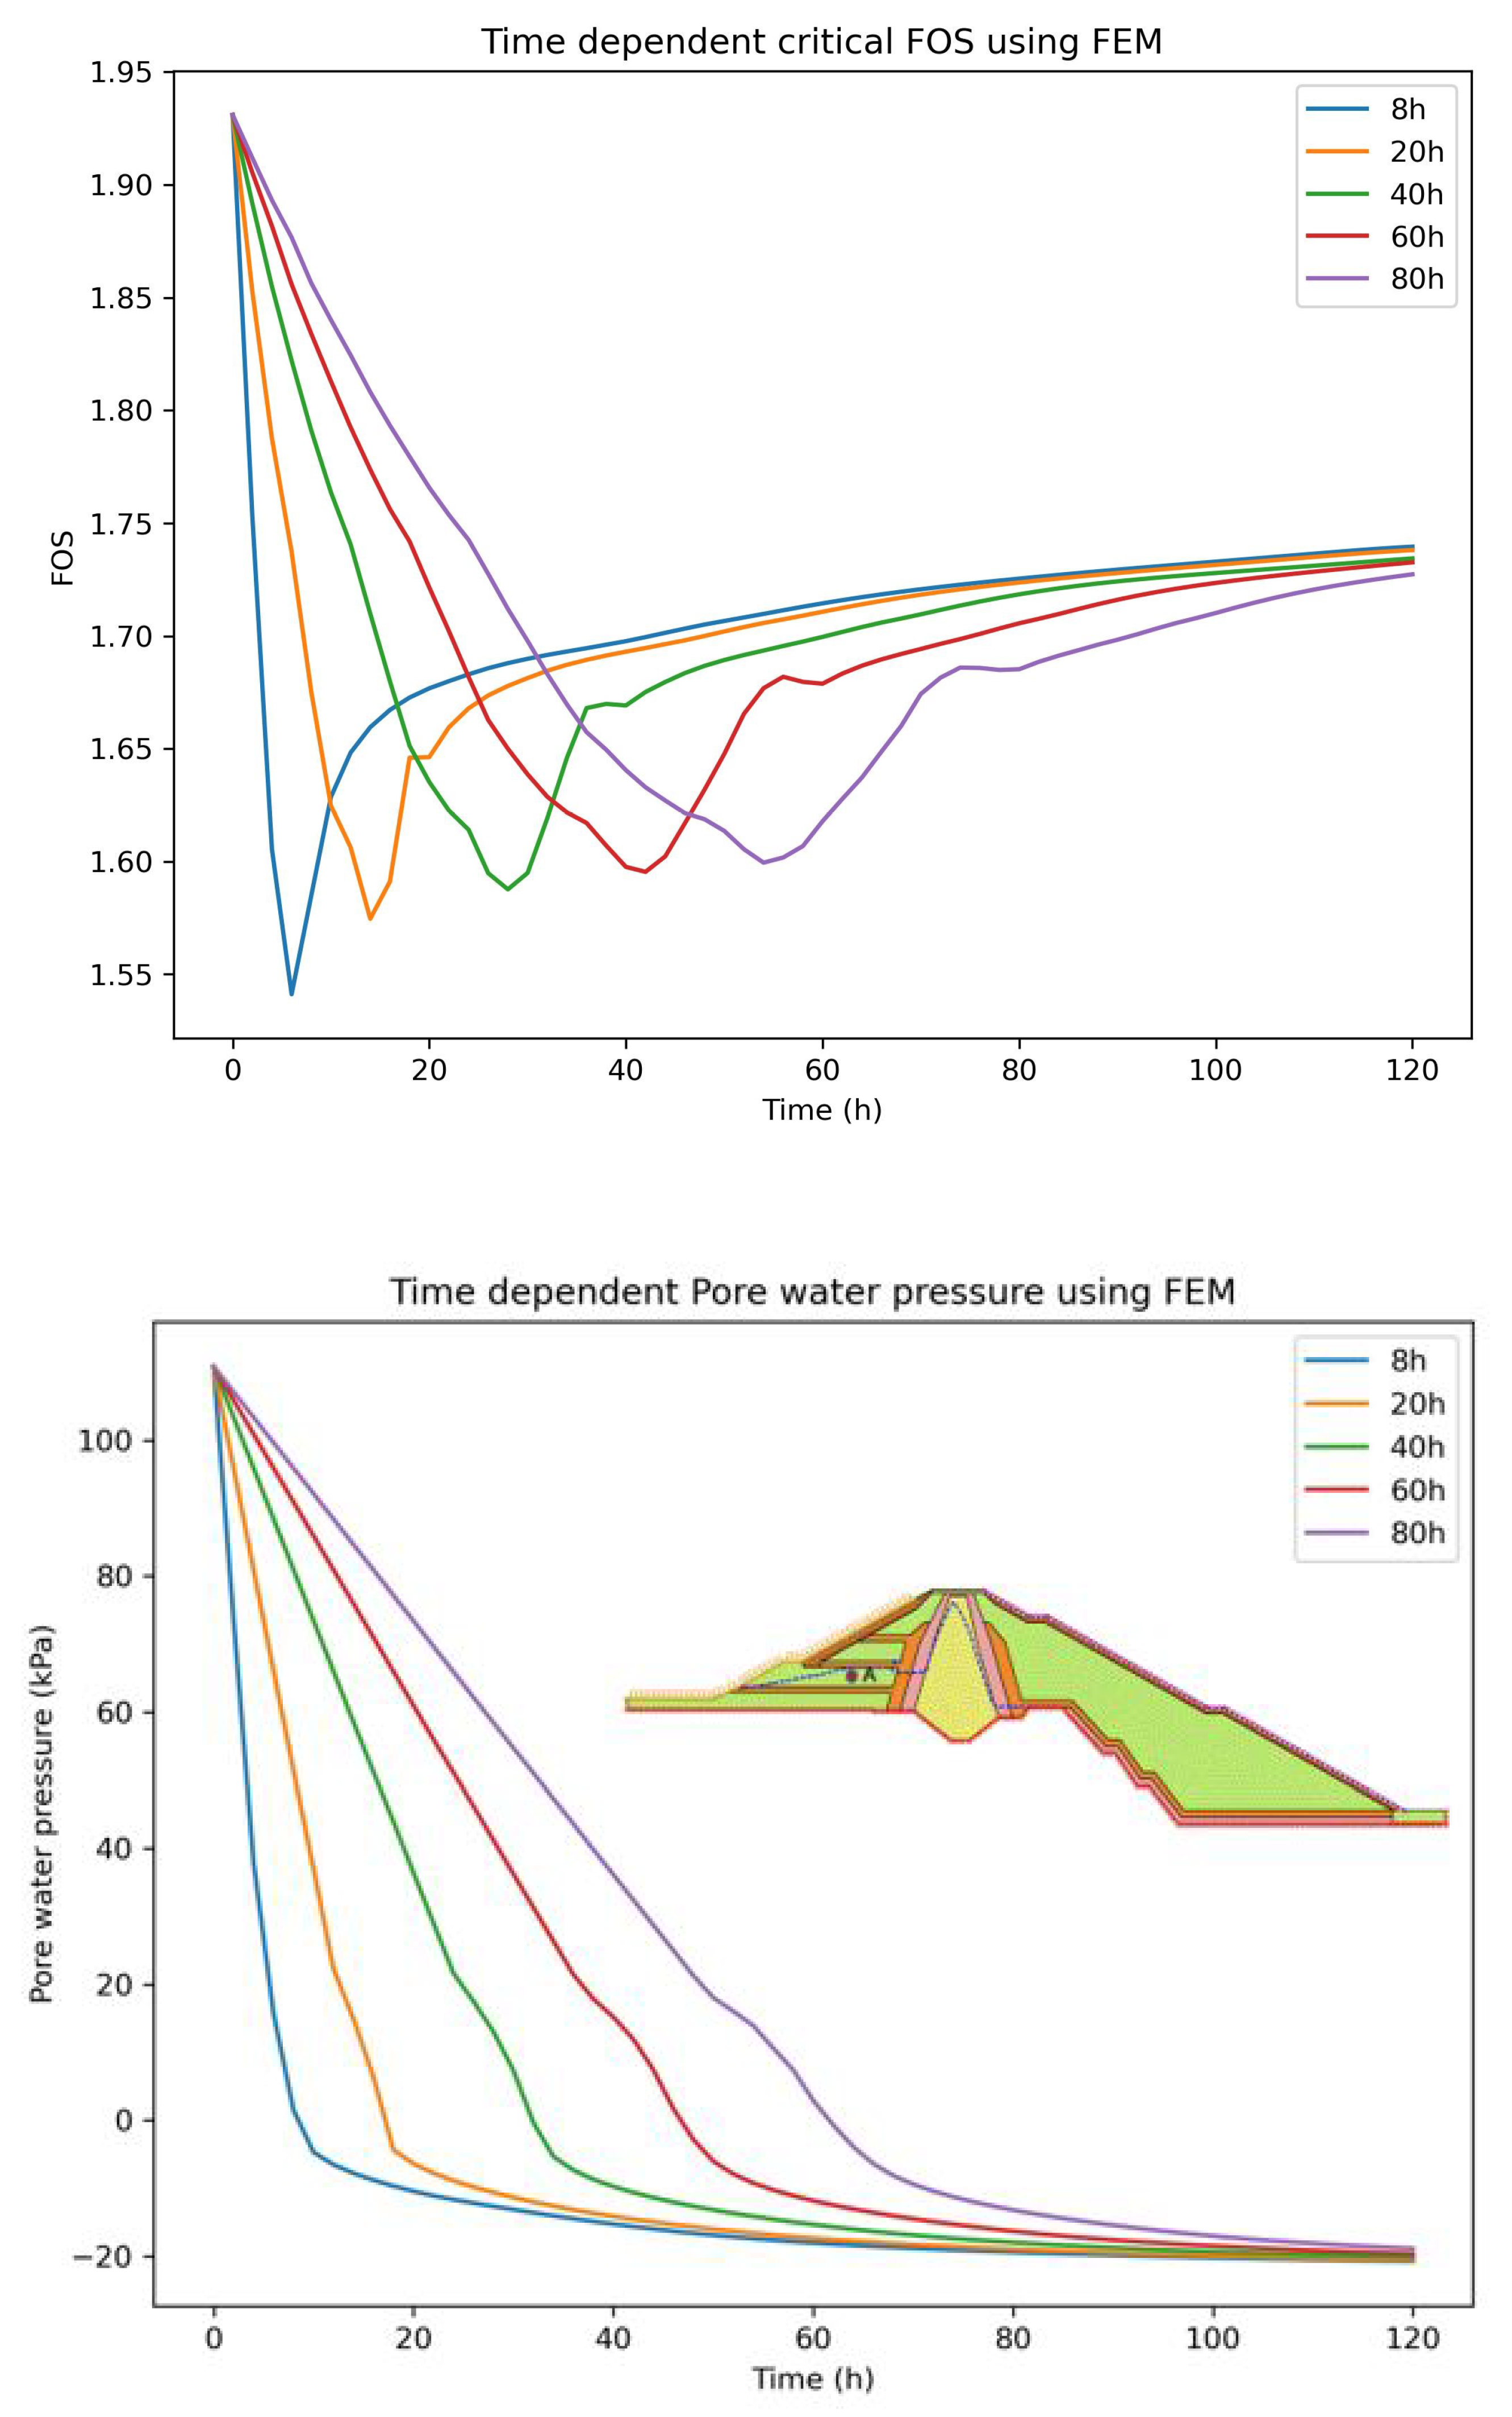
The time-dependent critical FOS using LEM adopting Morgenstern-Price Method and Stress-based FEM were carried out for linear draw-down of 8h, 20h, 40h, 60h, and 80h as plotted in
Figure 18.
3.2.1. Non-linear behavior
The stress-strain-based FEM was used to capture the non-linear behaviors adapting Mohr-Coulomb failure criteria during the draw-down of water level as water load on the upstream side of the dam varies with the time, depending upon the draw-down rate.
The non-linear behavior mesh shaded with a yellow region indicates an unstable zone at the upstream side of the dam during the 8 hours of draw-down with the rate of 1.91m/h in all the cases. The results indicate the maximum chances of movement of boulders rip-rap at the upstream side of the dam during the rapid draw-down, as it replicates the case of instability of the boulder rip-rap at the upstream side of the dam after the 8 hours of draw-down
Figure 2.
3.2.2. Pressure and seepage discharge variation
The excess pore water pressure variation inside the dam highly dominates the FOS as it reduces the resisting shear force [
3,
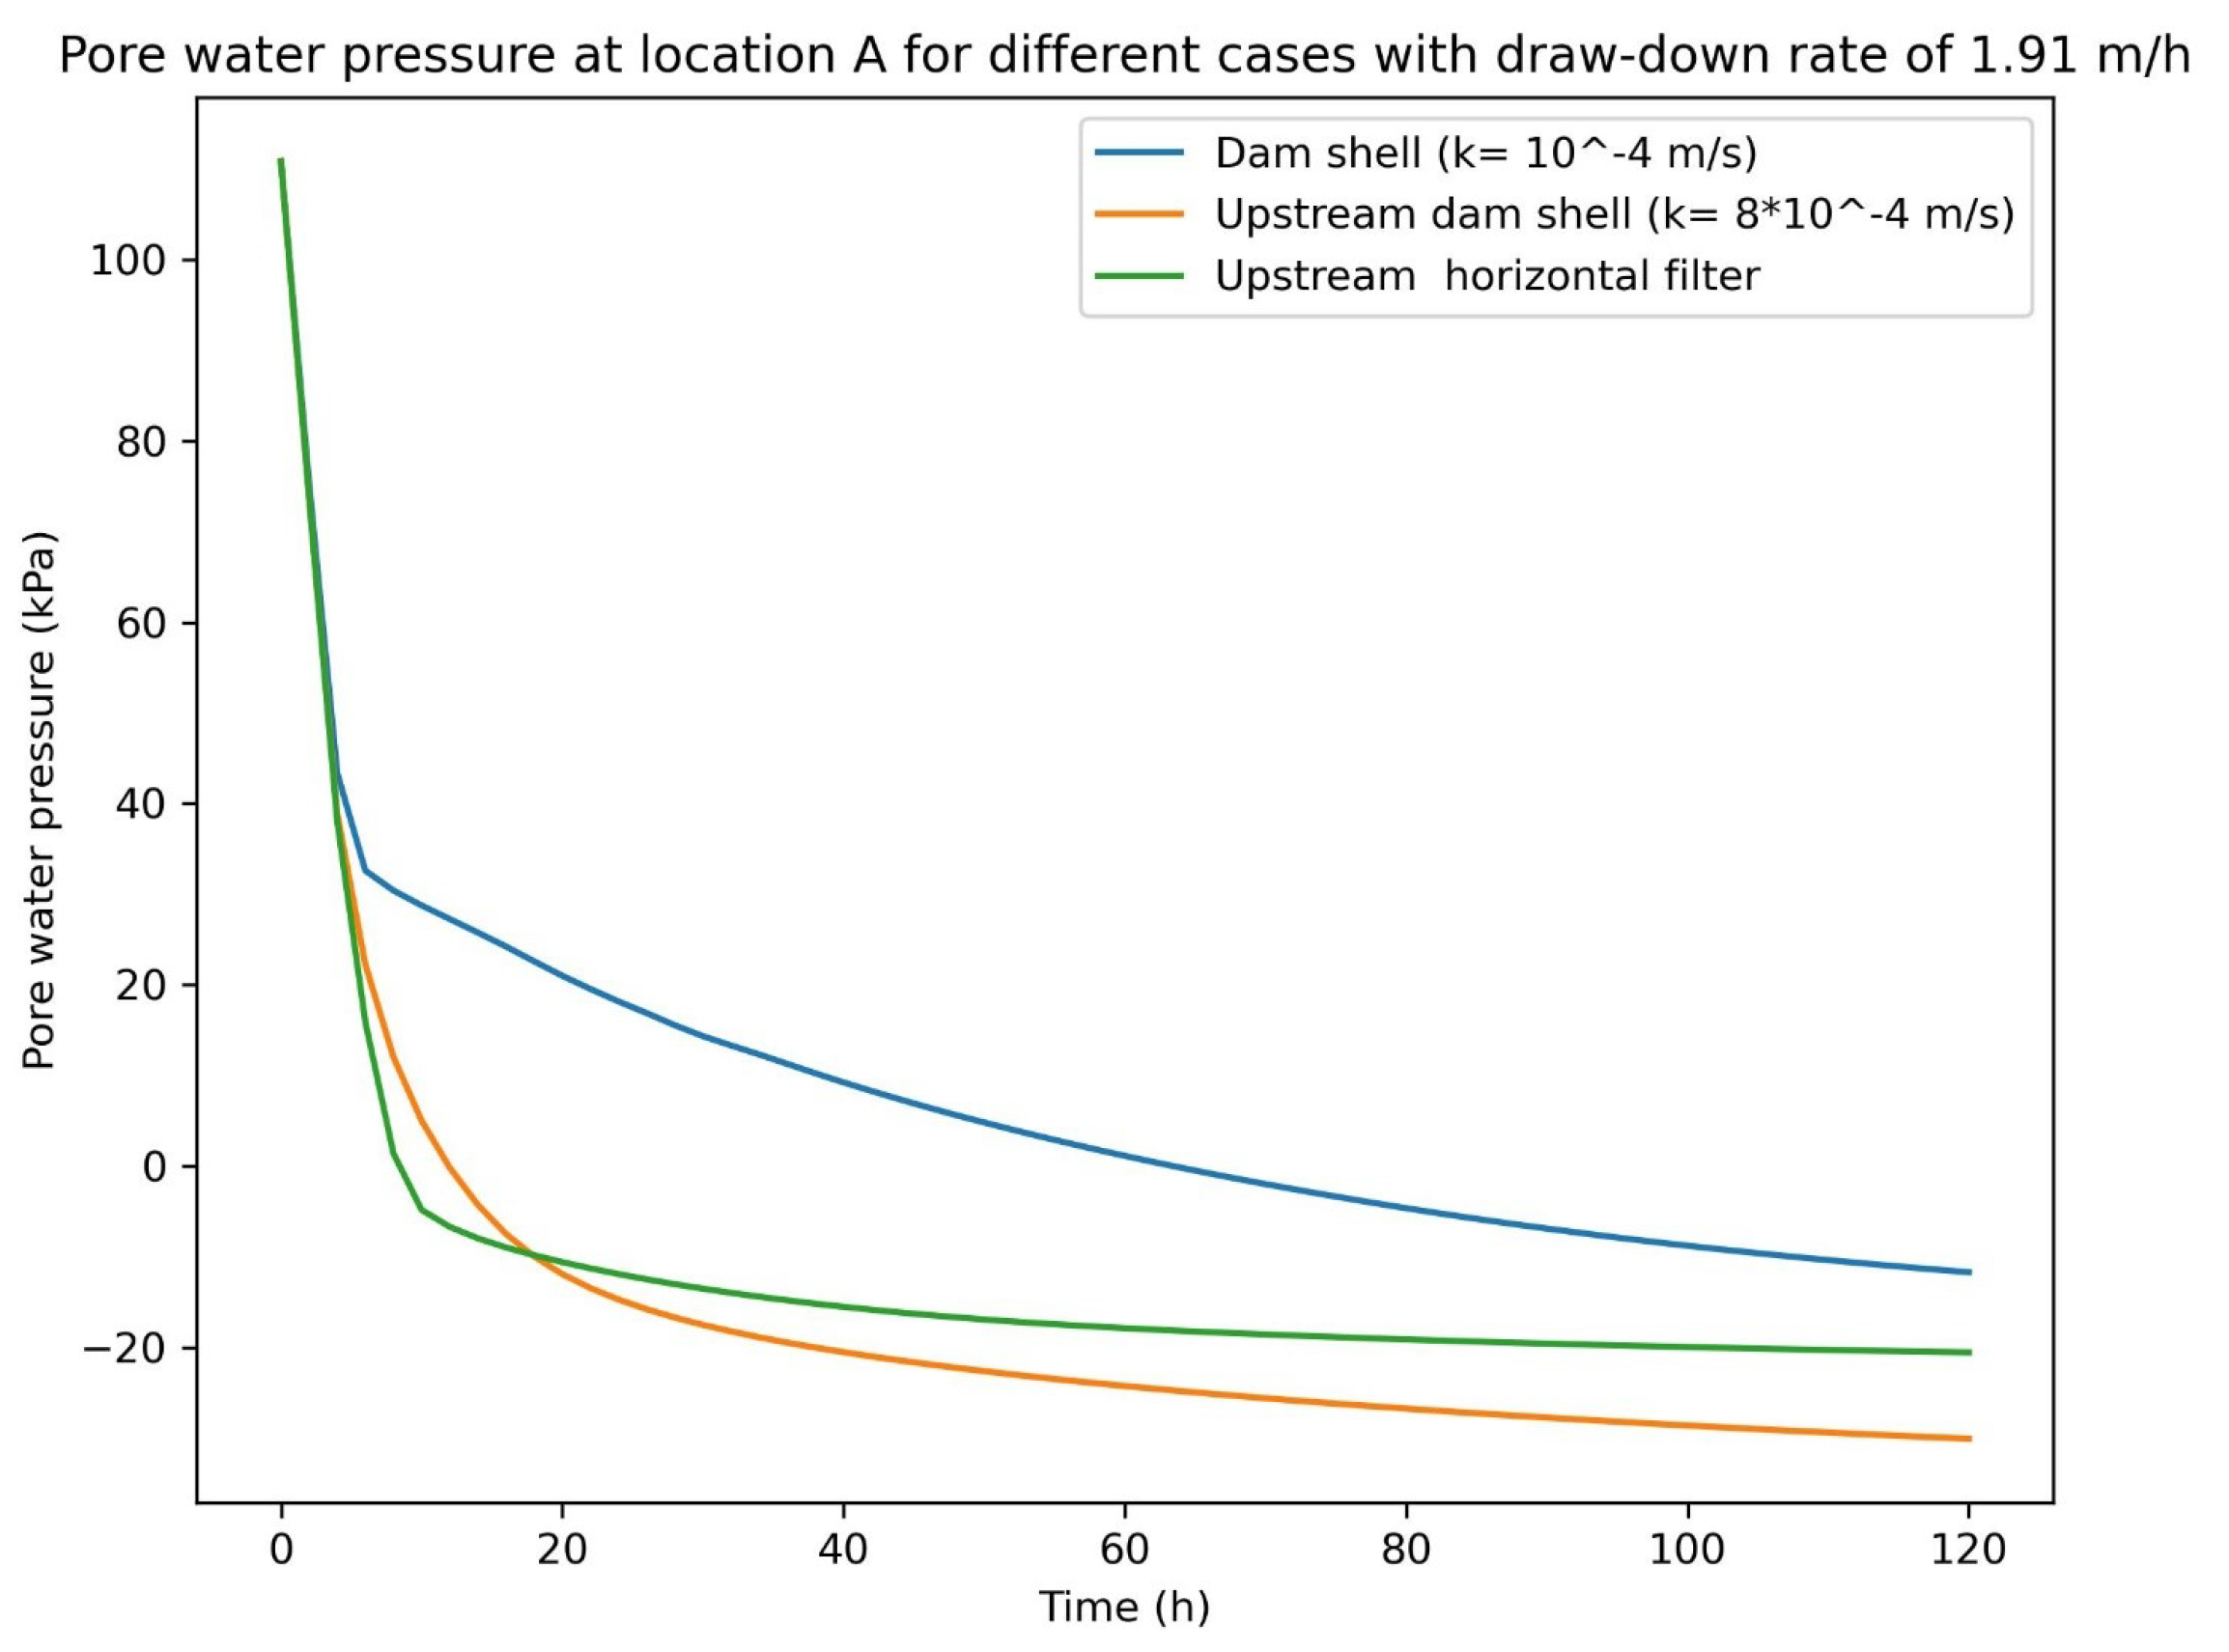
4]. Upstream dam materials should safely release the seepage discharge from the dam during the draw-down of water level reducing the excess pore water pressure inside the dam. Therefore, three cases were established to evaluate the change in pressure and discharge at location A,
Figure 19,
Figure 20 and
Figure 21. The result illustrated that less excess pore water pressure was achieved inside the dam with the increase in permeability at the upstream dam shell, as it quickly releases the pore water pressure from the dam.
Figure 19.
At 8h with a draw-down rate of 1.91m/h- Upstream dam shell ( m/s).
Figure 19.
At 8h with a draw-down rate of 1.91m/h- Upstream dam shell ( m/s).
Figure 20.
At 8h with a draw-down rate of 1.91m/h - Upstream dam shell ( m/s).
Figure 20.
At 8h with a draw-down rate of 1.91m/h - Upstream dam shell ( m/s).
Figure 21.
At 8h with a draw-down rate of 1.91m/h - Three layer horizontal filters (Cross-section Length = 33m, 15m, 8.5m and Height = 1m with m/s).
Figure 21.
At 8h with a draw-down rate of 1.91m/h - Three layer horizontal filters (Cross-section Length = 33m, 15m, 8.5m and Height = 1m with m/s).
Figure 22.
Pore water pressure at location A with a draw-down rate of 1.91m/h.
Figure 22.
Pore water pressure at location A with a draw-down rate of 1.91m/h.
The influence of change in hydraulic conductivity on seepage discharge and reduction of pore water pressure at location A was evaluated at 8 hours. The results illustrated that the higher hydraulic conductivity increases seepage discharge,
Table 6 and reduces the excess pore water pressure inside the dam,
Figure 19,
Figure 20,
Figure 21.
Table 6.
Seepage discharge at location A.
Table 6.
Seepage discharge at location A.
| Upstream side of the dam at location A with a draw-down rate after
|
|
Hydraulic conductivity m/s |
Seepage discharge |
|
|
|
|
|
-layers horizontal filter conductivity at location A is
|
|
Figure 23.
Left represents FOS and right illustrates pore water pressure at location A for different draw-down rate using LEM (Upstream dam shell (= )).
Figure 23.
Left represents FOS and right illustrates pore water pressure at location A for different draw-down rate using LEM (Upstream dam shell (= )).
Figure 24.
Left represents FOS and right illustrates pore water pressure at location A for different draw-down rate using LEM (Upstream dam shell (= )).
Figure 24.
Left represents FOS and right illustrates pore water pressure at location A for different draw-down rate using LEM (Upstream dam shell (= )).
Figure 25.
Left represents FOS and right illustrates pore water pressure at location A for different draw-down rate using LEM (Upstream three horizontal filter layers (= )).
Figure 25.
Left represents FOS and right illustrates pore water pressure at location A for different draw-down rate using LEM (Upstream three horizontal filter layers (= )).
Figure 26.
Left represents FOS and right illustrate pore water pressure at location A for different draw-down rate using FEM (Upstream dam shell (= )).
Figure 26.
Left represents FOS and right illustrate pore water pressure at location A for different draw-down rate using FEM (Upstream dam shell (= )).
Figure 27.
Left represents FOS and right illustrate pore water pressure at location A for different draw-down rate using FEM (Upstream dam shell (= )).
Figure 27.
Left represents FOS and right illustrate pore water pressure at location A for different draw-down rate using FEM (Upstream dam shell (= )).
Figure 28.
Left represents FOS and right illustrate pore water pressure at location A for different draw-down rate using FEM (Upstream three horizontal filter layers (= )).
Figure 28.
Left represents FOS and right illustrate pore water pressure at location A for different draw-down rate using FEM (Upstream three horizontal filter layers (= )).
The overall FOS using the LEM and FEM was found to be more or less similar, the resulting different values of FOS might be due to various reasons such as LEM relies on the equilibrium equations and depends upon the predefined failure surface, does not consider the actual condition of the nature i.e. the behavior of the soil parameter[
8]. On the other hand, true complex behaviors of the soil are hard to determine and might not be truly represented which has uncertainties in the analysis for FEM.
Table 7.
Overall critical minimum FOS
Table 7.
Overall critical minimum FOS
| Overall minimum FOS |
| Draw-down |
Draw-down rate |
Dam shell
|
Dam shell
|
Upstream horizontal filter |
| |
|
Using LEM |
Using FEM |
Using LEM |
Using FEM |
Using LEM |
Using FEM |
| 8 hours |
|
1.28 |
1.27 |
1.43 |
1.41 |
1.56 |
1.54 |
| 20 hours |
|
1.35 |
1.33 |
1.49 |
1.47 |
1.59 |
1.57 |
| 40 hours |
|
1.42 |
1.38 |
1.53 |
1.51 |
1.60 |
1.58 |
| 60 hours |
|
1.46 |
1.42 |
1.54 |
1.52 |
1.61 |
1.59 |
| 80 hours |
|
1.49 |
1.44 |
1.55 |
1.53 |
1.62 |
1.60 |
4. Discussion
4.1. Steady state
The safe dam FOS of 1.92 and 1.89 were obtained through LEM and FEM,
Figure 14,
Figure 15 which satisfied the minimum required factors of safety for rock-fill dams as per the guideline of US Army Corps of Engineers,
Table 8.
4.2. Transient state
The minimum FOS 1.28 and 1.27 obtained during the rapid draw-down with rate of 1.91m/h for 8 hours was found to be unsafe
Table 7, as both of the FOS using LEM and FEM were found to be less than 1.3 as per the US Army Corps of Engineers,
Table 8,
"5FS=1.3 applies to draw-down from the maximum storage pool". The minimum allowable draw-down rate of 0.76m/h for 20 hours was found to be safe as FOS reaches 1.35,
Table 7. The upstream dam shell with the permeability of
,
Figure 24 and
Figure 27 and application of three layers of upstream horizontal filter,
Figure 25 and
Figure 28 provides the adequate results for both LEM and FEM,
Table 7,
Table 8 at rate of 1.91m/h.The
Figure 19,
Figure 20 and
Figure 21 shows how the phreatic line changes inside the upstream side of the dam with the influence of change in seepage discharge,
Table 6 and pore water pressure,
Figure 22. This indicates FOS is highly dominated by the upstream dam shell permeability. However, non-linear analysis results have shown the instability of slope in the upstream rip-rap zone for all the cases at the draw-down rate of 1.91m/h for 8 hours,
Figure 19,
Figure 20 and
Figure 21.
On the other hand, the FOS was found to increase as the draw-down rate decreases, which is reasonable as FOS is influenced by the existing water load and excess pore water pressure[
3,
4]. The slow draw-down rate reduces the excess pore water pressure inside the dam resulting in higher FOS,
Figure 23,
Figure 24,
Figure 25,
Figure 26,
Figure 27 and
Figure 28. Therefore, a safe allowable draw-down rate and quick release of the excess pore water pressure are the two crucial things that govern the FOS at the time of rapid draw-down.
5. Conclusion and Recommendation
- The factor of safety (FOS) was found to be more or less similar using LEM and FEM
Table 7, LEM solves the problem based on the equilibrium method as it does not consider the true stress-strain distribution of the soil. The true soil parameter is hard to establish in FEM due to its complexity, likely to be useful for small-scale slope stability with precise soil parameters.
- The 8 hours of drawing down water level from the reservoir at the rate of 1.91m/h resulted in FOS of 1.28 and 1.27, which was found to be insufficient for both LEM and FEM as illustrated by
Table 7 for the draw-down from the maximum storage pool based upon the US Army Corps of Engineers
Table 8. The minimum drawing down rate of 0.76m/h must be maintained for 20 hours considering dam shell permeability of
to achieve a safe draw-down of FOS above 1.3,
Table 7.
- The FOS is highly dominated by the dam shell permeability and draw-down rate, as the time-dependent FOS depends upon the quick change in stabilizing water load and destabilizing excess pore water pressure,
Figure 23,
Figure 24,
Figure 25,
Figure 26,
Figure 27 and
Figure 28,
Table 7. The change in permeability of the upstream dam shell and application of three layers of the horizontal filter was found to be effective in resulting in adequate FOS as per the US Army Corps of Engineers for the minimum allowable factor of safety for rock fill dam
Table 8. However, the nonlinear behavior results have shown the chances of movement of upstream boulders in the rip-rap zone for all the cases at 8 hours of draw-down with the rate of 1.91m/h,
Figure 19,
Figure 20 and
Figure 21. The clogging issues of filter materials during the draw-down were not taken into account for LEM and FEM and can be considered as the limitation, as the filter zone can be clogged and malfunction due to the fluctuation of seepage inside the rock fill dam [
33].
- The limitation of the LEM over the FEM, FEM needs a detailed field study of the fill-dam for soil parameters such as Young modulus, Poisson’s ratio to define true stress distribution, actual seepage rate with calibrated hydraulic conductivity, Soil Water Characteristic Curve defining matric suction and volumetric water content are essential to identify true FOS. Moreover, LEM and FEM don’t truly represent the physical behaviors of slope instability. Further studies can be done with the application of a particle-based method i.e. Smoothed Particle Hydrodynamics Method (SPH) to adequately represent the physical behaviors of sliding slope provided with critical failure plane[
34].
Author Contributions
Pandey, B.:Writing, and editing; Knoblauch, H: Review and editing; Zenz, G: Review and editing. All authors have read and agreed to the published version of the article.
Funding
This research received no external findings.
Data Availability Statement
The data presented in this study are available on request from the corresponding author. Some data are retrieved from open-source platforms while others are not publicly available due to data confidentiality.
Conflicts of Interest
The authors declare no conflicts of interest.
References
- Sjödahl, P.; Dahlin, T.; Johansson, S. Using resistivity measurements for dam safety evaluation at Enemossen tailings dam in southern Sweden. Environmental geology 2005, 49, 267–273. [Google Scholar] [CrossRef]
- Andersen, G.R.; Chouinard, L.E.; Bouvier, C.; Back, W.E. Ranking procedure on maintenance tasks for monitoring of embankment dams. Journal of geotechnical and geoenvironmental engineering 1999, 125, 247–259. [Google Scholar] [CrossRef]
- Al-Janabi, A.M.S.; Ghazali, A.H.; Ghazaw, Y.M.; Afan, H.A.; Al-Ansari, N.; Yaseen, Z.M. Experimental and numerical analysis for earth-fill dam seepage. Sustainability 2020, 12, 2490. [Google Scholar] [CrossRef]
- Sun, G.; Yang, Y.; Jiang, W.; Zheng, H. Effects of an increase in reservoir drawdown rate on bank slope stability: a case study at the Three Gorges Reservoir, China. Engineering Geology 2017, 221, 61–69. [Google Scholar] [CrossRef]
- Alonso, E.E.; Pinyol, N.M. Numerical analysis of rapid drawdown: Applications in real cases. Water Science and Engineering 2016, 9, 175–182. [Google Scholar] [CrossRef]
- Utepov, Y.; Lechowicz, Z.; Zhussupbekov, A.; Skutnik, Z.; Aldungarova, A.; Mkilima, T. The influence of material characteristics on dam stability under rapid drawdown conditions. Archives of Civil Engineering, 2022; 539–553. [Google Scholar]
- Pinyol, N.M.; Alonso, E.E.; Olivella, S. Rapid drawdown in slopes and embankments. Water resources research 2008, 44. [Google Scholar] [CrossRef]
- Duncan, J.M. State of the art: limit equilibrium and finite-element analysis of slopes. Journal of Geotechnical engineering 1996, 122, 577–596. [Google Scholar] [CrossRef]
- Cheng, Y.M.; Yip, C. Three-dimensional asymmetrical slope stability analysis extension of Bishop’s, Janbu’s, and Morgenstern–Price’s techniques. Journal of geotechnical and geoenvironmental engineering 2007, 133, 1544–1555. [Google Scholar] [CrossRef]
- Lane, P.; Griffiths, D. Assessment of stability of slopes under drawdown conditions. Journal of geotechnical and geoenvironmental engineering 2000, 126, 443–450. [Google Scholar] [CrossRef]
- Oo, H.Z.; Ai, L.Z.; Qiu, Z. Numerical analysis of river bank slope stability during rapid drawdown of water level. Study Civ. Eng. Archit 2013, 2, 98–103. [Google Scholar]
- Hammouri, N.A.; Malkawi, A.I.H.; Yamin, M.M. Stability analysis of slopes using the finite element method and limiting equilibrium approach. Bulletin of Engineering Geology and the Environment 2008, 67, 471–478. [Google Scholar] [CrossRef]
- Azadi, A.; Esmatkhah Irani, A.; Azarafza, M.; Hajialilue Bonab, M.; Sarand, F.B.; Derakhshani, R. Coupled numerical and analytical stability analysis charts for an earth-fill dam under rapid drawdown conditions. Applied Sciences 2022, 12, 4550. [Google Scholar] [CrossRef]
- Zomorodian, S.; Abodollahzadeh, S.M. Effect of horizontal drains on upstream slope stability during rapid drawdown condition. Journal of Civil and Environmental Engineering 2012, 42, 29–34. [Google Scholar]
- Srivastava, A.; Babu, G.S.; Haldar, S. Influence of spatial variability of permeability property on steady state seepage flow and slope stability analysis. Engineering Geology 2010, 110, 93–101. [Google Scholar] [CrossRef]
- Gottardi, G.; Gragnano, C.G.; Rocchi, I.; Bittelli, M. Assessing river embankment stability under transient seepage conditions. Procedia Engineering 2016, 158, 350–355. [Google Scholar] [CrossRef]
- Bhaskar, P.; Puppala, A.J.; Boluk, B. Influence of unsaturated hydraulic properties on transient seepage and stability analysis of an earthen dam. International Journal of Geomechanics 2022, 22, 04022105. [Google Scholar] [CrossRef]
- Li, Z.; Ye, W.; Marence, M.; Bricker, J.D. Unsteady seepage behavior of an earthfill dam during drought-flood cycles. Geosciences 2018, 9, 17. [Google Scholar] [CrossRef]
- Alonso Pérez de Agreda, E.; Pinyol Puigmartí, N.M. Slope stability under rapid drawdown conditions. In Proceedings of the First Italian Workshop on Landslides; 2009; pp. 11–27. [Google Scholar]
- Nepal-Electricity-Authority(NEA). 9th Issue,Generation Operation and Maintenance Business. Technical report, 2013.
- Giri, S.; Omer, A.; Mool, P.; Kitamura, Y. Morphological modelling of sediment-induced problems at a cascade system of hydropower projects in hilly region of Nepal. In Sustainable and Safe Dams Around the World/Un monde de barrages durables et sécuritaires; CRC Press, 2019; pp. 1306–1317.
- MS, A.E.W.E.S.V. The Unified Soil Classification System. Appendix A. Characteristics of Soil Groups Pertaining to Embankments and Foundations. Appendix B. Characteristics of Soil Groups Pertaining to Roads and Airfields 1967.
- Zhai, Q.; Rahardjo, H. Quantification of uncertainties in soil–water characteristic curve associated with fitting parameters. Engineering Geology 2013, 163, 144–152. [Google Scholar] [CrossRef]
- Leong, E.C.; Rahardjo, H. Review of soil-water characteristic curve equations. Journal of geotechnical and geoenvironmental engineering 1997, 123, 1106–1117. [Google Scholar] [CrossRef]
- Khire, M.V.; Benson, C.H.; Bosscher, P.J. Capillary barriers: Design variables and water balance. Journal of Geotechnical and Geoenvironmental Engineering 2000, 126, 695–708. [Google Scholar] [CrossRef]
- Ameratunga, J.; Sivakugan, N.; Das, B.M. Correlations of soil and rock properties in geotechnical engineering, 2016.
- Bowles, J.E. Physical and geotechnical properties of soils 1979.
- Paikowsky, S.G. LRFD design and construction of shallow foundations for highway bridge structures; Vol. 651, Transportation Research Board, 2010.
- Verruijt, A. Soil Mechanics/Arnold Verruijt. Delft: Delft University of Technology, 2001. [Google Scholar]
- Smith, I. Smith’s elements of soil mechanics; John Wiley & Sons, 2021.
- SLOPE/W. Stability Modeling with GeoStudio, 2023.
- USArmyCorpsOfEngineers. Slope Stability, Engineering Manual.
- Arulanandan, K.; Perry, E.B. Erosion in relation to filter design criteria in earth dams. Journal of Geotechnical Engineering 1983, 109, 682–698. [Google Scholar] [CrossRef]
- Li, L.; Wang, Y.; Zhang, L.; Choi, C.; Ng, C.W. Evaluation of critical slip surface in limit equilibrium analysis of slope stability by smoothed particle hydrodynamics. International Journal of Geomechanics 2019, 19, 04019032. [Google Scholar] [CrossRef]
|
Disclaimer/Publisher’s Note: The statements, opinions and data contained in all publications are solely those of the individual author(s) and contributor(s) and not of MDPI and/or the editor(s). MDPI and/or the editor(s) disclaim responsibility for any injury to people or property resulting from any ideas, methods, instructions or products referred to in the content. |
© 2023 by the authors. Licensee MDPI, Basel, Switzerland. This article is an open access article distributed under the terms and conditions of the Creative Commons Attribution (CC BY) license (http://creativecommons.org/licenses/by/4.0/).
