Submitted:
01 November 2023
Posted:
01 November 2023
You are already at the latest version
Abstract
Keywords:
1. Introduction
2. Materials and Methods
3. Experimental Results and Discussion
3.1. Ageing temperature and time effects on mechanical characteristics: one-factor-at-a-time method
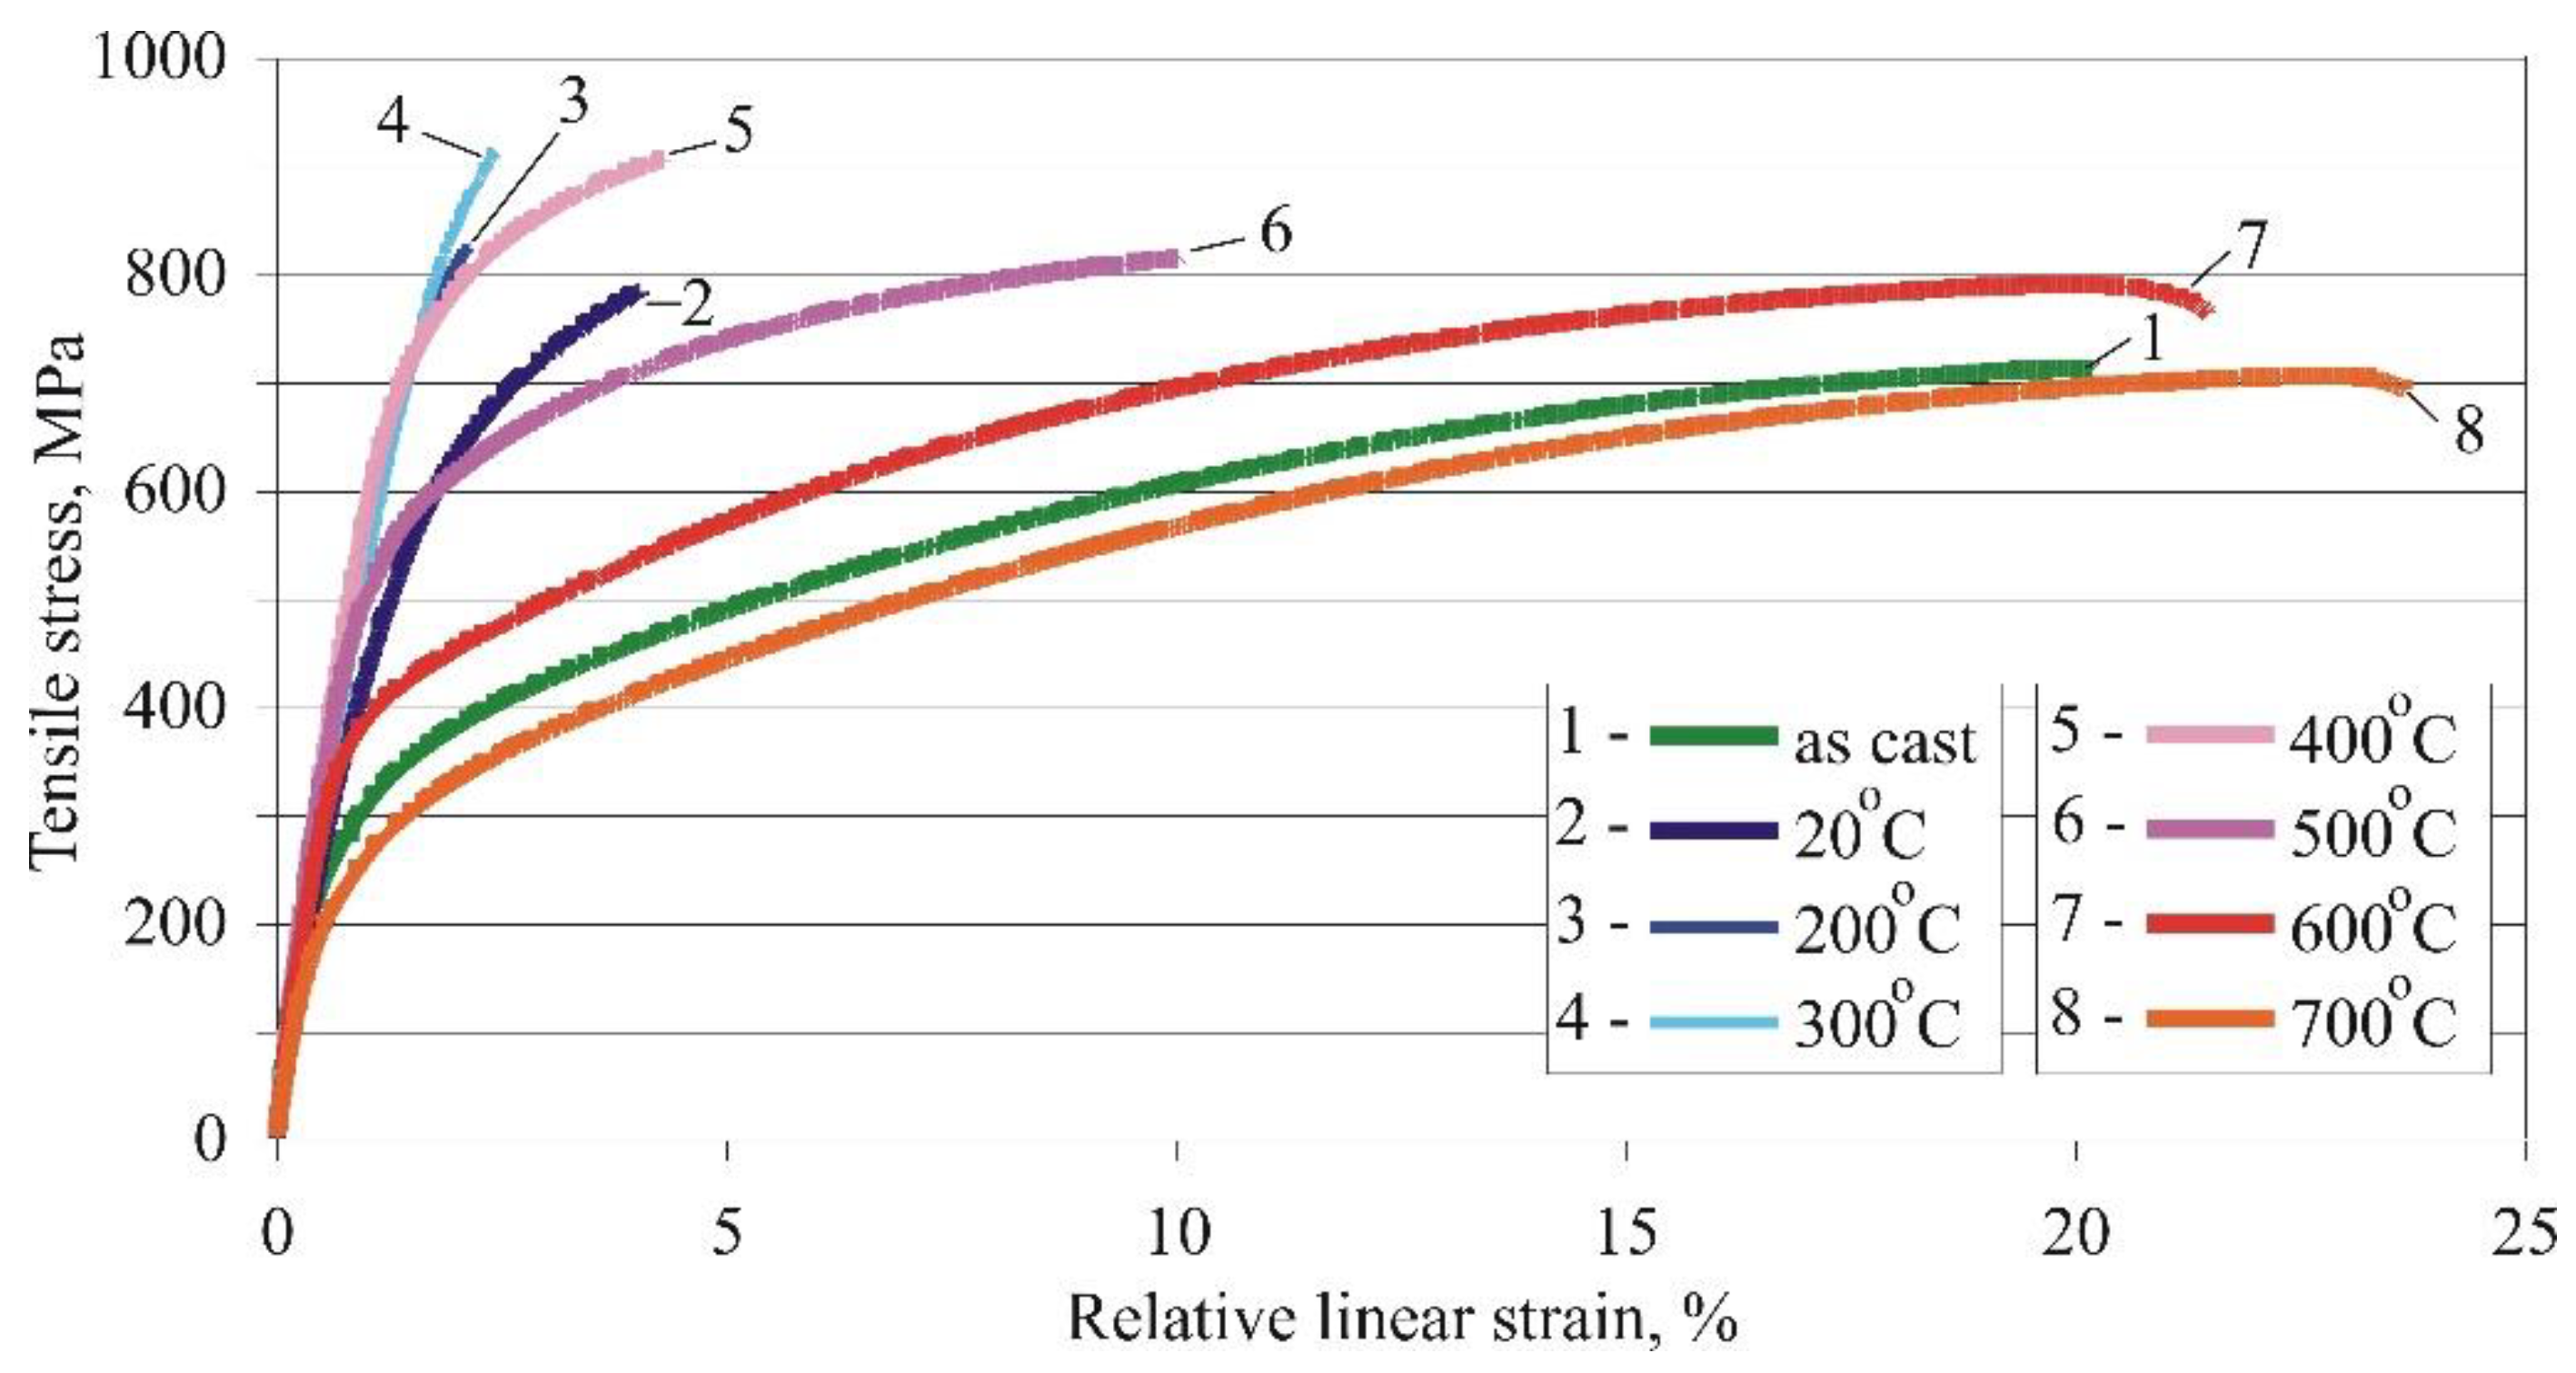
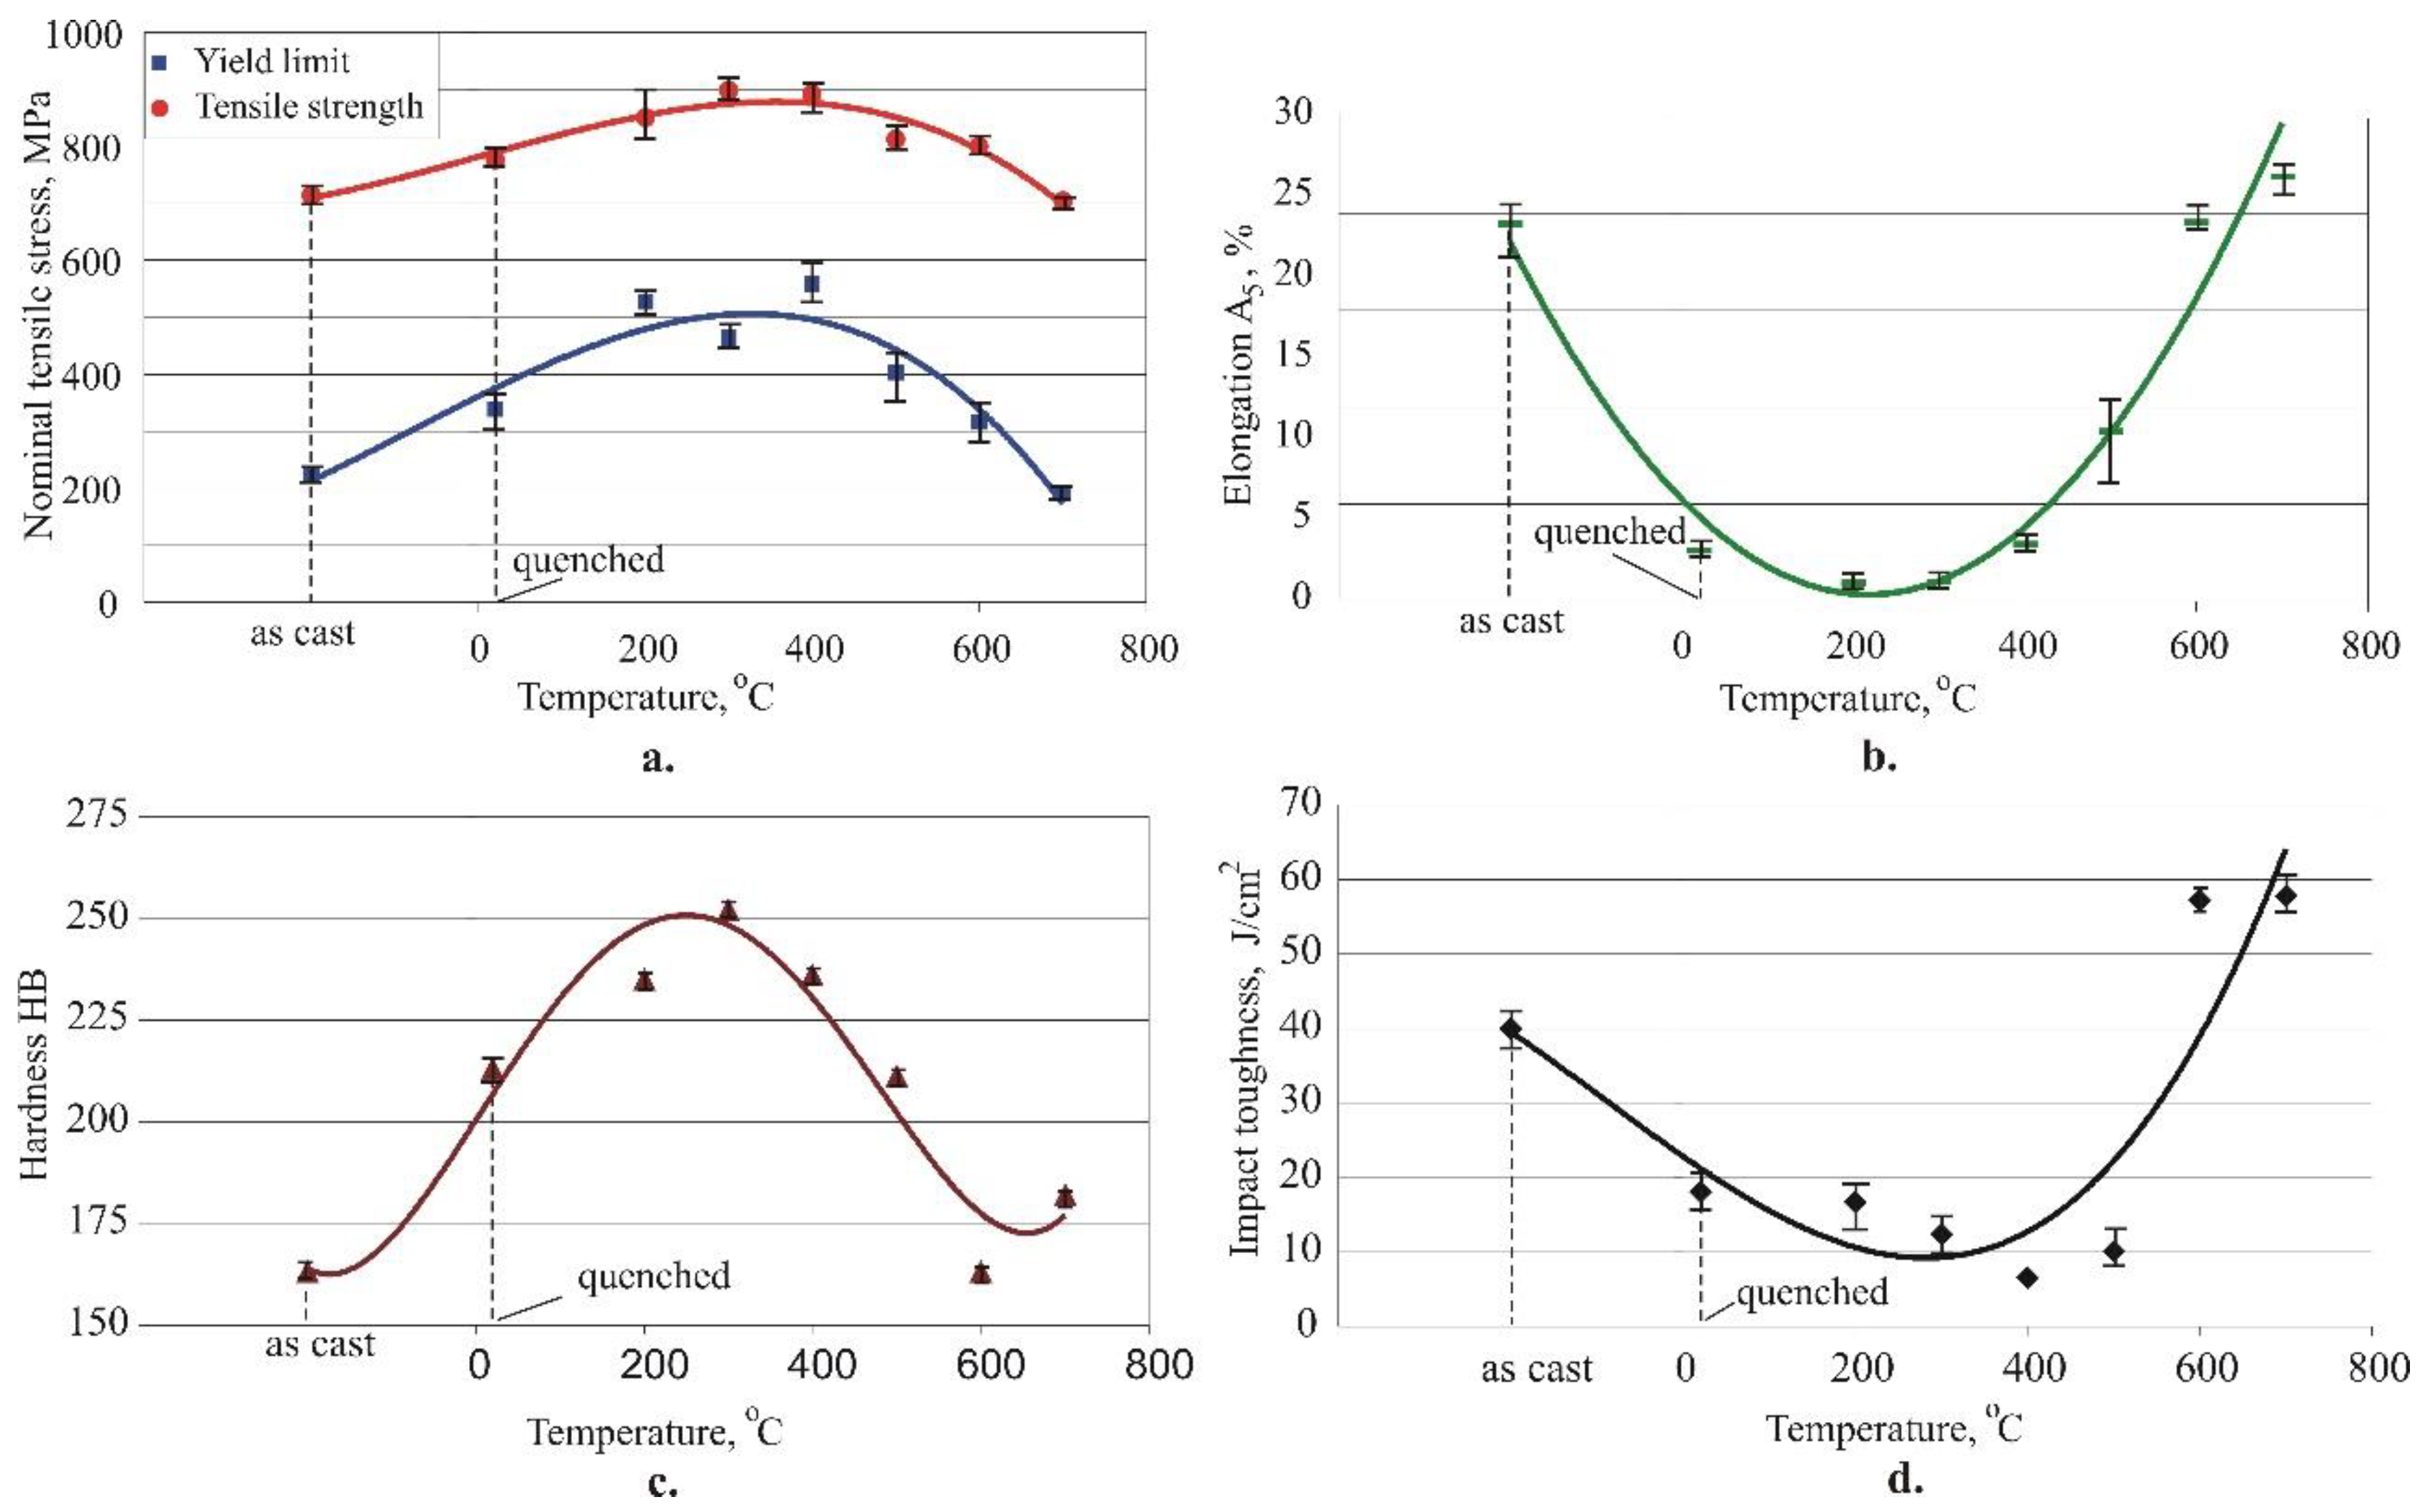
3.1.1. Effects of the ageing temperature
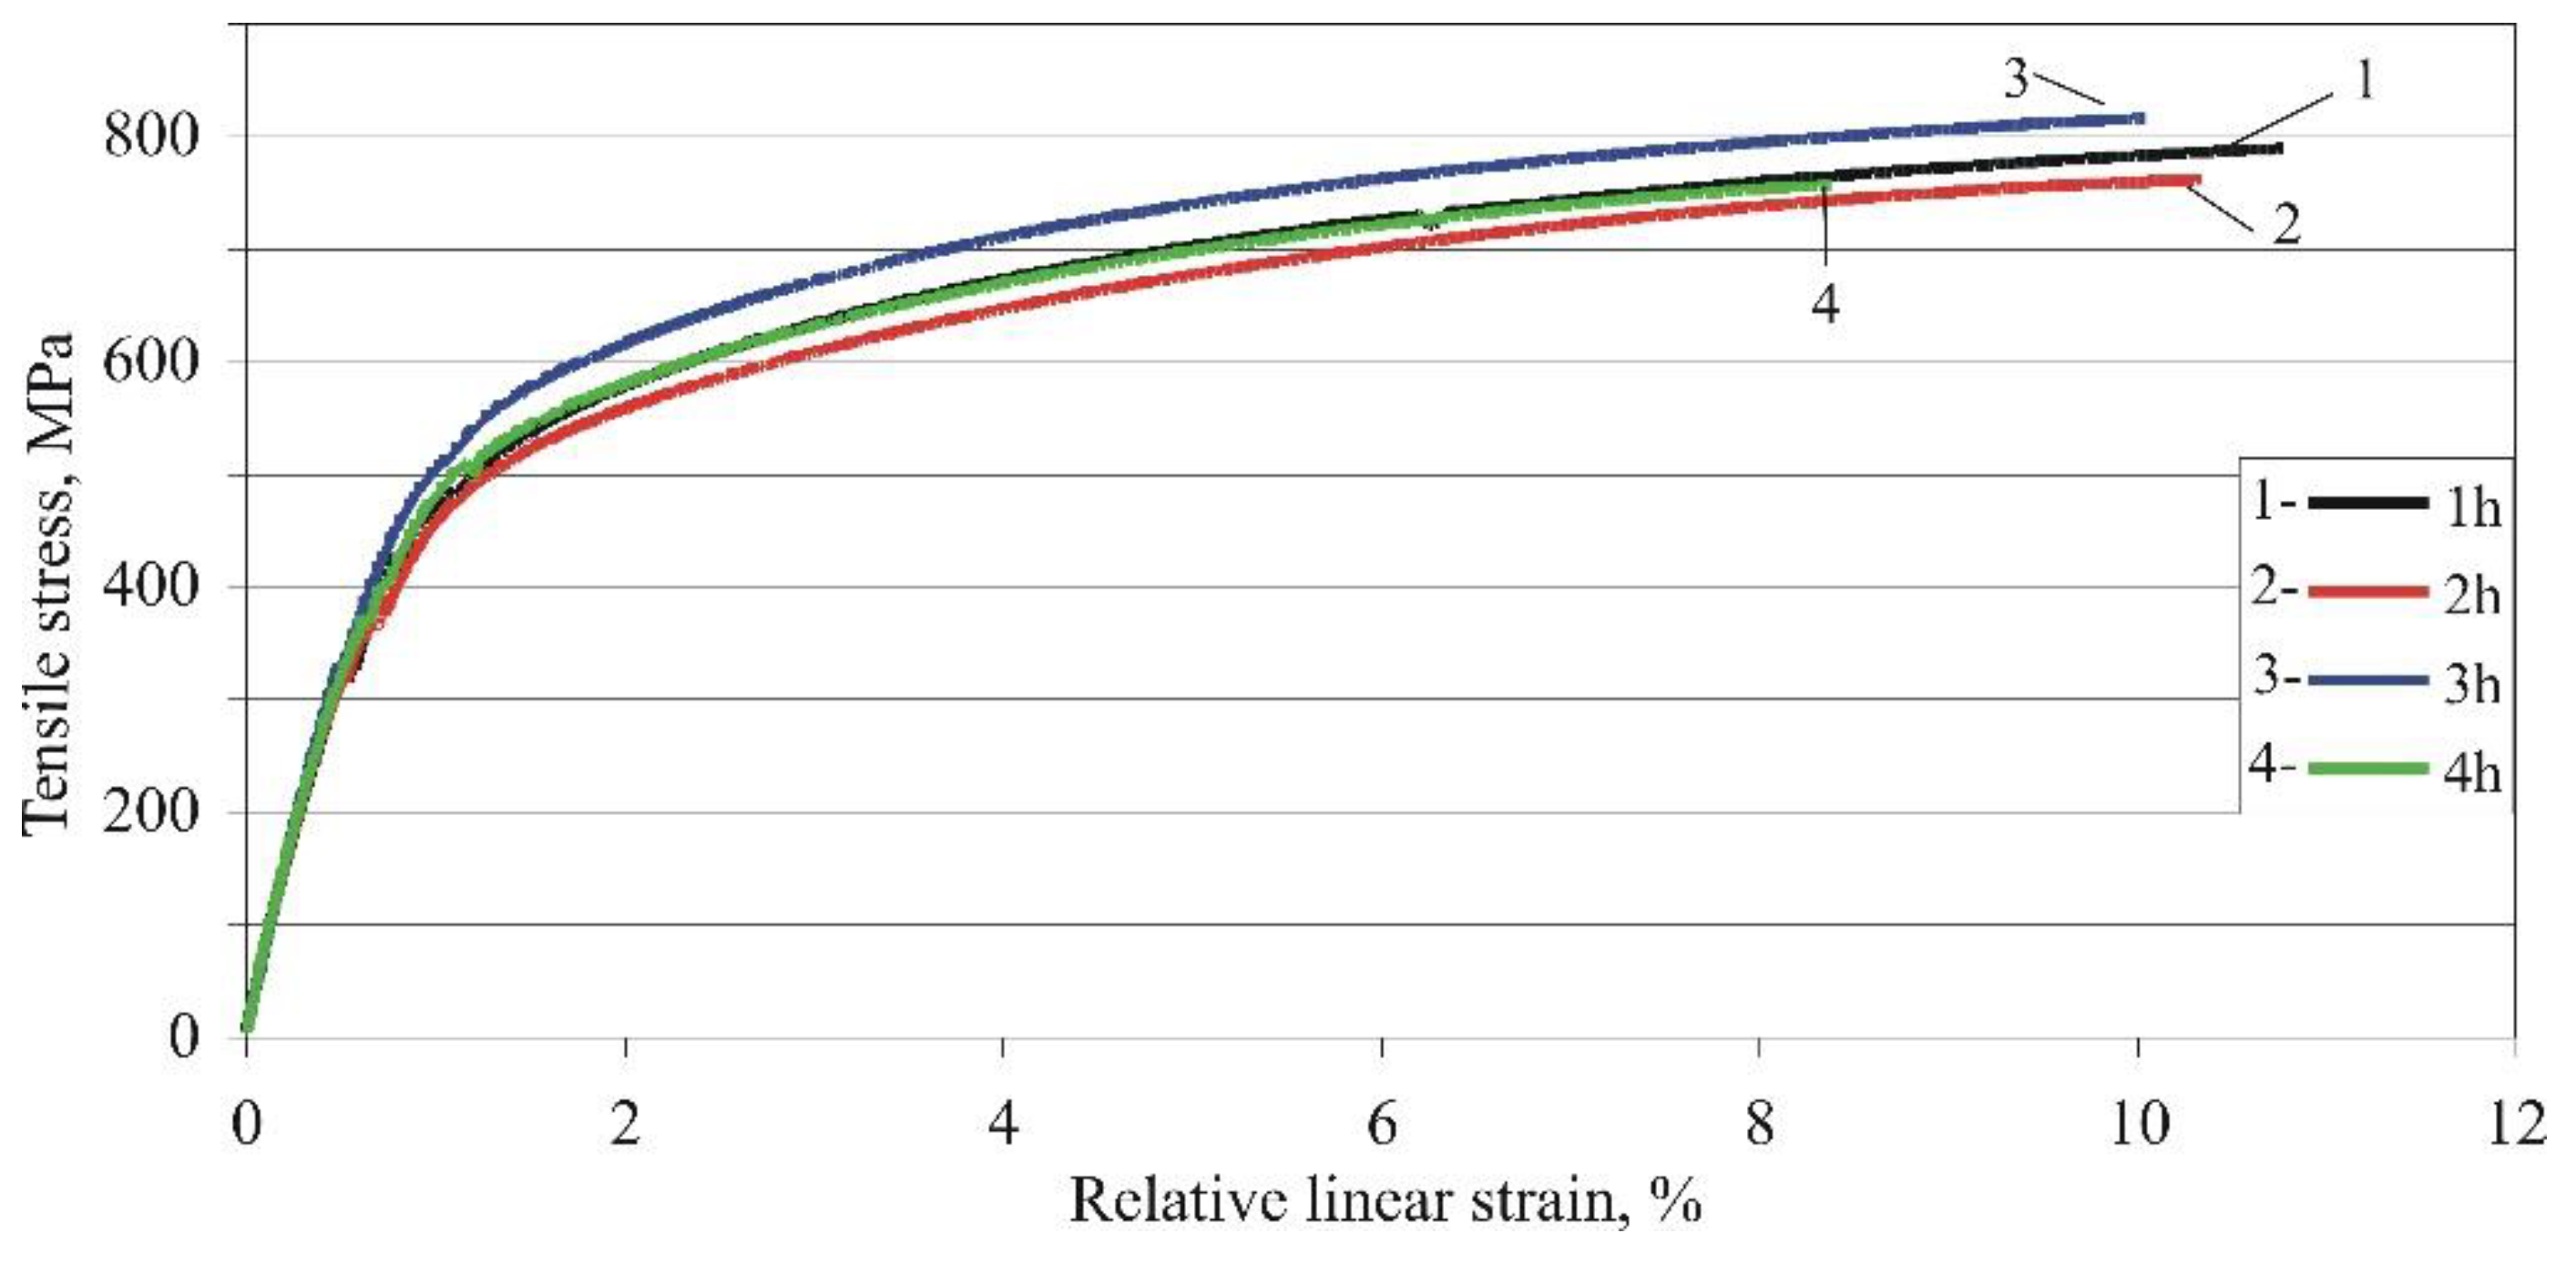
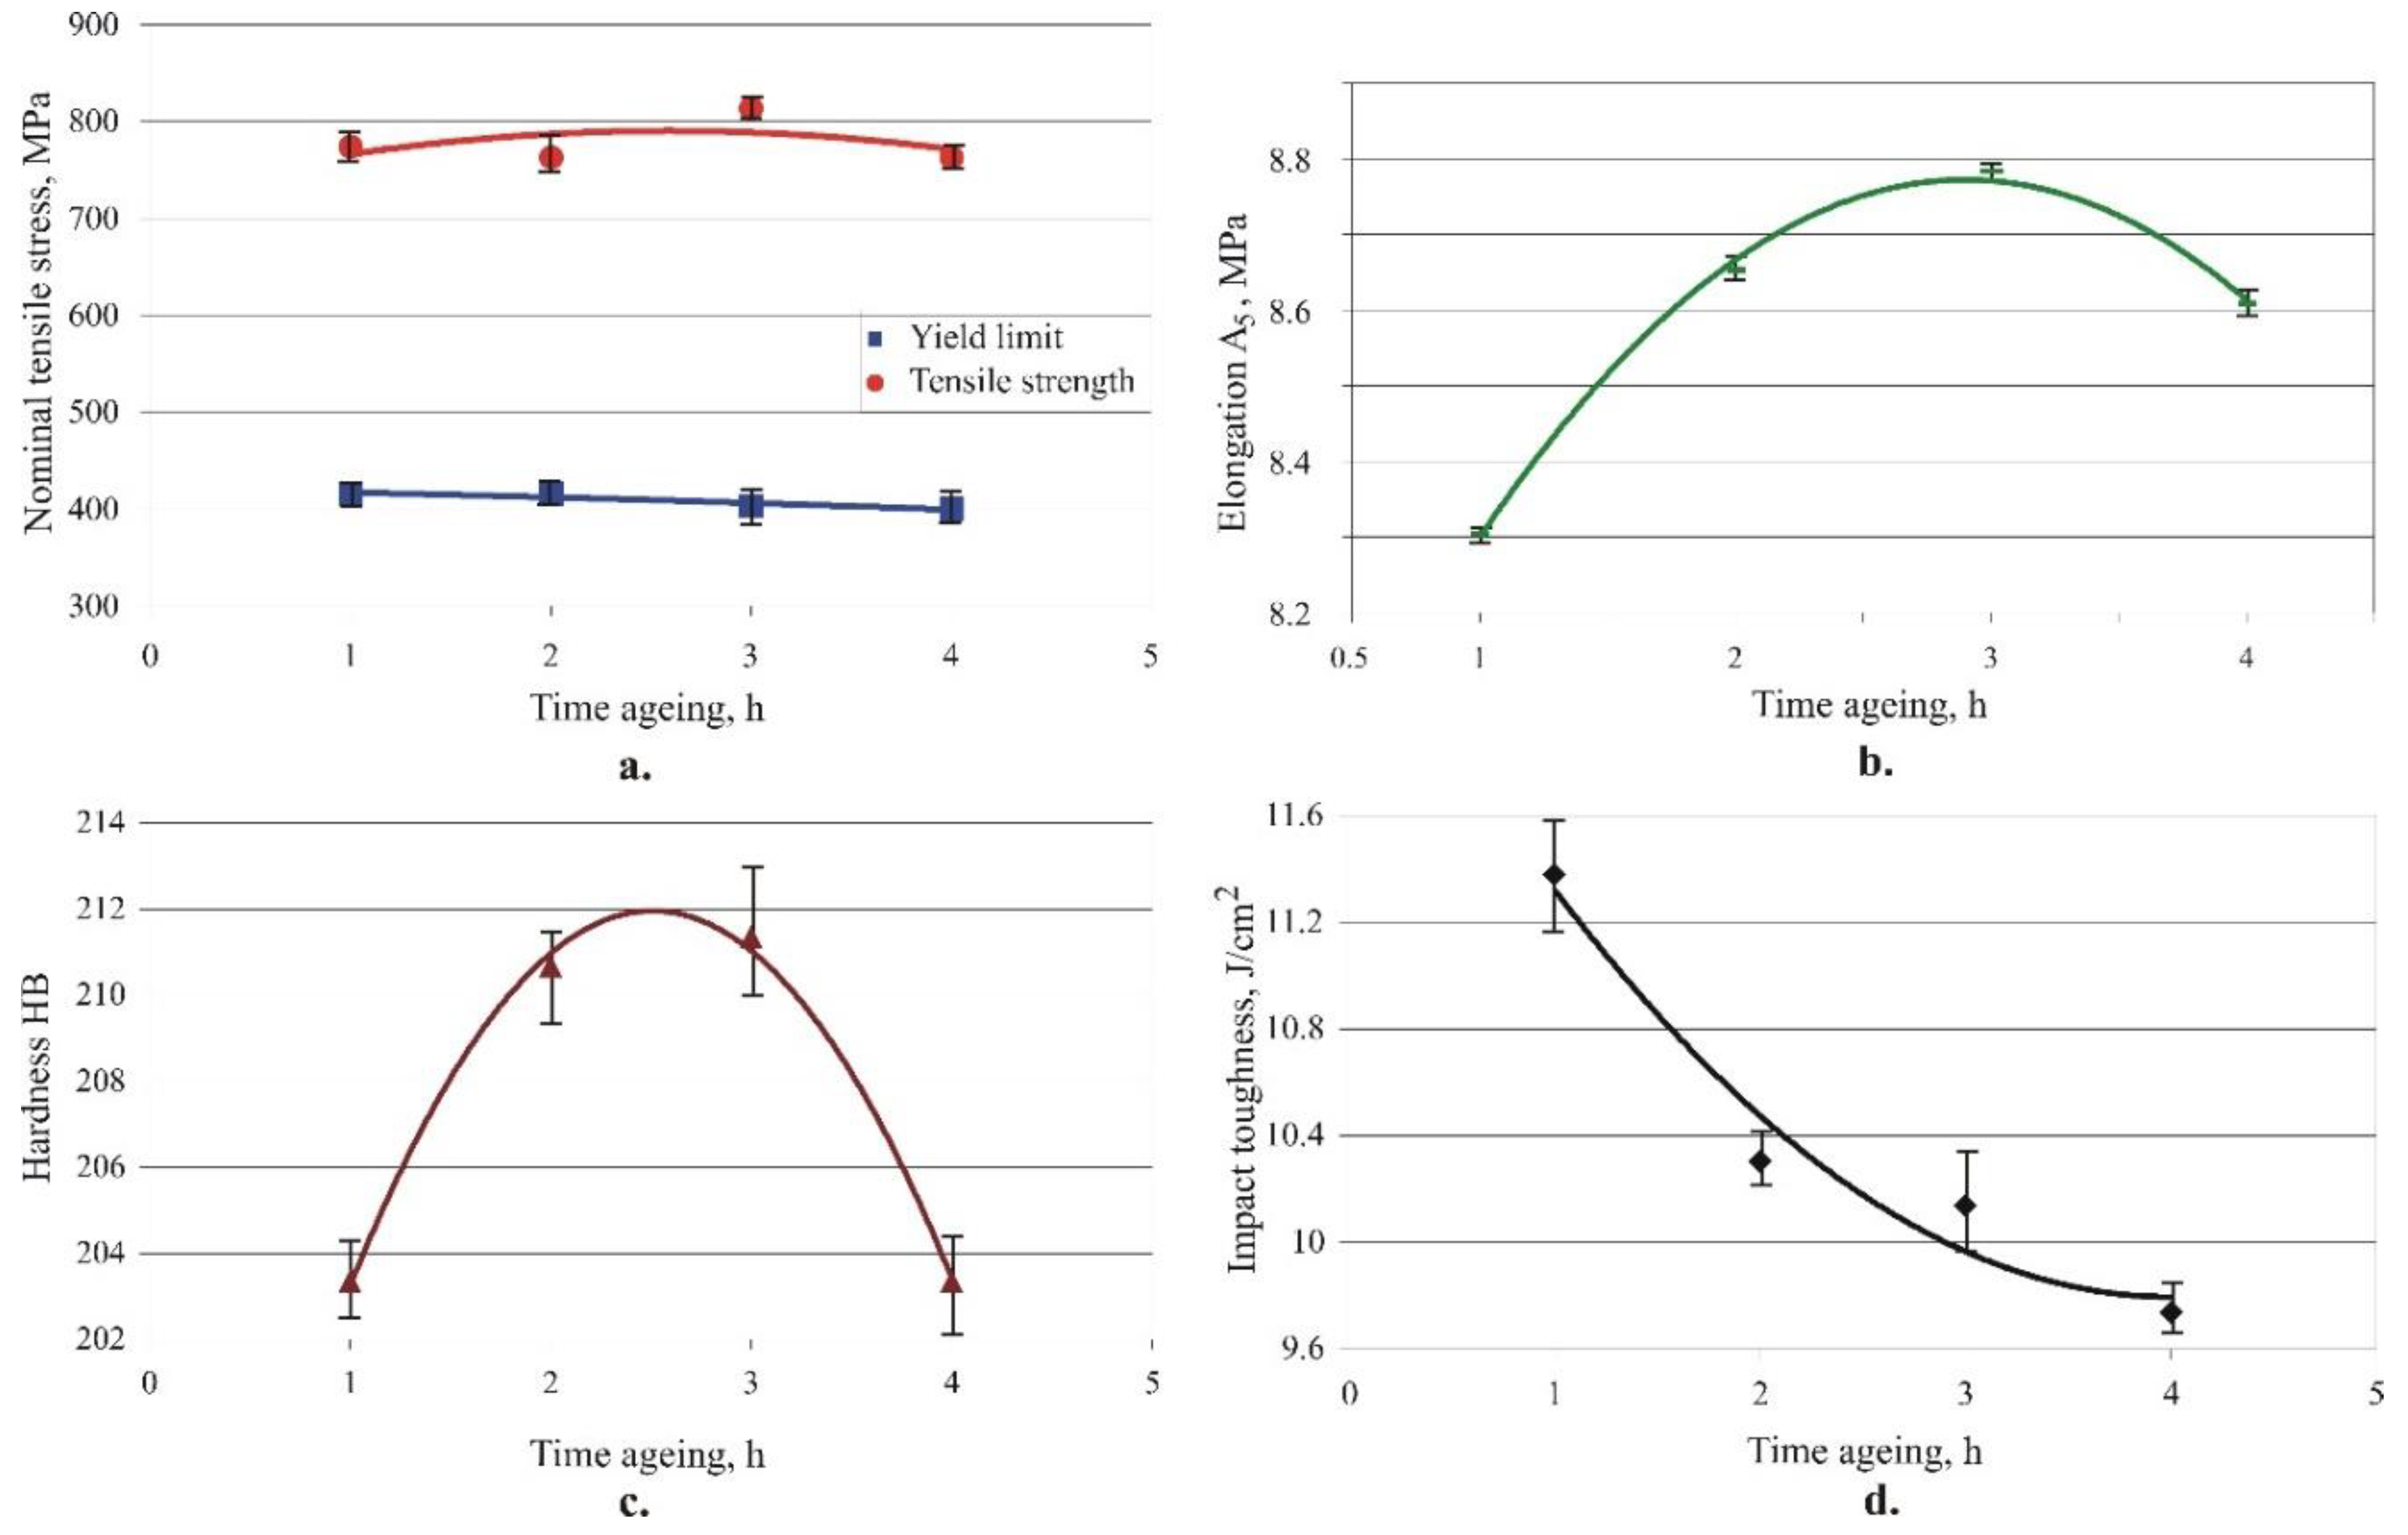
3.1.2. Effects of the ageing time
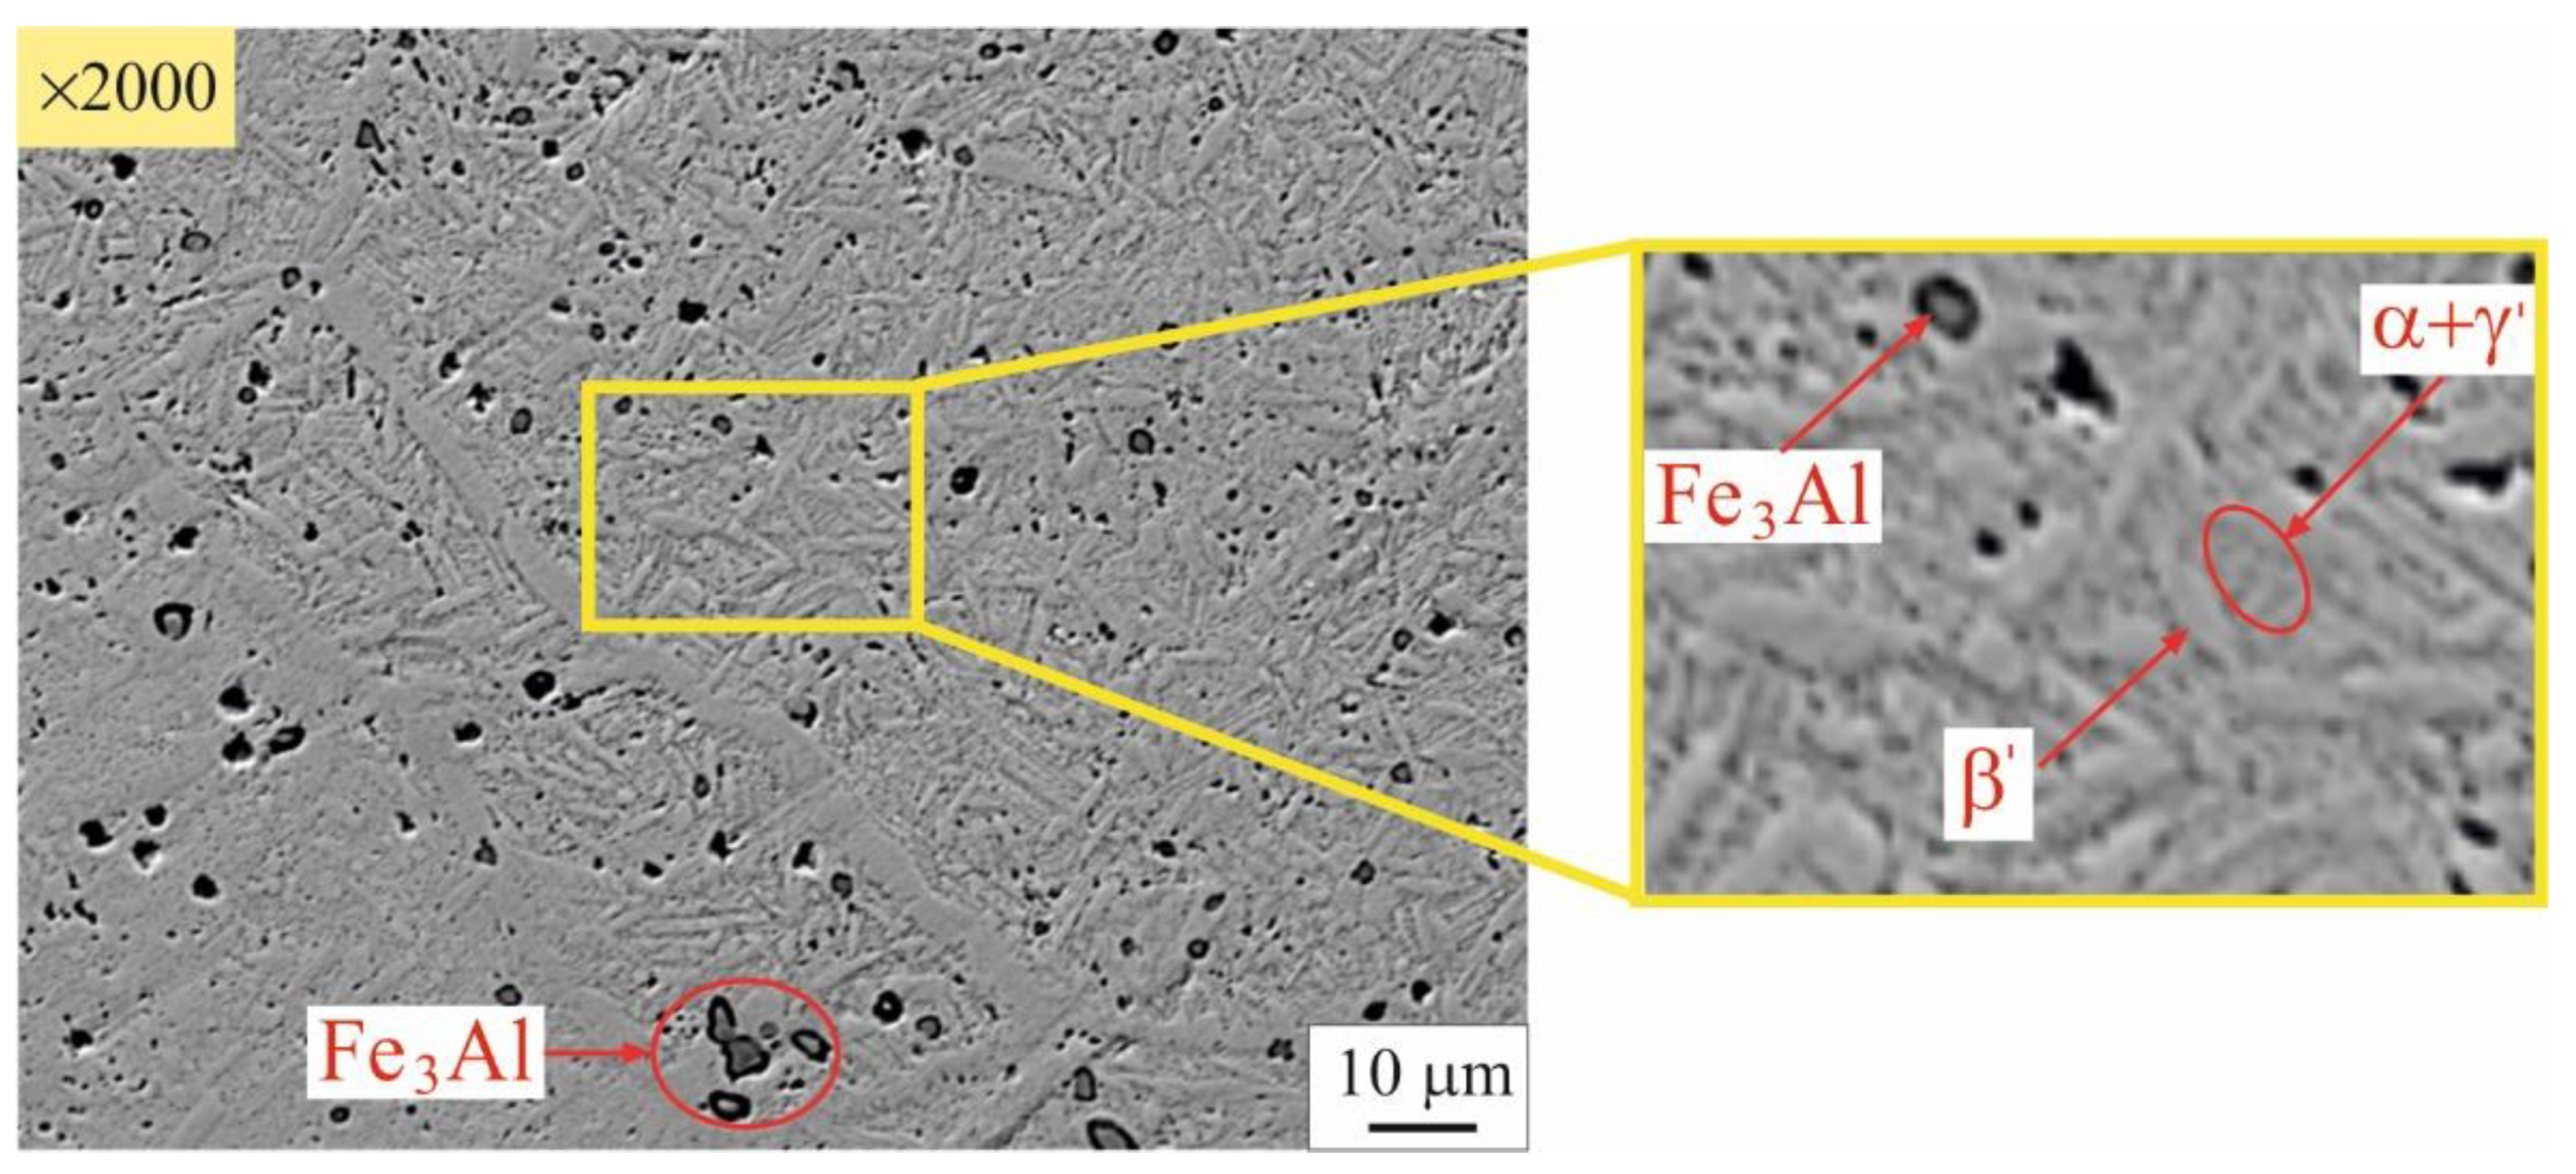
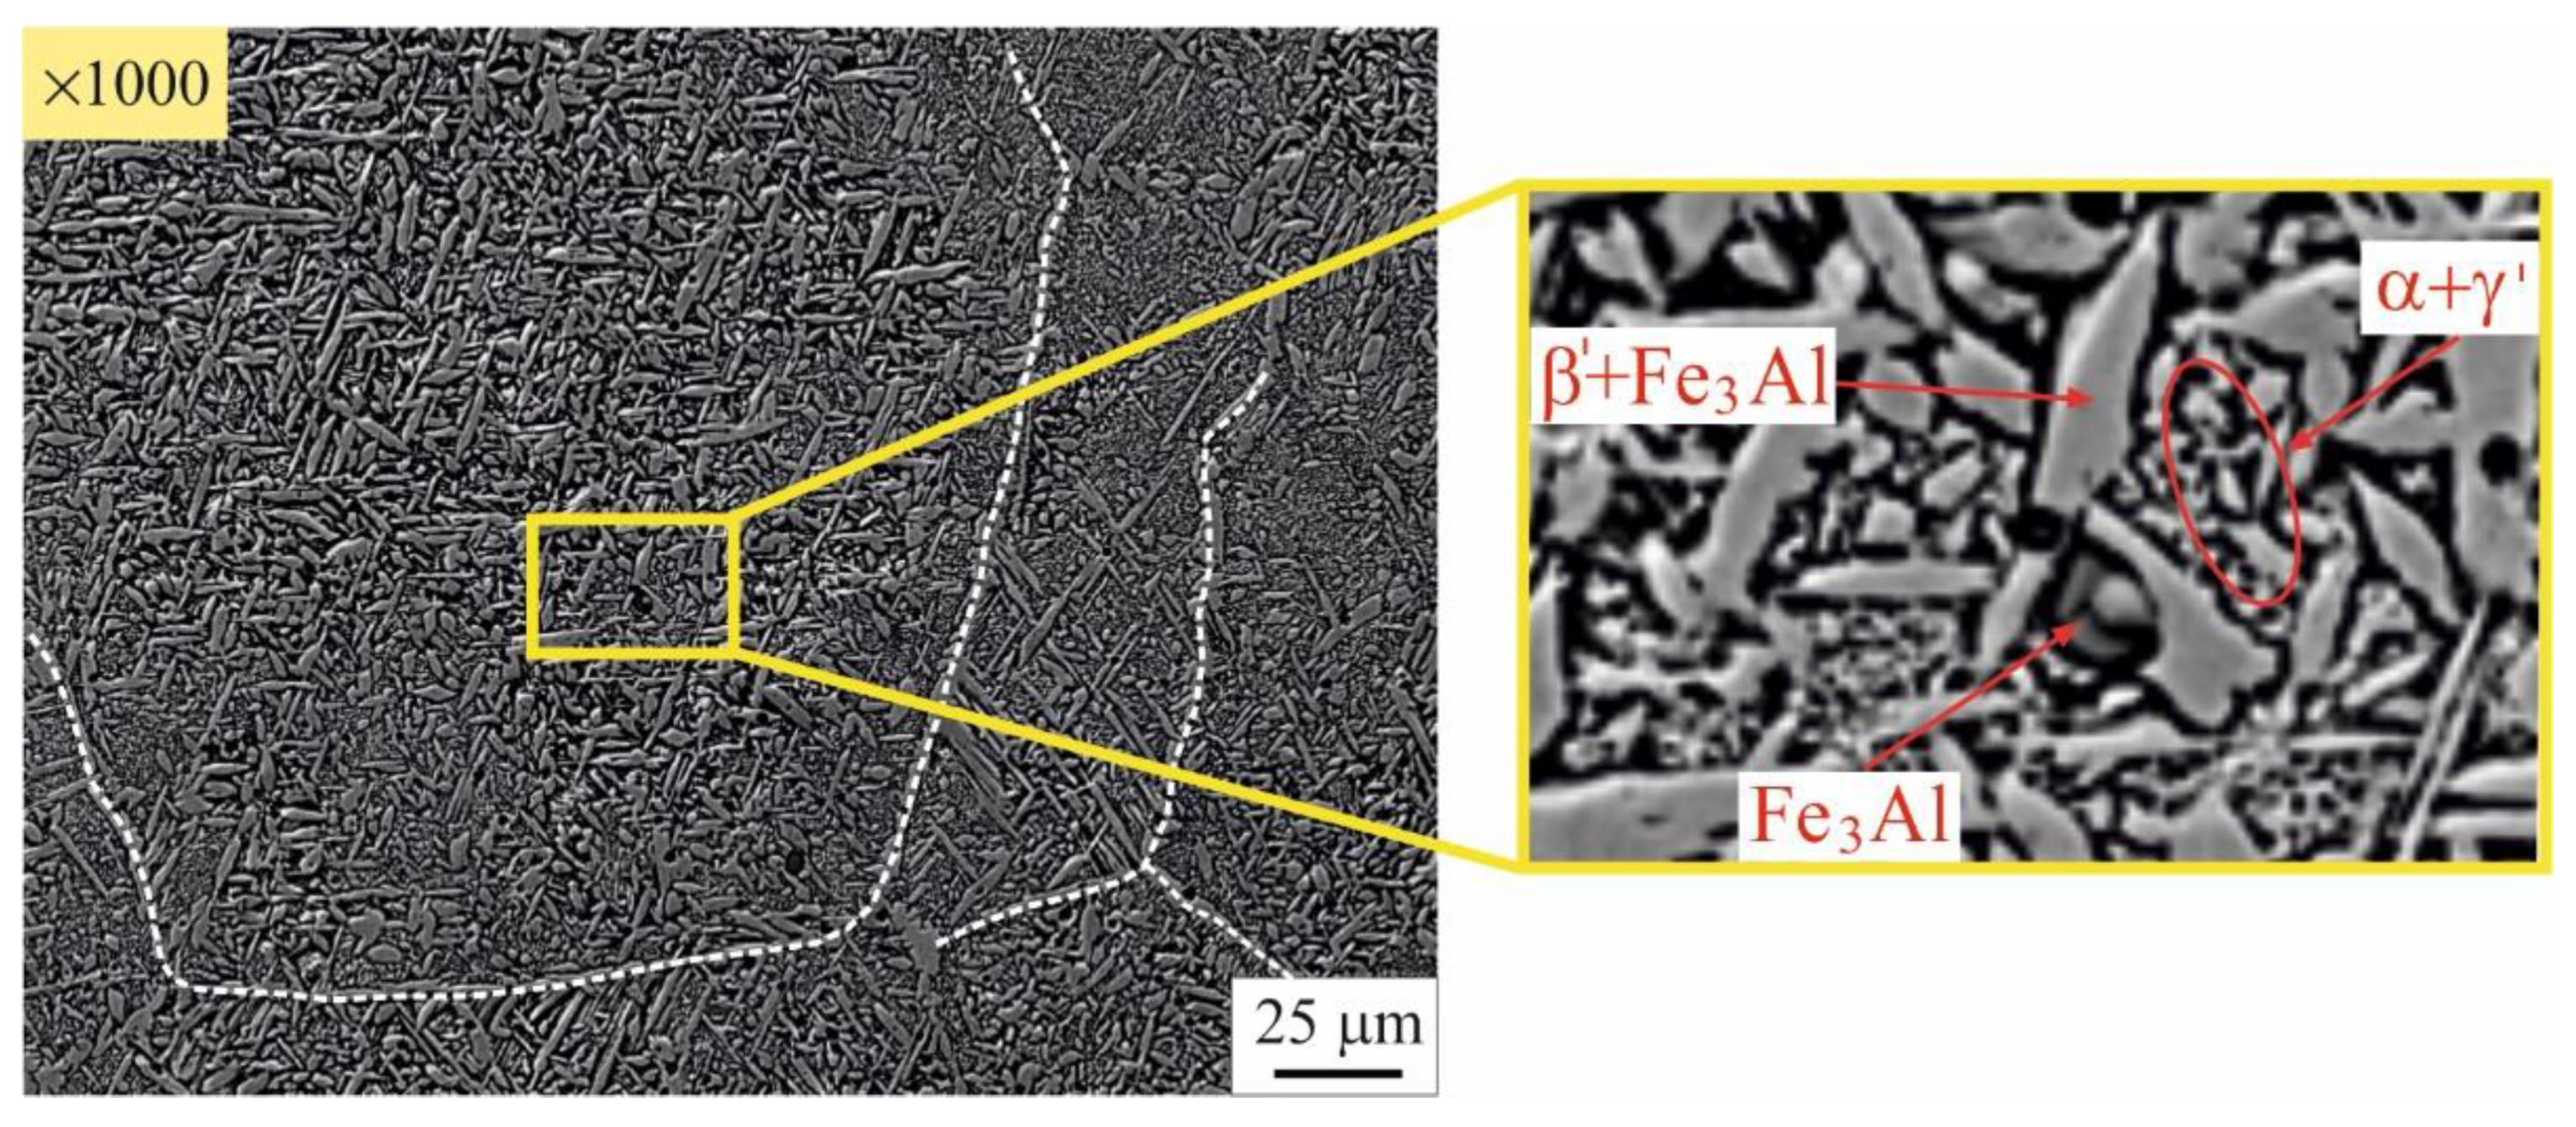
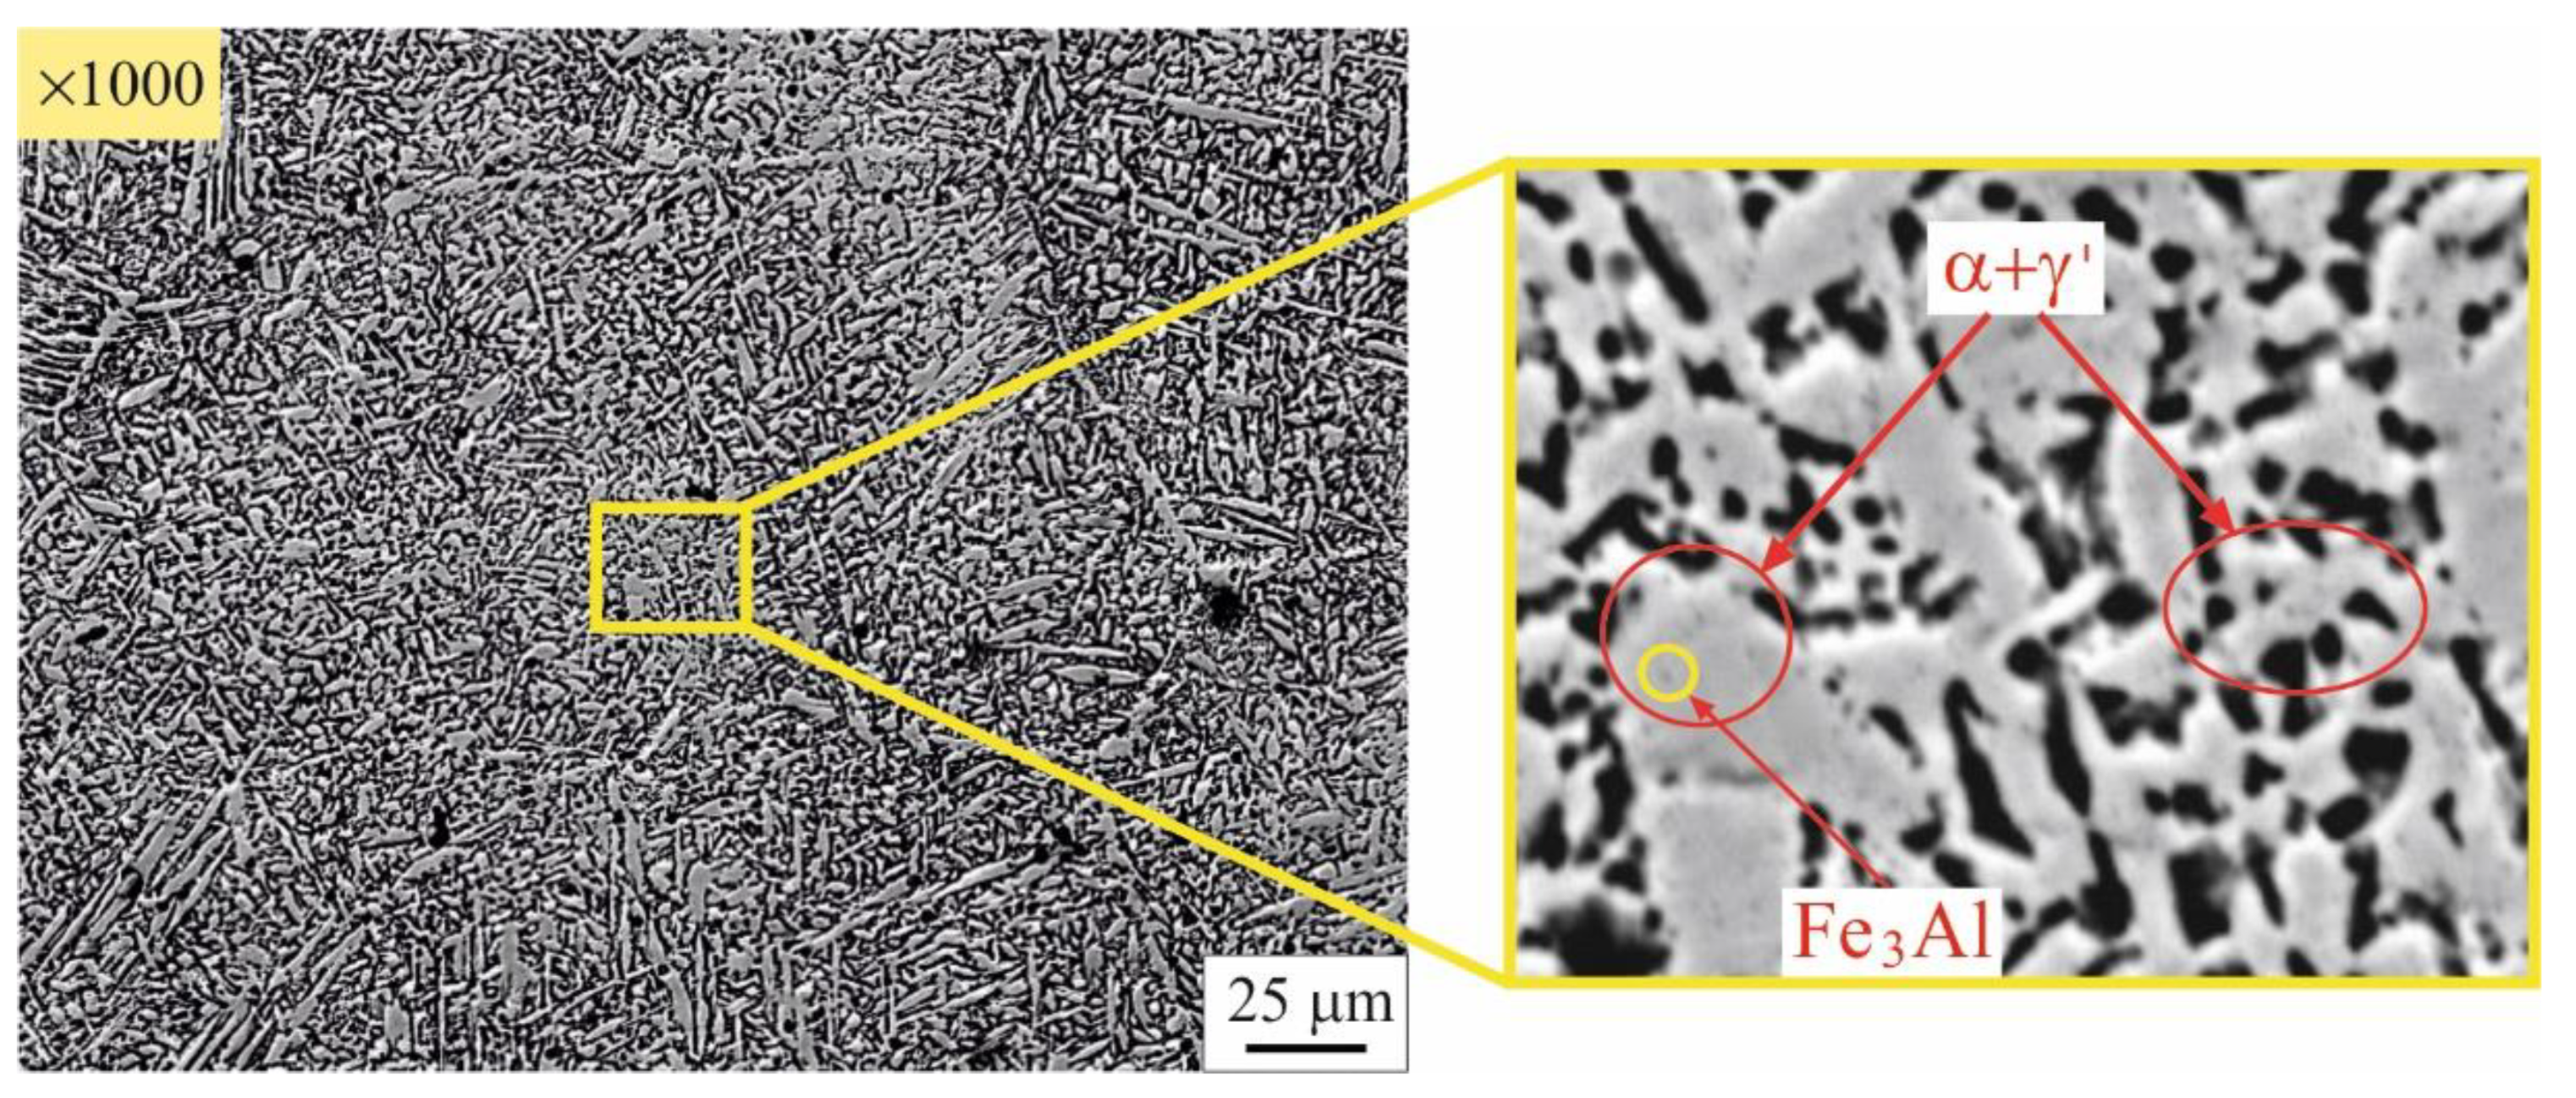
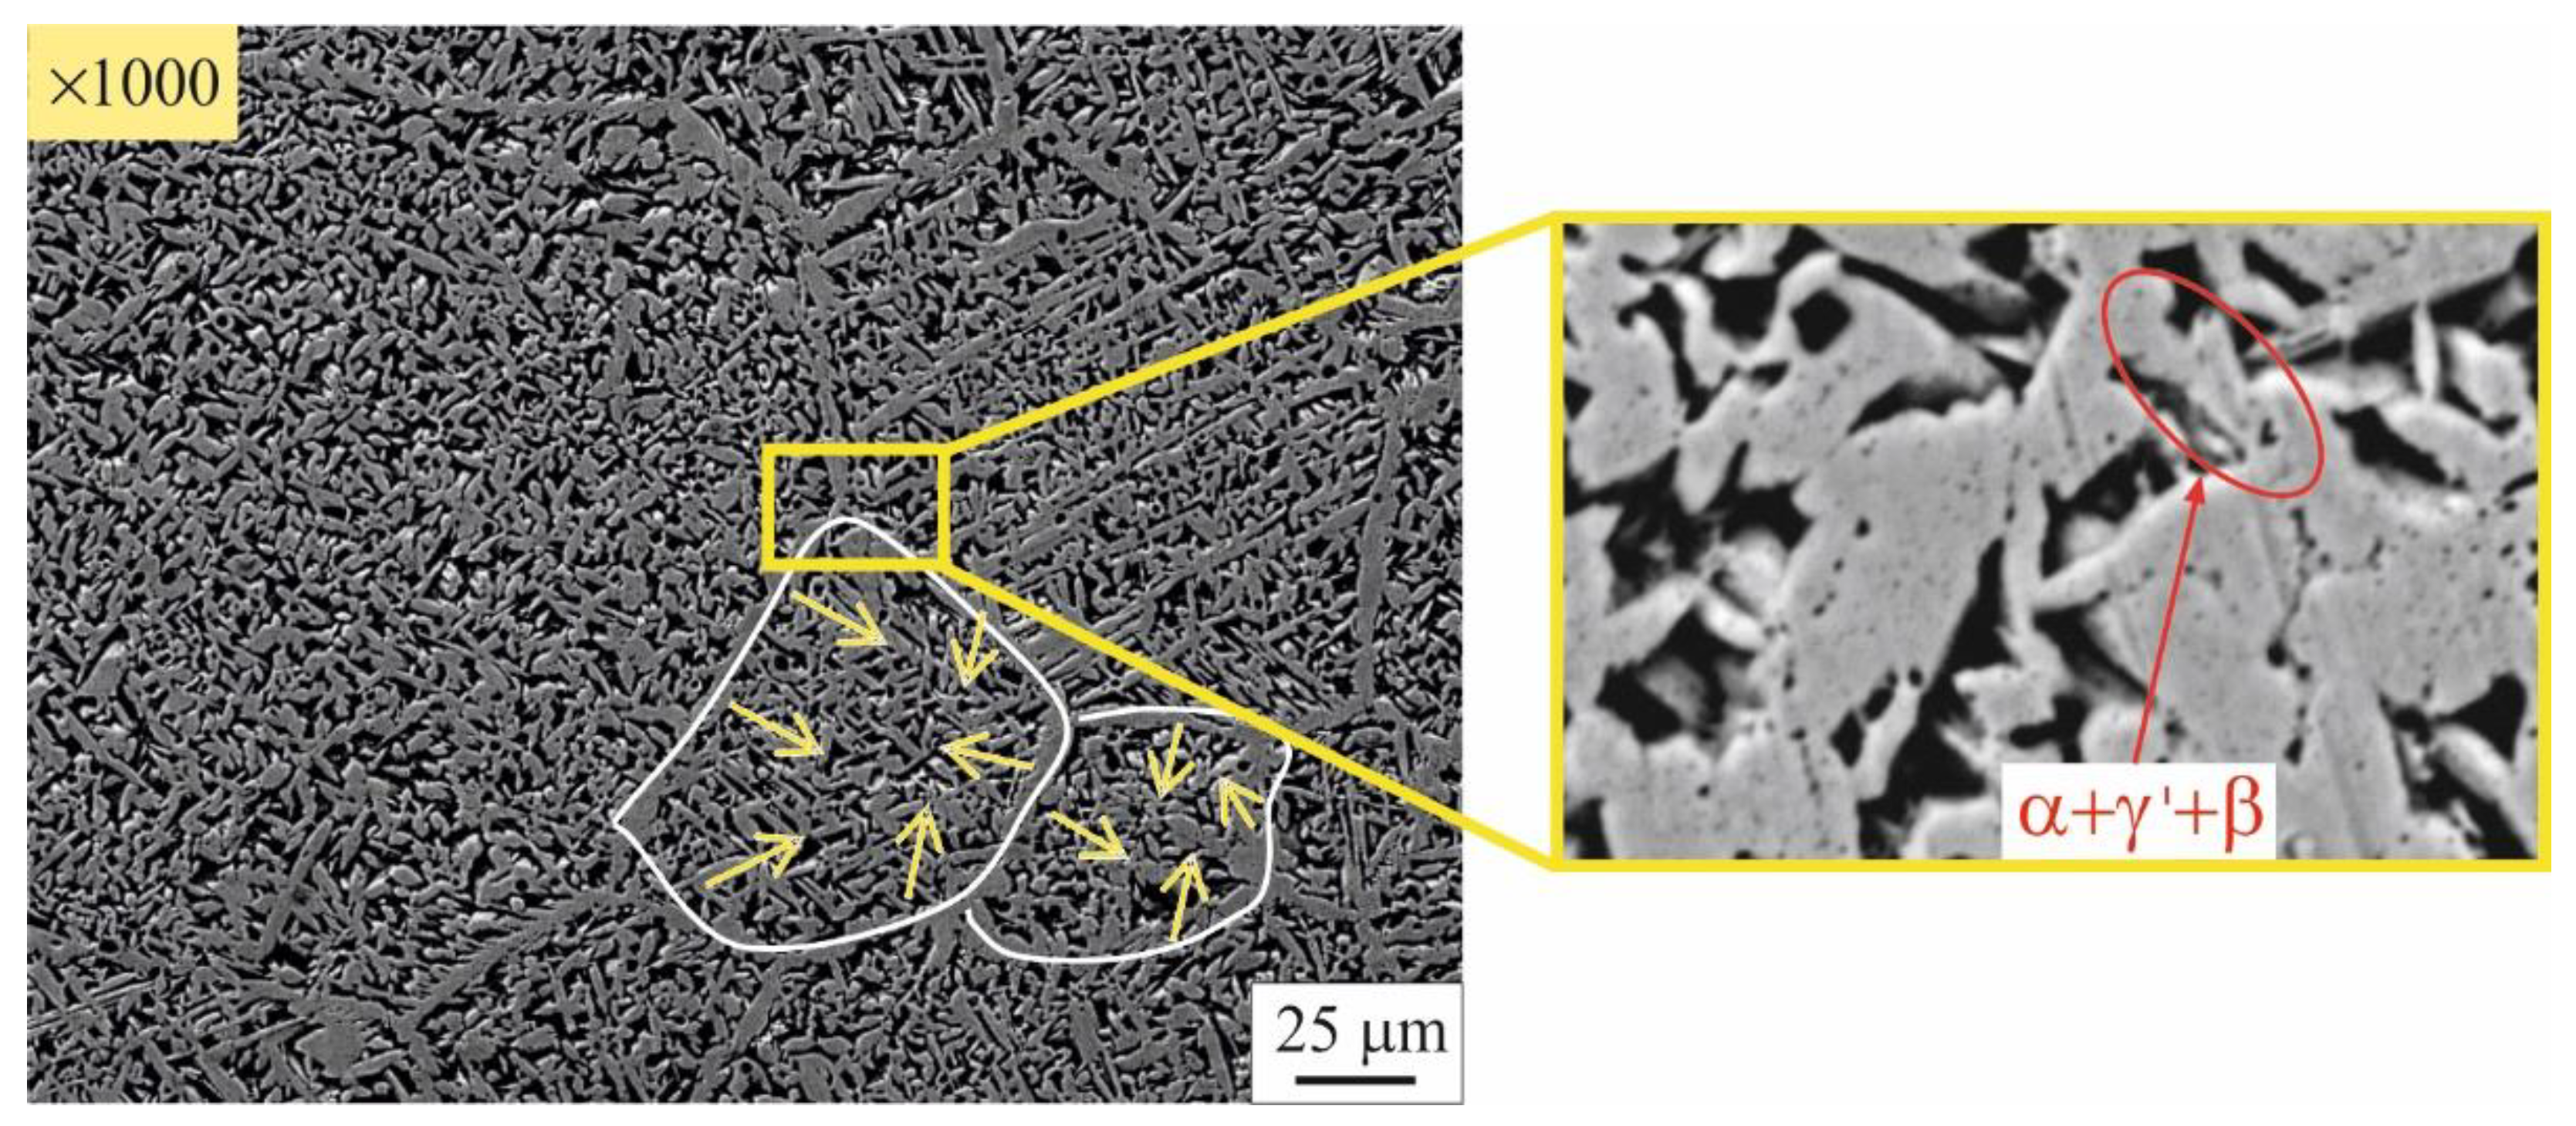
3.2. Microstructure evolution
3.3. Effect of heat treatment on mechanical characteristics: planned experiment and optimization
| Objective fun ctions | Governing factors | ||
|---|---|---|---|
| Codded | Natural | ||
|
-0.19582 0.98008 |
|
431.8 | |
|
0.33077 -0.99671 |
|
812.9 | |
|
0.75517 0.41485 |
|
14.6 | |
|
-0.68099 0.39878 |
|
261.8 | |
|
0.78857 0.00032 |
|
73.65 | |
- 1)
- Maximum plasticity: ;
- 2)
- Maximum impact toughness (dynamic strength): ;
- 3)
-
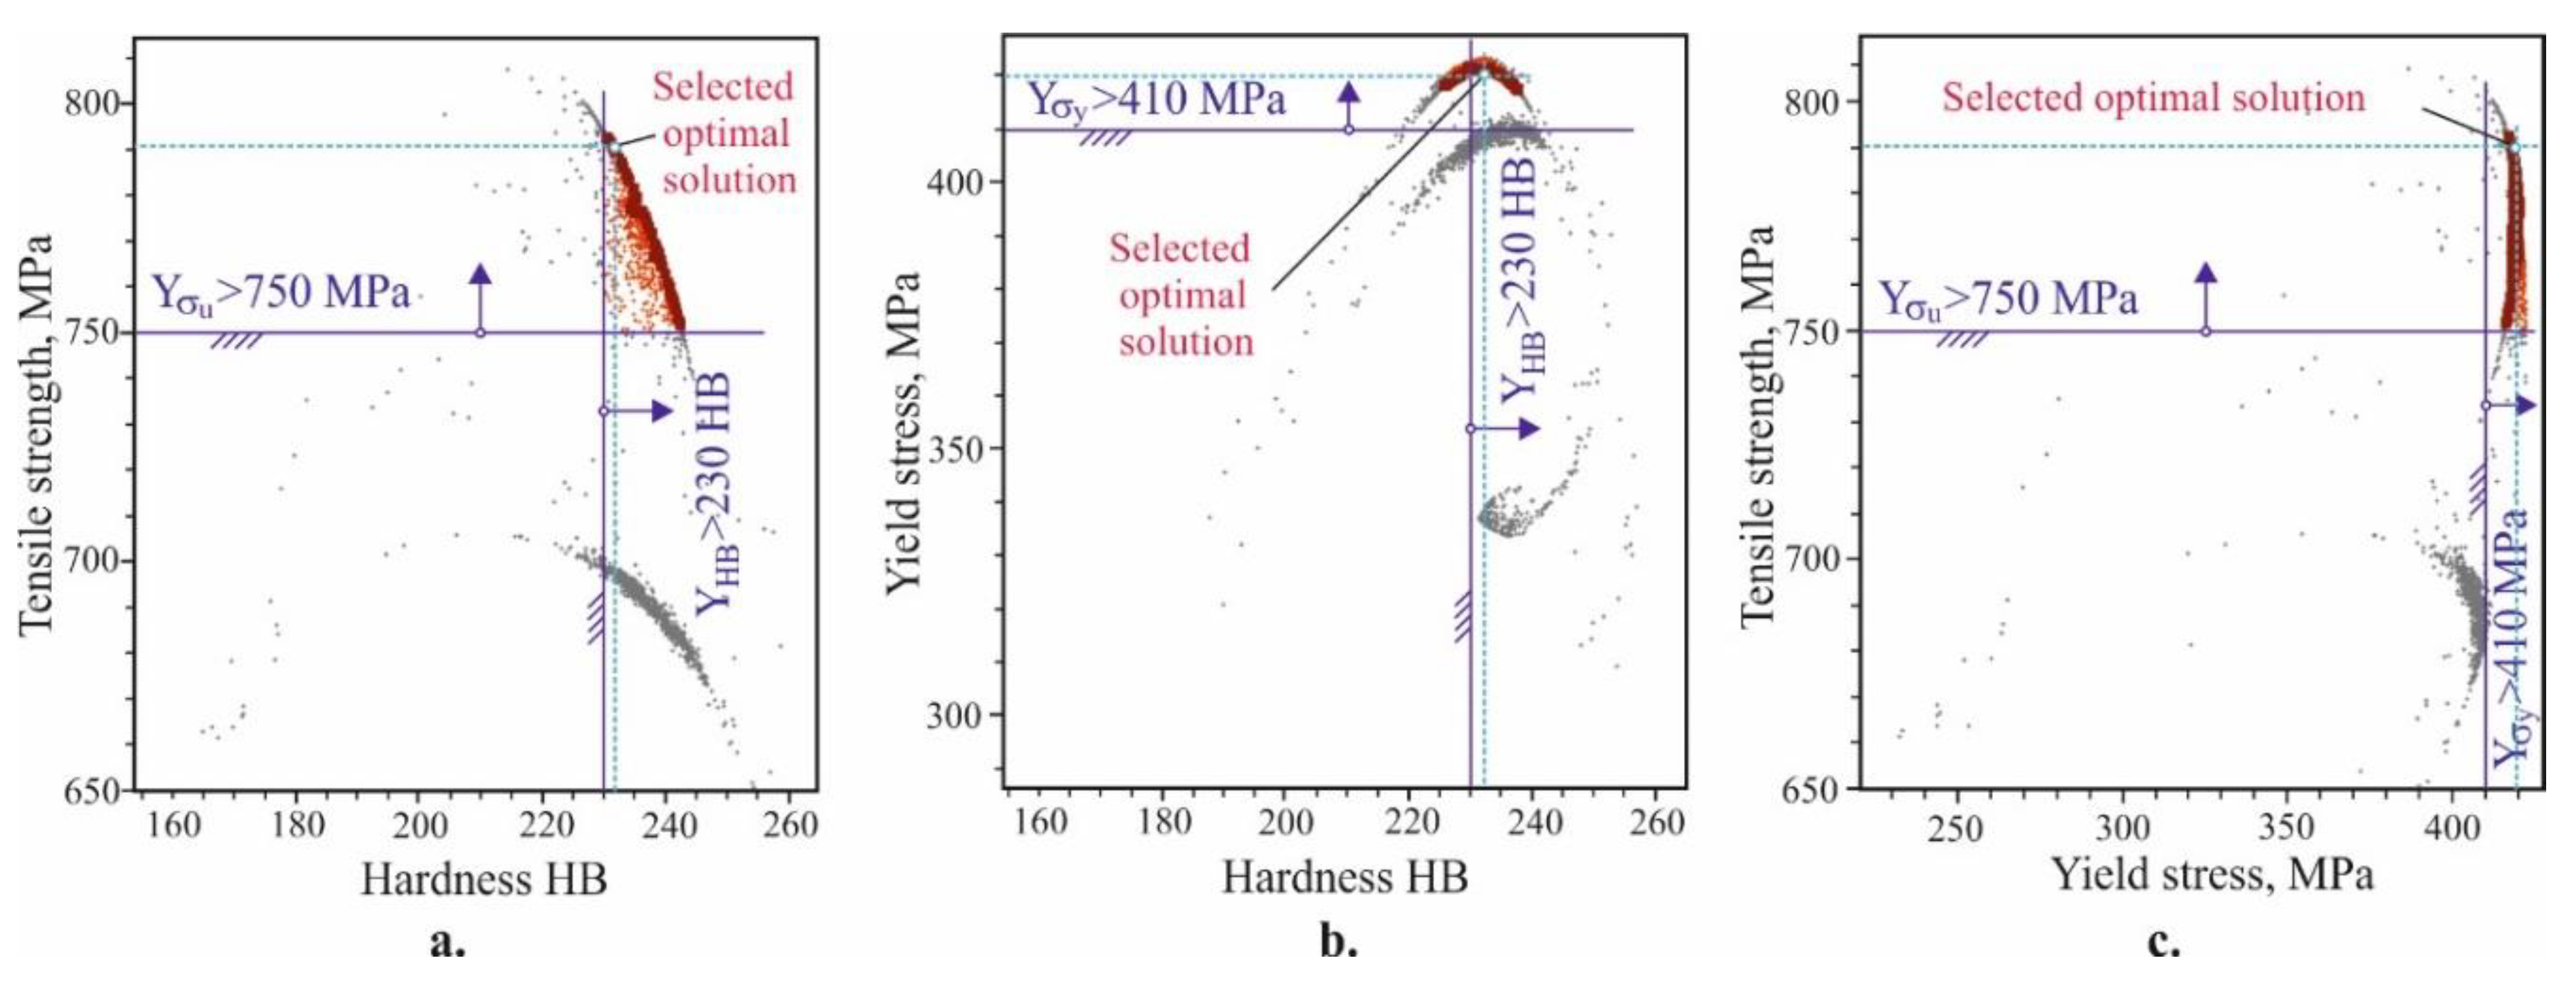
Simultaneous high hardness and static strength: The objective function vector is,
- 4)
-
Simultaneously high hardness, static and dynamic strength: The objective function vector is.
4. Conclusions
- The primary mechanical characteristics (yield limit, tensile strength, elongation, hardness and impact toughness) of IAB with β-transformation vary widely depending on the governing parameters of the ageing heat treatment. Therefore, they characteristics can be appropriately controlled according to the functional purpose of the corresponding bronze component. Of the two governing factors (temperature and time), the ageing temperature has a significantly greater weight. The temperature interval 640°C to 650°C maximises plasticity and dynamic strength, whereas hardness and static strength reach the maximum value in the interval of 280°C to 500°C.
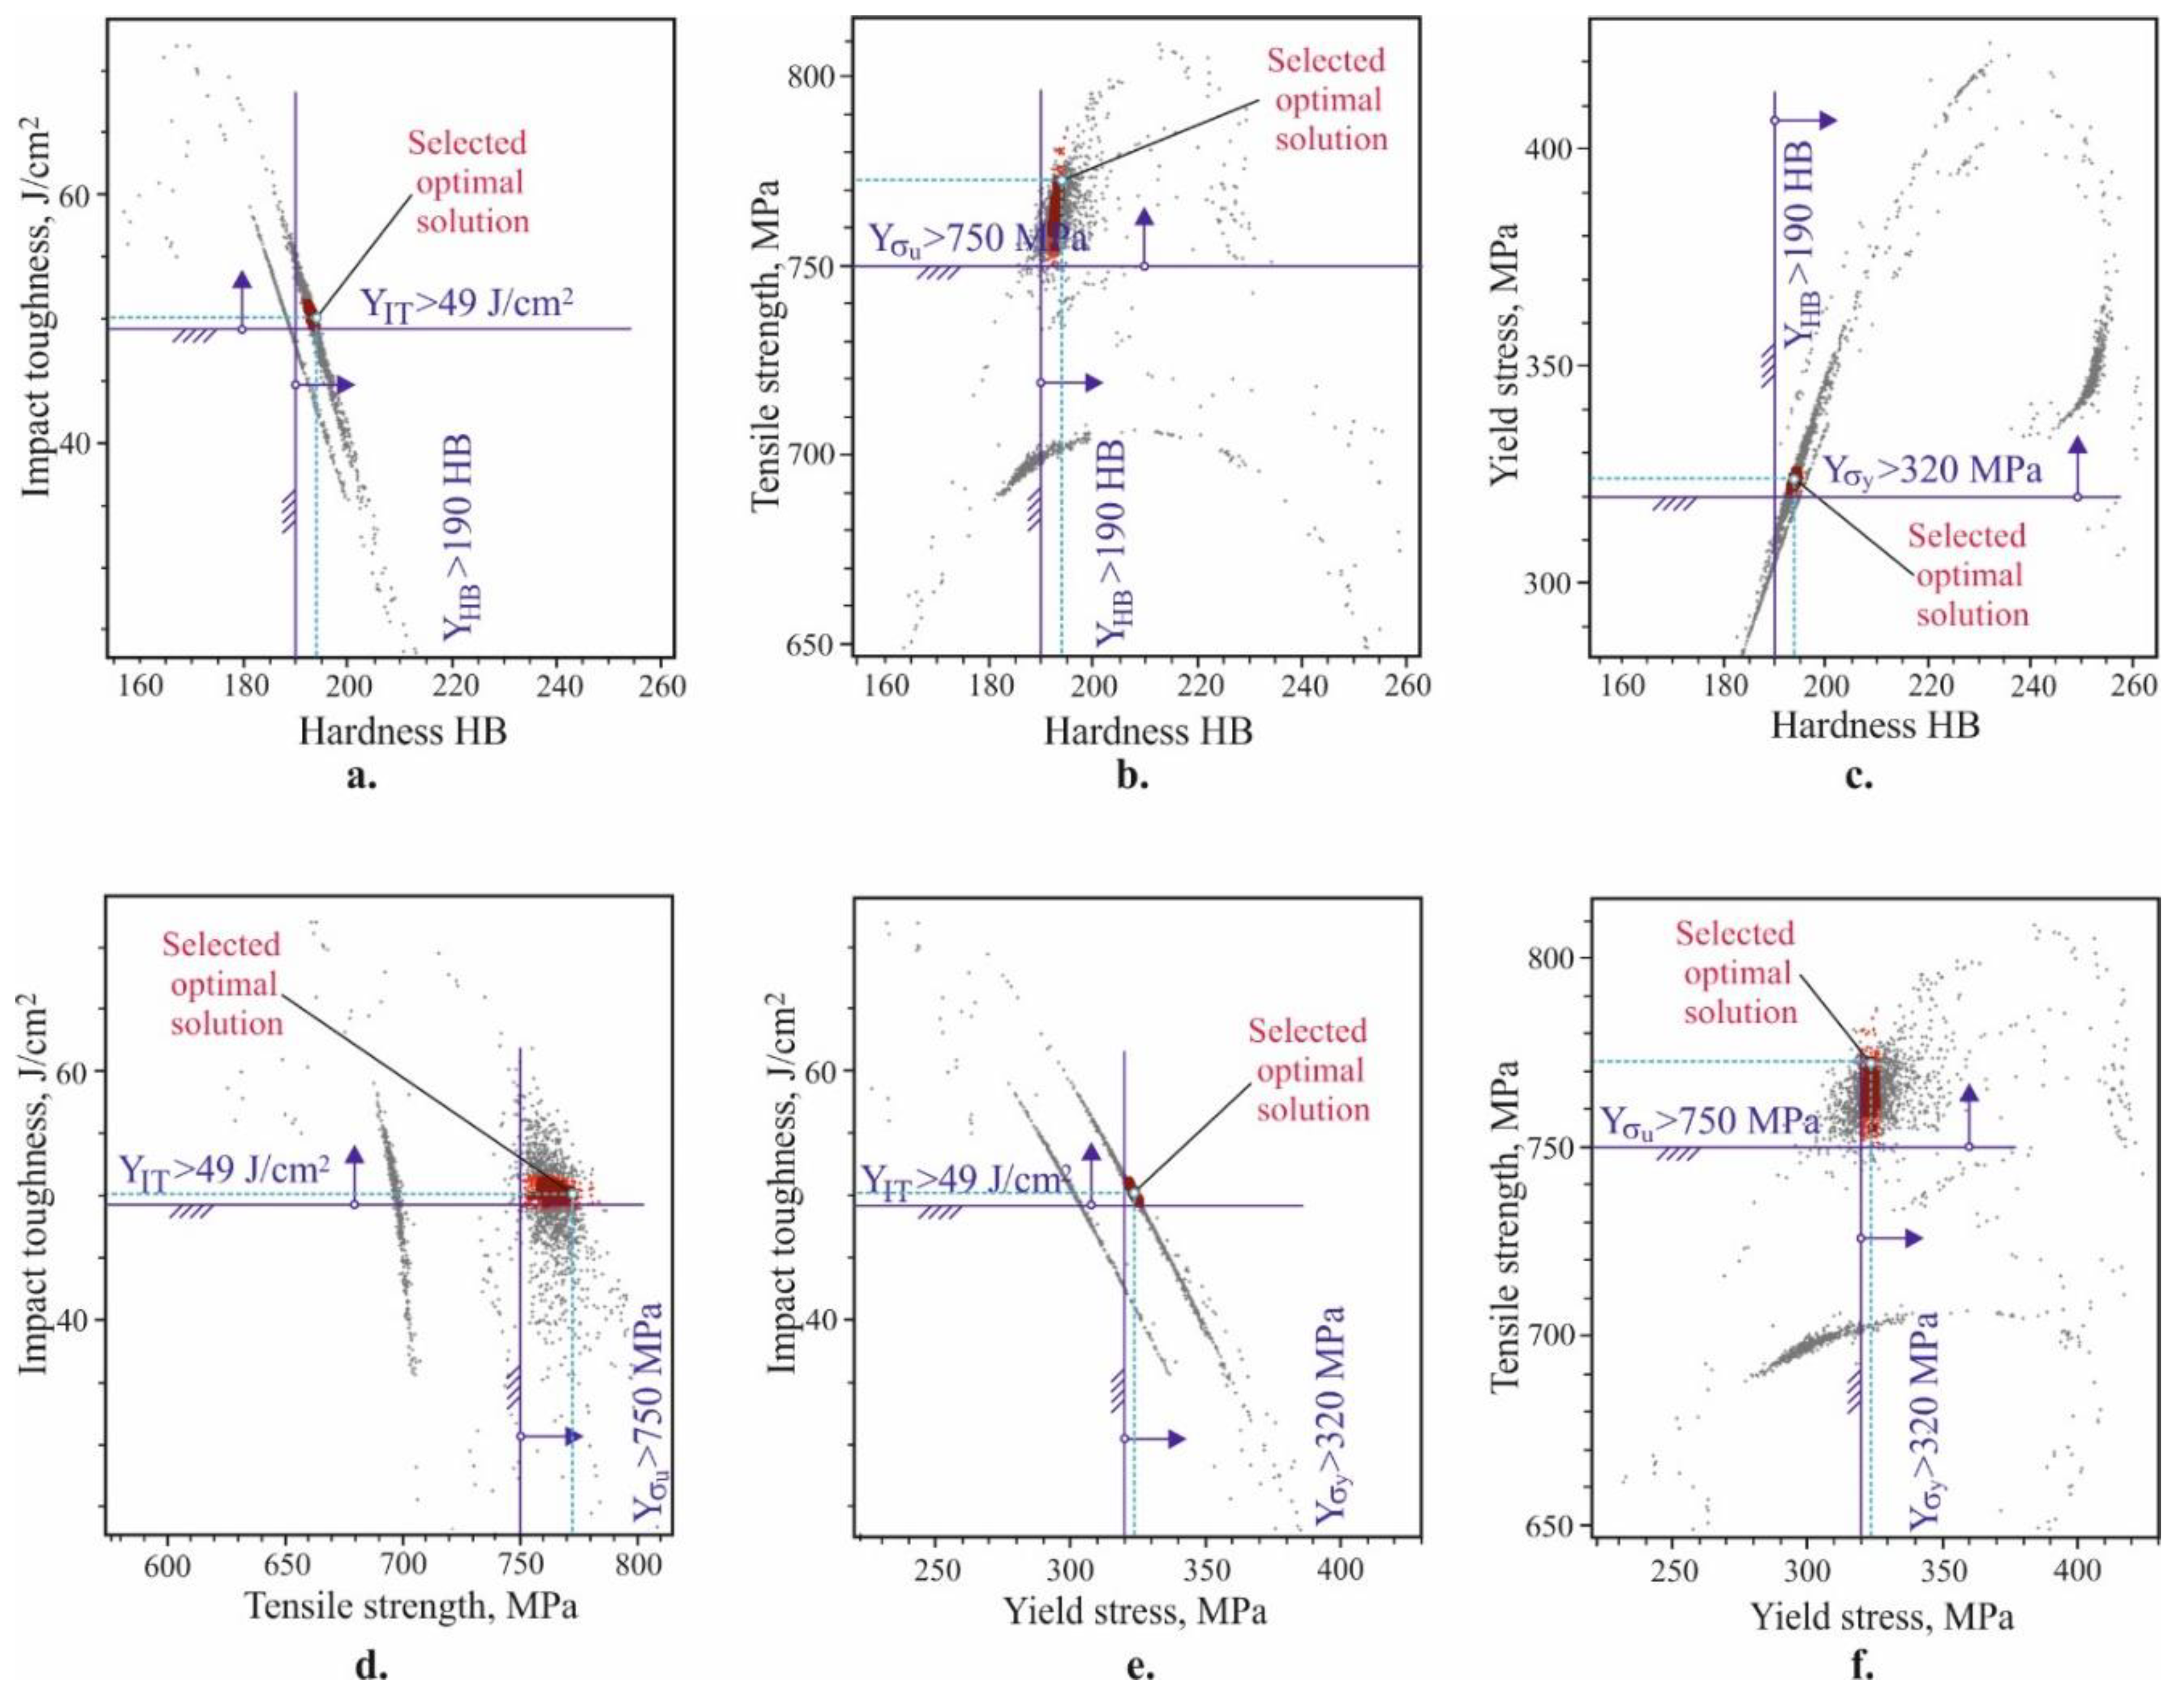
- Four optimisation tasks, with the most significance in practice, were formulated and solved. Thus, the optimal (compromise optimal) values of the temperature and time and the corresponding optimal (compromise optimal) magnitudes of the mechanical characteristics for the respective optimisation task were obtained.
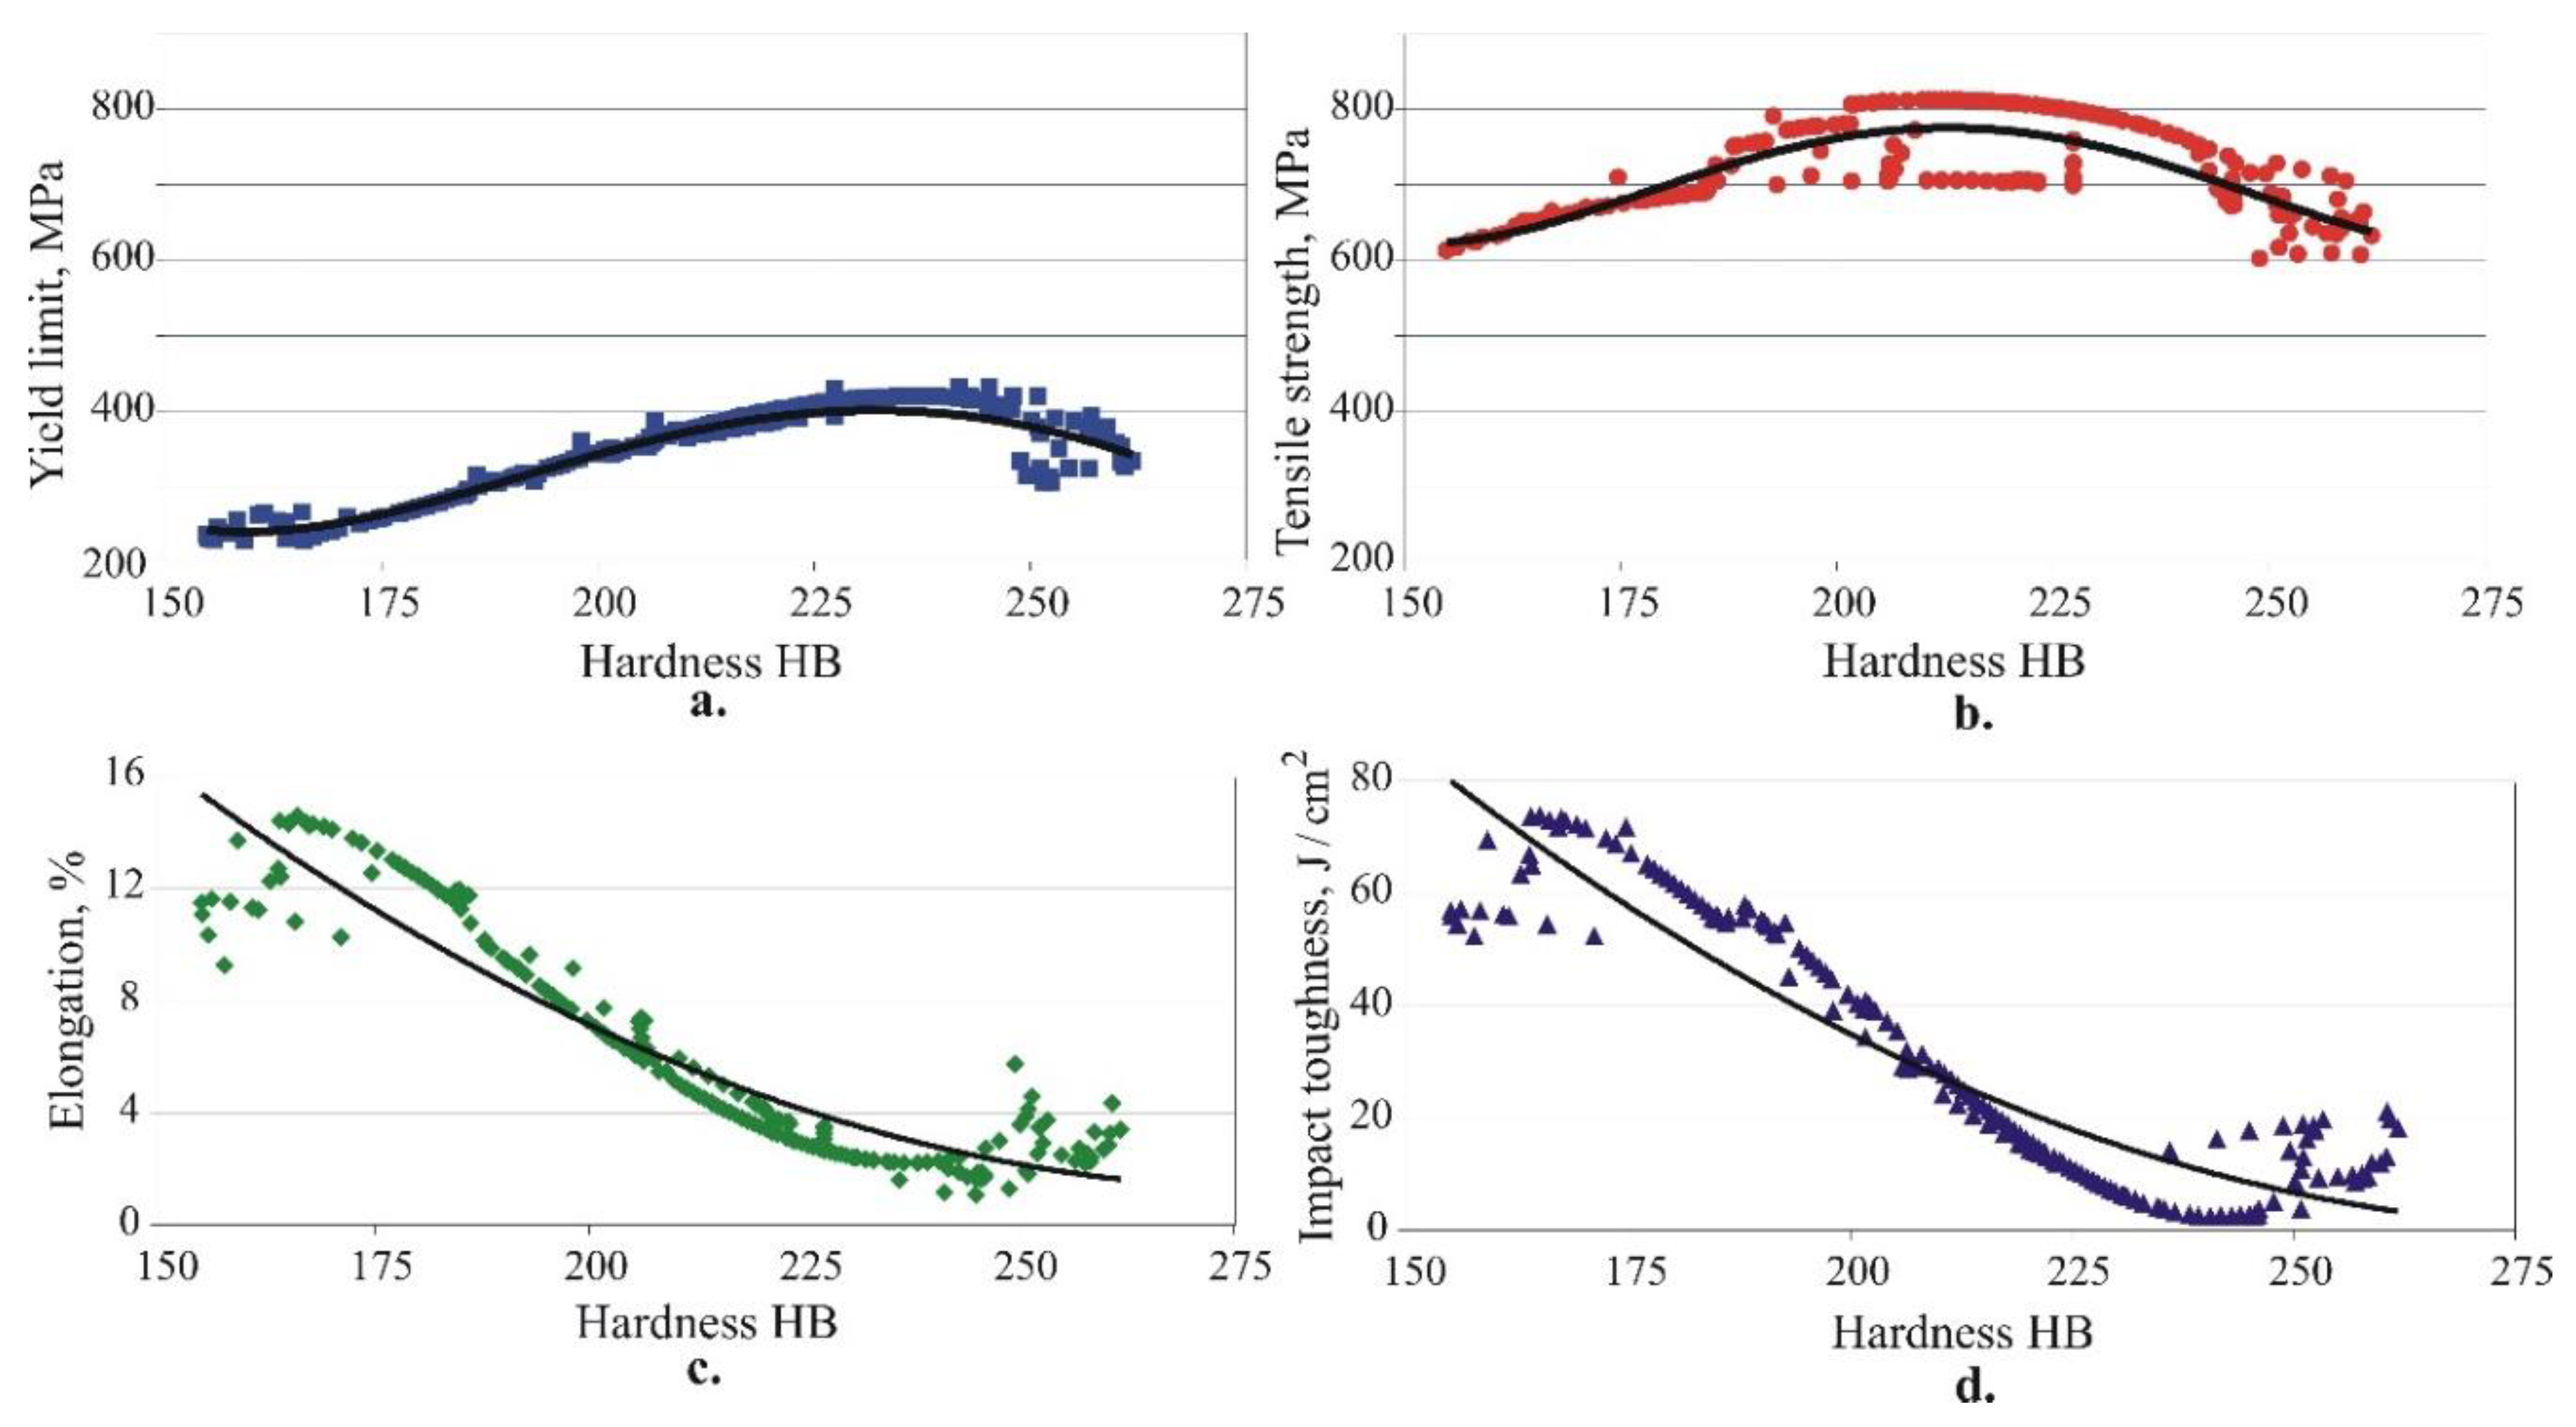
- The correlations of the hardness with each of the other four mechanical characteristics were determined. The dependencies of the mechanical characteristics on the hardness are nonlinear. As the hardness increases, the static strength increases up to a specific hardness value (approximately 230 HB for the yield limit and 210 HB for the tensile strength), and subsequently decrease. The elongation and dynamic strength trendlines display a continuous decrease when the hardness increases.
Author Contributions
Funding
Data Availability Statement
Conflicts of Interest
References
- Brezina, P. Heat treatment of complex aluminium bronzes. International Metals Reviews 1982, 27(2), 77–120. [Google Scholar] [CrossRef]
- Vu, A.T.; Nguyen, D.N.; Pham, X.D.; Tran, D.H.; Vuong, V.H.; Pham, M.K. Influence of strengthening phases on the microstructure and mechanical properties of CuAl9Fe4 alloy. International Journal of Scientific & Engineering Research 2018, 9, 346–351. [Google Scholar]
- Chau, M.Q.; Vu, A.T.; Le, T.S.; Mai, V.T.; Nguyen, D.N.; Doan, X.T.; Do, H.C.; Nguyen, D.T. Influence of tempering time on microstructure and mechanical properties of CuAl9Fe4 alloy. Journal of Mechanical Engineering Research and Developments 2021, 44(7), 75–85. [Google Scholar]
- Slama, P.; Dlouhy, J.; Kövér, M. Influence of heat treatment on the microstructure and mechanical properties of aluminium bronze. Materials and Technology 2014, 48(4), 599–604. [Google Scholar]
- Jain, P.; Nigam, P.K. Influence of heat treatment on microstructure and hardness of nickel aluminium bronze (Cu-10Al-5Ni-5Fe). Journal of Mechanical and Civil Engineering 2013, 4(6), 16–21. [Google Scholar] [CrossRef]
- Aaltonen, P.; Klemetti, K.; Hannien, H. Effect of tempering on corrosion and mechanical properties of cast aluminium bronzes. Scandinavian Journal of Metallurgy 1985, 14, 233–242. [Google Scholar]
- Mi, G.; Zhang, J.; Wang, H. The effect of ageing heat treatment on the mechanical properties of Cu-Al-Fe-(x) alloys. Key Engineering Materials 2011, 467-469, 257–262. [Google Scholar] [CrossRef]
- Matijevic, B.; Sushma, T.S.K.; Prathvi, B.K. Effect of heat treatment parameters on the mechanical properties and microstructure of aluminium bronze. Technical Journal 2017, 11(3), 107–110. [Google Scholar]
- Maximov, J.; Duncheva, G.; Anchev, A.; Dunchev, V.; Argirov, Y.; Todorov, V.; Mechkarova, T. Effects of heat treatment and severe surface plastic deformation on mechanical characteristics, fatigue and wear of Cu-10Al-5Fe bronze. Materials 2022, 15, 8905. [Google Scholar] [CrossRef] [PubMed]
- Vuchkov IN, Vuchkov II. QStatLab Professional, v. 5.5 – statistical quality control software. User’s Manual, Sofia, 2009.
- Deb, K.; Pratap, A.; Agarwal, S.; Meyarivan, T. A fast and elitist multiobjective genetic algorithm: NSGA-II. IEEE Transactions on Evolutionary Computation 2002, 6(2), 182–197. [Google Scholar] [CrossRef]

| Cu | Al | Fe | Mn | Ni | Pb | Zn | Si | Sn | Mg | S | Other |
|---|---|---|---|---|---|---|---|---|---|---|---|
| 80.95 | 11.0 | 6.26 | 0. 905 | 0.391 | 0.028 | 0.280 | 0.022 | 0.071 | 0.005 | 0.010 | Balance |
| Governing factors | Levels | ||||||||||||
|---|---|---|---|---|---|---|---|---|---|---|---|---|---|
| Natural | Codded | Natural | Coded | ||||||||||
| Ageing temperature | 200 | 325 | 450 | 575 | 700 | -1 | -0.5 | 0 | 0.5 | 1 | |||
| Ageing time | 1 | 1.75 | 2.5 | 3.25 | 4 | ||||||||
| № | MPa | MPa |
MPa |
MPa |
% |
% |
HB | IT |
|
|||
| 1 | -1 | -1 | 327 | 335.4 | 580.5 | 580.4 | 1.6 | 1.59 | 236 | 236.04 | 14.4 | 14.03 |
| 2 | 0 | -1 | 413 | 413 | 794.5 | 798.9 | 2.85 | 2.66 | 232 | 227.35 | 8.5 | 8.8 |
| 3 | 1 | -1 | 267 | 258.6 | 668 | 669.6 | 10.25 | 10.24 | 170 | 171.07 | 50.9 | 52.26 |
| 4 | -1 | 0 | 329.5 | 322.9 | 614.5 | 616.9 | 1.8 | 1.81 | 250 | 251.06 | 17.3 | 18.83 |
| 5 | 0 | 0 | 397 | 397 | 700 | 700 | 2.7 | 3.07 | 222 | 227.34 | 8.6 | 8.8 |
| 6 | 1 | 0 | 239.5 | 246.1 | 619.5 | 617.1 | 11.6 | 11.61 | 155 | 156.05 | 58.6 | 57.07 |
| 7 | -1 | 1 | 316.5 | 314.7 | 717.5 | 715.2 | 5.75 | 5.74 | 251 | 249.57 | 15.2 | 14.03 |
| 8 | 0 | 1 | 429.5 | 429.5 | 760.5 | 756.1 | 3.65 | 3.47 | 230 | 227.35 | 9.3 | 8.8 |
| 9 | 1 | 1 | 236 | 237.8 | 625.5 | 626.3 | 9.25 | 9.24 | 160 | 157.54 | 52.1 | 52.26 |
| 10 | -0.5 | -0.5 | 383.5 | 386.4 | 652 | 644.8 | 2.5 | 2.50 | 247 | 254.96 | 9.7 | 9.5 |
| 11 | 0.5 | -0.5 | 310.5 | 307.6 | 730.5 | 726.1 | 10.15 | 10.15 | 184 | 187.84 | 57.7 | 55.5 |
| 12 | -0.5 | 0.5 | 369 | 366.1 | 649.5 | 656.7 | 2.4 | 2.40 | 265 | 258.34 | 9.3 | 9.5 |
| 13 | 0.5 | 0.5 | 284.5 | 287.4 | 689 | 693.5 | 11.9 | 11.90 | 187 | 184.46 | 53.3 | 55.5 |
| Coefficients | Objective functions | ||||
| 397.0000 | 700.0000 | 3.0667 | 227.3488 | 8.8 | |
| -92.1944 | 78.6389 | 10.4208 | -80.9167 | 54.9611 | |
| -23.5417 | -21.3825 | 0.8375 | 0 | 0 | |
| -308.1250 | -165.4583 | 18.3639 | -23.7907 | 118.2833 | |
| 24.2500 | 77.5000 | 0 | 0 | 0 | |
| 0 | -44.5294 | 2.8958 | -6.7647 | 0 | |
| 53.7778 | -78.5555 | -5.5208 | 33.4167 | -35.8444 | |
| 31.7917 | 0 | -0.4375 | 0 | 0 | |
| -18.6250 | 44.2771 | 0.3875 | 0 | 0 | |
| 0 | 0 | -1.8625 | 8.25 | 0 | |
| 195.625 | 82.4583 | -14.7222 | 0 | -89.1333 | |
| 0 | 0 | 0 | 0 | 0 | |
| 0 | 0 | -4.1833 | 0 | 0 | |
| -22.1250 | -46.6250 | 0 | 0 | -4.8 | |
| 0 | 0 | 0 | 0 | 0 | |
| Optimi zation task | Optimal governing factors | ||||||
|---|---|---|---|---|---|---|---|
| Codded | Natural | ||||||
| 1 |
0.75517 0.41485 |
|
72.86 | 166.00 | 228.54 | 654.43 | |
| 2 |
0.78857 0.00032 |
|
14.3 | 165.13 | 234.7 | 652.48 | |
| 3 |
-0.1163 -1 |
2h 19min |
2.25 | 3.98 | 234.64 | 419.45 | 791.22 |
| 4 |
0.4512 -0.8375 |
1h 15min |
8.52 | 50.01 | 194.23 | 323.78 | 772.88 |
| Opti-miza-tion task | Optimal values of the objective functions | |||||||||
|
, |
||||||||||
| optimiz. | experim. | optimiz. | experim. | optimiz. | experim. | optimiz. | experim. | optimiz. | experim. | |
| 1 | 14.6 | 13.8 | 72.86 | 63.4 | 166.00 | 165 | 228.54 | 249 | 654.43 | 683 |
| 2 | 14.3 | 13.1 | 73.65 | 67.0 | 165.13 | 175 | 234.7 | 258 | 652.48 | 666 |
| 3 | 2.25 | 3.4 | 3.98 | 7.2 | 234.64 | 235 | 419.45 | 407 | 791.22 | 776 |
| 4 | 8.52 | 9.7 | 50.01 | 57.4 | 194.23 | 185 | 323.78 | 314 | 772.88 | 770 |
Disclaimer/Publisher’s Note: The statements, opinions and data contained in all publications are solely those of the individual author(s) and contributor(s) and not of MDPI and/or the editor(s). MDPI and/or the editor(s) disclaim responsibility for any injury to people or property resulting from any ideas, methods, instructions or products referred to in the content. |
© 2023 by the authors. Licensee MDPI, Basel, Switzerland. This article is an open access article distributed under the terms and conditions of the Creative Commons Attribution (CC BY) license (http://creativecommons.org/licenses/by/4.0/).


