Submitted:
01 November 2023
Posted:
02 November 2023
You are already at the latest version
Abstract
Keywords:
1. Introduction
2. Results and Discussion
2.1. Structural processes in HMTA aqueous solutions
2.2. Sensing of the aggregation processes via ultrasonic absorption measurements
3. Materials and Methods
3.1. Materials
3.2. Raman Spectroscopy
3.3. Ultrasonic relaxation spectroscopy
3.4. DFT calculations
4. Conclusions
Supplementary Materials
Author Contributions
Funding
Data Availability Statement
Acknowledgments
Conflicts of Interest
References
- Bakhit, M.; Krzyzaniak, N.; Hilder, J.; Clark, J.; Scott, A.M.; Mar, C.D. Use of methenamine hippurate to prevent urinary tract infections in community adult women: a systematic review and meta-analysis. Br. J. Gen. Pract. 2021, 71, e528–e537. [Google Scholar] [CrossRef] [PubMed]
- Schoen A.H. Re: Equivalence of methenamine Tablets Standard for Flammability of Carpets and Rugs. Report of U.S. Consumer Product Safety Commission, July 29, 2004.
- Retrieved from UK Food Standards Agency: “Current EU approved additives and their E Numbers”. https://www.food.gov.uk/business-guidance/approved-additives-and-e-numbers.
- Eller K, Henkes E, Rossbacher R, Höke H (2000). “Amines, Aliphatic”. Ullmann’s Encyclopedia of Industrial Chemistry. Wiley-VCH Verlag GmbH.
- Blažzević, N.; Kolbah, D.; Belin, B.; Šunjić, V.; Kajfež, F. Hexamethylenetetramine, A Versatile Reagent in Organic Synthesis. Synthesis 1979, 3, 161–176. [Google Scholar] [CrossRef]
- Tryfon, A.; Siafarika, P.; Kouderis, C.; Kaziannis, S.; Boghosian, S.; Kalampounias, A.G. Evidence of Self-Association and Conformational Change in Nisin Antimicrobial Polypeptide Solutions: A Combined Raman and Ultrasonic Relaxation Spectroscopic and Theoretical Study. Antibiotics 2023, 12, 221. [Google Scholar] [CrossRef] [PubMed]
- Kalampounias, A.G.; Kirillov, S.A.; Steffen, W.; Yannopoulos, S.N. Raman spectra and microscopic dynamics of bulk and confined salol. J. Molec. Struct. 2003, 651–653, 475–4831.
- Tsigoias, S.; Kouderis, C.; Mylona-Kosmas, A.; Boghosian, S.; Kalampounias, A.G. Proton-transfer in 1,1,3,3 tetramethyl guanidine by means of ultrasonic relaxation and Raman spectroscopies and molecular orbital calculations. Spectrochim. Acta A 2020, 229, 117958. [Google Scholar] [CrossRef]
- Tsigoias, S.; Papanikolaou, M.G.; Kabanos, T.A.; Kalampounias, A.G. Structure and dynamics of aqueous norspermidine solutions: an in situ ultrasonic relaxation spectroscopic study. J. Phys.: Condens. Matter, 2021, 33, 495104.
- Bernasconi, C.F. Relaxation kinetics. Academic Press, New York, 1976.
- Herzfeld, K.F.; Litovitz, T.A. Absorption and Dispersion of Ultrasonic Waves (Academic Press, New York, 1959).
- Mpourazanis, P.; Stogiannidis, G.; Tsigoias, S.; Kalampounias, A.G. Transverse phonons and intermediate-range order in Sr-Mg fluorophosphate glasses Spectrochim. Acta A. 2019, 212, 363–370. [Google Scholar] [CrossRef]
- Mpourazanis, P.; Stogiannidis, G.; Tsigoias, S.; Papatheodorou, G.N.; Kalampounias, A.G. Ionic to covalent glass network transition: Effects on elastic and vibrational properties according to ultrasonic echography and Raman spectroscopy. J. Phys. Chem. Solids. 2019, 125, 43–50. [Google Scholar] [CrossRef]
- Stogiannidis, G.; Tsigoias, S.; Mpourazanis, P.; Boghosian, S.; Kaziannis, S.; Kalampounias, A.G. Dynamics and vibrational coupling of methyl acetate dissolved in ethanol. Chem. Phys. 2019, 522, 1–9. [Google Scholar] [CrossRef]
- Ivanov, E.V.; Batov, D.V. Unusual behavior of temperature-dependent solvent H/D isotope effects in the enthalpy and heat capacity of hexamethylenetetramine (urotropine) hydration. J. Molec. Liq. 2019, 285, 508–514. [Google Scholar] [CrossRef]
- Ivanov, E.V. Temperature-dependent standard volumetric properties of hexamethylenetetramine in ordinary and deuterated water: A study resolving debatable issues being commented in the [Journal of Molecular Liquids, 248 (2017) 48–52]. J. Molec. Liq. 2018, 272, 218–225. [Google Scholar] [CrossRef]
- Thomas, C.W. Hexamethylenetetramine Hexahydrate: A New Type of Clathrate Hydrate. J. Chem. Phys. 1965, 43, 2799–2805. [Google Scholar]
- Davidson, D.W. Dielectric relaxation and orientational ordering of water molecules in hexamethylenetetramine hexahydrate. Division of Applied Chemistry, National Research Council of Cariada, Ottawa, Canada 1967.
- Chettiyankandy, P.; Chand, A.; Ghosh, R.; Sarkar, S.K.; Das, P.; Chowdhuri, S. Effects of hexamethylenetetramine (HMTA) on the aqueous solution structure, dynamics and ion solvation scenario: A concentration and temperature dependent study with potential HMTA models. J. Molec. Liq. 2019, 296, 111820. [Google Scholar] [CrossRef]
- Santos, P.S. ; Raman Spectra of Some Adducts of Hexamethylenetetramine, J. Raman Spectr. 1989, 20, 405–408. [Google Scholar] [CrossRef]
- Bertie, J.E.; Solinas, M. Infrared and Raman spectra and the vibrational assignment of hexamethylenetetramine-h12 and -d12. J. Chem. Phys. 1974, 61, 1666–1677. [Google Scholar] [CrossRef]
- Litovitz, T.A.; Davis, C.M. Physical Acoustics, ed. W. P. Mason, Vol. IIA, (1965), Academic Press, London and New York.
- Herzfeld, K.F.; Litovitz, T.A. Absorption and Dispersion of UltrasonicWaves, Academic Press, New York, 1959.
- Ensminger, D.; Bond, L.J. Ultrasonics: Fundamentals, Technologies, and Applications, Third edition CRC Press, New York, 2011.
- Blandamer, M.J. Introduction to Chemical Ultrasonics, Academic Press, New-York, 1973.
- Davidson, D.W. Dielectric relaxation and orientational ordering of water molecules in hexamethylenetetramine hexahydrate. Can. J. Chem. 1968, 46, 1024–1027. [Google Scholar] [CrossRef]
- Crescenzi, V.; Quadrifoglio, F.; Vitagliano, V. Hexamethylenetetramine Aqueous Solutions. Isopiestic Data at 25° and Density and Viscosity Data in the Range 3–34o, J. Phys. Chem. 1967, 71, 2313–2318.
- Kalampounias, A.G.; Tsilomelekis, G.; Boghosian, S. Glass-forming ability of TeO2 and temperature induced changes on the structure of the glassy, supercooled, and molten states. J. Chem. Phys. 2015, 142, 154503. [Google Scholar] [CrossRef] [PubMed]
- Kalampounias, A.G.; Yannopoulos, S.N.; Papatheodorou, G.N. Temperature- induced structural changes in glassy, supercooled, and molten silica from 77 to 2150 K. J. Chem. Phys. 2006, 124, 014504. [Google Scholar] [CrossRef] [PubMed]
- Latsis, G.K.; Banti, C.N.; Kourkoumelis, N.; Papatriantafyllopoulou, C.; Panagiotou, N.; Tasiopoulos, A.; Douvalis, A.; Kalampounias, A.G.; Bakas, T.; Hadjikakou, S.K. Poly Organotin Acetates against DNA with Possible Implementation on Human Breast Cancer. Int. J. Mol. Sci. 2018, 19, 2055. [Google Scholar] [CrossRef] [PubMed]
- Kalampounias, A.G.; Kirillov, S.A.; Steffen, W.; Yannopoulos, S.N. Raman spectra and microscopic dynamics of bulk and confined salol. J. Molec. Struct. 2003, 651–653, 475–483.
- Kouderis, C.; Siafarika, P.; Kalampounias, A.G. Disentangling proton-transfer and segmental motion relaxations in poly-vinyl-alcohol aqueous solutions by means of ultrasonic relaxation spectroscopy. Polymer 2021, 217, 123479. [Google Scholar] [CrossRef]
- Kalampounias, A.G. Establishing the role of shear viscosity on the rate constants of conformational fluctuations in unsaturated aldehydes. Chem. Phys. 2022, 561, 111618. [Google Scholar] [CrossRef]
- Kouderis, C.; Siafarika, P.; Kalampounias, A.G. Molecular relaxation dynamics and self-association of dexamethasone sodium phosphate solutions. Chem. Pap. 2021, 75, 6115–6125. [Google Scholar] [CrossRef]
- Frisch, M.J. et al., Gaussian 09, Revision A.02, Gaussian, Inc, Wallingford CT, 2009.
- Becke, A. Density-Functional Thermochemistry. III. The Role of Exact Exchange. J. Chem. Phys. 1993, 98, 5648–5652. [Google Scholar]
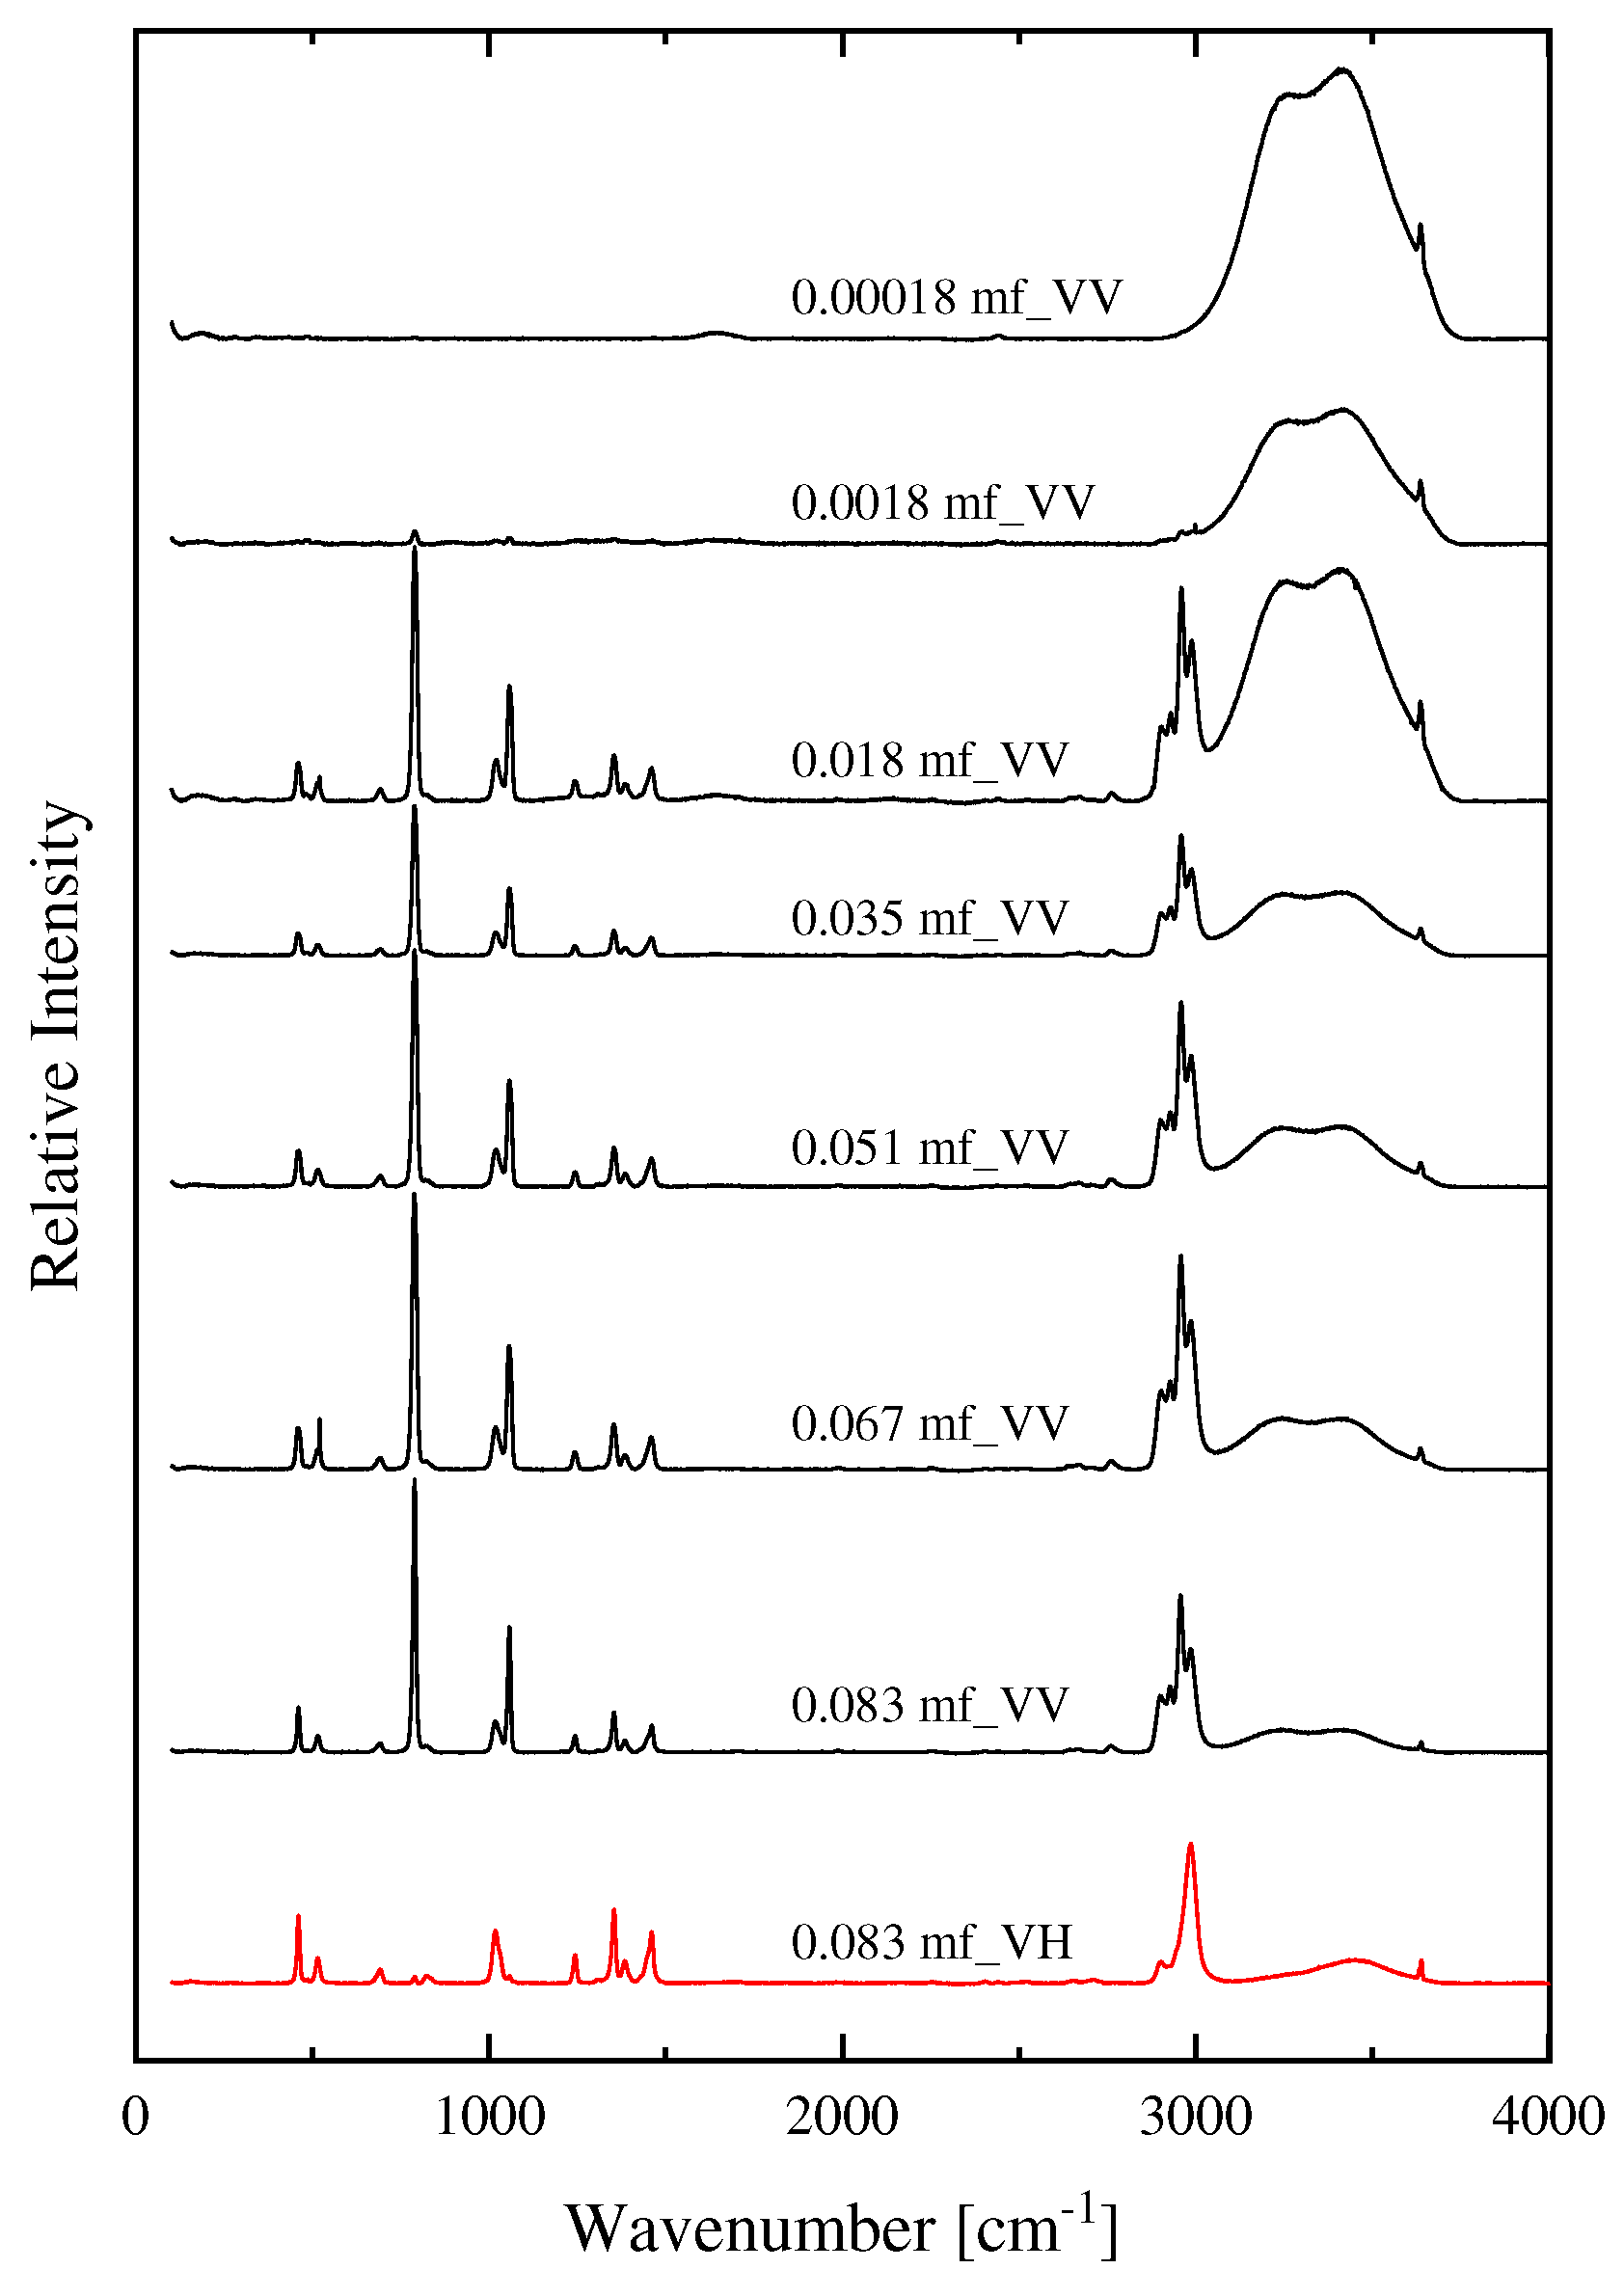
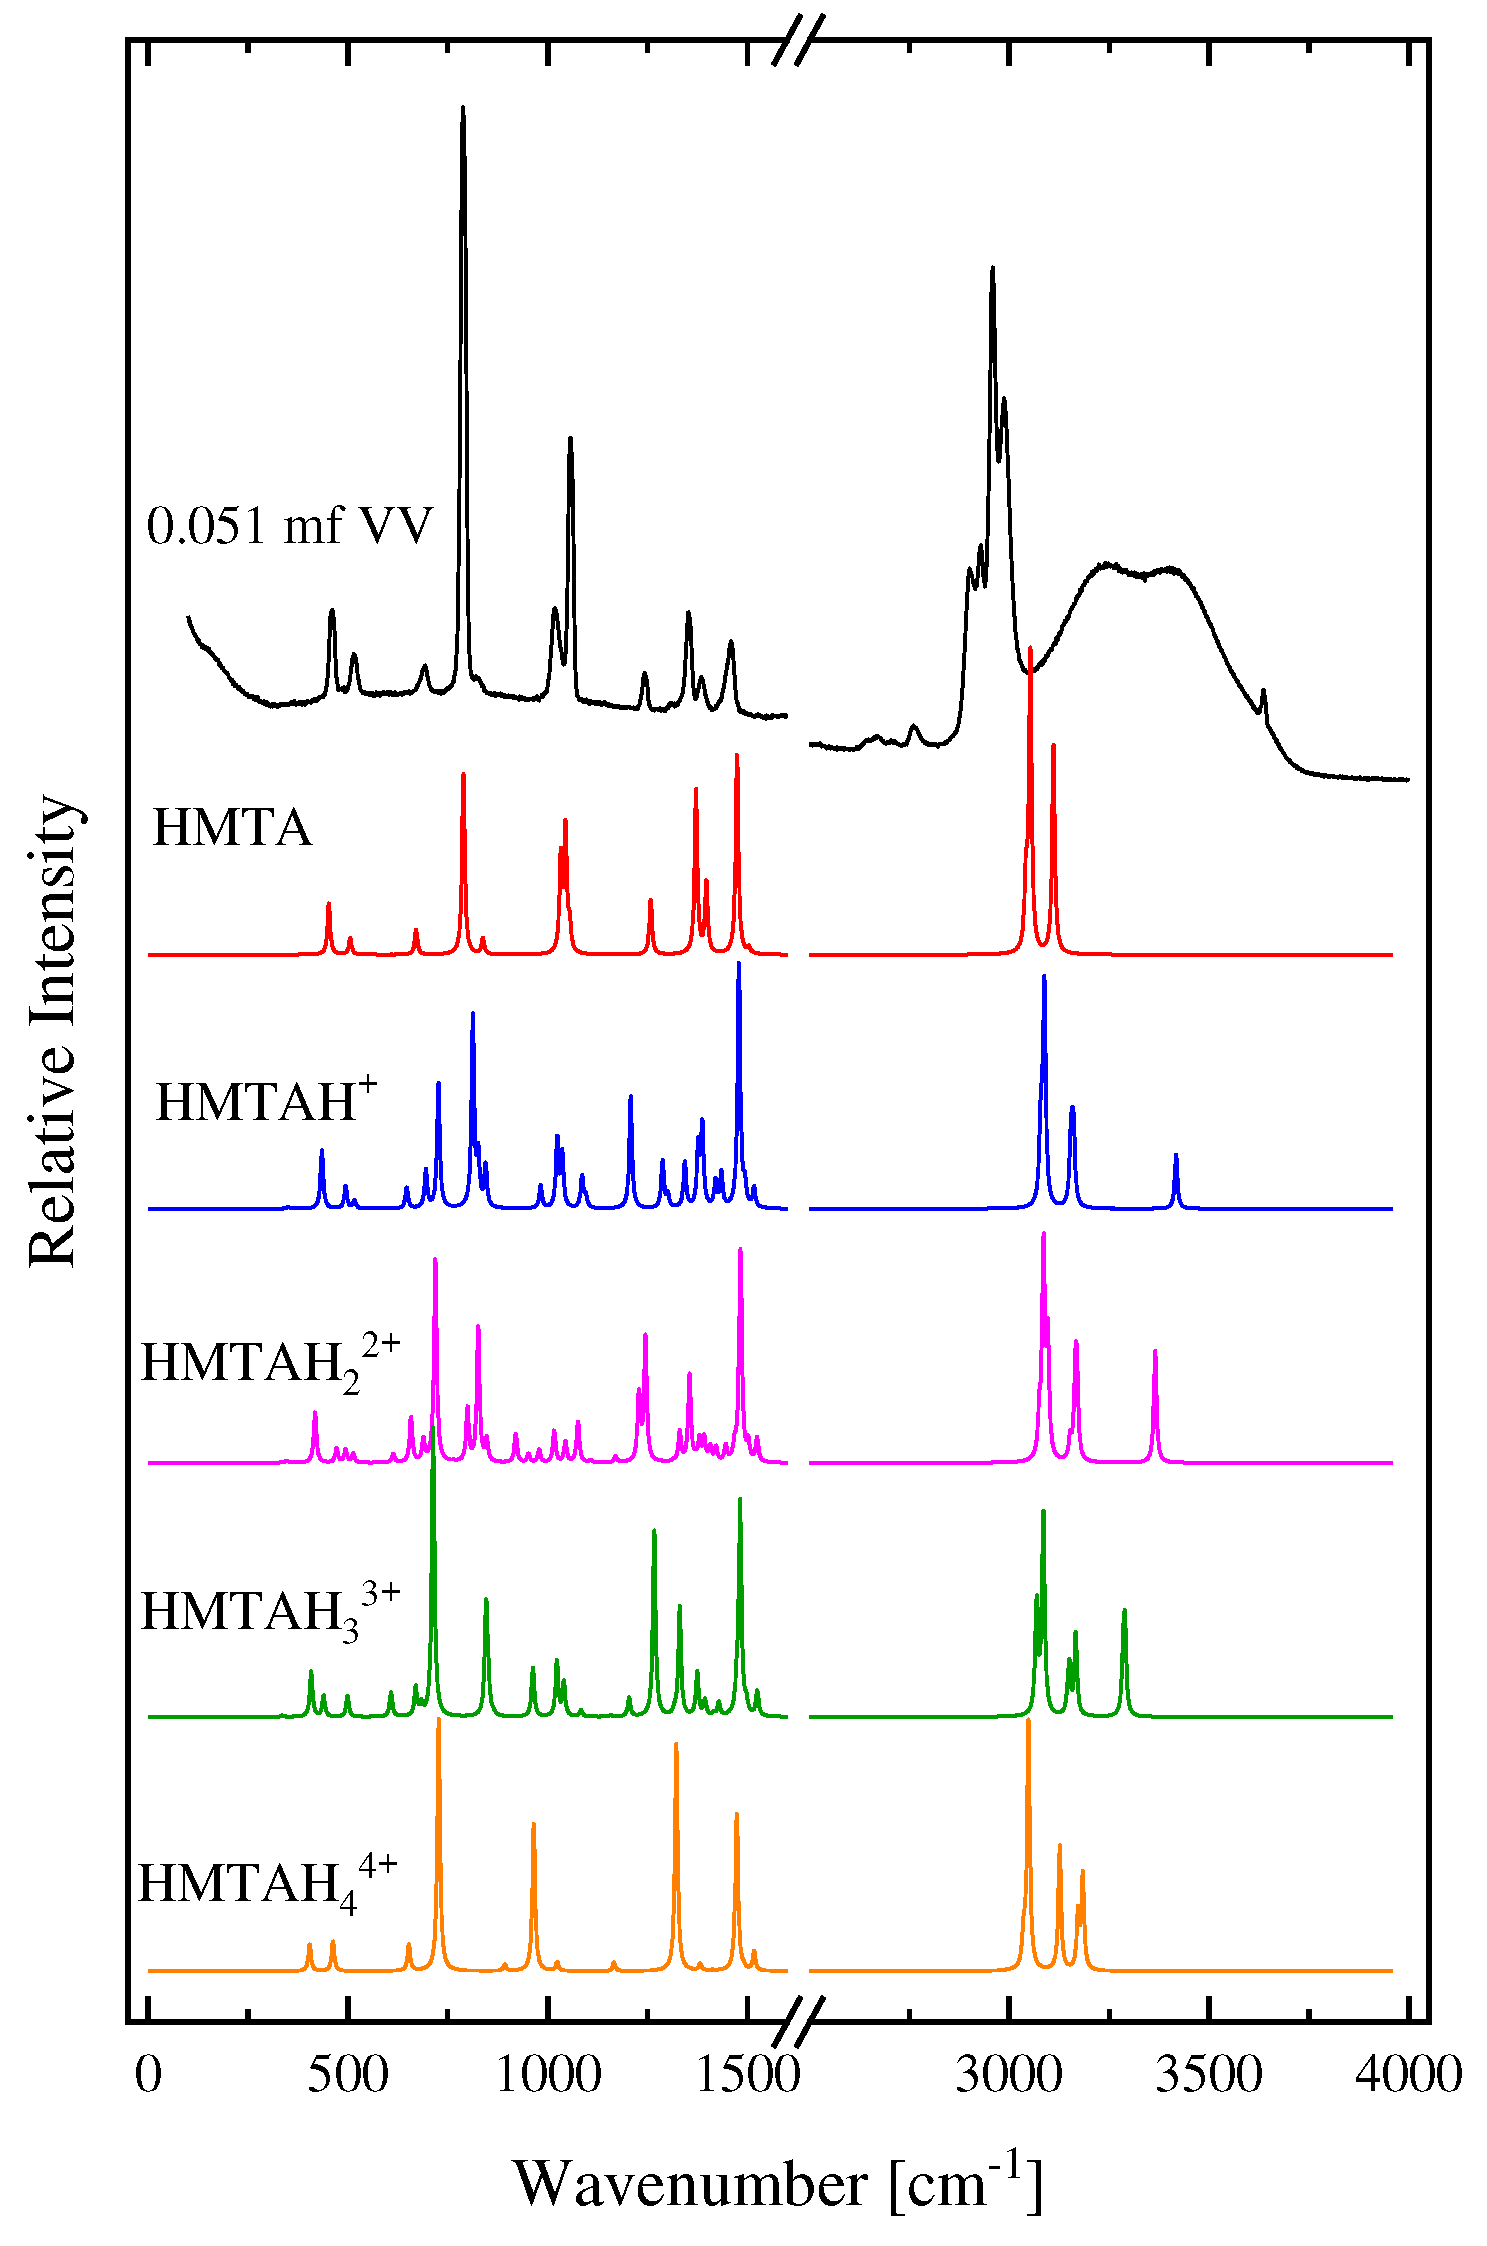
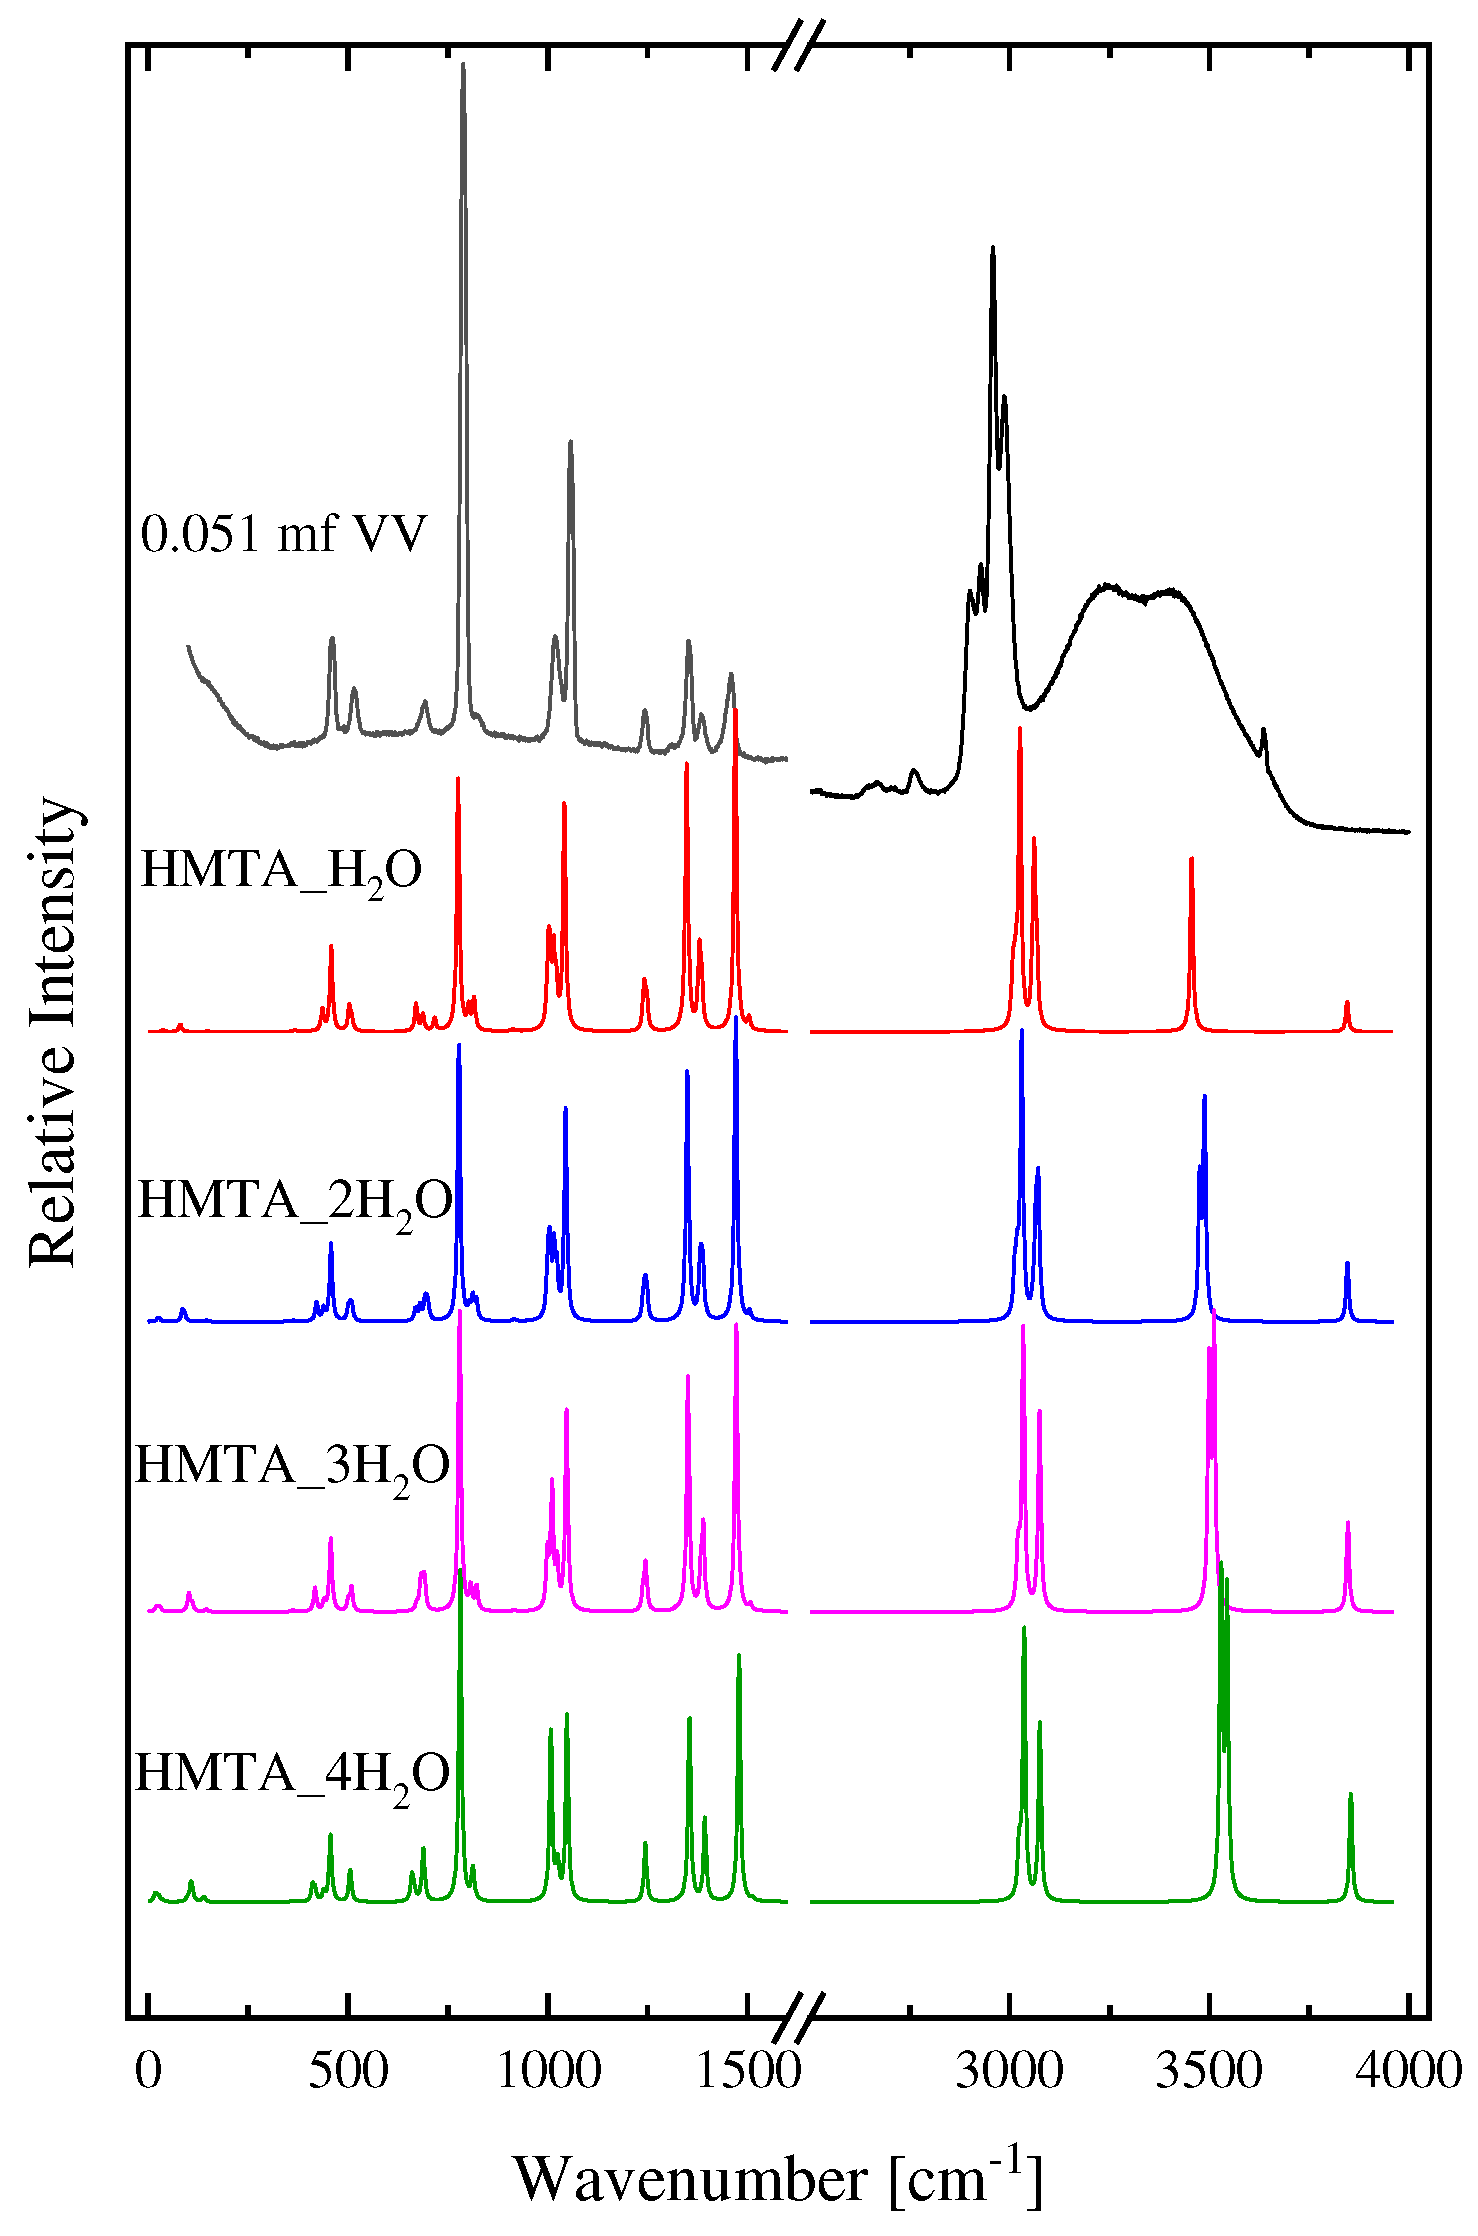
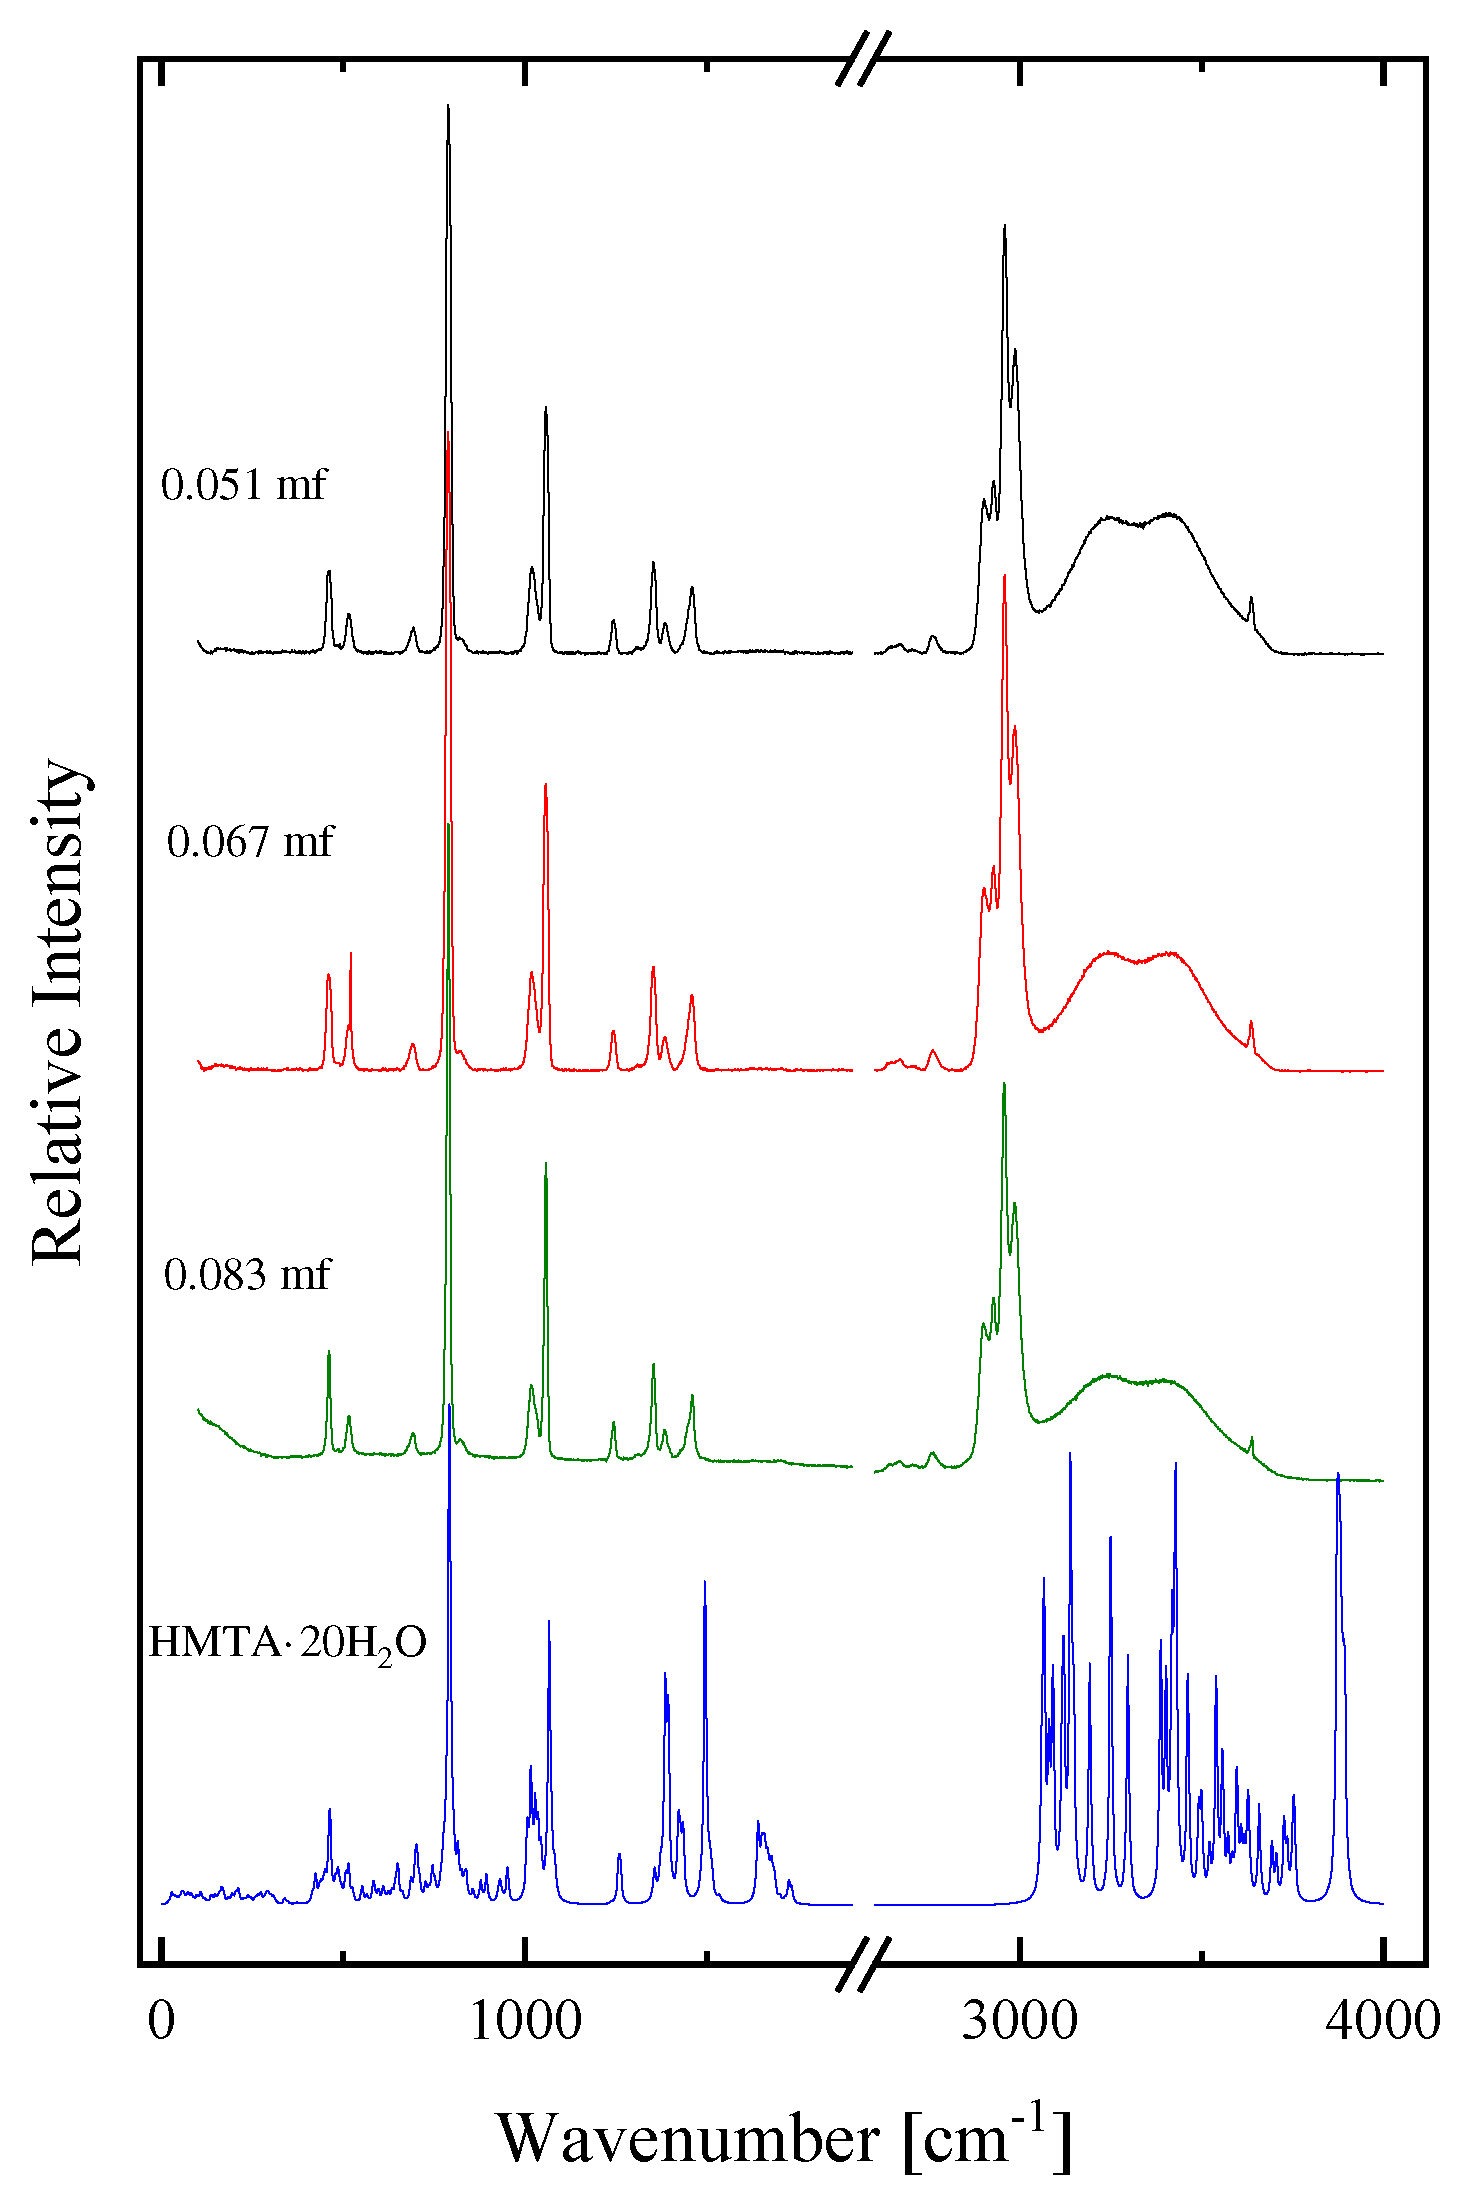
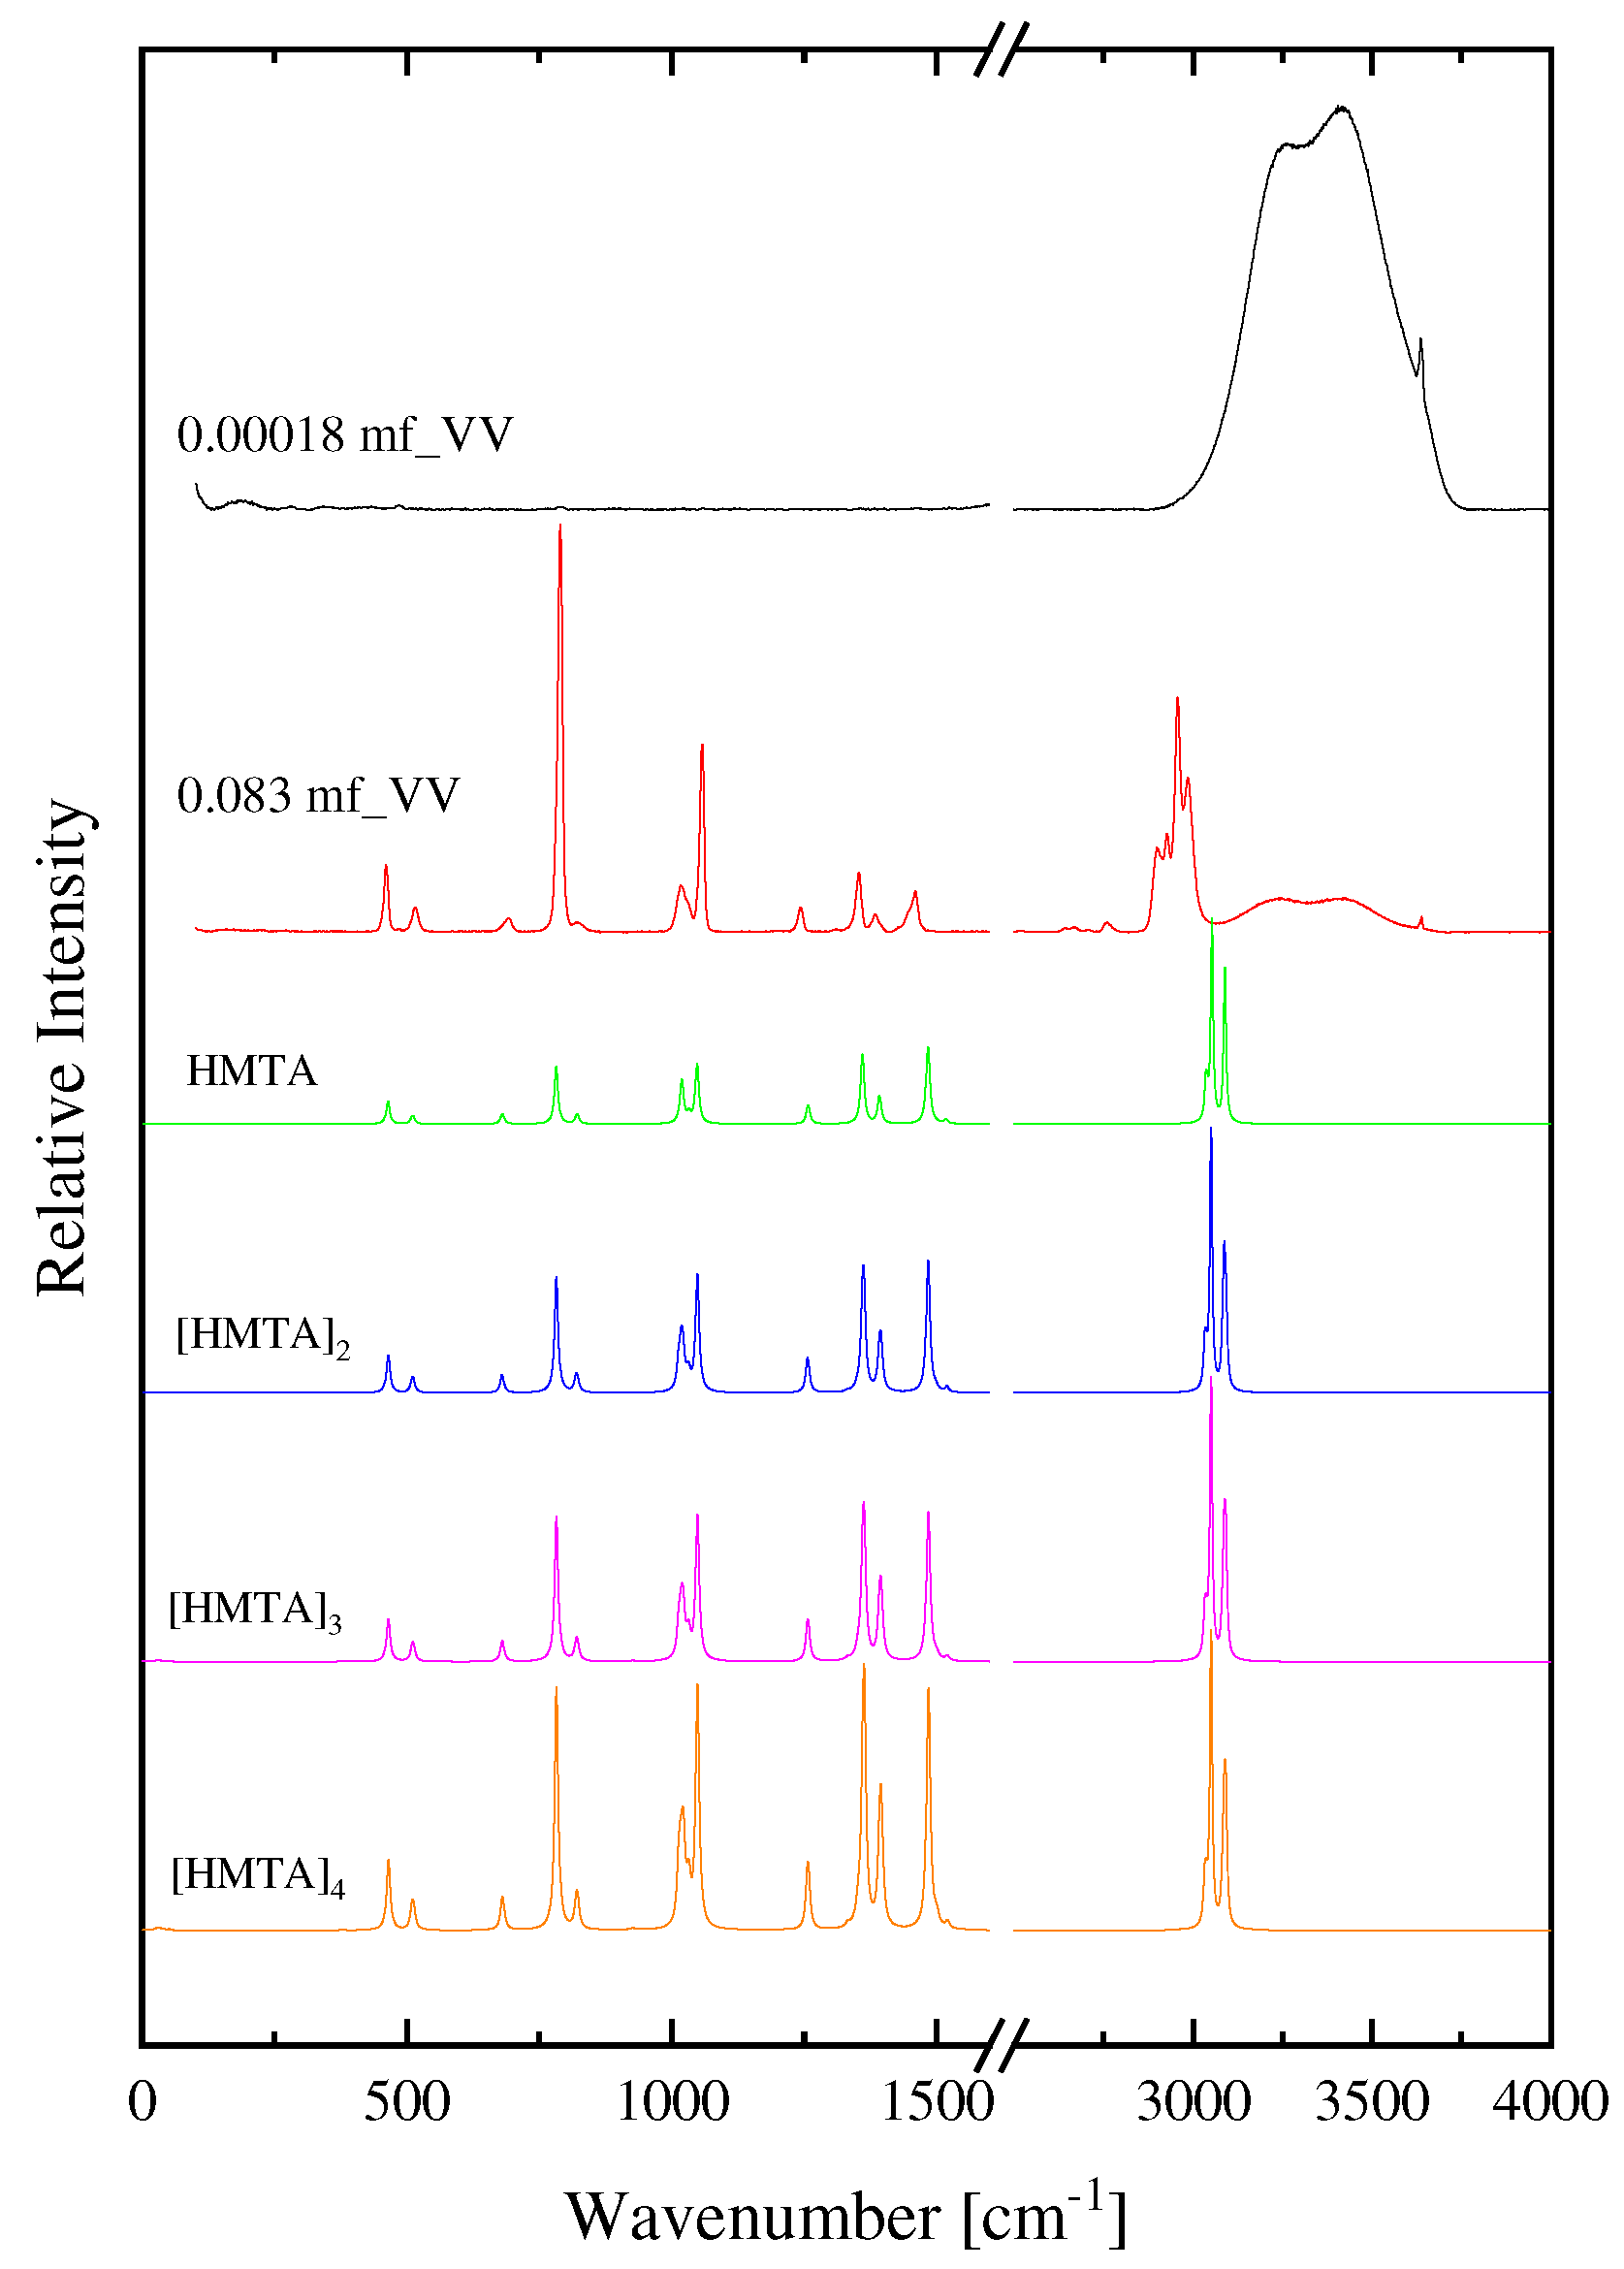
| Experimental Raman frequencies (cm−1) in solution | Theoretical Raman frequencies (cm−1) in vacuum | Assignment | Symmetry | |
|---|---|---|---|---|
| 59 | 463 | CNC deformation | E | Fingerprint region (<1500 cm−1) |
| 515 | 510 | CNC deformation | F2 | |
| 692 | 680 | CNC deformation | F2 | |
| 785 | 789 | CNC stretching | A1 | |
| 823 | 821 | CH2 rocking | F2 | |
| 1020 | 1019 | CN stretching | F2 | |
| 1056 | 1048 | CNC deformation | A1 | |
| 1242 | 1257 | CN stretching | F2 | |
| 1353 | 1359 | CH2 twisting | E | |
| 1384 | 1392 | CH2 wagging | F2 | |
| 1455 | 1483 | CH2 deformation | E | |
| 2902 | 3037 | Symmetric and asymmetric C-H stretching | C-H region | |
| 2931 | 3039 | |||
| 2959 | 3052 | |||
| 2988 | 3088 | |||
| 3253 | - | O-H stretching of water molecules | O-H region | |
| 3410 | - | O-H stretching of water molecules | ||
| 3636 | - | O-H stretching of water molecules that are hydrogen bonded with HMTA molecule | ||
| 3648 | - | O-H stretching of water molecules |
| Molal Concentration (mol/Kgsolvent) |
Mole fraction |
|---|---|
| 1 × 10⁻⁵ | 1.80 × 10⁻⁷ |
| 1 × 10⁻⁴ | 1.80 × 10⁻⁶ |
| 1 × 10⁻³ | 1.80 × 10⁻⁵ |
| 0.01 | 1.80 × 10⁻⁴ |
| 0.1 | 1.82 ×10⁻³ |
| 1.0 | 0.018 |
| 2.0 | 0.035 |
| 3.0 | 0.051 |
| 4.0 | 0.067 |
| 5.0 | 0.083 |
Disclaimer/Publisher’s Note: The statements, opinions and data contained in all publications are solely those of the individual author(s) and contributor(s) and not of MDPI and/or the editor(s). MDPI and/or the editor(s) disclaim responsibility for any injury to people or property resulting from any ideas, methods, instructions or products referred to in the content. |
© 2023 by the authors. Licensee MDPI, Basel, Switzerland. This article is an open access article distributed under the terms and conditions of the Creative Commons Attribution (CC BY) license (http://creativecommons.org/licenses/by/4.0/).


