Submitted:
01 November 2023
Posted:
02 November 2023
You are already at the latest version
Abstract
Keywords:
MSC: 68T07
1. Introduction
- This research article introduces a pioneering switch-transformer model that integrates multi-task learning (MTL) for sentiment analysis (SA) in Arabic Dialects (ADs). The proposed ST-SA model is founded on the a mixture of experts (MoE) mechnisim was developed to breaks down the problem into smaller, more straightforward sub-problems, enabling the model to effectively handle extended sequences and intricate input-output connections.
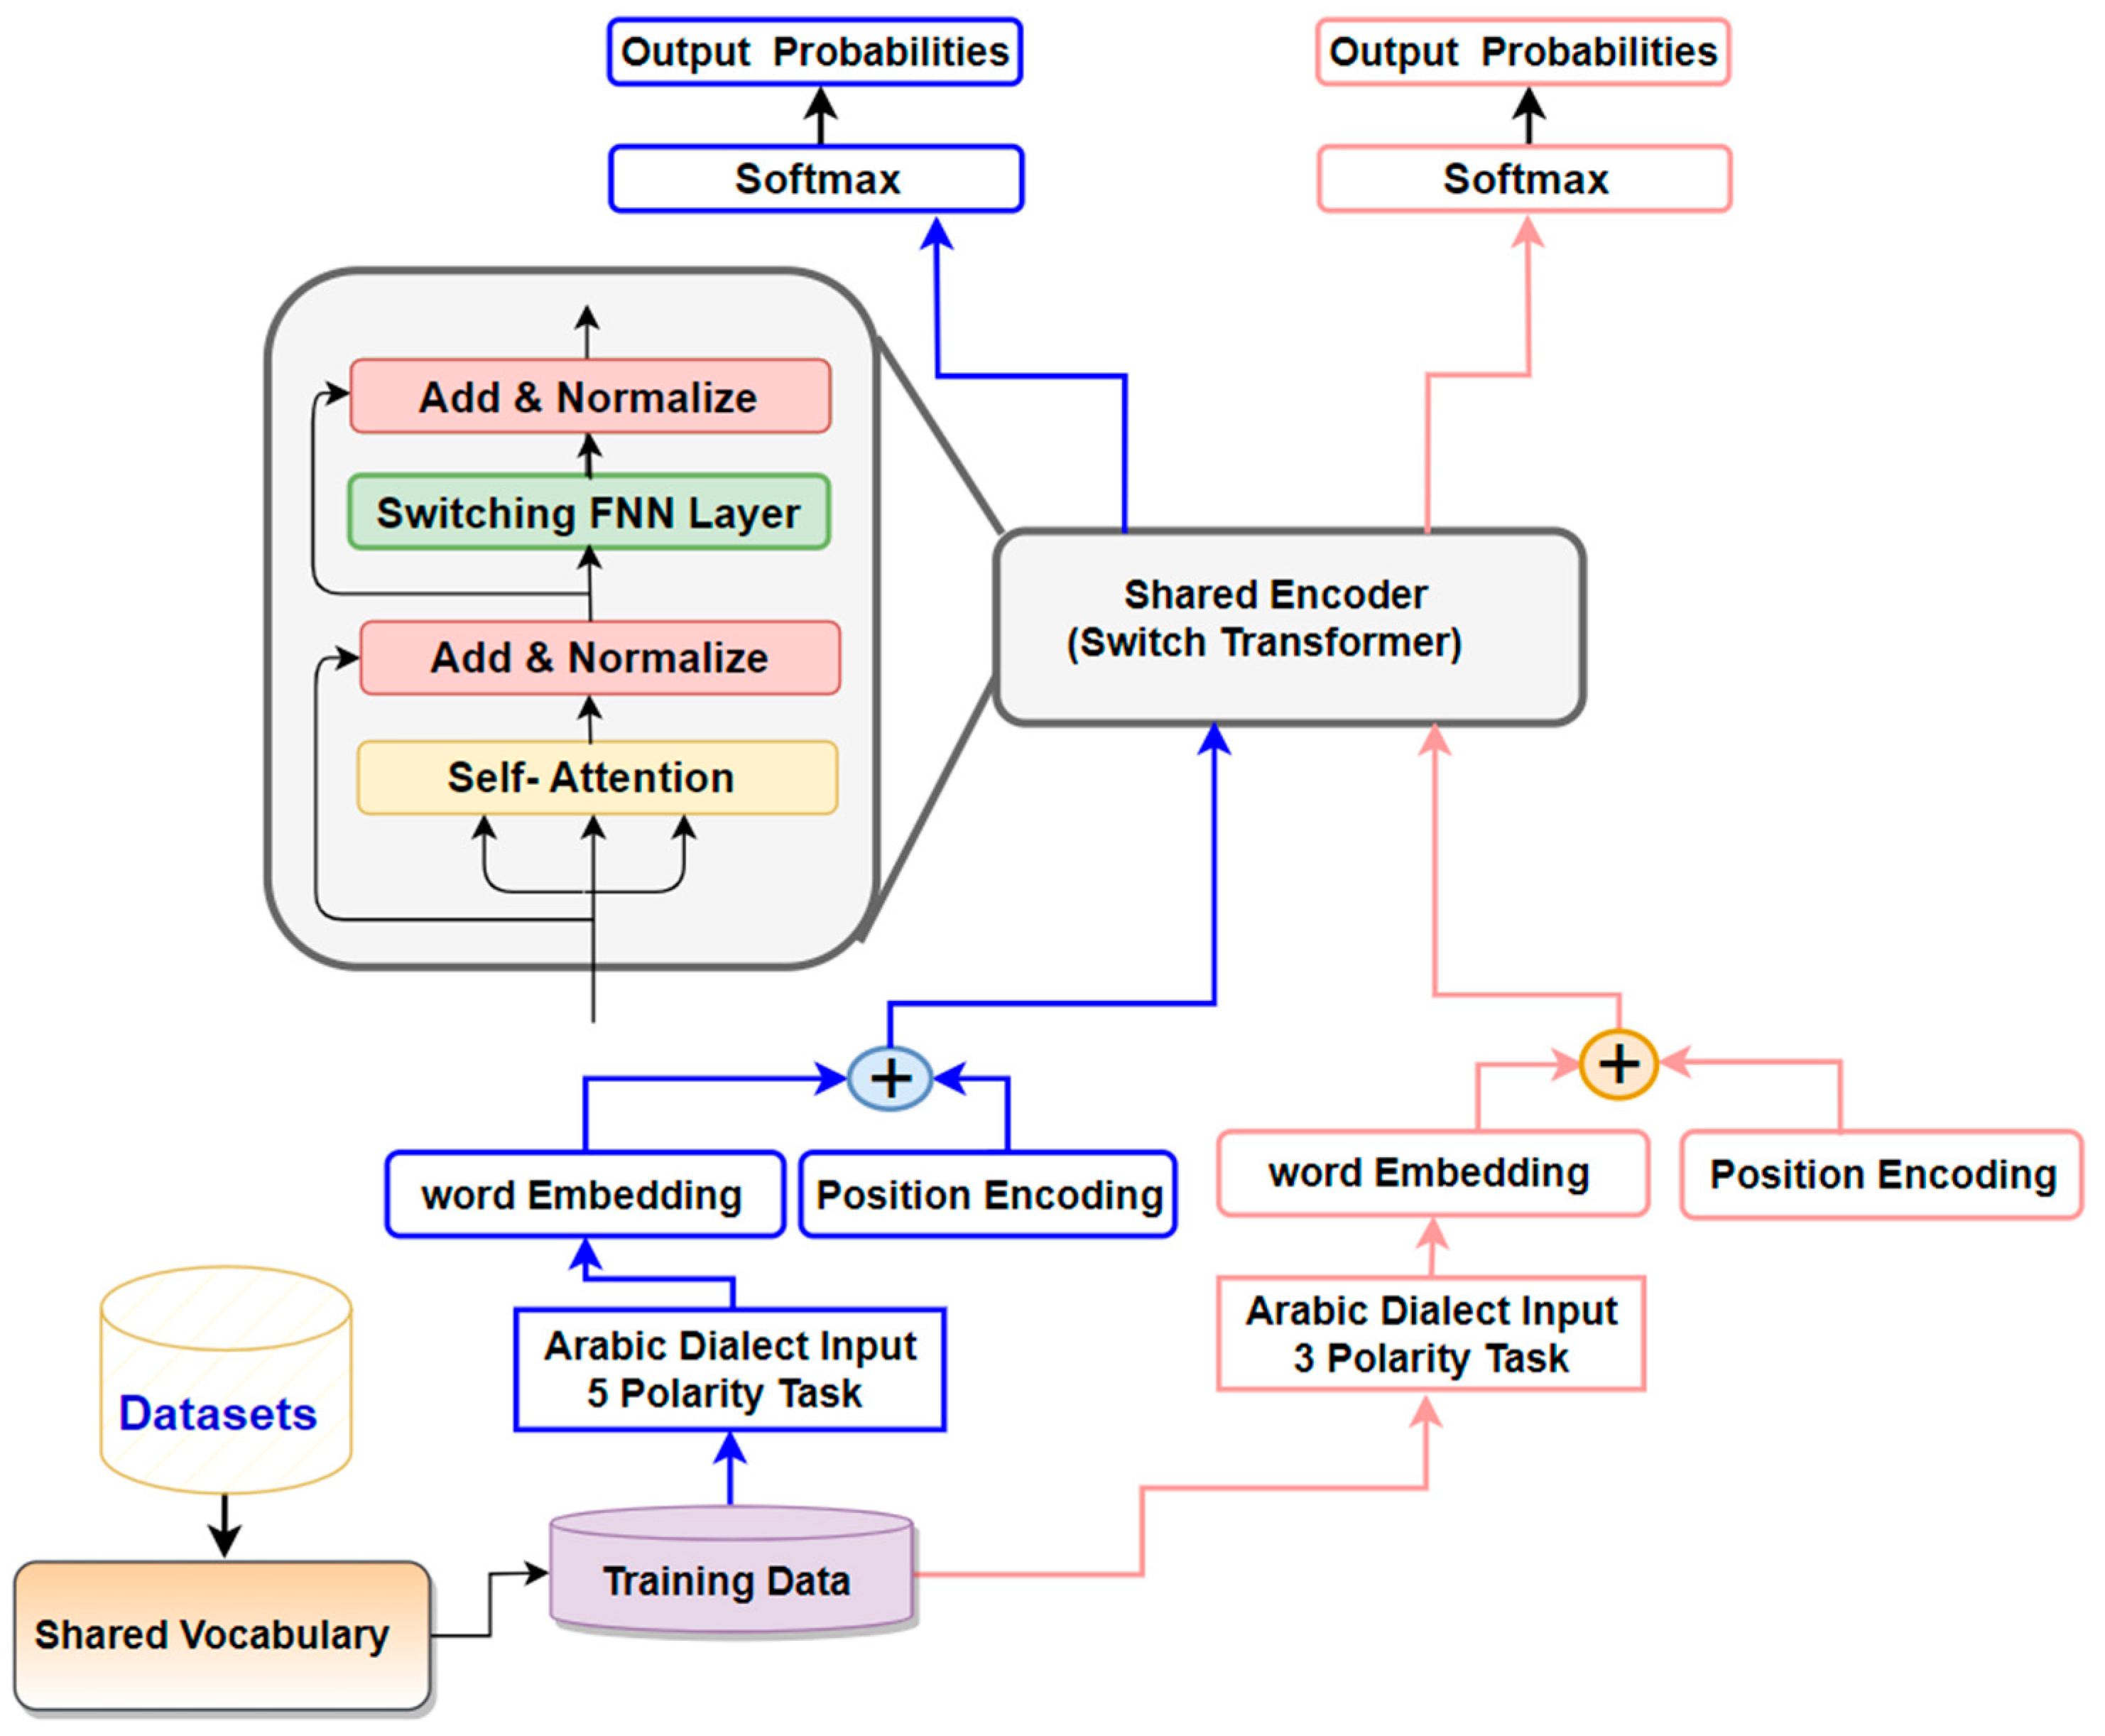
- Furthermore, a multi-head attention (MHA) mechanism was devised to capitalize on the correlation between three and five polarities through the utilization of a shared switch-transformer encoder layer. We elucidate the process of sequentially and collectively learning two tasks (ternary and five classifications) within the MTL framework. This approach aims to refine the representation of ADs text for each task and expand the scope of captured features.
- This research paper studied the effect of training the proposed switch-transformer model with varying embedding dimensions for each token, diverse token values, different attention head numbers, varying filter sizes, a diverse number of experts, a range of batch sizes, and multiple dropout values.
- The proposed SA-ST model employed a multi-head attention (MHA) mechanism to evaluate the correlation strength between two words within a sentence. This has notably bolstered the relevance and importance of various Natural Language Processing tasks.
2. Literature Review
3. The Proposed Switch-Transformer Sentiment Analysis Model that utilizes MoE Mechanism
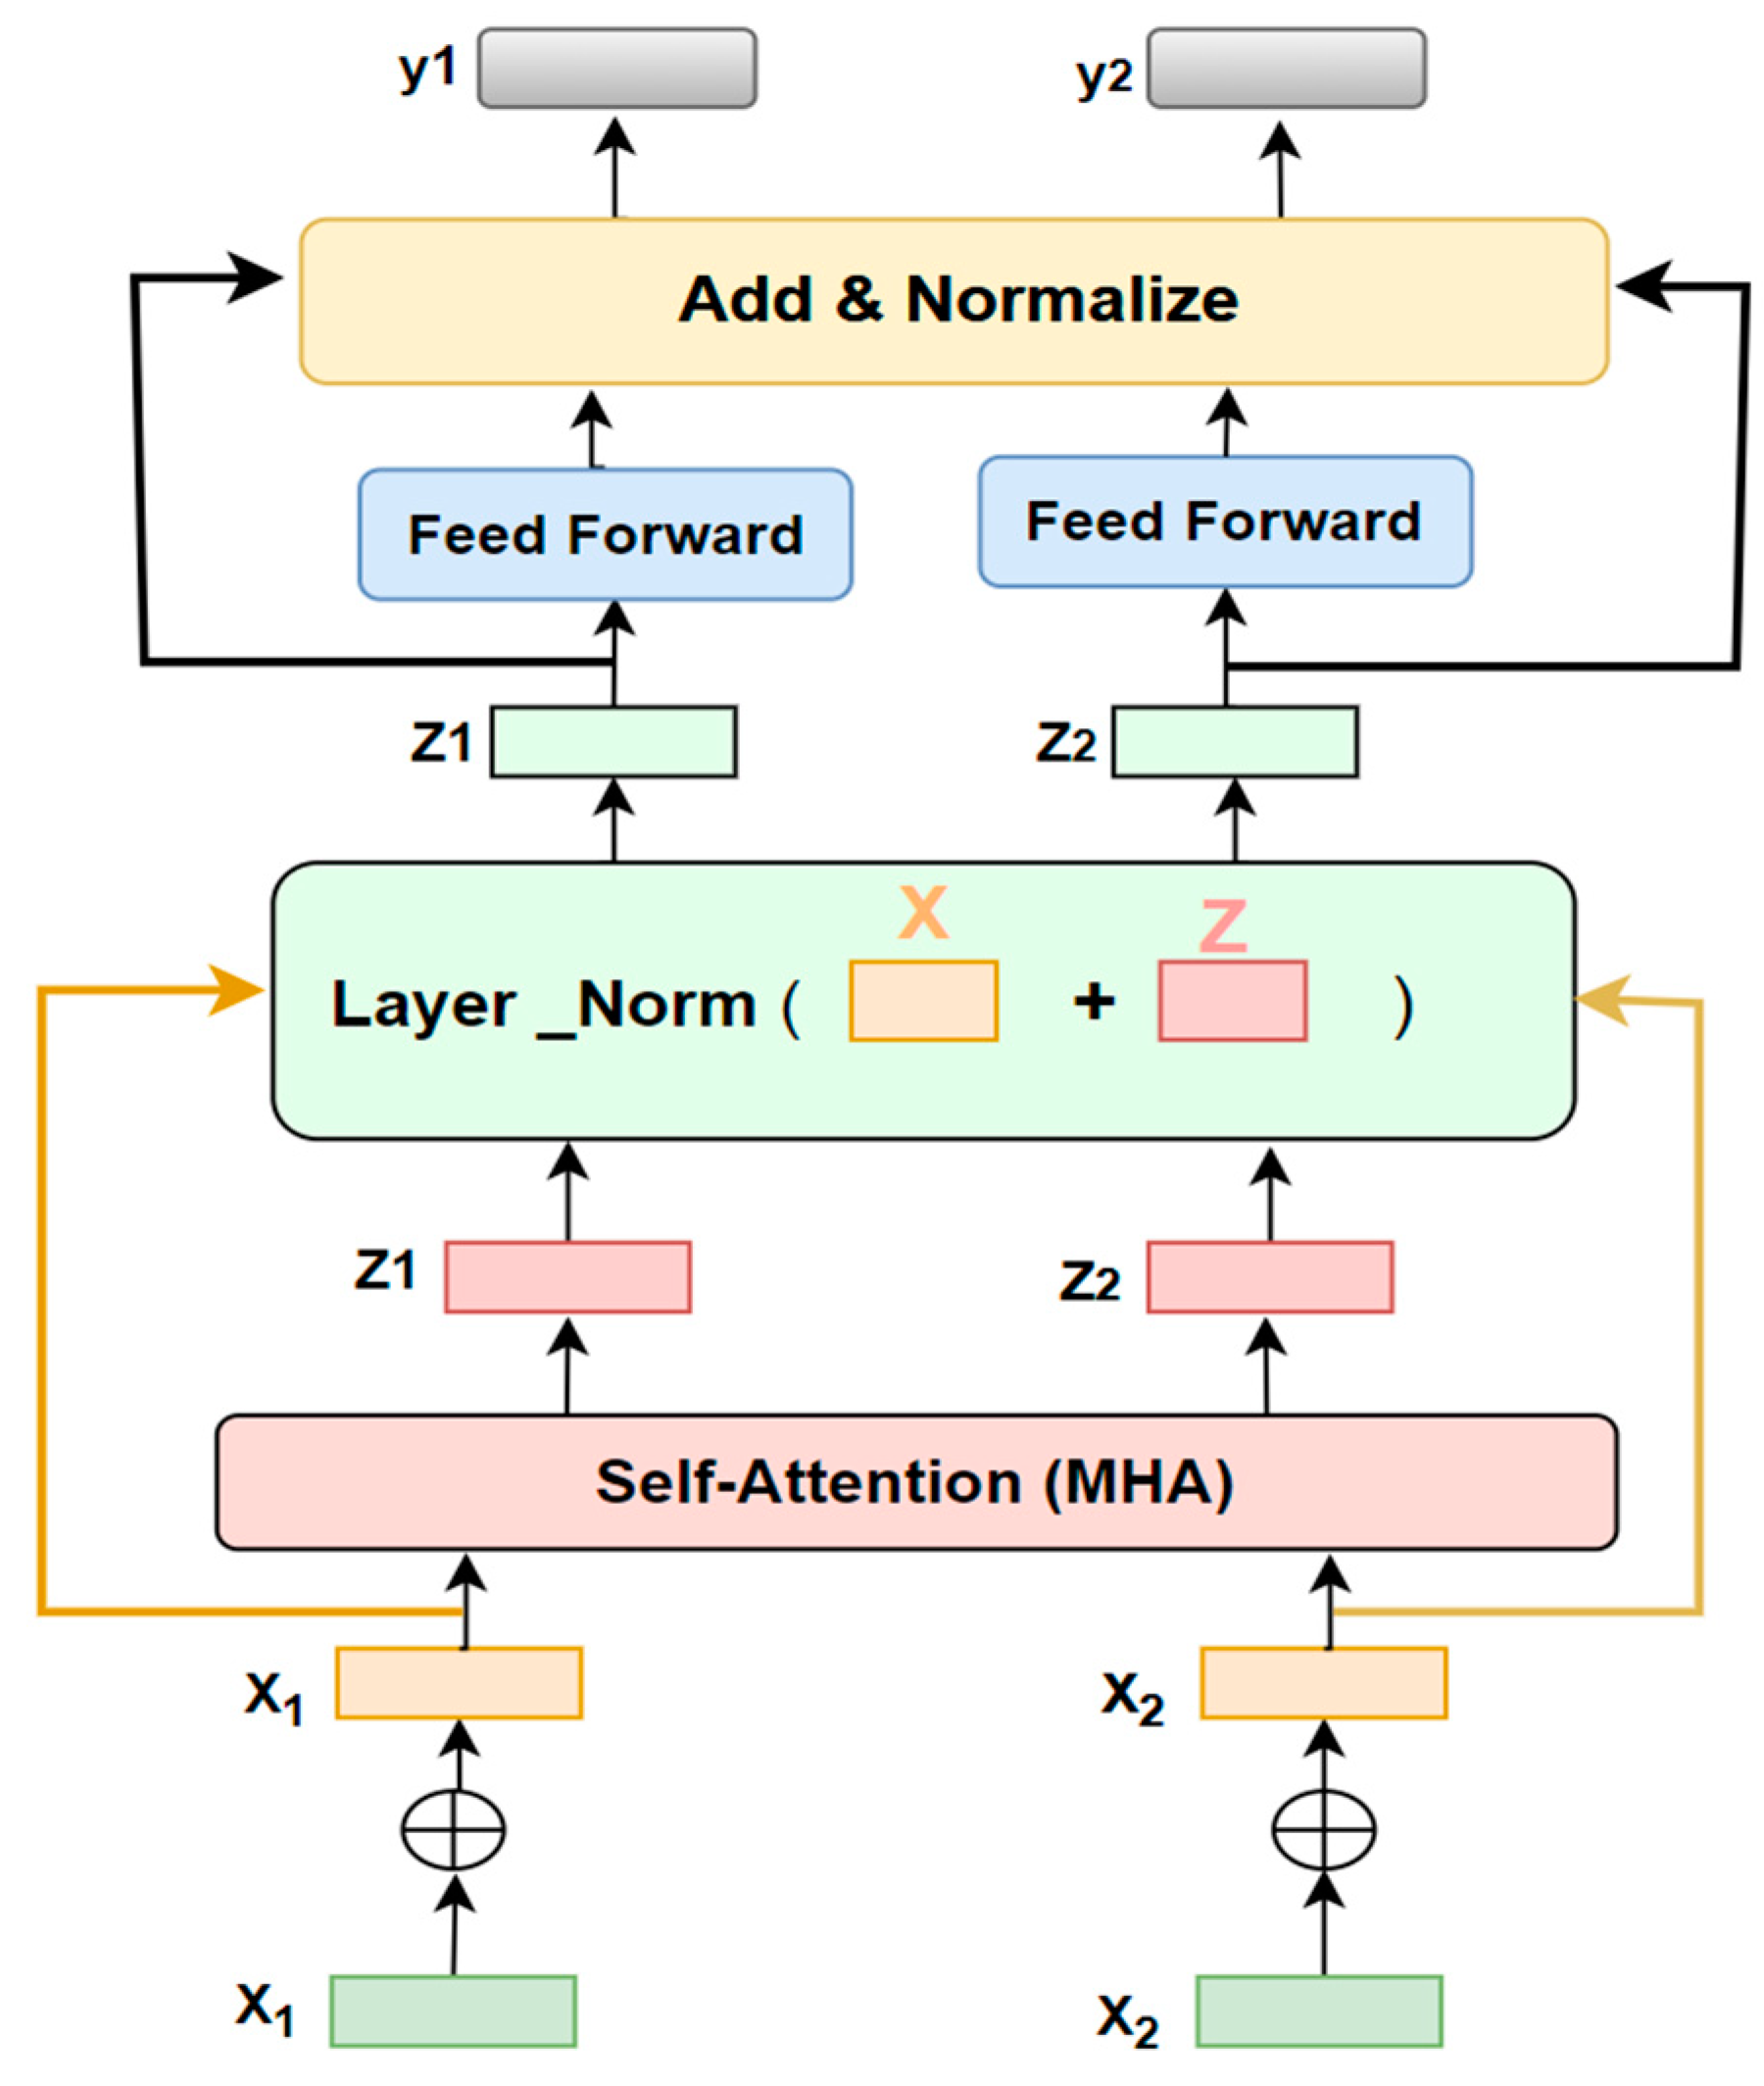
- Linear Transformation: The input sequence undergoes a transformation, resulting in the creation of three vectors: query key , and value . This is achieved through the application of a linear transformation to the embedded input.
- Segmentation: The vectors , , and are subsequently divided into multiple heads denoted as . This enables the model to concurrently to attend on distinct facets of the input sequence, as described in Equation 1.
- Scaled Dot-Product Attention: For every , the model determines the attention weights between the and vectors by proportionally adjusting their dot product using the square root of the vector dimension. This process evaluates the significance of each K vector in relation to its corresponding vector.
- Softmax: The resultant attention weights undergo normalization through the application of a softmax function, guaranteeing that their collective sum amounts to 1.
- The attention weights are subsequently employed to balance the vectors, generating an attention output for each component as indicated in Equation 2
- The combined attention outputs from each head are merged and then re-mapped to the initial vector dimension via an additional linear transformation, as outlined in Equation 3.
- Feed Forward Network: The resulting outcome undergoes transmission through a forward-propagating network, introducing nonlinearity and enabling the model to apprehend more intricate connections between the input and output, as stated in Equation 4.
4. Experiments:
4.1. Data
- Guarantee that the training dataset comprises a multitude of origins and encompasses a broad spectrum of demographic profiles, geographic locales, and societal contexts. This approach serves the purpose of mitigating biases, resulting in a dataset that is not only more exhaustive but also more equitable in its composition.
- Confirm that the sentiment labels in the training dataset are evenly distributed among all demographic segments and viewpoints. This helps to reduce the risk of over-generalization and biases stemming from an unequal distribution of sentiment instances.
- Set forth precise labeling directives that explicitly guide human annotators to remain impartial and refrain from introducing their personal biases into the sentiment labels. This approach aids in upholding uniformity and reducing the potential for biases.
- Conducting an exhaustive examination of the training data to pinpoint potential biases is imperative. This entails scrutinizing factors like demographic disparities, serotype reinforcement, and any groups that may be inadequately represented. Upon identification, we implemented appropriate measures to rectify these biases. This involved employing techniques such as data augmentation, oversampling of underrepresented groups, and applying pre-processing methods.
4.2. The Setup of the proposed model:
4.3. The Training Mechanisim of the proposed ST-SA model for Arabic Dialects:
4.4. Sate-of-Art Approaches:
4.5. Results:
| E-D-T | NT | AH | FS | NE | BS | DO | Accuracy (5-Polarity) |
|---|---|---|---|---|---|---|---|
| 50 | 50 | 4 | 50 | 10 | 50 | 0.30 | 81.39% |
| 32 | 100 | 2 | 32 | 10 | 50 | 0.25 | 83.81% |
| 23 | 90 | 2 | 32 | 10 | 60 | 0.25 | 84.02% |
| 30 | 150 | 4 | 30 | 5 | 50 | 0.25 | 82.89% |
| 30 | 25 | 4 | 30 | 5 | 50 | 0.30 | 82.72% |
| E-D-T | NT | AH | FS | NE | BS | DO | Accuracy (5-Polarity) |
|---|---|---|---|---|---|---|---|
| 30 | 20 | 2 | 30 | 6 | 40 | 0.22 | 66.72% |
| 40 | 15 | 3 | 30 | 10 | 55 | 0.25 | 67.37% |
| 35 | 17 | 3 | 35 | 13 | 52 | 0.30 | 64.95% |
|
50 55 |
24 30 |
3 3 |
30 40 |
15 18 |
53 56 |
0.24 0.26 |
68.81% 67.15% |
| E-D-T | NT | AH | FS | NE | BS | DO | Accuracy (5-Polarity) |
|---|---|---|---|---|---|---|---|
| 40 | 20 | 3 | 35 | 10 | 50 | 0.30 | 80.09% |
| 60 | 100 | 3 | 35 | 12 | 70 | 0.27 | 83.91% |
| 35 | 40 | 2 | 40 | 10 | 60 | 0.20 | 81.74% |
| 20 | 40 | 4 | 39 | 15 | 40 | 0.30 | 82.65% |
| Model | Polarity | Accuracy |
|---|---|---|
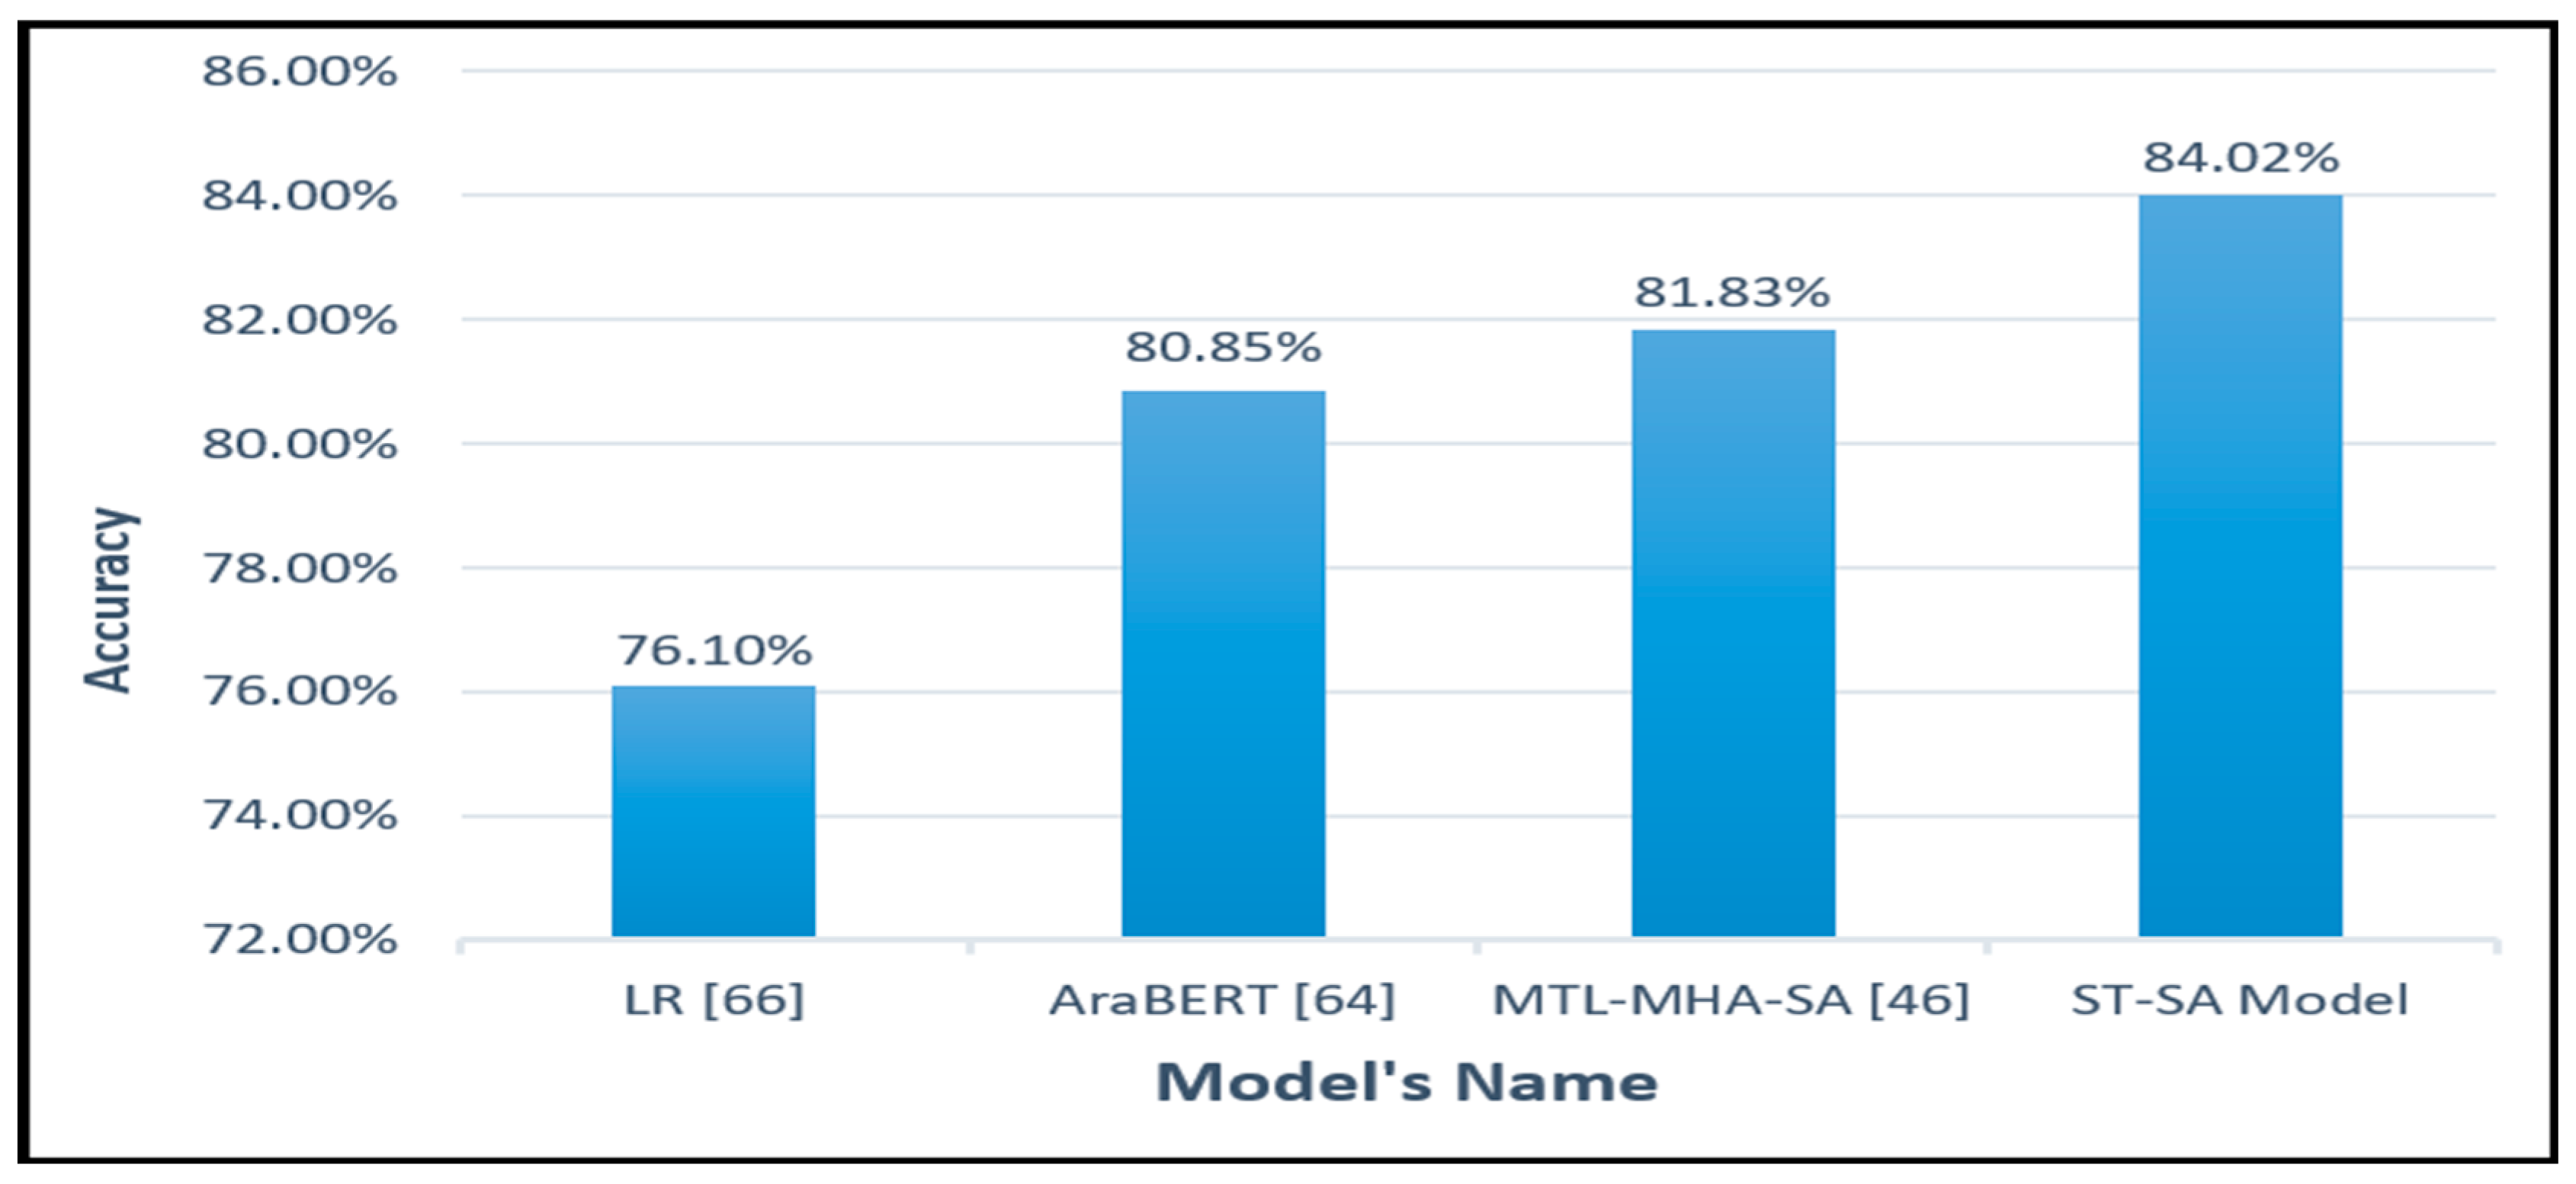
| LR [66] | 5 | 76.1% |
| AraBERT [64] MTL-MHA-SA [46] |
5 5 |
80.85% 81.83% |
| The proposed ST-SA Model | 5 | 84.02% |
| Model | Polarity | Accuracy |
|---|---|---|
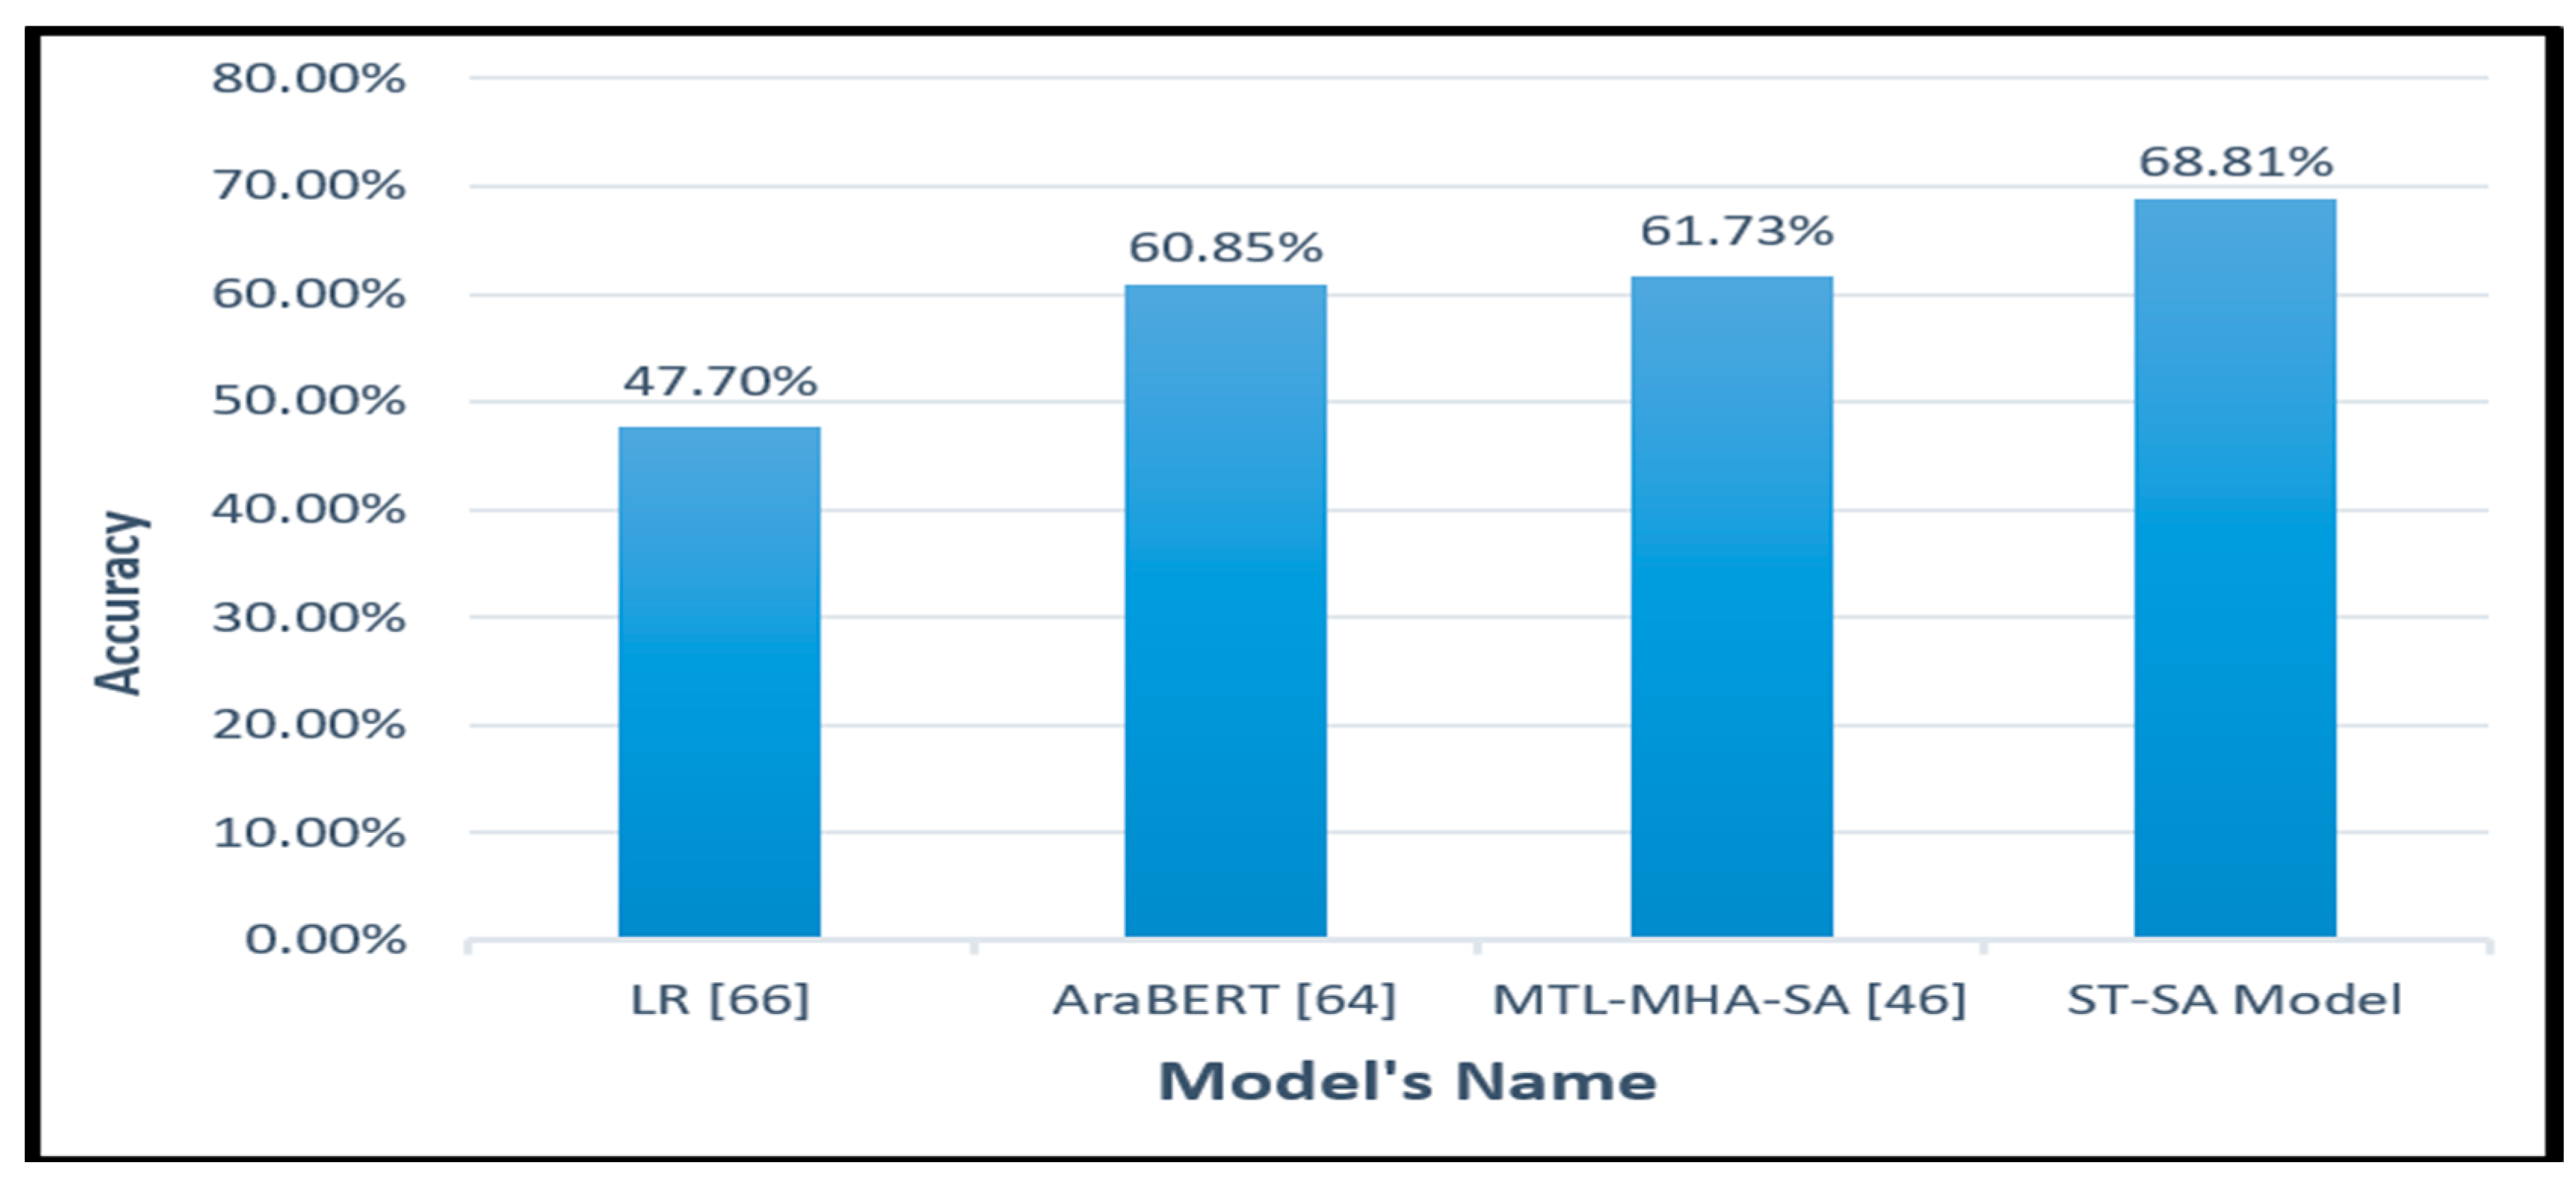
| LR [24] | 5 | 47.7% |
| AraBERT [64] | 5 | 60.85% |
| The MTL-MHA SA [46] The proposed ST-SA Model |
5 5 |
61.73% 68.81% |
| Model | Polarity | Accuracy |
|---|---|---|
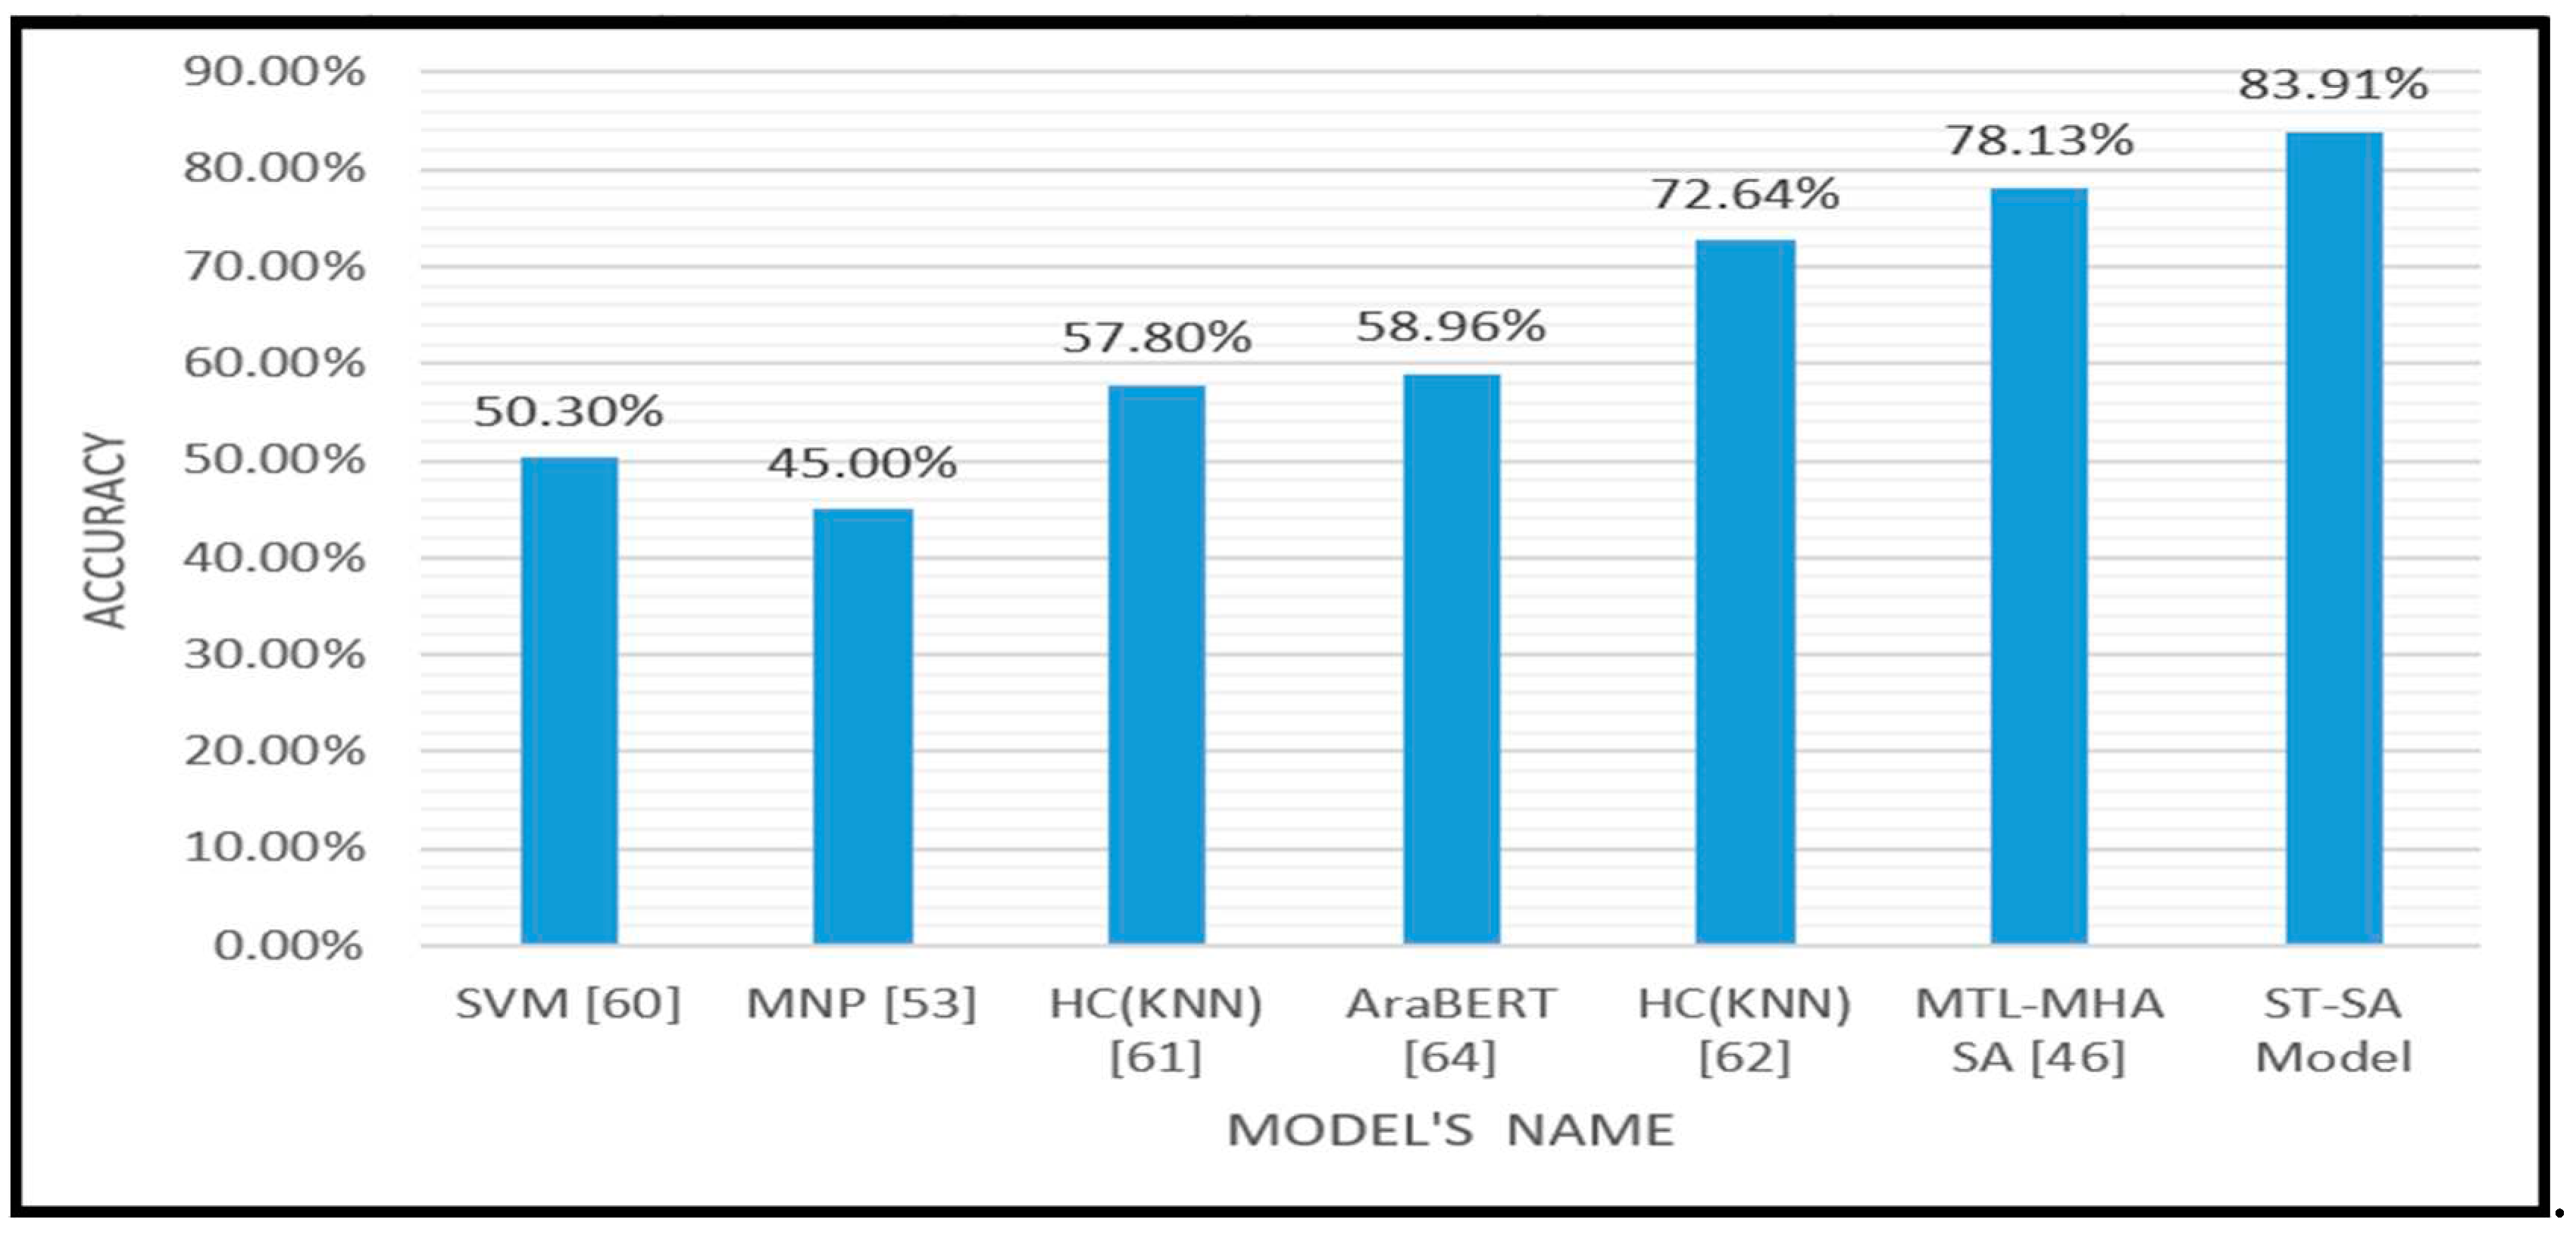
| SVM [60] | 5 | 50.3% |
| MNP [53] HC(KNN) [61] AraBERT [64] HC(KNN) [62] MTL-MHA SA [46] The Proposed ST-SA Model |
5 5 5 5 5 5 |
45.0% 57.8% 58.96% 72.64% 78.13% 83.91% |
| ST-SA Training Method | HARD (imbalance) Accuracy | BRAD (imbalance) Accuracy |
|---|---|---|
| Alternately | 84.02% | 67.37% |
| Jointly | 76.62% | 64.23% |
4.6. Impact of number of experts NE:
4.7. Impact of Length of Input Sentence:
4.8. Principal Findings:
- The study proposes an innovative approach, the switch-transformer multi-task learning (ST-MTL) Model, for classifying Arabic Dialects (ADs) into five distinct categories. This method combines Multi-Task Learning (MTL) with a cutting-edge switch-transformer model. The incorporation switch-transformer and particularly the Mixture of Experts (MoE) mechanism serves to augment the portrayal of the comprehensive text sequence on a global scale.
- The model’s capability to draw insights from various experts, each specializing in different aspects of the data, allows it to combine their findings, thereby boosting overall performance. This can lead to a heightened proficiency in tasks requiring a deep understanding of inputs, offering a promising solution to the limitations posed by restricted datasets in text classification for AD.
- Elevating Quality through MTL and switch-transfomer: The amalgamation of the Multi-Task Learning (MTL) framework with the incorporation of word-units as input attributes to the MHA sub-layer in switch-transformer encoder yields noteworthy advantages. This synergy is particularly pronounced in low-resource language Sentiment Analysis endeavors, exemplified by tasks involving Arabic Dialects.
- Superior Performance of Alternate Learning Over Joint Learning: The results indicate that opting for alternate learning, rather than joint learning, leads to enhanced effectiveness.
- Impact of Input Sentence Length: The efficacy of the suggested ST-SA model amplified as the length of input sentences extended, notably for sentences comprising 40 to 50-word tokens and those surpassing 50-word tokens, attaining impressive accuracy scores of 81.32% and 84.02%, respectively.
- Cutting-Edge Advancement: The empirical findings from the practical experimentation of the suggested model clearly demonstrate its supremacy over current methodologies. This is substantiated by the remarkable total accuracy rates of 84.02% on the HARD dataset, 68.81% on the BRAD dataset, and 83.91% on the LARB dataset. Notably, this represents a notable enhancement compared to renowned models such as The MTL-MHA SA ,AraBERT and LR.
5. Conclusion:
Author Contributions
Funding
Data Availability Statement
Conflicts of Interest
References
- Salloum, S.A.; AlHamad, A.Q.; Al-Emran, M.; Shaalan, K. A survey of Arabic text classification. Inter Journal Elctre Comput Engi. 2018, 8, 4352–4355. [Google Scholar]
- Harrat, S.; Meftouh, K.; Smaili, K. Machine translation for Arabic dialects (survey). Inf.Process. Manag . 2019, 56, 262–273. [Google Scholar] [CrossRef]
- El-Masri, M.; Altrabsheh, N.; Mansour, H. Successes and challenges of Arabic sentiment analysis research: A literature review. Soc Netw Anal Min. 2017, 7, 54. [Google Scholar] [CrossRef]
- Elnagar, A.; Yagi, S.M.; Nassif, A.B.; Shahin, I.; Salloum, S.A. Systematic Literature Review of Dialectal Arabic: Identification and Detection. IEEE Access. 2021, 9, 31010–31042. [Google Scholar] [CrossRef]
- Abdul-Mageed, M. Modeling Arabic subjectivity and sentiment in lexical space. info.process.Manag. 2019, 56, 308–319 ttps://doiorg/101016/jipm201707004. [Google Scholar] [CrossRef]
- Al-Smadi, M.; Al-Ayyoub, M.; Jararweh, Y.; Qawasmeh, O. Enhancing Aspect-Based Sentiment Analysis of Arabic Hotels’ reviews using morphological, syntactic and semantic features. Info.Process.Manag. 2019, 56, 308–319. [Google Scholar] [CrossRef]
- Baly, R.; Badaro, G.; El-Khoury, G.; Moukalled, R.; Aoun, R.; Hajj, H.; El-Hajj, W.; Habash, N.; Shaban, K.; Diab, M.; et al. A Characterization Study of Arabic Twitter Data with a Benchmarking for State-of-the-Art Opinion Mining Models. In Proceedings of the Third Arabic Natural Language Processing Workshop, Valencia, Spain, 3 April 2017; pp. 110–118. [Google Scholar] [CrossRef]
- El-Beltagy, S.R.; El Kalamawy, M.; Soliman, A.B. NileTMRG at SemEval-2017 Task 4: Arabic Sentiment Analysis. In proceeding of the 11th International Workshop on Semantic Evaluation (semEval-2017), Vancouver, BC, Canada, 3-4 August 2017; pp. 790–795. [Google Scholar] [CrossRef]
- Jabreel, M.; Moreno, A. SiTAKA at SemEval-2017 Task 4: Sentiment Analysis in Twitter Based on a Rich set of Features. In Proceedings of the 11th International workshops on Semantic Evaluation (SemEval-2017), Vancouver, BC, Canada, 3–4 August 2017; pp. 692–697. [Google Scholar] [CrossRef]
- Mulki, H.; Haddad, H.; Gridach, M.; Babaoglu, I. Tw-StAR at SemEval-2017 Task 4: Sentiment Classification of Arabic Tweets. In Proceedings of the 11th International Workshop on Semantic Evaluation (SemEval-2017), Vancouver, BC, Canada, 3–4 August 2017; pp. 664–669. [Google Scholar] [CrossRef]
- Siddiqui, S.; Monem, A.A.; Shaalan, K. Evaluation and enrichment of Arabic sentiment analysis. Stud.Compu. Intell. 2017, 740, 17–34. [Google Scholar] [CrossRef]
- Al-Azani, S.; El-Alfy, E.S. Using Word Embedding and Ensemble Learning for Highly Imbalanced Data Sentiment analysis in short Arabic text. Pocedia Comput. Sci. 2017, 109, 359–366. [Google Scholar] [CrossRef]
- Alali, M.; Sharef, N.M.; Hamdan, H.; Murad, M.A.A.; Husin, N.A. Multi-layers convolutional neural network for twitter sentiment ordinal scale classification. Adv. Intell. Syst. Comput. 2018, 700, 446–454. [Google Scholar] [CrossRef]
- Alali, M.; Sharef, N.M.; Murad, M.A.A.; Hamdan, H.; Husin, N.A. Narrow Convolutional Neural Network for Arabic Dialects Polarity Classification. IEEE Access 2019, 7, 96272–96283. [Google Scholar] [CrossRef]
- Gridach, M.; Haddad, H.; Mulki, H. Empirical evaluation of word representations on Arabic sentiment analysis. Commun. Comput. Inf. Sci. 2018, 782, 147–158. [Google Scholar] [CrossRef]
- Al Omari, M.; Al-Hajj, M.; Sabra, A.; Hammami, N. Hybrid CNNs-LSTM Deep Analyzer for Arabic Opinion Mining. In Proceedings of the 2019 6th International Conference on Social Networks Analysis, Management and Security (SNAMS), Granada, Spain, 22–25 October 2019; pp. 364–368. [Google Scholar] [CrossRef]
- W. Fedus and et. al., “Switch transformers: Scaling to trillion parameter models with simple and efficient sparsity,” J. Mach. Learn. Res, vol. 23, pp. 1–40, 2021.
- Vaswani, A.; Shazeer, N.; Parmar, N.; Uszkoreit, J.; Jones, L.; Gomez, A.N.; Kaiser, L.; Polosukhin, I. Attention is all you need. In Proceedings of the 31st Conference on Neural Information Processing Systems (NIPS), Long Beach, CA, USA, 4–9 December 2017; pp. 5998–9008. [Google Scholar] [CrossRef]
- Jin, N.; Wu, J.; Ma, X.; Yan, K.; Mo, Y. Multi-task learning model based on multi-scale cnn and lstm for sentiment classification. IEEE Access 2020, 8, 77060–77072. [Google Scholar] [CrossRef]
- Aly, M.; Atiya, A. LABR: A large scale Arabic book reviews dataset. In Proceedings of the 51st Annual Meeting of the Association for Computational Linguistics (Volume 2: Short Papers), Sofia, Bulgaria, 4–9 August 2013; Volume 2, pp. 494–498. [Google Scholar]
- Al Shboul, B.; Al-Ayyoub, M.; Jararweh, Y. Multi-way sentiment classification of Arabic reviews. In Proceedings of the 2015 6th International Conference on Information and Communication Systems (ICICS), Amman, Jordan, 7–9 April 2015; pp. 206–211. [Google Scholar]
- Al-Ayyoub, M.; Nuseir, A.; Kanaan, G.; Al-Shalabi, R. Hierarchical Classifiers for Multi-Way Sentiment Analysis of Arabic Reviews. Int. J. Adv. Comput. Sci. Appl. 2016, 7, 531–539. [Google Scholar] [CrossRef]
- Nuseir, A.; Al-Ayyoub, M.; Al-Kabi, M.; Kanaan, G.; Al-Shalabi, R. Improved hierarchical classifiers for multi-way sentiment analysis. Int. Arab J. Inf. Technol. 2017, 14, 654–661. [Google Scholar]
- Elnagar, A.; Einea, O. BRAD 1.0: Book reviews in Arabic dataset. In Proceedings of the 2016 IEEE/ACS 13th International Conference of Computer Systems and Applications (AICCSA), Agadir, Morocco, 29 November–2 December 2016. [Google Scholar] [CrossRef]
- Elnagar, A.; Khalifa, Y.S.; Einea, A. Hotel Arabic-reviews dataset construction for sentiment analysis applications. Stud. Comput. Intell. 2018, 740, 35–52. [Google Scholar] [CrossRef]
- Balikas, G.; Moura, S.; Amini, M.-R. Multitask Learning for Fine-Grained Twitter Sentiment Analysis. In Proceedings of the 40th International ACM SIGIR Conference on Research and Development in Information Retrieval, Shinjuku, Tokyo, 7–11 August 2017; pp. 1005–1008. [Google Scholar] [CrossRef]
- Lu, G.; Zhao, X.; Yin, J.; Yang, W.; Li, B. Multi-task learning using variational auto-encoder for sentiment classification. Pattern Recognit. Lett. 2020, 132, 115–122. [Google Scholar] [CrossRef]
- Jin, N.; Wu, J.; Ma, X.; Yan, K.; Mo, Y. Multi-task learning model based on multi-scale cnn and lstm for sentiment classification. IEEE Access 2020, 8, 77060–77072. [Google Scholar] [CrossRef]
- Sohangir, S.; Wang, D.; Pomeranets, A.; Khoshgoftaar, T.M. Big Data: Deep Learning for financial sentiment analysis. J. Big Data 2018, 5, 3. [Google Scholar] [CrossRef]
- Jangid, H.; Singhal, S.; Shah, R.R.; Zimmermann, R. Aspect-Based Financial Sentiment Analysis using Deep Learning. In Proceedings of the Companion of the The Web Conference 2018 on The Web Conference, Lyon, France, 23–27 April 2018; pp. 1961–1966. [Google Scholar] [CrossRef]
- Ain, Q.T.; Ali, M.; Riaz, A.; Noureen, A.; Kamran, M.; Hayat, B.; Rehman, A. Sentiment analysis using deep learning techniques: A review. Int. J. Adv. Comput. Sci. Appl. 2017, 8, 424. [Google Scholar] [CrossRef]
- Gao, Y.; Rong, W.; Shen, Y.; Xiong, Z. Convolutional neural network based sentiment analysis using Adaboost combination. In Proceedings of the 2016 International Joint Conference on Neural Networks (IJCNN), Vancouver, BC, Canada, 24–29 July 2016; pp. 1333–1338. [Google Scholar] [CrossRef]
- Hassan, A.; Mahmood, A. Deep learning approach for sentiment analysis of short texts. In Proceedings of the Third International Conference on Control, Automation and Robotics (ICCAR), Nagoya, Japan, 24–26 April 2017; pp. 705–710. [Google Scholar] [CrossRef]
- Qian, J.; Niu, Z.; Shi, C. Sentiment Analysis Model on Weather Related Tweets with Deep Neural Network. In Proceedings of the 2018 10th International Conference on Machine Learning and Computing, Macau, China, 26–28 February 2018; pp. 31–35. [Google Scholar] [CrossRef]
- Pham, D.-H.; Le, A.-C. Learning multiple layers of knowledge representation for aspect based sentiment analysis. Data Knowl. Eng. 2018, 114, 26–39. [Google Scholar] [CrossRef]
- Preethi, G.; Krishna, P.V.; Obaidat, M.S.; Saritha, V.; Yenduri, S. Application of deep learning to sentiment analysis for recommender system on cloud. In Proceedings of the 2017 International Conference on Computer, Information and Telecommunication Systems (CITS), Dalian, China, 21–23 July 2017; pp. 93–97. [Google Scholar] [CrossRef]
- Roshanfekr, B.; Khadivi, S.; Rahmati, M. Sentiment analysis using deep learning on Persian texts. In Proceedings of the 2017 Iranian Conference on Electrical Engineering (ICEE), Tehran, Iran, 2–4 May 2017; pp. 1503–1508. [Google Scholar] [CrossRef]
- Alharbi, A.S.M.; de Doncker, E. Twitter sentiment analysis with a deep neural network: An enhanced approach using user behavioral information. Cogn. Syst. Res. 2019, 54, 50–61. [Google Scholar] [CrossRef]
- Abid, F.; Alam, M.; Yasir, M.; Li, C.J. Sentiment analysis through recurrent variants latterly on convolutional neural network of Twitter. Future Gener. Comput. Syst. 2019, 95, 292–308. [Google Scholar] [CrossRef]
- Vateekul, P.; Koomsubha, T. A study of sentiment analysis using deep learning techniques on Thai Twitter data. In Proceedings of the 2016 13th International Joint Conference on Computer Science and Software Engineering (JCSSE), Khon Kaen, Thailand, 13–15 July 2016; pp. 1–6. [Google Scholar] [CrossRef]
- Pandey, A.C.; Rajpoot, D.S.; Saraswat, M. Twitter sentiment analysis using hybrid cuckoo search method. Inf. Process. Manag. 2017, 53, 764–779. [Google Scholar] [CrossRef]
- Paredes-Valverde, M.A.; Colomo-Palacios, R.; Salas-Zárate, M.D.P.; Valencia-García, R. Sentiment analysis in Spanish for improvement of products and services: A deep learning approach. Sci. Program. 2017, 2017, 1329281. [Google Scholar] [CrossRef]
- Patil, H.; Sharma, S.; Bhatt, D.P. Hybrid approach to SVM algorithm for sentiment analysis of tweets. In Proceedings pf AIP conference, June 2023; Vol. 2699, No. 1. [CrossRef]
- Luvembe, A.M.; Li, W.; Li, S.; Liu, F.; Xu, G. Dual emotion based fake news detection: A deep attention-weight update approach. Inform Proces & Manag,2023, 60(4), 103354. [CrossRef]
- Vyas, P.; Reisslein, M.; Rimal, B.P.; Vyas, G.; Basyal, G.P.; Muzumdar, P. Automated classification of societal sentiments on Twitter with machine learning. IEEE Transac on Tech and Society 2022, 3, 100–110. [Google Scholar] [CrossRef]
- Baniata, L.H.; Kang, S. Multi-Head Attention Based-Sentiment Analysis Model for Arabic Dialects that utilizes Shared Vocabulary. Electronics 2023.
- Alali, M.; Mohd Sharef, N.; Azmi Murad, M.A.; Hamdan, H.; Husin, N.A. Multitasking Learning Model Based on Hierarchical Attention Network for Arabic Sentiment Analysis Classification. Electronics 2022, 11, 1193. [Google Scholar] [CrossRef]
- T. Lin and et. al., “A survey of transformers,” AI Open, 2022. [CrossRef]
- C. Raffel and et. al., “Exploring the limits of transfer learning with a unified text-to-text transformer,” The Journal of Machine Learning Research, vol. 21, no. 1, pp. 5485–5551, 2020.
- F. Xue and et. al., “Go wider instead of deeper,” in Proceedings of the AAAI Conference on Artificial Intelligence, vol. 36, no. 8, 2022, pp. 8779–8787.
- Lazaridou and et. al., “Mind the gap: Assessing temporal generalization in neural language models,” Advances in Neural Information Processing Systems, vol. 34, pp. 29 348–29 363, 2021.
- Fan and et. al., “Beyond english-centric multilingual machine translation,” The Journal of Machine Learning Research, vol. 22, no. 1, pp. 4839–4886, 2021.
- Aly, M.; Atiya, A. LABR: A large scale Arabic book reviews dataset. In Proceedings of the 51st Annual Meeting of the Association for Computational Linguistics (Volume 2: Short Papers), Sofia, Bulgaria, 4–9 August 2013; Volume 2, pp. 494–498. [Google Scholar]
- Dean, Jeff, and Rajat Monga‘TensorFlow. "Large-Scale Machine Learning on Heterogeneous Distributed Systems’." TensorFlow. org (2015).
- Gulli A, Pal S. Deep learning with Keras. Packt Publishing Ltd; 2017 Apr 26.
- Varoquaux, G.; Buitinck, L.; Louppe, G.; Grisel, O.; Pedregosa, F.; Mueller, A. Scikit-learn: Machine Learning in Python. GetMobile Mob. Comput. Commun. 2015, 19, 29–33. [Google Scholar] [CrossRef]
- Baniata, L.H.; Park, S.; Park, S.-B. A multitask-based neural machine translation model with part-of-speech tags integration for Arabic dialects. Appl. Sci. 2018, 8, 2502. [Google Scholar] [CrossRef]
- Baniata, L.H.; Park, S.; Park, S.-B. A Neural Machine Translation Model for Arabic Dialects That Utilizes Multitask Learning (MTL). Comput. Intell. Neurosci. 2018, 2018, 7534712. [Google Scholar] [CrossRef]
- Baziotis, C.; Pelekis, N.; Doulkeridis, C. DataStories at SemEval-2017 Task 4: Deep LSTM with Attention for Message-level and Topic-based Sentiment Analysis. In Proceedings of the 11th International Workshop on Semantic Evaluation (SemEval-2017), Vancouver, BC, Canada, 3–4 August 2017; pp. 747–754. [Google Scholar] [CrossRef]
- Al Shboul, B.; Al-Ayyoub, M.; Jararweh, Y. Multi-way sentiment classification of Arabic reviews. In Proceedings of the 2015 6th International Conference on Information and Communication Systems (ICICS), Amman, Jordan, 7–9 April 2015; pp. 206–211. [Google Scholar]
- Al-Ayyoub, M.; Nuseir, A.; Kanaan, G.; Al-Shalabi, R. Hierarchical Classifiers for Multi-Way Sentiment Analysis of Arabic Reviews. Int. J. Adv. Comput. Sci. Appl. 2016, 7, 531–539. [Google Scholar] [CrossRef]
- Nuseir, A.; Al-Ayyoub, M.; Al-Kabi, M.; Kanaan, G.; Al-Shalabi, R. Improved hierarchical classifiers for multi-way sentiment analysis. Int. Arab J. Inf. Technol. 2017, 14, 654–661. [Google Scholar]
- Devlin, J.; Chang, M.-W.; Lee, K.; Toutanova, K. BERT: Pre-training of Deep bidirectional transformers for language understanding. In Proceedings of the 2019 Conference of the North American Chapter of the Association for Computational Linguistics: Human Language Technologies, Minneapolis, MN, USA, 2–7 June 2019; Volume 1, pp. 4171–4186. [Google Scholar] [CrossRef]
- Antoun, W.; Baly, F.; Hajj, H. AraBERT: Transformer-based Model for Arabic Language Understanding. In Proceedings of the LREC 2020 Workshop Language Resources and Evaluation Conference, Marseille, France, 11–16 May 2020; pp. 9–15. [Google Scholar] [CrossRef]
- Zeroual, I.; Goldhahn, D.; Eckart, T.; Lakhouaja, A. OSIAN: Open Source International Arabic News Corpus—Preparation and Integration into the CLARIN-infrastructure. In Proceedings of the Fourth Arabic Natural Language Processing Workshop, Florence, Italy, 28 July–2 August 2019; pp. 175–182. [Google Scholar] [CrossRef]
- Pang, B.; Lee, L. Opinion Mining and Sentiment Analysis, Foundations and Trends® in Information Retrieval; Now Publishers: Boston, MA, USA, 2008; pp. 1–135. [Google Scholar] [CrossRef]
- Liu, S.; Johns, E.; Davison, A.J. End-to-end multi-task learning with attention. In Proceedings of the 2019 IEEE/CVF Conference on Computer Vision and Pattern Recognition (CVPR), Long Beach, CA, USA, 15–20 June 2019; pp. 1871–1880. [Google Scholar] [CrossRef]
- Luong, M.-T.; Pham, H.; Manning, C.D. Effective approaches to attention-based neural machine translation. In Proceedings of the Empirical Methods in Natural Language Processing, Lisbon, Portugal, 17–21 September 2015; pp. 1412–1421. [Google Scholar] [CrossRef]
- Baniata, L.H.; Ampomah, I.K.E.; Park, S. A Transformer-Based Neural Machine Translation Model for Arabic Dialects that Utilizes Subword Units. Sensors 2021, 21, 6509. [Google Scholar] [CrossRef] [PubMed]
- Baniata, L.H.; Kang, S.; Ampomah, I.K.E. A Reverse Positional Encoding Multi-Head Attention-Based Neural Machine Translation Model for Arabic Dialects. Mathematics 2022, 10, 3666. [Google Scholar] [CrossRef]
| Task Type | Highly Positive | Positive | Neutral | Negative | Highly Negative | Total |
|---|---|---|---|---|---|---|
| 3-Polarity | - | 132,208 | 80,326 | 38,467 | - | 251,001 |
| 5-Polarity | 144,179 | 132,208 | 80,326 | 38,467 | 14,382 | 409,562 |
| Task Type | Highly Positive | Positive | Neutral | Negative | Highly Negative | Total |
|---|---|---|---|---|---|---|
| 3-Polarity | - | 158,461 | 106,785 | 47,133 | - | 251,001 |
| 5-Polarity | 16,972 | 158,461 | 106,785 | 47,133 | 31,247 | 510,598 |
| Task Type | Highly Positive | Positive | Neutral | Negative | Highly Negative | Total |
|---|---|---|---|---|---|---|
| 3-Polarity | - | 15,216 | 9841 | 4197 | - | 29,254 |
| 5-Polarity | 19,015 | 15,216 | 9814 | 4197 | 2337 | 50,606 |
| Sentence Length | Accuracy |
|---|---|
| <10 | 77.25% |
| (10-20) | 77.35% |
| (20-30) (30-40) (40-50) > 50 |
77.95% 78.63% 81.32% 84.02% |
Disclaimer/Publisher’s Note: The statements, opinions and data contained in all publications are solely those of the individual author(s) and contributor(s) and not of MDPI and/or the editor(s). MDPI and/or the editor(s) disclaim responsibility for any injury to people or property resulting from any ideas, methods, instructions or products referred to in the content. |
© 2023 by the authors. Licensee MDPI, Basel, Switzerland. This article is an open access article distributed under the terms and conditions of the Creative Commons Attribution (CC BY) license (http://creativecommons.org/licenses/by/4.0/).


