1. Introduction
Brucellosis is a common zoonotic disease caused by
Brucella species. Despite its low fatality rate, it imposes a substantial burden in terms of morbidity and economic costs. Making it a concern for public health and the economy in regions where it is endemic. Brucellosis is a major concern in livestock, leading to abortion, death of young ones, and reduced milk production in infected animals [
1].
Brucella, when present in animals, has the potential to transmit and induce brucellosis in humans, leading to symptoms such as fever, joint pain, and muscle pain.
Brucella spp. are characterized by their gram-negative nature and their ability to thrive as facultative intracellular bacteria. This pathogen can evade the host immune system, enabling it to survive and replicate within host cells. It can multiply within both professional phagocytes and non-professional phagocytes. However, professional phagocytes such as dendritic cells, macrophages, and neutrophils are more efficient at eliminating the ingested
Brucella [
2].
Neutrophils function as the initial defense against
Brucella, while macrophages come into play as the secondary defense and can act as a reservoir for
Brucella infection [
3]. After
Brucella entry, macrophages produce an array of microbial compounds and free radicals, including reactive oxygen species (ROS), superoxide anion (O
-2), hydrogen peroxide (H
2O
2), and hydroxyl (OH), to combat the invading bacteria [
4]. In order to survive in a hostile intracellular environment,
Brucella expresses Cu-Zn SOD and catalase under oxidative stress inside the host cell [
5,
6]. Notably, periplasmic catalase plays a critical role in protecting
Brucella from H
2O
2 in specific conditions within the host cells [
7]. Furthermore, macrophages themselves rely on catalase to regulate oxidative compounds and safeguard themselves against oxidative stress and damage. Thus, catalase is essential for both
Brucella and macrophages during infection.
Catalase is a common antioxidant enzyme with the highest turnover rate among all aerobic organisms. This heme enzyme converts H
2O
2 into water and oxygen, thereby reducing the toxic effects of H
2O
2 and protecting cells from excessive damage. However, catalase in the periplasm of
Brucella also plays a crucial role in protecting the bacteria from H
2O
2 produced during the host cell’s response to brucellosis. The supplementation of catalase to
Brucella-infected macrophages enables the survival of
Brucella [
4]. Therefore, controlling catalase activity may contribute to the management of brucellosis.
The compound 3-amino-1,2,4-triazole (3-AT) is known as a specific catalase inhibitor. 3-AT suppresses catalase activity by covalently binding to the active center of the tetradic form [
8]. It has been reported that 3-AT inhibits the peroxisomal transportation of catalase in human skin fibroblast cell lines [
9]. Ruiz-Ojeda et al. have reported that 3-AT induces the production of ROS and elicits an inflammatory response in human adipocytes [
10], which is closely related with the host’s response to
Brucella infection. Moreover, 3-AT has exhibited beneficial effects including anti-obesity effects, improvements in metabolic status in mice [
11], and inhibition of
Escherichia coli growth [
12]. Although prior studies have shed light on the potential effects of 3-AT and its role in catalase inhibition concerning the modulation of the immune response and bactericidal activity, none have explored its effects on bacterial infectious diseases. Thus, we conducted an investigation utilizing RAW 264.7 cells and an ICR mice model to determine whether 3-AT can enhance host protection against
B. abortus infection or diminish the persistence of this pathogen within the host.
3. Discussion
It is well established that
B. abortus catalase protects against hydrogen peroxide in the host intracellular environment, which is one of the influential host-killing factors in response to
Brucella infection [
7]. These findings have led to new approaches aimed at arresting the survival and replication of intracellular
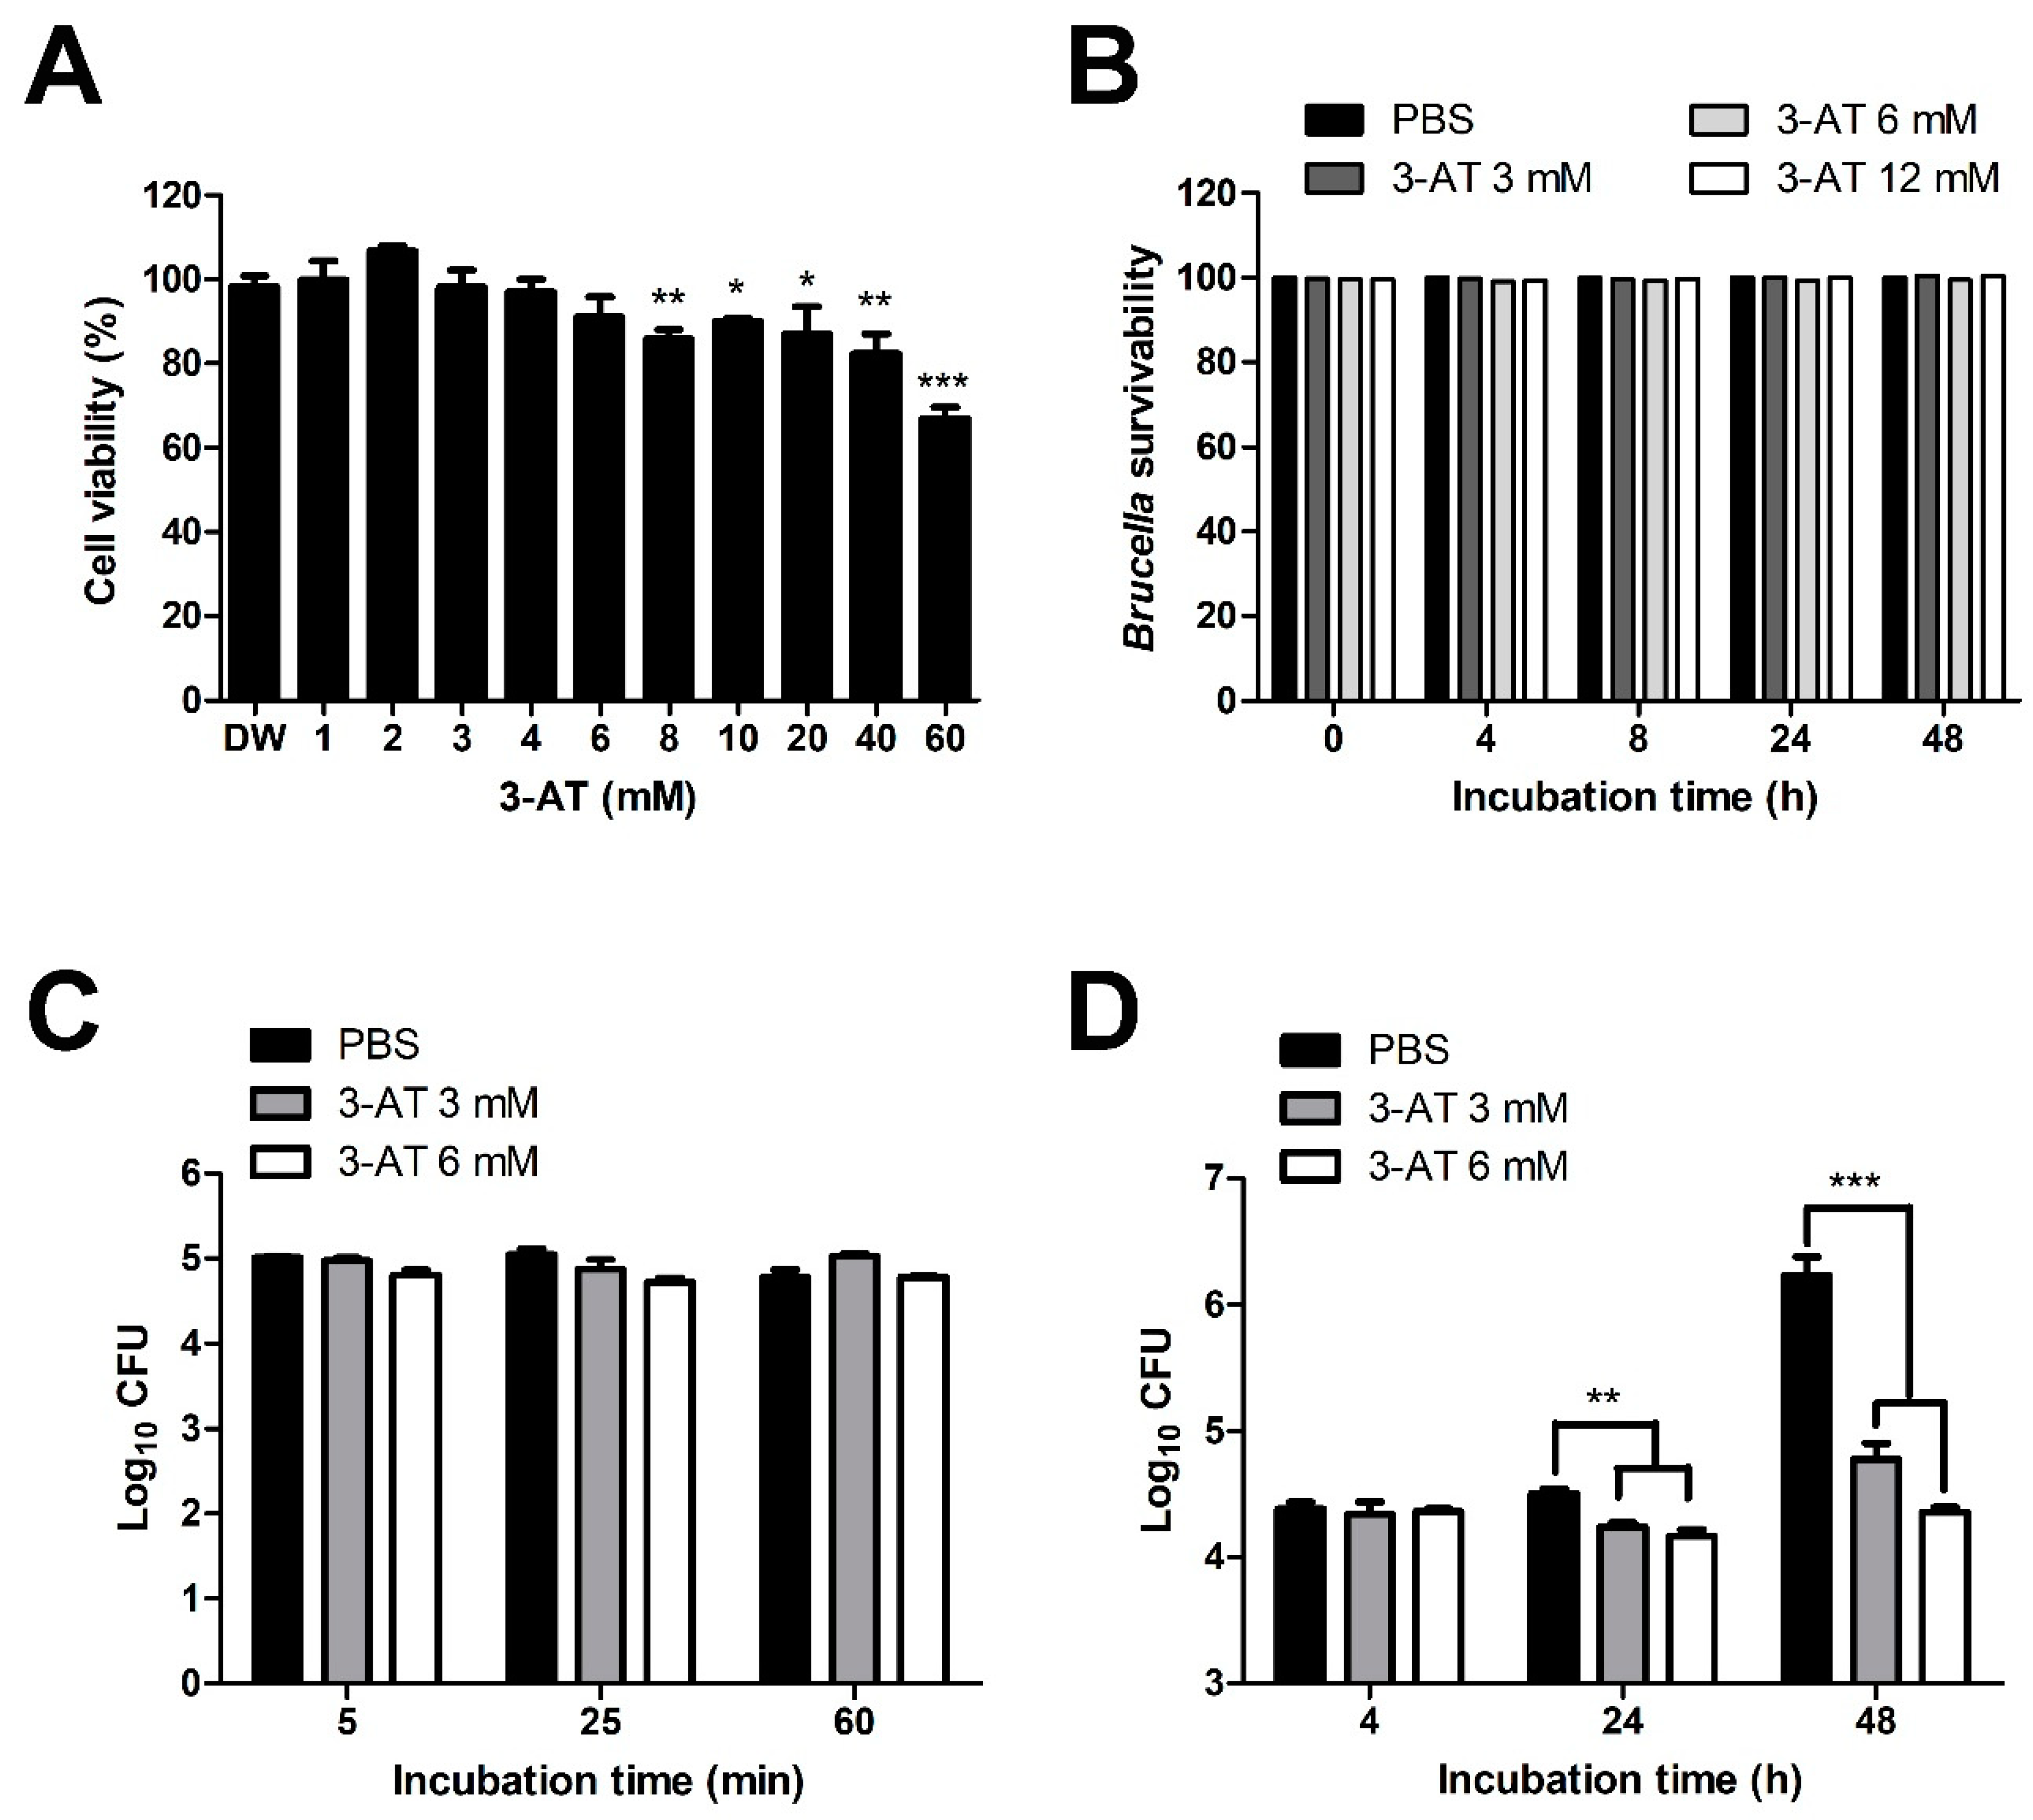
Brucella. Our research findings initially suggest that the inhibition of catalase by 3-AT enhances host defense in murine brucellosis. We found that 3-AT treatment can inhibit the intracellular growth of
B. abortus within macrophages. This may be attributed to the catalase inhibitory action of 3-AT, resulting in increased accumulation of cellular ROS and heightened H
2O
2 sensitivity of
B. abortus. Notably, 3-AT administration reduced the number of
B. abortus in the spleen and liver, the most visibly infected organs in mice. The reduction in the levels of some inflammation cytokines, such as TNF-α, IFN-γ, and IL-6, as well as the increase in the CD4
+/CD8
+ ratio in peripheral blood of 3-AT-treated mice during
Brucella infection, illustrates the immunomodulatory effect of 3-AT.
It has been reported that 3-AT treatment, in the presence of TLR-2 antibody, inhibits the intracellular growth of
Staphylococcus aureus within murine peritoneal macrophages [
16]. Interestingly, we observed that only 3-AT treatment significantly reduced intracellular
B. abortus survival by up to 98% within macrophage RAW 264.7 cells. However, it did not exhibit a bactericidal effect on this pathogen, suggesting that 3-AT treatment enhances macrophage defense mechanisms against
Brucella or reduces the pathogen’s adaptive capabilities within host cells. Furthermore, the inhibition of catalase possibly increases the external H
2O
2 sensitivity of
B. abortus as reported by a study done by Kim et al. [
7].
Previous reports have indicated that 3-AT augments the intracellular ROS or hydroperoxide of various cell types, such as human differentiated adipocytes, macrophage polarization in adipose tissue, lung cancer Calu-6 cells, and fibroblast cells [
10,
17,
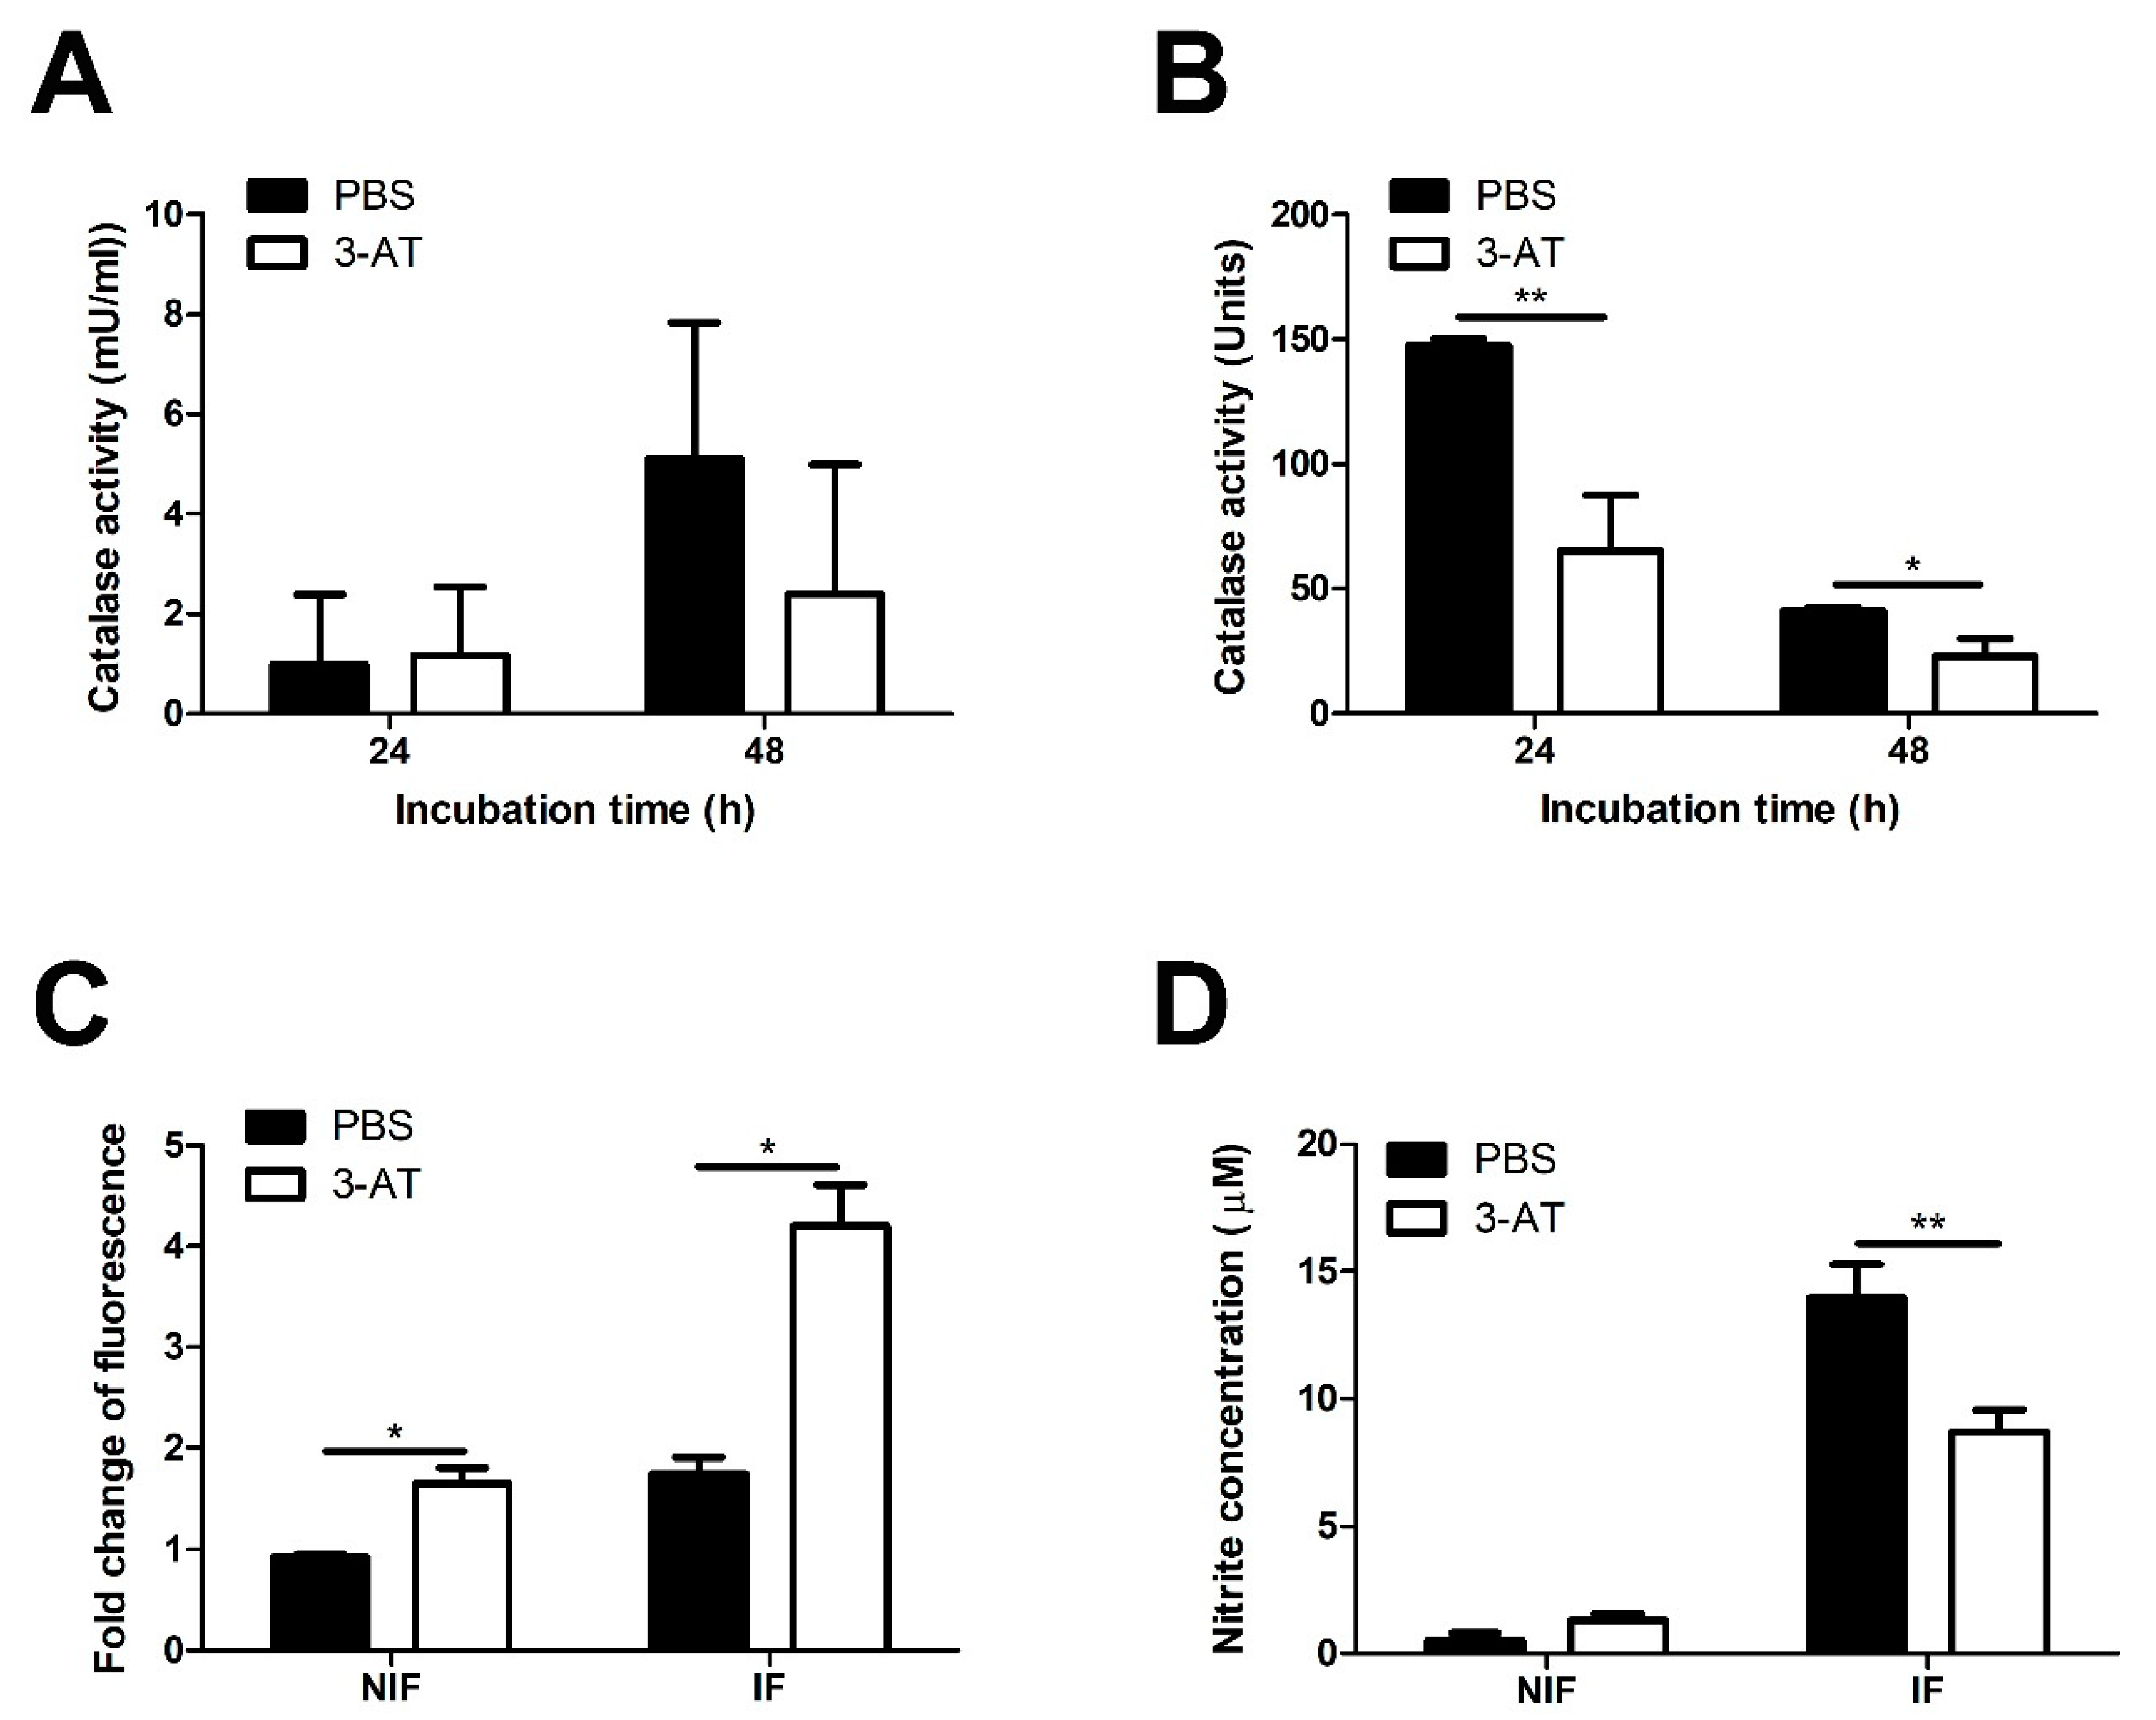
18,
19]. These reports are consistent with our findings. Treatment of 3-AT on RAW 264.7 cells leads to intracellular ROS accumulation, although the catalase activity of RAW 264.7 cells did not significantly decrease under 3-AT treatment. In contrast, 3-AT treatment significantly decreased
Brucella catalase activity, suggesting that the catalase inhibitory effect of 3-AT is more effective against
Brucella.
ROS is recognized as a vital killing factor in the innate immune response against
Brucella infection in immune cells [
4]. Additionally, the reduction of catalase activity in
Brucella can contribute to inhibiting its replication within the intracellular environment, as described in
Helicobacter pylori in macrophages [
20]. The dual impact of high intracellular ROS in RAW 264.7 cells and the reduction of catalase inside the bacteria, leads to increased oxidative sensitivity and significantly diminishes
Brucella replication within macrophages.
Apart from ROS, NO also plays an essential role in the clearance of intracellular
Brucella [
21]. However, unlike ROS, the level of NO released into the culture supernatant of
B. abortus-infected cells was reduced in the presence of 3-AT, indicating that 3-AT inhibits NO production. This result is in line with the results described by Buchmuller and colleagues [
22], who demonstrated that 3-AT inhibited NO synthesis. Although 3-AT reduced NO production, intracellular
B. abortus significantly decreased. This may be because NO’s lethal effect is not all-encompassing [
23], and the elimination of NO by
Brucella is most effective during the initial 24 h of infection. Subsequently, surviving bacteria may employ genetic mechanisms to deal with the enriched NO environment or utilize NO as a nitrogen source [
24]. In addition, NO reduction in infected RAW 264.7 cells may contribute to protecting cells from damage caused by the increasing intracellular ROS [
25].
NF-κB, a family of transcription factors comprising RelA (p65), NF-κB1 (p50 and p105), NF-κB2 (p52 and p100), c-Rel, and RelB, plays a central role in a variety of cellular regulatory processes. The activation status of NF-κB depends on its interaction with its inhibitor, IκB. In normal conditions, NF-κB remains inactive. However, when stimulated, NF-κB is liberated from its inhibitor and migrates into the nucleus to initiate various functions, including regulation of cytokines such as IL-6, IL-10, and TNF-α [
26]. Activation of NF-κB is crucial for mounting an effective immune response against
Brucella invasion [
27,
28].
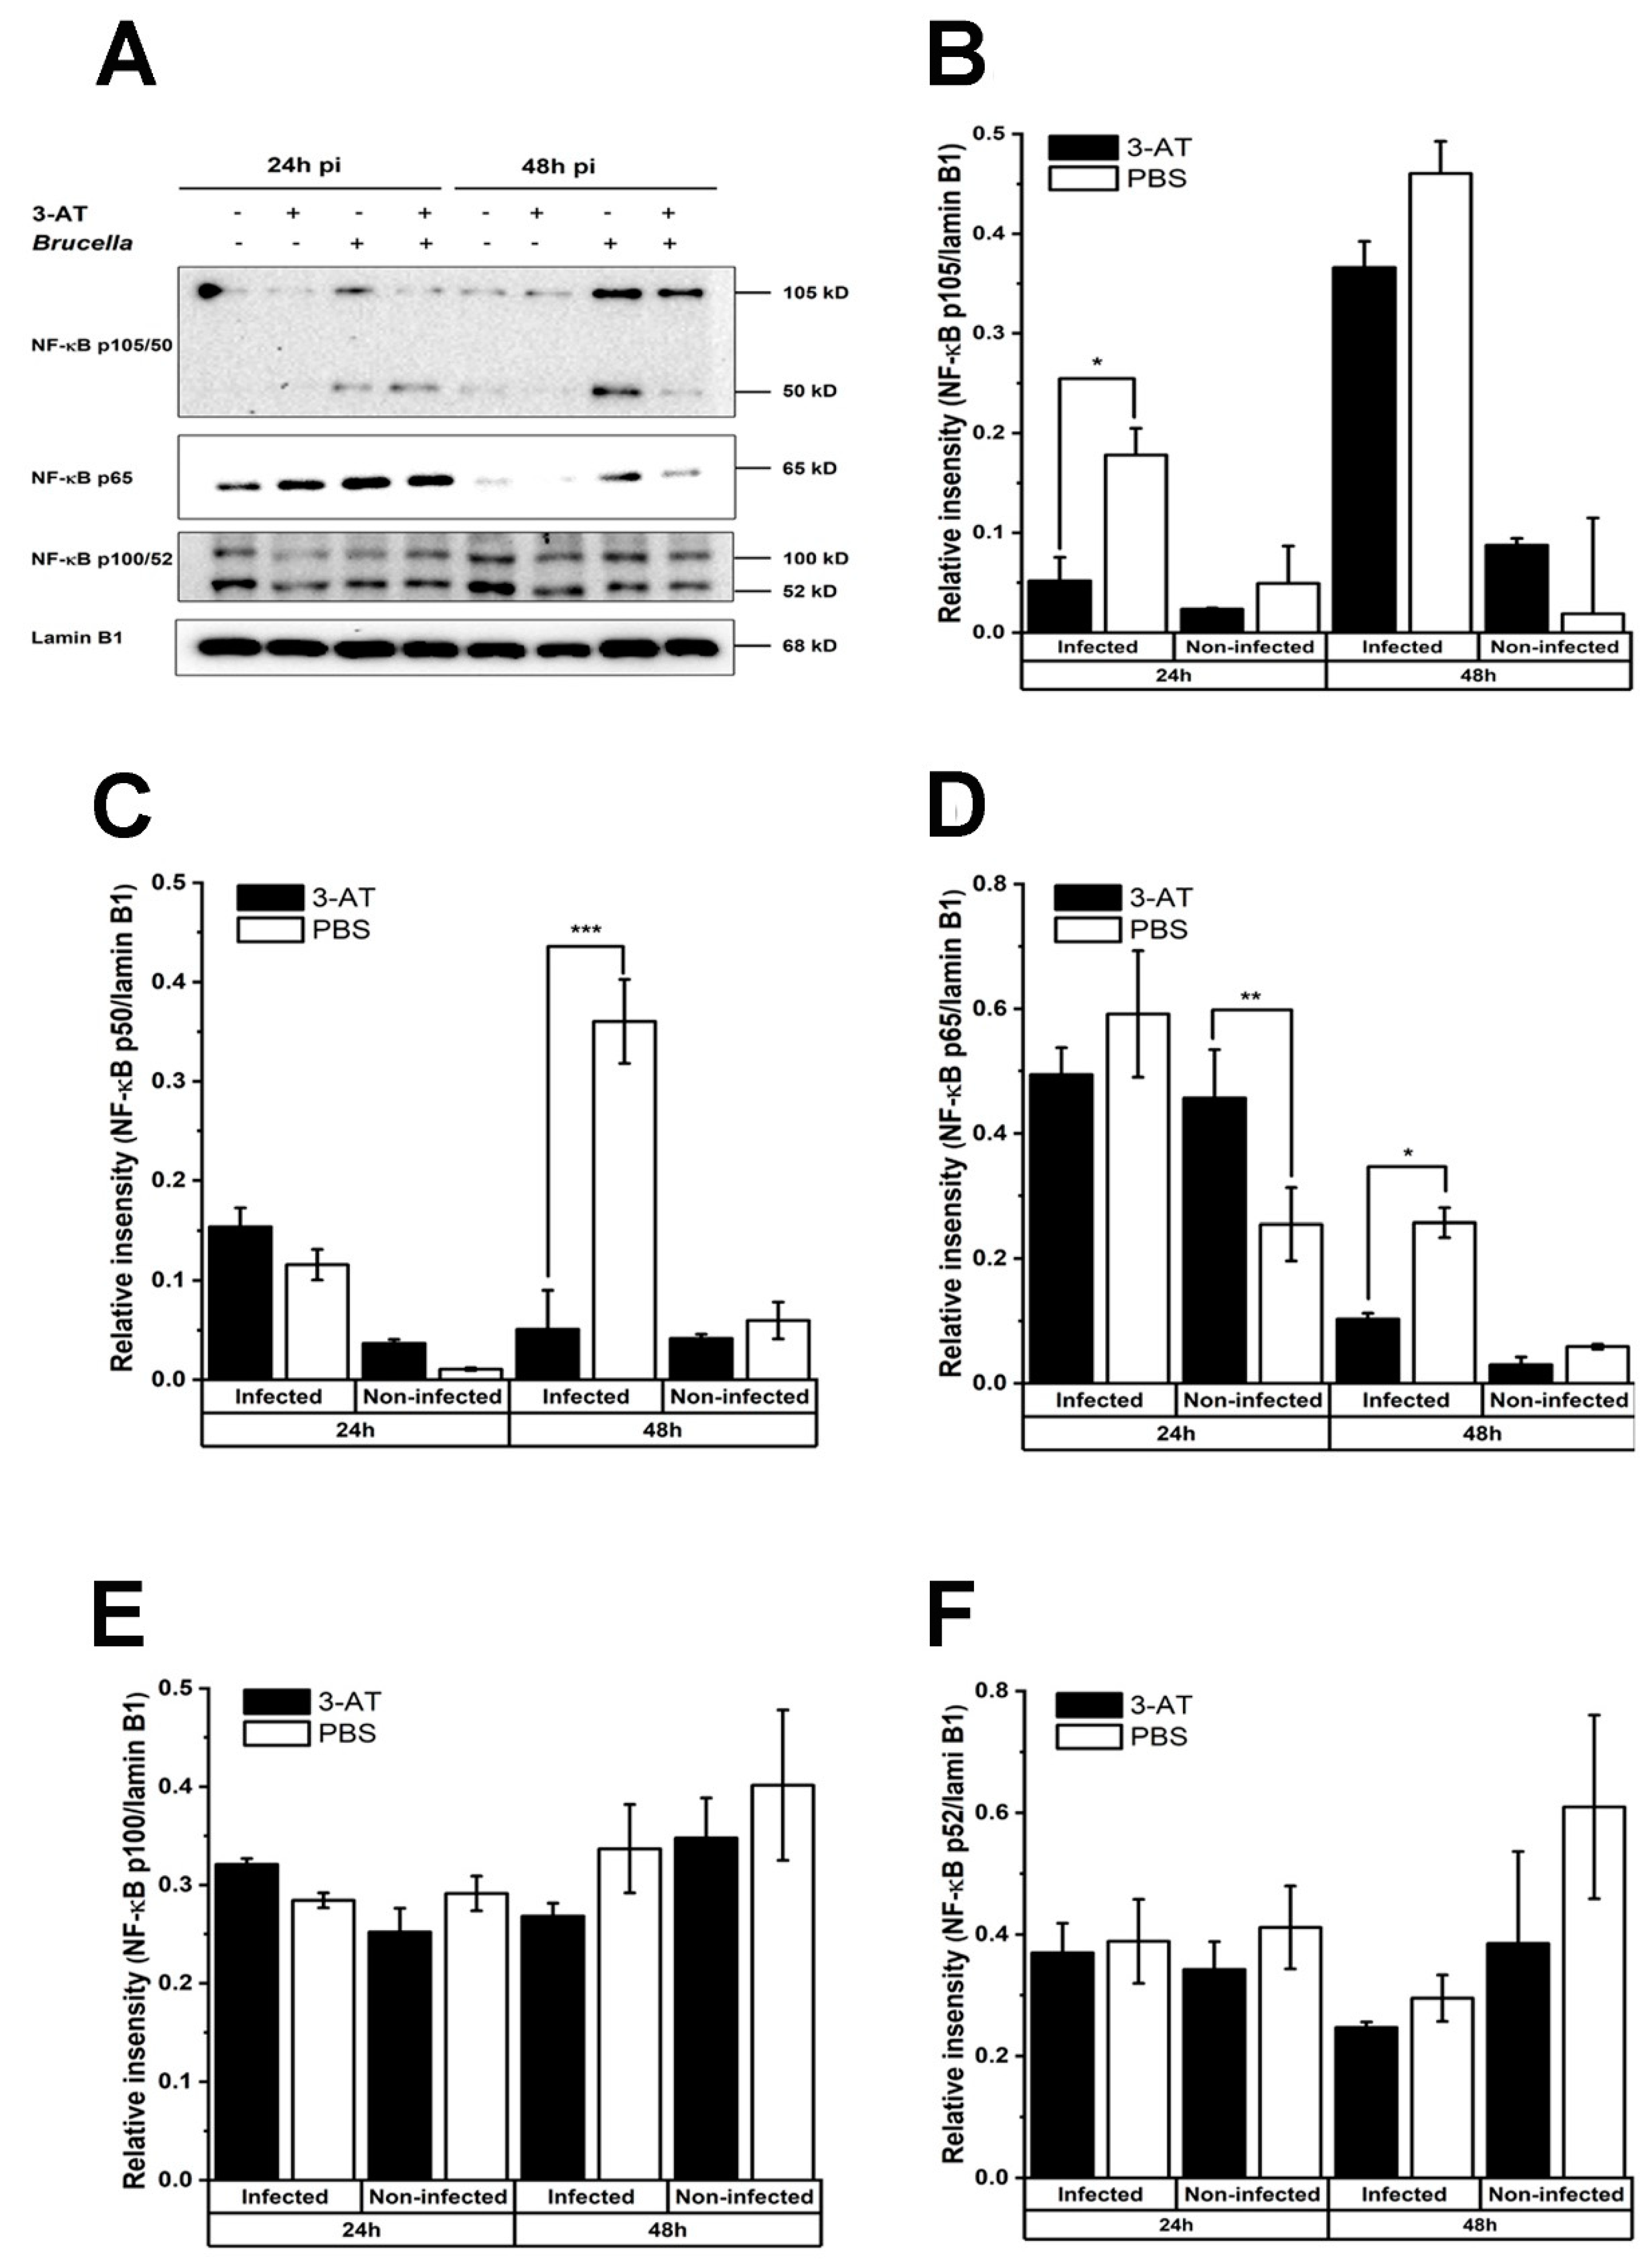
We found that 3-AT treatment suppresses the translocation of NF-κB p65 and p50 into the nucleus of
B. abortus-infected cells at 48 h pi. Similarly, a study done by Mu and associates [
29] indicated that the suppression of NF-κB activation by 3-AT leads to the impediment of mRNA expression of pro-inflammatory cytokines, possibly due to ROS accumulation. Note that the accumulation of ROS can activate or repress NF-κB through different pathways [
30]. ROS can directly regulate the NF-κB heterodimer, oxidize NF-κB, and subsequently diminish its DNA binding ability. The cysteine residue (Cys-62) in the domain of NF-κB p50 is sensitive to oxidation, leading to a reduction in the binding DNA-binding ability of p50 and its activation under conditions of increased intracellular ROS [
31,
32,
33]. In the case of p65, the phosphorylation of Ser-276 of this subunit is easily affected by ROS. Furthermore, ROS obstructs the phosphorylation of IκBα, preventing its degradation and the subsequent translocation of NF-κB into the nucleus [
30].
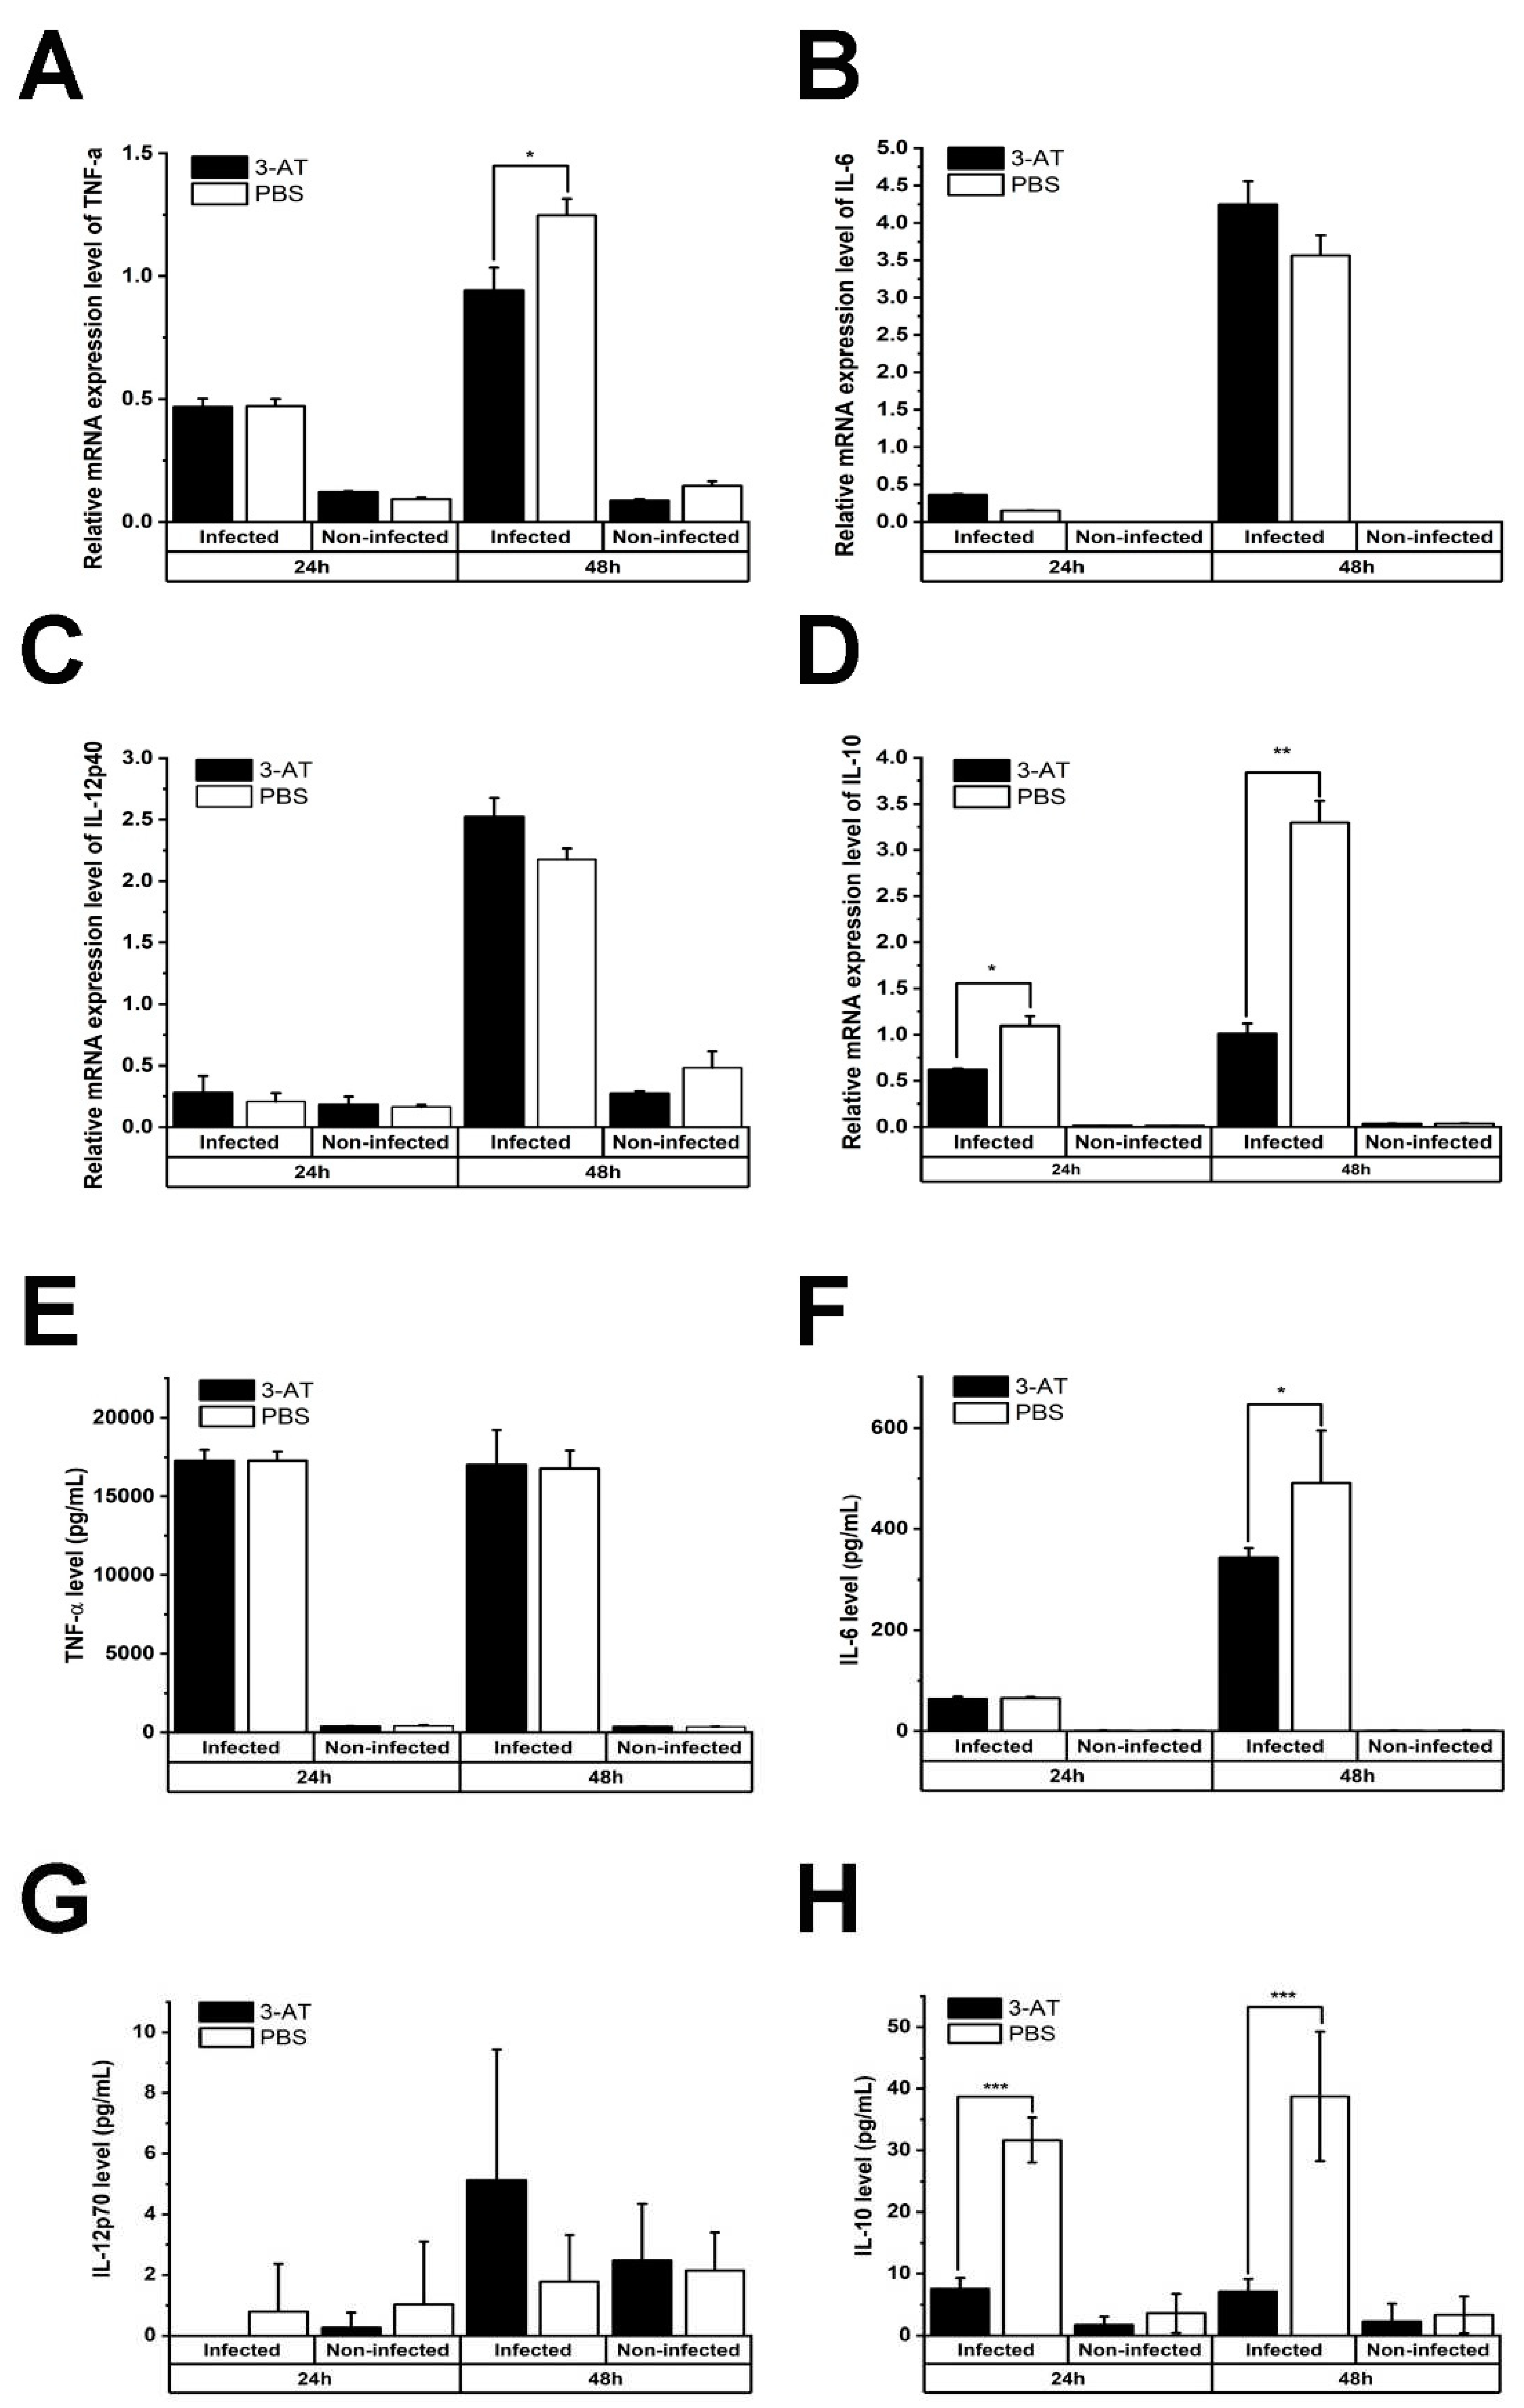
The exposure to 3-AT results in an elevation of intracellular ROS levels and hinders the nucleus translocation of NF-κB p50 and p65. Consequently, this alteration affects the mRNA expression of genes regulated by these NF-κB subunits. As an example, IL-10, an anti-inflammatory cytokine regulated by NF-κB p50 [
34], showed a significant reduction in both mRNA level and protein expression in the
B. abortus-infected macrophage following 3-AT treatment in the present study. This reduction is associated with the decrease in the presence of NF- κB p50 protein within the nucleus. In
B. abortus infection, IL-10 suppresses lysosome-mediated bacterial clearance, thereby enhancing the survivability of the pathogen within macrophages [
35]. The reduction of IL-10 levels in RAW 264.7 cells under 3-AT treatment may inhibit
B. abortus replication within host cells. On the other hand, the inhibition of NF-κB p65 activation has varying effects on the expression of other key cytokines involved in controlling
Brucella infection, such as TNF-α, IL-6, and IL-12 [
36,
37,
38].
The mRNA level of TNF-α was decreased, consistent with previous studies [
29], while the cytokine level remained relatively unchanged in the presence of 3-AT. In contrast, the gene expression of IL-6 did not significantly change, but its protein expression was decreased. 3-AT treatment did not affect IL12-p70 in both mRNA and protein levels. The inverse correlation between mRNA and protein levels of TNF-α and IL-6 had been reported in ovarian cancer cells by Israelsson and colleagues [
39], possibly due to the complex regulatory mechanisms governing gene transcription, protein translation, and the stability of these cytokines. Additionally, unknown negative feedback mechanisms may be in place to regulate mRNA and protein expression [
39]. Pro-inflammatory cytokines are known to contribute to the clearance of
Brucella in macrophages. However, based on our results, IL-6 levels do not coincide with a decrease in the intracellular growth of
B. abortus in the context of 3-AT treatment, suggesting that IL-10 reduction may have a more significant impact on intracellular
B. abortus growth compared to IL-6 levels.
The pleiotropic effects of 3-AT in the context of
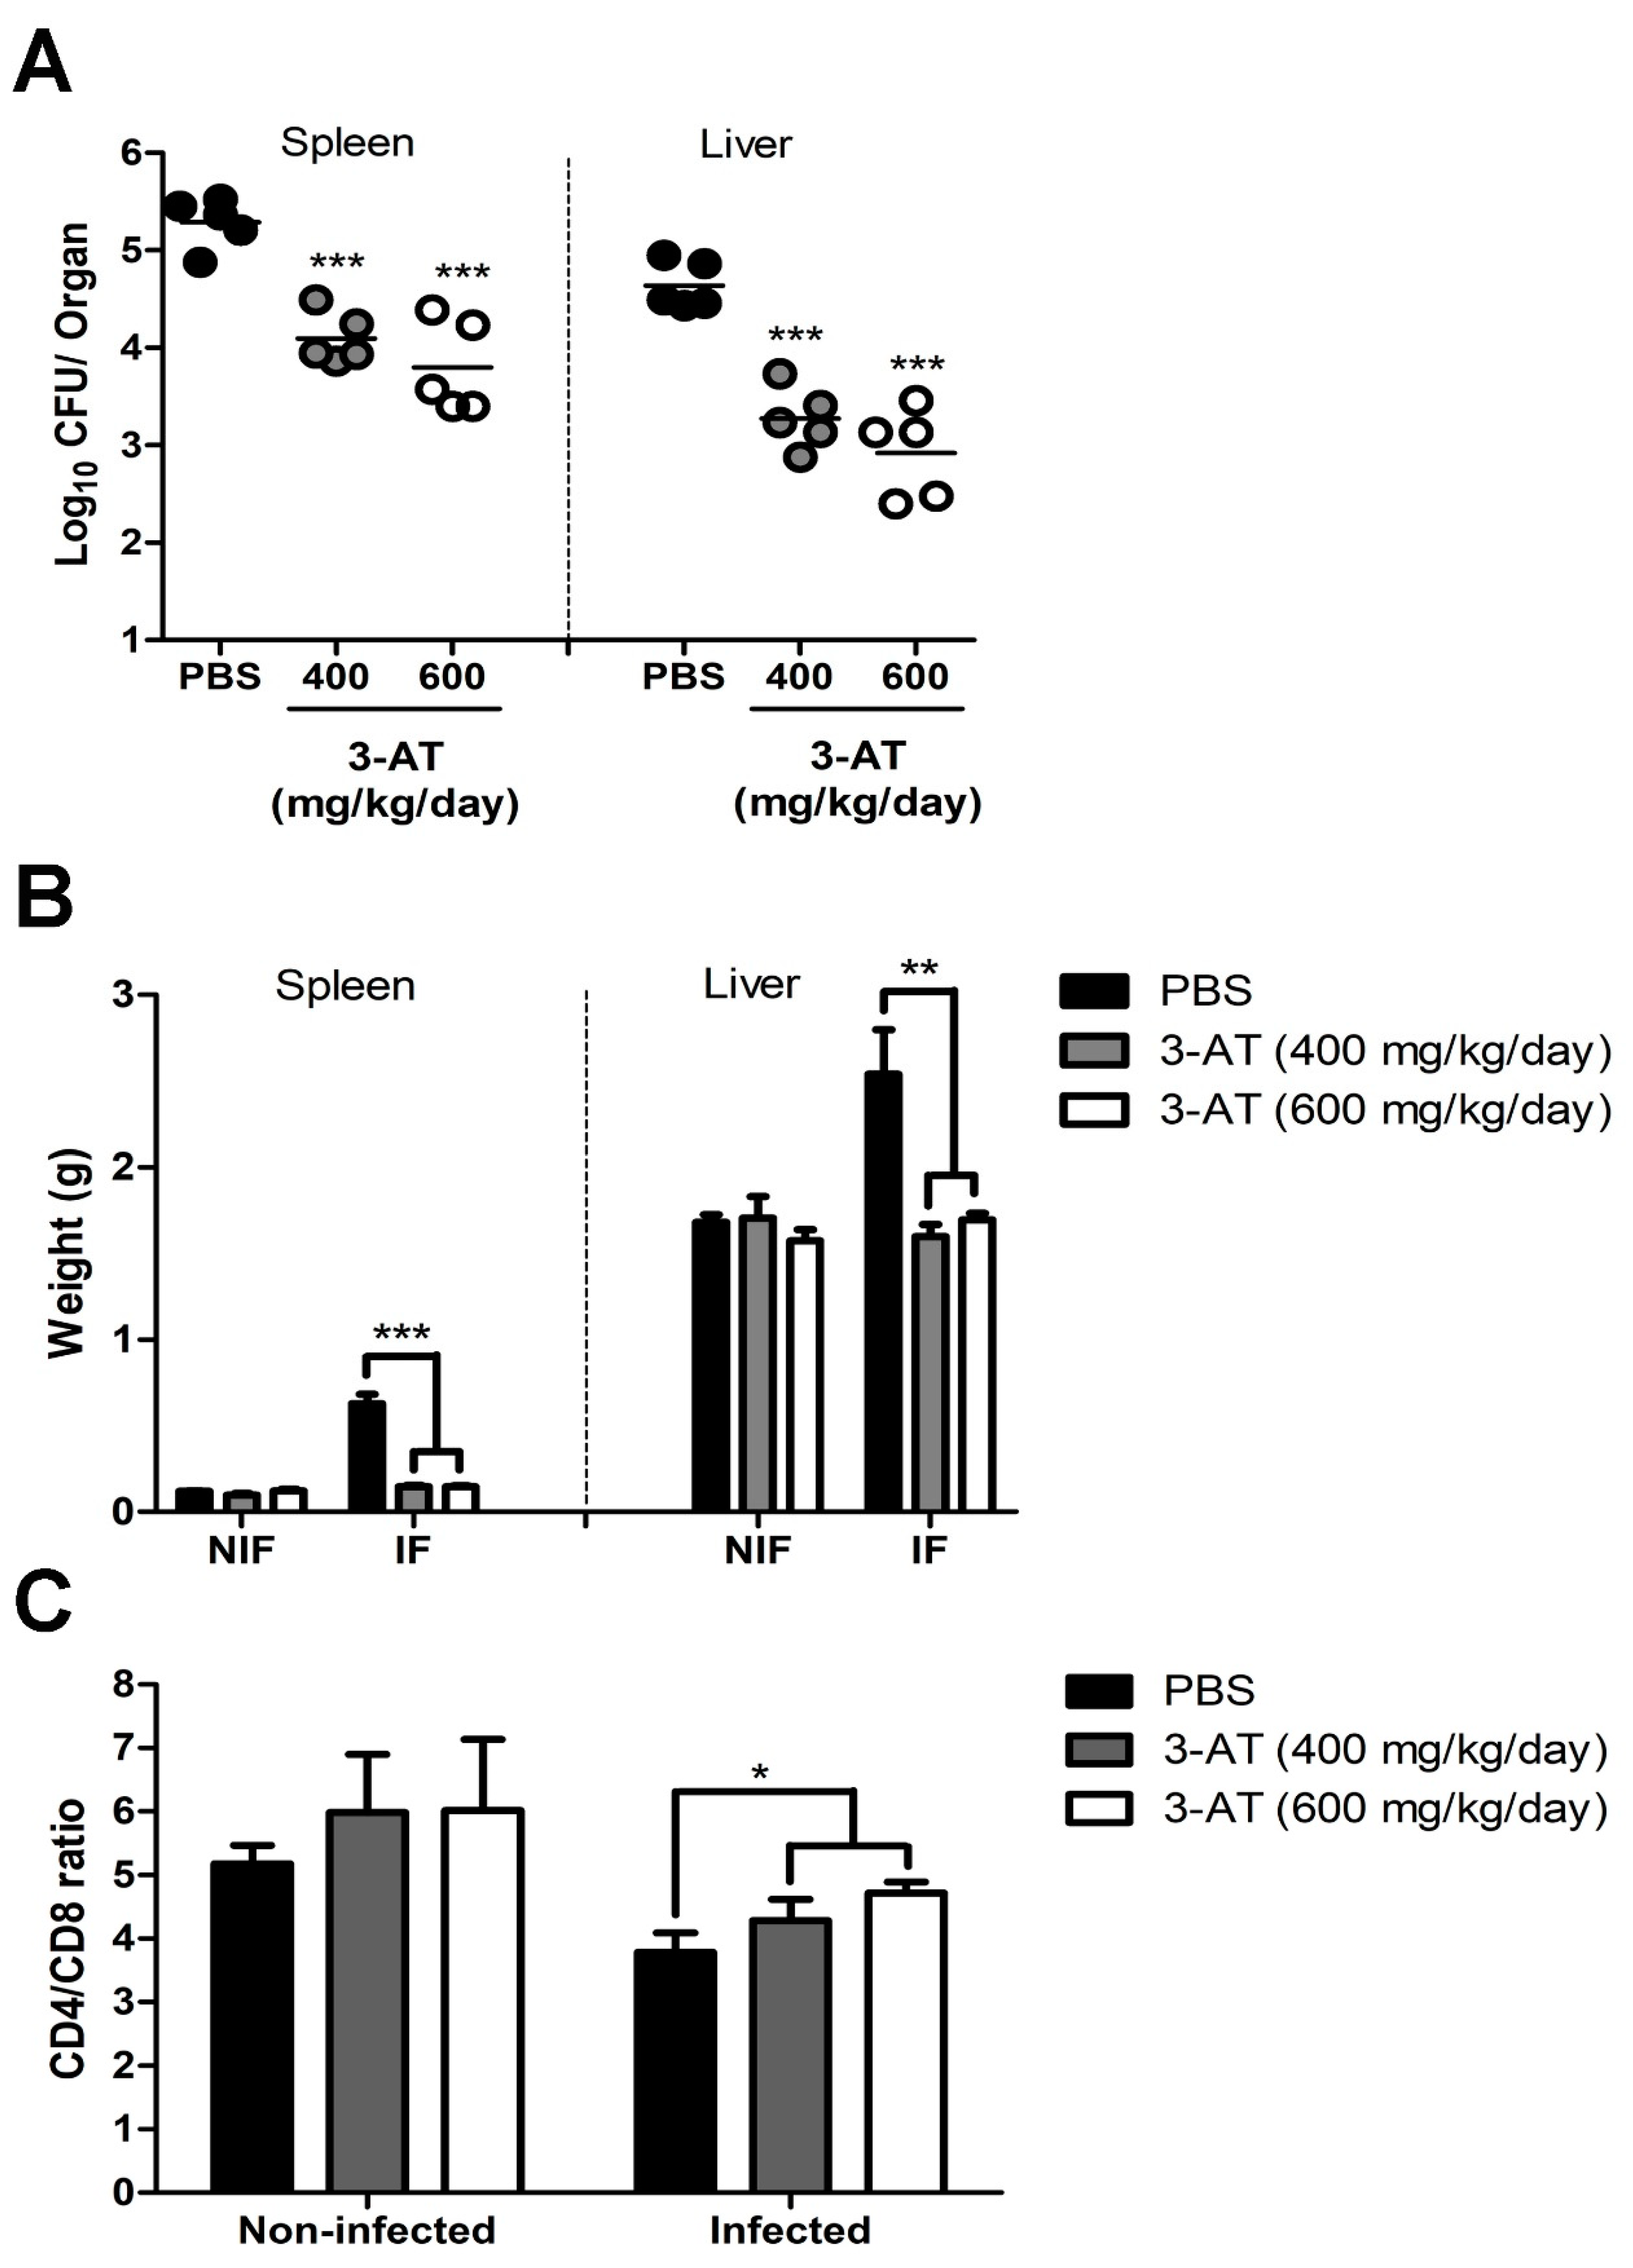
Brucella infection on RAW 264.7 cells, which include the inhibition of intracellular growth bacteria, increased ROS accumulation, and modulation of cell’s immune response, suggest 3-AT as a potential treatment to control brucellosis. Consequently, 3-AT was administered to ICR mice to investigate its protective effects against murine brucellosis. Intermittent treatment with 3-AT led to a reduction in the bacterial load in the spleen and liver of mice challenged with
B. abortus. This study first describes the effectiveness of 3-AT in reducing pathogen proliferation within host organs. Cytokines level and the CD4
+/CD8
+ ratio pattern can serve as indicators of the immune status in brucellosis. In the acute phase of brucellosis, infected patients exhibit higher levels of cytokines such as TNF-α, IL-6 or IFN-γ, and IL-10 compared to
Brucella-negative individuals [
40,
41,
42,
43]. In the convalescent stage, these cytokines are reduced compared to pre-treated patients but remain elevated compared to healthy cases [
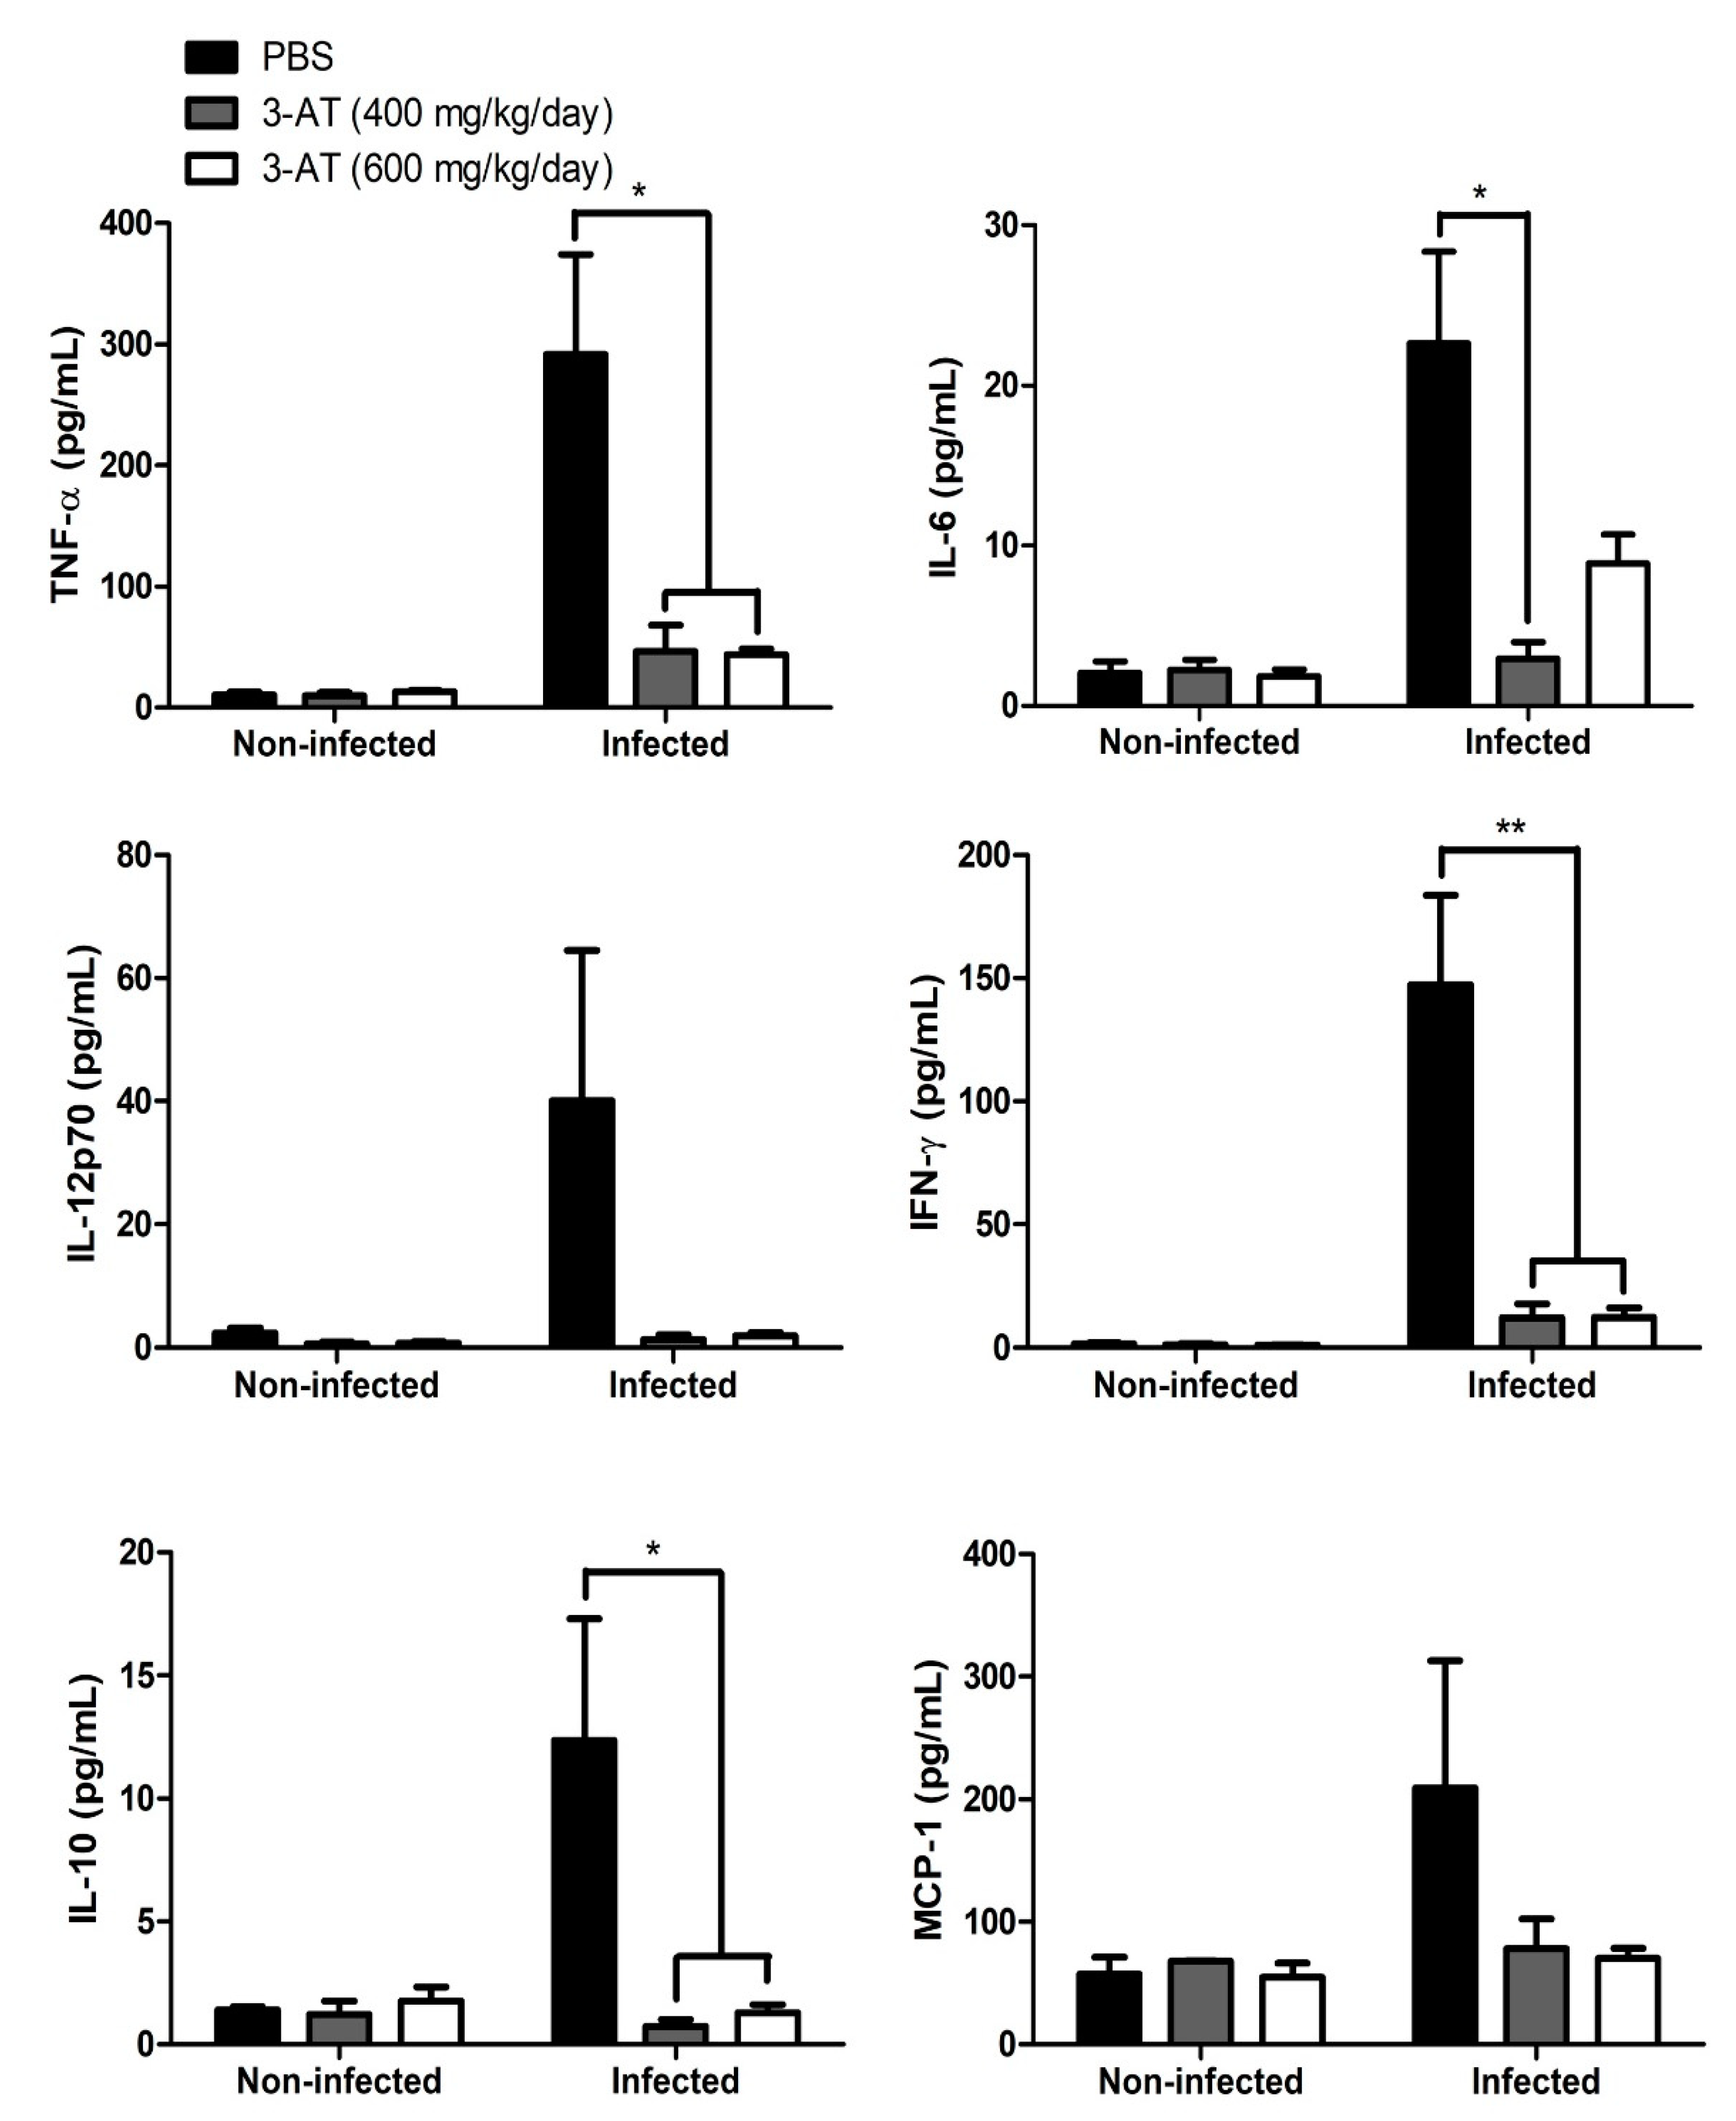
42]. Our study revealed that serum concentrations of TNF-α, IL-6 or IFN-γ, and IL-10 in
B. abortus-infected mice receiving 3-AT were notably reduced compared to the infected group without 3-AT treatment, yet still higher than the levels observed in the non-infected group. These results are consistent with the cytokine profiles observed in human brucellosis [
40,
41,
42].
We also observed a similar CD4
+/C8
+ ratio pattern in the 3-AT-treated group in both
Brucella-infected and non-infected mice, mirroring the patterns seen in patients receiving pre- and post-antibiotic treatment during acute brucellosis and in healthy individuals. This correlation reflects the recuperation of T-cell function following the dysfunction caused by
Brucella infection [
44,
45,
46]. Although in vivo results show the protective effects of 3-AT against
B. abortus infection, the precise mechanism underlying this protective ability and how it modulates the immune response in infected mice remain unclear. Hence, further experiments should be conducted to address these unanswered questions.
4. Materials and methods
4.1. Reagents
3-AT (A8056), MTT (M5655), triton x100 (9002-93-1), 30% hydrogen peroxide (H1009), and catalase assay kit (MAK-381-1KT) were purchased from Sigma-Aldrich (Seoul, Korea). DCFA/H2DCFDA-cellular ROS assay kit (ab113581-Abcam, Cambridge, UK), Griess reagent system (G2930), and GoTaq®qPCR master mix (A6002) were purchased from Promega (Fitchburg, WI, USA). NP-40 (85124) and cell extraction buffer (FNN0011) were acquired from ThermoFisher Scientific (NJ, USA). Cocktail (P3200-005) and bovine serum albumin (A0100-010) were purchased from GenDEPOT (Barker, TX, USA). EzWestLumi plus (WSE-7120L, Atto, Tokyo, Japan). RiboEx (301-001) was purchased from Geneall (Gyeonggi, Korea). QuantiTect® Reverse transcription kit (205311) was purchased from (Qiagen, Hilden, Germany). CBA mouse inflammation kit (552364), CD8a monoclonal antibody (553032), and CD4 monoclonal antibody (17504042) were purchased from Biosciences (San Diego, CA, USA). Red blood cell lysis buffer (11814389001) was purchased from Roche (Basel, Switzerland). All primary antibodies, including NF-κB p65 (8242T), lamin B1 (13435S), NF-κB p105/p50 (12540S), NF- κB p100/52 (37359S) are rabbit antibodies, were purchased from Cell Signaling (Danvers, MA, USA). Anti-rabbit IgG HRP-conjugated secondary antibody (7074S) was purchased from Cell Signaling.
4.2. Cell culture and bacteria growth conditions
RAW 264.7 cells (ATCC, TIB-71) were grown at 37oC in a 5% CO2 atmosphere in RPMI 1640 medium (1600-044, Gibco, CA, USA) in the presence of 10% (vol/vol) fetal bovine serum (FBS) (1600-044, Gibco). The smooth, virulent, wild type of B. abortus was inoculated in Brucella broth (BBL BD, San Jose, CA, USA) at 37oC in a shaking incubator until it reached the stationary phase before proceeding to the cell infection or mouse infection.
4.3. Cell viability assessment assay
MTT assay was performed to determine the non-cytotoxic concentration of 3-AT. RAW 264.7 cells were seeded at a density of 3 x 10⁴ cells per well in 96 wells plate for 24 h. After that, different concentrations of 3-AT (1, 2, 3, 4, 6, 8, 10, 20, 40, and 60 mM) were added to the cell culture medium for 48 h. After 48 h, the medium was replaced with a new medium containing 5 mg/mL of MTT solution. Following a 4 h incubation, the medium was removed and replaced with 150 µl of DMSO, which was incubated for 15 min. The plate reader (Thermo Labsystems Multiskan) was used to measure the absorbance at a wavelength of 540 nm.
4.4. Bactericidal assay
A 1 x 10⁴ colony forming units (CFU)/mL of B. abortus contained in a 96-well plate were treated using different concentrations of 3-AT (3, 6, and 12 mM) at 37oC for 0, 4, 8, 24, and 48 h. PBS was used as the vehicle control. At indicated time points, B. abortus was diluted 100 times and plated on an agar plate. The number of B. abortus colonies was counted after 72 h incubation. The bactericidal effect of 3-AT on Brucella was expressed as the percentage of surviving bacteria in the 3-AT treatment compared to the vehicle control.
4.5. Internalization and intracellular growth assay
RAW 264.7 cells were cultured at a density of 3 x 10⁴ cells per well for 24 h. 3-AT or PBS was administered to the cells 2 h prior to infection by B. abortus with the multiplicity of infection (MOI) of 50 for the internalization assay. Cells were then washed twice with PBS at 5, 25, and 60 min pi and incubated in a new medium containing 50 μg/mL of gentamicin for 30 min to eliminate extracellular bacteria. The cells were then washed twice using PBS and lysed in DW to release phagocytosed bacteria. The lysates were spread on the Brucella agar plate to check bacterial CFU. Bacterial CFU was then converted to log10.
The intracellular assay was performed the same as the invasion assay with some modifications. Briefly, RAW 264.7 cells were cultured in the fresh media containing 50 μg/mL of gentamicin in the presence of 3-AT only at 1 h pi. The number of intracellular B. abortus was determined at 4, 24, and 48 h pi.
4.6. Catalase activity assay
The catalase activity measurement in
B. abortus was performed as previously described [
47]. Briefly, the
B. abortus was shaken inoculated in 5 mL of
Brucella broth supplemented with 3 mM of 3-AT for 24 and 48 h at 37
oC. At the indicated time, 1 mL of
B. abortus was collected, washed twice, and suspended in 100 μL PBS. A mixture including 100 μL of triton x100 and 100 μL of 30% hydrogen peroxide was mixed thoroughly with
B. abortus suspension in a Pyrex tube (13 mm diameter, 100 mm height, borosilicate glass; Corning, USA) and then incubated at room temperature. The height of the O
2-forming foam after remaining steady for 10 min was measured using a ruler. The catalase activity was qualified based on the standard curve with the defined activity unit.
Catalase activity in RAW 264.7 cells was determined using the catalase assay kit, according to the manufacturer’s instructions. Briefly, 106 cells were cultured for 24 h, then were infected with B. abortus for 1 h, followed by 3-AT (3 mM) treatment. After 24 and 48 h treatment, cells were washed twice using PBS before being lysed in Assay buffer. The lysate was centrifuged at 10,000 x g for 15 min at 4oC to collect supernatant. The collected supernatant was acquired for catalase activity measurement.
4.7. ROS and NO detection assay
In ROS assay, cells were subcultured at a density of 2.5 x 10⁴ cells per well in a 96-well optical-bottom plate for 24 h before infection and followed by 3-AT (3 mM) treatment for 48 h. Following the guidance of the company, the cellular ROS assay was determined using the DCFA/H2DCFDA-cellular ROS assay kit. The fluorescent signal was detected using an F-4500 Fluorescence Spectrophotometer. NO detection assay was performed to assess the NO concentration produced by RAW 264.7 cells in cell culture media. The assay was conducted using the Griess reagent system following the manufacturer’s instructions.
4.8. Extraction of nucleus protein
RAW 264.7 cells were washed twice using PBS following 24 and 48 h infection and treatment with 3-AT. Cells were then collected in 500 μL of 1x hypotonic buffer (20 mM tris-HCl, 10 mM NaCl, 3 mM MgCl2) and placed on ice for 15 min prior to adding 25 μL of 10% NP-40 and homogenized by vortex, at maximum speed. The homogenate was centrifuged at 3,000 rpm for 10 min at 4oC to obtain the pellet. A complete cell extraction buffer supplemented with protease inhibitor cocktail and PMFS was added to the pellet and incubated on ice with interval vortex every 10 min, repeated three times. Finally, nucleus protein was obtained after centrifuge for 30 min at 14,000 x g at 4oC. Protein was qualified using the BCA protein quantification method and stored at -70oC for the subsequent experiments.
4.9. Immunoblotting assay
Nucleus protein was subjected to the SDS page and transferred onto an immobilon-P membrane (Millipore, Burlington, MA, USA). The membrane was blocked for 30 min, using a blocking buffer containing 5% bovine serum albumin (BSA) suspended in Tris-buffer saline containing 1% of Tween-20 (TBS-T buffer). After that, we incubated the membrane in diluted primary antibodies with a ratio of 1:1000 overnight at 4oC. All primary antibodies are rabbit anti-mouse antibodies. Following incubation with the primary antibody and third-time washing, the membrane was incubated with a goat anti-rabbit IgG HRP-conjugated secondary antibody with a 1:2,000 ratio for 1 h at room temperature. EzWestLumi plus was used to detect the signal, and a Molecular Imager® ChemiDocTMXRS+ system machine (Bio-Rad Laboratories, Carlsbad, CA, USA) was used to visualize protein expression.
4.10. RNA extraction and quantitative real-time PCR
RAW 264.7 cells were collected in 1 mL of cold RiboEx and homogenized by vigorous vortexing after adding 400 μL of chloroform. The homogenate was centrifuged at 12,000 rpm at 4
oC for 15 min. After centrifugation, the transparent top layer containing RNA was collected to mix with 400 μL isopropanol for 10 min at room temperature. The mixture was transferred into a binding column and centrifuged at 12,000 rpm at 4
oC for 30 min. The RNA bound to the column was washed twice with an RPE buffer and eluted with nuclease-free water. cDNA synthesis was performed using QuantiTect® Reverse transcription kit and following the guidance instructions. The real-time PCR was performed using the GoTaq®qPCR master mix on a CFX Opus 96 real-time PCR system. The total 20 μL reaction consists of 2 μL of cDNA, 2 μL of forward and reverse primers each, qPCR master 10 μL, and DW 4 μL. The primer sequences are listed in
Table 1, and the relative levels of mRNAs were analyzed using Bio-Rad CFX Maestro software.
4.11. Infection of mice with B. abortus and mice treatment with 3-AT
Seven-week-old female ICR mice were purchased from Samtako (Gyeonggi-do, Korea). The animal experiment protocol in this study was approved by the Animal Ethical Committee of Chonbuk National University (Authorization Number CBNU-2021-037). After one week of acclimation, mice were administered by oral gavage at a dose of 400 mg/kg/day or 600 mg/kg/day of 3-AT three days before infection. PBS was used as a control. For infection, mice were intraperitoneally injected with 2 x 10⁵ CFU of B. abortus or PBS. Mice were treated with 3-AT or PBS according to a schedule of two consecutive days of treatment, followed by a one-day rest during 12 days pi. Mice were sacrificed on the 12th day pi for heart blood, spleen, and liver collection. Collected organs were homogenized in 1 mL of PBS to examine B. abortus growth in mouse tissue within these organs. Serial dilution of homogenates was prepared in PBS and plated on the Brucella agar plate. Colonies were enumerated after 72 h incubation at 37oC. The number of CFU was subjected to log10 base. The collected blood was subjected to serum cytokine measurement and CD4+ /CD8+ T cell population differentiation experiment.
4.12. Serum cytokine measurement
The serum was obtained by centrifuging blood at 2,000 rpm at 4oC for 10 min. The concentrations of cytokines, including TNF-α, INF-γ, IL-6, IL-12p70, IL-10, and MCP-1, were measured using a CBA mouse inflammation kit, following the manual instruction. Data were acquired and analyzed using BD FACVerse flow cytometer and FCAP array software (BD Biosciences).
4.13. CD4+/CD8+ T cells ratio in peripheral blood
The ratio of differential CD4+/CD8+ T cells was defined in 100 μl blood. Blood was incubated with a 75 μl mixture of PE-conjugated rat-anti mouse CD8a monoclonal antibody and CD4 monoclonal antibody in 1% BSA for 30 min in the dark at RT. The red blood in the mixture was lysed by adding 2 mL of red blood cell lysis buffer and incubated for 10 min. Three milliliters of PBS was added to terminate the lysis reaction. White blood cells were then collected by centrifuging at 380 x g for 5 min, washed twice with 3 mL of PBS, and suspended in 0.5 mL PBS. White blood cells were analyzed using BD FACVerse flow cytometer to determine the population of CD4+ and CD8+ T cells, and the CD4+/CD8+ T ratio was analyzed using BD FACSuite software (BD Biosciences)
4.14. Statistical analysis
The data were presented as the mean ± the standard deviation. Statistical analysis was conducted using an unpaired Student’s t-test through GraphPad Instat. Significance levels were denoted as follows: * P < 0.05, ** P < 0.01, and *** P < 0.001, indicating the statistically significant differences between the groups.
Figure 1.
Effect of 3-AT on the internalization and intracellular growth of B. abortus within RAW 264.7 cells. Cytotoxic effects of 3-AT on RAW 264.7 cells at 48 h after treatment were assessed by MTT assay (A). The bactericidal effect of 3-AT on B. abortus was evaluated at different concentrations and incubation time points (0, 4, 8, 24, and 48 h) (B). The internalization (C) and intracellular growth (D) of B. abortus within macrophages were evaluated at various time points after pre-treatment with 3 mM and 6 mM of 3-AT. The data are represented as the mean ± SD of replicated samples obtained from at least two independent experiments. Significant deviations from the control group are denoted by an asterisk (*P < 0.05, **P < 0.01, ***P < 0.001).
Figure 2.
Catalase inhibition affects ROS accumulation and NO production of RAW 264.7 cells. Catalase activity of cells (A) and Brucella (B) were measured after 24 and 48 h exposure to 3 mM 3-AT or PBS. The effect of 3-AT treatment on ROS accumulation in macrophages at 48 h pi was quantified using DCFA/H2DCFDA-cellular ROS assay kit and a spectrofluorometer (C). Nitrite production was quantified using the Griess assay and spectrophotometry (D). Data were displayed as the mean ± SD of triplicate samples from at least two independent experiments. Statistically significant differences compared to the control group are indicated by asterisks (*P < 0.05, **P < 0.01).
Figure 3.
3-AT inhibits the translocation of NF-κB into the nucleus of RAW 264.7 cells. Total protein extracted from nuclear macrophages after 24 and 48 h exposure with 3-AT 3 mM or PBS was subjected to the immunoblotting assay (A) for detecting the nuclear translocation of NF-κB p105/50, p65, and p100/52. The relative intensity of NF-κB p105/50 (B, C), p65 (D), and p100/52 (E, F) proteins was normalized to the control lamin B1 using ImageJ software. The data are presented as the mean ± SD of duplicate samples obtained from two independent experiments. Asterisks indicate a significant deviation (*P < 0.05, **P < 0.01, *** P< 0.001).
Figure 4.
3-AT induces the mRNA expression in macrophages infected with B. abortus. Cells were treated with 3-AT 3 mM for 24 and 48 h. Following treatment, RNA was isolated from RAW 264.7 cells at 24 and 48 h incubation with 3-AT and was converted to cDNA. TNF-α (A), IL-6 (B), IL-12p40 (C), and IL-10 (D) gene expression were then evaluated by qRT-PCR. TNF-α (E), IL-6 (F), IL-12p40 (G), and IL-10 (H) cytokine levels in the cell culture media were quantified using a mouse inflammation kit and flow cytometry. Data present the mean ± SD replicate samples from three independent experiments. Asterisks indicate a significant deviation (*P < 0.05, **P < 0.01, *** P< 0.001).
Figure 5.
Protection against B. abortus in ICR mice treated with 3-AT. ICR mice were orally administered with 400 or 600 mg/kg/day of 3-AT or vehicle control three days prior to infection with B. abortus. The treatment was then intermittently continued for 12 days. At day 12 pi, the bacterial load in the spleen and liver (A) and the total weight of the spleen and liver (B) were determined. The CD4+/CD8+ ratio in the blood of infected mice was analyzed by flow cytometry at day 12 pi (C). The data are presented as the mean ± SD of the mean of each group with five mice. Asterisks indicate statistically significant differences (*P < 0.05, **P < 0.01, ***P < 0.001).
Figure 6.
3-AT affects cytokine production in B. abortus-infected mice. TNF-α, IL-6, IL-10, IFN-γ, IL-12p70, and MCP-1 levels in the serum form mice were measured using a CBA kit and flow cytometry at day 12 pi. Asterisks indicate statistically significant differences (*P < 0.05, **P < 0.01).
Figure 6.
3-AT affects cytokine production in B. abortus-infected mice. TNF-α, IL-6, IL-10, IFN-γ, IL-12p70, and MCP-1 levels in the serum form mice were measured using a CBA kit and flow cytometry at day 12 pi. Asterisks indicate statistically significant differences (*P < 0.05, **P < 0.01).
Table 1.
Mouse primer sequences used for qRT-PCR.
Table 1.
Mouse primer sequences used for qRT-PCR.
| Gene Symbol |
Gene name |
Primer sequences |
| GAPDH |
Glyceraldehyde-3-phosphate dehydrogenase |
F: 5′-GGAGAAACCTGCCAAGTATG -3′
R: 5′-AACCTG GTCCTCAGTGTA-3′ |
|
IL-6
|
Interleukin 6 |
F: 5’- ACCACGGCCTTCCCTACTT -3’ |
| |
|
R: 5’- CATTTCCACGATTTCCCAGA-3’ |
|
IL-10
|
Interleukin 10 |
F: 5’-CATTTCCACGATTTCCCAGA-3’ |
| |
|
R: 5’- CATTTCCACGATTTCCCAGA -3’ |
|
IL-12p40
|
Interleukin-12 subunit p40 |
F: 5’CTGGTGTCTCCACTCATGGC-3’ |
| |
|
R: 5’- GCGTGTCACAGGTGAGGTTC -3’ |
| TNF-α |
Tumor necrosis factor-alpha |
F: 5’- CAGGTTCTGTCCCTTTCACTCACT -3’
R: 5’- GTTCAGTAGACAGAAGAGCGTGGT -3’ |
