Submitted:
02 November 2023
Posted:
03 November 2023
You are already at the latest version
Abstract
Keywords:
1. Introduction
2. Materials and Methods
2.1. DBD reactor and electrical characterization
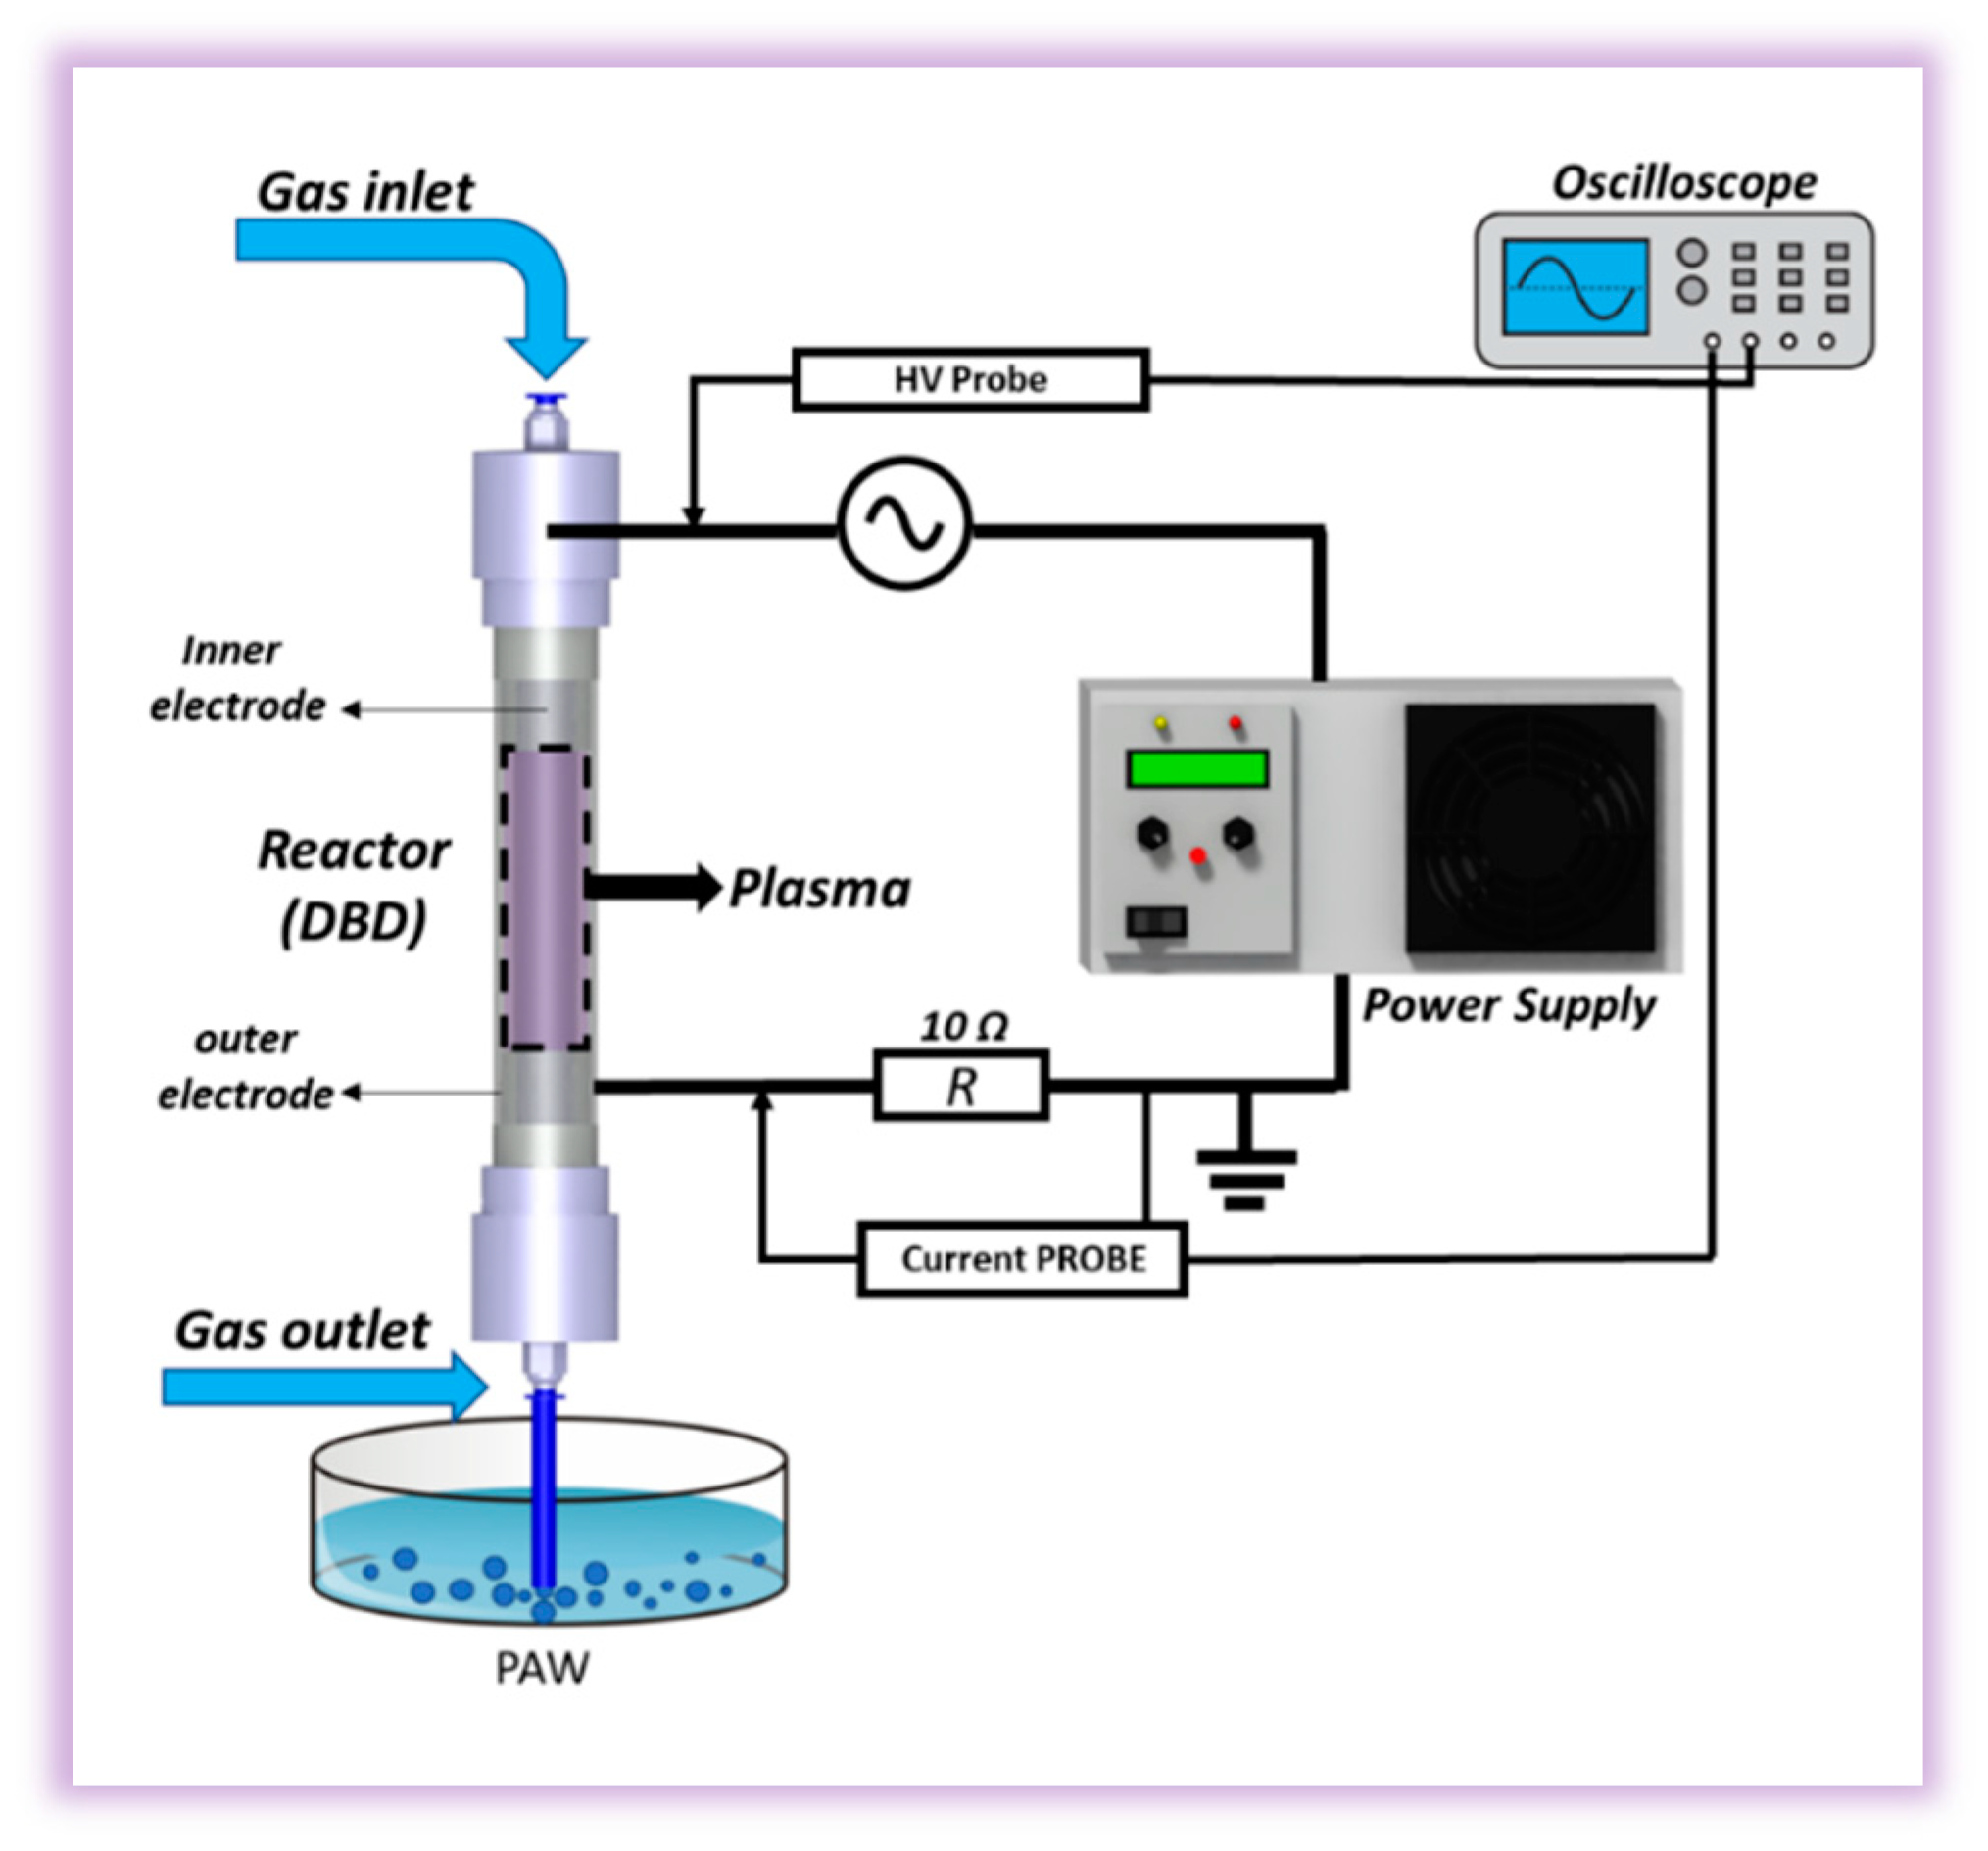
2.2. Water activation process and samples
2.3. Microbiological assays – Assessment of antimicrobial activity of PAW
3. Results
3.1. Electrical characterization of coaxial DBD plasma
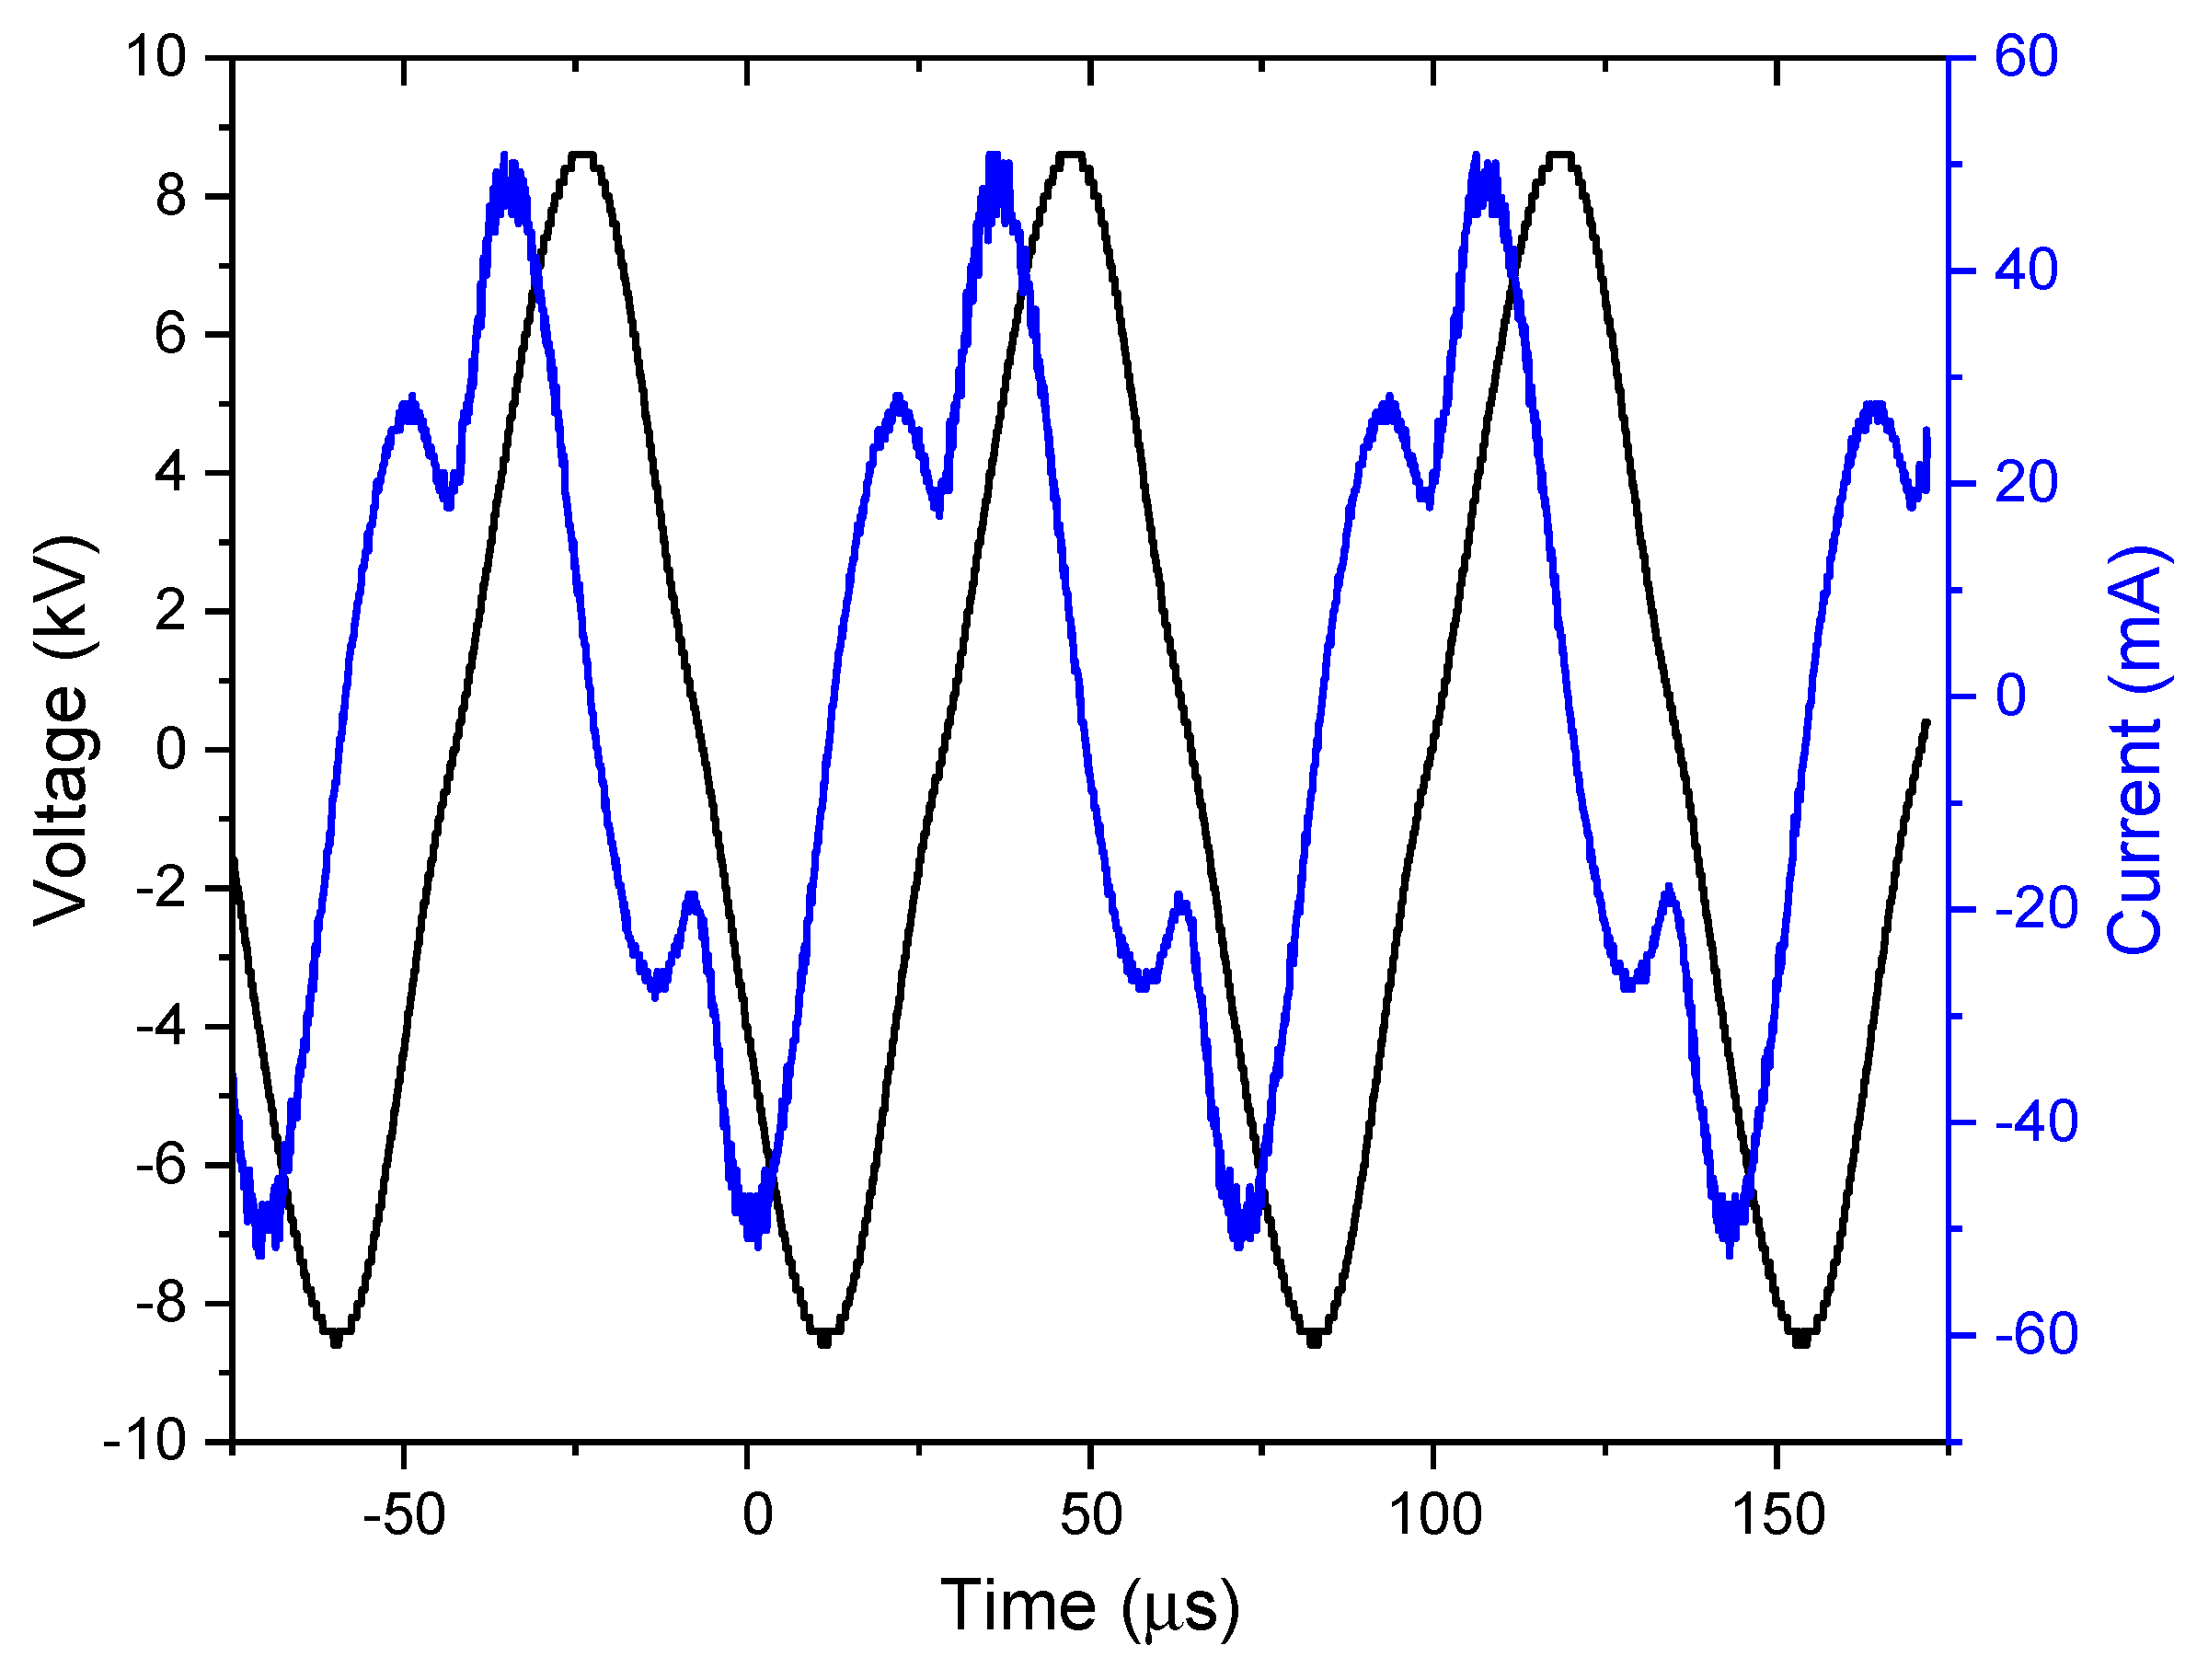
3.2. Coaxial DBD reactor mapping
3.3. Impact of gas flow rate on activation
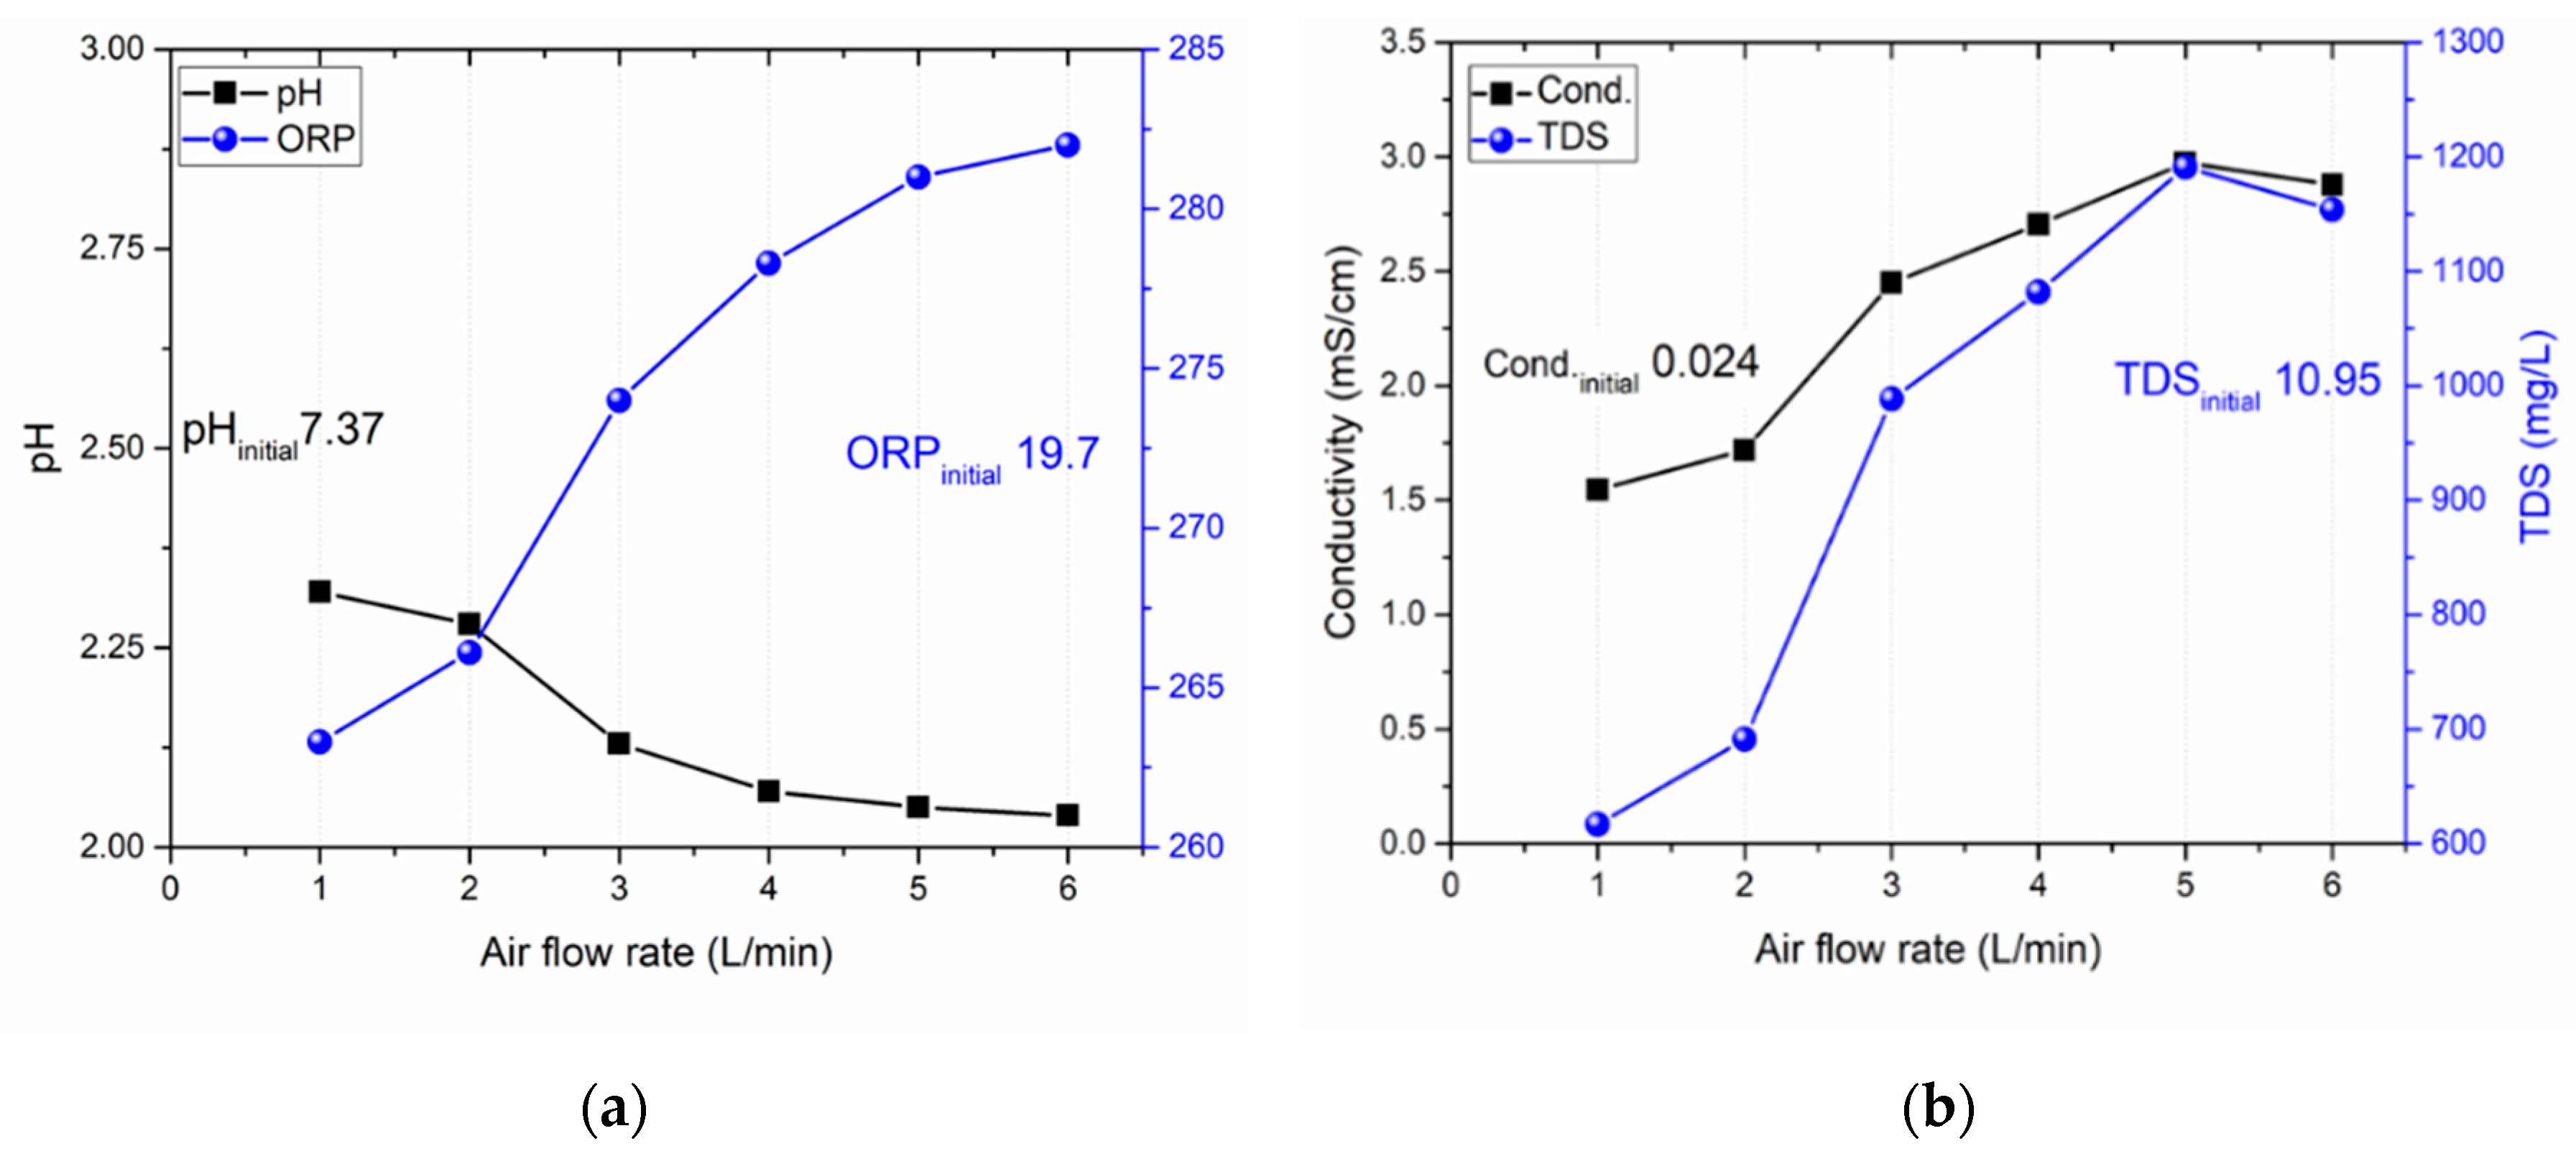
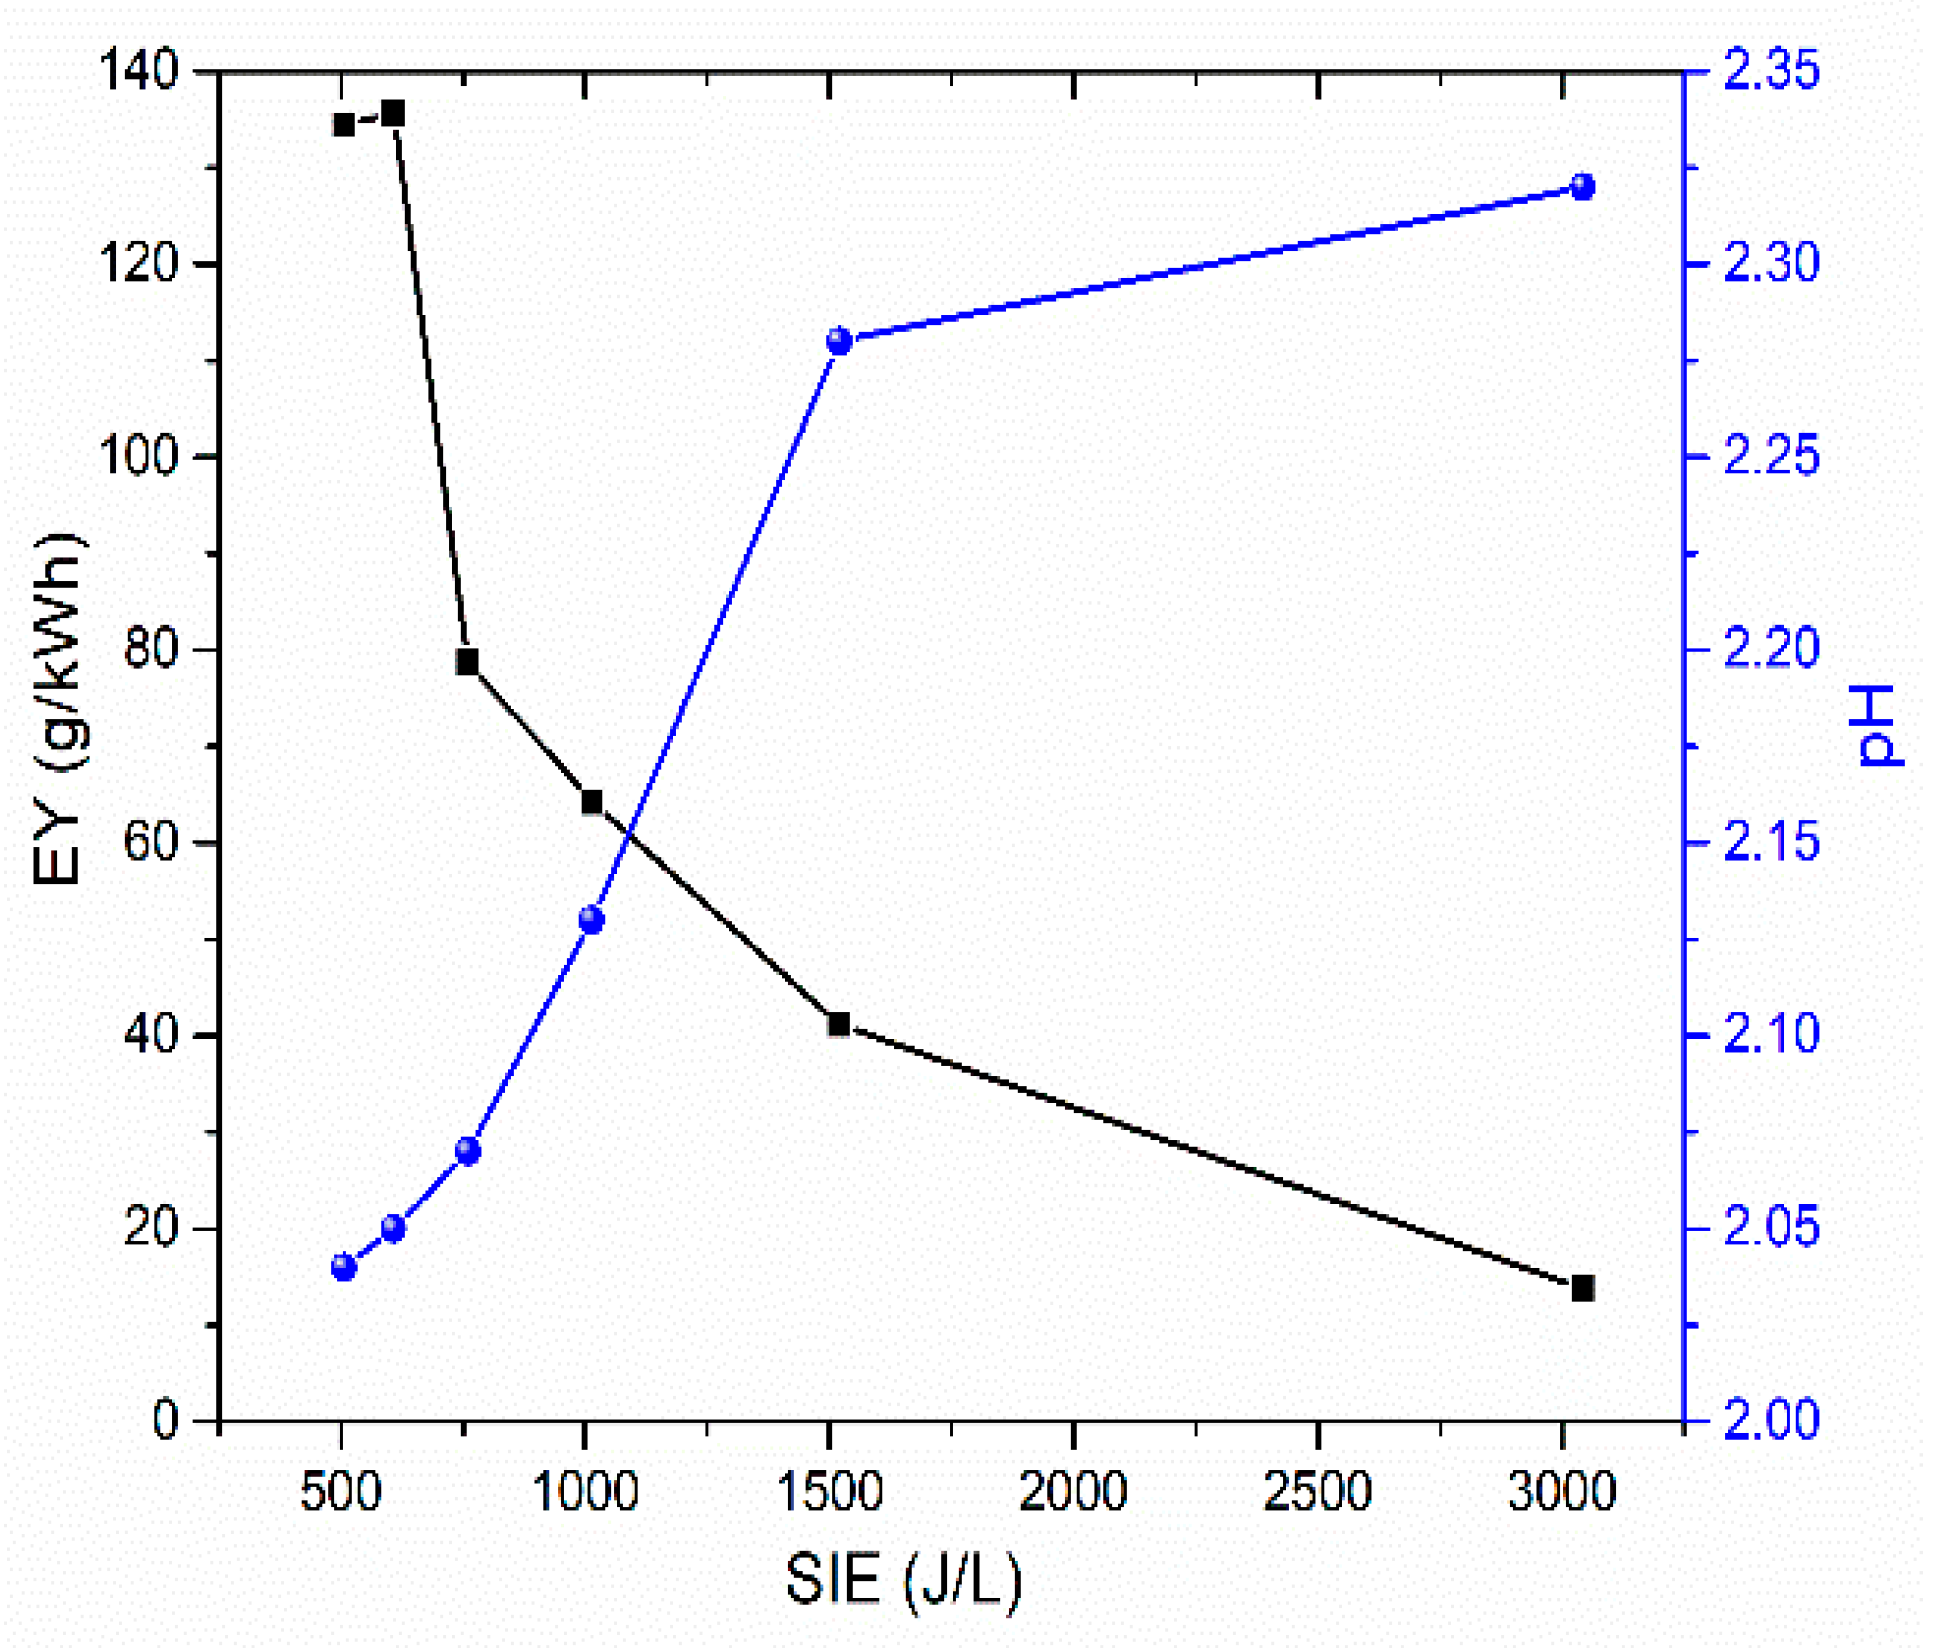
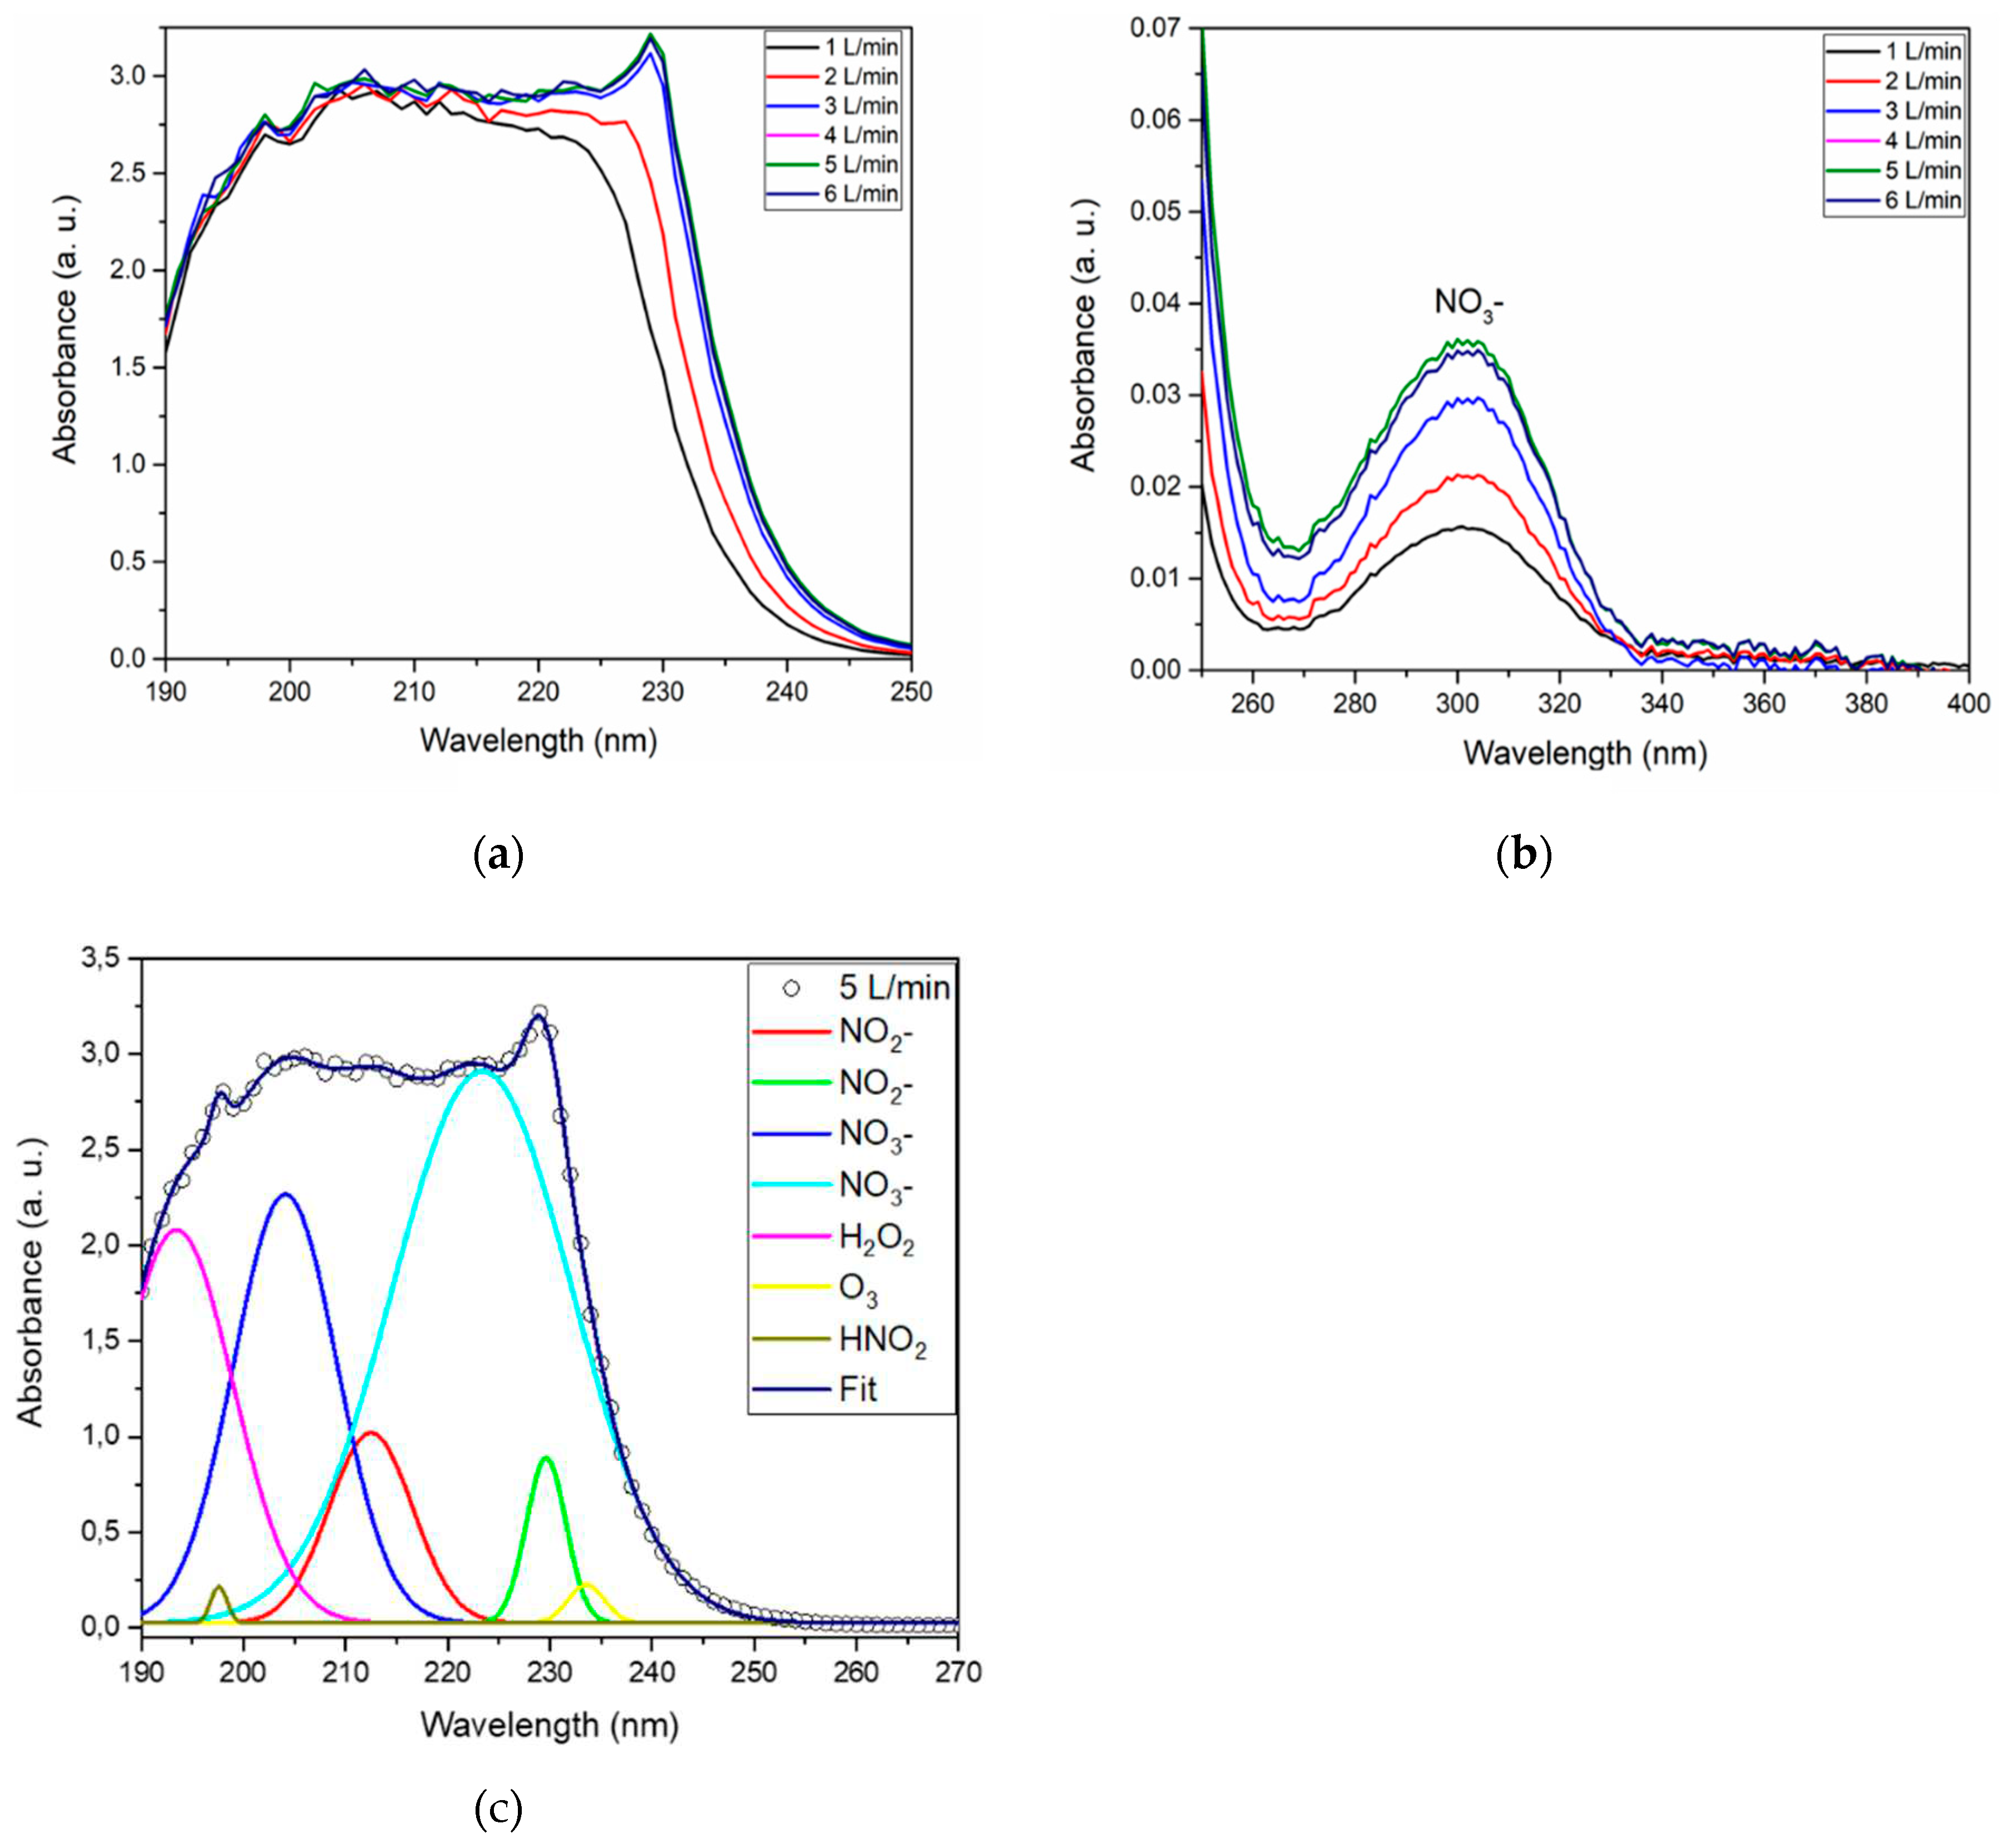
| Air flow rate (L/min) | NO2- (mg/L) | NO3- (mg/L) | H2O2 (mg/L) | HNO2 (mg/L) |
|---|---|---|---|---|
| 1 | 1.94 | 237.90 | 1.38 | 22.27 |
| 2 | 2.93 | 382.70 | 2.04 | 36.88 |
| 3 | 4.40 | 473.07 | 2.75 | 78.24 |
| 4 | 4.82 | 492.09 | 2.86 | 98.41 |
| 5 | 5.00 | 500.00 | 3.00 | 106.89 |
| 6 | 4.82 | 495.29 | 2.86 | 105.45 |
3.4. Influence of activation time
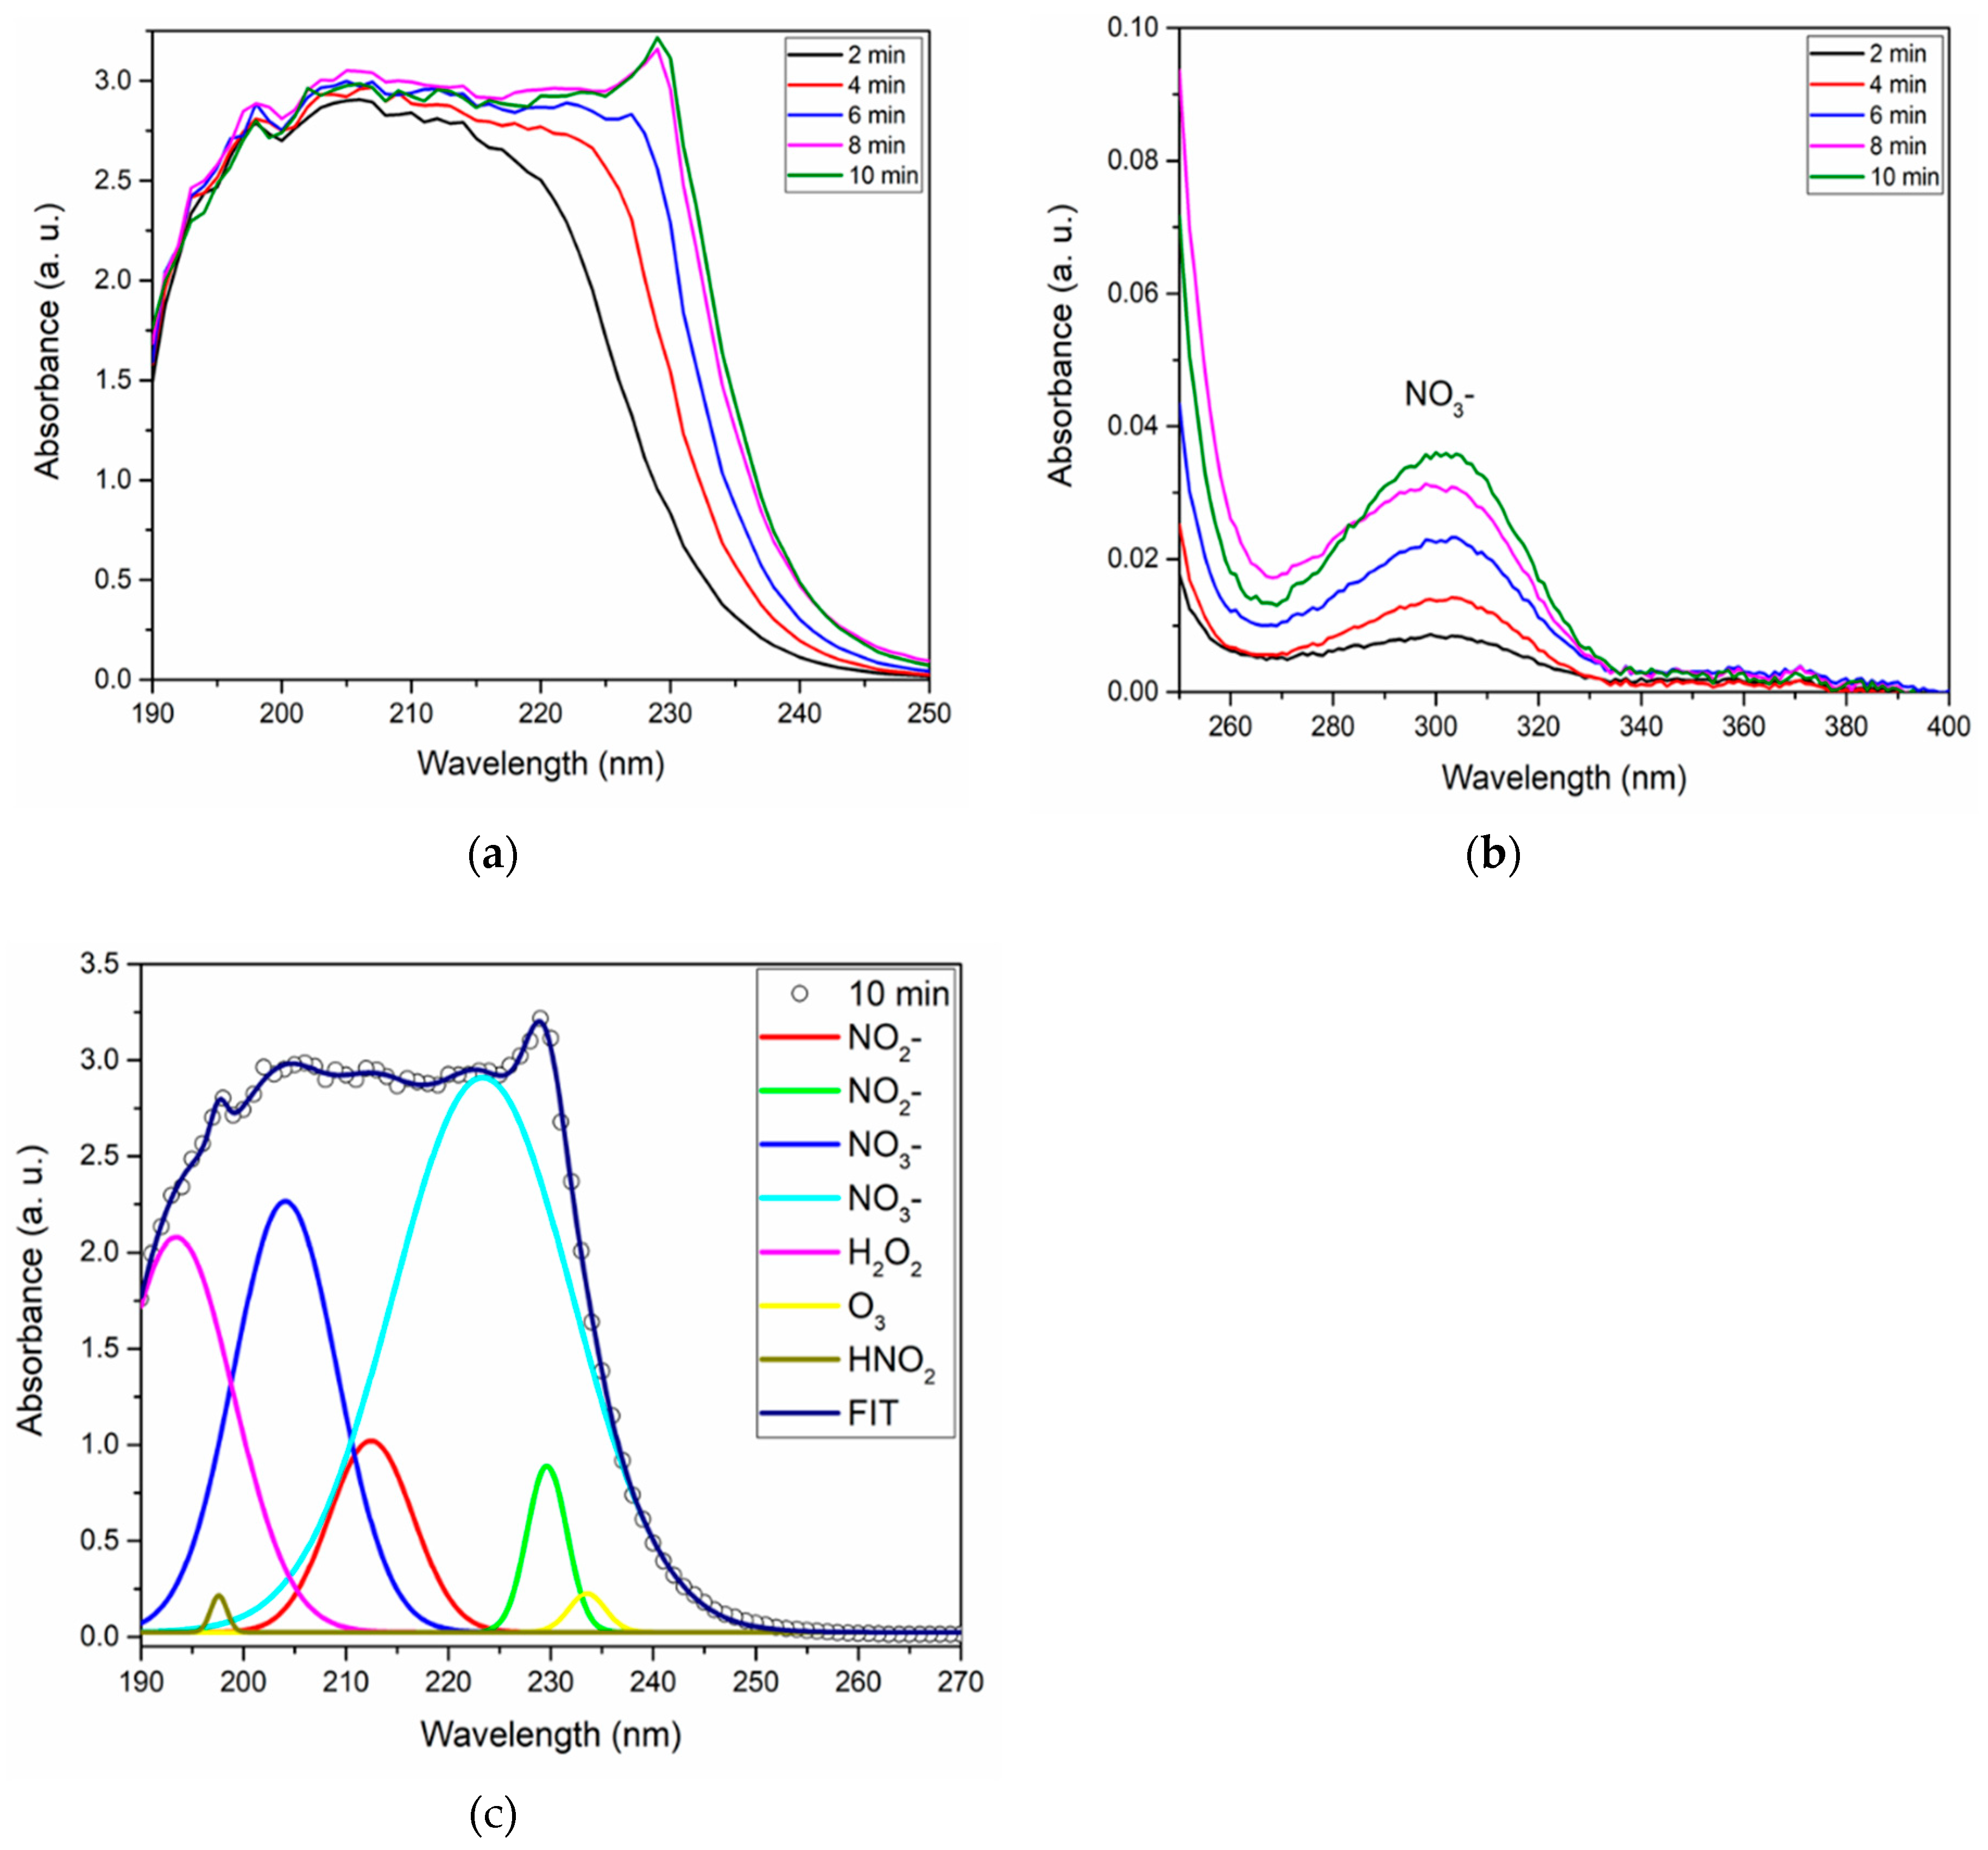
| Activation time (min) | NO2- (mg/L) | NO3- (mg/L) | H2O2 (mg/L) | HNO2 (mg/L) |
|---|---|---|---|---|
| 2 | 1.14 | 133.74 | 0.78 | 3.13 |
| 4 | 2.03 | 247.27 | 1.44 | 17.53 |
| 6 | 3.14 | 366.54 | 2.13 | 48.63 |
| 8 | 4.51 | 474.26 | 2.76 | 92.08 |
| 10 | 5.00 | 500.0 | 3.00 | 106.89 |
3.5. Influence DI water volume
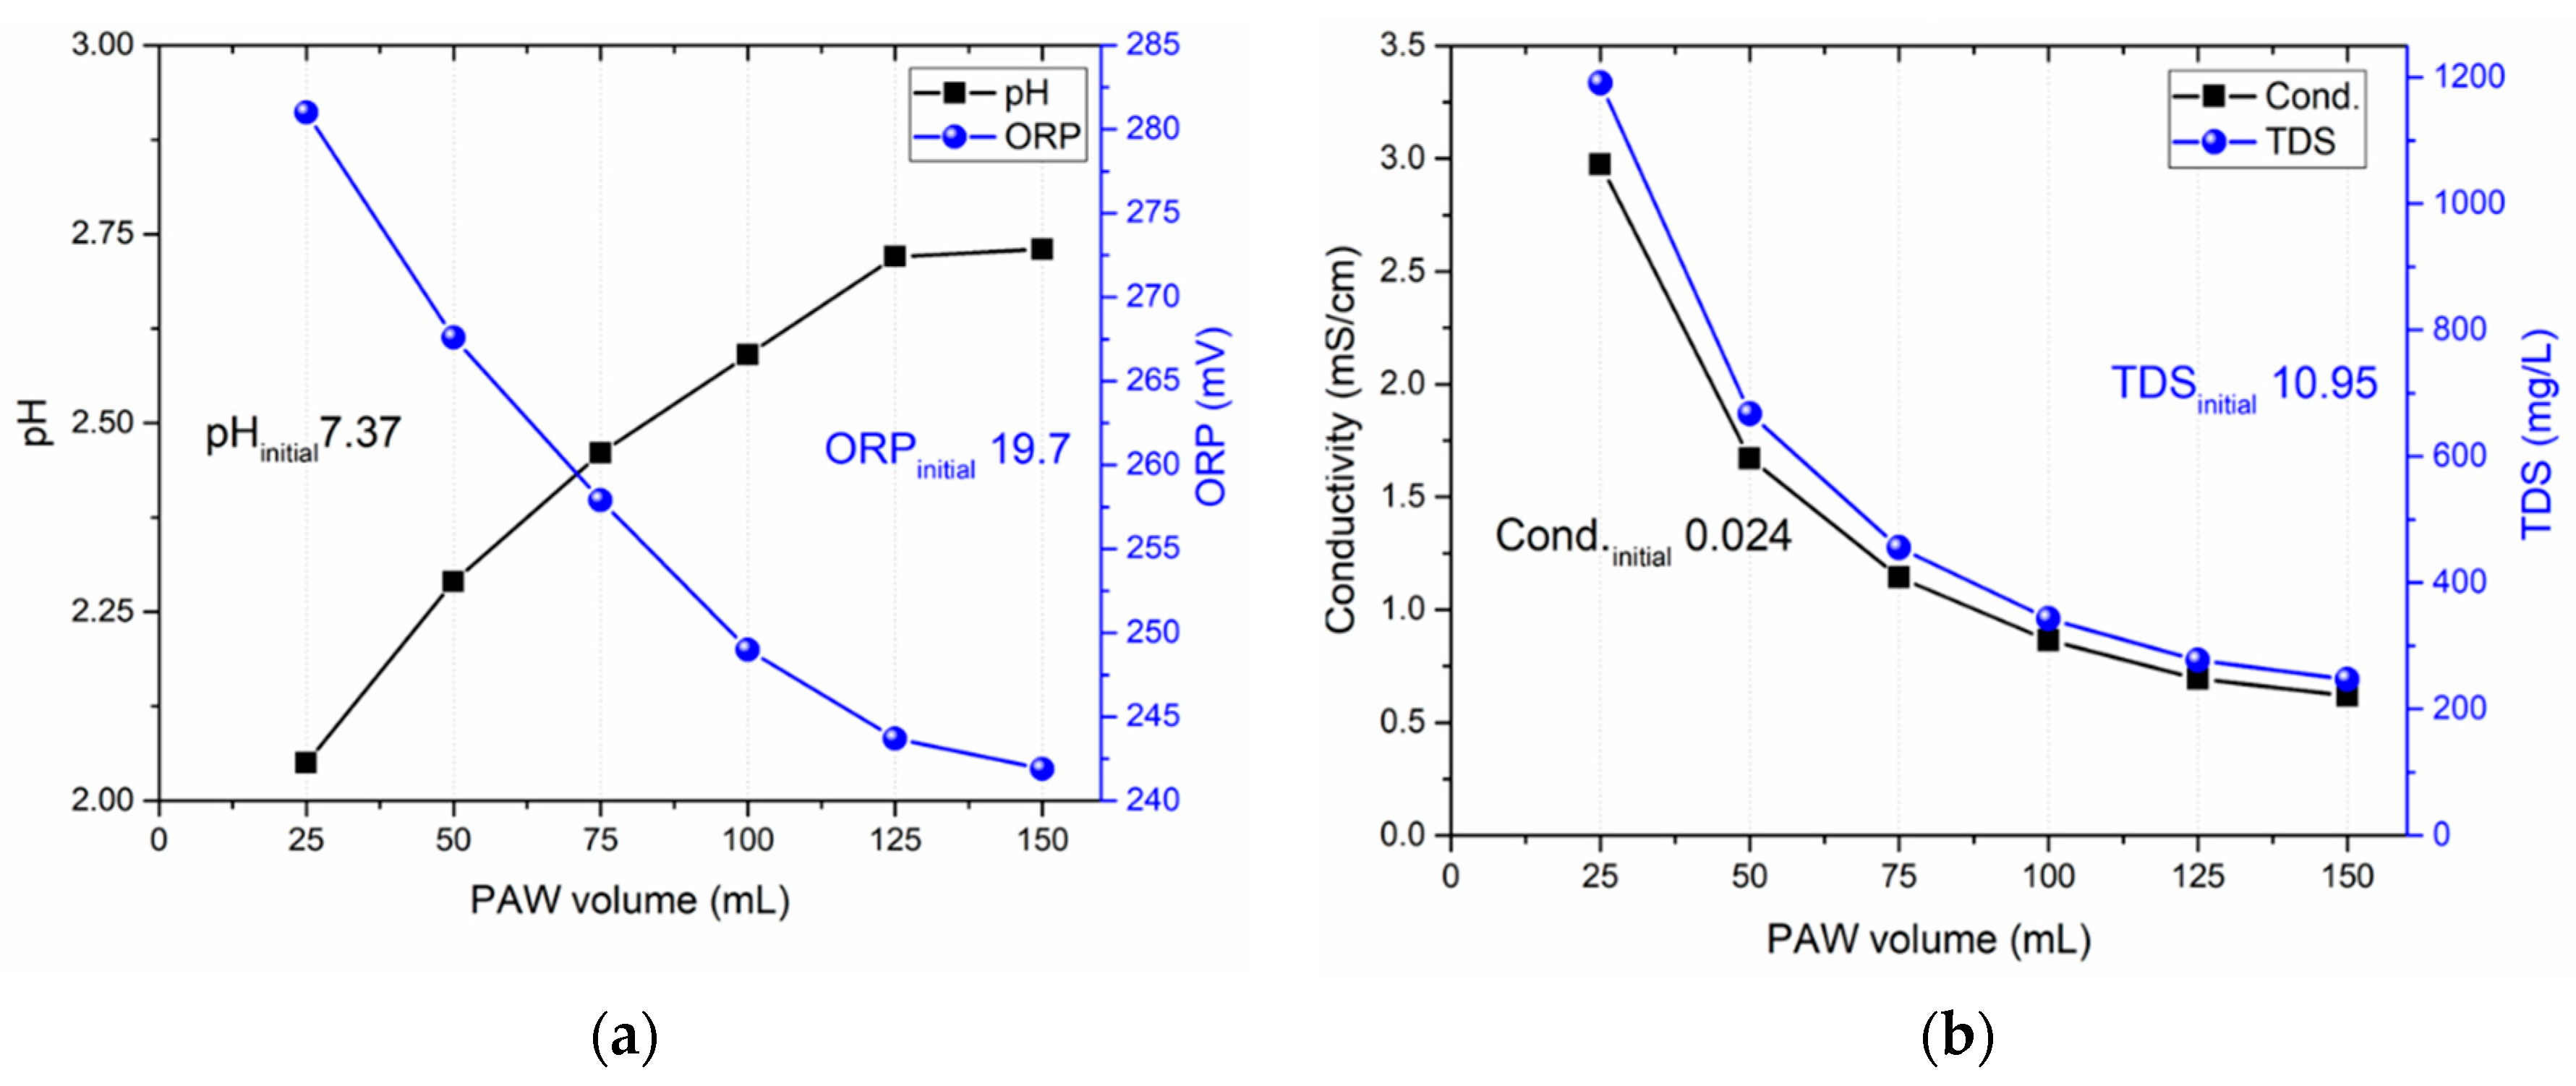
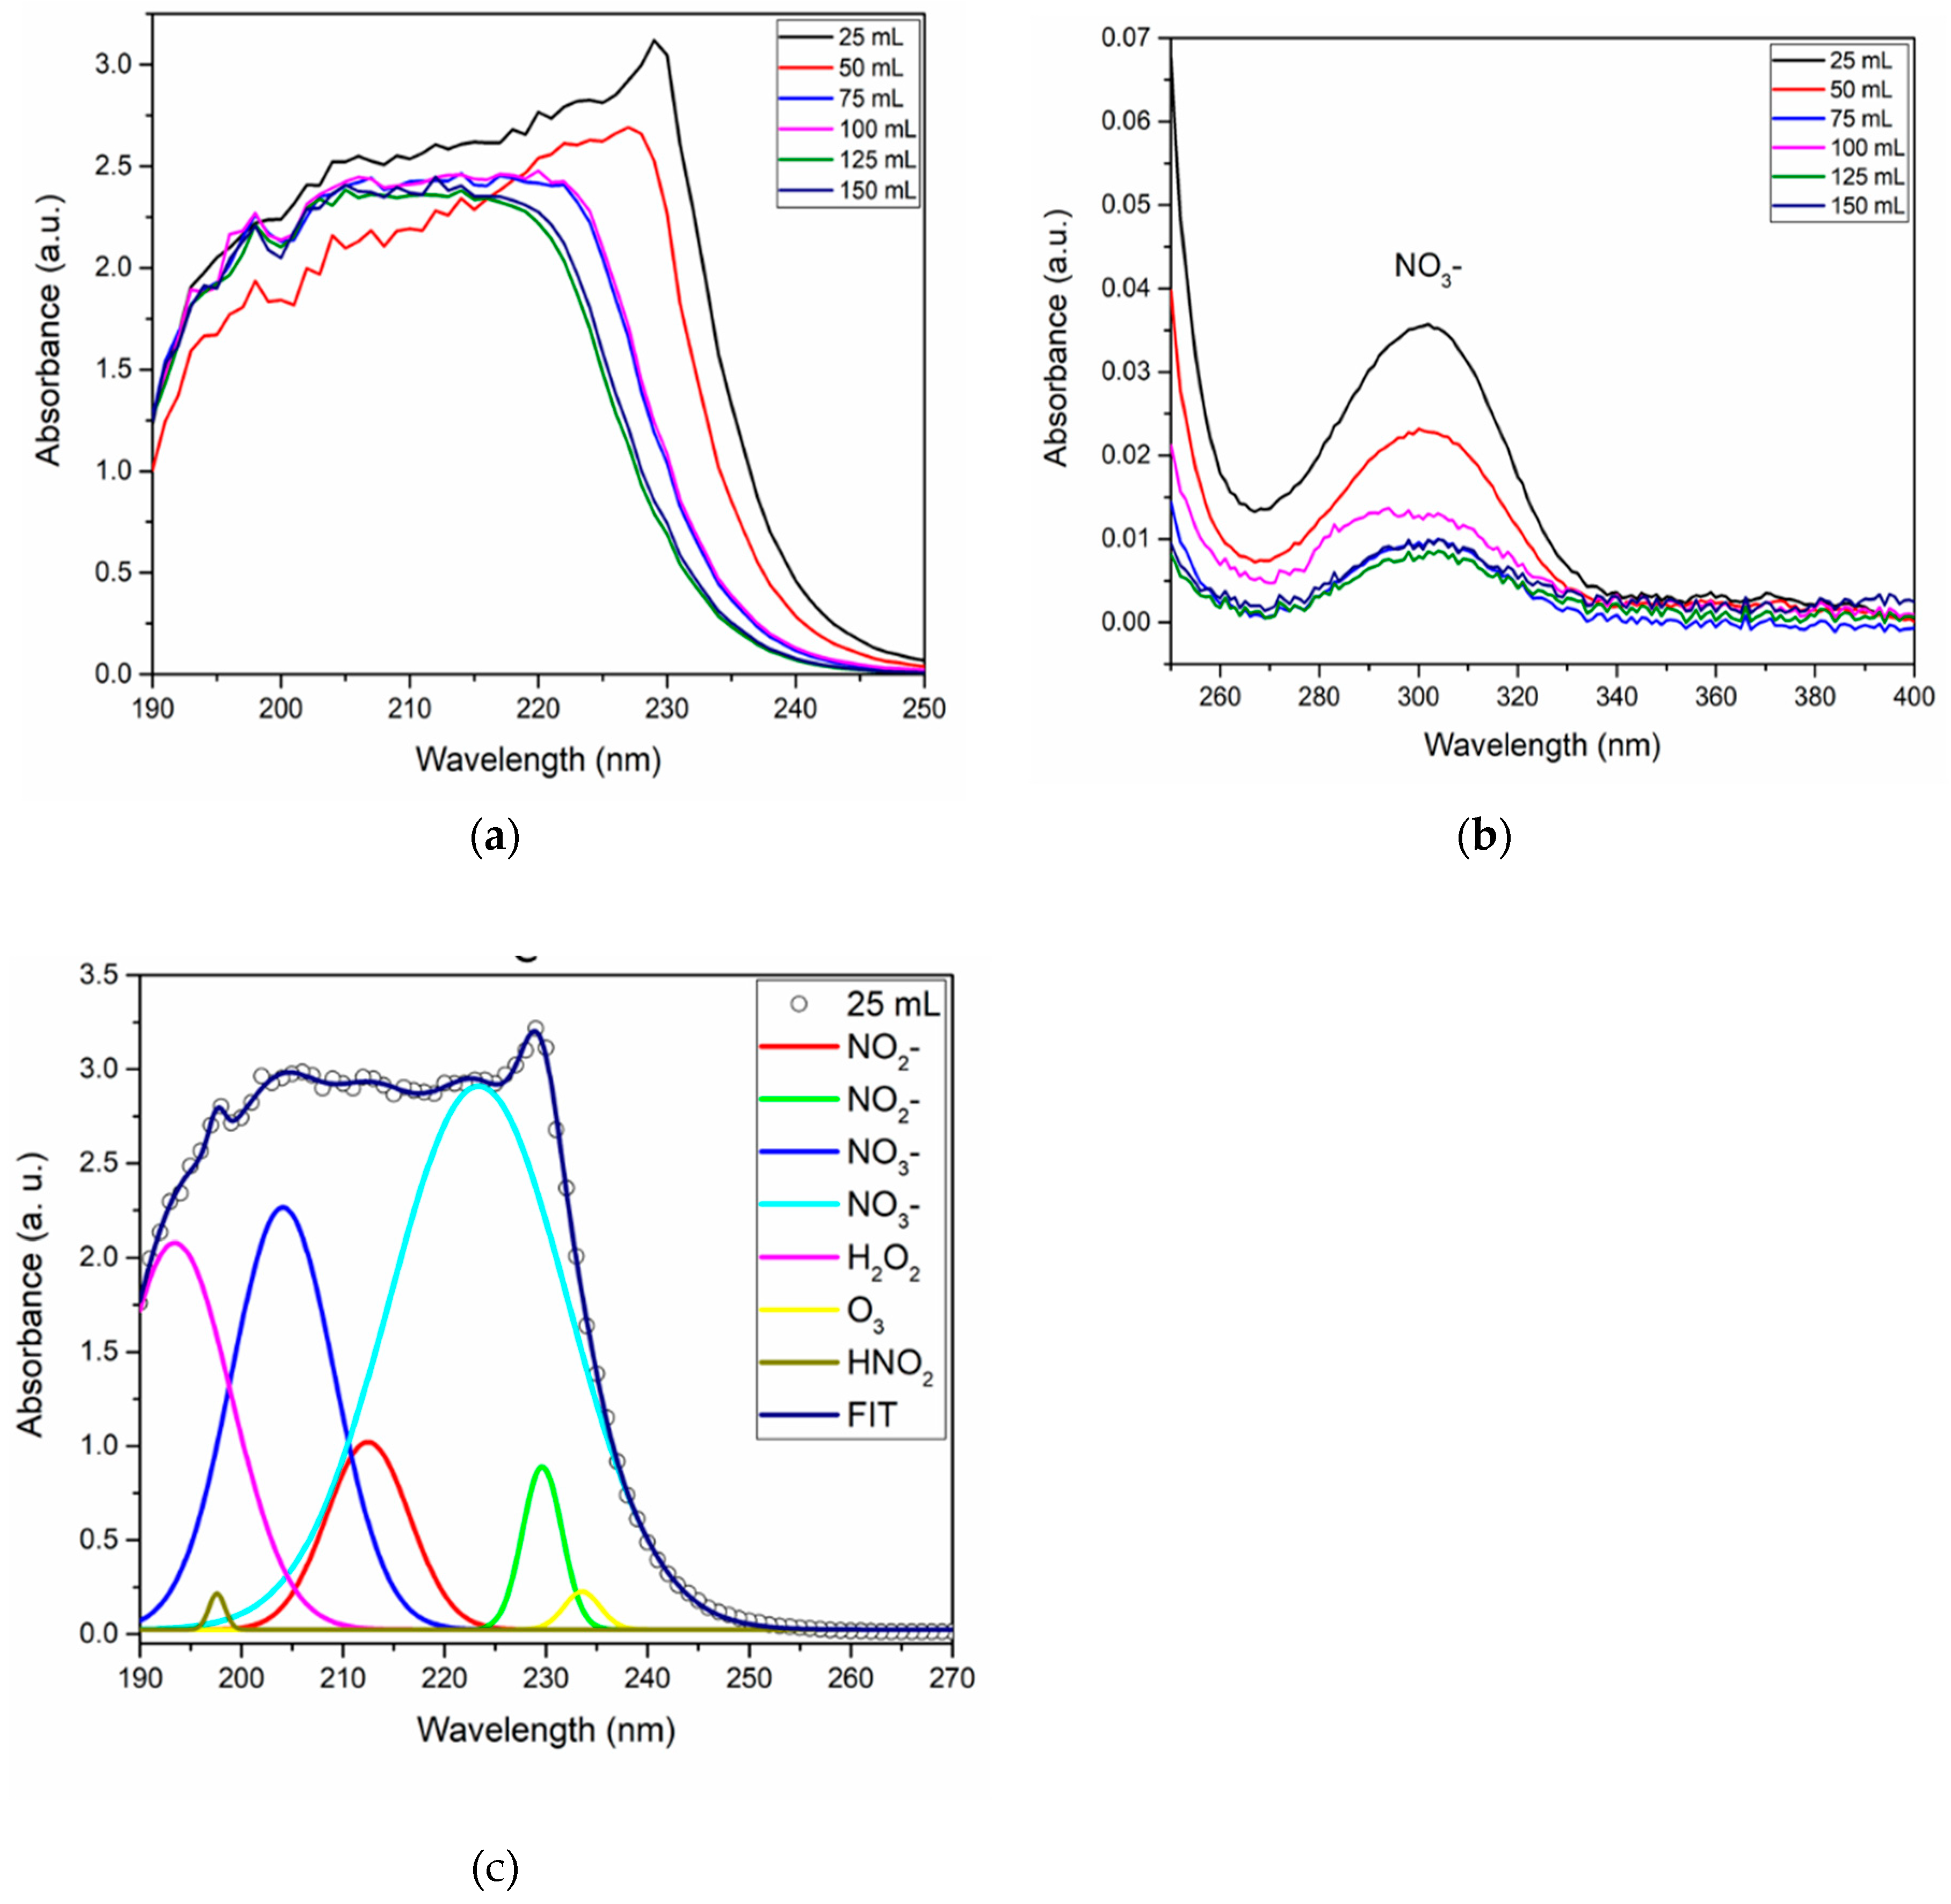
| PAW volume (mL) | NO2- (mg/L) | NO3- (mg/L) | H2O2 (mg/L) | HNO2 (mg/L) |
|---|---|---|---|---|
| 25 | 5.00 | 500.00 | 3.00 | 106.89 |
| 50 | 3.06 | 366.23 | 2.11 | 37.64 |
| 75 | 1.32 | 166.35 | 0.97 | 10.97 |
| 100 | 1.40 | 173.84 | 1.01 | 8.63 |
| 125 | 0.85 | 110.23 | 0.64 | 3.88 |
| 150 | 0.92 | 119.05 | 0.69 | 4.11 |
3.6. Microbiological assays
4. Conclusions
Author Contributions
Funding
Data Availability Statement
Conflicts of Interest
References
- Pulingam, T.; Parumasivam, T.; Gazzali, A.M.; Sulaiman, A.M.; Chee, J.Y.; Lakshmanan, M.; Chin, C.F.; Sudesh, K. Antimicrobial Resistance: Prevalence, Economic Burden, Mechanisms of Resistance and Strategies to Overcome. European Journal of Pharmaceutical Sciences 2022, 170. [Google Scholar] [CrossRef] [PubMed]
- Scholtz, V.; Vaňková, E.; Kašparová, P.; Premanath, R.; Karunasagar, I.; Julák, J. Non-Thermal Plasma Treatment of ESKAPE Pathogens: A Review. Front Microbiol 2021, 12. [Google Scholar] [CrossRef] [PubMed]
- Weltmann, K.D.; Von Woedtke, T. Plasma Medicine - Current State of Research and Medical Application. Plasma Phys Control Fusion 2017, 59. [Google Scholar] [CrossRef]
- Akan, T.; Çabuk, A. Indirect Plasma Inactivation by a Low Temperature Atmospheric Pressure Plasma (LTAPP) System. J Electrostat 2014, 72, 218–221. [Google Scholar] [CrossRef]
- Wong, K.S.; Chew, N.S.L.; Low, M.; Tan, M.K. Plasma-Activated Water: Physicochemical Properties, Generation Techniques, and Applications. Processes 2023, 11. [Google Scholar] [CrossRef]
- Magureanu, M.; Piroi, D.; Mandache, N.B.; David, V.; Medvedovici, A.; Bradu, C.; Parvulescu, V.I. Degradation of Antibiotics in Water by Non-Thermal Plasma Treatment. Water Res 2011, 45, 3407–3416. [Google Scholar] [CrossRef] [PubMed]
- Magureanu, M.; Piroi, D.; Mandache, N.B.; David, V.; Medvedovici, A.; Parvulescu, V.I. Degradation of Pharmaceutical Compound Pentoxifylline in Water by Non-Thermal Plasma Treatment. Water Res 2010, 44, 3445–3453. [Google Scholar] [CrossRef]
- Gerrity, D.; Stanford, B.D.; Trenholm, R.A.; Snyder, S.A. An Evaluation of a Pilot-Scale Nonthermal Plasma Advanced Oxidation Process for Trace Organic Compound Degradation. Water Res 2010, 44, 493–504. [Google Scholar] [CrossRef]
- Locke, B.R.; Sato, M.; Sunka, P.; Hoffmann, M.R.; Chang, J.S. Electrohydraulic Discharge and Nonthermal Plasma for Water Treatment. Ind Eng Chem Res 2006, 45, 882–905. [Google Scholar] [CrossRef]
- Laurita, R.; Barbieri, D.; Gherardi, M.; Colombo, V.; Lukes, P. Chemical Analysis of Reactive Species and Antimicrobial Activity of Water Treated by Nanosecond Pulsed DBD Air Plasma. Clin Plasma Med 2015, 3, 53–61. [Google Scholar] [CrossRef]
- Kamgang-Youbi, G.; Herry, J.M.; Bellon-Fontaine, M.N.; Brisset, J.L.; Doubla, A.; Naïtali, M. Evidence of Temporal Postdischarge Decontamination of Bacteria by Gliding Electric Discharges: Application to Hafnia Alvei. Appl Environ Microbiol 2007, 73, 4791–4796. [Google Scholar] [CrossRef]
- Addou, A.; Brisset, J.L.; Doubla, A.; Abdelmalek, F.; Khe, K. Post-Discharge Plasma-Chemical Oxidation of Iron ( II ) Complexes. 2003, 73–77.
- Ercan, U.K.; Wang, H.; Ji, H.; Fridman, G.; Brooks, A.D.; Joshi, S.G. Nonequilibrium Plasma-Activated Antimicrobial Solutions Are Broad-Spectrum and Retain Their Efficacies for Extended Period of Time. Plasma Processes and Polymers 2013, 10, 544–555. [Google Scholar] [CrossRef]
- Ursache, M.; Moraru, R.; Hnatiuc, E.; Nastase, V.; Mares, M. Comparative Assessment of the Relation between Energy Consumption and Bacterial Burden Reduction Using Plasma Activated Water. 2014 International Conference on Optimization of Electrical and Electronic Equipment, OPTIM 2014 2014, 1036–1041. 1041. [Google Scholar] [CrossRef]
- Koga-Ito, C.Y.; Kostov, K.G.; Miranda, F.S.; Milhan, N.V.M.; Azevedo Neto, N.F.; Nascimento, F.; Pessoa, R.S. Cold Atmospheric Plasma as a Therapeutic Tool in Medicine and Dentistry. Plasma Chemistry and Plasma Processing 2023. [Google Scholar] [CrossRef]
- Burlica, R.; Kirkpatrick, M.J.; Locke, B.R. Formation of Reactive Species in Gliding Arc Discharges with Liquid Water. J Electrostat 2006, 64, 35–43. [Google Scholar] [CrossRef]
- Pawłat, J.; Terebun, P.; Kwiatkowski, M.; Tarabová, B.; Kovaľová, Z.; Kučerová, K.; Machala, Z.; Janda, M.; Hensel, K. Evaluation of Oxidative Species in Gaseous and Liquid Phase Generated by Mini-Gliding Arc Discharge. Plasma Chemistry and Plasma Processing 2019. [Google Scholar] [CrossRef]
- France, P.I. V; Abb, E. Dielectric-Barrier Discharges. Principle and Applications. 1997, 7. [Google Scholar]
- U. Konelschatz, B.E. and W.E.A. Dielectric-Barrier Discharges. Principle and Applications. J. PHYS IV FRANCE 7 1997, 7. [Google Scholar]
- Tang, Q.; Jiang, W.; Cheng, Y.; Lin, S.; Lim, T.M.; Xiong, J. Generation of Reactive Species by Gas-Phase Dielectric Barrier Discharges. Ind Eng Chem Res 2011, 50, 9839–9846. [Google Scholar] [CrossRef]
- Zhang, Z.; Xu, Z.; Cheng, C.; Wei, J.; Lan, Y.; Ni, G.; Sun, Q.; Qian, S.; Zhang, H.; Xia, W.; et al. Bactericidal Effects of Plasma Induced Reactive Species in Dielectric Barrier Gas–Liquid Discharge. Plasma Chemistry and Plasma Processing 2017, 37, 415–431. [Google Scholar] [CrossRef]
- Miranda, F.S.; Rabelo, S.C.; Pradella, J.G.C.; Carli, C. Di; Petraconi, G.; Maciel, H.S.; Pessoa, R.S.; Vieira, L. Plasma In-Liquid Using Non-Contact Electrodes: A Method of Pretreatment to Enhance the Enzymatic Hydrolysis of Biomass. Waste Biomass Valorization 2019. [Google Scholar] [CrossRef]
- Liu, H.; Zhao, Y.; Zhou, Y.; Chang, L.; Zhang, J. Removal of Gaseous Elemental Mercury by Modified Diatomite. Science of the Total Environment 2019, 652, 651–659. [Google Scholar] [CrossRef]
- Jeong, J.; Jurng, J. Removal of Gaseous Elemental Mercury by Dielectric Barrier Discharge. Chemosphere 2007, 68, 2007–2010. [Google Scholar] [CrossRef]
- Chen, Z.; Mannava, D.P.; Mathur, V.K. Mercury Removal in Flue Gases by Dielectric Barrier Discharge Technique. AIChE Annual Meeting, Conference Proceedings 2004, 7101–7104.
- Wright, A.; Bandulasena, H.; Ibenegbu, C.; Leak, D.; Holmes, T.; Zimmerman, W.; Shaw, A.; Iza, F. Dielectric Barrier Discharge Plasma Microbubble Reactor for Pretreatment of Lignocellulosic Biomass. AIChE Journal 2018, 64, 3803–3816. [Google Scholar] [CrossRef]
- Mohades, S.; Lietz, A.M.; Kushner, M.J. Generation of Reactive Species in Water Film Dielectric Barrier Discharges Sustained in Argon, Helium, Air, Oxygen and Nitrogen. J Phys D Appl Phys 2020, 53. [Google Scholar] [CrossRef]
- Sampaio, A. da G.; Chiappim, W.; Milhan, N.V.M.; Botan Neto, B.; Pessoa, R.; Koga-Ito, C.Y. Effect of the PH on the Antibacterial Potential and Cytotoxicity of Different Plasma-Activated Liquids. Int J Mol Sci 2022, 23. [Google Scholar] [CrossRef]
- Miranda, F.S.; Koga-Ito, C.Y.; Pessoa, R.S.; Petraconi, G. Processo Contínuo de Tratamento e Ativação de Líquidos Nebulizado Ou de Fluxo Corrente Empregando Um Sistema de Células de Descargas Por Barreira Dielétrica 2023, 1–15.
- Oh, J.S.; Szili, E.J.; Ogawa, K.; Short, R.D.; Ito, M.; Furuta, H.; Hatta, A. UV-Vis Spectroscopy Study of Plasma-Activated Water: Dependence of the Chemical Composition on Plasma Exposure Time and Treatment Distance. Jpn J Appl Phys 2018, 57. [Google Scholar] [CrossRef]
- Gamaleev, V.; Iwata, N.; Oh, J.S.; Hiramatsu, M.; Ito, M. Development of an Ambient Air Flow Rotating Arc Jet for Low-Temperature Treatment. IEEE Access 2019, 7, 93100–93107. [Google Scholar] [CrossRef]
- Liu, Z.; Zhou, C.; Liu, D.; He, T.; Guo, L.; Xu, D.; Kong, M.G. Quantifying the Concentration and Penetration Depth of Long-Lived RONS in Plasma-Activated Water by UV Absorption Spectroscopy. AIP Adv 2019, 9. [Google Scholar] [CrossRef]
- Tachibana, K.; Nakamura, T. Examination of UV-Absorption Spectroscopy for Analysis of O3, NO2-, and HNO2 Compositions and Kinetics in Plasma-Activated Water. Jpn J Appl Phys 2020, 59. [Google Scholar] [CrossRef]
- Dharini, M.; Jaspin, S.; Mahendran, R. Cold Plasma Reactive Species: Generation, Properties, and Interaction with Food Biomolecules. Food Chem 2023, 405. [Google Scholar] [CrossRef] [PubMed]
- Huang, X.; Zhou, S.; Liu, M. Investigation of the Coupled Volume Dielectric Barrier Discharge for Ozone Formation in Open Atmospheric Air. IEEE Transactions on Plasma Science 2018, 46, 2887–2893. [Google Scholar] [CrossRef]
- Yuan, D.; Wang, Z.; He, Y.; Xie, S.; Lin, F.; Zhu, Y.; Cen, K. Ozone Production with Dielectric Barrier Discharge from Air: The Influence of Pulse Polarity. Ozone Sci Eng 2018, 40, 494–502. [Google Scholar] [CrossRef]
- Guo, Y.; Liao, X.; Fu, M.; Huang, H.; Ye, D. Toluene Decomposition Performance and NOx By-Product Formation during a DBD-Catalyst Process. J Environ Sci (China) 2015, 28, 187–194. [Google Scholar] [CrossRef] [PubMed]
- Jõgi, I.; Erme, K.; Levoll, E.; Stamate, E. Radical Production Efficiency and Electrical Characteristics of a Coplanar Barrier Discharge Built by Multilayer Ceramic Technology. J Phys D Appl Phys 2017, 50. [Google Scholar] [CrossRef]
- Fateev, A.; Egsgaard, H.; Fateev, A.; Leipold, F.; Kusano, Y.; Stenum, B.; Egsgaard, H.; Bindslev, H. Reduction of NO x by Plasma-Assisted Methods INCOM-Industrial Production Processes for Nanoreinforced Composite Structures View Project EMPIR Joint Research Project EMPRESS-"Enhancing Process Efficiency through Improved Temperature Measurement" View Project Reduction of NO x by Plasma-Assisted Methods;
- Traylor, M.J.; Pavlovich, M.J.; Karim, S.; Hait, P.; Sakiyama, Y.; Clark, D.S.; Graves, D.B. Long-Term Antibacterial Efficacy of Air Plasma-Activated Water. J Phys D Appl Phys 2011, 44. [Google Scholar] [CrossRef]
- Zhao, Y.M.; Ojha, S.; Burgess, C.M.; Sun, D.W.; Tiwari, B.K. Inactivation Efficacy of Plasma-Activated Water: Influence of Plasma Treatment Time, Exposure Time and Bacterial Species. Int J Food Sci Technol 2021, 56, 721–732. [Google Scholar] [CrossRef]
- Kamgang-Youbi, G.; Herry, J.M.; Meylheuc, T.; Brisset, J.L.; Bellon-Fontaine, M.N.; Doubla, A.; Naïtali, M. Microbial Inactivation Using Plasma-Activated Water Obtained by Gliding Electric Discharges. Lett Appl Microbiol 2009, 48, 13–18. [Google Scholar] [CrossRef]
- Bălan, G.G.; Roşca, I.; Ursu, E.L.; Doroftei, F.; Bostănaru, A.C.; Hnatiuc, E.; Năstasă, V.; Şandru, V.; Ştefănescu, G.; Trifan, A.; et al. Plasma-Activated Water: A New and Effective Alternative for Duodenoscope Reprocessing. Infect Drug Resist 2018, 11, 727–733. [Google Scholar] [CrossRef]
- Zhao, Y.M.; Patange, A.; Sun, D.W.; Tiwari, B. Plasma-Activated Water: Physicochemical Properties, Microbial Inactivation Mechanisms, Factors Influencing Antimicrobial Effectiveness, and Applications in the Food Industry. Compr Rev Food Sci Food Saf 2020, 19, 3951–3979. [Google Scholar] [CrossRef]
- Rathore, V.; Patel, D.; Butani, S.; Nema, S.K. Investigation of Physicochemical Properties of Plasma Activated Water and Its Bactericidal Efficacy. Plasma Chemistry and Plasma Processing 2021, 41, 871–902. [Google Scholar] [CrossRef]
- Judée, F.; Simon, S.; Bailly, C.; Dufour, T. Plasma-Activation of Tap Water Using DBD for Agronomy Applications: Identification and Quantification of Long Lifetime Chemical Species and Production/Consumption Mechanisms. Water Res 2018, 133, 47–59. [Google Scholar] [CrossRef] [PubMed]
- Laurita, R.; Barbieri, D.; Gherardi, M.; Colombo, V.; Lukes, P. Chemical Analysis of Reactive Species and Antimicrobial Activity of Water Treated by Nanosecond Pulsed DBD Air Plasma. Clin Plasma Med 2015, 3, 53–61. [Google Scholar] [CrossRef]
- Rathore, V.; Patil, C.; Kumar Nema, S. Title: Continuous Production for Large Quantity Plasma Activated Water Using Multiple Plasma Device Setup;
- Oehmigen, K.; Hähnel, M.; Brandenburg, R.; Wilke, C.; Weltmann, K.D.; Von Woedtke, T. The Role of Acidification for Antimicrobial Activity of Atmospheric Pressure Plasma in Liquids. Plasma Processes and Polymers 2010, 7, 250–257. [Google Scholar] [CrossRef]
- da Silva, G.J.; Mendonça, N. Association between Antimicrobial Resistance and Virulence in Escherichia Coli. Virulence 2012, 3, 18–28. [Google Scholar] [CrossRef] [PubMed]
- Cheung, G.Y.C.; Bae, J.S.; Otto, M. Pathogenicity and Virulence of Staphylococcus Aureus. Virulence 2021, 12, 547–569. [Google Scholar] [CrossRef] [PubMed]
- Lee, Y.; Puumala, E.; Robbins, N.; Cowen, L.E. Antifungal Drug Resistance: Molecular Mechanisms in Candida Albicans and Beyond. Chem Rev 2021, 121, 3390–3411. [Google Scholar] [CrossRef] [PubMed]
- Traylor, M.J.; Pavlovich, M.J.; Karim, S.; Hait, P.; Sakiyama, Y.; Clark, D.S.; Graves, D.B. Long-Term Antibacterial Efficacy of Air Plasma-Activated Water. J Phys D Appl Phys 2011, 44. [Google Scholar] [CrossRef]
- Zhou, R.; Zhou, R.; Prasad, K.; Fang, Z.; Speight, R.; Bazaka, K.; Ostrikov, K. Cold Atmospheric Plasma Activated Water as a Prospective Disinfectant: The Crucial Role of Peroxynitrite. Green Chemistry 2018, 20, 5276–5284. [Google Scholar] [CrossRef]
- Xu, H.; Liu, C.; Huang, Q. Enhance the Inactivation of Fungi by the Sequential Use of Cold Atmospheric Plasma and Plasma-Activated Water: Synergistic Effect and Mechanism Study. Chemical Engineering Journal 2023, 452. [Google Scholar] [CrossRef]
- Sherrington, S.L.; Sorsby, E.; Mahtey, N.; Kumwenda, P.; Lenardon, M.D.; Brown, I.; Ballou, E.R.; MacCallum, D.M.; Hall, R.A. Adaptation of Candida Albicans to Environmental PH Induces Cell Wall Remodelling and Enhances Innate Immune Recognition. PLoS Pathog 2017, 13. [Google Scholar] [CrossRef]
| PAW volume (mL) | NO2- (mg/L) | NO3- (mg/L) | H2O2 (mg/L) | HNO2 (mg/L) |
|---|---|---|---|---|
| 25 | 5.00 | 500.00 | 3.00 | 106.89 |
| 50 | 3.06 | 366.23 | 2.11 | 37.64 |
| 75 | 1.32 | 166.35 | 0.97 | 10.97 |
| 100 | 1.40 | 173.84 | 1.01 | 8.63 |
| 125 | 0.85 | 110.23 | 0.64 | 3.88 |
| 150 | 0.92 | 119.05 | 0.69 | 4.11 |
Disclaimer/Publisher’s Note: The statements, opinions and data contained in all publications are solely those of the individual author(s) and contributor(s) and not of MDPI and/or the editor(s). MDPI and/or the editor(s) disclaim responsibility for any injury to people or property resulting from any ideas, methods, instructions or products referred to in the content. |
© 2023 by the authors. Licensee MDPI, Basel, Switzerland. This article is an open access article distributed under the terms and conditions of the Creative Commons Attribution (CC BY) license (http://creativecommons.org/licenses/by/4.0/).


