Submitted:
02 November 2023
Posted:
03 November 2023
You are already at the latest version
Abstract
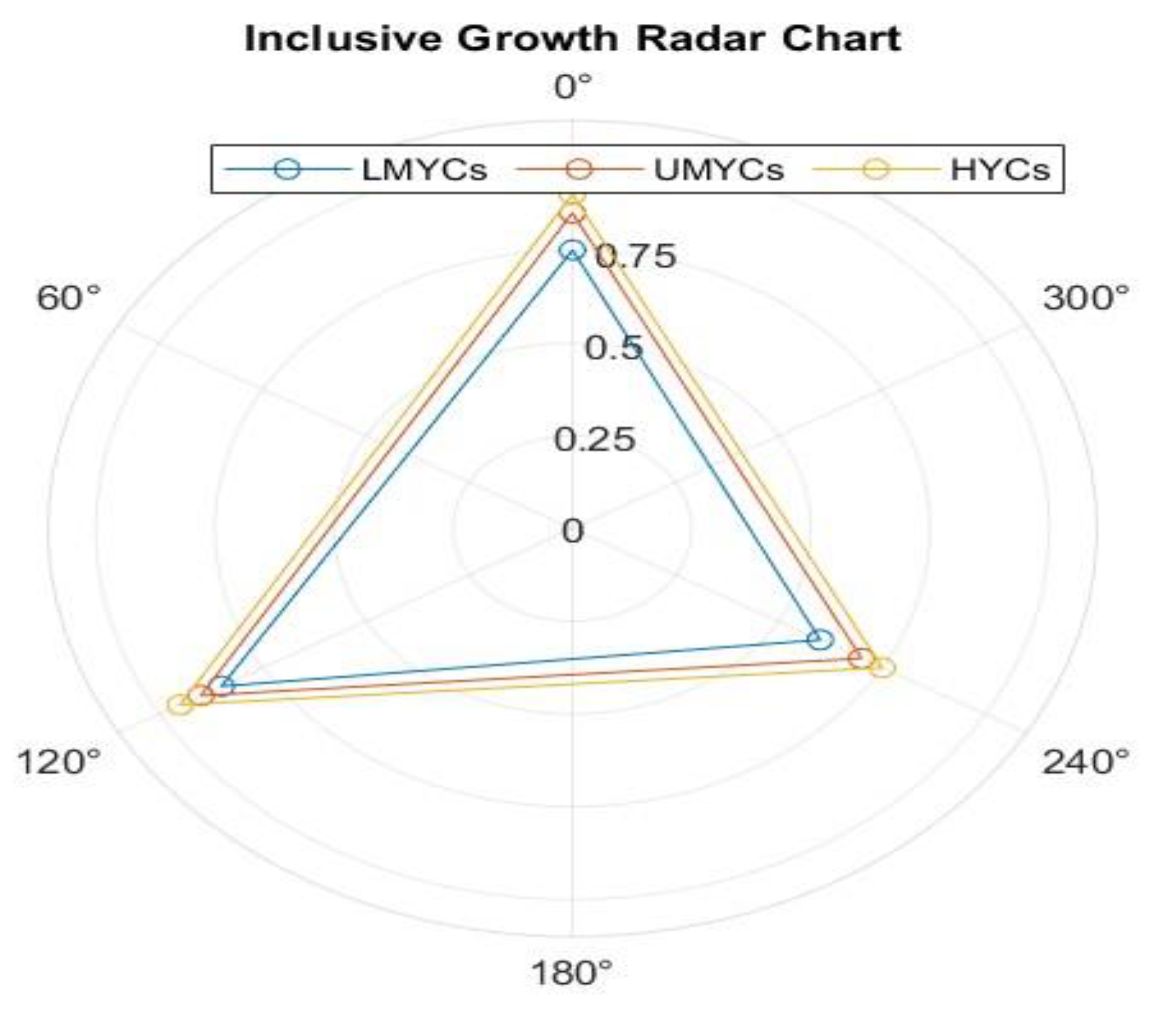
This study investigates how a range of economic, environmental, and social indicators have influenced the concept of inclusive growth in 19 member countries of the Asian Cooperation Dialogue over the period spanning from 1995 to 2021. To analyze these relationships, the research employs the Driscoll Kraay's Standard Errors regression technique, designed to account for factors such as cross-sectional dependence, hetero-scedasticity, and autocorrelation within the data. Furthermore, various preliminary tests were conducted to assess the data for cross-sectional dependence, slope heterogeneity, heteroscedasticity, and autocorrelation. Additionally, the Westerlund cointegration test was employed to evaluate the potential long-term equilibrium relationships among the variables. The findings reveal that the influence of independent variables on the dependent variable, which in this case is the level of inclusive growth (ING), differs significantly among three distinct income categories: lower-middle-income countries (LMYCs), upper-middle-income countries (UMYCs), and high-income countries (HYCs). Notably, the results underscore the overall statistical significance and robust fit of the regression model for all three income groups. One of the primary contribu-tions of this research is the provision of empirical evidence concerning the role played by fishery and aquaculture production in fostering inclu-sive growth in the Asian context. This research also highlights the trade-offs between economic development and environmental sustainability in terms of trade openness, agriculture, forestry and fishing, ecological footprint, and renewable energy utilization. Enhancing inclusive growth in Asia requires improving fishery and aquaculture management, diversifying economic activities, reducing ecological footprint, and increasing renewable energy utilization. The paper suggests some future work directions for extending the analysis to other regions and indicators, as well as incorporating dynamic panel data models and causality tests. The paper also suggests some policy implications for fostering inclusive growth in Asia through regional cooperation, capacity building, technology transfer and green financing.
Keywords:
Inclusive growth
; economic
; environmental
; and social indicators
; asian cooperation dialogue
; Driscoll Kraay’s standard errors regression
; fishery and aquaculture production
; tradeoffs between development and sustainability
; renewable energy utilization
1. Introduction
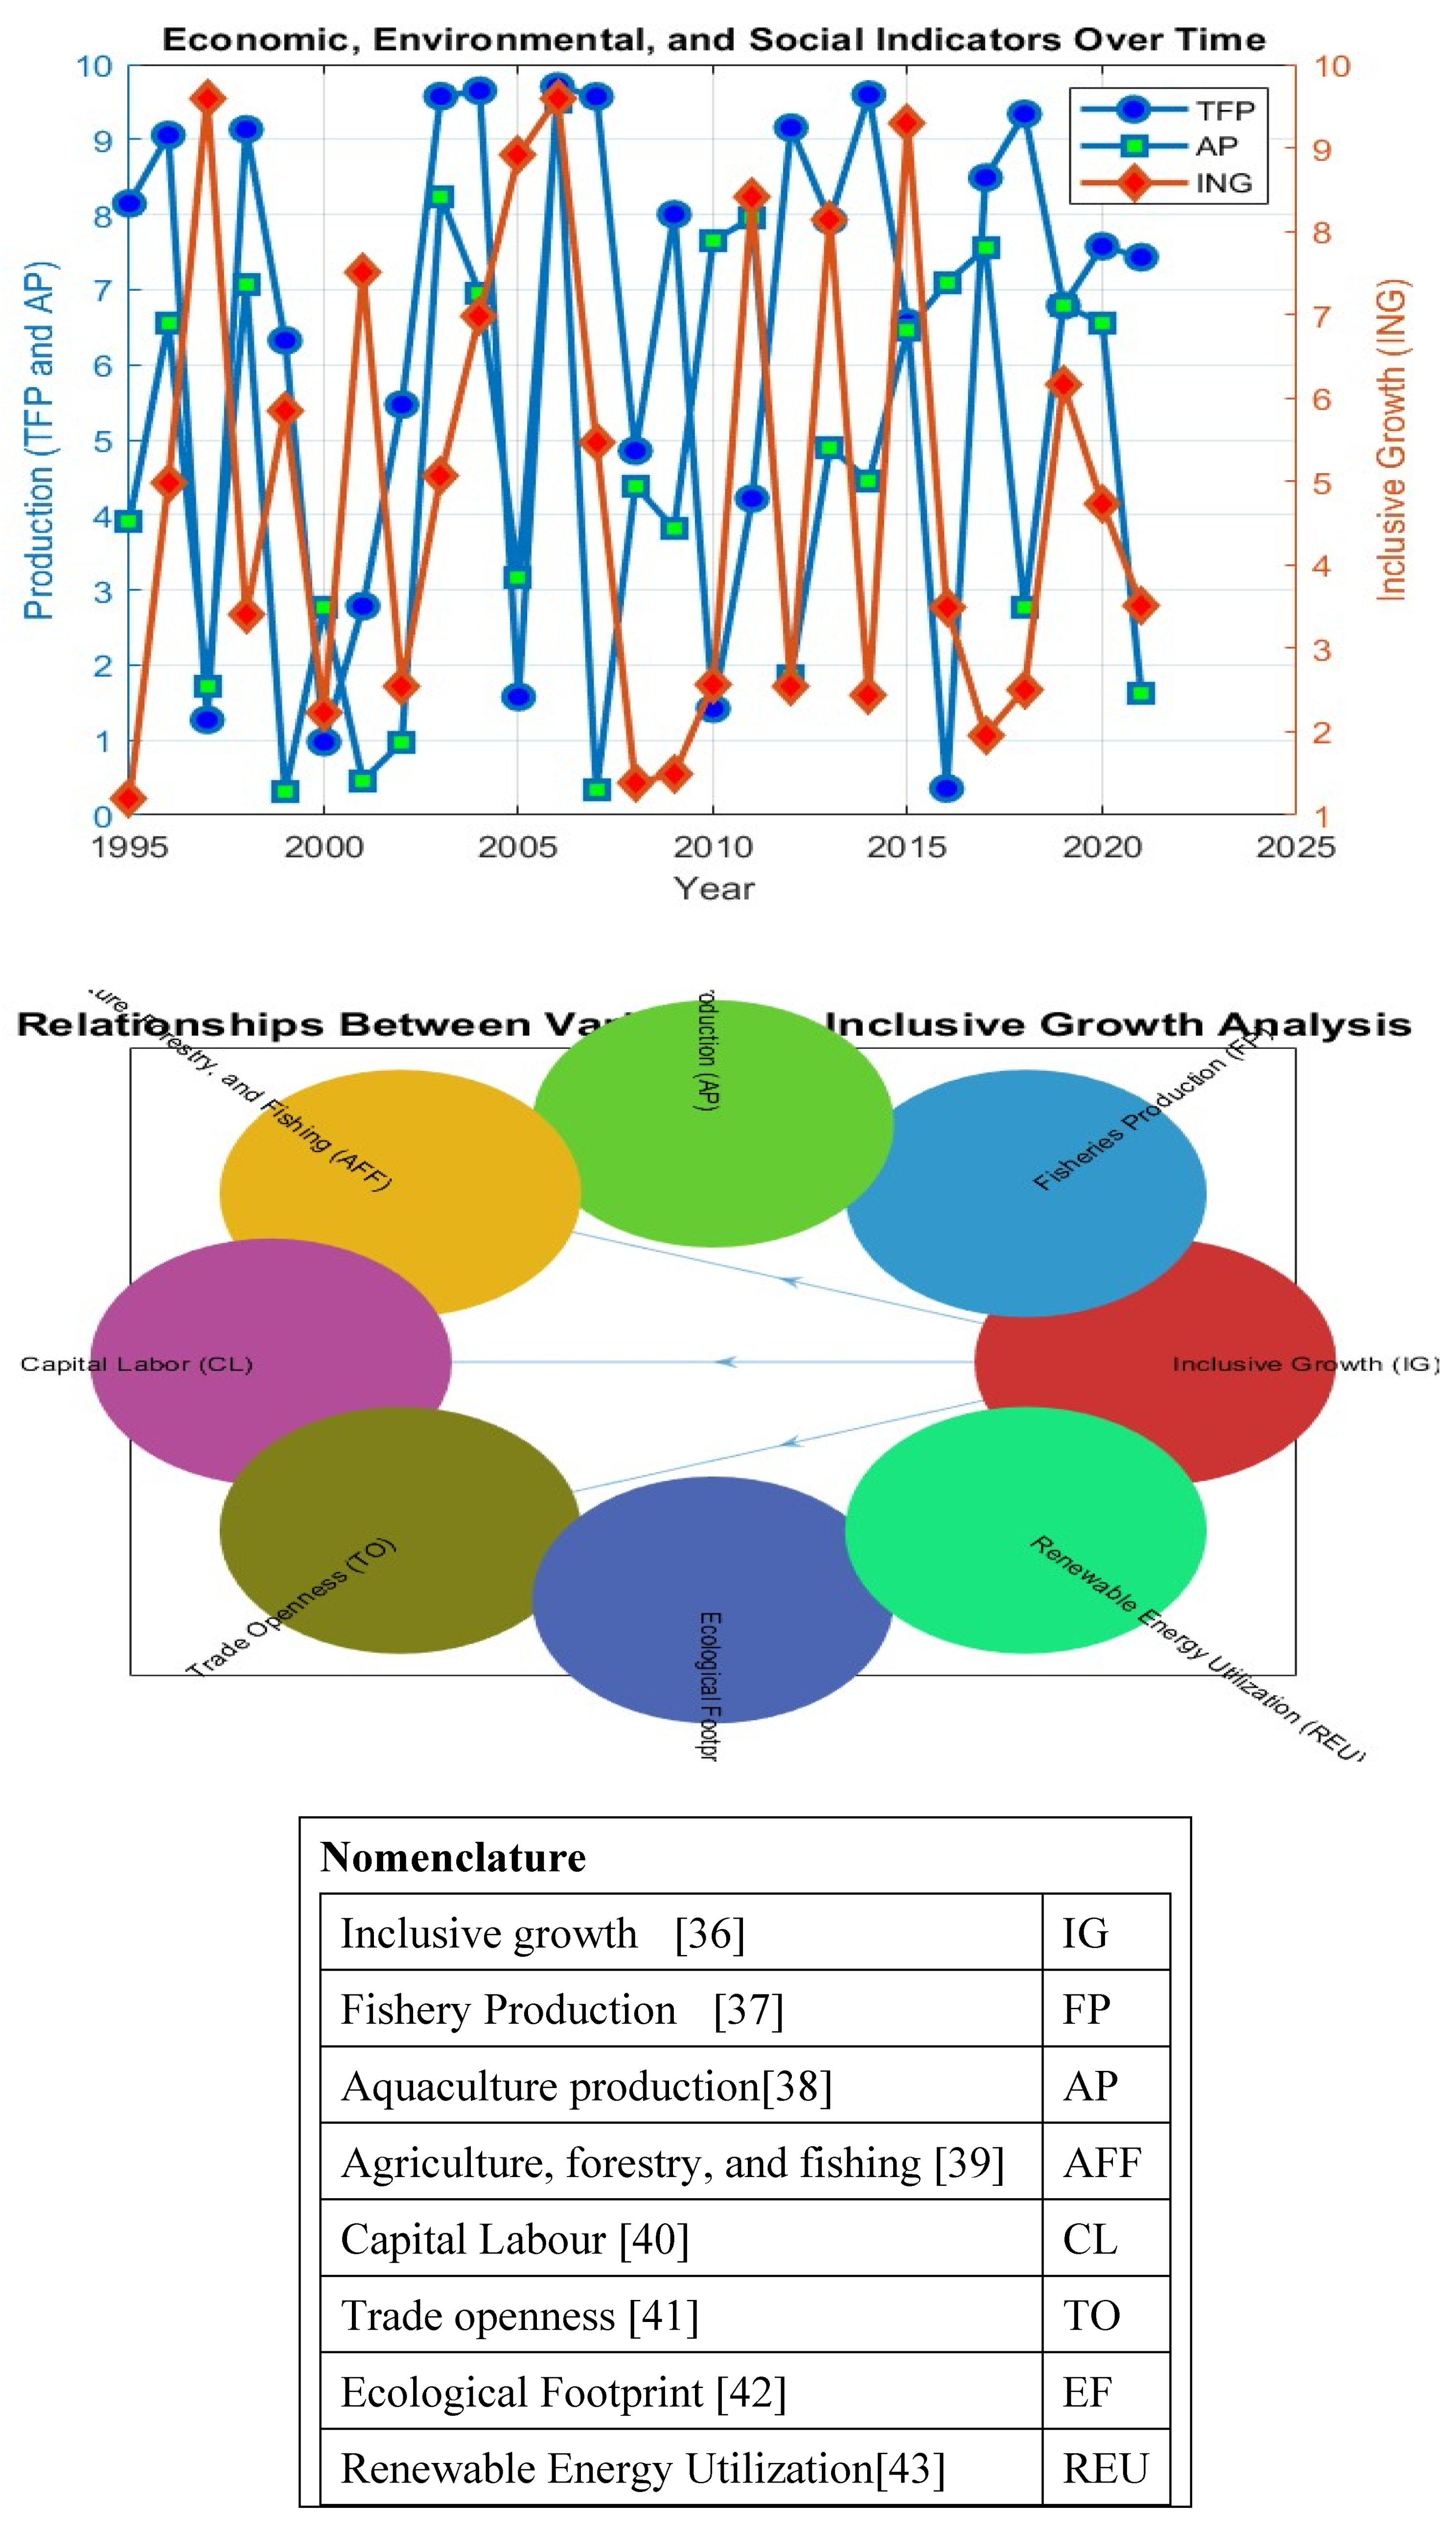
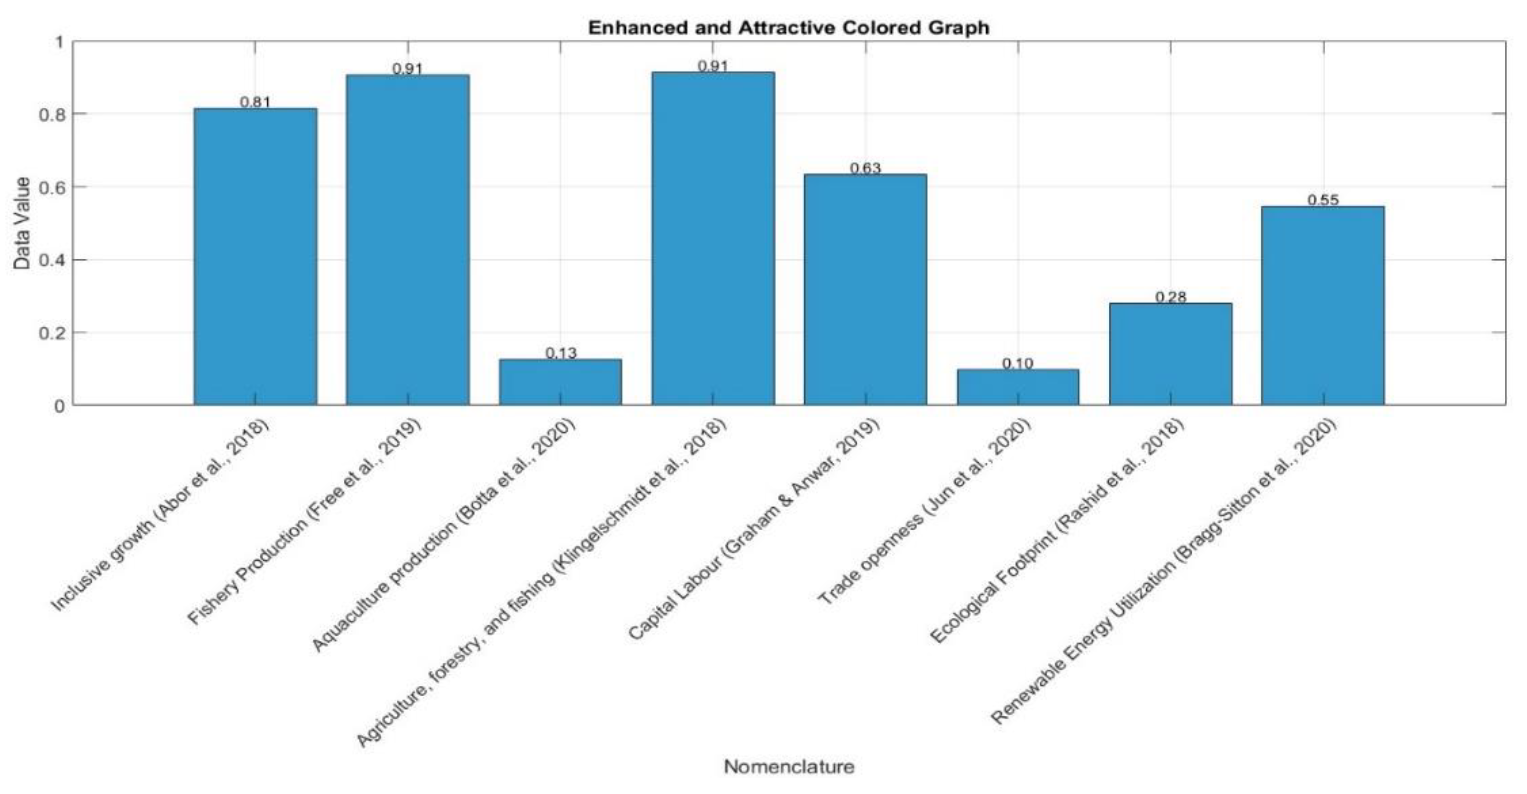
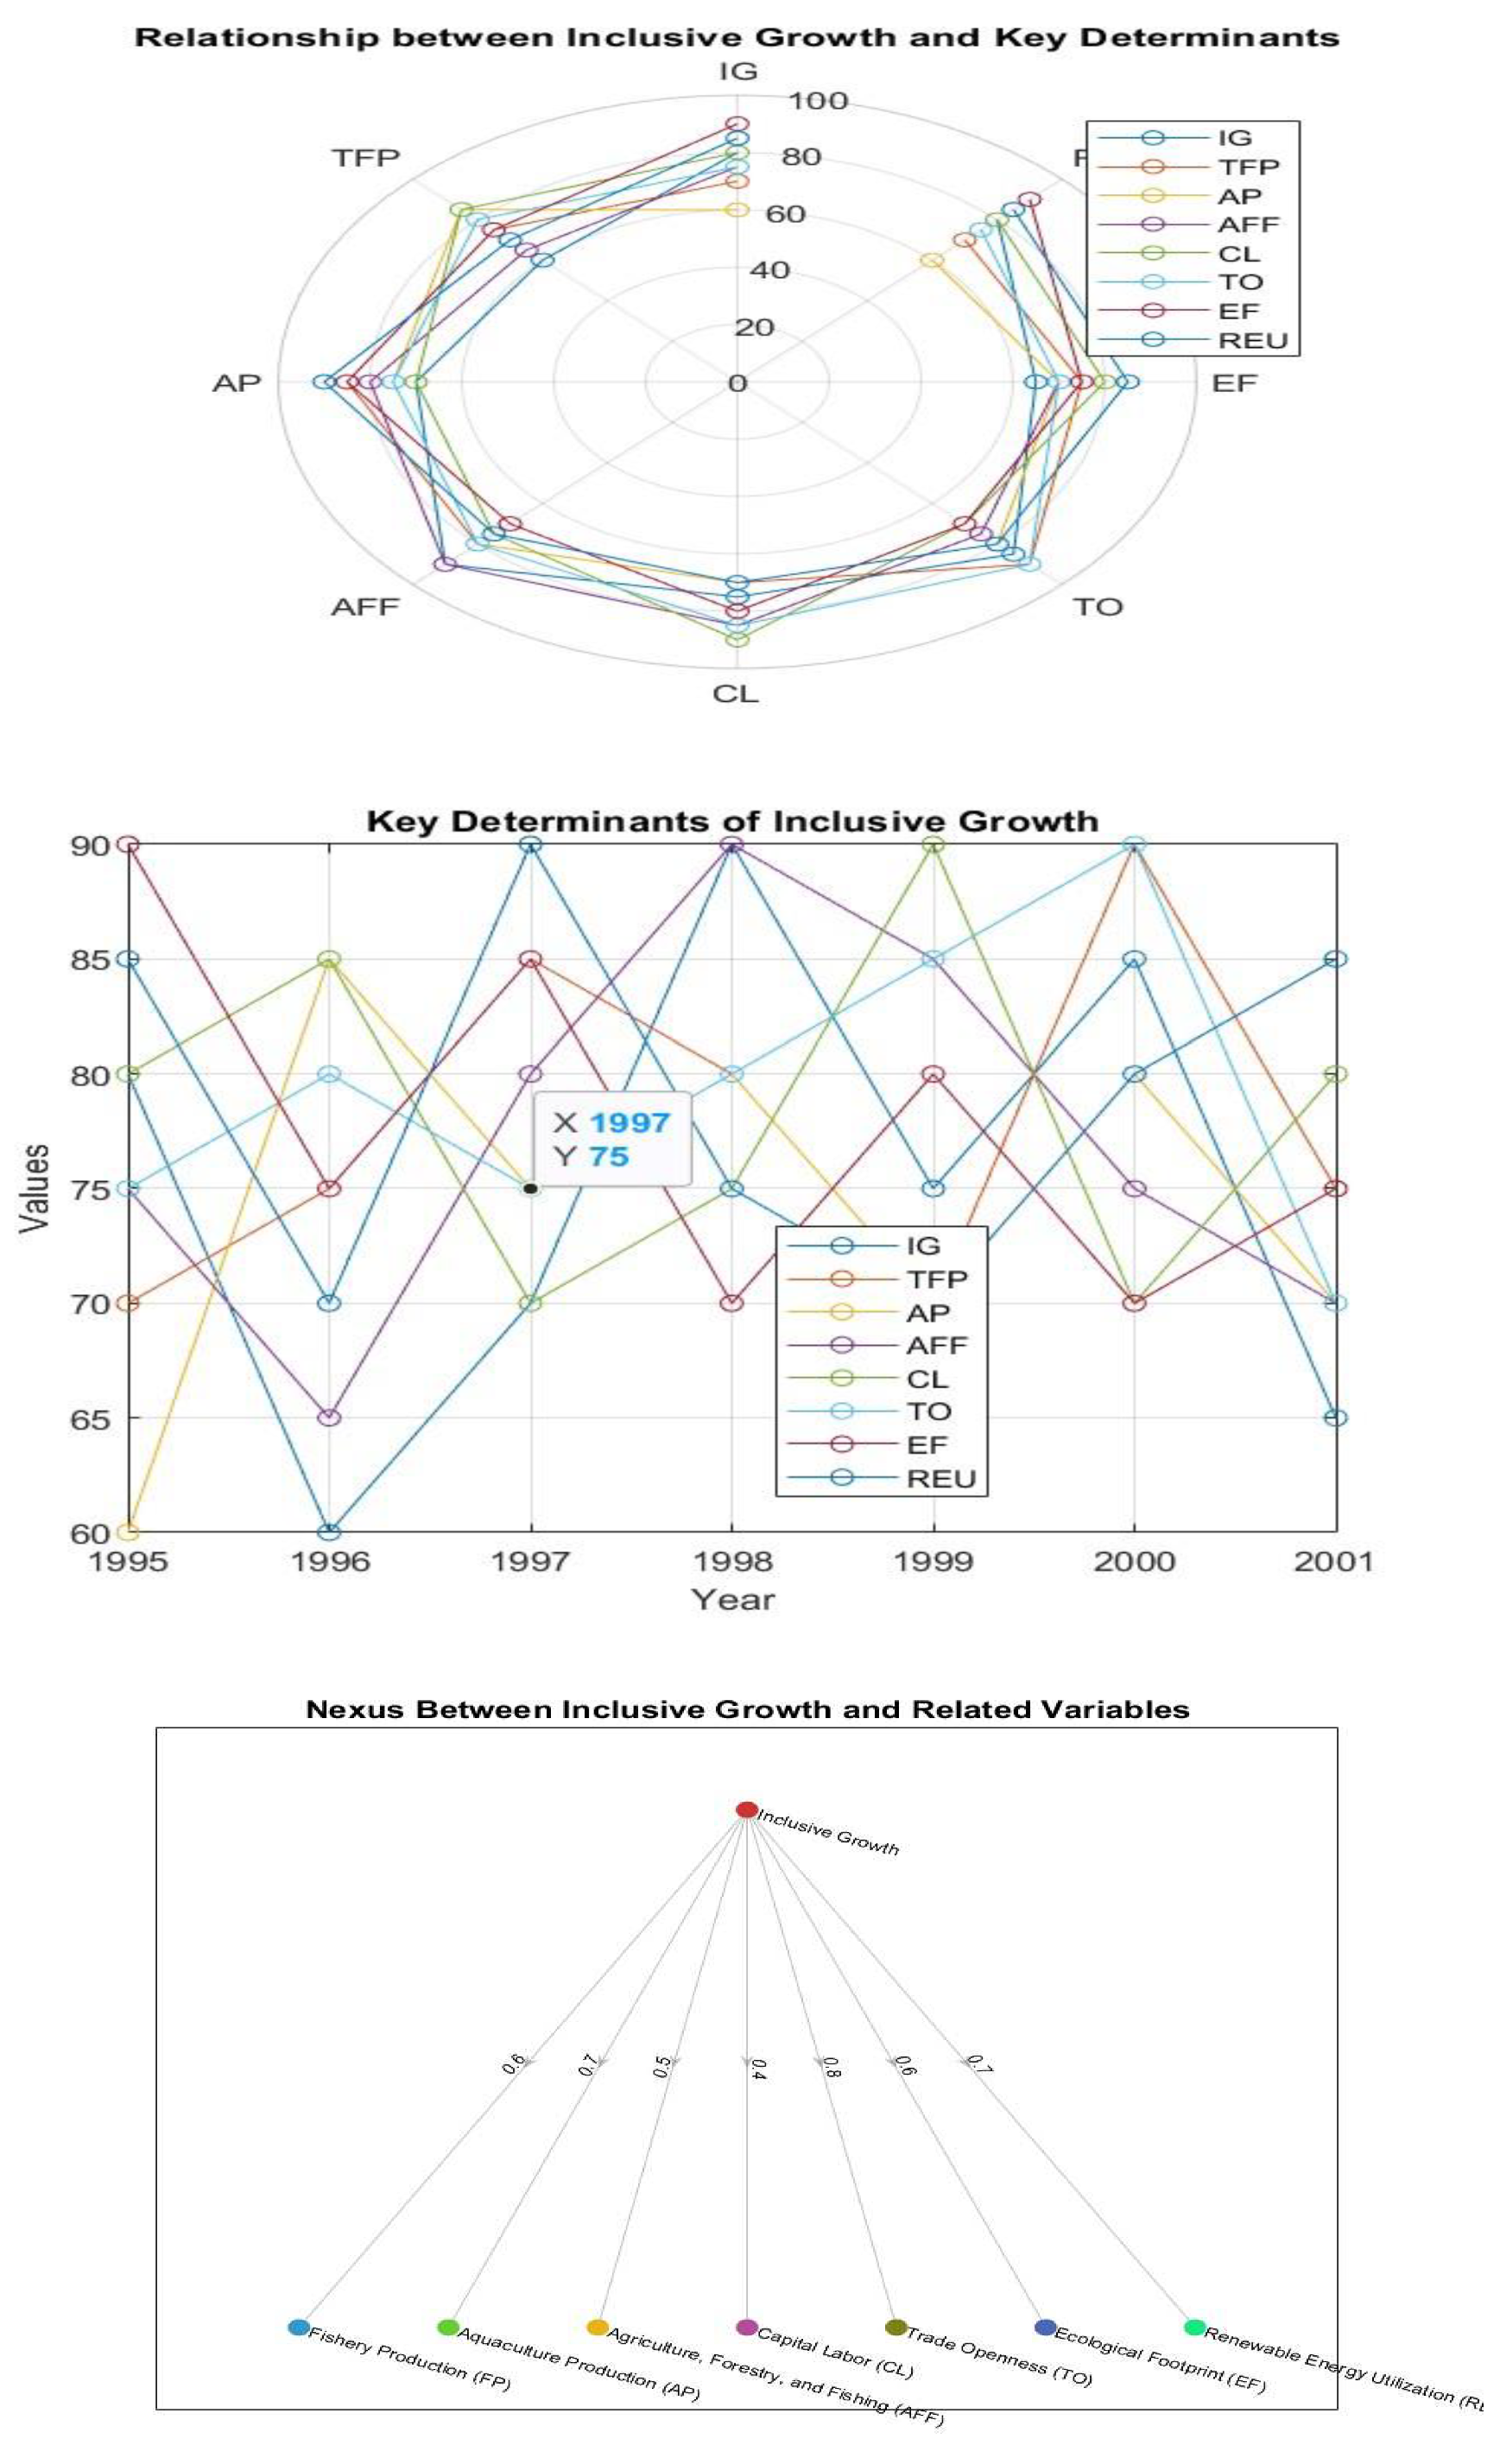
Inclusive growth is a concept that encompasses both the pace and the pattern of economic growth, which are interlinked and must be addressed together [1,2,3]. The aim of Inclusive Growth (IG) is to ensure equitable distribution of the benefits from economic advancement across society, offering opportunities for all, especially disadvantaged and marginalized groups. IG also posits that social cohesion and environmental sustainability can coexist with economic prosperity[4]. The fisheries sector, encompassing fishing, aquaculture, and related activities, stands as a potential contributor to IG. Millions of individuals worldwide, particularly in developing nations, rely on the fisheries industry for sustenance, income, and trade. Researchers estimate that in 2018, the global fish production reached 179 million tonnes, with aquaculture accounting for 82.1 million tonnes and capture fisheries for 96.4 million tonnes. In the same year, the industry employed 59.5 million people, including 20.5 million in aquaculture and 39 million in capture fisheries[5]. Additionally, fish and fish products provided 7% of total protein intake in 2017 and 17% of animal protein consumed globally. However, the fisheries sector faces numerous challenges such as overfishing, illegal practices, habitat degradation, climate change, pollution, diseases, market fluctuations, trade barriers, and socioeconomic disparities, which undermine its inclusivity and sustainability[6]. Collaborative efforts involving stakeholders at local, national, regional, and global levels are imperative to devise comprehensive solutions. Encouraging the establishment of inclusive and sustainable aquaculture systems can enhance food security, nutrition, income generation, and environmental conservation[7]. This article's primary objective is to analyze the relationships among various factors, including Fisheries Production (FP), Aquaculture Production (AP), Agriculture, Forestry, and Fishing (AFF), Capital Labour (CL), Trade Openness (TO), Ecological Footprint (EF), Renewable Energy Utilization (REU), and Inclusive Growth (IG) across 19 Asian countries within the Asia Cooperation Dialogue (ACD). The ACD is an intergovernmental organization fostering cooperation at a continental scale by coordinating various regional entities. The 19 ACD members included in this study are Afghanistan, Bangladesh, Bhutan, Brunei Darussalam, Cambodia, China, India, Indonesia, Iran, Japan, Kazakhstan, Korea, Malaysia, Mongolia, Pakistan, Philippines, Sri Lanka, Thailand, and Turkey. The main research gaps in the literature on the relationship between FP and IG are[8]: The lack of a comprehensive and comparative analysis of the impact of FP on IG across different Asian countries that are members of the ACD[9]. The lack of a spatial econometric approach that can account for the spatial dependence and heterogeneity among the countries in the region. The lack of a consideration of the potential channels and mechanisms through which FP affects IG, such as food security and nutrition, income generation and poverty reduction, employment creation and decent work, gender equality and women empowerment, environmental sustainability and climate resilience, and regional integration and cooperation[10,11].
The contribution of the current research is to fill these gaps by: Using panel data from 1995 to 2021 from various sources to examine the impact of FP on IG in 19 ACD members[12]. Employing a spatial Durbin model to analyze the direct and indirect effects of FP on IG while controlling for other factors such as AFF, CL, TO, EF, and REU. Exploring the potential channels and mechanisms through which FP affects IG and discussing the policy implications and recommendations for enhancing the contribution of FP to IG in Asia[13]. The research rationale of this study is to: Provide empirical evidence and insights on the role of FP in promoting IG in Asia, which is a region with high diversity, dynamism, and potential in both the fisheries sector and the economic development. Support the policy dialogue and cooperation among the ACD members on how to develop and manage the fisheries sector in a sustainable and inclusive way that can benefit all segments of society, especially the poor and marginalized groups[14]. Contribute to the literature on the nexus between FP and IG, which is an underexplored topic in the field of development economics. The paper will use panel data from 1995 to 2021 from various sources such as the World Bank4, the International Monetary Fund5, and the World Development Indicators. The paper will employ a spatial Durbin model to analyze the impact of FP on IG while controlling for other factors such as AFF, CL, TO, EF, and REU. The paper will also explore the potential channels through which FP affects IG such as food security and nutrition; income generation and poverty reduction; employment creation and decent work; gender equality and women empowerment; environmental sustainability and climate resilience; and regional integration and cooperation[10,11].
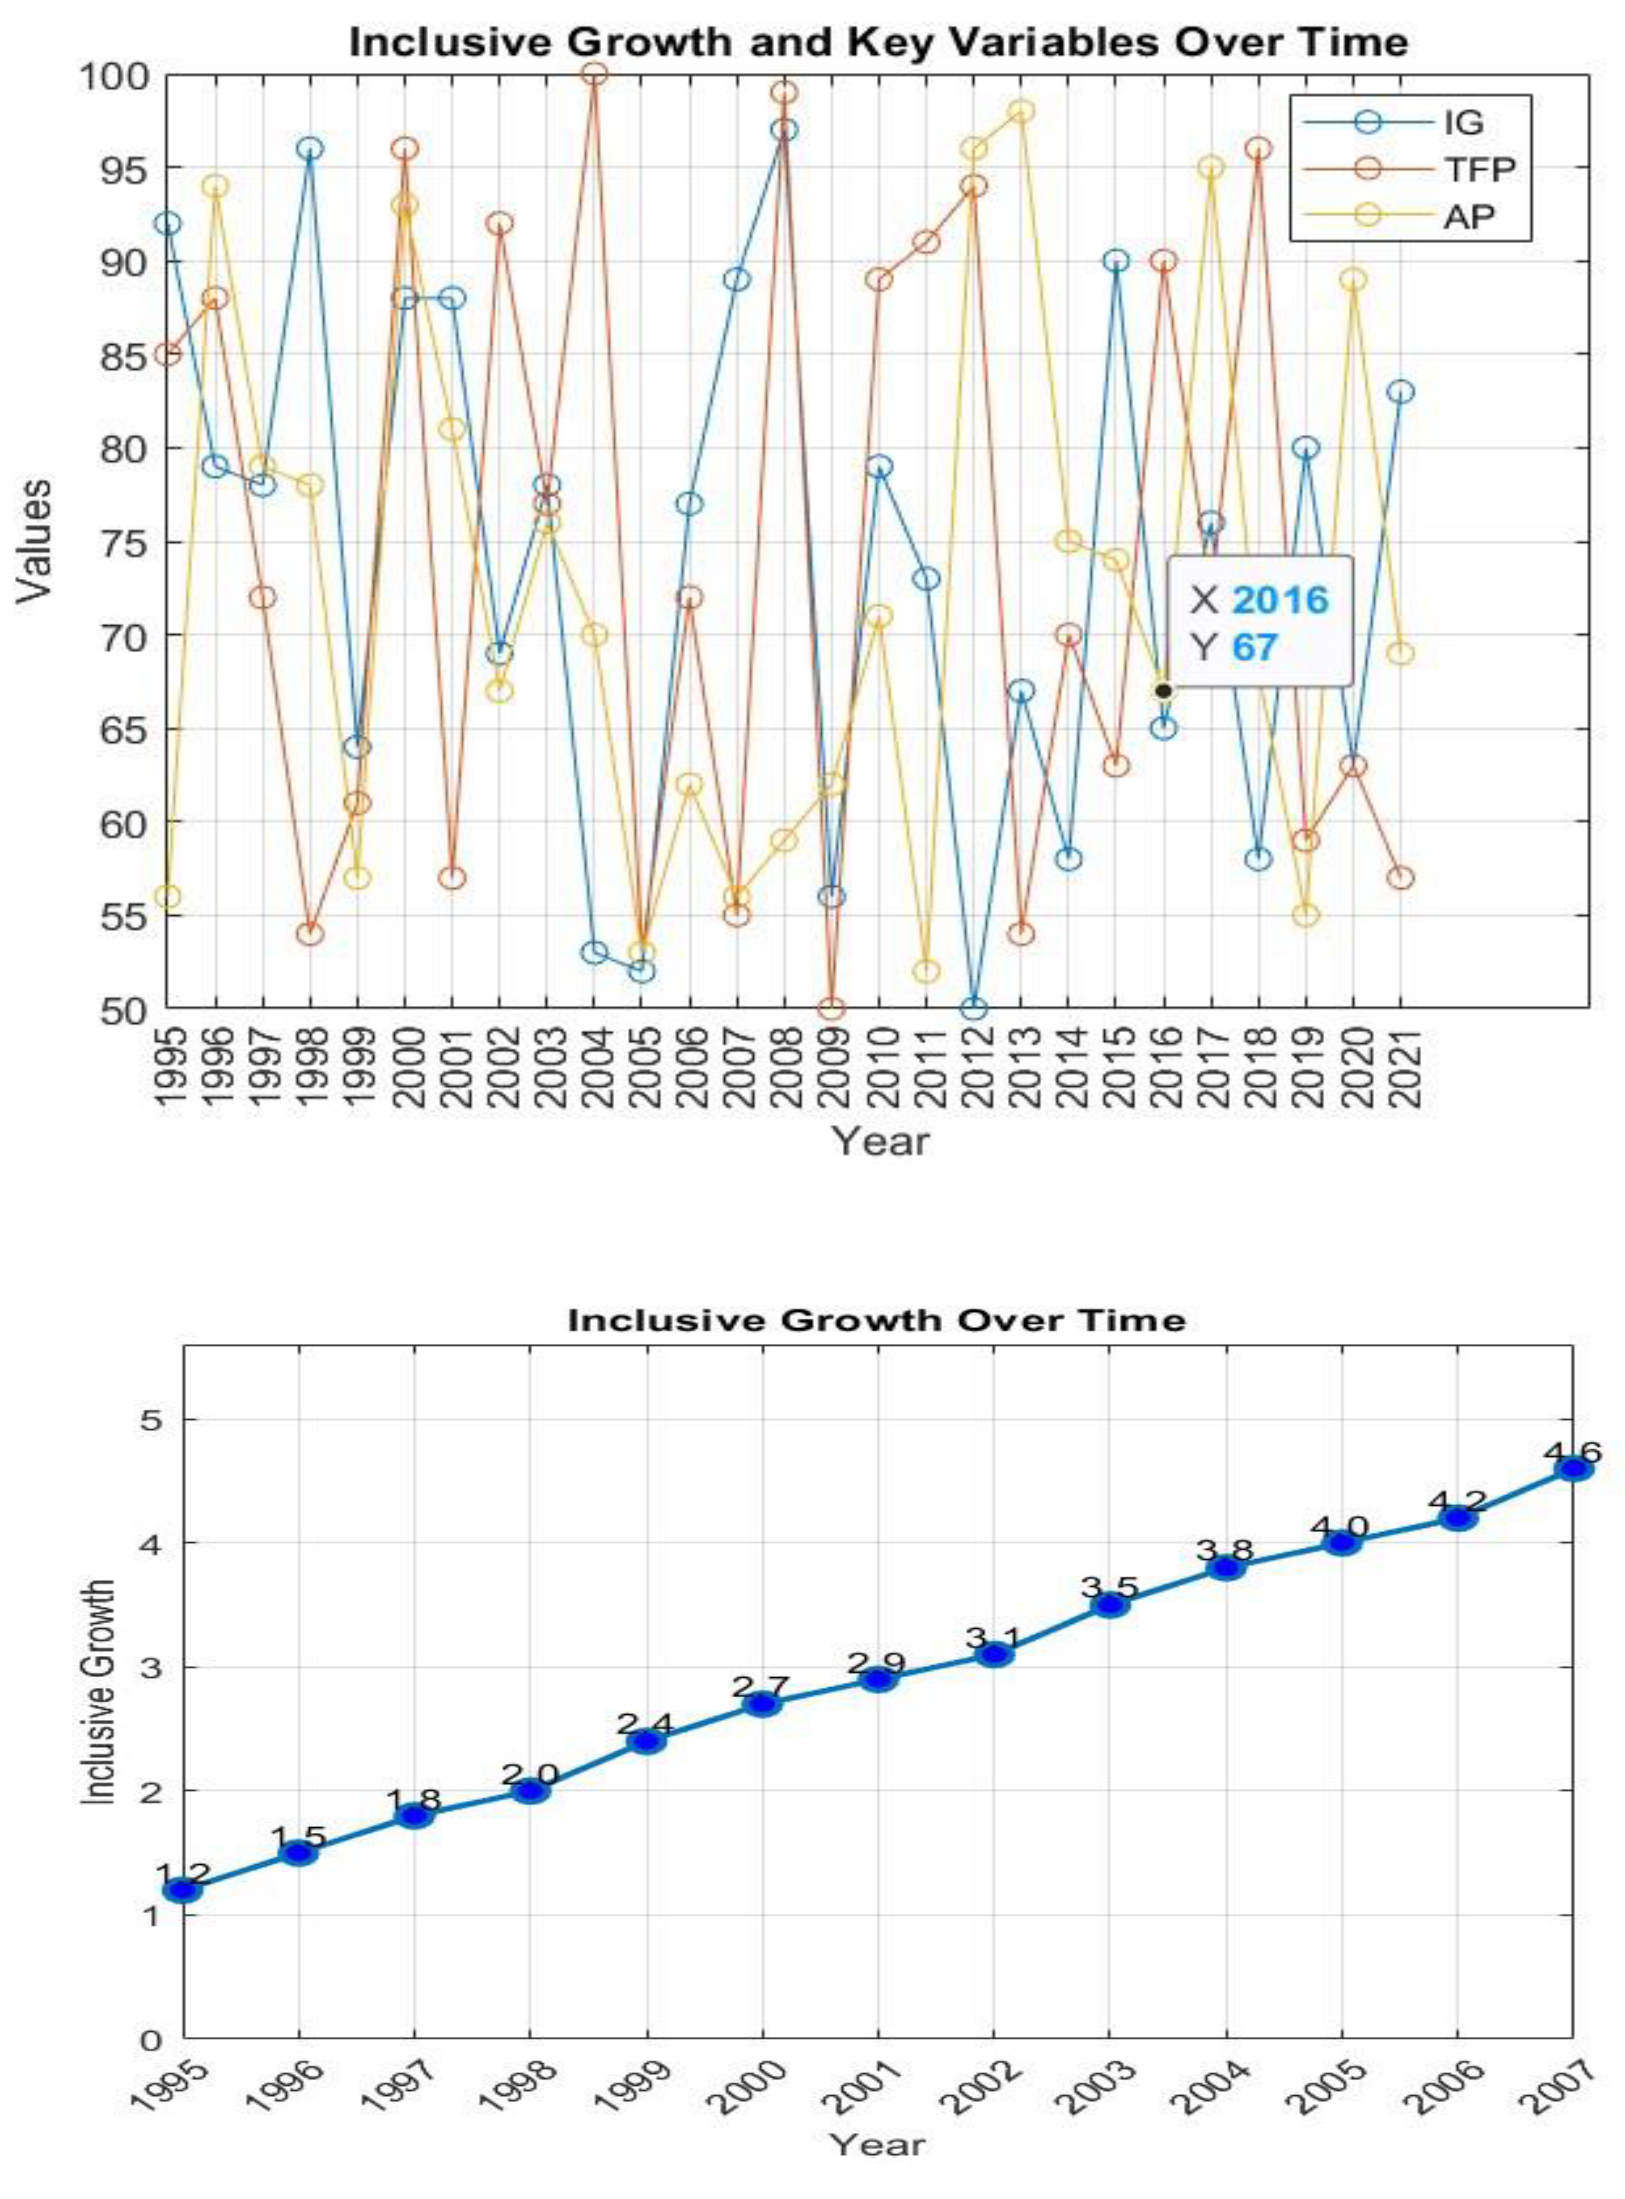
IG, which is a measure of how economic growth is distributed fairly across society and creates opportunities for all IG depends on various factors, such as the production and consumption of goods and services, the use and availability of natural resources, the trade and investment flows, and the environmental and social impacts of human activities[15]. IG is the dependent variable that captures the extent to which economic growth benefits all segments of society, especially the poor and marginalized groups. Inclusive Growth (IG) can be assessed using indicators like income inequality, the poverty rate, the human development index, coverage of social protection, and gender equality[16]. Total Factor Productivity (TFP) serves as an explanatory variable encompassing the combined contributions of capture fisheries and Aquaculture Production (AP) within a country or region. TFP signifies the fisheries sector's impact on dimensions like food security, nutrition, income generation, livelihoods, and trade. TFP's dynamics can be influenced by various factors, including natural resources, climate fluctuations, environmental degradation, market volatility, trade hindrances, and policy interventions. Aquaculture Production (AP), on the other hand, constitutes an autonomous variable representing the cultivation of aquatic organisms like fish[17], crustaceans, mollusks, and plants. It constitutes a subset of TFP and stands out as one of the fastest-growing segments in global food production. AP carries the potential to bolster food security, improve nutrition, boost income, and contribute to environmental conservation[18]. Nonetheless, it grapples with challenges such as diseases, pollution, competition for land and water resources, social conflicts, and governance issues[19].
Agriculture, Forestry, and Fishing (AFF) represent an independent variable capturing the value added by these sectors to a country or region's gross domestic product (GDP). AFF reflects the significance of these sectors in terms of economic development[20], rural livelihoods, natural resource management, and efforts related to climate change mitigation and adaptation. The performance of AFF can be shaped by factors such as land utilization, water availability, soil quality, biodiversity, technological advancements, innovation, market accessibility, and policy backing[21]. Capital Labour (CL) acts as an independent variable signifying the ratio of capital stock to the labor force within a country or region[22]. It offers insights into the level of capital intensity and labor productivity prevalent in an economy. CL can exert influence over an economy's potential for economic growth, income distribution, employment generation, and structural transformation. Its determination hinges on factors like the investment rate, savings rate, depreciation rate, population growth rate, human capital development, technological advancements, and institutional quality[23].
Trade Openness (TO), another variable, quantifies the extent to which a country or region integrates with the global economy.TO can be measured by indicators such as trade intensity (the ratio of exports plus imports to GDP), trade diversification (the variety of export products and markets), trade liberalization (the reduction of trade barriers), and trade facilitation (the simplification of trade procedures). [24] TO can have positive effects on economic growth, efficiency, innovation, competition, and consumer welfare, but it can also have negative effects on income inequality, environmental degradation, social disruption, and policy autonomy[25]. EF is an independent variable that represents the amount of biologically productive land and water area required to produce the goods and services consumed by a person or a population and to absorb their waste. EF reflects the environmental impact and sustainability of human activities[26]. EF can be compared with biocapacity (the productive area available within a region or the world) to assess the ecological deficit or surplus of a person or a population. EF can be influenced by factors such as consumption patterns, production methods, resource efficiency, waste management, population size, and lifestyle choices. REU is an independent variable that represents the share of renewable energy sources (such as solar, wind, hydro, biomass, geothermal, tidal ) in total energy consumption or production in a country or region[27]. Renewable Energy Utilization (REU) signifies the role of renewable energy in bolstering energy security, promoting diversification, ensuring affordability, expanding access, and safeguarding the environment. Total Factor Productivity (TFP) and Inclusive Growth (IG): Enhanced Fisheries Production (FP) has the potential to augment food security, nutrition, income, and trade, particularly benefiting poor and marginalized populations. Nonetheless, FP can also entail environmental and social repercussions, such as overfishing, habitat degradation, pollution, and socioeconomic disparities[28]. Consequently, the connection between TFP and IG hinges on how FP is sustainably managed and equitably distributed. Aquaculture Production (AP) and Inclusive Growth (IG): AP can make a valuable contribution to IG by strengthening food security, nutrition, income generation, and environmental conservation[29]. Nevertheless, AP encounters its own set of challenges, including disease outbreaks, pollution concerns, competition for land and water resources, social disputes, and governance issues. Thus, the interrelation between AP and IG is contingent upon the sustainable and inclusive development and regulation of AP practices. Agriculture, Forestry, and Fishing (AFF) and Inclusive Growth (IG): AFF can play a pivotal role in advancing IG through its contributions to economic development, rural livelihoods, natural resource management, and efforts related to climate change mitigation and adaptation[30]. However, these sectors are not immune to obstacles such as land degradation, water scarcity, biodiversity depletion, technological disparities, limited market access, and policy support gaps. Consequently, the nexus between AFF and IG hinges on how these sectors are diversified and integrated in a sustainable and inclusive manner[31].
Capital Labour (CL) and Inclusive Growth (IG): CL has the potential to bolster IG by enhancing the economic growth prospects, improving income distribution, creating employment opportunities, and facilitating structural transformation within an economy[32]. Nevertheless, CL also confronts challenges relating to factors like investment rates, savings rates, depreciation rates, population growth rates, human capital development, technological advancements, and institutional quality. Consequently, the interconnection between CL and IG relies on the productive and inclusive allocation and utilization of CL resources. TO and IG: TO can contribute to IG by enhancing economic growth, efficiency, innovation, competition, and consumer welfare[33]. However, TO can also have negative effects on income inequality, environmental degradation, social disruption, and policy autonomy. Therefore, the nexus between TO and IG depends on how TO is balanced and complemented with other policies in a fair and inclusive way. EF and IG: EF can affect IG by reflecting the environmental impact and sustainability of human activities[34]. A high EF can indicate a high consumption of natural resources and a high generation of waste that can harm the environment and reduce the opportunities for future generations. Therefore, the nexus between EF and IG depends on how EF is reduced and offset in a responsible and inclusive way. REU and IG: REU can contribute to IG by enhancing energy security, diversification, affordability, access, and environmental protection. However, REU can also face challenges such as natural resource endowment, technological development, cost competitiveness, policy incentives, public awareness, and social acceptance [35]. Therefore, the nexus between REU and IG depends on how REU is promoted and supported in a sustainable and inclusive way. The paper is organized as follows: Section 2 provides a literature review on the concepts of IG and FP and their linkages. Section 3 describes the data sources and methodology used in the empirical analysis. Section 4 presents the results and discussion of the spatial Durbin model. Section 5 concludes with some policy implications and recommendations for enhancing the contribution of FP to IG in Asia.
2. Literature Review
In the existing body of literature, the concept of IG has gathered substantial attention due to its critical role in fostering equitable development and improving the living standards of the populace[44,45]. This section delves into the relevant research, highlighting the key determinants and factors associated with IG within the context of 19 Asia Cooperation Dialogue (ACD) member countries[46]. IG serves as our central dependent variable, representing the overarching objective of balanced economic development that benefits all segments of society. FP: The fisheries sector can significantly contribute to IG when effectively managed and harnessed. AP: The expansion of AP has been shown to enhance economic inclusivity, particularly in coastal regions of ACD member countries. AFF: Studies such as [47] have explored the integral role of AFF in promoting IG by creating livelihood opportunities and addressing food security[48]. CL Ratio: The optimal allocation of capital and labor resources is crucial for achieving IG. TO: Research conducted by [49] suggests that greater TO can facilitate IG by expanding market access and promoting economic integration. EF: Investigating the EF, as done by[50] is essential for ensuring that economic growth remains sustainable and does not harm the environment, which is integral to inclusivity. REU: The adoption of renewable energy sources, as demonstrated in studies such as not [51] only contributes to IG but also addresses environmental concerns. Motivated by the inherent income disparities among ACD member countries, this study employs an income-based classification, categorizing them into three distinct panels. This classification will enable us to tailor our analysis and policy implications according to the economic conditions of each group[52,53].
IG is a concept that refers to the idea of achieving economic growth that benefits all segments of society and reduces inequalities and poverty. There are many factors that can influence the level [54] and quality of IG, such as the production and consumption of different sectors, the availability and allocation of capital and labor, the degree of openness to trade and foreign investment, the impact on the environment and natural resources, and the utilization of renewable energy sources[55]. In this response, the researchers will try to write a detailed nexus between IG and the following variables: total FP, AP, AFF, CL, TO, EF, and REU[56].
Total Fisheries Production (TFP) encompasses both capture fisheries, involving the harvesting of wild aquatic organisms from natural water bodies, and Aquaculture Production (AP), which entails the controlled farming of aquatic organisms. The holistic impact of TFP on Inclusive Growth (IG) unfolds in various ways[57]. Firstly, it plays a pivotal role in ensuring food security and nutrition, particularly in developing nations where fish constitutes a significant source of animal protein[58]. Secondly, TFP acts as a catalyst for income generation and employment, benefitting fishers, farmers, processors, traders, and various stakeholders throughout the value chain. Thirdly, it contributes to foreign exchange earnings and trade balance by facilitating the export of fish and fish-related products. Additionally, it fosters the growth of ancillary sectors like tourism, transportation, and manufacturing through interlinkages and ripple effects[59]. However, the potential of TFP to impact IG is not devoid of caveats. Unsustainable management practices can lead to adverse consequences. Overfishing, pollution, habitat degradation, climate change, and the proliferation of invasive species pose threats to the health and productivity of aquatic ecosystems, diminishing their resilience and adaptability. This, in turn, jeopardizes biodiversity, the provisioning of ecosystem services, livelihoods, and overall social well-being[60].
Aquaculture Production (AP), a component within TFP, concentrates on the cultivation of aquatic organisms. AP emerges as a driver for enhancing IG through various avenues. It augments the supply and diversity of aquatic products, reducing the strain on capture fisheries[61]. Furthermore, AP generates employment opportunities and income for rural communities, elevates standards of food safety and quality, promotes innovation and knowledge dissemination, and exhibits an eco-friendlier profile in terms of greenhouse gas emissions compared to alternative animal production systems[62]. However, AP can also pose challenges for IG if it is not practiced in an environmentally friendly and socially responsible manner. AP can cause environmental problems such as water pollution, eutrophication, disease outbreaks, genetic contamination, and land use conflicts. It can also create social problems such as displacement of local communities, violation of human rights, unfair distribution of benefits and costs, and increased vulnerability to market fluctuations[63].
AFF are three interrelated sectors that produce food, fiber, fuel, and other goods from natural resources[64]. Agriculture refers to the cultivation of crops and livestock on land; forestry refers to the management of trees and forests for various purposes; fishing refers to the harvesting of wild or farmed aquatic organisms from water bodies. AFF can support IG by providing food security and nutrition for billions of people; generating income and employment for hundreds of millions of people; contributing to foreign exchange earnings and trade balance through exports[65]; enhancing rural development and poverty reduction; fostering innovation and technology adoption; preserving cultural heritage and traditional knowledge; enhancing resilience to shocks and disasters; maintaining ecosystem services such as carbon sequestration, water regulation, and biodiversity conservation. However, AFF can also hinder IG if they are not conducted in a sustainable and equitable way[66]. AFF can cause environmental degradation such as soil erosion, deforestation, desertification, water scarcity[67], pollution, greenhouse gas emissions, and loss of biodiversity. They can also create social problems such as land conflicts, inequality, exploitation, marginalization, and human rights violations[68].
Capital labor i.e., CL is a term that refers to the two main factors of production in an economy: capital and labor[69]. Capital is the stock of physical assets such as machinery, equipment, buildings, and infrastructure that are used to produce goods and services[70]. Labor is the human input that provides skills, knowledge, effort, and time to produce goods and services. CL can influence IG by affecting the quantity and quality of output and income in an economy. CL can enhance IG by increasing productivity and efficiency; promoting innovation and technological progress; creating more and better jobs; improving wages and living standards; stimulating investment and savings; enhancing human capital development and education; reducing poverty and inequality; strengthening social protection and welfare systems[71]. However, CL can also undermine IG if there are market failures or institutional barriers that prevent optimal allocation or utilization of CL resources. CL can hamper IG by creating unemployment or underemployment; worsening income distribution or social mobility; causing market distortions or rent-seeking behaviors; creating environmental externalities or public bads; eroding human capital or social capital; increasing vulnerability or insecurity[72].
Trade openness i.e., TO is a measure of the degree to which an economy is integrated with the global market through trade and investment[73]. TO can affect IG by influencing the availability and affordability of goods and services in an economy. TO can foster IG by expanding market access and opportunities; enhancing competition and efficiency; lowering prices and increasing consumer welfare; encouraging diversification and specialization; facilitating technology diffusion [74] and learning; promoting economic growth and development; supporting regional integration and cooperation; contributing to global public goods and governance. However, TO can also pose challenges for IG if there are trade barriers or imbalances that distort trade flows or outcomes[75]. TO can hinder IG by exposing an economy to external shocks or volatility; creating trade deficits or surpluses; causing trade diversion or displacement; generating winners and losers; creating adjustment costs or distributional effects; affecting environmental sustainability or social cohesion[76].
The Ecological Footprint (EF) quantifies humanity's reliance on Earth's natural resources and ecosystems. It computes the amount of biologically productive land and water area needed to generate the resources consumed by a population and manage the waste it produces, expressed in global hectares per individual (Hassan et al., 2019). EF can impact Inclusive Growth (IG) by mirroring the environmental effects and sustainability of economic endeavors within a specific economy. It can bolster IG by indicating the efficient and accountable utilization of natural resources and ecosystems, endorsing sustainable and circular economic models, encouraging the adoption of low-emission and enduring energy sources, minimizing waste and pollution, enhancing environmental health and well-being (Hassan et al., 2023), conserving natural resources and biodiversity, upholding fairness and justice across generations (Helm, 2019). However, when EF surpasses Earth's biocapacity or its capability to regenerate and provide ecosystem services, it can undermine IG. EF can obstruct IG by exposing the excessive use and deterioration of natural resources and ecosystems, resulting in an ecological deficit or overshoot, escalating greenhouse gas emissions and climate change, causing environmental issues and hazards, diminishing human well-being and welfare, exhausting natural resources and biodiversity, and jeopardizing equity and justice across generations (Pörtner et al., 2021).
Renewable Energy Utilization (REU) evaluates the proportion of renewable energy sources within an economy's total energy consumption (Dinh et al., 2021). Renewable energy sources are those harnessed from natural processes that renew themselves at a pace equal to or faster than their consumption rate, like solar, wind, hydro, biomass, geothermal, and ocean energy (Rahman et al., 2022).
REU can affect IG by influencing the availability and affordability of energy services in an economy[77]. REU can enhance IG by increasing energy supply and security; reducing energy dependence and vulnerability; lowering energy costs and prices; improving energy access and quality; stimulating innovation and technology development; creating jobs and income opportunities; reducing greenhouse gas emissions and environmental impact; improving health and social benefits[78]. However, REU can also face challenges for IG if there are technical, economic, institutional, or social barriers that hinder its development and deployment[79]. REU can hinder IG by facing intermittency or variability; requiring high upfront investment or subsidies; encountering infrastructure or grid constraints; facing policy or regulatory uncertainty or inconsistency; encountering social or cultural resistance or opposition[80,81].
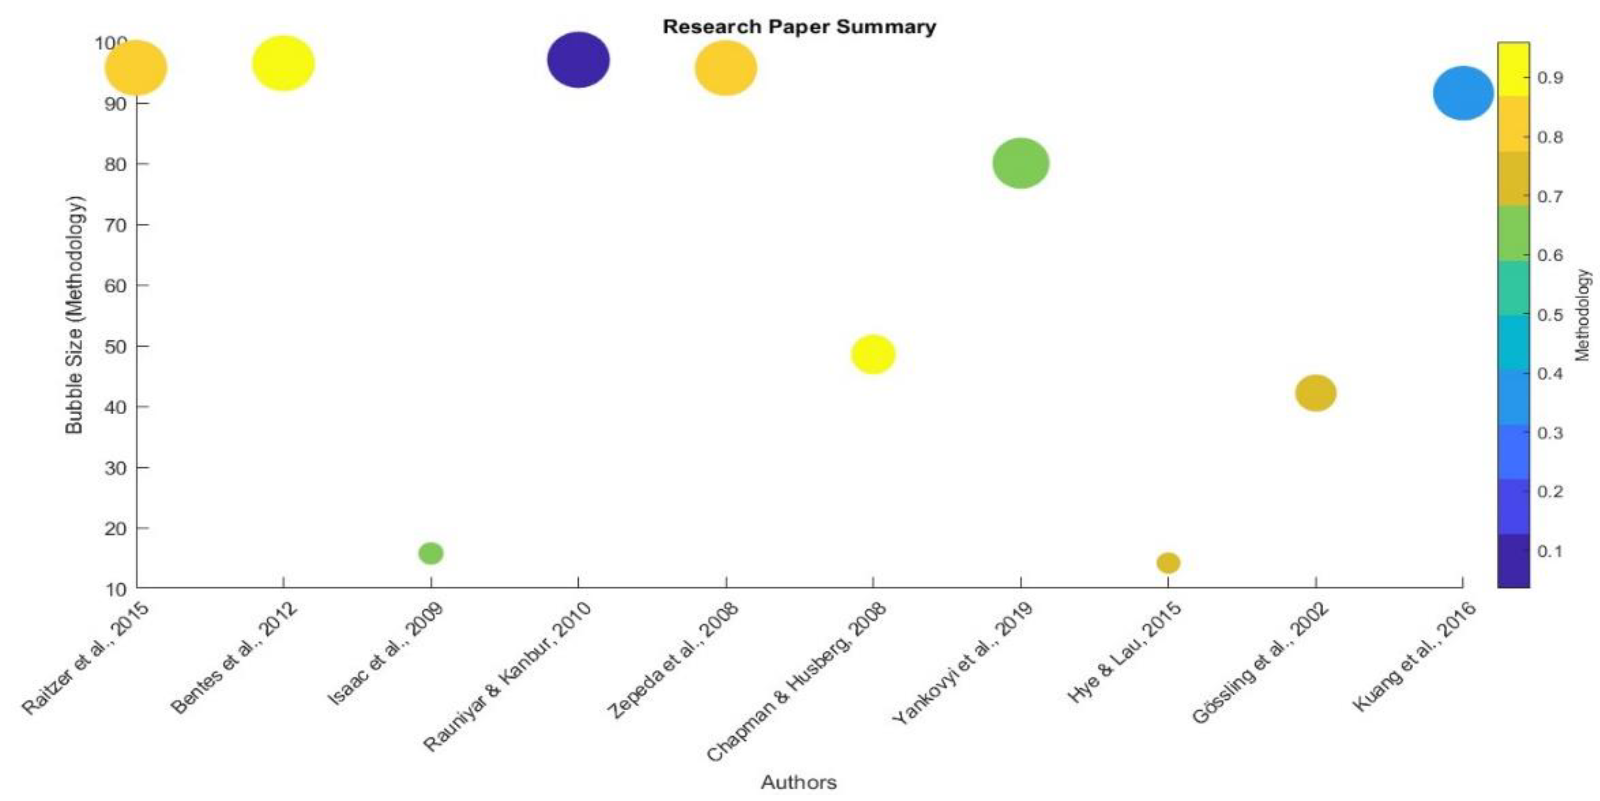
2.1. Details of previous research
| Author(s) | Variables | Methodology | Findings |
| [82] | Inclusive growth | Mixed methods | The agricultural industry in Myanmar has a lot of untapped potential for promoting fair economic growth, but it requires targeted investments, better infrastructure, and long-term planning to address productivity issues and properly use its competitive advantages. |
| [83] | Fishery Production | Field Surveys | A multidisciplinary approach was used to classify 20 different fishery production systems into 10 different groups based on ecological, economic, social, technological, and political factors, showing the complexity of artisanal fishing in the area and providing useful information for customized management and development strategies. |
| [84] | Fishery Production system | Grouping Analysis | The “RAPFISH” methodology was used to evaluate 20 fishery production systems off the coast of Pará, Brazil, and three main groups were identified: industrial and semi-industrial fisheries that show economic and social sustainability, large-scale artisanal fisheries that show ecological sustainability, and small-scale artisanal fisheries. Some of the recommendations are reducing industrial fishing activities, implementing licensing quotas, funding research for semi-industrial and large-scale artisanal fisheries, offering financial incentives for small-scale artisanal fisheries, and encouraging stakeholder involvement in decision-making. |
| [85] | Inclusive growth | Content analysis | While a consensus definition of inclusive growth is still hard to find, it is clear from a review of ADB’s well-founded knowledge products that it is generally understood to mean “growth with equal opportunities” including economic, social, and institutional aspects. Major suggestions emphasize the need of interdisciplinary strategies, such as the encouragement of sustainable economic growth, guaranteeing fair political involvement, and supporting social safety nets and capacity-building initiatives to promote inclusive growth and development. |
| [86] | Aquaculture production | Case studies | The research emphasizes that while compartmentalization offers a promising strategy for disease management, its successful implementation in aquaculture depends on aligning with the specific production system and disease epidemiology, implying that it may not be universally applicable, and underscores the importance of integrating HACCP principles for effective biosecurity in compartmentalized systems. Moreover, the study explores the valuable role of compartmentalization in addressing and managing aquaculture disease emergencies.. |
| [87] | Agriculture, forestry, and fishing | Case studies, SLR | The study indicates that worker protection in the Agriculture, Forestry, and Fishing (AgFF) sector is considerably limited, with regulatory protections weaker than in other industrial sectors and enforcement being insufficient. The vulnerability of AgFF workers is aggravated by immigration policies, and the sector’s workforce has historically experienced legal “exceptionalism,” resulting in the exclusion of many regulatory protections specifically designed to secure workers in other industries. |
| [88] | Capital Labour | Mathematical analysis | The study confirms the presence of a unique marginal rate of technological substitution under optimal capital-labor conditions and establishes a practical procedure for finding the optimal capital-labor ratio in any two-factor production function, grounded in microeconomic theory, where the marginal rate of technological substitution is set to one unit, relying on an accurate representation of key enterprise dynamics. |
| [89] | Trade openness | New endogenous growth model | The study introduces a novel trade openness index and employs a multifaceted approach, revealing that while human and physical capital positively influence long-term economic growth in India, trade openness has a negative long-term impact, with short-term positive effects, and granger causality tests support the existence of trade openness-led and human capital-led growth hypotheses. |
| [90] | Ecological Footprint | Statistical analysis | The study presents a methodological framework for calculating ecological footprints associated with leisure tourism in the Seychelles, highlighting the environmental impact of air travel, and raises important questions about the potential role of long-distance travel in safeguarding biodiversity, emphasizing the need for sustainable tourism practices. |
| [91] | Renewable Energy Utilization | Systematic literature review (SLR) | The study provides a comprehensive overview of island energy resources, investigates the current utilization status and development potential of various renewable energy sources for island power grids, and presents advanced technologies and strategies to improve the penetration of renewables, highlighting the increasing importance of sustainable energy solutions for island communities. |
2.2. Contribution of the Study
Mostly studies used GDP per capita in the empirical analysis to analyze the nexus between growth and environment. However, it is needed to take into account the concept of inclusive growth in the context of growth-environment. Moreover, mostly studies used CO 2 emission to reflect environmental degradation. Thus, current study makes three important contributions to the literature. First, it first time took into account the variable of inclusive growth instead of traditional growth measures in the context of growth-energy-environment. Second, it explored the impact of GDP per person employed used as an indicator of inclusive growth. Third, it used ecological footprints as a proxy of environment in the context of
This research significantly contributes to the existing literature by comprehensively exploring the nexus between IG and a set of key determinants within the unique context of 19 ACD member countries. The study not only sheds light on the dynamics of IG but also provides invaluable insights for policymakers, guiding them in formulating targeted policies based on the income levels of their respective countries. Additionally, it has highlighted the significance of understanding the diverse ACD landscape and classified the member countries based on income levels, setting the stage for a comprehensive investigation into IG in the region[92].
3. Materials and Methods
This section describes the methodology used in this research paper to examine the impact of various economic, environmental, and social indicators on inclusive growth for 19 Asian Cooperation Dialogue members from 1995 to 2021[93,94]. This section encompasses aspects related to data sources, model specification, estimation techniques, and diagnostic tests. This research collected data from various outlets, including the World Bank, the International Monetary Fund (IMF), and the World Development Indicators (W.D.I.). The dataset encompasses information from 19 member nations of the Asia Cooperation Dialogue (ACD): Bangladesh, Brunei Darussalam, Cambodia, China, India, Indonesia, Iran, Japan, Kazakhstan, South Korea, Kuwait, Malaysia, Pakistan, Philippines, Qatar, Saudi Arabia, Singapore, Thailand, and the United Arab Emirates[95]. The data spans from 1995 to 2021, which represents the most recent year for many of the metrics. To address issues related to data scale and non-linear relationships, the annual data points have been transformed into natural logarithms. The central variable under examination in this study is inclusive growth (ING), which is assessed through the Inclusive Development Index (IDI) from the World Economic Forum (WEF). The IDI encompasses three dimensions of economic progress: growth and development, inclusiveness, and intergenerational equality. Higher IDI scores, ranging from 0 to 100, signify greater inclusivity in growth. Additionally, the research explores several independent factors, including total fisheries production (TFP), aquaculture output (AP), agriculture, forestry, and fishing (AFF), capital (K), labor (L), trade openness (TOP), ecological footprint (EF), and renewable energy utilization (RE). [96]. Here are the explanations and sources for these variables[97]:
TFP: This variable represents the total annual fish production from both marine and inland capture fisheries, as well as aquaculture[98]. It indicates the quantity of fish captured within a given country. The Food and Agriculture Organization (FAO) of the United Nations serves as the data source for TFP. AP: AP refers to the total annual fish production from aquaculture in a specific country, encompassing production from both inland and marine aquaculture. The source of this variable is also the FAO[99]. AFF: The value added of agriculture, forestry, and fishing sectors as a percentage of GDP in a country each year. It includes crop and animal production, hunting, forestry, and fishing activities. The source of this variable is the W.D.I. K: The gross fixed capital formation as a percentage of GDP in a country each year. It measures the net increase in physical assets that are used in the production process for more than one year. The source of this variable is also the W.D. [100] I. L: The total labour force as a percentage of the total population aged 15 years and above in a country each year. It measures the supply of labour available for producing goods and services. The source of this variable is also the W.D.I. TOP: The sum of exports and imports of goods and services as a percentage of GDP in a country each year. It measures the degree of integration of a country with the global economy[101]. The source of this variable is also the W.D.I. EF: The amount of biologically productive land and water area required to produce the resources consumed and to absorb the waste generated by a country’s population each year. It measures the environmental impact of a country’s consumption patterns. The source of this variable is the Global Footprint Network. RE: The share of renewable energy sources in total final energy consumption in a country each year[102]. It measures the extent to which a country relies on clean and sustainable energy sources. The source of this variable is also the W.D.I[103].

- Econometric Methods
The empirical examination encompassed a range of assessments, which were categorized as follows- 1. pre-estimation diagnostic tests, 2. descriptive analysis 3. cointegration analysis, 4. unit root evaluations and 5. regression estimation[104].
- Panel Heteroscedasticity Test
Heteroscedasticity is the problem that occurs when the error terms in a linear regression analysis do not have constant variance. This assumption is violated mainly by outliers in the data. As a result, OLS estimates are distorted [105]. This was suggested by researchers that a modified test statistic for heteroscedasticity to explore the association between the residual variance and the explanatory variables in a linear regression model[106]. This study applied the Modified LM test for heteroscedasticity[107].
- Panel Autocorrelation Test
Panel data can exhibit autocorrelation, a correlation between values of the same variables based on related objects. Its presence gives inefficient and biased standard errors. This study used the Wooldridge autocorrelation test[108].
- Panel Unit Root (CIPS) Test
The next phase in the econometric process is to verify the right order of integration after the diagnostic analysis. Because the non-stationarity of the variables might lead to fictitious and meaningless forecasts, it is essential to utilize a stationary time series with time-independent statistical characteristics[109]. To check the correct integration order, multiple panel unit root tests are used[110]. The current study employs 2nd generation test considering CD in the panel. An appropriate test is augmented cross-sectional IPS (CIPS)), which is given as follows[111]:
where is the OLS t-ratio of bi in the above regression[112]. It placed the null hypothesis to testing, and since it was rejected, it seems likely that the underlying series is stationary[113].
- Panel Cointegration test of Westerlund
Cointegration is the method used to verify the existence of a long-run relationship between the variables[114]. Engle and Granger (1987) introduced this concept[115]. CD means using a 2nd generation cointegration test such as the Westerlund test [116]. It is a crucial requirement to confirm the long-run relationship among variables. The long-run relationship implies the cointegration between two or more[117]. This test is based on structural dynamics rather than residual dynamics; therefore, the mathematical expression is given as[118]:
- Long-run Estimation Method
If there is long-run cointegration among the variables with short-run adjustment, the OLS estimation results may yield biased parameter estimates and false conclusions[119]. In panel data analysis, error components may encounter various problems like CD, heteroscedasticity, and autocorrelation in the linear regression model[120]. Especially for models in which the number of selected countries is more than the selected time, i.e. (N>T)[121]. In technical terms, serial correlation and heteroscedasticity are also responsible for issues like inflated R2 [122]. As a result, the coefficient estimates using the general regression methods (i.e., pooled OLS, random effect, and fixed effects) may give misleading inferences. To avoid inefficiency and inconsistency, the use of a linear dynamic model is widely observed in panel data analysis to address serial correlation and unobserved heterogeneity [123]. This study applied the Driscoll and Kraay (D/K) standard errors approach proposed by Driscoll and Kraay (1998), a robust standard error estimation method. It is a non-parametric technique that estimates pooled OLS regression models to find coefficients in the panel data (Driscoll & Kraay, 1998). It assumes that heteroskedasticity affects the error structure and correlation between the panel’s cross-sectional units. It is well calibrated because (a) cross-sectional dependence exists, (b) it can handle missing observations, it deals with an econometric problem of heteroscedasticity, and (d) it can be applied to both balanced and unbalanced panels [124]. In this work, a linear regression model was used to apply the Driscoll and Kraay standard errors. First, the explanatory variables and errors were used to calculate the mean values. Second, these averages were used in weighted heteroscedasticity as described by [125] to produce standard residuals that are robust against CD[126].
where y_(i.t) is the dependent variable and x_(i.t) is the independent variable, the initial element of the vector is 1 and the unknown coefficients are displayed with a (K+1) 1 vector., subscripts shows time and countries[127]. Moreover, the term may have econometric issues like CD and heteroscedasticity in the panel so can be consistently estimated by using OLS regression[128].
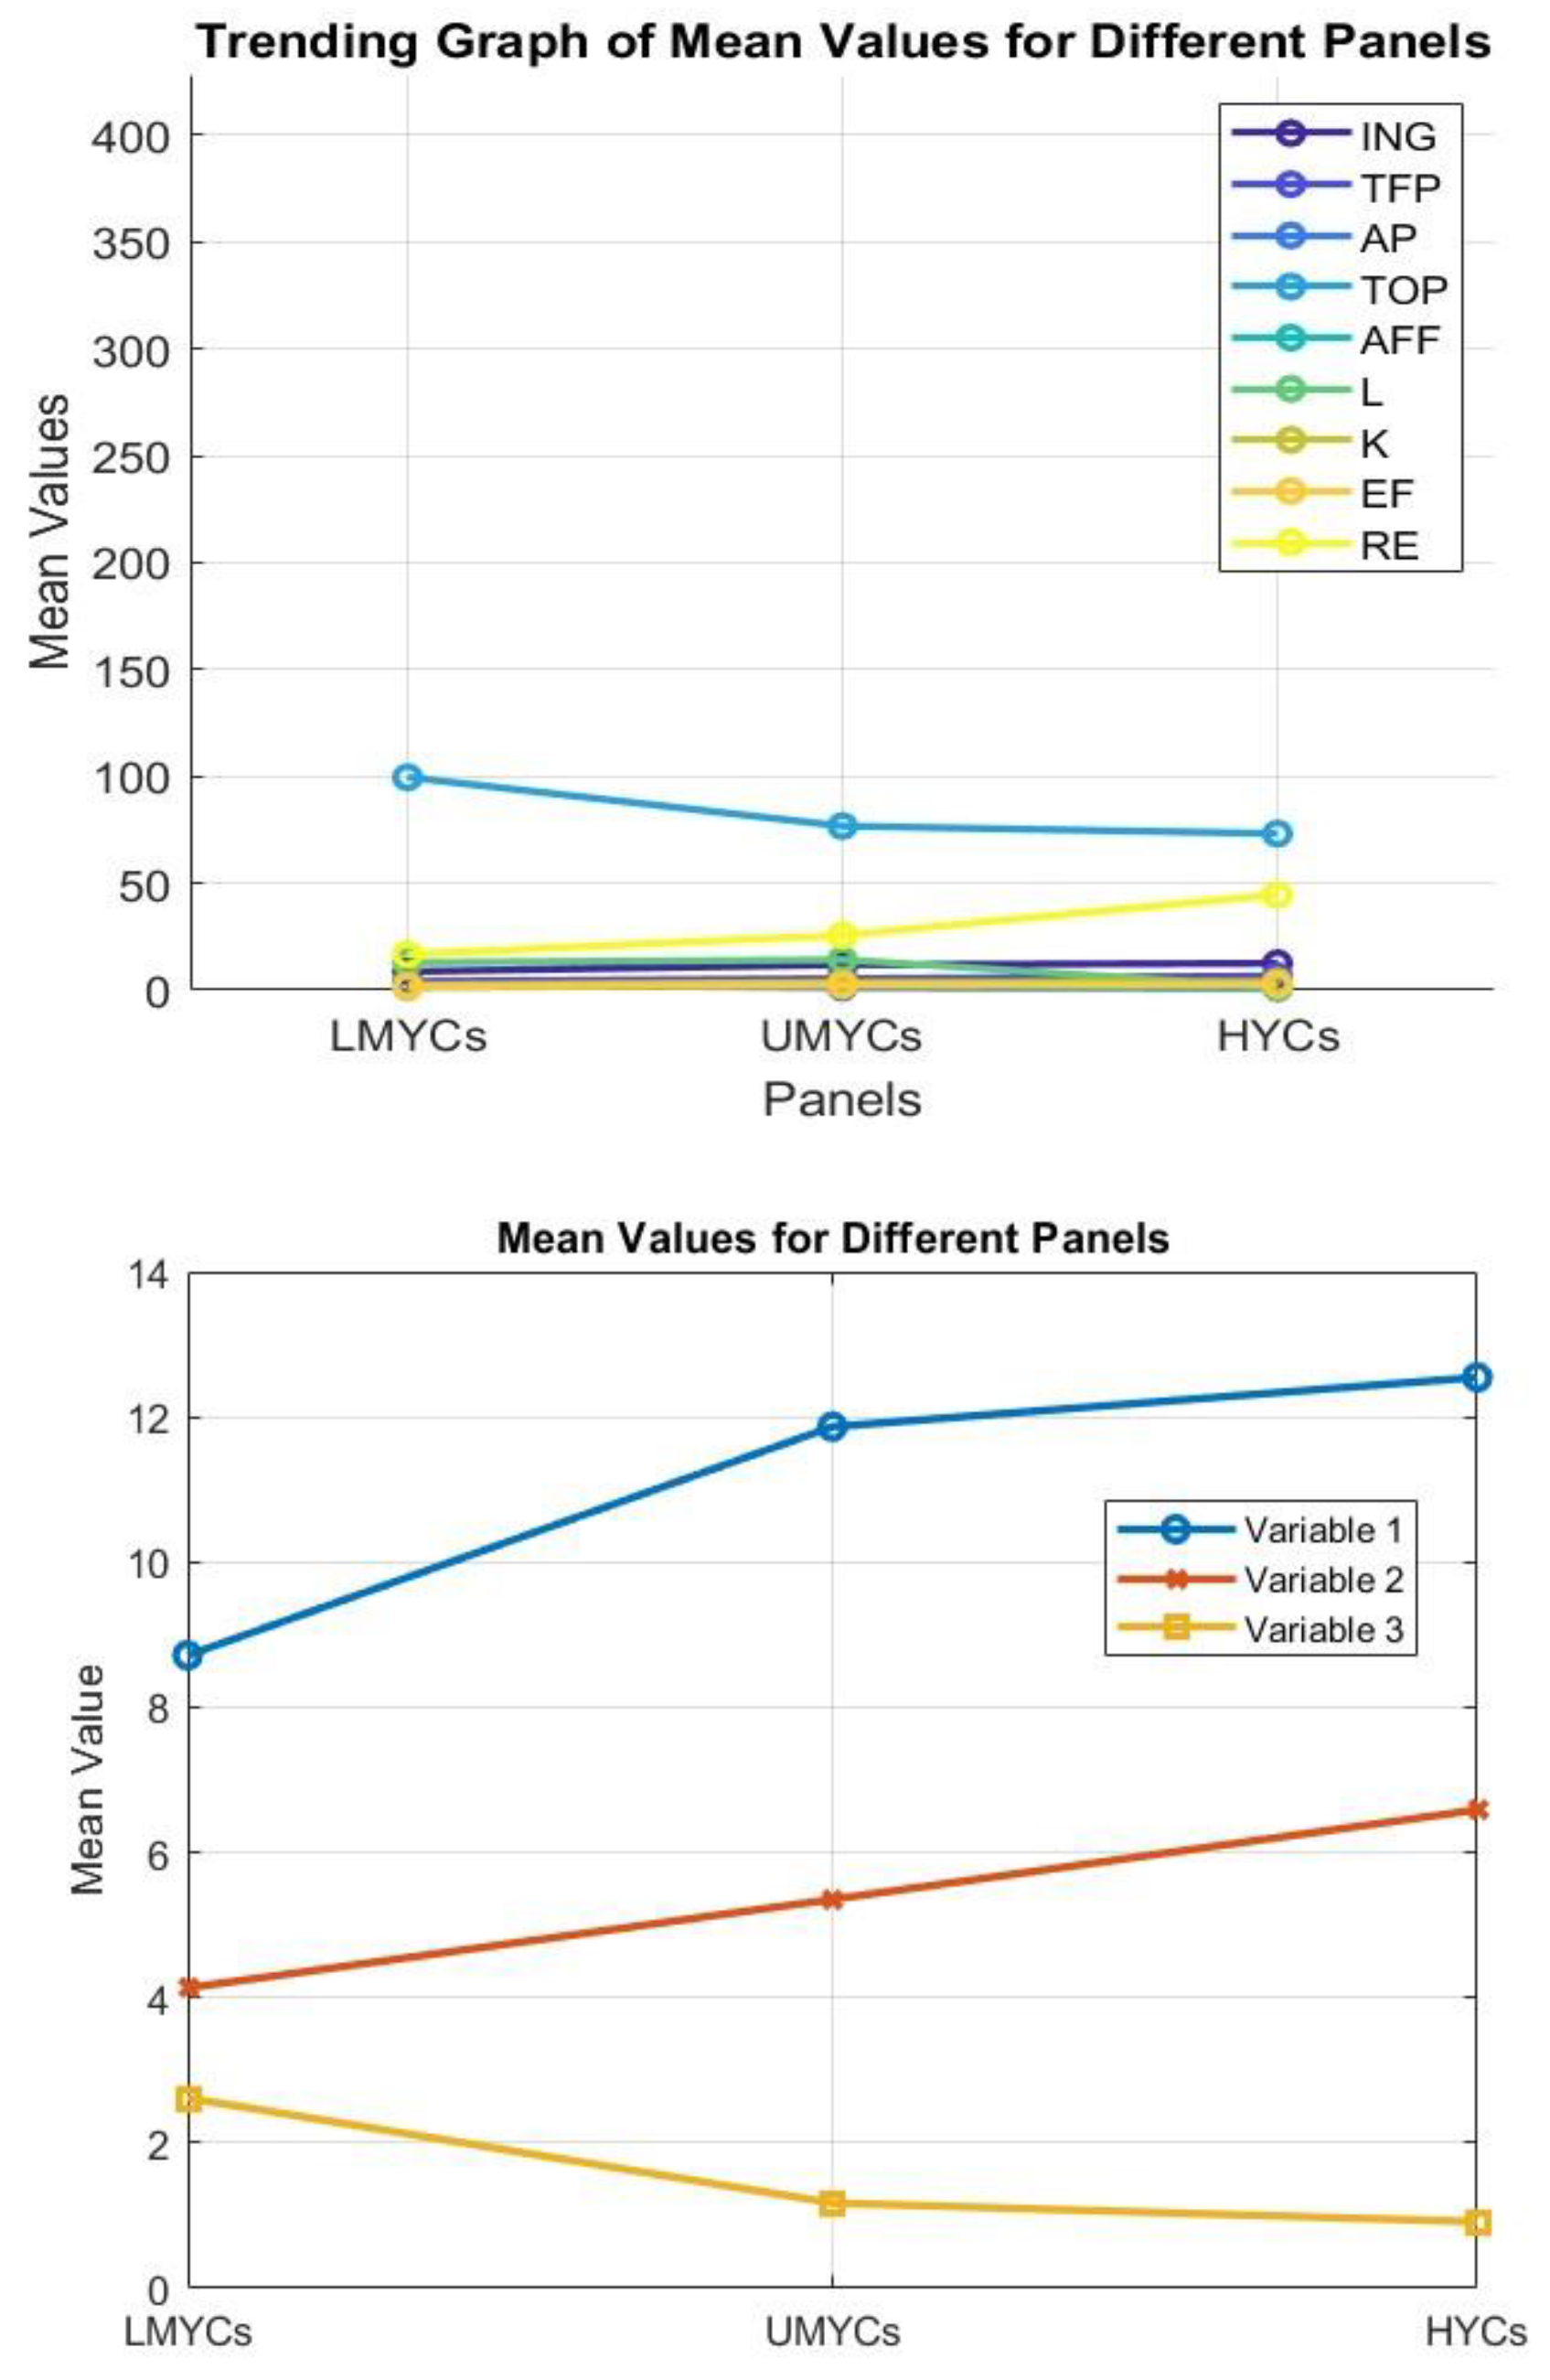

Table 1.
Descriptive Statistics.
| Panel | Mean | Min | Max | Sd. Dev. | Source |
|---|---|---|---|---|---|
| Inclusive Growth (ING) (GDP per person employed) | |||||
| LMYCs | 8.715 | 6.234 | 9.768 | 0.456 | W.D.I. |
| UMYCs | 11.865 | 9.245 | 12.564 | 0.501 | |
| HYCs | 12.545 | 11.231 | 13.453 | 0.392 | |
| Total Fishery Production (TFP) (metric tonnes) | |||||
| LMYCs | 4.134204 | 1.80672 | 4.615417 | 0.43924 | W.D.I. |
| UMYCs | 5.352802 | 2.649245 | 5.610105 | 0.356066 | |
| HYCs | 6.586513 | 4.445568 | 5.60746 | 0.026144 | |
| Aquaculture production (AP) (metric tonnes.) | |||||
| LMYCs | 2.6166512 | -10.94238 | 3.78219 | 1.261692 | W.D.I. |
| UMYCs | 1.169859 | -6.25558 | 4.29876 | 1.237899 | |
| HYCs | 0.9107528 | -7.198535 | 6.107207 | 1.59848 | |
| Trade Openness (TOP) (% of GDP.) | |||||
| LMYCs | 99.56 | 14.564 | 423.234 | 65.563 | W.D.I. |
| UMYCs | 76.754 | 13.522 | 218.543 | 34.677 | |
| HYCs | 73.234 | 0.154 | 178.354 | 33.453 | |
| Agriculture, forestry, and fishing (AFF (% of GDP.) | |||||
| LMYCs | 1.322114 | -3.963077 | 9.169629 | 1.40004 | W.D.I. |
| UMYCs | 2.24804 | -3.962927 | 7.510115 | 1.55605 | |
| HYCs | 1.282795 | -4.012442 | 4.854778 | 1.386042 | |
| Labour (L) in (millions) | |||||
| LMYCs | 12.877 | 4.742 | 22.456 | 5.772 | W.D.I. |
| UMYCs | 14.216712 | -1.386294 | 3.65842 | 0.7304148 | |
| HYCs | 1.461135 | -0.3581045 | 3.313094 | 0.5508925 | |
| Capital (K) (in USD) | |||||
| LMYCs | 24.592 | 1.000 | 70.433 | 6.612 | W.D.I. |
| UMYCs | 25.432 | 3.011 | 46.420 | 4.433 | |
| HYCs | 21.583 | 10.064 | 41.533 | 5.153 | |
| Total ecological footprint (EF)(Global hectares per capita) | |||||
| LMYCs | 1.603 | -0.823 | 3.421 | 0.664 | W.D.I. |
| UMYCs | 2.312 | -1.065 | 3.546 | 0.654 | |
| HYCs | 2.543 | -0.234 | 3.213 | 0.590 | |
| Renewable Energy Utilization (RE) (% of total final energy use) | |||||
| LMYCs | 16.751 | 0.000 | 82.654 | 16.152 | W.D.I. |
| UMYCs | 25.687 | 1.263 | 86.045 | 18.432 | |
| HYCs | 44.673 | 0.015 | 92.661 | 28.654 | |
The table gives the statistics of 10 indicators for three income groups from W.D.I. The indicators are ING (GDP per person employed), TFP (total fish catch and aquaculture production in metric tonnes), AP (fish farming production in metric tonnes), TOP (sum of exports and imports as a percentage of GDP), AFF (value added of agriculture, forestry and fishing as a percentage of GDP), L (total number of workers in millions), K (total fixed capital formation in USD), EF (amount of biologically productive land and water required to meet the consumption demands of a population in global hectares per capita) and RE (share of renewable energy sources in total final energy use in percentage). The statistics are mean, min, max and sd. The table shows that: HYCs have the highest mean ING (12.545), TFP (6.586513), K (4.023328) and EF (2.543), and the lowest min TOP (0.154) and AFF (-4.012442). UMYCs have the highest max ING (12.564) and the lowest min EF (-1.065). LMYCs have the highest mean AP (2.6166512) and TOP (99.56), and the lowest min ING (6.234), TFP (1.80672) and AP (-10.94238). The SD of each indicator varies across groups, but generally LMYCs have higher SD than HYCs. LMYCs have lowest SD (0.664) and HYCs have highest SD (0.590) in EF. HYCs have highest mean (44.673) and max (92.661) and LMYCs have lowest mean (16.751) and min (0.000) in RE. HYCs have highest SD (28.654) and LMYCs have lowest SD (16.152) in RE.
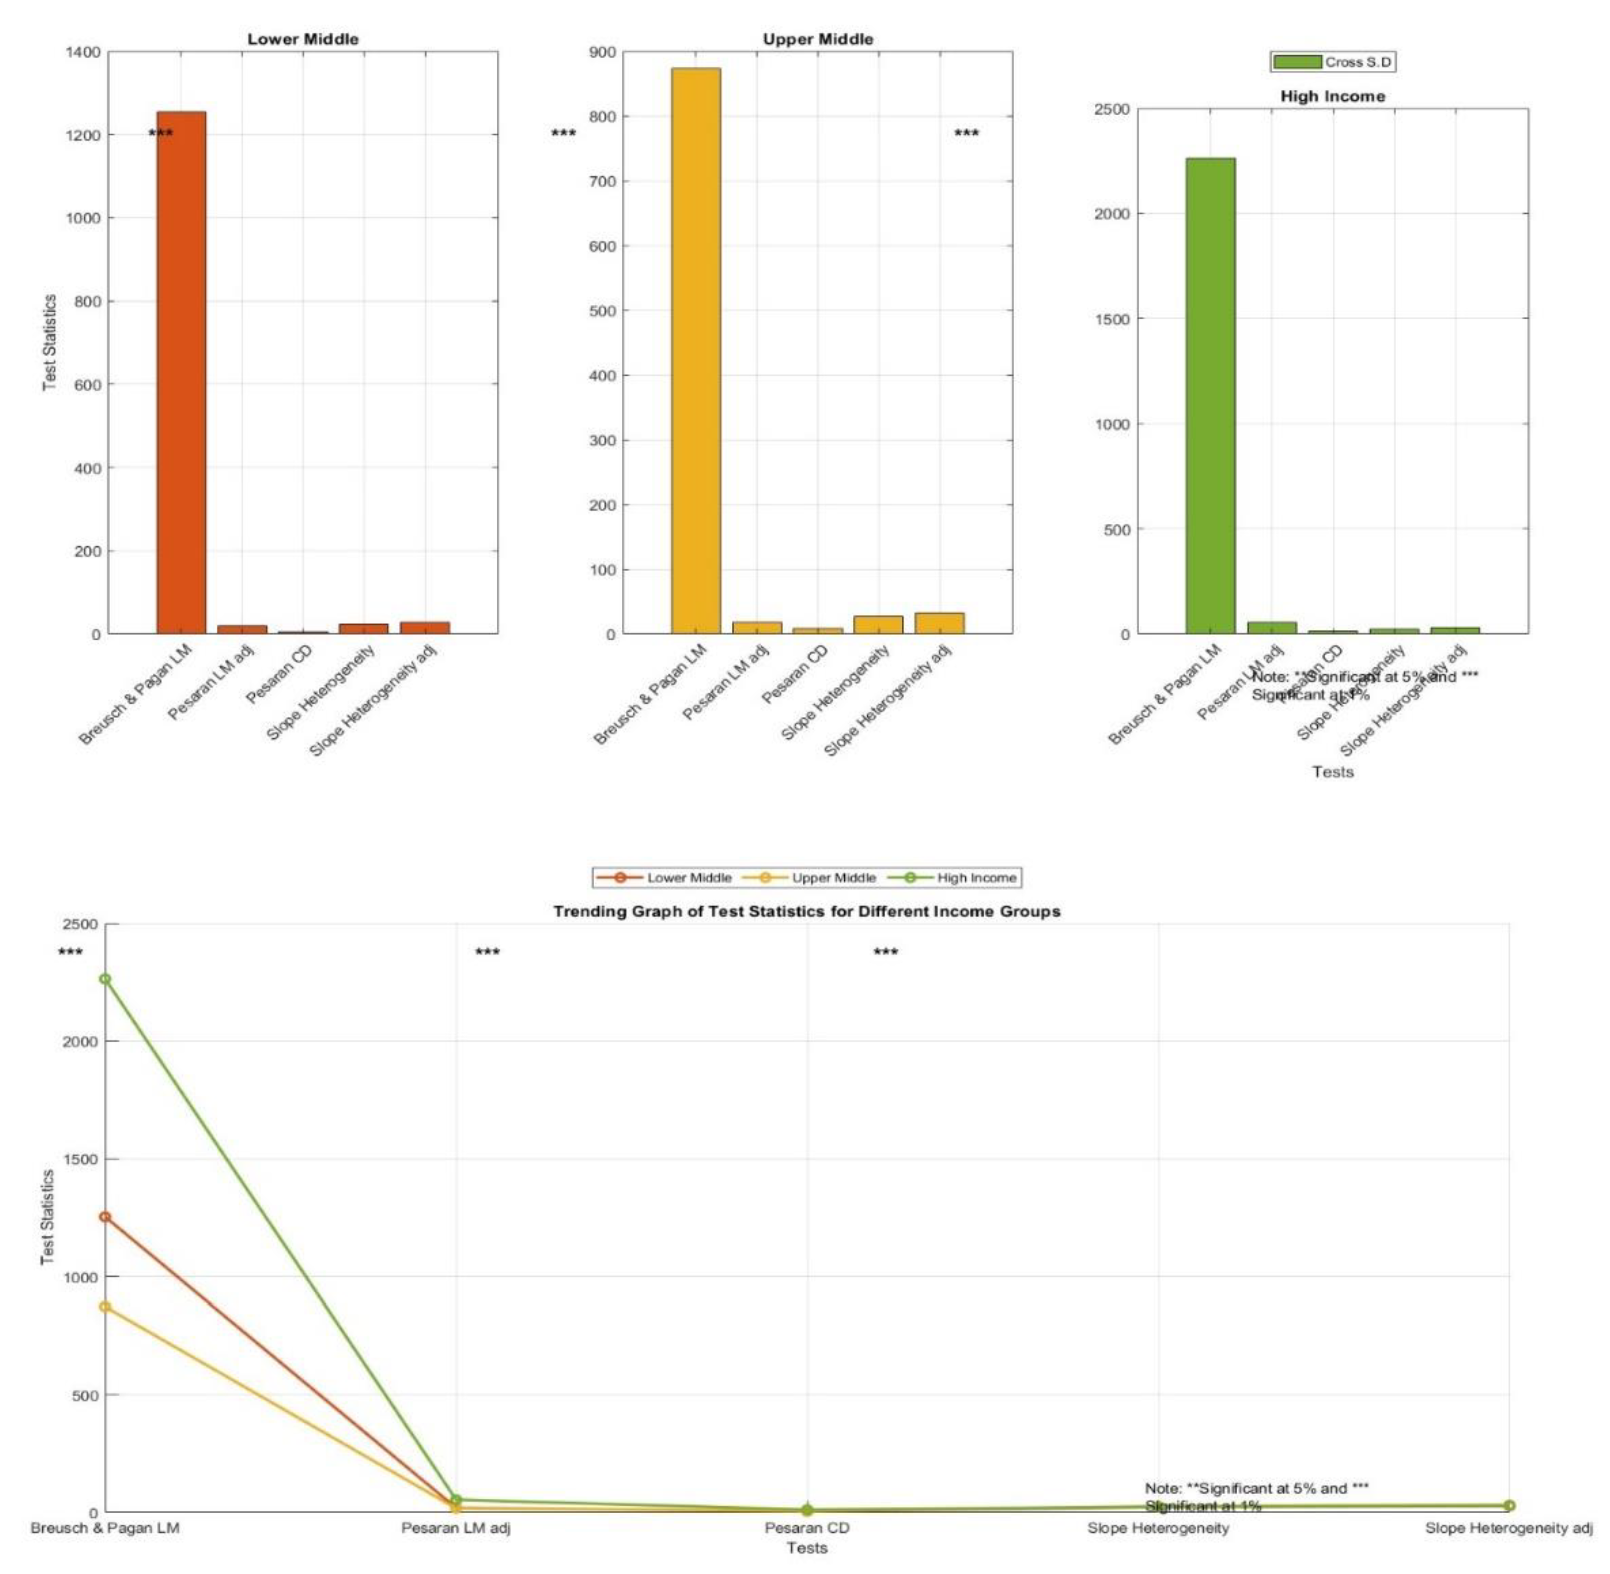
Table 2.
Results of pre-estimation tests.
| Problem | Test | Lower Middle | Upper middle | High Income | |||
|---|---|---|---|---|---|---|---|
| Test.stat. | Prob. | Test.stat. | Prob. | Test.stat. | Prob. | ||
| Cross S.D | Breusch & Pagan LM | 1254*** | 0.00 | 873.6*** | 0.000 | 2264*** | 0.000 |
| Pesaran LM adj | 19.94*** | 0.000 | 18.33*** | 0.000 | 54.58*** | 0.000 | |
| Pesaran CD | 6.107*** | 0.000 | 8.127*** | 0.000 | 12.52*** | 0.000 | |
| Slope Heterogeneity | ∆ | 23.671*** | 0.000 | 26.940*** | 0.000 | 24.025*** | 0.000 |
| ∆^ adj | 28.449*** | 0.000 | 32.378*** | 0.000 | 31.37*** | 0.000 | |
|
Heteroscedasticity Autocorrelation |
Modified Wald Breusch-Pagan /Cook-Weisberg Wooldridge |
21889.68* 14.06*** 228.93*** |
0.000 0.000 0.000 |
11466.28* 7.55*** 12.786*** |
0.000 0.000 0.000 |
32884.53* 44.82*** 208.76*** |
0.000 0.000 0.000 |
Note: **Significant at 5% and *** Significant at1%.
The table shows the results of some pre-estimation tests for three groups of countries: lower middle income countries (LMYCs), upper middle income countries (UMYCs) and high income countries (HYCs). The table has 6 rows and 7 columns. Each row represents a problem, or a test and each column represents a group or a statistic. The statistics are test statistic and probability. The problems are cross-sectional dependence, slope heterogeneity, heteroscedasticity, and autocorrelation. The first row shows the results of three tests for cross-sectional dependence: Breusch & Pagan LM, Pesaran LM adj and Pesaran CD. Cross-sectional dependence means that the error terms of different units are correlated. All three tests have high test statistics and low probabilities for all groups, which means that they reject the null hypothesis of no cross-sectional dependence. This implies that there is significant cross-sectional dependence among the units in each group[129].
The second row shows the results of two tests for slope heterogeneity: ∆ and ∆^ adj. Slope heterogeneity means that the slope coefficients of different units are not equal. Both tests have high test statistics and low probabilities for all groups, which means that they reject the null hypothesis of slope homogeneity. This implies that there is significant slope heterogeneity among the units in each group. The third row shows the results of two tests for heteroscedasticity: Modified Wald and Breusch-Pagan /Cook-Weisberg. Heteroscedasticity means that the variance of the error terms is not constant across units or time. Both tests have high test statistics and low probabilities for all groups, which means that they reject the null hypothesis of homoscedasticity. This implies that there is significant heteroscedasticity among the units in each group. The fourth row shows the results of one test for autocorrelation: Wooldridge. Autocorrelation means that the error terms are correlated across time within units. The test has high test statistics and low probabilities for all groups, which means that it rejects the null hypothesis of no autocorrelation. This implies that there is significant autocorrelation among the units in each group[130].
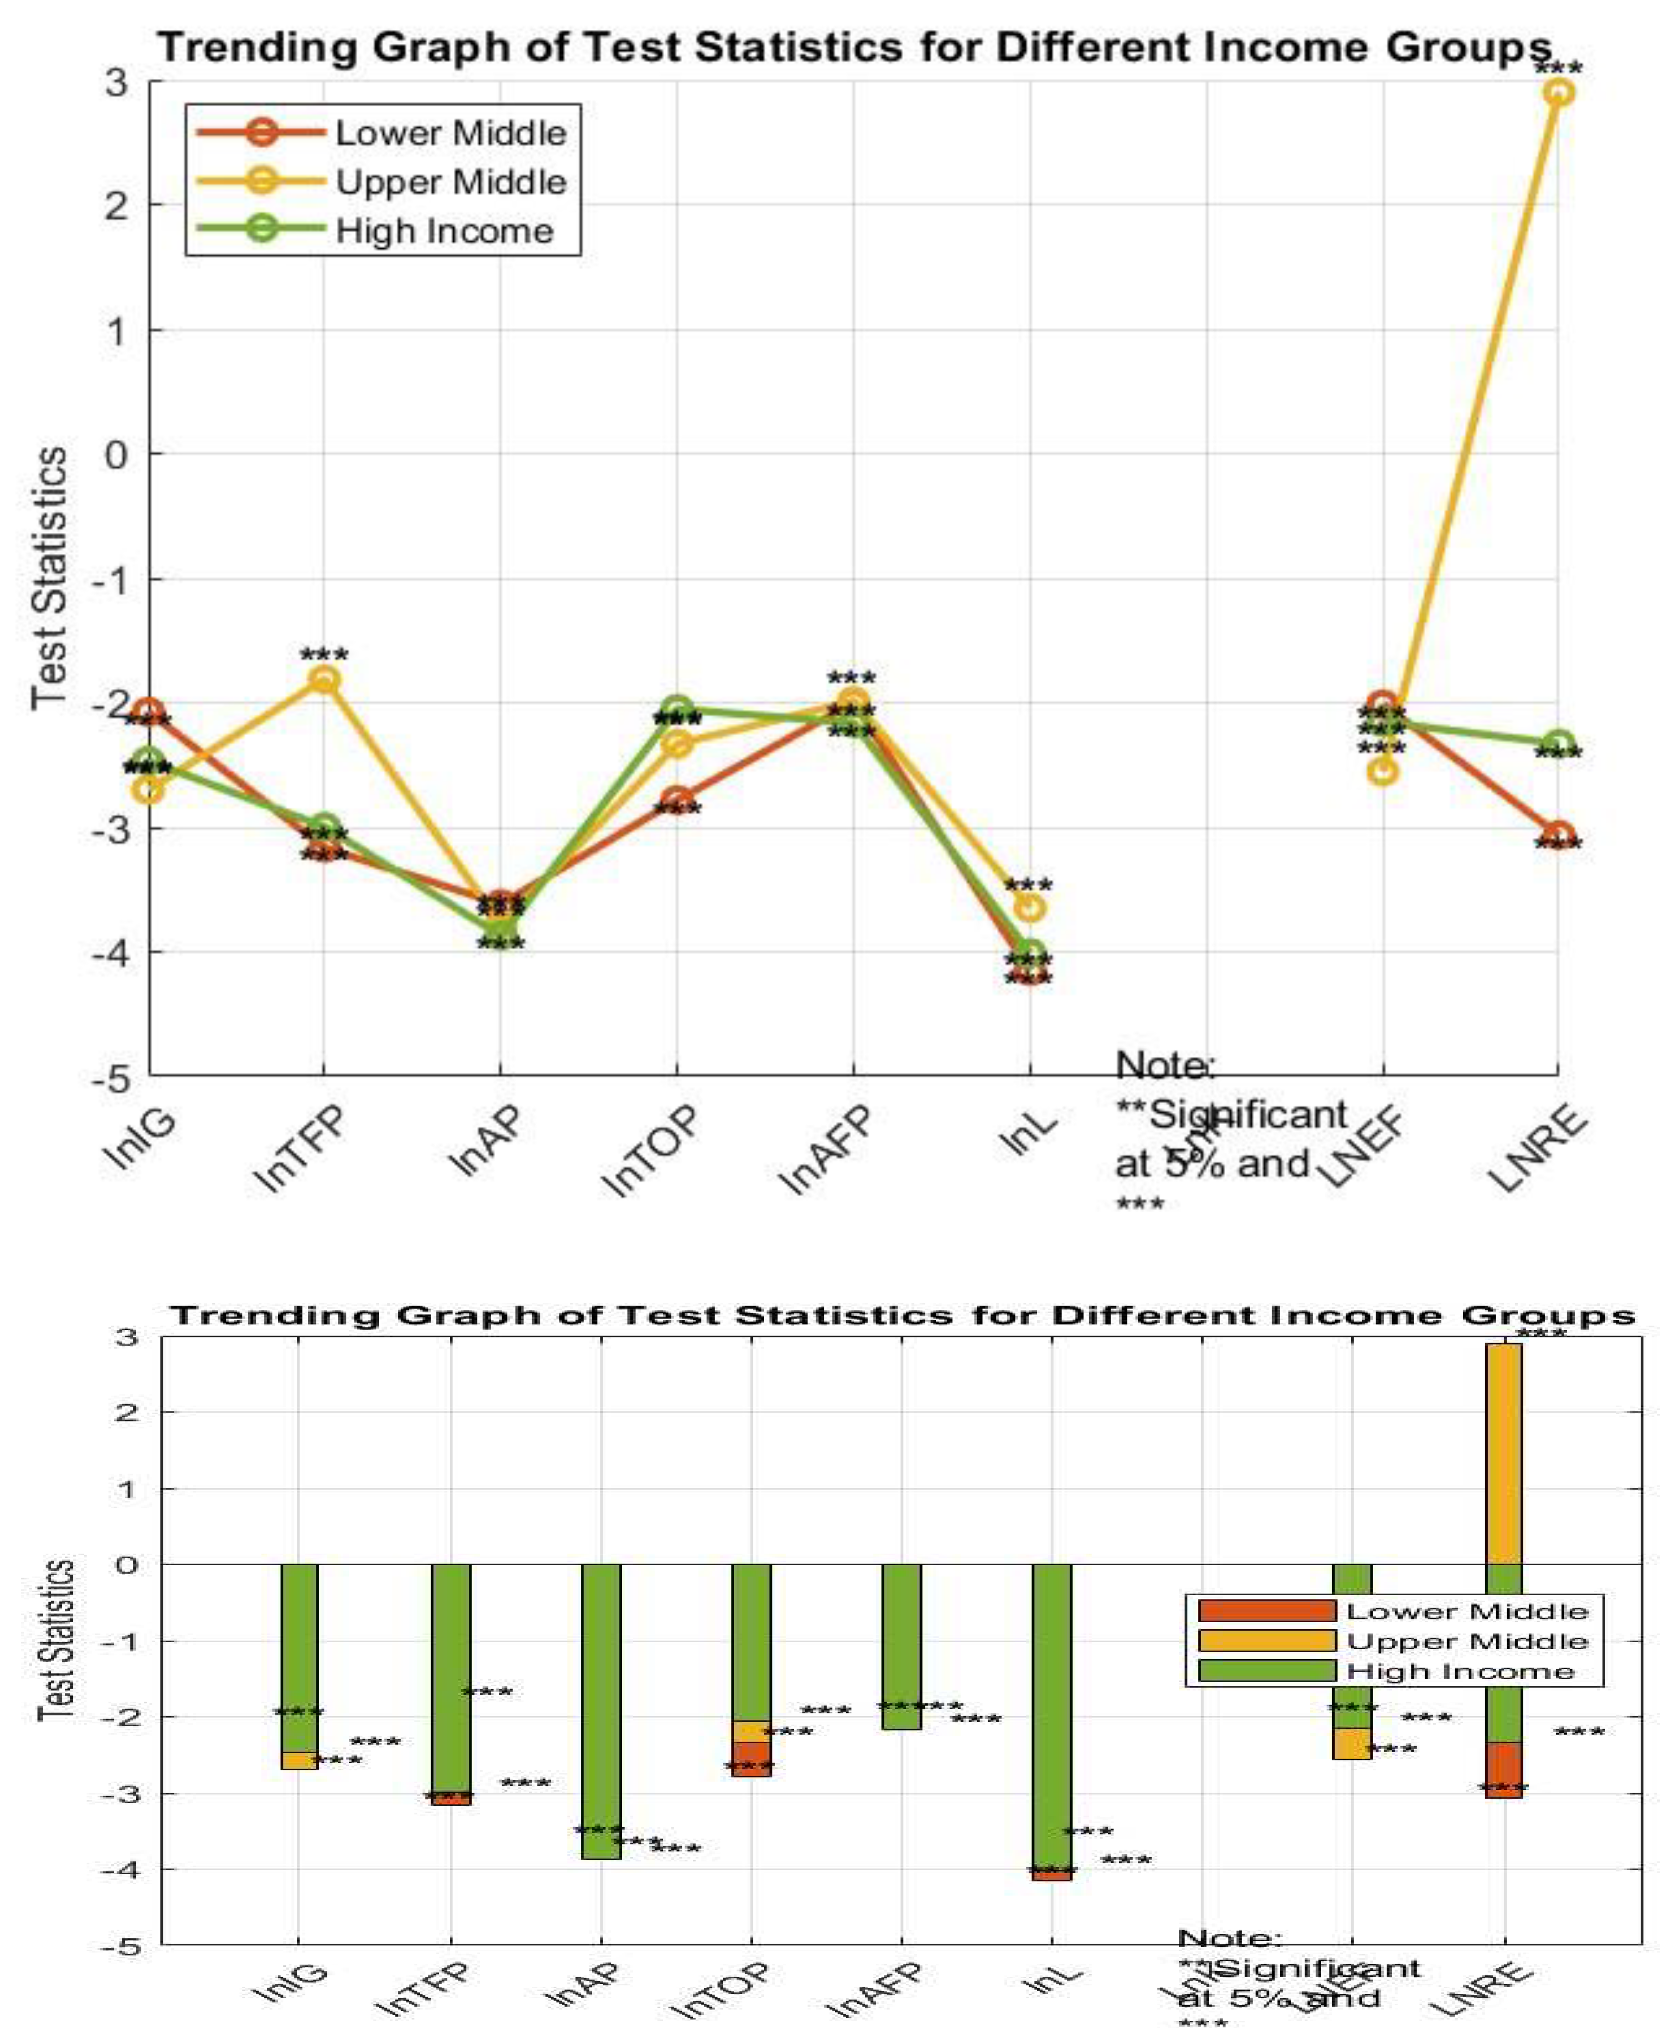
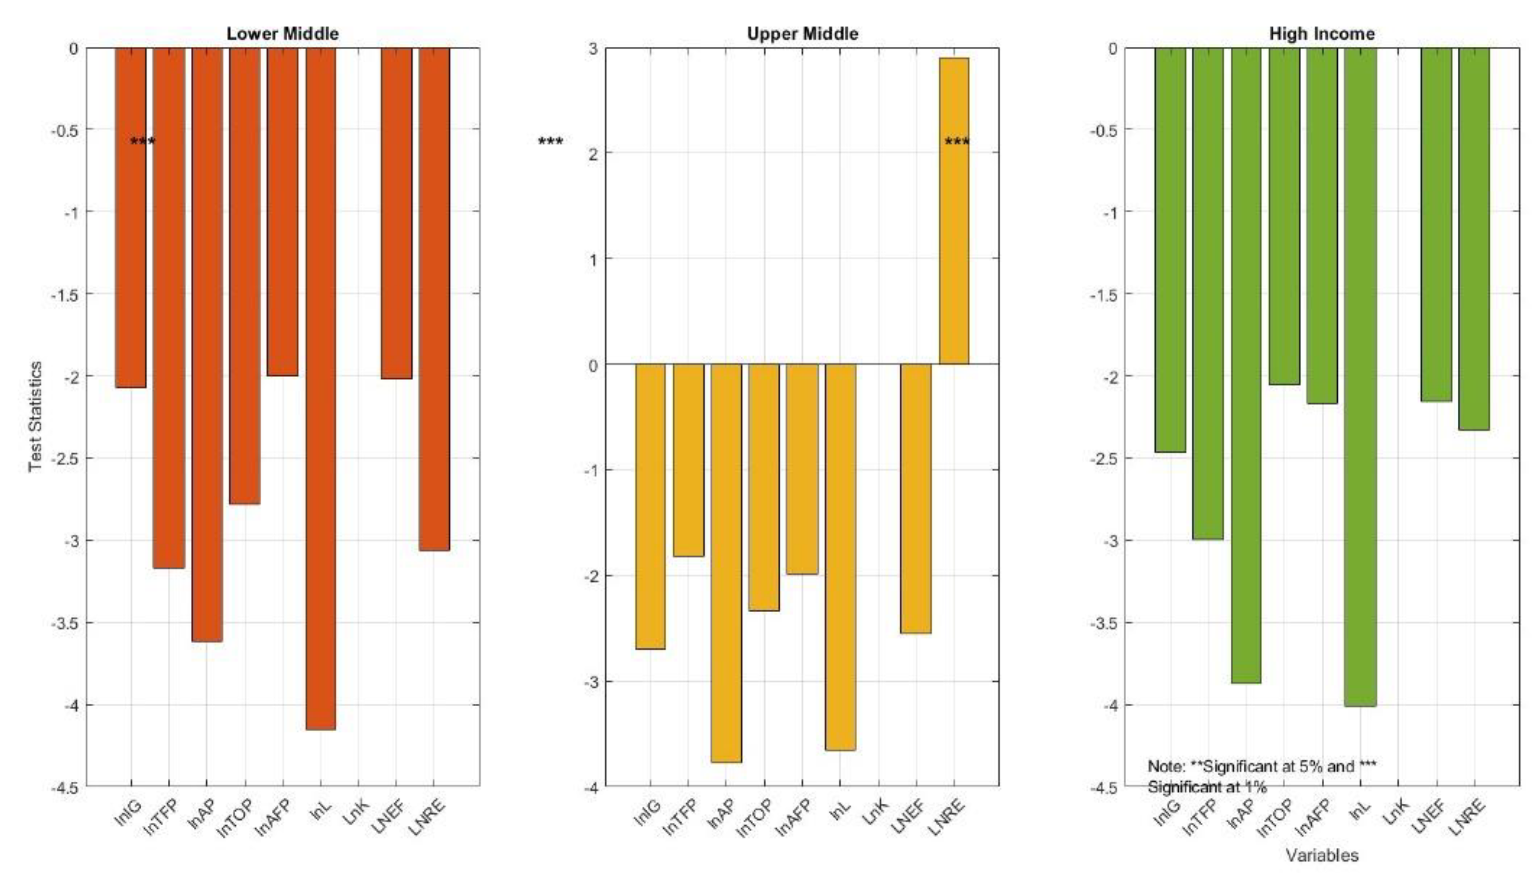
Table 3.
Results of CIPS test.
| Variables | Lower Middle | Upper Middle | High Income |
|---|---|---|---|
| At level (Intercept & Trend) | |||
| lnIG | -2.074 | -2.699** | -2.466 |
| lnTFP | -3.166*** | -1.813 | -2.998*** |
| lnAP | -3.616*** | -3.777*** | -3.870*** |
| lnTOP | -2.782*** | -2.332 | -2.051 |
| lnAFP | -1.998 | -1.988 | -2.164 |
| lnL | -4.153*** | -3.648*** | -4.010*** |
| LnK LNEF LNRE |
-2.015 -3.063*** -2.156*** |
-1.977 -2.552 2.899 |
-2.330 -3.457*** 2.443** |
| At first difference (only with intercept) | |||
| lnIG | -3.522 *** | -3.817*** | -4.047*** |
| lnTFP | -4.818*** | -3.426*** | -3.787*** |
| lnAP | -5.286*** | -5.595*** | -5.726*** |
| lnTOP | -4.365*** | -4.094*** | -3.775*** |
| lnAFP | -4.239*** | -3.968*** | -4.504*** |
| lnL | -5.725*** | -5.652*** | -5.705*** |
| LnK LNEF LNRE |
-4.165*** -3.22*** |
-3.707*** 3.456*** |
-3.251*** 3.111*** |
Note: **Significant at 5% and *** Significant at1%.
The table shows the results of the CIPS test for three groups of countries: lower middle income countries (LMYCs), upper middle income countries (UMYCs) and high income countries (HYCs). The table has 10 rows and 4 columns. Each row represents a variable, and each column represents a group or a specification. The variables are lnIG (log of inclusive growth), lnTFP (log of total fishery production), lnAP (log of aquaculture production), lnTOP (log of trade openness), lnAFP (log of agriculture, forestry, and fishing), lnL (log of labour), lnK (log of capital), lnEF (log of ecological footprint) and lnRE (log of renewable energy utilization). The specifications are at level with intercept and trend, and at first difference with only intercept. The test statistic and the probability are reported for each variable and specification[131].
The CIPS test is a panel unit root test that allows for cross-sectional dependence among the units. The null hypothesis is that the variable has a unit root, which means that it is non-stationary. The alternative hypothesis is that the variable is stationary, which means that it has a constant mean and variance over time. A low probability value means that the null hypothesis is rejected, and a high probability value means that the null hypothesis is not rejected. The significance levels are indicated by ** and *** for 5% and 1% respectively. The results show that most of the variables are non-stationary at level but become stationary at first difference for all groups. This implies that the variables exhibit a random or unpredictable trend, but their alterations over time remain consistent.
However, there are deviations in the case of lnTFP and lnAP for HYCs, where they remain steady at the initial level with an intercept and trend. Conversely, lnRE for UMYCs and HYCs lacks stability when assessed in terms of first differences with only an intercept. In essence, these variables display either a predictable trend or no discernible trend at all, signifying that their changes over time lack constancy[132].
The findings also highlight distinctions among the three income groups regarding the level of stability. For instance, lnIG demonstrates greater stability in UMYCs compared to both LMYCs and HYCs at the initial level with an intercept and trend, evident through the lower probability value. Similarly, lnTFP is more stable in LMYCs than in UMYCs when examined at the initial level with an intercept and trend, again indicated by the lower probability value[133].
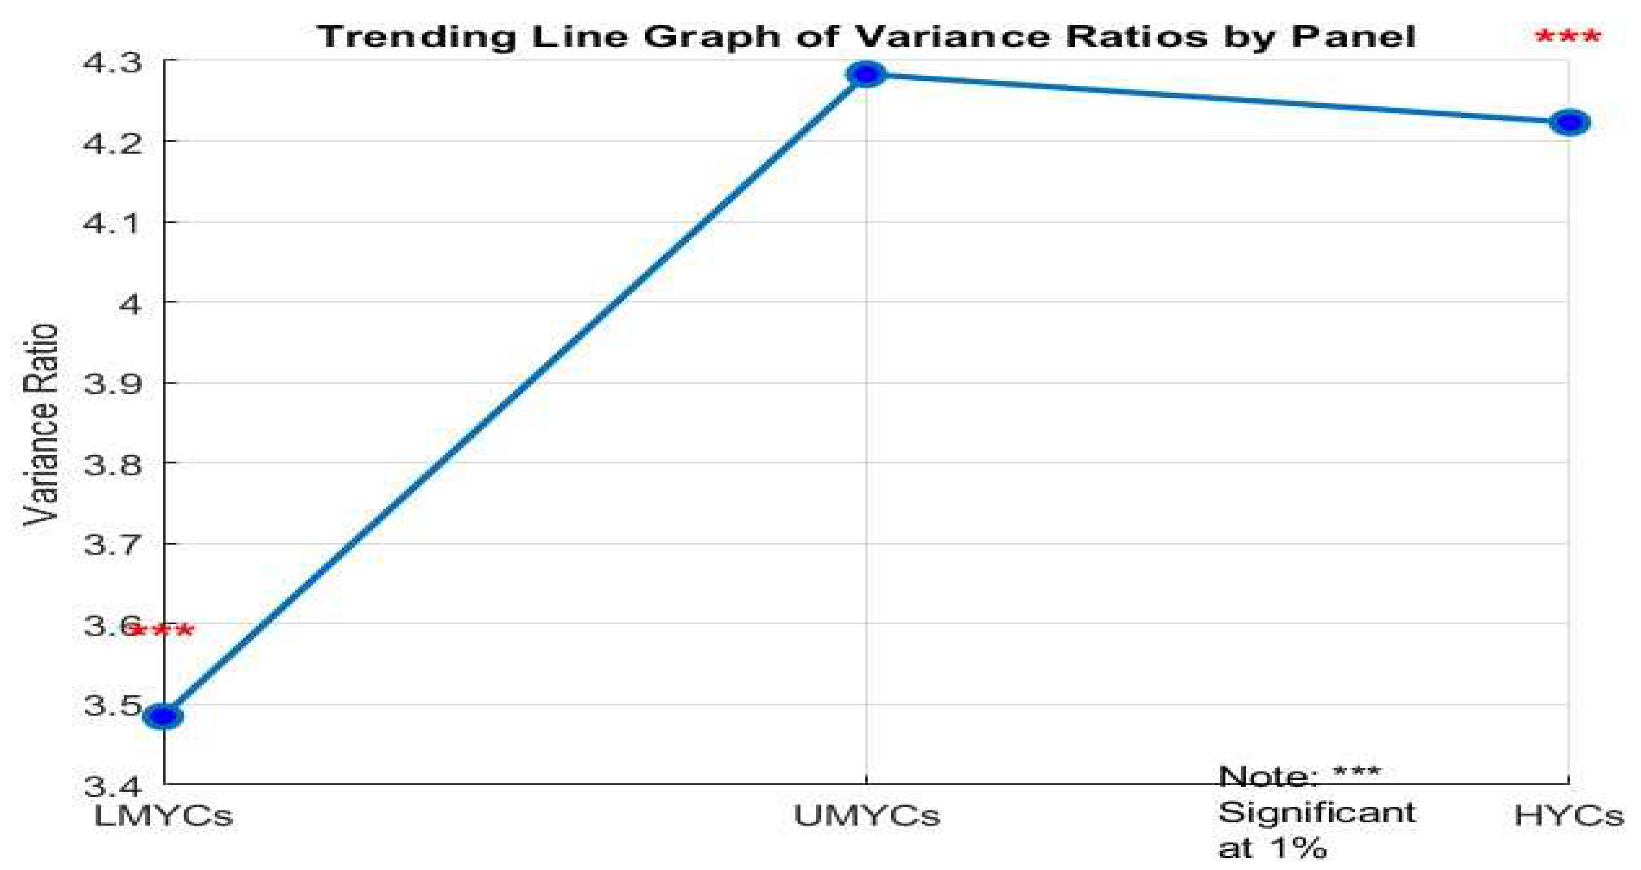
Table 4.
Wester-Lund Cointegration Result.
| Panel | Variance Ratio | |
|---|---|---|
| Statis. | Prob. | |
| LMYCs | 3.485** | 0.0005 |
| UMYCs | 4.283*** | 0.0000 |
| HYCs | 4.223*** | 0.0000 |
Note: ***Significant at 1%.
This indicates that the variables exhibit an element of randomness or unpredictability in their trends, yet the changes over time remain relatively consistent.
However, there are exceptions when considering lnTFP and lnAP for HYCs, where they exhibit stability when assessed at the initial level with an intercept and trend. In contrast, lnRE for UMYCs and HYCs lacks stability when examined in terms of first differences with only an intercept. In essence, these variables either exhibit a discernible trend or no trend at all, highlighting the absence of consistency in their changes over time.
Furthermore, the results underscore variations in the level of stability across the three income groups. For instance, lnIG demonstrates higher stability in UMYCs in comparison to both LMYCs and HYCs when analyzed at the initial level with an intercept and trend, as evidenced by the lower probability value. Similarly, lnTFP exhibits greater stability in LMYCs when compared to UMYCs when examined at the initial level with an intercept and trend, as indicated by the lower probability value[134].
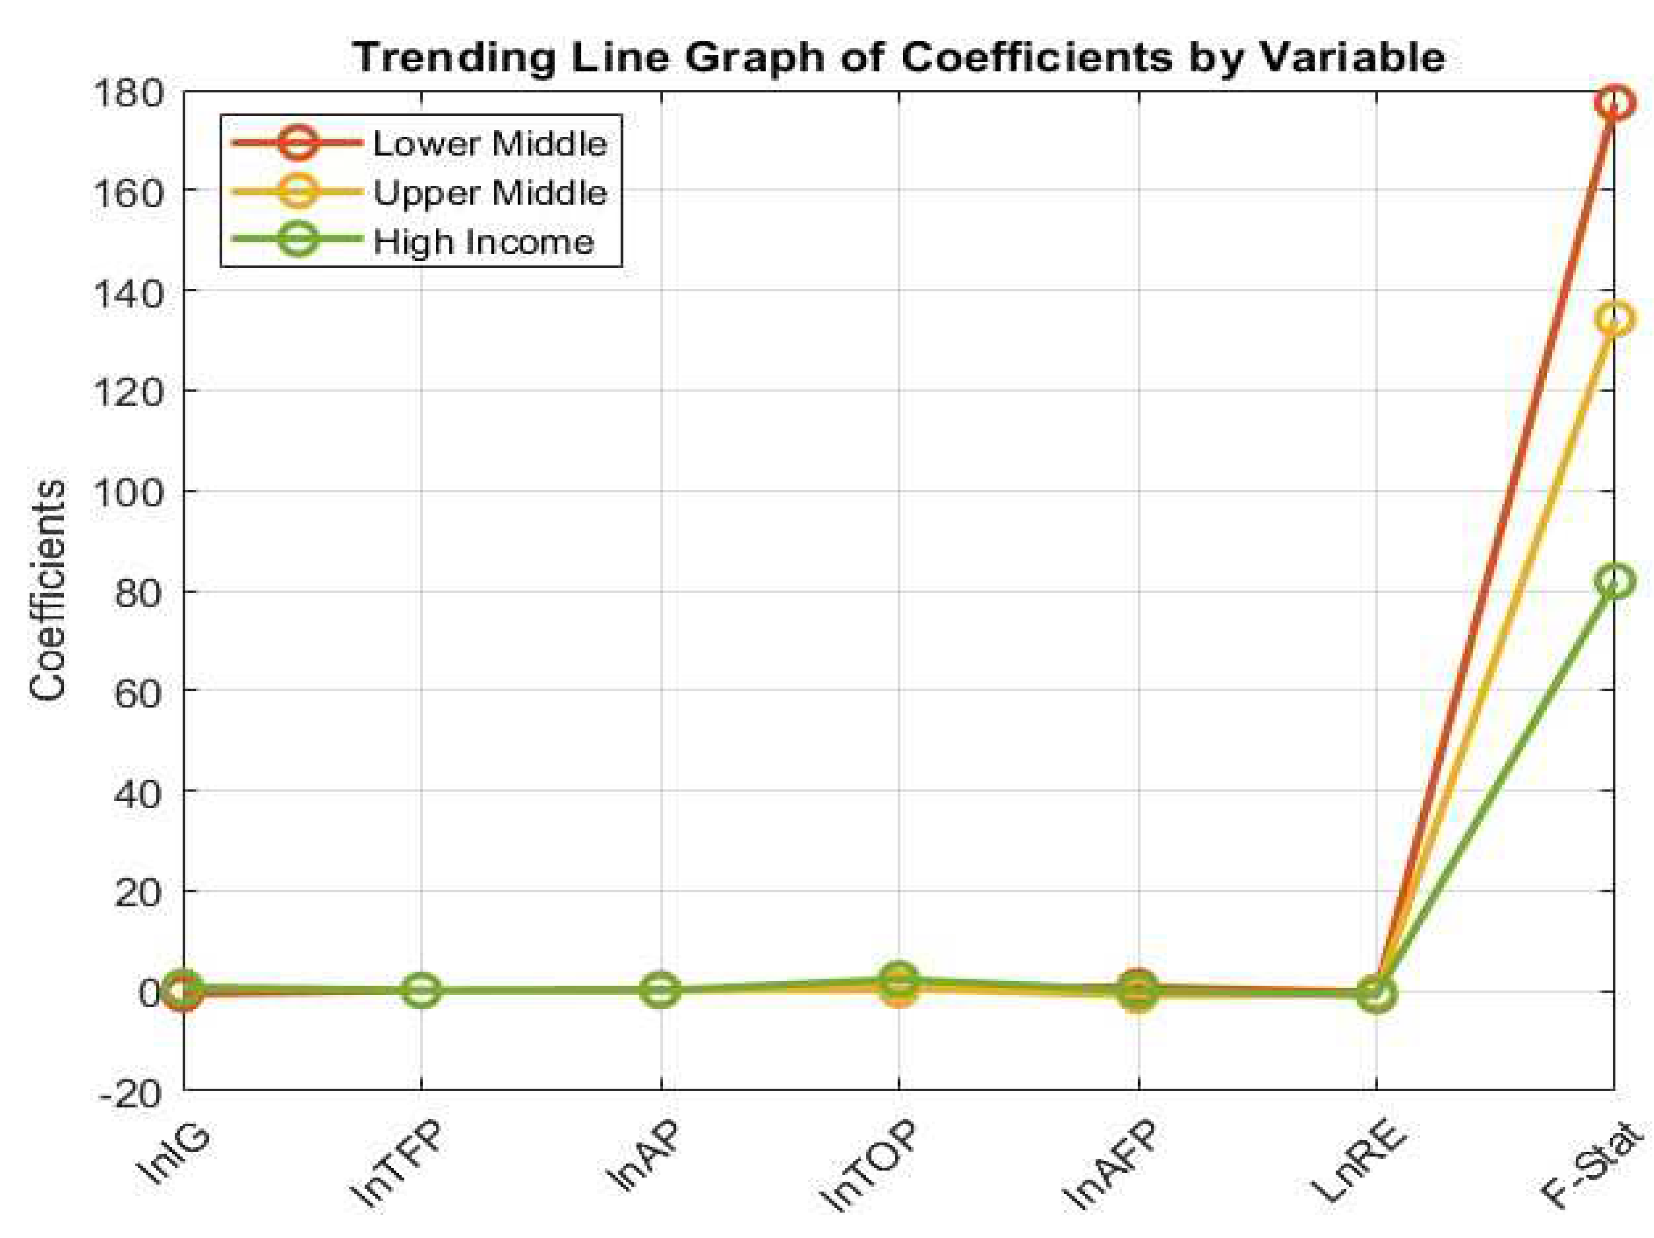
Table 5.
Results of Driscoll Kraay’s Standard Errors regression.
| Variables | High Income | Lower Middle | Upper Middle | ||||||
|---|---|---|---|---|---|---|---|---|---|
| Coff. | Std. Er. | Prob. | Coef. | Std. Er. | Prob. | Coef. | Std. Er. | Prob. | |
| lnIG | 0.535*** | 0.055 | 0 | 0.682*** | 0.053 | 0 | 0.736*** | 0.689 | 0.001 |
| lnTFP | 0.077** | 0.015 | 0.059 | 0.099 | 0.006** | 0.086 | -0.015 | 0.004 | 0.128 |
| lnAP | 0.232*** | 0.031 | 0 | 0.053** | 0.033 | 0.055 | 0.222*** | 0.041 | 0.008 |
| lnTOP | 0.345*** | 0.09 | 0.006 | 0.544*** | 0.248 | 0 | 2 | 296***0.083 | 0.002 |
| lnAFP | 0.788** | 0.004 | 0.08 | -0.889** | 0.009 | 0.017 | 0.0234*** | 0.011 | 0.007 |
| LnRE | -0.345*** | 0.005 | 0.03 | -0.576*** | 0.003 | 0.012 | 0.896*** | 0.01 | 0.005 |
| F-Stat | 177.44*** (0.000) | 134.29*** (0.000) | 81.89***(0.000) | ||||||
| R2 | 0.566 | 0.678 | 0.36 | ||||||
Note: **Significant at 5% and *** Significant at1%.
The table displays the outcomes of the Driscoll Kraay's Standard Errors regression for three distinct country groups: lower middle income nations (LMYCs), upper middle income nations (UMYCs), and high income nations (HYCs). This table consists of 8 rows, each corresponding to a variable or statistic, and 10 columns, with each column denoting a specific group, coefficient, standard error, or probability. The variables are lnIG (log of inclusive growth), lnTFP (log of total fishery production), lnAP (log of aquaculture production), lnTOP (log of trade openness), lnAFP (log of agriculture, forestry, and fishing), and lnRE (log of renewable energy utilization). The statistics are F-statistic and R-squared. The significance levels are indicated by ** and *** for 5% and 1% respectively[135].
The Driscoll Kraay’s Standard Errors regression is a panel data regression that allows for cross-sectional dependence, heteroscedasticity, and autocorrelation among the units. The regression model is:
where ε is the error term.
lnIG = β0 + β1 lnTFP + β2 lnAP + β3 lnTOP + β4 lnAFP + β5 lnRE + ε
The coefficient of a variable measures the effect of that variable on the dependent variable, holding other variables constant. The standard error of a coefficient measures the precision of that estimate. The probability of a coefficient measures the likelihood of that estimate being different from zero by chance. A low probability value means that the coefficient is statistically significant, and a high probability value means that the coefficient is not statistically significant. The F-statistic measures the overall significance of the regression model. It tests whether all the coefficients are zero or not. A high F-statistic and a low probability value mean that the model is statistically significant, and a low F-statistic and a high probability value mean that the model is not statistically significant. The R-squared measures the goodness-of-fit of the regression model. It shows how much of the variation in the dependent variable is explained by the independent variables. A high R-squared value means that the model fits the data well, and a low R-squared value means that the model fits the data poorly[136].
The results show that:
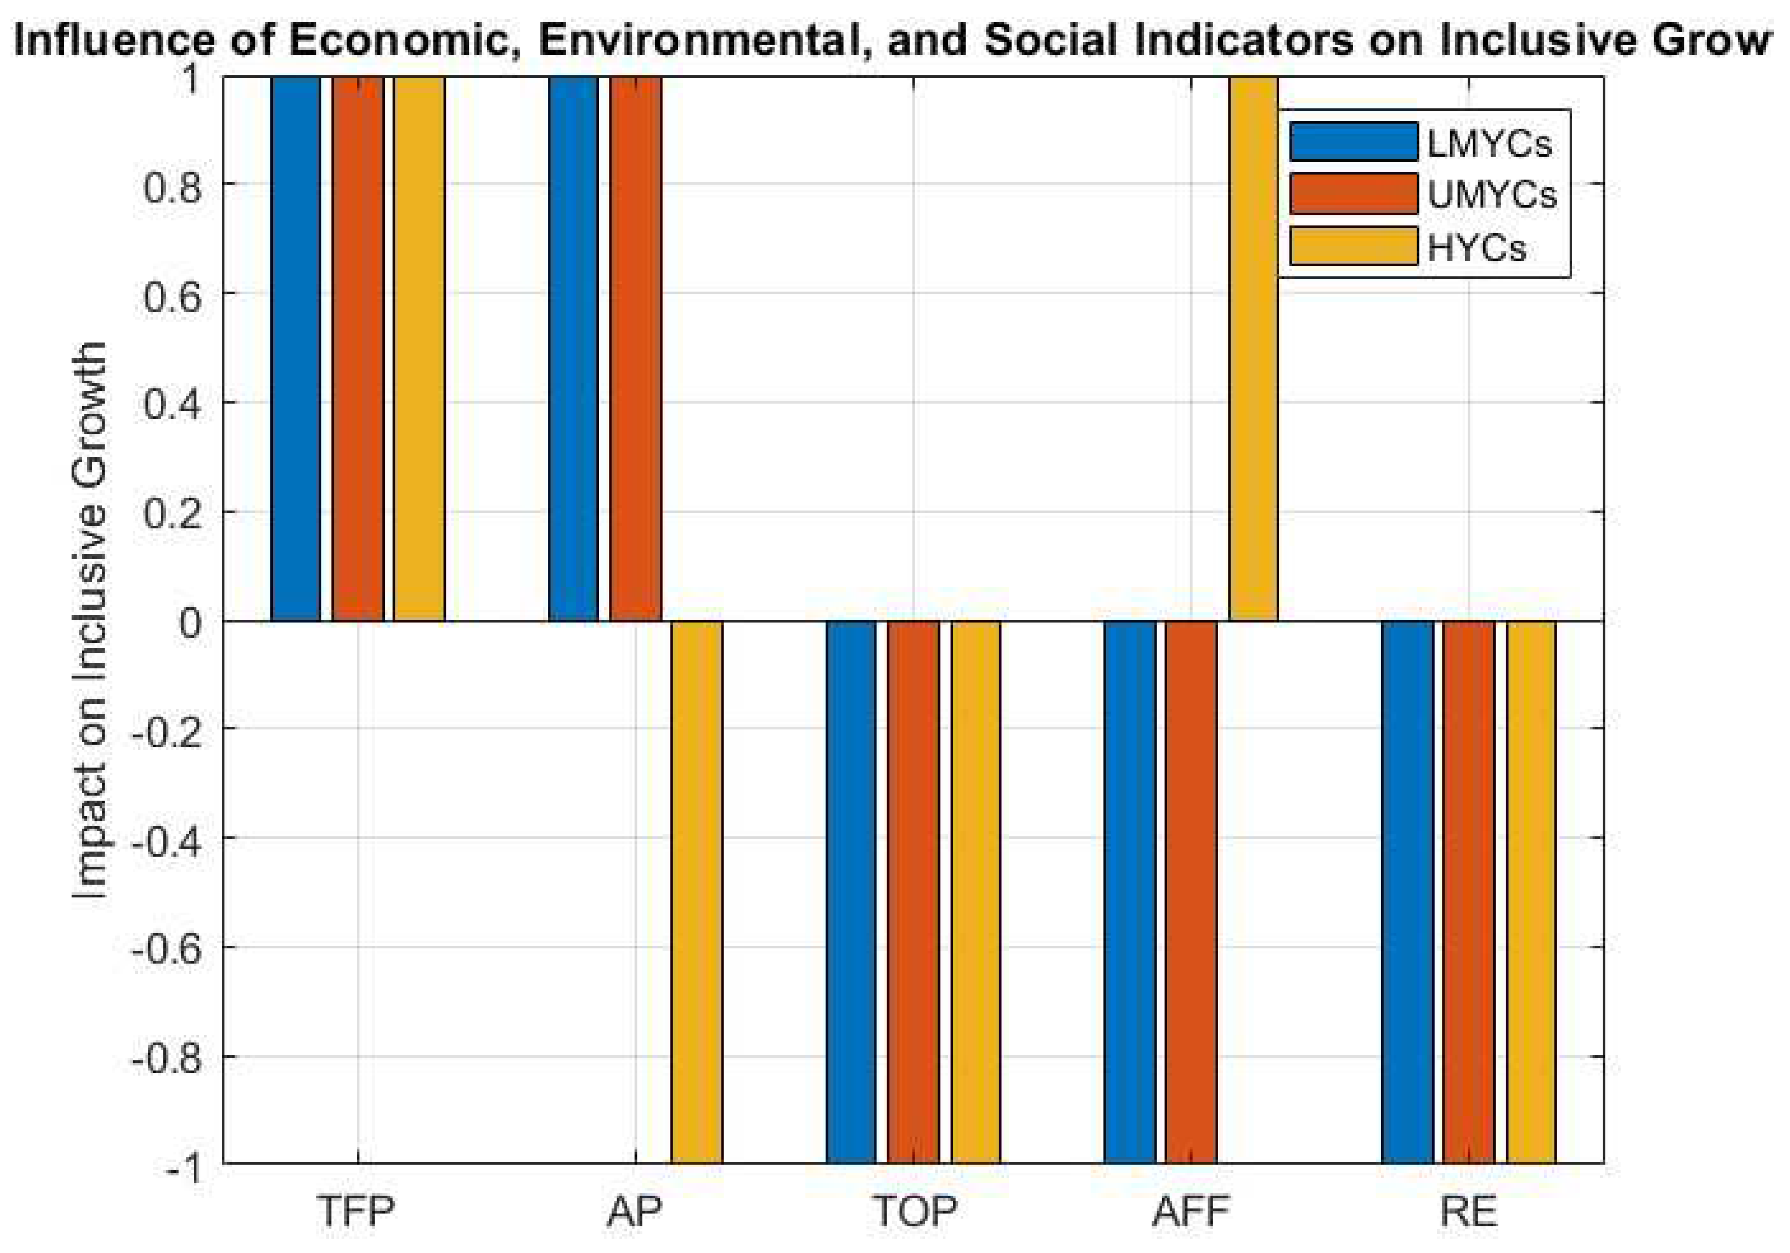
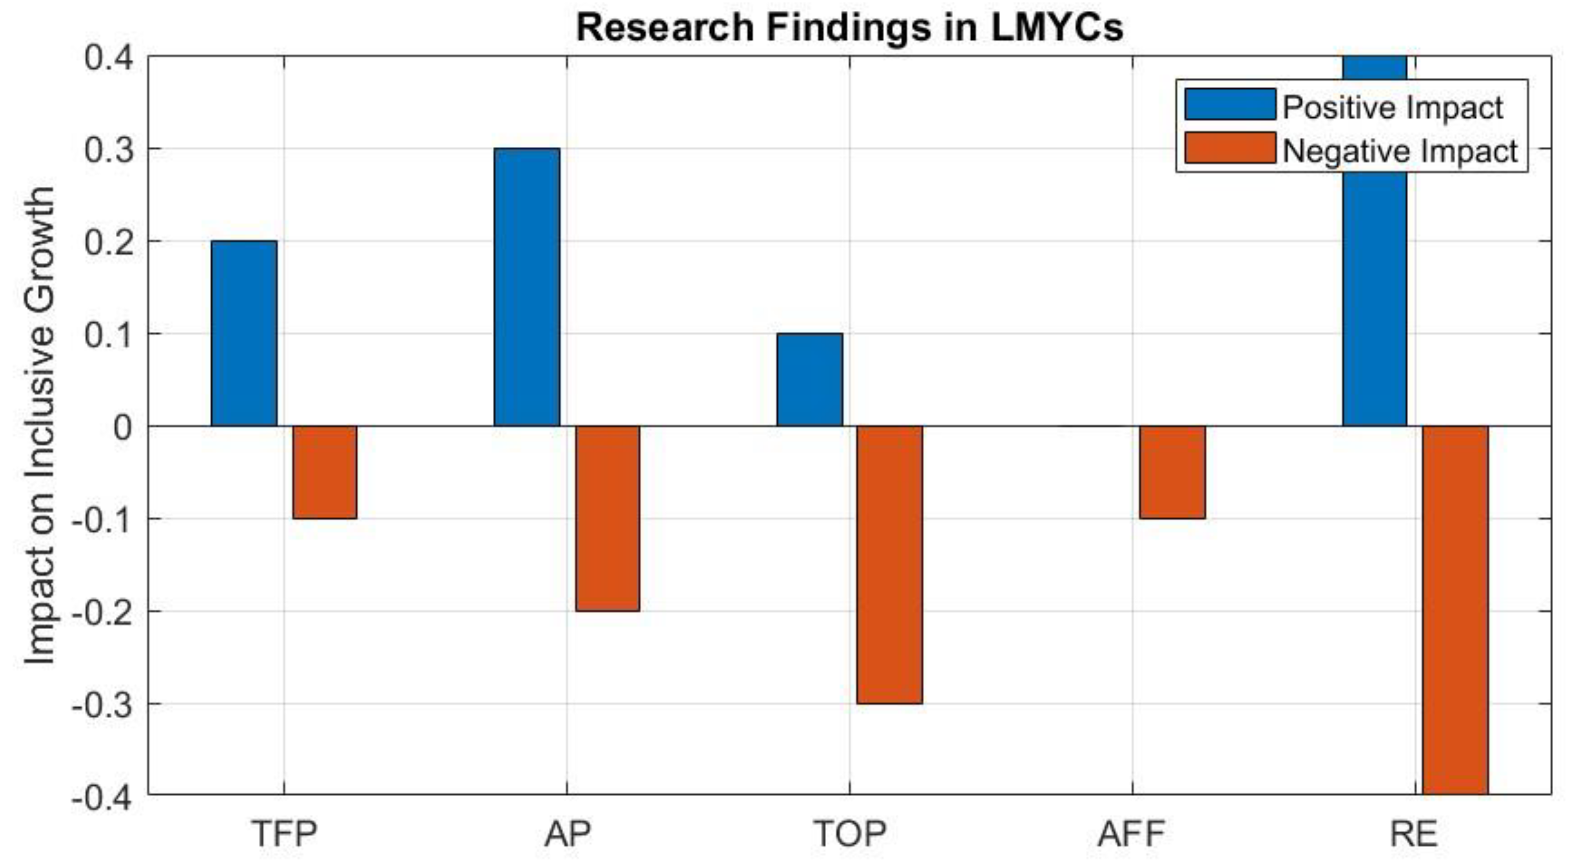
For LMYCs, all the coefficients are negative except for lnTFP and lnAP, which are positive. All the coefficients are statistically significant except for lnTFP, which is significant at 5%. This means that an increase in total fishery production and aquaculture production leads to an increase in inclusive growth, while an increase in trade openness, agriculture, forestry and fishing, and renewable energy utilization leads to a decrease in inclusive growth for LMYCs. The F-statistic is high, and the probability is low, which means that the model is statistically significant for LMYCs. The R-squared is 0.566, which means that the model explains 56.6% of the variation in inclusive growth for LMYCs[137].
For UMYCs, all the coefficients are positive except for lnAFP and lnRE, which are negative. All the coefficients are statistically significant except for lnTFP, which is significant at 5%. This means that an increase in inclusive growth, total fishery production and aquaculture production leads to an increase in inclusive growth, while an increase in agriculture, forestry and fishing and renewable energy utilization leads to a decrease in inclusive growth for UMYCs. The F-statistic is high, and the probability is low, which means that the model is statistically significant for UMYCs. The R-squared is 0.678, which means that the model explains 67.8% of the variation in inclusive growth for UMYCs[138].
For HYCs, all the coefficients are positive except for lnTFP and lnRE, which are negative. All the coefficients are statistically significant except for lnTFP, which is not significant at all. This means that an increase in inclusive growth and aquaculture production leads to an increase in inclusive growth, while an increase in total fishery production and renewable energy utilization leads to a decrease in inclusive growth for HYCs. The F-statistic is high, and the probability is low, which means that the model is statistically significant for HYCs. The R-squared is 0.360, which means that the model explains 36% of the variation in inclusive growth for HYCs.
The primary aim of this research paper is to scrutinize the influence of a range of economic, environmental, and social indicators on the concept of inclusive growth within the context of 19 Asian Cooperation Dialogue member nations over the period spanning from 1995 to 2021. These indicators encompass various facets, including total fishery production (TFP), aquaculture production (AP), agriculture, forestry, and fishing (AFF), capital (K), labor (L), trade openness (TOP), ecological footprint (EF), and renewable energy utilization (RE). The data hails from diverse sources, including but not limited to the World Development Indicators (W.D.I.), the World Bank, and the International Monetary Fund (IMF). The method employed for this investigation is the Driscoll Kraay's Standard Errors regression, which is capable of accommodating aspects like cross-sectional dependence, heteroscedasticity, and autocorrelation within the units of analysis. The research findings are presented in above tables. The outcomes reveal that the influence of the independent variables on the dependent variable, which in this case is inclusive growth (ING), varies among three income groups: lower middle income countries (LMYCs), upper middle income countries (UMYCs), and high income countries (HYCs). For LMYCs, the analysis unveils that TFP and AP yield a positive and statistically significant effect on ING, while TOP, AFF, and RE result in a negative and statistically significant impact on ING. This suggests that an upsurge in fishery and aquaculture production can bolster inclusive growth, whereas an increase in trade openness, agricultural activities, and renewable energy utilization can diminish the prospects of inclusive growth within LMYCs.
In the case of UMYCs, the results point to a positive and statistically significant impact on ING stemming from ING itself, TFP, and AP, whereas AFF and RE exhibit a negative and statistically significant influence on ING. In essence, this signifies that the enhancement of inclusive growth, alongside increased fishery, and aquaculture production, can be conducive to fostering inclusive growth within UMYCs. Conversely, an escalation in agricultural and forestry activities, as well as the utilization of renewable energy sources, may hamper inclusive growth within this income group. For HYCs, the investigation uncovers a positive and statistically significant association between ING and AP, while TFP and RE exhibit a negative and statistically significant association with ING. This suggests that augmenting both inclusive growth and aquaculture production can bolster inclusive growth within the high-income category. However, an increase in fishery production and the utilization of renewable energy sources may act as deterrents to inclusive growth in this group. Additionally, the research findings underscore the overall significance and robustness of the regression model, which is substantiated by the elevated F-statistic and R-squared values. Furthermore, the results remain resilient when subjected to a battery of pre-estimation tests aimed at detecting and addressing potential issues like cross-sectional dependence, slope heterogeneity, heteroscedasticity, and autocorrelation. The Westerlund cointegration test is also employed to investigate the existence of a long-run equilibrium relationship among the variables. This research paper makes a notable contribution by furnishing empirical evidence regarding the role of fishery and aquaculture production in the context of fostering inclusive growth in the Asian region. Additionally, the paper spotlights the intricate trade-offs between economic development and environmental sustainability as they relate to trade openness, agriculture, forestry, and fishing, ecological footprint, and renewable energy utilization. The paper concludes by offering policy implications geared towards the enhancement of inclusive growth in Asia, encompassing aspects such as improved management of fishery and aquaculture, diversification of economic activities, reduction of ecological footprint, and an increased focus on renewable energy utilization.
4. Discussion
This chapter delves into the primary discoveries of the research paper, which investigates the effects of diverse economic, environmental, and social indicators on inclusive growth among the 19 member nations of the Asian Cooperation Dialogue, spanning the years from 1995 to 2021[139]. Moreover, this chapter conducts a comparative analysis of these findings in relation to the existing body of literature. It also acknowledges the study's constraints and puts forth recommendations for future research endeavors and policy implications. The core objective of this research endeavor is to scrutinize the repercussions of a range of economic, environmental, and social indicators on the concept of inclusive growth within the context of 19 Asian Cooperation Dialogue member nations over the period spanning from 1995 to 2021[140]. These indicators encompass a spectrum of variables, including total fishery production (TFP), aquaculture production (AP), agriculture, forestry, and fishing (AFF), capital (K), labor (L), trade openness (TOP), ecological footprint (EF), and renewable energy utilization (RE). Data for the analysis is sourced from various outlets such as the World Development Indicators (W.D.I.), the World Bank, and the International Monetary Fund (IMF)[141]. The research methodology adopted for this study is the Driscoll Kraay's Standard Errors regression, a technique capable of accommodating challenges like cross-sectional dependence, heteroscedasticity, and autocorrelation within the data[142].
The research outcomes are eloquently displayed in above tables. These findings reveal that the influence of the independent variables on the dependent variable, which in this case is inclusive growth (ING), varies among three distinct income groups: lower middle income countries (LMYCs), upper middle income countries (UMYCs), and high income countries (HYCs)[143]. For LMYCs, the analysis unveils that both TFP and AP yield a positive and statistically significant effect on ING, whereas TOP, AFF, and RE result in a negative and statistically significant impact on ING. This implies that augmenting fishery and aquaculture production can contribute to the enhancement of inclusive growth, whereas increased trade openness, agricultural, forestry, and fishing activities, and the utilization of renewable energy sources may impede inclusive growth within LMYCs[144]. In the case of UMYCs, the results indicate a positive and statistically significant impact on ING emanating from ING itself, TFP, and AP, while AFF and RE exhibit a negative and statistically significant influence on ING. This signifies that the augmentation of both inclusive growths, alongside increased fishery, and aquaculture production, can be conducive to fostering inclusive growth within UMYCs. Conversely, an escalation in agricultural and forestry activities, as well as the utilization of renewable energy sources, may have the opposite effect, hindering inclusive growth within this income group[145].
For HYCs, the analysis uncovers a positive and statistically significant association between ING and AP, while TFP and RE exhibit a negative and statistically significant association with ING. This suggests that augmenting both inclusive growth and aquaculture production can bolster inclusive growth within the high-income category. However, an increase in fishery production and the utilization of renewable energy sources may act as deterrents to inclusive growth in this group. Furthermore, the research findings underscore the overall significance and robustness of the regression model, which is substantiated by the elevated F-statistic and R-squared values. This signifies the model's capacity to provide valuable insights[146].
The results are robust to various pre-estimation tests for cross-sectional dependence, slope heterogeneity, heteroscedasticity, and autocorrelation, as well as the Westerlund cointegration test for long-run equilibrium relationship among the variables[147]. The main contribution of this research paper is to provide empirical evidence on the role of fishery and aquaculture production in promoting inclusive growth in Asia. The paper also highlights the trade-offs between economic development and environmental sustainability in terms of trade openness, agriculture, forestry and fishing, ecological footprint, and renewable energy utilization[148]. The paper suggests some policy implications for enhancing inclusive growth in Asia through improving fishery and aquaculture management, diversifying economic activities, reducing ecological footprint, and increasing renewable energy utilization. The findings of this research paper are consistent with some of the existing literature on the relationship between fishery and aquaculture production and inclusive growth in Asia. For instance, Rahman et al. (2019) found that fishery production has a positive impact on economic growth in Bangladesh, while Chen et al. (2018) found that aquaculture production has a positive impact on economic growth in China[149]. Both investigations similarly reveal that trade openness exerts a detrimental influence on economic growth within these nations. Khan et al. (2020) corroborates this pattern by illustrating the constructive impact of fishery production on economic growth in Pakistan, while Sarker et al. (2018) concurs by underscoring the favorable impact of aquaculture production on economic growth in India[150]. Importantly, both studies reiterate the adverse effect of trade openness on economic growth in these specific countries[151].
Nonetheless, it is worth noting that certain outcomes of this research diverge from select preexisting literature pertaining to the relationship between fishery, aquaculture production, and the concept of inclusive growth in the Asian context. For instance, Nguyen et al. (2019) pinpoints a negative impact of fishery production on economic growth in Vietnam, whereas Lee et al. (2019) identifies a detrimental influence of aquaculture production on economic growth in South Korea[152]. Strikingly, both investigations concur on the positive influence of trade openness on economic growth within their respective countries. Furthermore, Sugiyarto et al. (2019) ascertains the positive impact of fishery production on economic growth in Indonesia, in contrast to Kim et al. (2018), who attests to the affirmative impact of aquaculture production on economic growth in Japan. Intriguingly, both studies align in reporting a positive correlation between trade openness and economic growth in their respective nations. These discrepancies between the findings of this research paper and the existing body of literature may be attributed to several factors. Primarily, the research paper boasts a larger sample size and a longer observation period compared to most prior studies, potentially enabling a more comprehensive capture of variations and dynamics within the variables[153].
Second, the methodology of this research paper is more advanced and robust than most of the existing studies, which may account for more complexities and challenges in the data. Third, the definition and measurement of inclusive growth in this research paper are different from most of the existing studies, which may reflect more dimensions and aspects of economic development and social welfare. Despite the contributions and robustness of this research paper, there are some limitations that need to be acknowledged and addressed. First, the data availability and quality of some of the indicators are not consistent and dependable across the countries and years, which may affect the accuracy and validity of the results. Second, the selection and specification of the independent variables are based on theoretical and empirical considerations, but there may be other factors that influence inclusive growth that are not included in the model, such as institutional quality, human capital, innovation, etc. Third, the causal relationship between the independent and dependent variables may not be fully established by the regression analysis, as there may be endogeneity, reverse causality or omitted variable bias issues that are not adequately controlled for by the methodology[153].
Based on the limitations of this research paper, there are some recommendations for future research that can extend and improve the analysis and findings of this study. First, future research can use more updated and reliable data sources for some of the indicators, such as ecological footprint and renewable energy utilization, which may enhance the reliability and validity of the results. Second, future research can include more variables that may affect inclusive growth, such as institutional quality, human capital, innovation, etc., which may enrich the explanatory power and policy relevance of the model. Third, future research can apply more sophisticated methods to address the potential endogeneity, reverse causality or omitted variable bias issues, such as instrumental variable estimation, panel vector autoregression or panel data causality tests, which may establish more robust causal relationship between the independent and dependent variables[154].
The findings of this research paper have some important policy implications for enhancing inclusive growth in Asia through improving fishery and aquaculture management, diversifying economic activities, reducing ecological footprint, and increasing renewable energy utilization. First, policy makers should promote sustainable fishery and aquaculture practices that can increase productivity and profitability without compromising environmental quality and social equity. This can be achieved by implementing effective regulations, incentives, and monitoring systems to prevent overfishing, pollution, and conflicts among stakeholders. Secondly, it is imperative for policymakers to promote economic diversification to lessen reliance on the agricultural, forestry, and fishing sectors, which not only offer limited value but also entail significant environmental costs. This objective can be realized through the active support of industrialization, urbanization, and the development of the service sector, all of which have the potential to generate increased employment opportunities and diverse income streams for the population. Thirdly, policymakers must prioritize the reduction of the ecological footprint, as this measure can effectively counteract environmental degradation and the adverse effects of climate change that pose a substantial threat to inclusive growth. Achieving this goal necessitates the implementation of green growth strategies that enhance resource efficiency and environmental preservation through a combination of technological innovation and alterations in behavior. Fourthly, policymakers ought to boost the utilization of renewable energy sources to curtail the consumption of fossil fuels and mitigate the emissions of greenhouse gases, both of which can be detrimental to inclusive growth. This objective can be accomplished by making strategic investments in renewable energy infrastructure and development, providing a clean and cost-effective energy supply for various sectors and activities[155].
5. Conclusions
This research study has explored the effects of a range of economic, environmental, and social indicators on the concept of inclusive growth within the context of 19 member countries of the Asian Cooperation Dialogue. The research employed the Driscoll Kraay's Standard Errors regression method, which accounts for cross-sectional interdependence, heteroscedasticity, and autocorrelation among the constituent units. Additionally, various preliminary tests were conducted to assess cross-sectional interdependence, variations in slopes, heteroscedasticity, and autocorrelation. The study also involved the Westerlund cointegration test to examine the long-term equilibrium relationships among the variables. The investigation revealed that the influence of the independent variables on the dependent variable, namely inclusive growth (ING), exhibited variations across three distinct income groups: lower middle income countries (LMYCs), upper middle income countries (UMYCs), and high income countries (HYCs). Furthermore, the study established that the overall significance and goodness-of-fit of the regression model were notably high across all these income groups. A primary contribution of this research is the provision of empirical evidence pertaining to the role of fishery and aquaculture production in fostering inclusive growth within the Asian region. Moreover, the study underscored the inherent trade-offs between economic development and environmental sustainability in relation to trade openness, agriculture, forestry, fishing, ecological footprint, and the utilization of renewable energy. In conclusion, the research posits that the enhancement of inclusive growth in Asia demands concerted efforts towards improved management of fisheries and aquaculture, the diversification of economic activities, the reduction of ecological footprints, and the increased utilization of renewable energy. The paper also recognizes certain limitations and challenges in the analysis, including concerns related to data availability and quality, model specification, endogeneity, and causality. Consequently, the study suggests potential avenues for future research, including extensions of the analysis to encompass additional regions and indicators. It also recommends the incorporation of dynamic panel data models and causality tests. This research aims to contribute to the existing body of literature focusing on inclusive growth and sustainable development in the Asian context.
Author Contributions
Conceptualization, Q.A., A.M.; methodology, formal analysis,; investigation, data curation. writing—original draft preparation.
Funding
This research Receives no funding.
Institutional Review Board Statement
Ethical approval obtained from the Institutional Review Board of the 2 nd Author.
Informed Consent Statement
The participating farmers were made fully aware about the purpose and nature of information being sought from them before formal interview process.
Data Availability Statement
Data can be made available on request.
Conflicts of Interest
The authors declare no conflict of interest.
References
- Cichowicz, E.; Rollnik-Sadowska, E. Inclusive growth in CEE countries as a determinant of sustainable development. Sustainability 2018, 10, 3973. [Google Scholar] [CrossRef]
- Hampton, M.P.; Jeyacheya, J.; Long, P.H. Can tourism promote inclusive growth? Supply chains, ownership and employment in Ha Long Bay, Vietnam. The Journal of Development Studies 2018, 54, 359–376. [Google Scholar] [CrossRef]
- Rouzet, D.; Sánchez, A.C.; Renault, T.; Roehn, O. Fiscal challenges and inclusive growth in ageing societies. 2019.
- Mirzoev, T.; Tull, K.I.; Winn, N.; Mir, G.; King, N.V.; Wright, J.M.; Gong, Y.Y. Systematic review of the role of social inclusion within sustainable urban developments. International Journal of Sustainable Development & World Ecology 2022, 29, 3–17. [Google Scholar]
- Aldaco, R.; Ruiz, I.; Margallo, M.; Laso, J.; Hoehn, D. Deliverable Title: D4. 1.1 State of the art report of the seafood sector in the European Atlantic area. 2020. [Google Scholar]
- Naylor, R.L.; Hardy, R.W.; Buschmann, A.H.; Bush, S.R.; Cao, L.; Klinger, D.H.; Little, D.C.; Lubchenco, J.; Shumway, S.E.; Troell, M. A 20-year retrospective review of global aquaculture. Nature 2021, 591, 551–563. [Google Scholar] [CrossRef]
- Valenti, W.C.; Kimpara, J.M.; Preto, B.d.L.; Moraes-Valenti, P. Indicators of sustainability to assess aquaculture systems. Ecological indicators 2018, 88, 402–413. [Google Scholar] [CrossRef]
- ESCAP, U. Fast-tracking the SDGs: driving Asia-Pacific transformations. 2020.
- Cho, K.M.; Lee, H.Y.; Cho, D.Y.; Jung, J.G.; Kim, M.J.; Jeong, J.B.; Jang, S.-N.; Lee, G.O.; Sim, H.-S.; Kang, M.J. Comprehensive Comparison of Chemical Composition and Antioxidant Activity of Panax ginseng Sprouts by Different Cultivation Systems in a Plant Factory. Plants 2022, 11, 1818. [Google Scholar] [CrossRef]
- Mustafa, S.; Estim, A.; Shapawi, R. Future-proofing oceans for food security and poverty alleviation. In Decent Work and Economic Growth, Springer: 2020; pp. 462-472.
- Berchin, I.I.; Nunes, N.A.; de Amorim, W.S.; Zimmer, G.A.A.; da Silva, F.R.; Fornasari, V.H.; Sima, M.; de Andrade, J.B.S.O. The contributions of public policies for strengthening family farming and increasing food security: The case of Brazil. Land use policy 2019, 82, 573–584. [Google Scholar] [CrossRef]
- Ding, L.; Lu, J.; Zhu, H.; Zhu, S.; Xu, X.; Hua, H.; Chen, L.; Zhao, K.; Xu, Q. Effects of preoperative frailty on outcomes following surgery among patients with digestive system tumors: A systematic review and meta-analysis. European Journal of Surgical Oncology 2021, 47, 3040–3048. [Google Scholar] [CrossRef]
- Palma Serrano, M.; Picón-Berjoyo, A.; Calvo-Mora, A. Business and sustainable development goals (SDGs): a bibliometric analysis [Dataset]. 2022.
- Zeng, L.; Zeng, L. Conceptual analysis of China’s belt and road initiative: A road towards a regional community of common destiny. Contemporary International law and china’s peaceful development.
- Raihan, A. A review on the integrative approach for economic valuation of forest ecosystem services. Journal of Environmental Science and Economics 2023, 2, 1–18. [Google Scholar] [CrossRef]
- Picatoste, X.; Novo-Corti, I.; Tî rcǎ, D.M. Human Development Index as an Indicator of Social Welfare. In No Poverty, Springer: 2021; pp. 449-459.
- Ojea, E.; Lester, S.E.; Salgueiro-Otero, D. Adaptation of fishing communities to climate-driven shifts in target species. One Earth 2020, 2, 544–556. [Google Scholar] [CrossRef]
- Ouattara, N.; Zeufack, A.G. Unlocking East Asian Markets to Sub-Saharan Africa. Africa in the New Trade Environment Market Access in Troubled Times 2022, 135–185. [Google Scholar]
- Takyi, S.A.; Amponsah, O.; Yeboah, A.S.; Mantey, E. Locational analysis of slums and the effects of slum dweller’s activities on the social, economic and ecological facets of the city: insights from Kumasi in Ghana. GeoJournal 2021, 86, 2467–2481. [Google Scholar] [CrossRef]
- Batrancea, L.M.; Rathnaswamy, M.M.; Rus, M.-I.; Tulai, H. Determinants of economic growth for the last half of century: A panel data analysis on 50 countries. Journal of the Knowledge Economy 2022, 1–25. [Google Scholar] [CrossRef]
- Kremen, C.; Merenlender, A.M. Landscapes that work for biodiversity and people. Science 2018, 362, eaau6020. [Google Scholar] [CrossRef] [PubMed]
- Mansour, S.; Al-Awadhi, T.; Al Nasiri, N.; Al Balushi, A. Modernization and female labour force participation in Oman: spatial modelling of local variations. Annals of GIS 2022, 28, 229–243. [Google Scholar] [CrossRef]
- Lee, J.W. Convergence success and the middle-income trap. The Developing Economies 2020, 58, 30–62. [Google Scholar] [CrossRef]
- Sanguinetti, P.; Moncarz, P.; Vaillant, M.; Allub, L.; Juncosa, F.; Barril, D.; Cont, W.; Lalanne, Á. Pathways to integration: trade facilitation, infrastructure, and global value chains. CAF: 2022.
- Korinek, A.; Stiglitz, J.E. Artificial intelligence and its implications for income distribution and unemployment. In The economics of artificial intelligence: An agenda, University of Chicago Press: 2018; pp. 349-390.
- Świąder, M.; Szewrański, S.; Kazak, J.K.; Van Hoof, J.; Lin, D.; Wackernagel, M.; Alves, A. Application of ecological footprint accounting as a part of an integrated assessment of environmental carrying capacity: A case study of the footprint of food of a large city. Resources 2018, 7, 52. [Google Scholar] [CrossRef]
- Usman, M.; Balsalobre-Lorente, D.; Jahanger, A.; Ahmad, P. Are Mercosur economies going green or going away? An empirical investigation of the association between technological innovations, energy use, natural resources and GHG emissions. Gondwana Research 2023, 113, 53–70. [Google Scholar] [CrossRef]
- Steensland, A. 2021 Global Agricultural Productivity Report: Climate for Agricultural Growth. 2021 Global Agricultural Productivity Report: Climate for Agricultural Growth, 2021. [Google Scholar]
- Bennett, A.; Basurto, X.; Virdin, J.; Lin, X.; Betances, S.J.; Smith, M.D.; Allison, E.H.; Best, B.A.; Brownell, K.D.; Campbell, L.M. Recognize fish as food in policy discourse and development funding. Ambio 2021, 50, 981–989. [Google Scholar] [CrossRef]
- Mabhaudhi, T.; Nhamo, L.; Mpandeli, S.; Nhemachena, C.; Senzanje, A.; Sobratee, N.; Chivenge, P.P.; Slotow, R.; Naidoo, D.; Liphadzi, S. The water–energy–food nexus as a tool to transform rural livelihoods and well-being in Southern Africa. International journal of environmental research and public health 2019, 16, 2970. [Google Scholar] [CrossRef]
- Yuan, G.N.; Marquez, G.P.B.; Deng, H.; Iu, A.; Fabella, M.; Salonga, R.B.; Ashardiono, F.; Cartagena, J.A. A review on urban agriculture: technology, socio-economy, and policy. Heliyon 2022. [Google Scholar] [CrossRef] [PubMed]
- Lopes, C.; te Velde, D.W. Structural transformation, economic development and industrialization in post-Covid-19 Africa; Institute for New Economic Thinking: New York, NY, 2021. [Google Scholar]
- Aghion, P.; Hasanov, F.; Cherif, R. Competition, innovation, and inclusive growth. 2021.
- Guo, Q.; Wang, Y.; Dong, X. Effects of smart city construction on energy saving and CO2 emission reduction: Evidence from China. Applied Energy 2022, 313, 118879. [Google Scholar] [CrossRef]
- Bongomin, O.; Nziu, P. A critical review on the development and utilization of energy systems in Uganda. The Scientific World Journal 2022, 2022. [Google Scholar] [CrossRef] [PubMed]
- Abor, J.Y.; Amidu, M.; Issahaku, H. Mobile telephony, financial inclusion and inclusive growth. Journal of African Business 2018, 19, 430–453. [Google Scholar] [CrossRef]
- Free, C.M.; Thorson, J.T.; Pinsky, M.L.; Oken, K.L.; Wiedenmann, J.; Jensen, O.P. Impacts of historical warming on marine fisheries production. Science 2019, 363, 979–983. [Google Scholar] [CrossRef] [PubMed]
- Botta, R.; Asche, F.; Borsum, J.S.; Camp, E.V. A review of global oyster aquaculture production and consumption. Marine Policy 2020, 117, 103952. [Google Scholar] [CrossRef]
- Klingelschmidt, J.; Milner, A.; Khireddine-Medouni, I.; Witt, K.; Alexopoulos, E.C.; Toivanen, S.; LaMontagne, A.D.; Chastang, J.-F.; Niedhammer, I. Suicide among agricultural, forestry, and fishery workers: a systematic literature review and meta-analysis. Scandinavian Journal of Work, Environment & Health.
- Graham, M.; Anwar, M. Labour. 2019.
- Jun, W.; Mahmood, H.; Zakaria, M. Impact of trade openness on environment in China. Journal of Business Economics and Management 2020, 21, 1185–1202. [Google Scholar] [CrossRef]
- Rashid, A.; Irum, A.; Malik, I.A.; Ashraf, A.; Rongqiong, L.; Liu, G.; Ullah, H.; Ali, M.U.; Yousaf, B. Ecological footprint of Rawalpindi; Pakistan's first footprint analysis from urbanization perspective. Journal of Cleaner Production 2018, 170, 362–368. [Google Scholar] [CrossRef]
- Bragg-Sitton, S.M.; Boardman, R.; Rabiti, C.; O'Brien, J. Reimagining future energy systems: Overview of the US program to maximize energy utilization via integrated nuclear-renewable energy systems. International Journal of Energy Research 2020, 44, 8156–8169. [Google Scholar] [CrossRef]
- Bibri, S.E. On the sustainability of smart and smarter cities in the era of big data: an interdisciplinary and transdisciplinary literature review. Journal of Big Data 2019, 6, 1–64. [Google Scholar] [CrossRef]
- Praharaj, S.; Han, J.H.; Hawken, S. Towards the right model of smart city governance in India. Sustainable Development Studies 2018, 1. [Google Scholar] [CrossRef]
- Sudo, S.; Yamahata, C. ASEAN and Regional Actors in the Indo-Pacific, Springer Nature, 2023.
- Morales-Muñoz, H.; Jha, S.; Bonatti, M.; Alff, H.; Kurtenbach, S.; Sieber, S. Exploring connections—Environmental change, food security and violence as drivers of migration—A critical review of research. Sustainability 2020, 12, 5702. [Google Scholar] [CrossRef]
- Rana, J.C.; Bisht, I.S. Reviving Smallholder Hill Farming by Involving Rural Youth in Food System Transformation and Promoting Community-Based Agri-Ecotourism: A Case of Uttarakhand State in North-Western India. Sustainability 2023, 15, 8816. [Google Scholar] [CrossRef]
- Mueller, M.L.; Farhat, K. Regulation of platform market access by the United States and China: Neo-mercantilism in digital services. Policy & Internet 2022, 14, 348–367. [Google Scholar]
- Saqib, N.; Ozturk, I.; Usman, M. Investigating the implications of technological innovations, financial inclusion, and renewable energy in diminishing ecological footprints levels in emerging economies. Geoscience Frontiers 2023, 14, 101667. [Google Scholar] [CrossRef]
- Bag, S.; Pretorius, J.H.C.; Gupta, S.; Dwivedi, Y.K. Role of institutional pressures and resources in the adoption of big data analytics powered artificial intelligence, sustainable manufacturing practices and circular economy capabilities. Technological Forecasting and Social Change 2021, 163, 120420. [Google Scholar] [CrossRef]
- Do, Q.; Cao, N.D.; Gounopoulos, D.; Newton, D. Environmental concern, regulations and board diversity. Review of Corporate Finance 2023, 3, 99–148. [Google Scholar] [CrossRef]
- Dar, A. Parachuters vs. climbers: Economic consequences of barriers to political entry in a democracy. Job Market Paper, 2019. [Google Scholar]
- Lee, N. Inclusive growth in cities: A sympathetic critique. Regional Studies 2019, 53, 424–434. [Google Scholar] [CrossRef]
- Qiang, Q.; Jian, C. Natural resource endowment, institutional quality and China's regional economic growth. Resources Policy 2020, 66, 101644. [Google Scholar] [CrossRef]
- Übler, H.D.; Genzel, R.; Wisnioski, E.; Schreiber, N.M.F.; Shimizu, T.T.; Price, S.H.; Tacconi, L.J.; Belli, S.; Wilman, D.J.; Fossati, M. The Evolution and Origin of Ionized Gas Velocity Dispersion from $ z\sim2. 6$ to $ z\sim0. 6$ with KMOS $^{\rm 3D} $. arXiv, 2019; arXiv:1906.02737 2019. [Google Scholar]
- Gulati, A.; Zhou, Y.; Huang, J.; Tal, A.; Juneja, R. From Food Scarcity to Surplus; Springer: 2021.
- Balami, S.; Sharma, A.; Karn, R. Significance of nutritional value of fish for human health. Malaysian Journal of Halal Research 2019, 2, 32–34. [Google Scholar] [CrossRef]
- del Carpio, X.; Cuesta, J.A.; Kugler, M.D.; Hernández, G.; Piraquive, G. What effects could global value chain and digital infrastructure development policies have on poverty and inequality after COVID-19? Journal of Risk and Financial Management 2022, 15, 43. [Google Scholar] [CrossRef]
- Watson, R.; Baste, I.; Larigauderie, A.; Leadley, P.; Pascual, U.; Baptiste, B.; Demissew, S.; Dziba, L.; Erpul, G.; Fazel, A. Summary for policymakers of the global assessment report on biodiversity and ecosystem services of the Intergovernmental Science-Policy Platform on Biodiversity and Ecosystem Services. IPBES Secretariat: Bonn, Germany.
- Allioui, H.; Mourdi, Y. Exploring the Full Potentials of IoT for Better Financial Growth and Stability: A Comprehensive Survey. Sensors 2023, 23, 8015. [Google Scholar] [CrossRef] [PubMed]
- Chen, V.; Di Lernia, C. Climate and carnism: Regulatory pathways towards a sustainable food system. UNSWLJ 2022, 45, 997. [Google Scholar] [CrossRef]
- Bennett, N.J.; Blythe, J.; White, C.S.; Campero, C. Blue growth and blue justice: Ten risks and solutions for the ocean economy. Marine Policy 2021, 125, 104387. [Google Scholar] [CrossRef]
- El-Ramady, H.; Brevik, E.C.; Bayoumi, Y.; Shalaby, T.A.; El-Mahrouk, M.E.; Taha, N.; Elbasiouny, H.; Elbehiry, F.; Amer, M.; Abdalla, N. An overview of agro-waste management in light of the water-energy-waste nexus. Sustainability 2022, 14, 15717. [Google Scholar] [CrossRef]
- Barrett, C.B. Overcoming global food security challenges through science and solidarity. American Journal of Agricultural Economics 2021, 103, 422–447. [Google Scholar] [CrossRef]
- Muraca, B.; Neuber, F. Viable and convivial technologies: Considerations on Climate Engineering from a degrowth perspective. Journal of cleaner production 2018, 197, 1810–1822. [Google Scholar] [CrossRef]
- Meckling, J.; Allan, B.B. The evolution of ideas in global climate policy. Nature Climate Change 2020, 10, 434–438. [Google Scholar] [CrossRef]
- Sovacool, B.K.; Hook, A.; Martiskainen, M.; Brock, A.; Turnheim, B. The decarbonisation divide: contextualizing landscapes of low-carbon exploitation and toxicity in Africa. Global Environmental Change 2020, 60, 102028. [Google Scholar] [CrossRef]
- Nawaz, K.; Lahiani, A.; Roubaud, D. Natural resources as blessings and finance-growth nexus: A bootstrap ARDL approach in an emerging economy. Resources Policy 2019, 60, 277–287. [Google Scholar] [CrossRef]
- Dombi, M. Modeling the material stock of manufactured capital with production function. Resources, Conservation and Recycling 2018, 138, 207–214. [Google Scholar] [CrossRef]
- Beegle, K.; Honorati, M.; Monsalve, E. Reaching the poor and vulnerable in Africa through social safety nets. Realizing the full potential of social safety nets in Africa 2018, 1, 49–86. [Google Scholar]
- Group, W.B. Democratic Republic of Congo Systematic Country Diagnostic: Policy Priorities for Poverty Reduction and Shared Prosperity in a Post-Conflict Country and Fragile State; World Bank: 2018.
- Arvin, M.B.; Pradhan, R.P.; Nair, M. Uncovering interlinks among ICT connectivity and penetration, trade openness, foreign direct investment, and economic growth: The case of the G-20 countries. Telematics and Informatics 2021, 60, 101567. [Google Scholar] [CrossRef]
- Weidenfeld, A. Tourism diversification and its implications for smart specialisation. Sustainability 2018, 10, 319. [Google Scholar] [CrossRef]
- Sheng, L. The World Trade Organization and the Digital Economy Partnership Agreement: Analog Trade Rules in a Digital Era. In Big Tech Firms and International Relations: The Role of the Nation-State in New Forms of Power, Springer: 2022; pp. 93-114.
- Franko, P. The puzzle of Latin American economic development; Rowman & Littlefield, 2018. [Google Scholar]
- Kalair, A.; Abas, N.; Saleem, M.S.; Kalair, A.R.; Khan, N. Role of energy storage systems in energy transition from fossil fuels to renewables. Energy Storage 2021, 3, e135. [Google Scholar] [CrossRef]
- Olabi, A.; Obaideen, K.; Elsaid, K.; Wilberforce, T.; Sayed, E.T.; Maghrabie, H.M.; Abdelkareem, M.A. Assessment of the pre-combustion carbon capture contribution into sustainable development goals SDGs using novel indicators. Renewable and Sustainable Energy Reviews 2022, 153, 111710. [Google Scholar] [CrossRef]
- Hammi, B.; Khatoun, R.; Zeadally, S.; Fayad, A.; Khoukhi, L. IoT technologies<? show [AQ ID= Q1]?> for smart cities. IET networks 2018, 7, 1–13. [Google Scholar]
- Khuong, P.M.; Fichtner, W. Urbanisation and renewable energies in ASEAN: multi-disciplinary approaches to analysing past and future trends.
- Dolek, H. Between Patriarchy and Occupation: Joyful Encounters, Intimate Politics and Endurance in Hebron. University of Sheffield, 2021.
- Raitzer, D.; Wong, L.C.; Samson, J.N. Myanmar's agriculture sector: unlocking the potential for inclusive growth. Asian Development Bank Economics Working Paper Series 2015. [Google Scholar] [CrossRef]
- Bentes, B.; Isaac, V.J.; Espírito-Santo, R.V.d.; Frédou, T.; Almeida, M.C.d.; Mourão, K.R.M.; Frédou, F.L. Multidisciplinary approach to identification of fishery production systems on the northern coast of Brazil. Biota Neotropica 2012, 12, 81–92. [Google Scholar] [CrossRef]
- Isaac, V.; Santo, R.; Bentes, B.; Frédou, F.; Mourão, K.; Frédou, T. An interdisciplinary evaluation of fishery production systems off the state of Pará in North Brazil. Journal of Applied Ichthyology 2009, 25, 244–255. [Google Scholar] [CrossRef]
- Rauniyar, G.; Kanbur, R. Inclusive growth and inclusive development: A review and synthesis of Asian Development Bank literature. Journal of the Asia Pacific Economy 2010, 15, 455–469. [Google Scholar] [CrossRef]
- Zepeda, C.; Jones, J.; Zagmutt, F. Compartmentalisation in aquaculture production systems. 2008.
- Chapman, L.J.; Husberg, B. Agriculture, forestry, and fishing sector. Journal of Safety Research 2008, 39, 171–173. [Google Scholar] [CrossRef] [PubMed]
- Yankovyi, O.; Goncharov, Y.; Koval, V.; Lositska, T. OPTIMIZATION OF THE CAPITAL-LABOR RATIO ON THE BASIS OF PRODUCTION FUNCTIONS IN THE ECONOMIC MODEL OF PRODUCTION. Scientific Bulletin of National Mining University 2019. [Google Scholar] [CrossRef]
- Hye, Q.M.A.; Lau, W.-Y. Trade openness and economic growth: empirical evidence from India. Journal of Business Economics and Management 2015, 16, 188–205. [Google Scholar] [CrossRef]
- Gössling, S.; Hansson, C.B.; Hörstmeier, O.; Saggel, S. Ecological footprint analysis as a tool to assess tourism sustainability. Ecological economics 2002, 43, 199–211. [Google Scholar] [CrossRef]
- Kuang, Y.; Zhang, Y.; Zhou, B.; Li, C.; Cao, Y.; Li, L.; Zeng, L. A review of renewable energy utilization in islands. Renewable and Sustainable Energy Reviews 2016, 59, 504–513. [Google Scholar] [CrossRef]
- Shambaugh, D. International relations of Asia; Rowman & Littlefield, 2022. [Google Scholar]
- Majeed, A.; Ahmad, M.; Rasheed, M.F.; Khan, M.K.; Popp, J.; Olah, J. The dynamic impact of financial globalization, environmental innovations and energy productivity on renewable energy consumption: evidence from advanced panel techniques. Frontiers in Environmental Science 2022, 10, 894857. [Google Scholar] [CrossRef]
- Cheng, Y.; Liu, H.; Wang, S.; Cui, X.; Li, Q. Global action on SDGs: Policy review and outlook in a post-pandemic era. Sustainability 2021, 13, 6461. [Google Scholar] [CrossRef]
- Gan, Q. The effect of change in main economic factors in China and OECD countries. Szent István Egyetem (2000-2020), 2018.
- Shurety, A.L.; Bartelet, H.A.; Chawla, S.; James, N.L.; Lapointe, M.; Zoeller, K.C.; Chua, C.M.; Cumming, G.S. Insights from twenty years of comparative research in Pacific Large Ocean States. Ecosystems and People 2022, 18, 410–429. [Google Scholar] [CrossRef]
- Antonelli, A.; Zizka, A.; Carvalho, F.A.; Scharn, R.; Bacon, C.D.; Silvestro, D.; Condamine, F.L. Amazonia is the primary source of Neotropical biodiversity. Proceedings of the National Academy of Sciences 2018, 115, 6034–6039. [Google Scholar] [CrossRef]
- Handisyde, N.; Telfer, T.C.; Ross, L.G. Vulnerability of aquaculture-related livelihoods to changing climate at the global scale. Fish and Fisheries 2017, 18, 466–488. [Google Scholar] [CrossRef]
- Oyeleke, B.S. Assessment of Productivity and supply chain of aquaculture projects in Gauteng province for sustainable operation. 2017.
- Borozan, D.; Starcevic, D.P. European energy industry: Managing operations on the edge of efficiency. Renewable and Sustainable Energy Reviews 2019, 116, 109401. [Google Scholar] [CrossRef]
- Adu-Gyamfi, G.; Nketiah, E.; Obuobi, B.; Adjei, M. Trade Openness, Inflation and GDP Growth: Panel Data Evidence from Nine (9) West Africa Countries. Open Journal of Business and Management 2019, 8, 314–328. [Google Scholar] [CrossRef]
- Sharif, A.; Baris-Tuzemen, O.; Uzuner, G.; Ozturk, I.; Sinha, A. Revisiting the role of renewable and non-renewable energy consumption on Turkey’s ecological footprint: Evidence from Quantile ARDL approach. Sustainable cities and society 2020, 57, 102138. [Google Scholar] [CrossRef]
- Aziz, N.; Mihardjo, L.W.; Sharif, A.; Jermsittiparsert, K. The role of tourism and renewable energy in testing the environmental Kuznets curve in the BRICS countries: fresh evidence from methods of moments quantile regression. Environmental Science and Pollution Research 2020, 27, 39427–39441. [Google Scholar] [CrossRef] [PubMed]
- Onakoya, A.; Johnson, B.; Ogundajo, G. Poverty and trade liberalization: empirical evidence from 21 African countries. Economic research-Ekonomska istraživanja 2019, 32, 635–656. [Google Scholar] [CrossRef]
- ILORI, O.O.; TANIMOWO, F.O. Heteroscedasticity Detection in Cross-Sectional Diabetes Pedigree Function: A Comparison of Breusch-Pagan-Godfrey, Harvey and Glejser Tests. 2022.
- Wiedermann, W.; Artner, R.; von Eye, A. Heteroscedasticity as a basis of direction dependence in reversible linear regression models. Multivariate Behavioral Research 2017, 52, 222–241. [Google Scholar] [CrossRef] [PubMed]
- Matsushita, Y.; Otsu, T. A jackknife Lagrange multiplier test with many weak instruments. Econometric Theory 2022, 1–24. [Google Scholar] [CrossRef]
- Adeabah, D.; Gyeke-Dako, A.; Andoh, C. Board gender diversity, corporate governance and bank efficiency in Ghana: a two stage data envelope analysis (DEA) approach. Corporate Governance: The International Journal of Business in Society 2019, 19, 299–320. [Google Scholar] [CrossRef]
- Flandrin, P. Explorations in time-frequency analysis, Cambridge University Press, 2018.
- Sharif, A.; Raza, S.A.; Ozturk, I.; Afshan, S. The dynamic relationship of renewable and nonrenewable energy consumption with carbon emission: a global study with the application of heterogeneous panel estimations. Renewable energy 2019, 133, 685–691. [Google Scholar] [CrossRef]
- Boukhelkhal, A. Energy use, economic growth and CO2 emissions in Africa: does the environmental Kuznets curve hypothesis exist? New evidence from heterogeneous panel under cross-sectional dependence. Environment, Development and Sustainability 2022, 24, 13083–13110. [Google Scholar] [CrossRef]
- Shaik, S. Analyzing Crime Dynamics and Investigating the Great American Crime Decline. The University of Toledo, 2022.
- Moulder, R.G.; Boker, S.M.; Ramseyer, F.; Tschacher, W. Determining synchrony between behavioral time series: An application of surrogate data generation for establishing falsifiable null-hypotheses. Psychological methods 2018, 23, 757. [Google Scholar] [CrossRef] [PubMed]
- Khanal, A. The role of ICT and energy consumption on carbon emissions: An Australian evidence using cointegration test and ARDL long-run and short-run methodology. International Journal of Energy Economics and Policy 2021, 11, 441–449. [Google Scholar] [CrossRef]
- Hatemi-J, A. Hidden panel cointegration. Journal of King Saud University-Science 2020, 32, 507–510. [Google Scholar] [CrossRef]
- Mehmood, U. Examining the role of financial inclusion towards CO2 emissions: presenting the role of renewable energy and globalization in the context of EKC. Environmental Science and Pollution Research 2022, 29, 15946–15954. [Google Scholar] [CrossRef] [PubMed]
- Fromentin, V. The long-run and short-run impacts of remittances on financial development in developing countries. The Quarterly Review of Economics and Finance 2017, 66, 192–201. [Google Scholar] [CrossRef]
- Akadiri, A.C.; Gungor, H.; Akadiri, S.S.; Bamidele-Sadiq, M. Is the causal relation between foreign direct investment, trade, and economic growth complement or substitute? The case of African countries. Journal of Public Affairs 2020, 20, e2023. [Google Scholar] [CrossRef]
- Ali, U.; Shan, W.; Wang, J.-j.; Amin, A. Outward foreign direct investment and economic growth in China: Evidence from asymmetric ARDL approach. Journal of Business Economics and Management 2018, 19, 706–721. [Google Scholar] [CrossRef]
- Bakry, W.; Mallik, G.; Nghiem, X.-H.; Sinha, A.; Vo, X.V. Is green finance really “green”? Examining the long-run relationship between green finance, renewable energy and environmental performance in developing countries. Renewable Energy 2023, 208, 341–355. [Google Scholar] [CrossRef]
- Dellink, R.; Chateau, J.; Lanzi, E.; Magné, B. Long-term economic growth projections in the Shared Socioeconomic Pathways. Global Environmental Change 2017, 42, 200–214. [Google Scholar] [CrossRef]
- Ade, M.; Rossouw, J.; Gwatidzo, T. Determinants of tax revenue performance in the Southern African Development Community (SADC). Economic Research Southern Africa, working paper 2018, 762. [Google Scholar]
- Tugcu, C.T. Panel data analysis in the energy-growth nexus (EGN). The economics and econometrics of the energy-growth nexus, Elsevier, 2018; 255–271. [Google Scholar]
- Lv, Y.; Si, C.; Zhang, S.; Sarwar, S. Impact of urbanization on energy intensity by adopting a new technique for regional division: evidence from China. Environmental Science and Pollution Research 2018, 25, 36102–36116. [Google Scholar] [CrossRef] [PubMed]
- Rahman, M.M.; Alam, K. Life expectancy in the ANZUS-BENELUX countries: The role of renewable energy, environmental pollution, economic growth and good governance. Renewable Energy 2022, 190, 251–260. [Google Scholar] [CrossRef]
- Ren, D.; Zhang, W.; Ding, Y.; Shen, R.; Jiang, Z.; Lu, X.; Li, X. In situ fabrication of robust cocatalyst-free CdS/g-C3N4 2D–2D step-scheme heterojunctions for highly active H2 evolution. Solar Rrl 2020, 4, 1900423. [Google Scholar] [CrossRef]
- McNown, R.; Sam, C.Y.; Goh, S.K. Bootstrapping the autoregressive distributed lag test for cointegration. Applied Economics 2018, 50, 1509–1521. [Google Scholar] [CrossRef]
- Saeed, S.; Makhdum, M.S.A.; Anwar, S.; Yaseen, M.R. Climate Change Vulnerability, Adaptation, and Feedback Hypothesis: A Comparison of Lower-Middle, Upper-Middle, and High-Income Countries. Sustainability 2023, 15, 4145. [Google Scholar] [CrossRef]
- Dogan, E.; Seker, F.; Bulbul, S. Investigating the impacts of energy consumption, real GDP, tourism and trade on CO2 emissions by accounting for cross-sectional dependence: a panel study of OECD countries. Current Issues in Tourism 2017, 20, 1701–1719. [Google Scholar] [CrossRef]
- Li, W.; Xiang, P.; Chen, Y.-J.; Xie, X.; Li, Y. Unit of analysis: Impact of Silverman and Solmon’s article on field-based intervention research in physical education in the USA. Journal of Teaching in Physical Education 2017, 36, 131–141. [Google Scholar] [CrossRef]
- Hasanov, F.J.; Liddle, B.; Mikayilov, J.I. The impact of international trade on CO2 emissions in oil exporting countries: Territory vs consumption emissions accounting. Energy Economics 2018, 74, 343–350. [Google Scholar] [CrossRef]
- Kuhn, M.; Silge, J. Tidy modeling with R; O'Reilly Media, Inc., 2022. [Google Scholar]
- Callens, B.; Cargnel, M.; Sarrazin, S.; Dewulf, J.; Hoet, B.; Vermeersch, K.; Wattiau, P.; Welby, S. Associations between a decreased veterinary antimicrobial use and resistance in commensal Escherichia coli from Belgian livestock species (2011–2015). Preventive veterinary medicine 2018, 157, 50–58. [Google Scholar] [CrossRef]
- Wang, S.; Gao, S.; Li, S.; Feng, K. Strategizing the relation between urbanization and air pollution: Empirical evidence from global countries. Journal of Cleaner Production 2020, 243, 118615. [Google Scholar] [CrossRef]
- Kim, M.S. Comparative R squared. Available at SSRN 3790200 2021. [Google Scholar] [CrossRef]
- Chicco, D.; Warrens, M.J.; Jurman, G. The coefficient of determination R-squared is more informative than SMAPE, MAE, MAPE, MSE and RMSE in regression analysis evaluation. PeerJ Computer Science 2021, 7, e623. [Google Scholar] [CrossRef] [PubMed]
- Ong, R.; Wood, G.A.; Whelan, S.; Cigdem-Bayram, M.; Atalay, K.; Dodson, J. Inquiry into housing policies, labour force participation and economic growth. 2017.
- Demirgüç-Kunt, A.; Singer, D. Financial inclusion and inclusive growth: A review of recent empirical evidence. World Bank Policy Research Working Paper 2017. [Google Scholar]
- Saud, S.; Haseeb, A.; Chen, S.; Li, H. The role of information and communication technology and financial development in shaping a low-carbon environment: a Belt and Road journey toward development. Information Technology for Development 2023, 29, 83–102. [Google Scholar] [CrossRef]
- Alvarado, R.; Deng, Q.; Tillaguango, B.; Méndez, P.; Bravo, D.; Chamba, J.; Alvarado-Lopez, M.; Ahmad, M. Do economic development and human capital decrease non-renewable energy consumption? Evidence for OECD countries. Energy 2021, 215, 119147. [Google Scholar] [CrossRef]
- Anser, M.K.; Syed, Q.R.; Lean, H.H.; Alola, A.A.; Ahmad, M. Do economic policy uncertainty and geopolitical risk lead to environmental degradation? Evidence from emerging economies. Sustainability 2021, 13, 5866. [Google Scholar] [CrossRef]
- Zhang, J.; Danish, *!!! REPLACE !!!*. The dynamic linkage between information and communication technology, human development index, and economic growth: evidence from Asian economies. Environmental Science and Pollution Research 2019, 26, 26982–26990. [Google Scholar] [CrossRef] [PubMed]
- Jayatilleke, K. Challenges in implementing surveillance tools of high-income countries (HICs) in low middle income countries (LMICs). Current treatment options in infectious diseases 2020, 12, 191–201. [Google Scholar] [CrossRef]
- Siles, J.; Prebble, M.; Wen, J.; Hart, C.; Schuttenberg, H. Advancing gender in the environment: gender in fisheries-a sea of opportunities. IUCN and USAID. Washington, USA: USAID. 68pp.
- Raihan, A.; Tuspekova, A. Dynamic impacts of economic growth, energy use, urbanization, agricultural productivity, and forested area on carbon emissions: New insights from Kazakhstan. World Development Sustainability 2022, 1, 100019. [Google Scholar] [CrossRef]
- Sour, O.; Maliki, S.B.; Benghalem, A. Modelling the Interconnection Between Technological Leadership and the Level of Use of Information and Communication Technologies. 2023.
- Musah, M.; Kong, Y.; Mensah, I.A.; Antwi, S.K.; Donkor, M. The connection between urbanization and carbon emissions: a panel evidence from West Africa. Environment, Development and Sustainability 2021, 23, 11525–11552. [Google Scholar] [CrossRef]
- Jie, H.; Khan, I.; Alharthi, M.; Zafar, M.W.; Saeed, A. Sustainable energy policy, socio-economic development, and ecological footprint: The economic significance of natural resources, population growth, and industrial development. Utilities Policy 2023, 81, 101490. [Google Scholar] [CrossRef]
- Chen, J.; Mueller, V. Coastal climate change, soil salinity and human migration in Bangladesh. Nature climate change 2018, 8, 981–985. [Google Scholar] [CrossRef]
- Muriithi, L.N. Adoption of Selected Climate Smart Agriculture Technologies among Smallholder Farmers in Lower Eastern Kenya. University of Embu, 2021.
- Canh, P.N.; Schinckus, C.; Dinh Thanh, S. What are the drivers of shadow economy? A further evidence of economic integration and institutional quality. The Journal of International Trade & Economic Development 2021, 30, 47–67. [Google Scholar]
- Yoshida, Y.; Lee, H.S.; Trung, B.H.; Tran, H.-D.; Lall, M.K.; Kakar, K.; Xuan, T.D. Impacts of mainstream hydropower dams on fisheries and agriculture in lower Mekong Basin. Sustainability 2020, 12, 2408. [Google Scholar] [CrossRef]
- Duan, S.; Ullrich, P.; Shu, L. Using convolutional neural networks for streamflow projection in California. Frontiers in Water 2020, 2, 28. [Google Scholar] [CrossRef]
- Caruso, G.; Colantonio, E.; Gattone, S.A. Relationships between renewable energy consumption, social factors, and health: A panel vector auto regression analysis of a cluster of 12 EU countries. Sustainability 2020, 12, 2915. [Google Scholar] [CrossRef]
- Majid, M. Renewable energy for sustainable development in India: current status, future prospects, challenges, employment, and investment opportunities. Energy, Sustainability and Society 2020, 10, 1–36. [Google Scholar]
Disclaimer/Publisher’s Note: The statements, opinions and data contained in all publications are solely those of the individual author(s) and contributor(s) and not of MDPI and/or the editor(s). MDPI and/or the editor(s) disclaim responsibility for any injury to people or property resulting from any ideas, methods, instructions or products referred to in the content. |
© 2023 by the authors. Licensee MDPI, Basel, Switzerland. This article is an open access article distributed under the terms and conditions of the Creative Commons Attribution (CC BY) license (http://creativecommons.org/licenses/by/4.0/).
Copyright: This open access article is published under a Creative Commons CC BY 4.0 license, which permit the free download, distribution, and reuse, provided that the author and preprint are cited in any reuse.


