Submitted:
02 November 2023
Posted:
03 November 2023
You are already at the latest version
Abstract
Keywords:
1. Introduction
2. Results and Discussion
2.1. Extraction and Purification of SJG-1.0 and GMG-1.0
2.2. Chemical compositions of SJG-1.0 and GMG-1.0
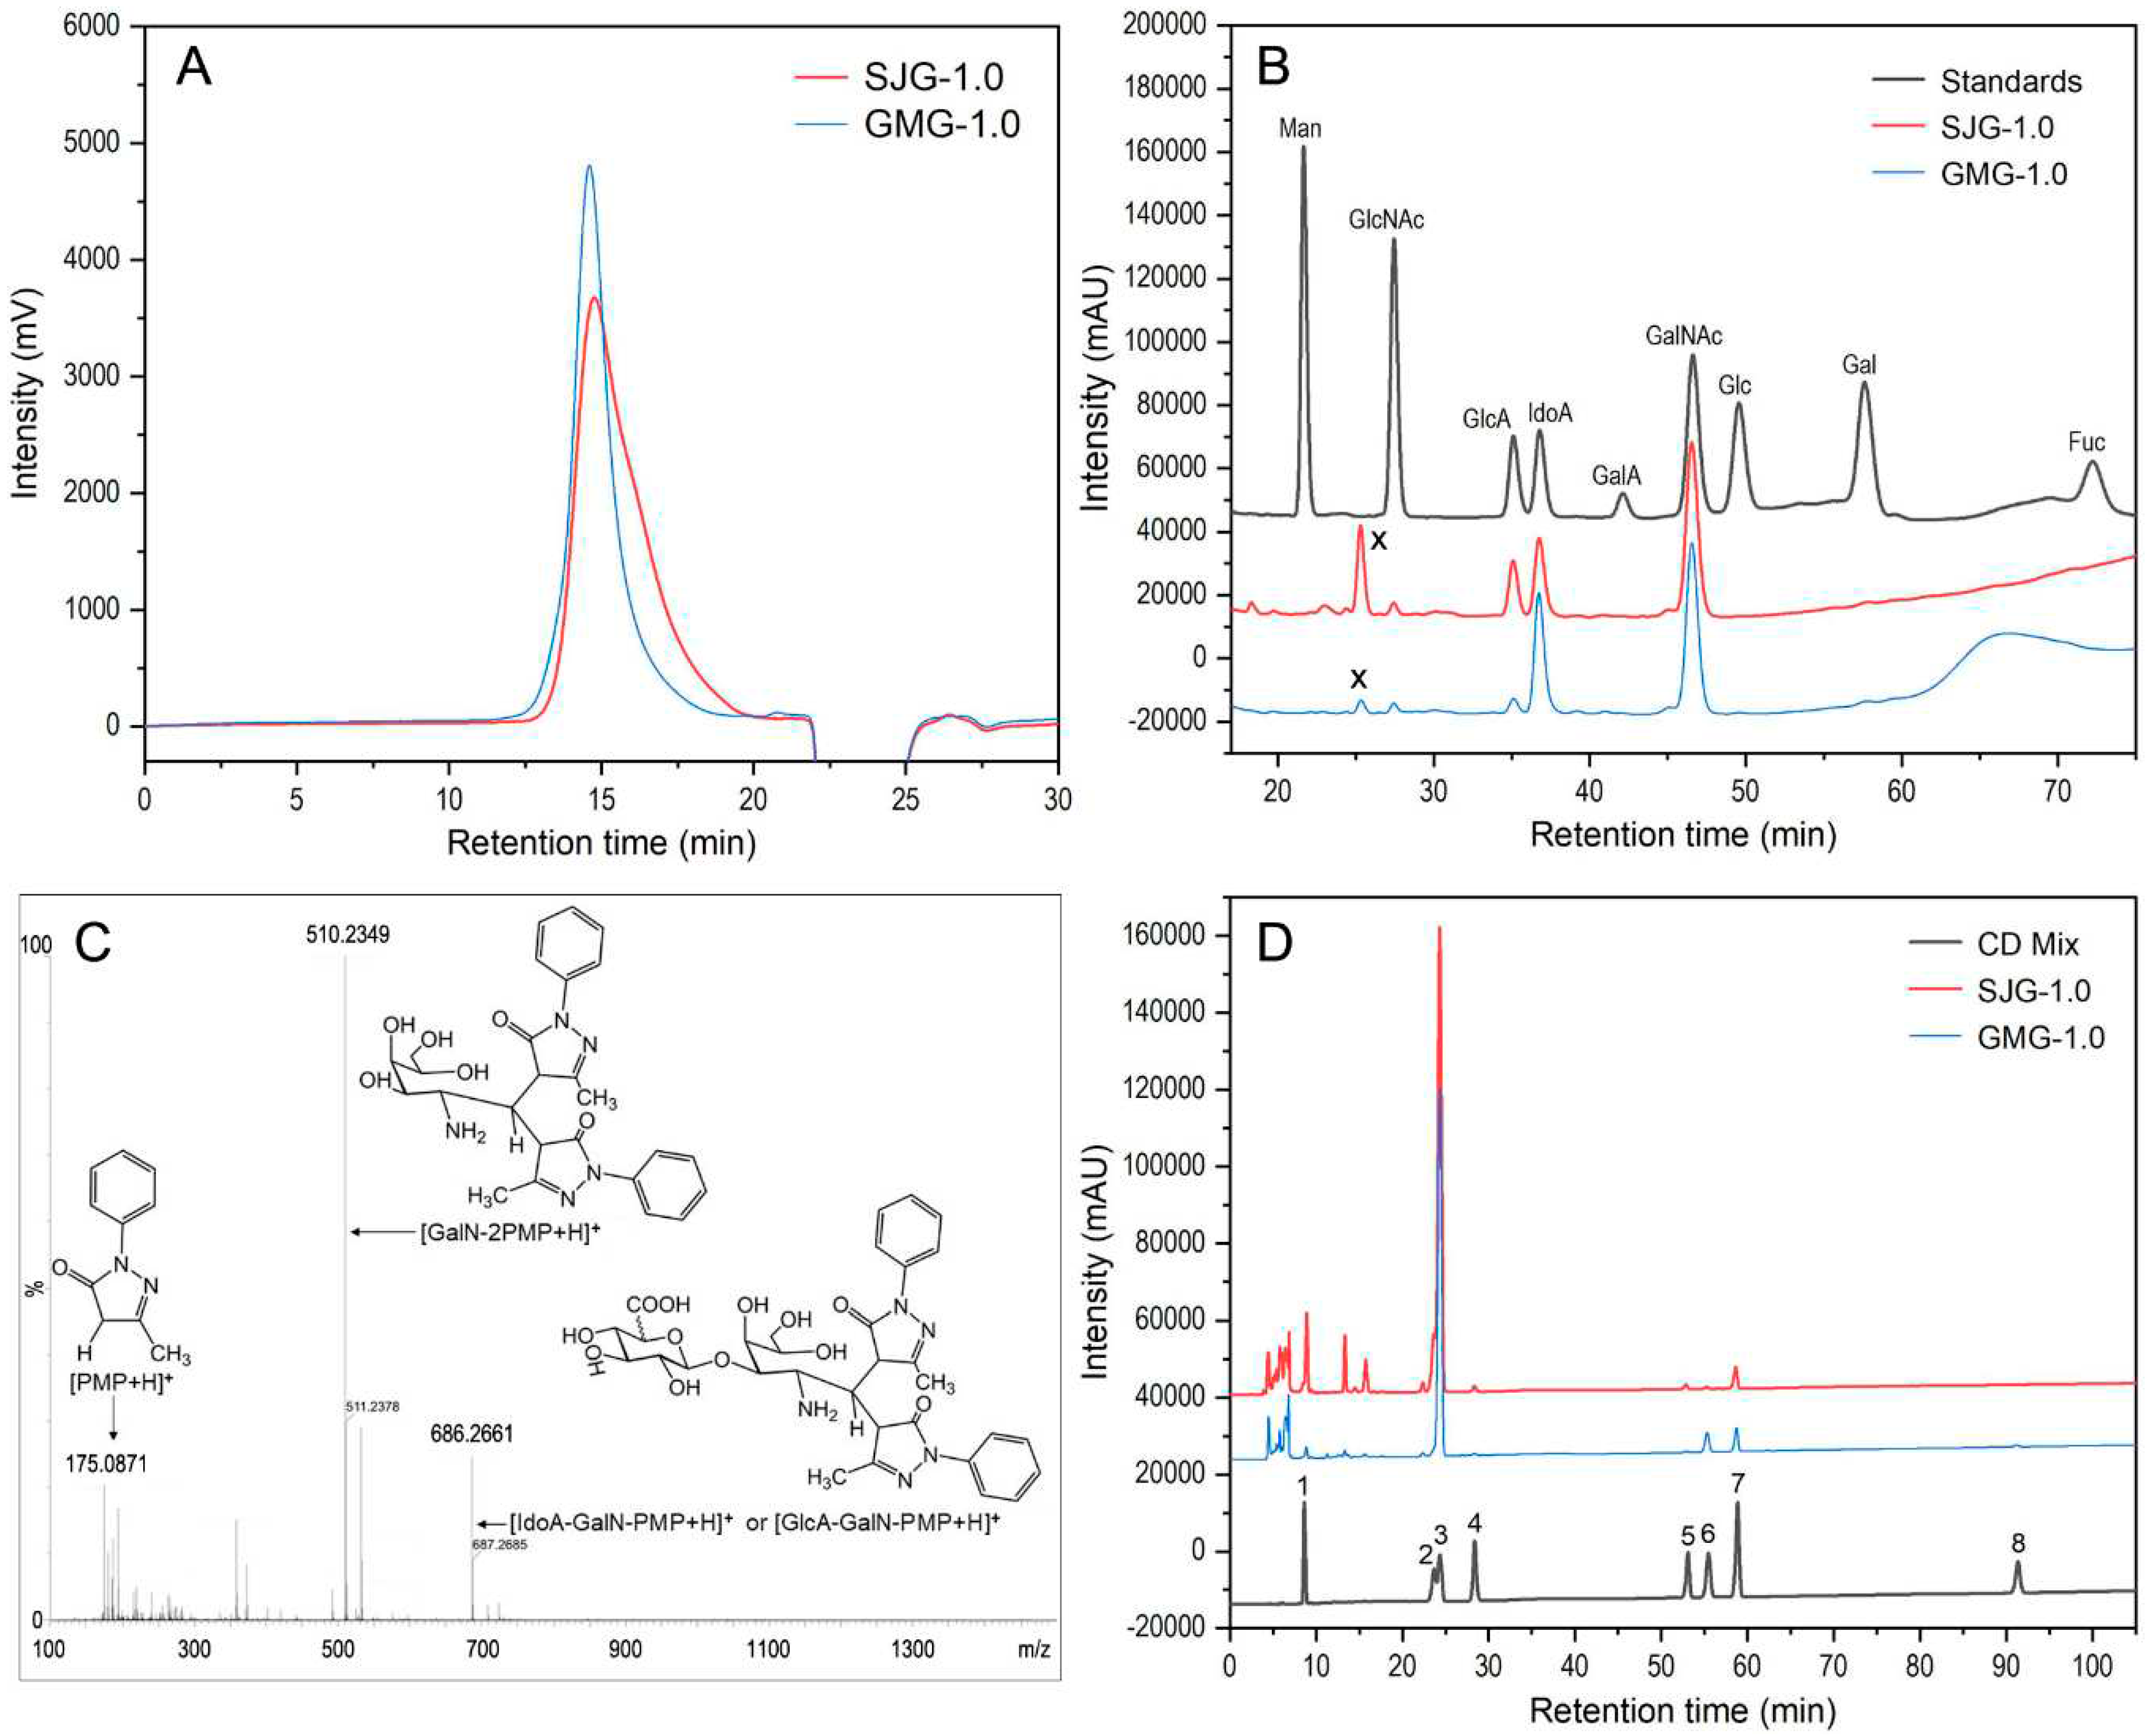
2.3. Purity and molecular weight of SJG-1.0 and GMG-1.0
2.4. Monosaccharide compositions of SJG-1.0 and GMG-1.0
2.5. Disaccharide compositions of SJG-1.0 and GMG-1.0
2.6. IR spectrum analysis of of SJG-1.0 and GMG-1.0
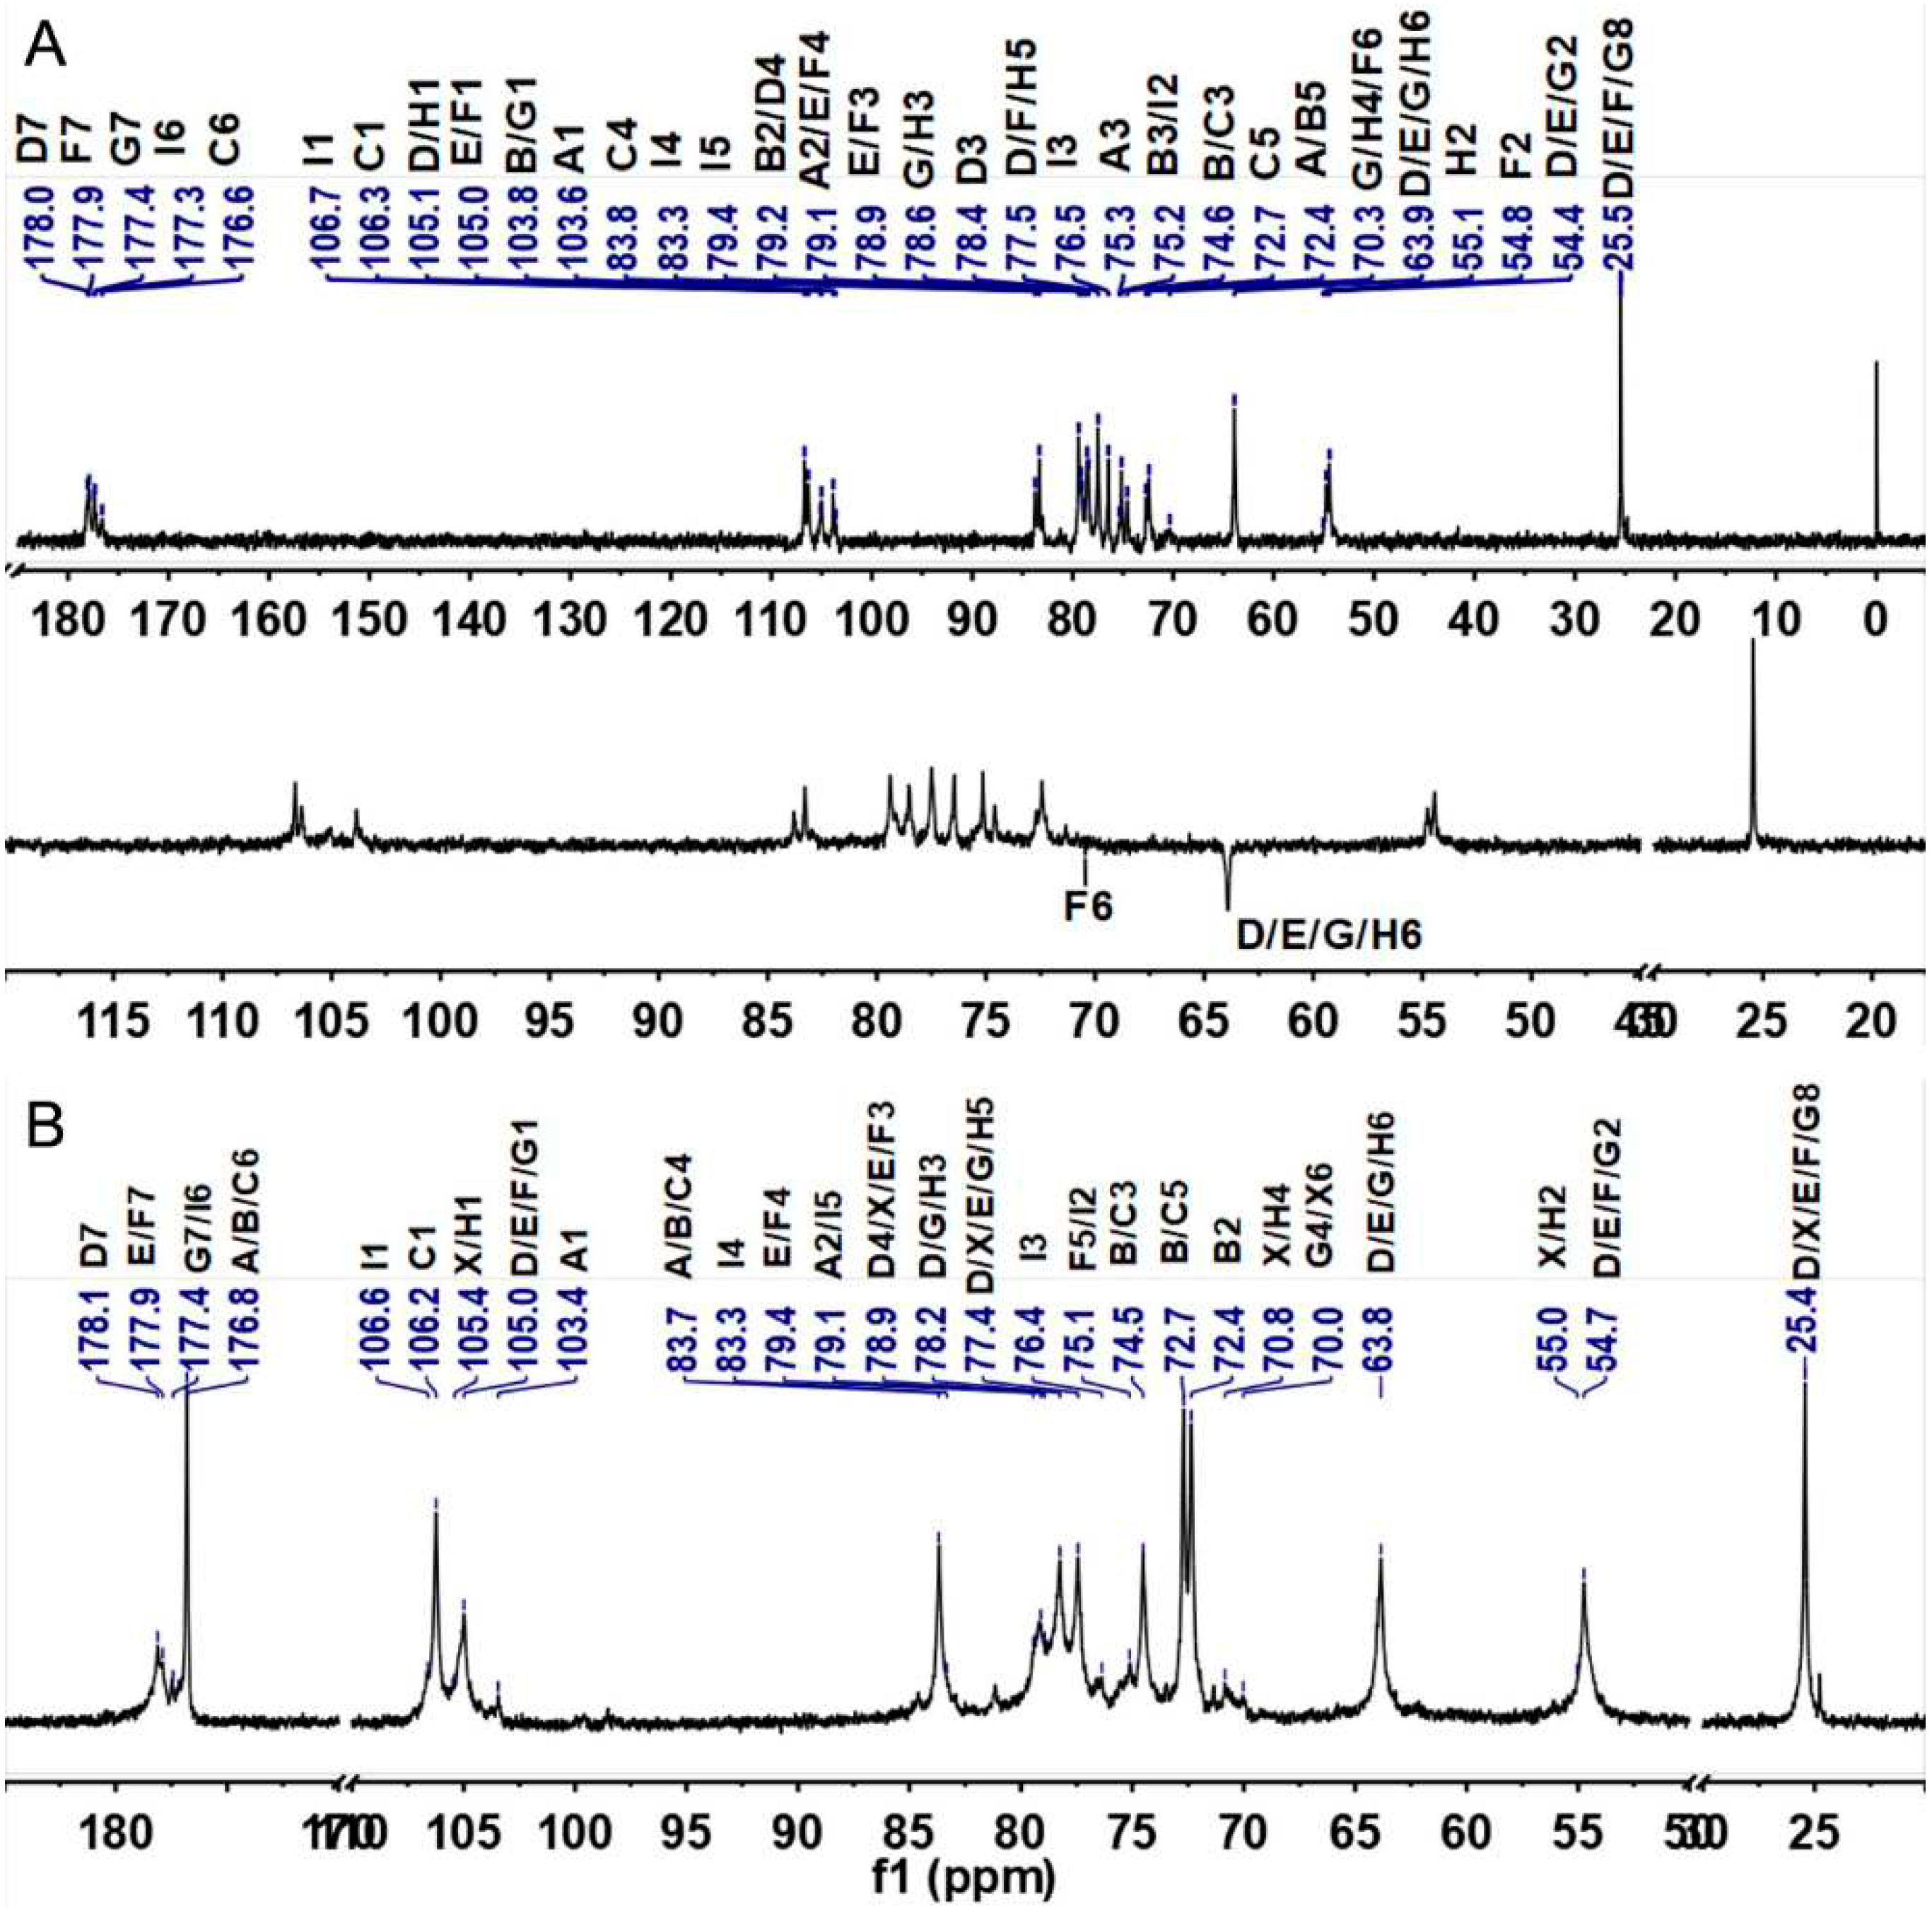
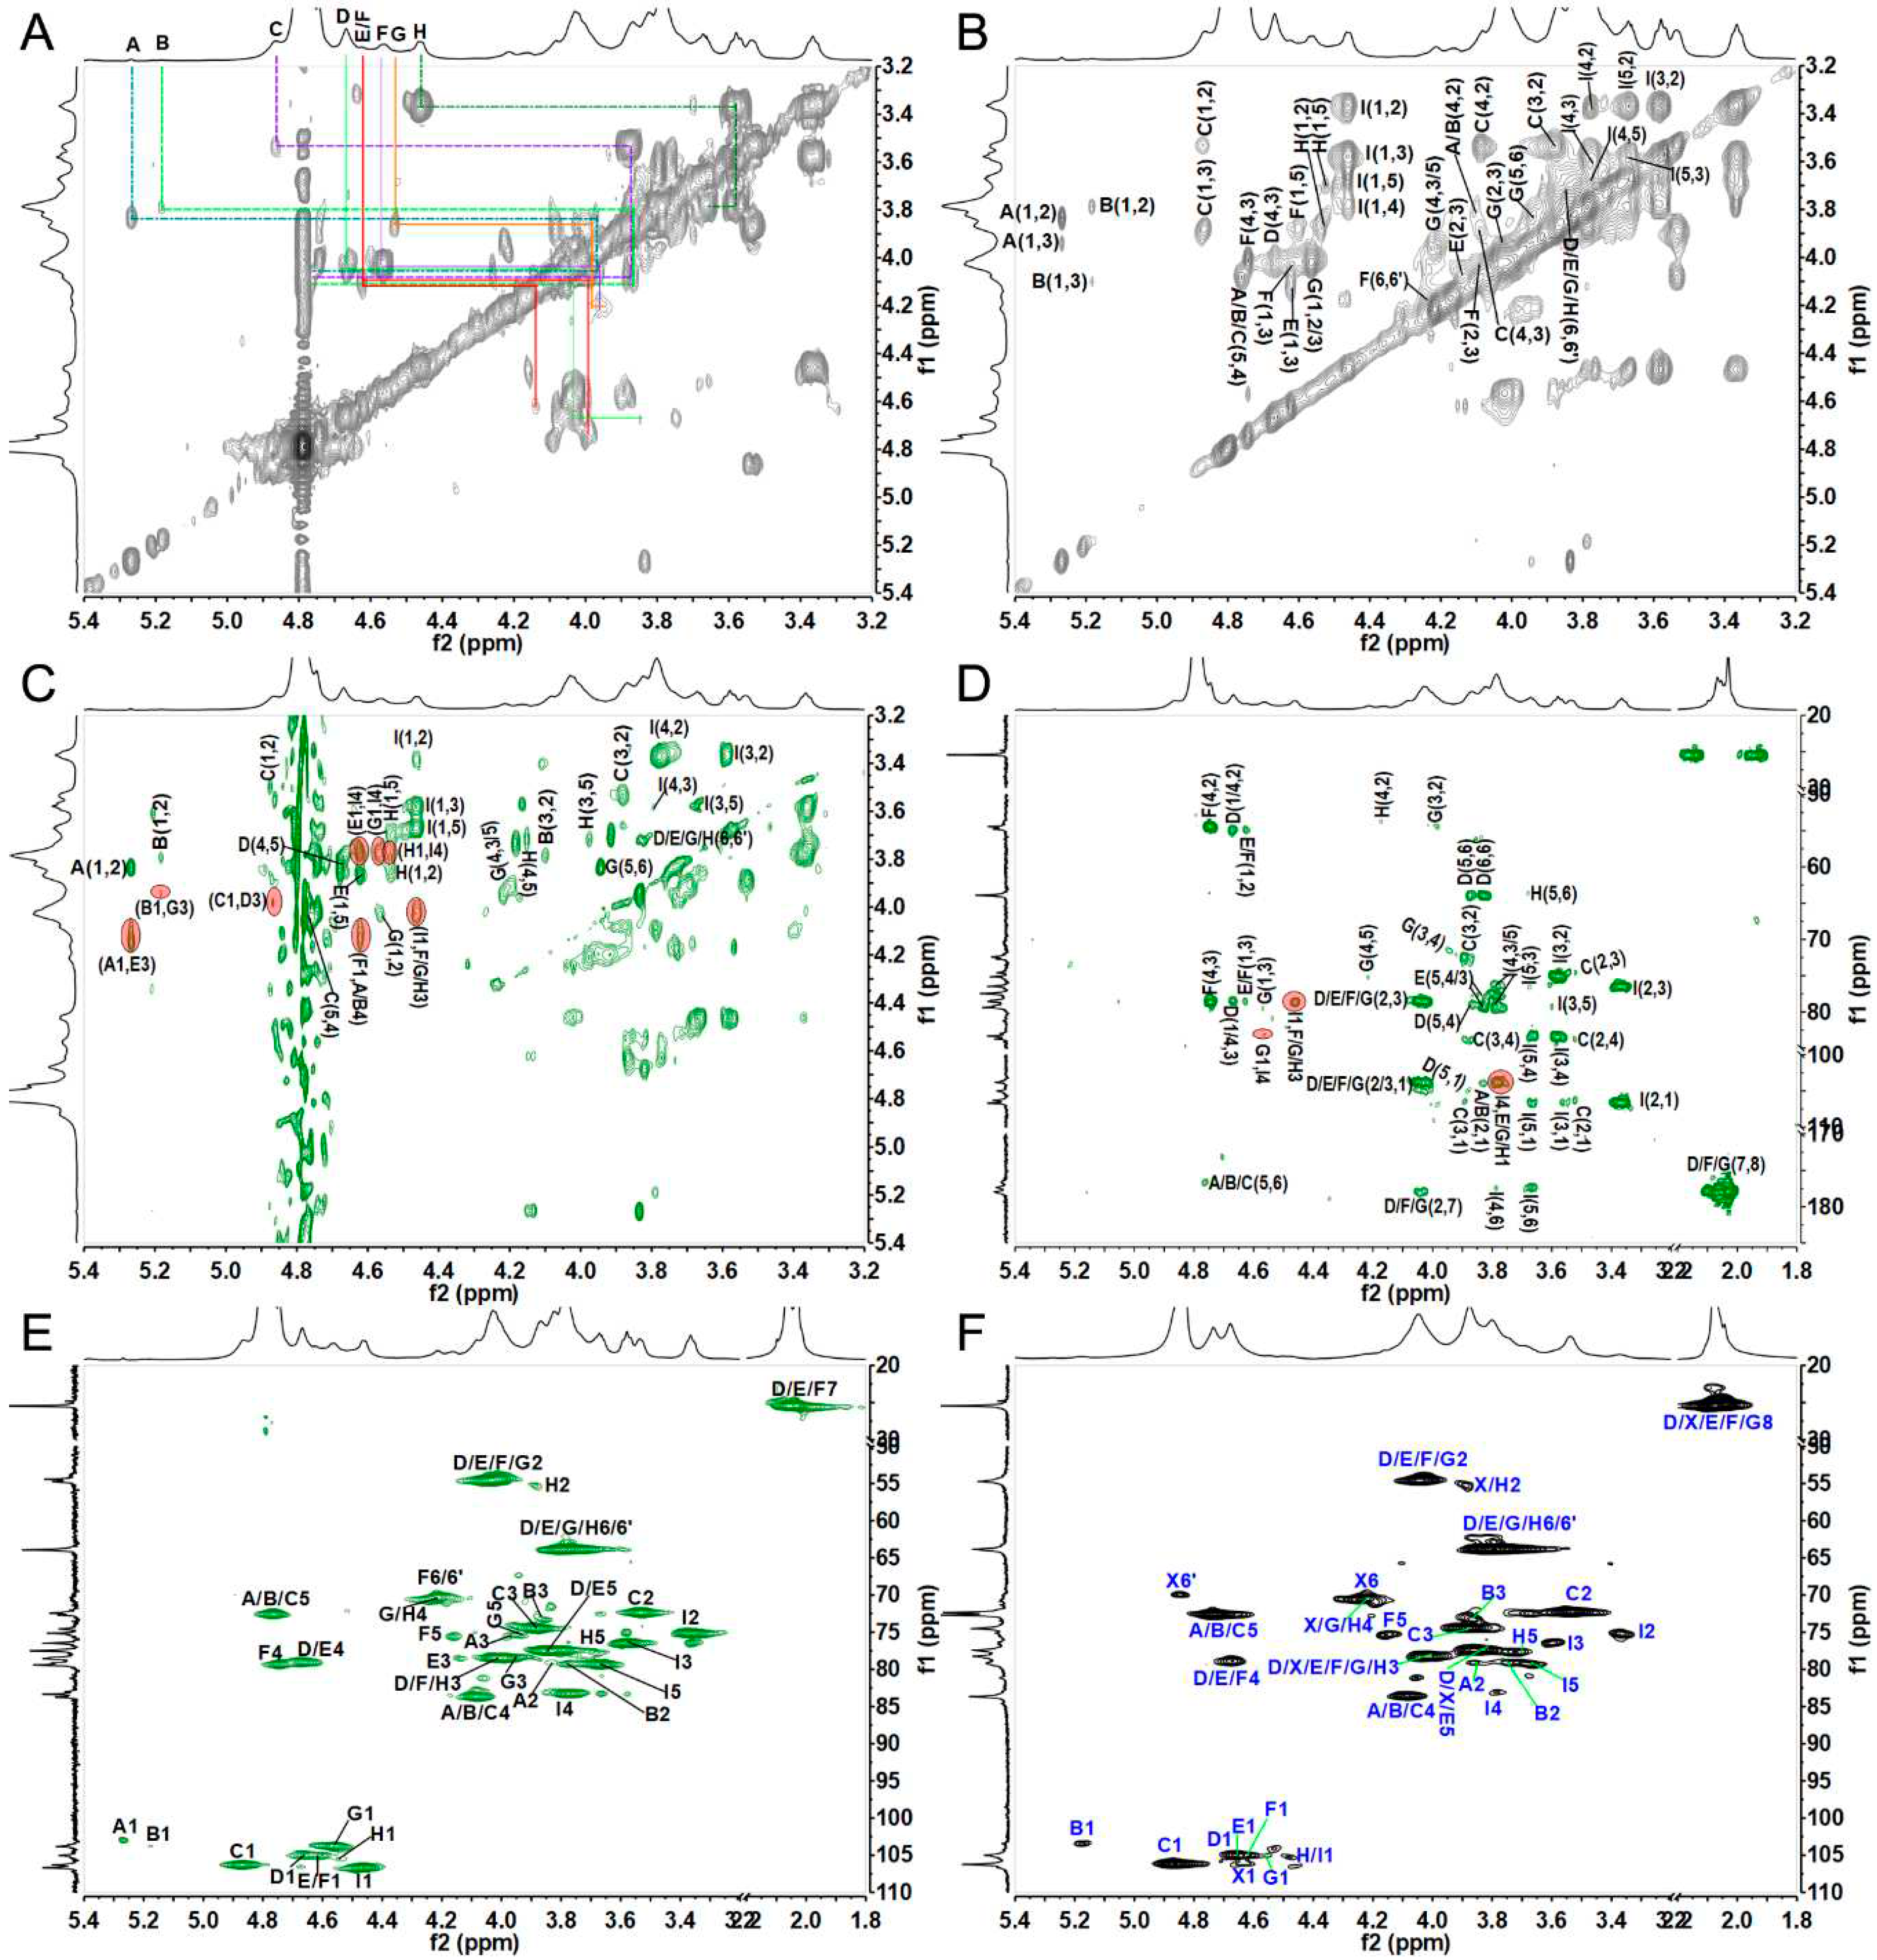
2.7. Structural analysis of SJG-1.0 and GMG-1.0 by NMR spectroscopy
2.11. Anticoagulant activity
3. Materials and Methods
3.1. Materials and reagents
3.2. Extraction and Isolation of GAGs from swim bladder
3.3. Physicochemical analysis
3.4. Enzymatic treatment and disaccharide composition analysis
3.5. NMR spectroscopy
3.6. Assay of anticoagulant activity
3.7. Statistical analysis
4. Conclusions
Supplementary Materials
Author Contributions
Funding
Data Availability Statement
Acknowledgments
Conflicts of Interest
References
- Arima, K.; Fujita, H.; Toita, R.; Imazu-Okada, A.; Tsutsumishita-Nakai, N.; Takeda, N.; Nakao, Y.; Wang, H.; Kawano, M.; Matsushita, K.; et al. Amounts and compositional analysis of glycosaminoglycans in the tissue of fish. Carbohydr. Res. 2013, 366, 25–32. [Google Scholar] [CrossRef]
- Maccari, F.; Galeotti, F.; Volpi, N. Isolation and structural characterization of chondroitin sulfate from bony fishes. Carbohydr. Polym. 2015, 129, 143–147. [Google Scholar] [CrossRef] [PubMed]
- Valcarcel, J.; Novoa-Carballal, R.; Pérez-Martín, R.; Reis, R.L.; Vázquez, J.A. Glycosaminoglycans from marine sources as therapeutic agents. Biotechnol. Adv. 2017, 35, 711–725. [Google Scholar] [CrossRef] [PubMed]
- Messmore, H.L.; Wehrmacher, W.H.; Coyne, E.; Fareed, J. Heparin to pentasaccharide and beyond: The end is not in sight. Semin. Thromb. Hemost. 2004, 30, 81–88. [Google Scholar] [CrossRef] [PubMed]
- Gandhi, N.S.; Mancera, R.L. Heparin/heparan sulphate-based drugs. Drug Discov. Today 2010, 15, 1058–1069. [Google Scholar] [CrossRef] [PubMed]
- Uebelhart, D. Clinical review of chondroitin sulfate in osteoarthritis. Osteoarthr. Cartil. 2008, 16, S19–S21. [Google Scholar] [CrossRef] [PubMed]
- Price, R.D.; Berry, M.G.; Navsaria, H.A. Hyaluronic acid: the scientific and clinical evidence. J. Plast. Reconstr. Aesthetic Surg. 2007, 60, 1110–1119. [Google Scholar] [CrossRef] [PubMed]
- Caputo, H.E.; Straub, J.E.; Grinstaff, M.W. Design, synthesis, and biomedical applications of synthetic sulphated polysaccharides. Chem. Soc. Rev. 2019, 48, 2338–2365. [Google Scholar] [CrossRef] [PubMed]
- Li, H.; Yuan, Q.; Lv, K.; Ma, H.; Gao, C.; Liu, Y.; Zhang, S.; Zhao, L. Low-molecular-weight fucosylated glycosaminoglycan and its oligosaccharides from sea cucumber as novel anticoagulants: A review. Carbohydr. Polym. 2021, 251, 117034. [Google Scholar] [CrossRef]
- Sadovy de Mitcheson, Y.; To, A.W.L.; Wong, N.W.; Kwan, H.Y.; Bud, W.S. Emerging from the murk: threats, challenges and opportunities for the global swim bladder trade. Rev. Fish Biol. Fish. 2019, 29, 809–835. [Google Scholar] [CrossRef]
- González-Félix, M.L.; Perez-Velazquez, M.; Castellanos-Rico, M.; Sachs, A.M.; Gray, L.D.; Gaines, S.D.; Goto, G.M. First report on the swim bladder index, proximate composition, and fatty acid analysis of swim bladder from cultured Totoaba macdonaldi fed compound aquafeeds. Aquac. Reports 2021, 21, 100901. [Google Scholar] [CrossRef]
- Clarke, S. Understanding pressures on fishery resources through trade statistics: A pilot study of four products in the Chinese dried seafood market. Fish Fish. 2004, 5, 53–74. [Google Scholar] [CrossRef]
- Sheng, Y.; Wang, W.Y.; Wu, M.F.; Wang, Y.M.; Zhu, W.Y.; Chi, C.F.; Wang, B. Eighteen novel bioactive peptides from monkfish (Lophius litulon) swim bladders: Production, identification, antioxidant activity, and stability. Mar. Drugs 2023, 21, 1–24. [Google Scholar] [CrossRef] [PubMed]
- Kaewdang, O.; Benjakul, S.; Kaewmanee, T.; Kishimura, H. Characteristics of collagens from the swim bladders of yellowfin tuna (Thunnus albacares). Food Chem. 2014, 155, 264–270. [Google Scholar] [CrossRef]
- Cruz-López, H.; Rodríguez-Morales, S.; Enríquez-Paredes, L.M.; Villarreal-Gómez, L.J.; True, C.; Olivera-Castillo, L.; Fernández-Velasco, D.A.; López, L.M. Swim bladder of farmed Totoaba macdonaldi: A source of value-added collagen. Mar. Drugs 2023, 21, 1–14. [Google Scholar] [CrossRef] [PubMed]
- Zhao, X.; Qian, Y.; Li, G.J.; Tan, J. Preventive effects of the polysaccharide of Larimichthys crocea swim bladder on carbon tetrachloride (CCl4) -induced hepatic damage. Chin. J. Nat. Med. 2015, 13, 521–528. [Google Scholar] [CrossRef] [PubMed]
- Jiang, X.H.; Zhao, X.; Luo, H.L.; Zhu, K. Therapeutic effect of polysaccharide of large yellow croaker swim bladder on lupus nephritis of mice. Nutrients 2014, 6, 1223–1235. [Google Scholar] [CrossRef] [PubMed]
- Suo, H.Y.; Song, J.L.; Zhou, Y.L.; Liu, Z.H.; Yi, R.K.; Zhu, K.; Xie, J.; Zhao, X. Induction of apoptosis in HCT-116 colon cancer cells by polysaccharide of Larimichthys crocea swim bladder. Oncol. Lett. 2015, 9, 972–978. [Google Scholar] [CrossRef] [PubMed]
- Pan, Y.X.; Wang, P.P.; Zhang, F.M.; Yu, Y. .; Zhang, X.; Lin, L.; Linhardt, R.J. Glycosaminoglycans from fish swim bladder: isolation, structural characterization and bioactive potential. Glycoconj. J. 2018, 35, 87–94. [Google Scholar] [CrossRef]
- Zhou, S.Y.; Zhong, S.Y.; Su, W.M.; Du, Z.M.; Chen, J.P.; Hong, P.Z.; Zhang, C.H. Isolation, purification and structural identification of heparinoids from fish swim bladder. Food Sci. 2019, 40, 84–91. [Google Scholar]
- Chen, J.; Zhou, S. y.; Wang, Z.; Liu, S.C.; Li, R.; Jia, J.; Chen, J.P.; Liu, X.F.; Song, B.B.; Zhong, S.Y. Anticoagulant and anti-inflammatory effects of a degraded sulfate glycosaminoglycan from swimming bladder. Food Res. Int. 2022, 157, 111444. [Google Scholar] [CrossRef] [PubMed]
- Ou, J.Y.; Wang, Z.; Huang, H.P.; Chen, J.; Liu, X.F.; Jia, X.J.; Song, B.B.; Cheong, K.L.; Gao, Y.; Zhong, S.Y. Intervention effects of sulfate glycosaminoglycan from swim bladder against arsenic-induced damage in IEC-6 cells. Int. J. Biol. Macromol. 2023, 252, 126460. [Google Scholar] [CrossRef]
- Zhu, H.; Chen, X.; Zhang, X.; Liu, L.L.; Cong, D.P.; Zhao, X.; Yu, G.L. Acidolysis-based component mapping of glycosaminoglycans by reversed-phase high-performance liquid chromatography with off-line electrospray ionization-tandem mass spectrometry: Evidence and tags to distinguish different glycosaminoglycans. Anal. Biochem. 2014, 465, 63–69. [Google Scholar] [CrossRef] [PubMed]
- Yuan, Q.X.; Li, H.; Wang, Q.; Sun, S.J.; Fang, Z.Y.; Tang, H.; Shi, X.H.; Wen, J.; Huang, L.H.; Bai, M.; et al. Deaminative-cleaved S. monotuberculatus fucosylated glycosaminoglycan: Structural elucidation and anticoagulant activity. Carbohydr. Polym. 2022, 298, 120072. [Google Scholar] [CrossRef] [PubMed]
- Lv, K.L.; Yuan, Q.X.; Li, H.; Li, T.T.; Ma, H.Q.; Gao, C.H.; Zhang, S.Y.; Liu, Y.H.; Zhao, L.Y. Chlorella pyrenoidosa polysaccharides as a prebiotic to modulate gut microbiota: Physicochemical properties and fermentation characteristics in vitro. Foods 2022, 11, 725. [Google Scholar] [CrossRef] [PubMed]
- Zhou, C.; Mi, S.; Li, J.; Gao, J.; Wang, X.H.; Sang, Y.X. Purification, characterisation and antioxidant activities of chondroitin sulphate extracted from Raja porosa cartilage. Carbohydr. Polym. 2020, 241, 1–8. [Google Scholar] [CrossRef] [PubMed]
- Yang, K.R.; Tsai, M.F.; Shieh, C.J.; Arakawa, O.; Dong, C.D.; Huang, C.Y.; Kuo, C.H. Ultrasonic-assisted extraction and structural characterization of chondroitin sulfate derived from jumbo squid cartilage. Foods 2021, 10, 2363. [Google Scholar] [CrossRef]
- Yuan, Q.; Zhang, X.; Ma, M.; Long, T.; Xiao, C.; Zhang, J.; Liu, J.; Zhao, L. Immunoenhancing glucuronoxylomannan from Tremella aurantialba Bandoni et Zang and its low-molecular-weight fractions by radical depolymerization: Properties, structures and effects on macrophages. Carbohydr. Polym. 2020, 238, 116184. [Google Scholar] [CrossRef]
- Panagos, C.G.; Thomson, D.; Moss, C.; Bavington, C.D.; Ólafsson, H.G.; Uhrín, D. Characterisation of hyaluronic acid and chondroitin/dermatan sulfate from the lumpsucker fish, C. lumpus. Carbohydr. Polym. 2014, 106, 25–33. [Google Scholar] [CrossRef]
- Liu, J.; Zhou, L.; He, Z.; Gao, N.; Shang, F.; Xu, J.; Li, Z.; Yang, Z.; Wu, M.; Zhao, J. Structural analysis and biological activity of a highly regular glycosaminoglycan from Achatina fulica. Carbohydr. Polym. 2018, 181, 433–441. [Google Scholar] [CrossRef]
- Volpi, N.; Maccari, F. Structural characterization and antithrombin activity of dermatan sulfate purified from marine clam Scapharca inaequivalvis. Glycobiology 2009, 19, 356–367. [Google Scholar] [CrossRef] [PubMed]
- Zhao, L.; Wu, M.; Xiao, C.; Yang, L.; Zhou, L.; Gao, N.; Li, Z.; Chen, J.; Chen, J.; Liu, J.; et al. Discovery of an intrinsic tenase complex inhibitor: Pure nonasaccharide from fucosylated glycosaminoglycan. Proc. Natl. Acad. Sci. U. S. A. 2015, 112, 8284–8289. [Google Scholar] [CrossRef] [PubMed]
- Ramachandra, R.; Namburi, R.B.; Ortega-Martinez, O.; Shi, X.; Zaia, J.; Dupont, S.T.; Thorndyke, M.C.; Lindahl, U.; Spillmann, D. Brittlestars contain highly sulfated chondroitin sulfates/dermatan sulfates that promote fibroblast growth factor 2-induced cell signaling. Glycobiology 2014, 24, 195–207. [Google Scholar] [CrossRef] [PubMed]
- Nandini, C.D.; Itoh, N.; Sugahara, K. Novel 70-kDa chondroitin sulfate/dermatan sulfate hybrid chains with a unique heterogenous sulfation pattern from shark skin, which exhibit neuritogenic activity and binding activities for growth factors and neurotrophic factors. J. Biol. Chem. 2005, 280, 4058–4069. [Google Scholar] [CrossRef] [PubMed]
- Bougatef, H.; Ghlissi, Z.; Kallel, R.; Amor, I. Ben; Boudawara, T.; Gargouri, J.; Sahnoun, Z.; Volpi, N.; Sila, A.; Bougatef, A. Chondroitin/dermatan sulfate purified from corb (Sciaena umbra) skin and bone: In vivo assessment of anticoagulant activity. Int. J. Biol. Macromol. 2020, 164, 131–139. [Google Scholar] [CrossRef] [PubMed]
- Rand, M.D.; Lock, J.B.; Van’t Veer, C.; Gaffney, D.P.; Mann, K.G. Blood clotting in minimally altered whole blood. Blood 1996, 88, 3432–3445. [Google Scholar] [CrossRef] [PubMed]
- Lin, L.; Zhao, L.; Gao, N.; Yin, R.; Li, S.; Sun, H.; Zhou, L.; Zhao, G.; Purcell, S.W.; Zhao, J. From multi-target anticoagulants to DOACs, and intrinsic coagulation factor inhibitors. Blood Rev. 2020, 39, 100615. [Google Scholar] [CrossRef]
- Vieira, R.P.; Mulloy, B.; Mouriio, P.A.S. Structure of a fucose-branched chondroitin sulfate from sea cucumber. J. Biol. Chem. 1991, 266, 13530–13536. [Google Scholar] [CrossRef] [PubMed]
- Bradford, M.M. A rapid and sensitive method for the quantitation of microgram quantities of protein utilizing the principle of protein-dye binding. Anal. Biochem. 1976, 72, 248–254. [Google Scholar] [CrossRef]
- Blumenkrantz, N.; Asboe-hansen, G. New method for quantitative determination of uronic acids. Anal. Biochem. 1973, 54, 484–489. [Google Scholar] [CrossRef]
- Dodgson, K.S.; Price, R.G. A note on the determination of the ester sulphate content of sulphated polysaccharides. Biochem. J. 1962, 84, 106–110. [Google Scholar] [CrossRef] [PubMed]
- Zhao, L.; Lai, S.; Huang, R.; Wu, M.; Gao, N.; Xu, L.; Qin, H.; Peng, W.; Zhao, J. Structure and anticoagulant activity of fucosylated glycosaminoglycan degraded by deaminative cleavage. Carbohydr. Polym. 2013, 98, 1514–1523. [Google Scholar] [CrossRef] [PubMed]
- Nelson, S.R.; Lyon, M.; Gallagher, J.T.; Johnson, E.A.; Pepys, M.B. Isolation and characterization of the integral glycosaminoglycan constituents of human amyloid A and monoclonal light-chain amyloid fibrils. Biochem. J. 1991, 275, 67–73. [Google Scholar] [CrossRef] [PubMed]
- Bougatef, H.; Ghlissi, Z.; Kallel, R.; Amor, I.B.; Boudawara, T.; Gargouri, J.; Sahnoun, Z.; Volpi, N.; Sila, A.; Bougatef, A. Chondroitin/dermatan sulfate purified from corb (Sciaena umbra) skin and bone: In vivo assessment of anticoagulant activity. Int. J. Biol. Macromol. 2020, 164, 131–139. [Google Scholar] [CrossRef] [PubMed]
- Yuan, Q.X.; Xie, Y.F.; Wang, W.; Yan, Y.H.; Ye, H.; Jabbar, S.; Zeng, X.X. Extraction optimization, characterization and antioxidant activity in vitro of polysaccharides from mulberry (Morus alba L.) leaves. Carbohydr. Polym. 2015, 128, 52–62. [Google Scholar] [CrossRef] [PubMed]
- Ma, H.Q.; Yuan, Q.X.; Tang, H.; Tan, H.J.; Li, T.T.; Wei, S.Y.; Huang, J.W.; Yao, Y.; Hu, Y.P.; Zhong, S.P.; et al. Structural elucidation of a glucan from Trichaster palmiferus by its degraded products and preparation of its sulfated derivative as an anticoagulant. Mar. Drugs 2023, 21, 148. [Google Scholar] [CrossRef]
- da Silva, H.A.M.; de Queiroz, I.N.L.; Francisco, J.S.; Pomin, V.H.; Pavão, M.S.G.; de Brito-Gitirana, L. Chondroitin sulfate isolated from the secretion of the venom-producing parotoid gland of Brazilian bufonid. Int. J. Biol. Macromol. 2019, 124, 548–556. [Google Scholar] [CrossRef]


| Residues | H/C | Chemical shifts (δ,ppm) a |
Connection patterns Cross signals (ppm) |
|||||||
| 1 | 2 | 3 | 4 | 5 | 6 | 7 | 8 | |||
| A | H | 5.27 | 3.84 b | 3.95 | 4.10 c | 4.76 | A-E | |||
| α-D-IdoA2S | C | 103.6 | 79.1 | 75.5 | 83.0 | 72.4 | 176.8 | (5.27,4.14) | ||
| B | H | 5.18 | 3.79 | 4.10 | 4.13 | 4.78 | B-G | |||
| α-D-IdoA2S | C | 103.9 | 79.2 | 75.1 | 83.5 | 72.4 | 176.8 | (5.18,3.96) | ||
| C | H | 4.86 | 3.53 | 3.88 | 4.08 | 4.76 | C-D | |||
| α-D-IdoA | C | 106.3 | 72.4 | 74.6 | 83.8 | 72.7 | 176.6 | (4.86,4.03) | ||
| D | H | 4.67 | 4.05 | 4.03 | 4.66 | 3.87 | 3.73/3.84 | 2.03 | D-C | |
| β-D-GalNAc4S | C | 105.1 | 54.3 | 78.4 | 79.2 | 77.5 | 63.9 | 178.0 | 25.5 | (4.67,4.08) |
| E | H | 4.62 | 4.08 | 4.14 | 4.63 | 3.83 | 3.73/3.84 | 2.05 | E-I | |
| β-D-GalNAc4S | C | 105.0 | 54.7 | 78.6 | 79.1 | 77.7 | 63.9 | 177.9 | 25.5 | (4.62,3.78) |
| F | H | 4.61 | 4.10 | 4.04 | 4.74 | 4.15 | 4.25/4.17 | 2.04 | F-A/B | |
| β-D-GalNAc4S6S | C | 105.0 | 54.3 | 78.9 | 79.4 | 75.7 | 70.0 | 177.9 | 25.5 | (4.61,4.10/4.13) |
| G | H | 4.56 | 4.02 | 3.96 | 4.21 | 3.93 | 3.72/3.84 | 2.07 | G-I | |
| β-D-GalNAc | C | 103.8 | 54.5 | 78.6 | 70.3 | 75.7 | 63.9 | 177.4 | 25.5 | (4.56,3.78) |
| H | H | 4.53 | 3.86 | 4.00 | 4.17 | 3.70 | 3.74/3.82 | H-I | ||
| β-D-GalN2S | C | 105.6 | 55.1 | 78.6 | 70.3 | 77.3 | 63.9 | (4.53,3.78) | ||
| I | H | 4.47 | 3.37 | 3.58 | 3.78 | 3.67 | I-F/G/H | |||
| β-D-GlcA | C | 106.7 | 75.2 | 76.5 | 83.3 | 79.4 | 177.3 | (4.47,4.04/3.96/4.00) | ||
| Sample | APTT 1, μM | TT 1, μM | PT 1, μM | anti-tenase 2, μM |
| LMWH | 0.571 ± 0.003 | 0.658 ± 0.043 | / 3 | 0.010 ± 0.001 |
| SJG-1.0 | 0.586 ± 0.001 | / | / | / |
| GMG-1.0 | 0.226 ± 0.016 | 12.035 ± 0.404 | / | 0.058 ± 0.015 |
Disclaimer/Publisher’s Note: The statements, opinions and data contained in all publications are solely those of the individual author(s) and contributor(s) and not of MDPI and/or the editor(s). MDPI and/or the editor(s) disclaim responsibility for any injury to people or property resulting from any ideas, methods, instructions or products referred to in the content. |
© 2023 by the authors. Licensee MDPI, Basel, Switzerland. This article is an open access article distributed under the terms and conditions of the Creative Commons Attribution (CC BY) license (http://creativecommons.org/licenses/by/4.0/).


