Submitted:
03 November 2023
Posted:
06 November 2023
You are already at the latest version
Abstract
Keywords:
1. Introduction
2. Materials and Methods
2.1. Study Area
2.2. Dataset
| Product | Spatial and temporal resolution | Temporal coverage | Period of interest | Websites |
|---|---|---|---|---|
| ERA5Land | 9 Km/1 M | 1950- present |
1981-2021 |
https://cds.climate.copernicus.eu/cdsapp#!/dataset/reanalysis-era5-land-monthly-means?tab=overview |
| ESA CCI SM | 25 Km/1 D | 1978-2021 | 2001-2021 |
https://www.esa-soilmoisture-cci.org/ (lastaccess: 23 October 2022) |
| Copernicus SWI | 12.5 Km/1D | 2007-2021 | 2007-2021 | https://land.copernicus.eu/global/products/swi |
| MODIS (NDVI) | 1 Km/1 M | February 2000- near-present | 2001-2021 | https://lpdaac.usgs.gov/ |
| MODIS (LST) | 1 Km/1 D | February 2000- near-present | 2001-2021 | https://lpdaac.usgs.gov/ |
2.3. Methods
2.3.1. Calculation of Drought Indices
2.3.2. Correlation and Cross-Correlation between Indices
2.3.3. A Modified Run Theory with Pooling and Screening
2.3.4. Characterization of Drought Stages Inside a Drought Spell
3. Results
3.1. Time Series of Drought Indices at Different Spatial Scales
3.2. Pearson Correlation between Drought Indices at Different Spatial Scales
3.3. Cross-Correlation between Drought Indices
3.4. Run Theory According to a Lower and Upper Bound
3.5. Drought Stages and Pooling (A Case Study)
4. Discussion
4.1. Drought Assessment Using Various Indices
4.2. Interactions between Drought Indices
4.3. Drought Characteristics and Stages
5. Conclusions
Author Contributions
Funding
Data Availability Statement
Acknowledgments
Conflicts of Interest
References
- E. H. Bouras et al., « Cereal yield forecasting with satellite drought-based indices, weather data and regional climate indices using machine learning in morocco », Remote Sensing, vol. 13, no 16, 2021. [CrossRef]
- T. Javed et al., « Drought characterization across agricultural regions of China using standardized precipitation and vegetation water supply indices », Journal of Cleaner Production, vol. 313, sept. 2021. [CrossRef]
- R. J. Klos, G. G. Wang, W. L. Bauerle, et J. R. Rieck, « Drought impact on forest growth and mortality in the southeast.pdf> », Ecologyca Apllications, vol. 19, no 3, p. 699-708, 2009.
- J. Zscheischler et al., « A typology of compound weather and climate events », Nature Reviews Earth and Environment, vol. 1, no 7, p. 333-347, 2020. [CrossRef]
- J. De Rosnay, « Le macroscope. Vers une vision globale », Revue d’Histoire et de Philosophie religieuses, vol. 57, no 3, p. 314, 1975.
- J. Heim R R, « A review of twentieth-century drought indices used in the United States », Bulletin of the American Meteorological Society, no August, p. 1149-1166, 2002.
- T. B. McKee, N. J. Doesken, et J. Kleist, « The Relationship of Drought Frequency and Duration to Time Scales », présenté à 8th Conf. Appl. Climatol. American Meteorological Society, Anaheim, Ca., 1993, p. 6.
- S. Beguería, S. M. Vicente-Serrano, F. Reig, et B. Latorre, « Standardized precipitation evapotranspiration index (SPEI) revisited: Parameter fitting, evapotranspiration models, tools, datasets and drought monitoring », International Journal of Climatology, vol. 34, no 10, p. 3001-3023, 2014. [CrossRef]
- S. M. Vicente-Serrano, S. Beguería, et J. I. López-Moreno, « A multiscalar drought index sensitive to global warming: The standardized precipitation evapotranspiration index », Journal of Climate, vol. 23, no 7, p. 1696-1718, 2010. [CrossRef]
- A. J. Peters, E. A. Walter-Shea, L. Ji, A. Viña, M. Hayes, et M. D. Svoboda, « Drought monitoring with NDVI-based Standardized Vegetation Index », Photogrammetric Engineering and Remote Sensing, vol. 68, no 1, p. 71-75, 2002.
- Kogan, « Remote sensing of weather impacts on vegetation in non-homogeneous areas », International Journal of Remote Sensing, vol. 11, no 8, p. 1405-1419, 1990.
- X. Zhao et al., « Drought monitoring over yellow river basin from 2003–2019 using reconstructed MODIS land surface temperature in google earth engine », Remote Sensing, vol. 13, no 18, 2021. [CrossRef]
- Y. Tramblay et P. Quintana Seguí, « Estimating soil moisture conditions for drought monitoring with random forests and a simple soil moisture accounting scheme », vol. 1, p. 1325-1334, 2022.
- R. Amri, M. Zribi, Z. Lili-Chabaane, B. Duchemin, C. Gruhier, et A. Chehbouni, « Analysis of Vegetation Behavior in a North African Semi-Arid Region, Using SPOT-VEGETATION NDVI Data », Remote Sensing 2011, Vol. 3, Pages 2568-2590, vol. 3, no 12, p. 2568-2590, nov. 2011. [CrossRef]
- A. Zhang et G. Jia, « Monitoring meteorological drought in semiarid regions using multi-sensor microwave remote sensing data », Remote Sensing of Environment, vol. 134, p. 12-23, 2013. [CrossRef]
- V. Yevjevich, « An objective approach to definitions and investigations of continental hydrologic droughts », Journal of Hydrology, vol. 7, no 3, p. 353, 1967. [CrossRef]
- V. de M. B. Raposo, V. A. F. Costa, et A. F. Rodrigues, « A review of recent developments on drought characterization, propagation, and influential factors », Science of the Total Environment, vol. 898, no May, 2023. [CrossRef]
- A. F. Van Loon, « Hydrological drought explained », Wiley Interdisciplinary Reviews: Water, vol. 2, no 4, p. 359-392, juill. 2015. [CrossRef]
- X. Zhang et al., « Drought propagation under global warming: Characteristics, approaches, processes, and controlling factors », Science of the Total Environment, vol. 838, no 19, p. 156021, 2022, doi: 10.1016/j.scitotenv.2022.156021. [CrossRef]
- K. C. Mo, « Drought onset and recovery over the United States », Journal of Geophysical Research: Atmospheres, vol. 116, no D20, 2011. [CrossRef]
- J. Spinoni, J. V. Vogt, G. Naumann, P. Barbosa, et A. Dosio, « Will drought events become more frequent and severe in Europe? », International Journal of Climatology, vol. 38, no 4, p. 1718-1736, 2018. [CrossRef]
- L. M. Tallaksen, H. Madsen, et B. Clausen, « On the definition and modelling of streamflow drought duration and deficit volume », Hydrological Sciences Journal, vol. 42, no 1, p. 15-33, févr. 1997. [CrossRef]
- X. Tu, V. P. Singh, X. Chen, M. Ma, Q. Zhang, et Y. Zhao, « Uncertainty and variability in bivariate modeling of hydrological droughts », Stochastic Environmental Research and Risk Assessment, vol. 30, no 5, p. 1317-1334, 2016. [CrossRef]
- J. Spinoni et al., « Future Global Meteorological Drought Hot Spots: A Study Based on CORDEX Data », Journal of Climate, vol. 33, no 9, p. 3635-3661, mai 2020. [CrossRef]
- M. Le Page et al., « Projection of irrigation water demand based on the simulation of synthetic crop coefficients and climate change », Hydrology and Earth System Sciences, vol. 25, no 2, p. 637-651, févr. 2021. [CrossRef]
- J. A. Dracup, K. S. Lee, et E. G. Paulson, « On the statistical characteristics of drought events », Water Resources Research, vol. 16, no 2, p. 289-296, avr. 1980. [CrossRef]
- J. P. Vidal et al., « Multilevel and multiscale drought reanalysis over France with the Safran-Isba-Modcou hydrometeorological suite », Hydrology and Earth System Sciences, vol. 14, no 3, p. 459-478, 2010. [CrossRef]
- M. Svoboda et al., « The drought monitor », Bulletin of the American Meteorological Society, vol. 83, no 8, p. 1181-1190, 2002. [CrossRef]
- B. R. Bonsal, E. E. Wheaton, A. Meinert, et E. Siemens, « Characterizing the Surface Features of the 1999–2005 Canadian Prairie Drought in Relation to Previous Severe Twentieth Century Events », Atmosphere-Ocean, vol. 49, no 4, p. 320-338, déc. 2011. [CrossRef]
- S. Parry, C. Prudhomme, R. L. Wilby, et P. J. Wood, « Drought termination: Concept and characterisation », Progress in Physical Geography: Earth and Environment, vol. 40, no 6, p. 743-767, déc. 2016. [CrossRef]
- G. Sepulcre-Canto, S. Horion, A. Singleton, H. Carrao, et J. Vogt, « Development of a Combined Drought Indicator to detect agricultural drought in Europe », Natural Hazards and Earth System Sciences, vol. 12, no 11, p. 3519-3531, nov. 2012. [CrossRef]
- J. Gaona, P. Quintana-seguí, M. J. Escorihuela, A. Boone, et M. C. Llasat, « Interactions between precipitation , evapotranspiration and soil moisture-based indices to characterize drought with high-resolution remote sensing and land-surface model data . », Natural Hazards and Earth System Sciences [Preprint], no March, p. 1-30, 2022. [CrossRef]
- V. K. Jain, R. P. Pandey, M. K. Jain, et H. R. Byun, « Comparison of drought indices for appraisal of drought characteristics in the Ken River Basin », Weather and Climate Extremes, vol. 8, p. 1-11, 2015. [CrossRef]
- Q. Liu, S. Zhang, H. Zhang, Y. Bai, et J. Zhang, « Monitoring drought using composite drought indices based on remote sensing », Science of the Total Environment, vol. 711, p. 134585, 2020. [CrossRef]
- Z. Pei, S. Fang, L. Wang, et W. Yang, « Comparative analysis of drought indicated by the SPI and SPEI at various timescales in inner Mongolia, China », Water (Switzerland), vol. 12, no 7, 2020. [CrossRef]
- T. Silva, V. Pires, T. Cota, et Á. Silva, « Detection of Drought Events in Setúbal District: Comparison between Drought Indices », Atmosphere, vol. 13, no 4, p. 1-22, 2022. [CrossRef]
- L. Vergni, F. Todisco, et B. Di Lena, « Evaluation of the similarity between drought indices by correlation analysis and Cohen’s Kappa test in a Mediterranean area », Natural Hazards, vol. 108, no 2, p. 2187-2209, sept. 2021. [CrossRef]
- N. El Moçayd, S. Kang, et E. A. B. Eltahir, « Climate change impacts on the Water Highway project in Morocco », Hydrology and Earth System Sciences, vol. 24, no 3, p. 1467-1483, 2020, doi: 10.5194/hess-24-1467-2020. [CrossRef]
- Y. Tramblay, W. Badi, F. Driouech, S. El Adlouni, L. Neppel, et E. Servat, « Climate change impacts on extreme precipitation in Morocco », Global and Planetary Change, vol. 82-83, p. 104-114, 2012. [CrossRef]
- Y. Tramblay, L. Jarlan, L. Hanich, et S. Somot, « Future Scenarios of Surface Water Resources Availability in North African Dams », Water Resources Management, vol. 32, no 4, p. 1291-1306, 2018. [CrossRef]
- M. H. Kharrou, V. Simonneaux, S. Er-raki, M. L. Page, S. Khabba, et A. Chehbouni, « Assessing irrigation water use with remote sensing-based soil water balance at an irrigation scheme level in a semi-arid region of morocco », Remote Sensing, vol. 13, no 6, p. 1-24, 2021. [CrossRef]
- M. Buchhorn et al., « Copernicus Global Land Service: Land Cover 100m: collection 3: epoch 2019: Globe », sept. 2020. [CrossRef]
- H. Hersbach et al., « The ERA5 global reanalysis », Quarterly Journal of the Royal Meteorological Society, vol. 146, no 730, p. 1999-2049, 2020. [CrossRef]
- G. B. Senay, M. Schauer, M. Friedrichs, N. M. Velpuri, et R. K. Singh, « Satellite-based water use dynamics using historical Landsat data (1984–2014) in the southwestern United States », Remote Sensing of Environment, vol. 202, p. 98-112, déc. 2017. [CrossRef]
- Livada et V. D. Assimakopoulos, « Spatial and temporal analysis of drought in Greece using the Standardized Precipitation Index (SPI) », Theoretical and Applied Climatology, vol. 89, no 3-4, p. 143-153, 2007. [CrossRef]
- B. S. Sobral et al., « Drought characterization for the state of Rio de Janeiro based on the annual SPI index: trends, statistical tests and its relation with ENSO », Atmospheric Research, vol. 220, no July 2018, p. 141-154, 2019. [CrossRef]
- X. Bai, P. Wang, Y. He, Z. Zhang, et X. Wu, « Assessing the accuracy and drought utility of long-term satellite-based precipitation estimation products using the triple collocation approach », Journal of Hydrology, vol. 603, no PC, p. 127098, 2021, doi: 10.1016/j.jhydrol.2021.127098. [CrossRef]
- E. H. Bouras et al., « Linkages between rainfed cereal production and agricultural drought through remote sensing indices and a land data assimilation system: A case study in Morocco », Remote Sensing, vol. 12, no 24, p. 1-35, 2020. [CrossRef]
- M. Del Pilar Jiménez-Donaire, A. Tarquis, et J. Vicente Giráldez, « Evaluation of a combined drought indicator and its potential for agricultural drought prediction in southern Spain », Natural Hazards and Earth System Sciences, vol. 20, no 1, p. 21-33, 2020. [CrossRef]
- W. Jiao, C. Tian, Q. Chang, K. A. Novick, et L. Wang, « A new multi-sensor integrated index for drought monitoring », Agricultural and Forest Meteorology, vol. 268, no July 2018, p. 74-85, 2019. [CrossRef]
- S. M. Quiring et S. Ganesh, « Evaluating the utility of the Vegetation Condition Index (VCI) for monitoring meteorological drought in Texas », Agricultural and Forest Meteorology, vol. 150, no 3, p. 330-339, 2010. [CrossRef]
- H. Ezzine, A. Bouziane, et D. Ouazar, « Seasonal comparisons of meteorological and agricultural droughtindices in Morocco using open short time-series data », International Journal of Applied Earth Observation and Geoinformation, vol. 26, no 1, p. 36-48, 2014. [CrossRef]
- E. Layati, A. Ouigmane, A. Qadem, et M. El Ghachi, « Characterization and Quantification of Meteorological Drought in the Oued El-Abid Watershed, Central High Atlas, Morocco (1980-2019) », Hydrospatial Analysis, vol. 5, no 2, p. 45-55, 2021. [CrossRef]
- W. Zkhiri, Y. Tramblay, L. Hanich, L. Jarlan, et D. Ruelland, « Spatiotemporal characterization of current and future droughts in the High Atlas basins (Morocco) », Theoretical and Applied Climatology, vol. 135, no 1-2, p. 593-605, 2019. [CrossRef]
- S. Zhim, A. Larabi, et H. Brirhet, « Analysis of precipitation time series and regional drought assessment based on the standardized precipitation index in the Oum Er-Rbia basin (Morocco) », Arabian Journal of Geosciences, vol. 12, no 16, p. 1998-2000, 2019. [CrossRef]
- S. Acharki, S. K. Singh, E. V. do Couto, Y. Arjdal, et A. Elbeltagi, « Spatio-temporal distribution and prediction of agricultural and meteorological drought in a Mediterranean coastal watershed via GIS and machine learning », Physics and Chemistry of the Earth, vol. 131, no April, p. 103425, 2023. [CrossRef]
- O. Hakam, A. Baali, T. El Kamel, Y. Ahouach, et K. Azennoud, « Comparative evaluation of various drought indices (DIs) to monitor drought status: A case study of Moroccan Lower Sebou basin », Kuwait Journal of Science, vol. 49, no 3, 2022. [CrossRef]
- Y. Ait Brahim et al., « Assessment of climate and land use changes: Impacts on groundwater resources in the Souss-Massa river basin », Handbook of Environmental Chemistry, vol. 53, p. 121-142, 2017. [CrossRef]
- N. R. Dalezios, A. Gobin, A. M. Tarquis Alfonso, et S. Eslamian, « Agricultural Drought Indices: Combining Crop, Climate, and Soil Factors », Handbook of Drought and Water Scarcity, no January, p. 73-89, 2017. [CrossRef]
- N. Sánchez, Á. González-Zamora, M. Piles, et J. Martínez-Fernández, « A New Soil Moisture Agricultural Drought Index (SMADI) Integrating MODIS and SMOS Products: A Case of Study over the Iberian Peninsula », Remote Sensing 2016, Vol. 8, Page 287, vol. 8, no 4, p. 287, mars 2016. [CrossRef]
- Y. Xu, L. Wang, K. W. Ross, C. Liu, et K. Berry, « Standardized soil moisture index for drought monitoring based on soil moisture active passive observations and 36 years of North American Land Data Assimilation System data: A case study in the Southeast United States », Remote Sensing, vol. 10, no 2, 2018. [CrossRef]
- N. Farhani, J. Carreau, Z. Kassouk, M. L. Page, Z. L. Chabaane, et G. Boulet, « Analysis of Multispectral Drought Indices in Central Tunisia », Remote Sensing, vol. 14, no 8, p. 1-27, 2022. [CrossRef]
- S. M. Vicente-Serrano et al., « Global assessment of the standardized evapotranspiration deficit index (SEDI) for drought analysis and monitoring », Journal of Climate, vol. 31, no 14, p. 5371-5393, 2018. [CrossRef]
- M. Zribi, S. Nativel, et M. Le Page, « Analysis of Agronomic Drought in a Highly Anthropogenic Context Based on Satellite Monitoring of Vegetation and Soil Moisture », Remote Sensing, vol. 13, no 14, Art. no 14, janv. 2021. [CrossRef]
- L. Ji et A. J. Peters, « Assessing vegetation response to drought in the northern Great Plains using vegetation and drought indices », Remote Sensing of Environment, vol. 87, no 1, p. 85-98, sept. 2003. [CrossRef]
- S. M. Vicente-Serrano et al., « Performance of drought indices for ecological, agricultural, and hydrological applications », Earth Interactions, vol. 16, no 10, p. 1-27, 2012. [CrossRef]
- W. Wei, J. Zhang, L. Zhou, B. Xie, J. Zhou, et C. Li, « Comparative evaluation of drought indices for monitoring drought based on remote sensing data », Environmental Science and Pollution Research, vol. 28, no 16, p. 20408-20425, 2021. [CrossRef]
- T. Chen, R. A. M. de Jeu, Y. Y. Liu, G. R. van der Werf, et A. J. Dolman, « Using satellite based soil moisture to quantify the water driven variability in NDVI: A case study over mainland Australia », Remote Sensing of Environment, vol. 140, p. 330-338, 2014. [CrossRef]
- L. Brocca, L. Ciabatta, C. Massari, S. Camici, et A. Tarpanelli, « Soil moisture for hydrological applications: Open questions and new opportunities », Water (Switzerland), vol. 9, no 2, 2017. [CrossRef]
- S. J. Bakke, M. Ionita, et L. M. Tallaksen, « The 2018 northern European hydrological drought and its drivers in a historical perspective », Hydrology and Earth System Sciences, vol. 24, no 11, p. 5621-5653, 2020. [CrossRef]
- Wu, X. Chen, H. Yao, L. Gao, Y. Chen, et M. Liu, « Non-linear relationship of hydrological drought responding to meteorological drought and impact of a large reservoir », Journal of Hydrology, vol. 551, p. 495-507, 2017. [CrossRef]
- S. M. Vicente-Serrano et al., « Climate, Irrigation, and Land Cover Change Explain Streamflow Trends in Countries Bordering the Northeast Atlantic », Geophysical Research Letters, vol. 46, no 19, p. 10821-10833, oct. 2019. [CrossRef]
- Wu, X. Chen, Z. Yu, H. Yao, W. Li, et D. Zhang, « Assessing the impact of human regulations on hydrological drought development and recovery based on a “simulated-observed” comparison of the SWAT model », 2019. [CrossRef]
- F. N. Kogan, « Application of vegetation index and brightness temperature for drought detection », Advances in Space Research, vol. 15, no 11, p. 91-100, 1995. [CrossRef]
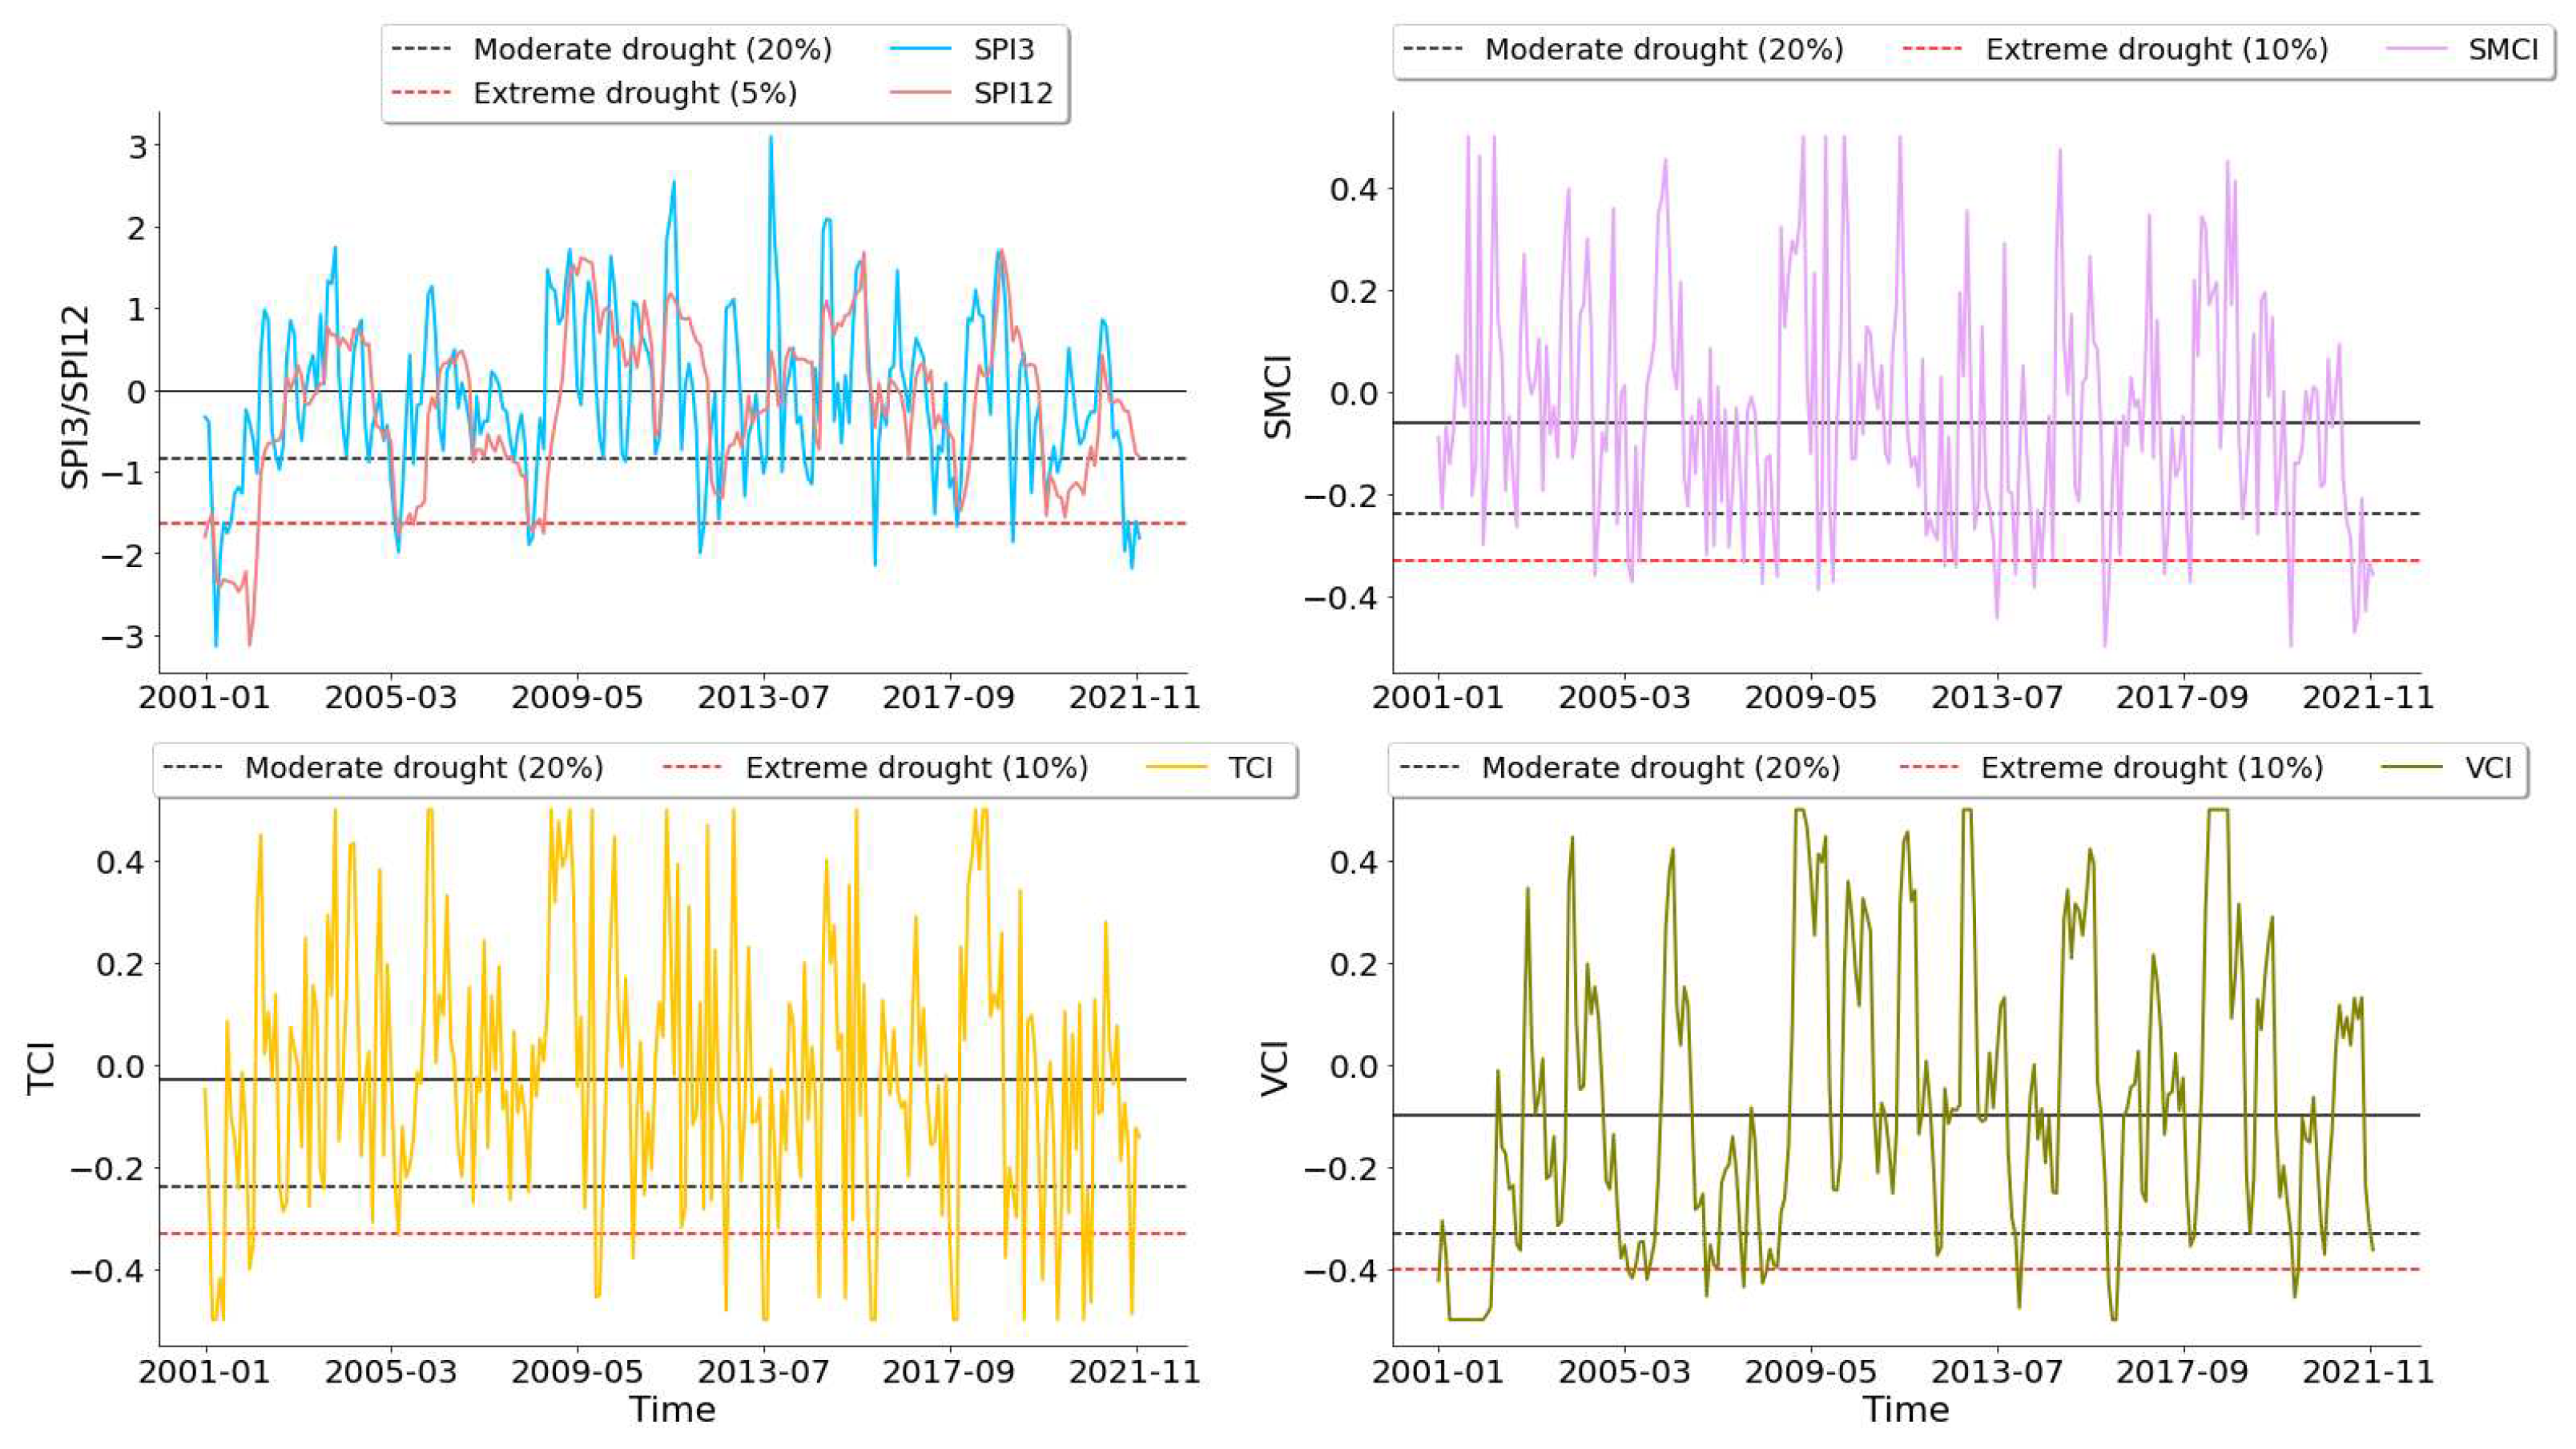
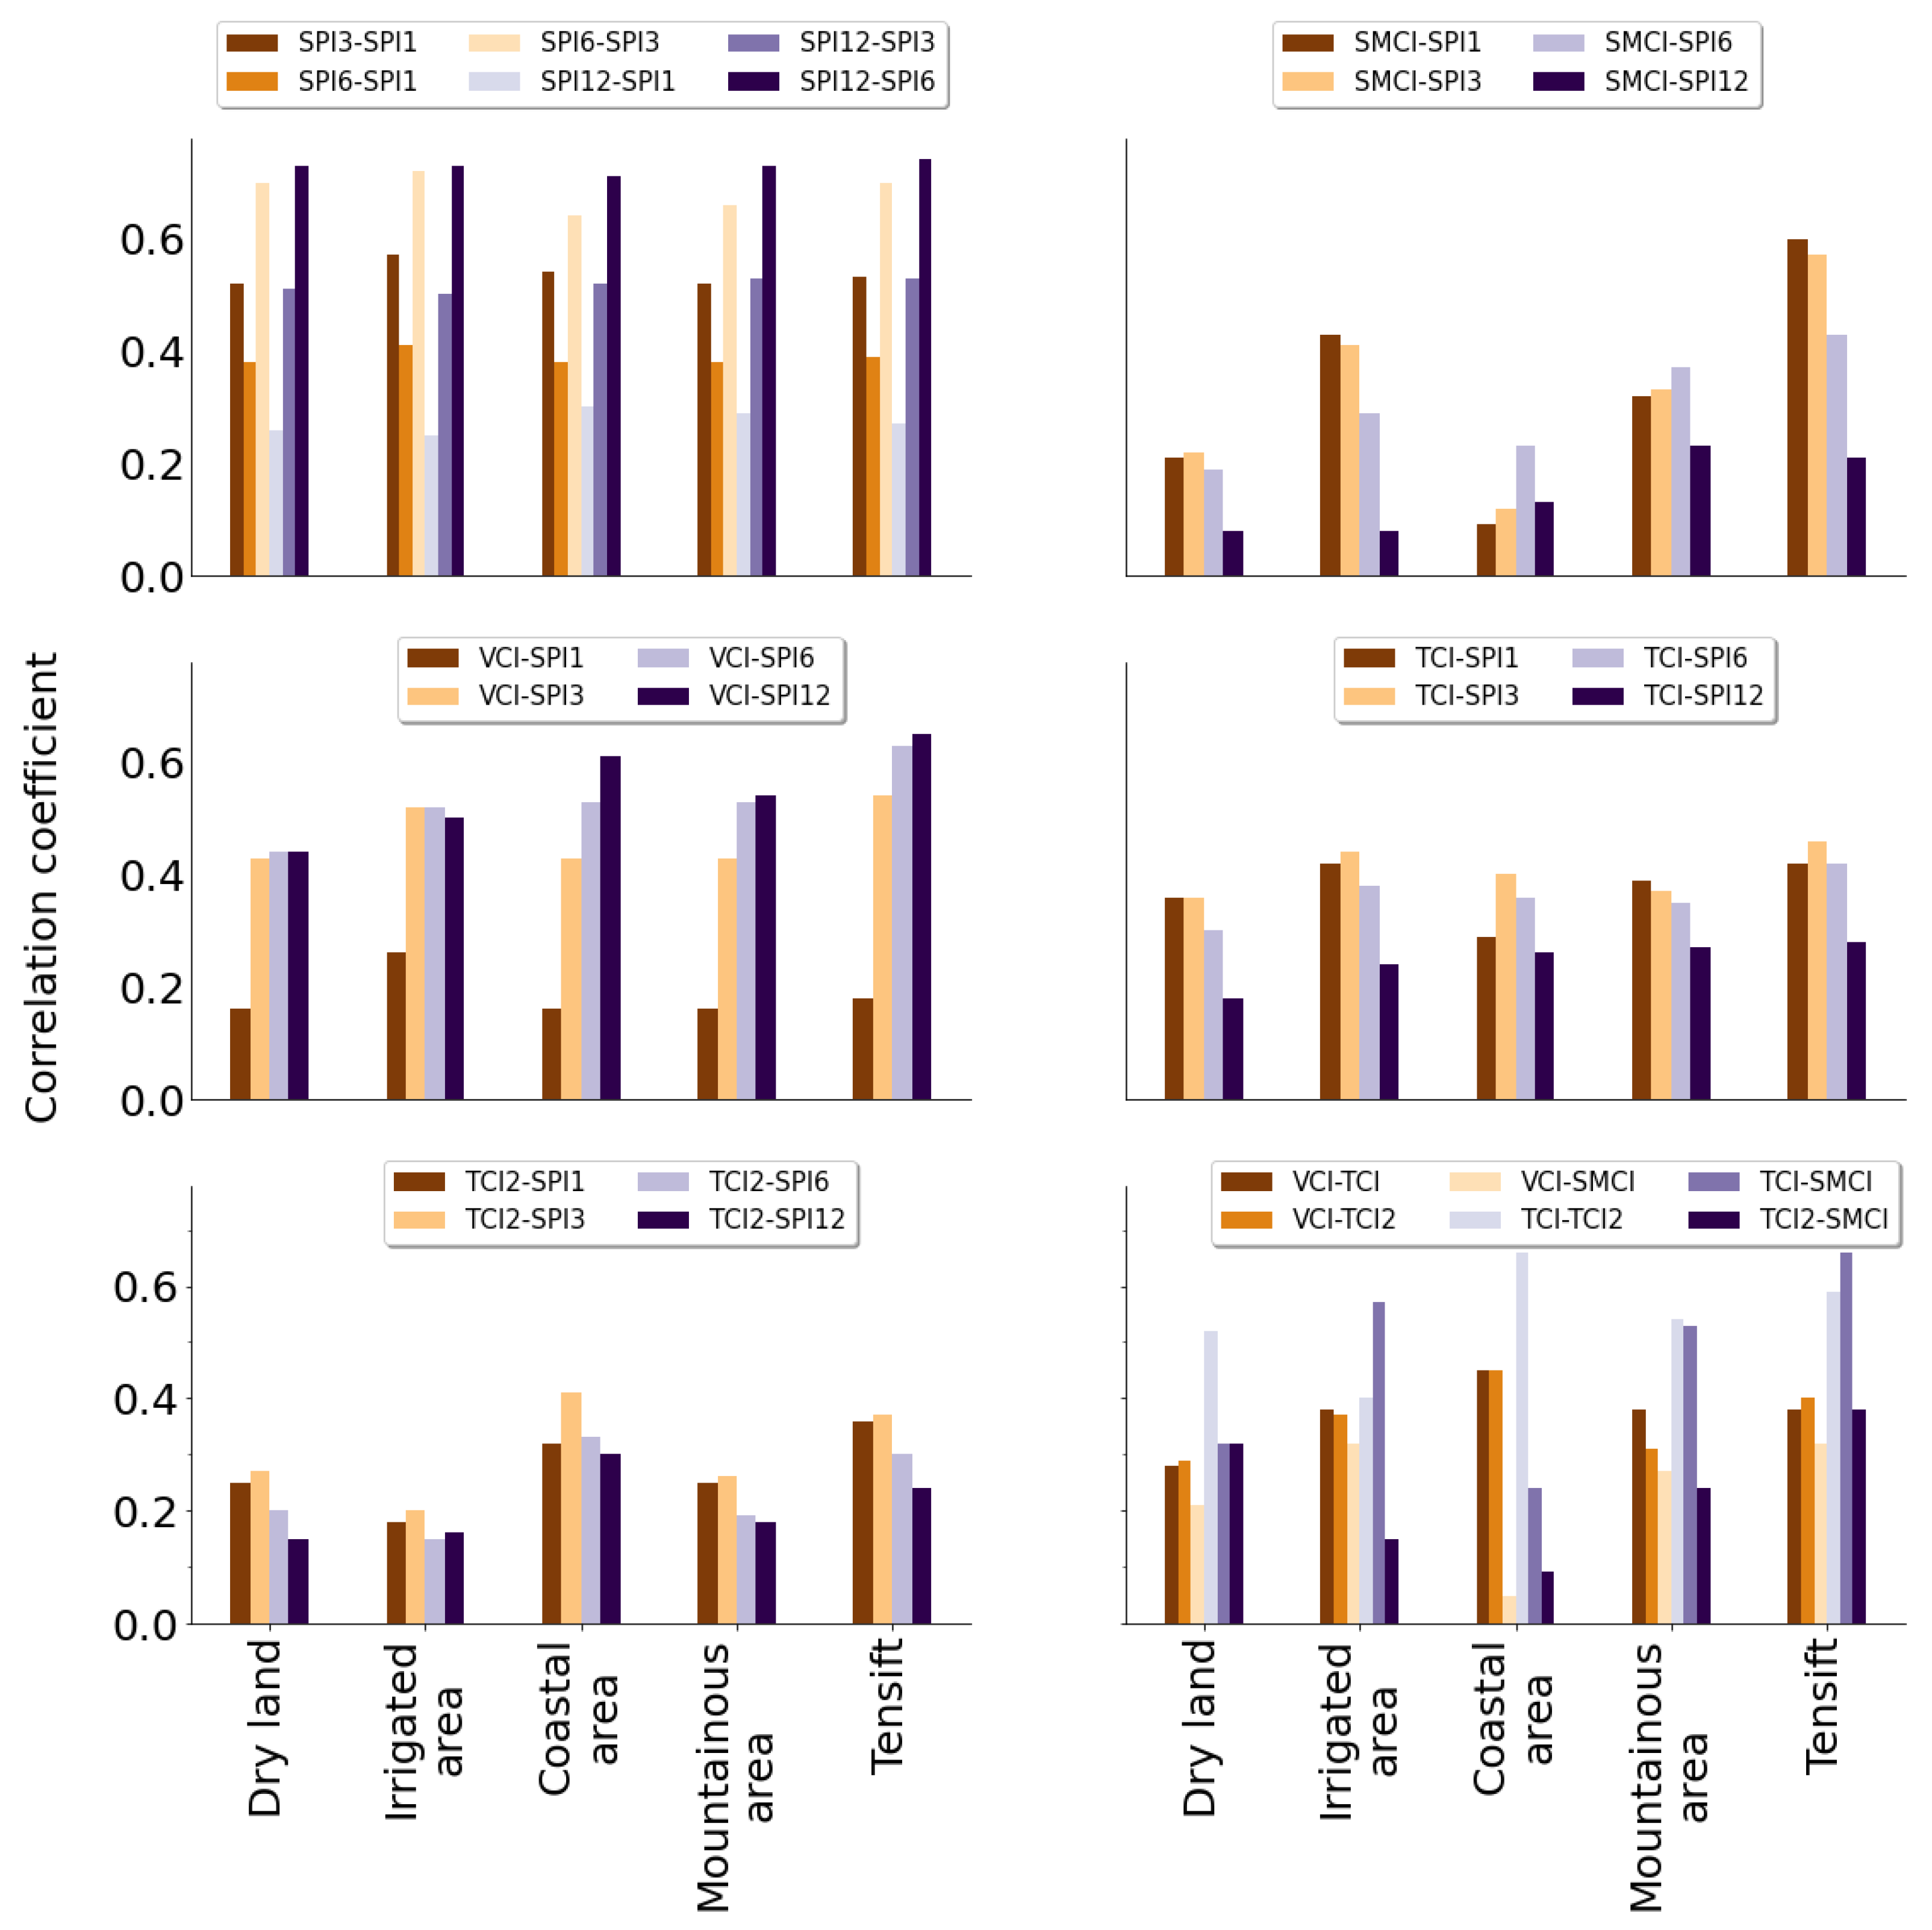
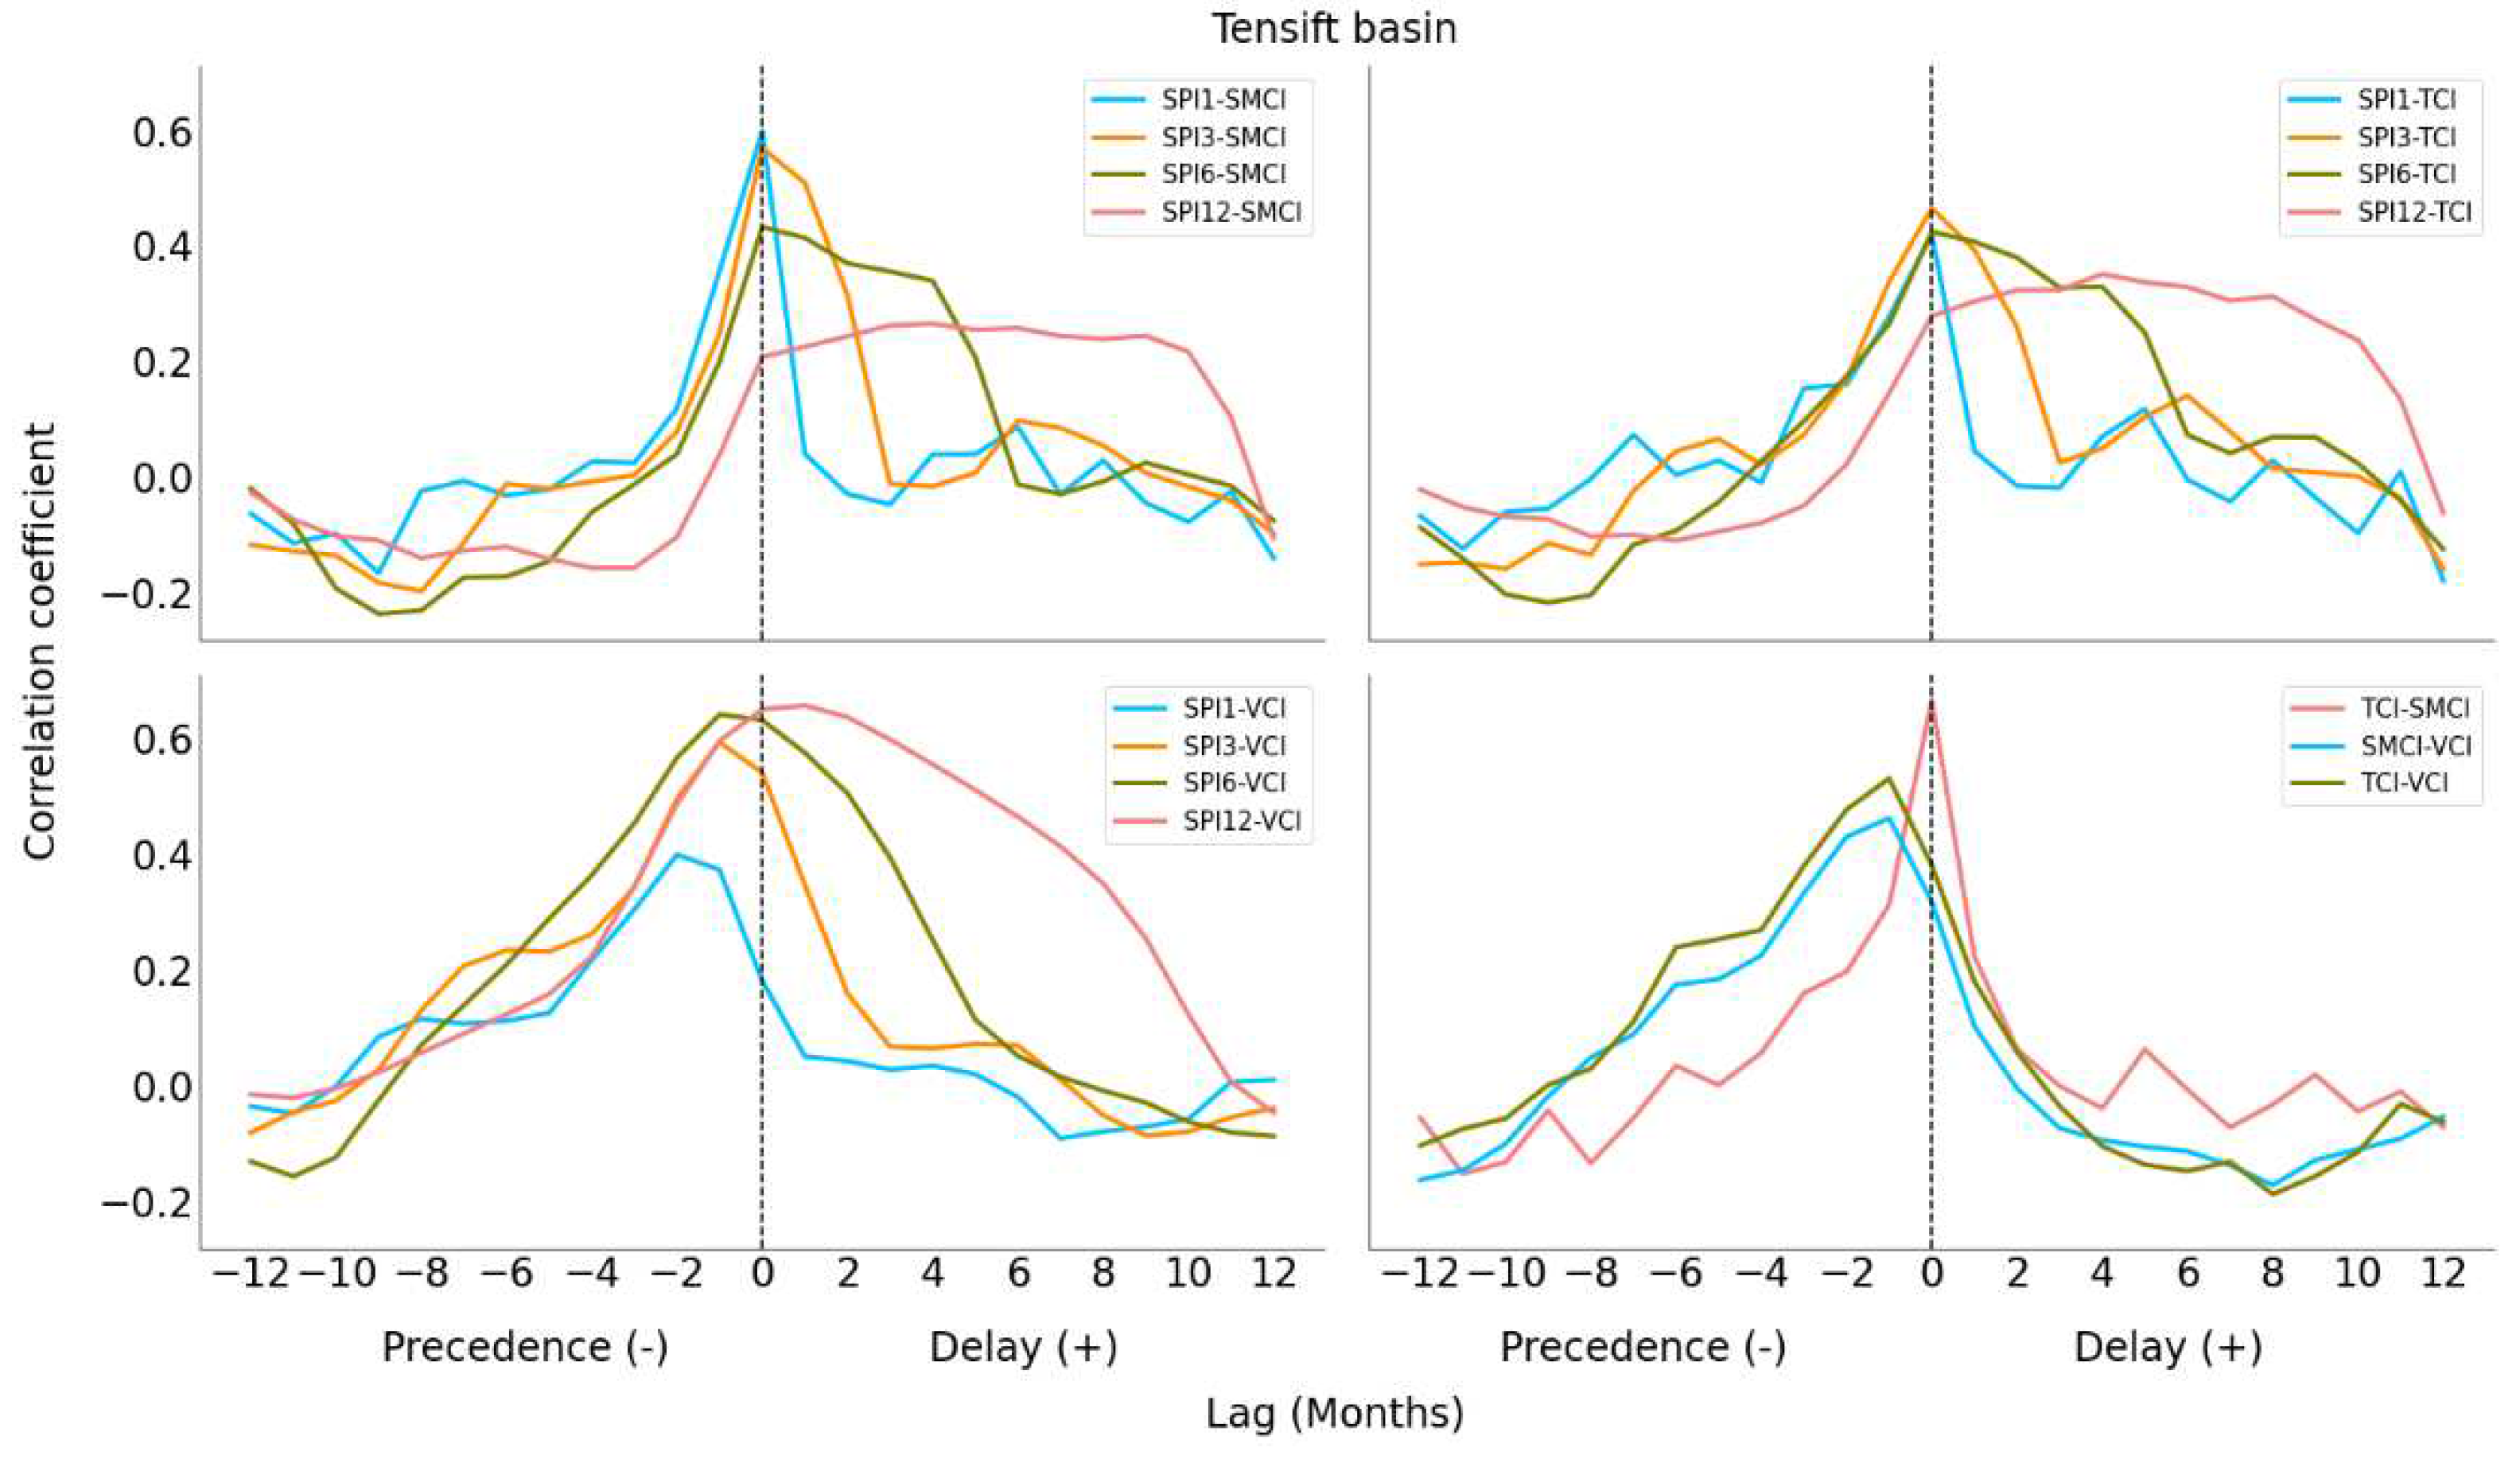
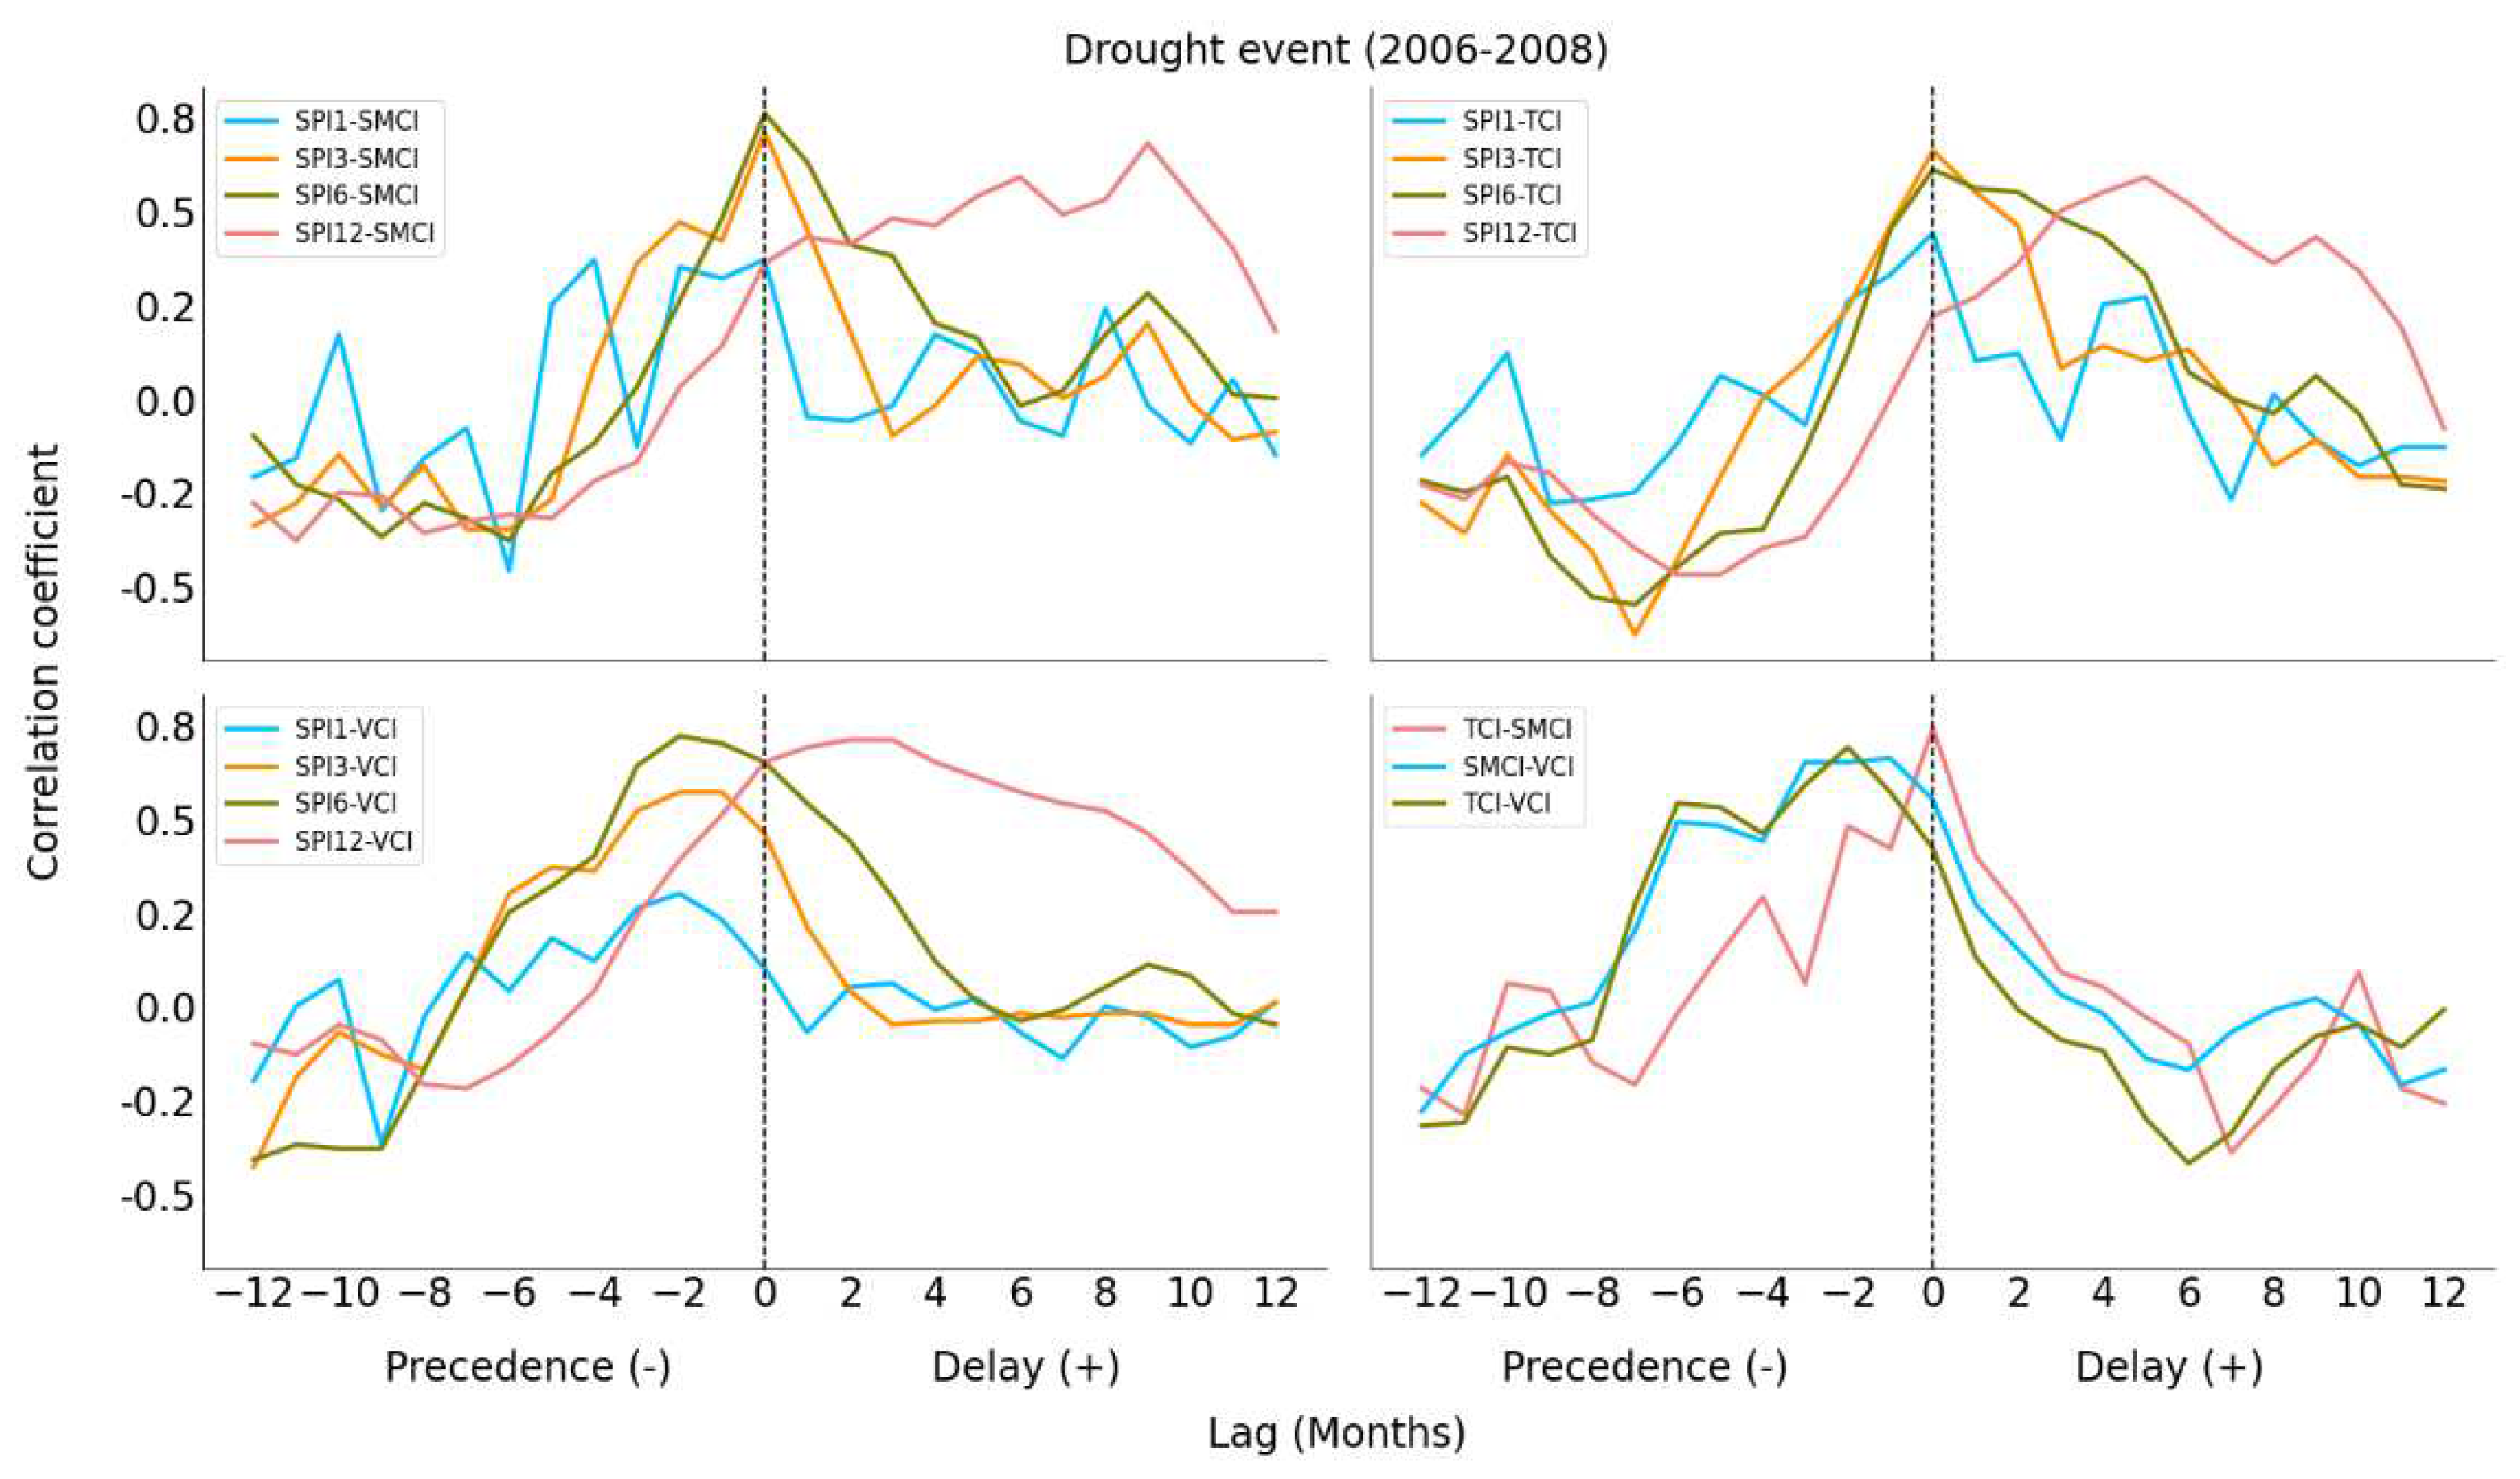
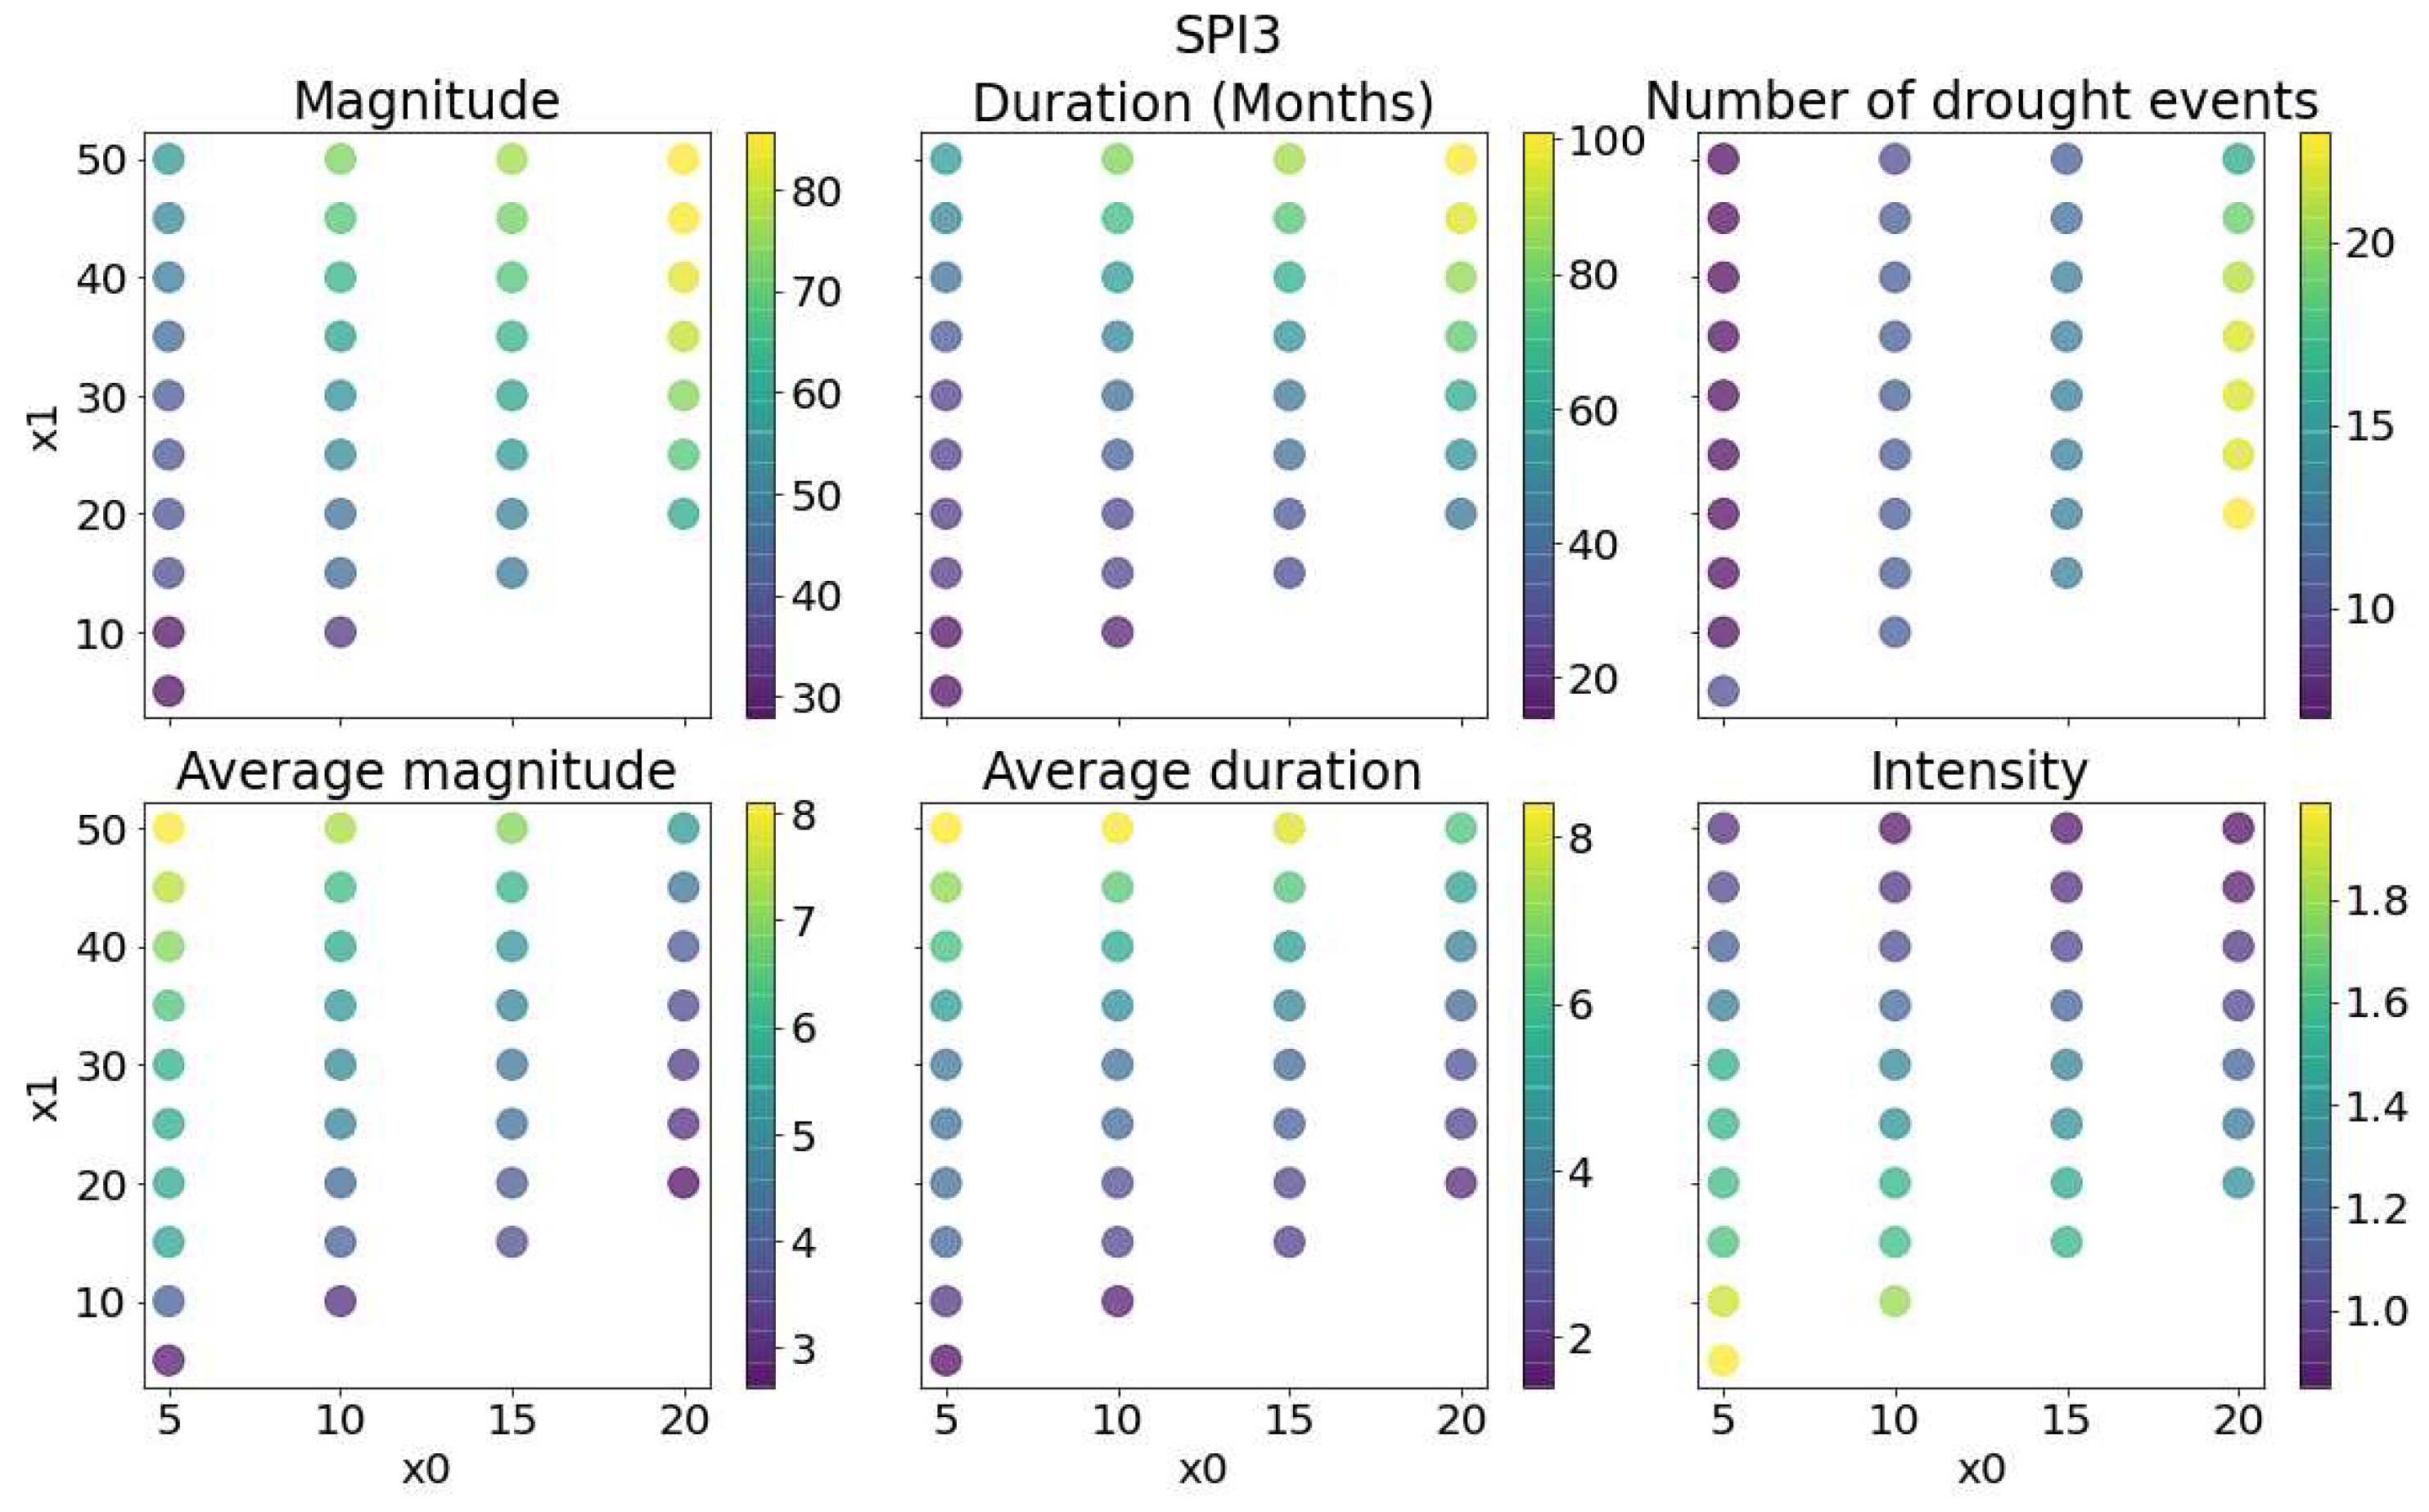
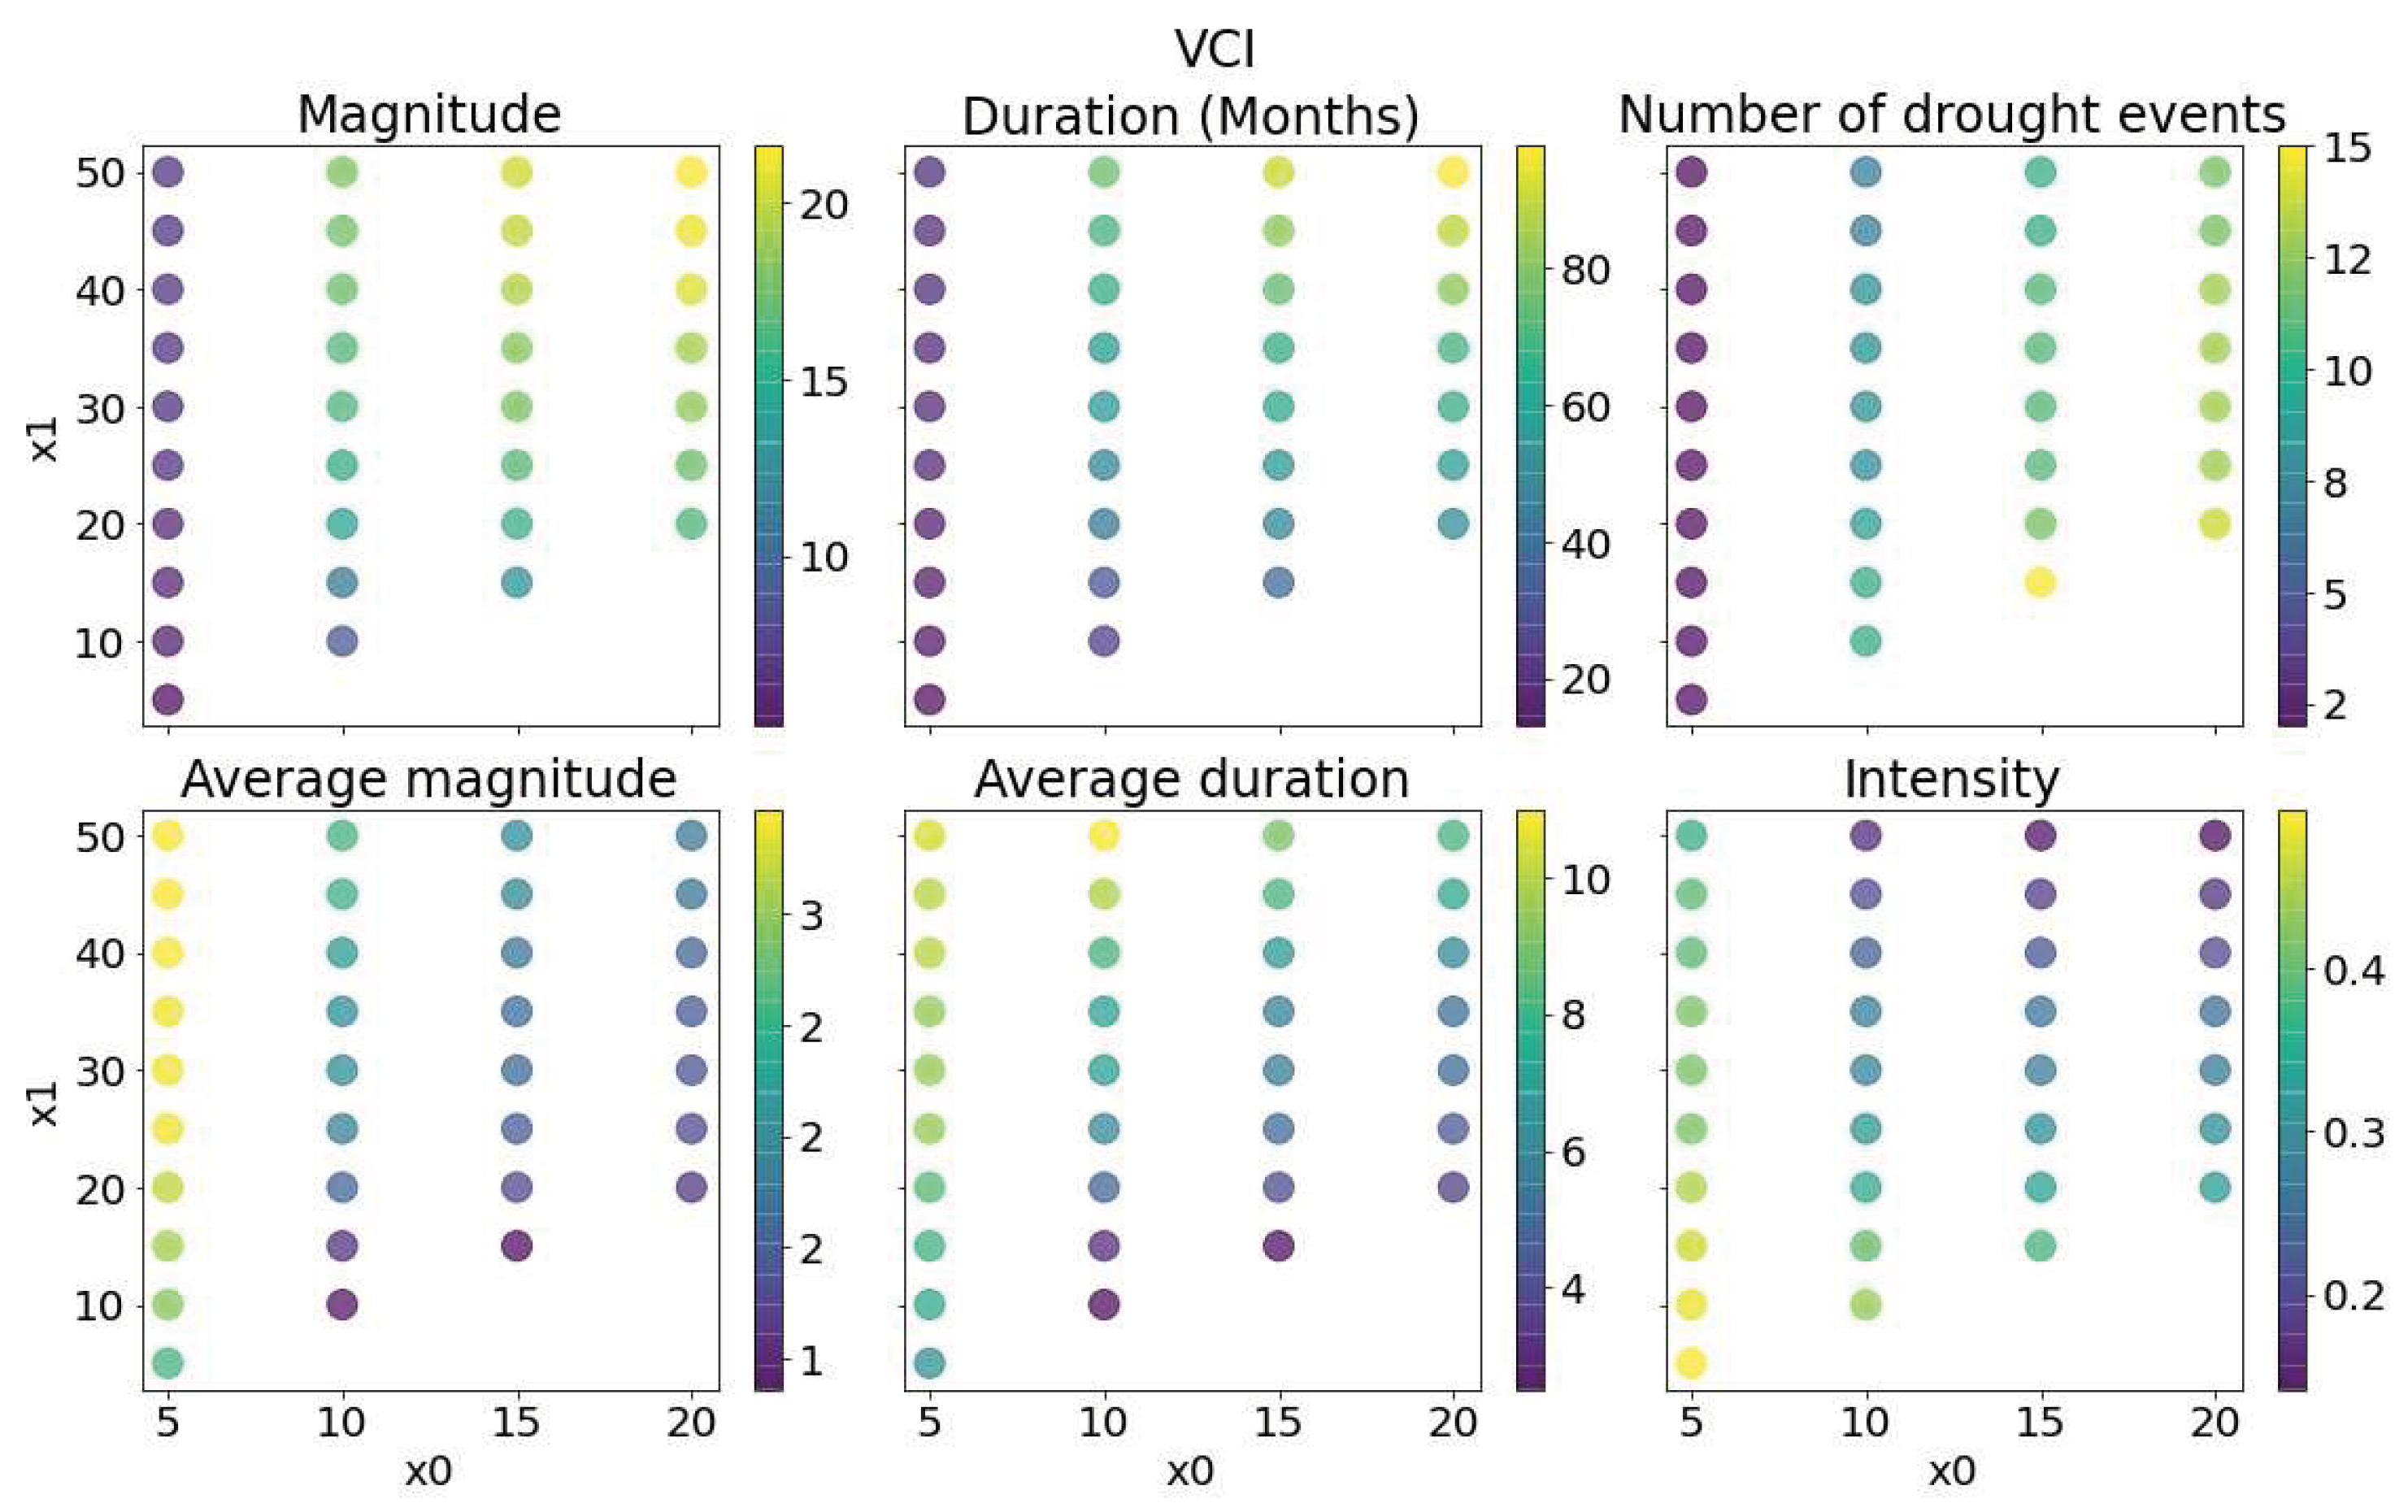
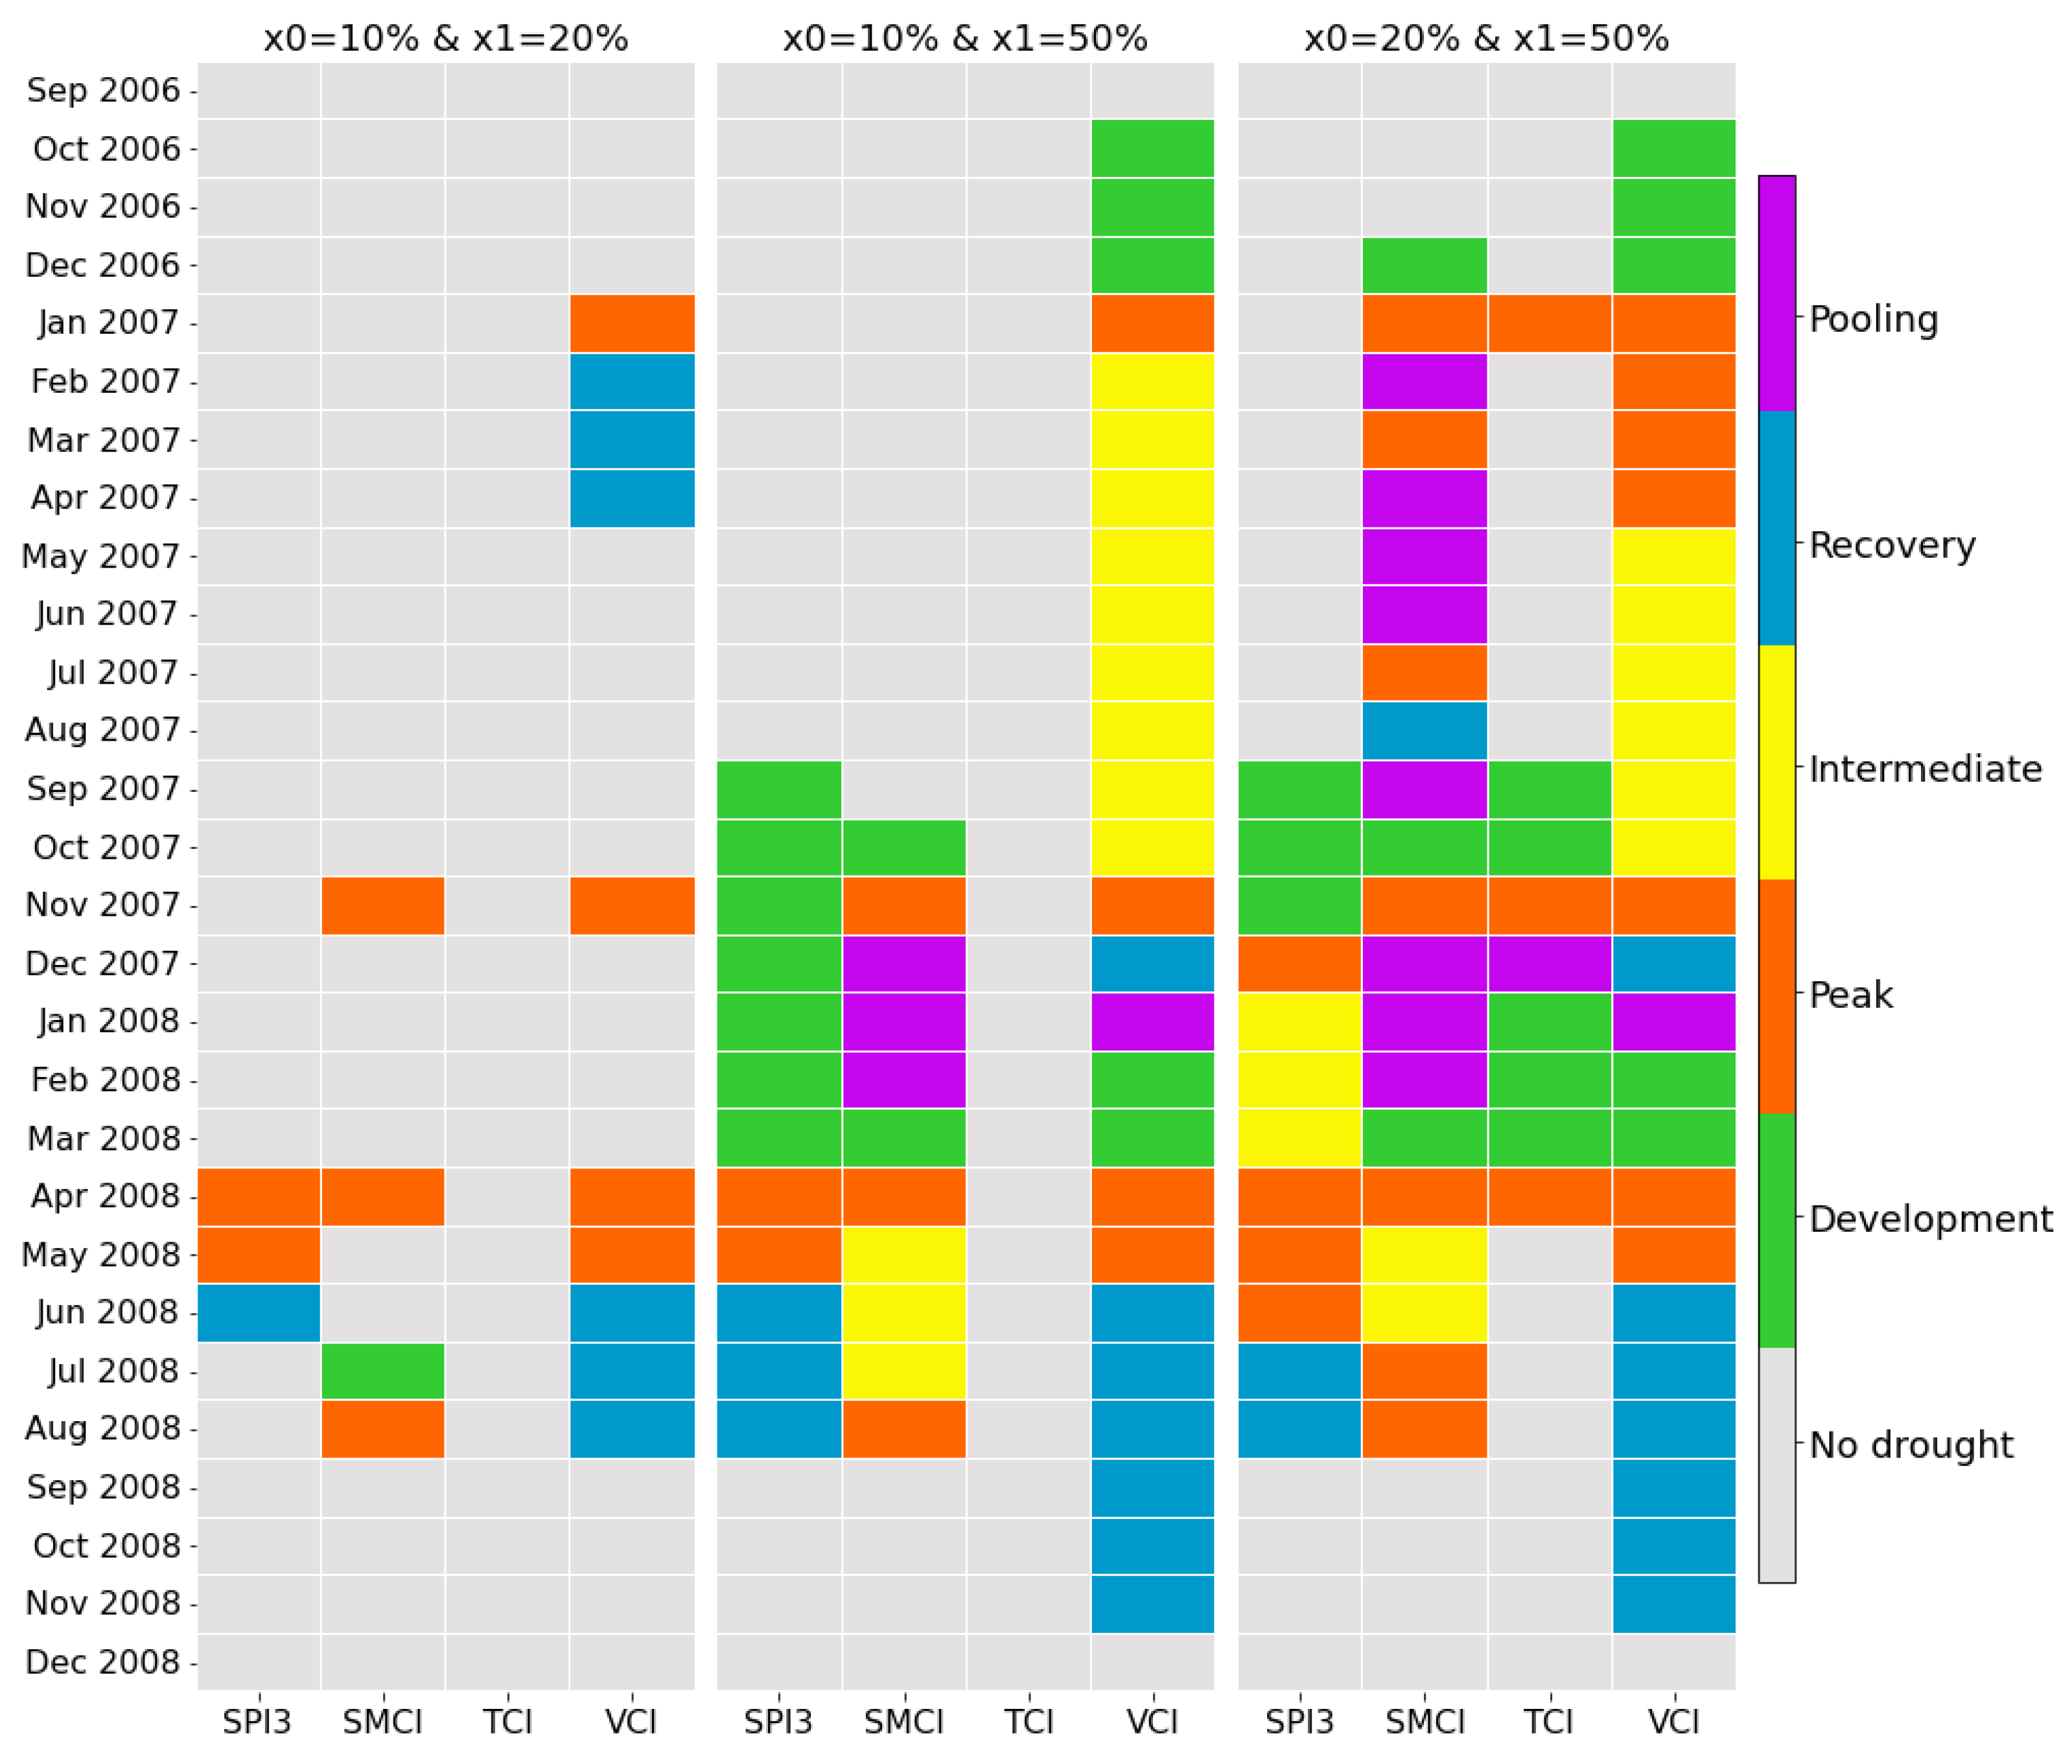
| Probability of occurrence (%) | Drought category | SPI | VCI | TCI | SMCI |
|---|---|---|---|---|---|
| 5 | Exceptional | -1.64 | -0.48 | -0.49 | -0.36 |
| 10 | Extreme | -1.28 | -0.4 | -0.33 | -0.33 |
| 15 | Severe | -1.04 | -0.36 | -0.28 | -0.28 |
| 20 | Moderate | -0.84 | -0.33 | -0.24 | -0.24 |
| 25 | Abnormally dry | -0.67 | -0.28 | -0.2 | -0.21 |
| 30 | -0.52 | -0.25 | -0.16 | -0.18 | |
| 35 | Close to normal | -0.39 | -0.23 | -0.12 | -0.14 |
| 40 | -0.25 | -0.19 | -0.09 | -0.13 | |
| 45 | -0.13 | -0.14 | -0.06 | -0.09 | |
| 50 | 0 | -0.1 | -0.03 | -0.06 |
Disclaimer/Publisher’s Note: The statements, opinions and data contained in all publications are solely those of the individual author(s) and contributor(s) and not of MDPI and/or the editor(s). MDPI and/or the editor(s) disclaim responsibility for any injury to people or property resulting from any ideas, methods, instructions or products referred to in the content. |
© 2023 by the authors. Licensee MDPI, Basel, Switzerland. This article is an open access article distributed under the terms and conditions of the Creative Commons Attribution (CC BY) license (http://creativecommons.org/licenses/by/4.0/).


