Preprint
Article

Lean Product and Process Development in an Automotive Company

Altmetrics

Downloads

169

Views

72

Comments

0

Submitted:

03 November 2023

Posted:

06 November 2023

You are already at the latest version

Alerts
Abstract
Product Development Process is widely known among industry and automobile companies. With the advance of technology and the need to improve product efficiency, many companies have been applying Lean Thinking principles. Their benefits lead those companies to implement their concepts and tools, like Value Stream Design in Indirect Areas, Obeya, Just-in-time (JIT) which is based on the production control system developed and implemented by Toyota. This article describes the case study of the implementation of Lean Product & Process Development (LPPD) on the current Product Development Process (PDP) in an automotive company. The PDP was created by the organization and adapted from Advanced Product Quality Planning (APQP). The main findings were a Value Stream Design model of an improved PDP as a useful and successfully contribution for the company. These improvements reduced the product development lead time from 700 days to 369 days. The process efficiency increased from 68% to 85%. The communication and transparency between the cross-functional team (CFT) was improved and show promise for achieving a successful launch of new products.
Keywords: 
Subject: Engineering  -   Industrial and Manufacturing Engineering

1. Introduction

The automotive industry has repeatedly held its position as one of the most competitive sectors in the global marketplace. However, with the technologic progress and the pressing need to improve time-to-market, companies within this industry find themselves navigating a landscape shaped by ever-evolving market demands. The need to fulfil certain objectives like high quality, meeting customers’ needs and reduce costs led to the emergence of design methodologies that facilitate the development of a product efficiently and effectively 1. In the context of modern automotive production, where companies deal with uncertainty, the decisions made in the early stages of a project can significantly influence the cost of the final product. Therefore, optimizing these embryonic stages is essential to achieving a cost-effective product. Bearing that in mind, many companies have been focused on the implementation of Lean Thinking principles applied in product development processes 2. This philosophy, known for its versatility and applicability across various industries, focuses on reducing production times and costs while enhancing process effectiveness, without compromising the quality of the final product. The literature demonstrates the existence of various types of waste in this kind of processes3 that can be reduced or even eliminated by the application of these methodologies. Although waste can be more visible in manufacturing factories around the world, rather than in PD processes, Lean PD is now taking its first “baby steps”, without many onsite research applications. This requires a robust product design which allows the application of stable and lean processes 4. The Table 1 presents the types of waste that can be found on Lean Production and on Lean Product Development.
The aim of this work was to propose a new Lean Product Development framework to achieve a better understanding about the way Lean Thinking implementation impact manufacturing processes in an automotive company, in a practice-based perspective. Currently, with the vision of clean energy-efficient world, the company has been moving towards electrification, producing solutions for combustion, hybrid and, increasingly, purely electric vehicles. Therefore, the object of study in this project was the High Voltage Air Heater (HVAH) for a Battery Electric Vehicle (BEV).
The remainder of this paper is organized as follows. Section two presents the research methodology applied. The third section describes the Lean Production concept and the principles of its application. It is also provided a detailed description of the product development process, the Lean Product and Process Development (LPPD) workshops and a critical analysis and identification of problems through Value Stream Design for indirect Areas. In section four, the results of the Value Stream Design of the future state and the implementation of improvement proposals are delivered, it is also presented the Value Stream Design results and discussion. Finally, the last section draws the main conclusions and contributions of the present work.

2. Research Methodology

The research methodology used in the project described was Action-Research (AR). This methodology is characterized by the researcher's intervention in the action of the research site 6. A cyclical process is used, alternating between action and critical reflection. Throughout this process, there is continuous improvement with respect to the data, methods and interpretation carried out. The cyclical process is composed of five phases according with Susman and Evered (1978). These phases are: 1) diagnosis, 2) action planning, 3) implementation, 4) evaluation and 5) learning specification.
Thus, to study the problem and successfully achieve the objective of this work, one of the researchers worked directly with the engineers responsible for the improvement and development of this project. The phases of AR used in the context of this work are detailed next.
In phase 1, diagnosis, the problem that causes the desire to change was investigated and established. The gaps of manufacturing were assessed, and the current processes weaknesses were identified. For this, it is important to point out that a practical, detailed study of several versions of sensors already produced at this automotive company was developed.
Then, in phase 2, action planning, actions were investigated and planned to solve the identified problem. In this way, practical methodologies and tools were studied, presented in the state of the art, that contributed to the formulation of solutions intended to mitigate the stated problem.
In phase 3, implementation of the action, some of the methodologies and tools presented in the state of the art were applied to solve the problem under study.
After that, in phase 4, evaluation, the selected proposals were analyzed and tested. In this sense, simulations and tests were carried out and analyzed for the developed solutions that allows the definition of the final solution for the identified problem.
Phase 5, identified as learning specification, was developed in parallel with the entire process, as it served to specify the knowledge resulting from each phase, thus corresponding to the writing of the article.

3. Critical Analysis

This section presents the critical analysis that was made to identify the problems existent in the PDP of a product High Voltage Air Heater. For this, it was used the Value Stream Design for Indirect Areas (VSDiA), observations and value stream analysis.

3.1. Product Development Process and Lean Product Development Process description

The Product Development Process (PDP) is based on the Advanced Product Quality Planning (APQP). APQP is a structured process aimed at ensuring customer satisfaction with new products or processes. The goal of product quality planning is to facilitate communication with everyone involved in PDP, identify the failures and required changes in an early phase of the project, avoid late changes and provide a quality product on time at the lowest cost 8. PDP is, thus, a collaborative process, which requires the contribution of multiple engineering disciplines within a design department, and across the enterprise network.
Lean Product and Process Development (LPPD) was a collaborative approach to support product and production planning as integrated part of PDP. LPPD is a lean strategy model that was recently implemented in the organization. LPPD was based on workshops for the cross functional team bringing different perspectives together to develop a lean and agile product and value streams driving the risk mitigation.

3.2. Critical analysis and problems identification through VSDiA

The lean tool used to analyze PDP and identify the problems was Value Stream Mapping and Design for Indirect Areas. The first applications of Value Stream Mapping (VSM) were on the manufacturing (i.e., physical transformation), later on was extended Value stream mapping’s application to office and administrative processes (information management) 9. This means it is possible to apply a VSM to an indirect process, like the PDP, through adaptation to specific features of business processes in indirect areas 10. Figure 1 presents the phase structure of Value Stream Design for indirect Areas (VSDiA).
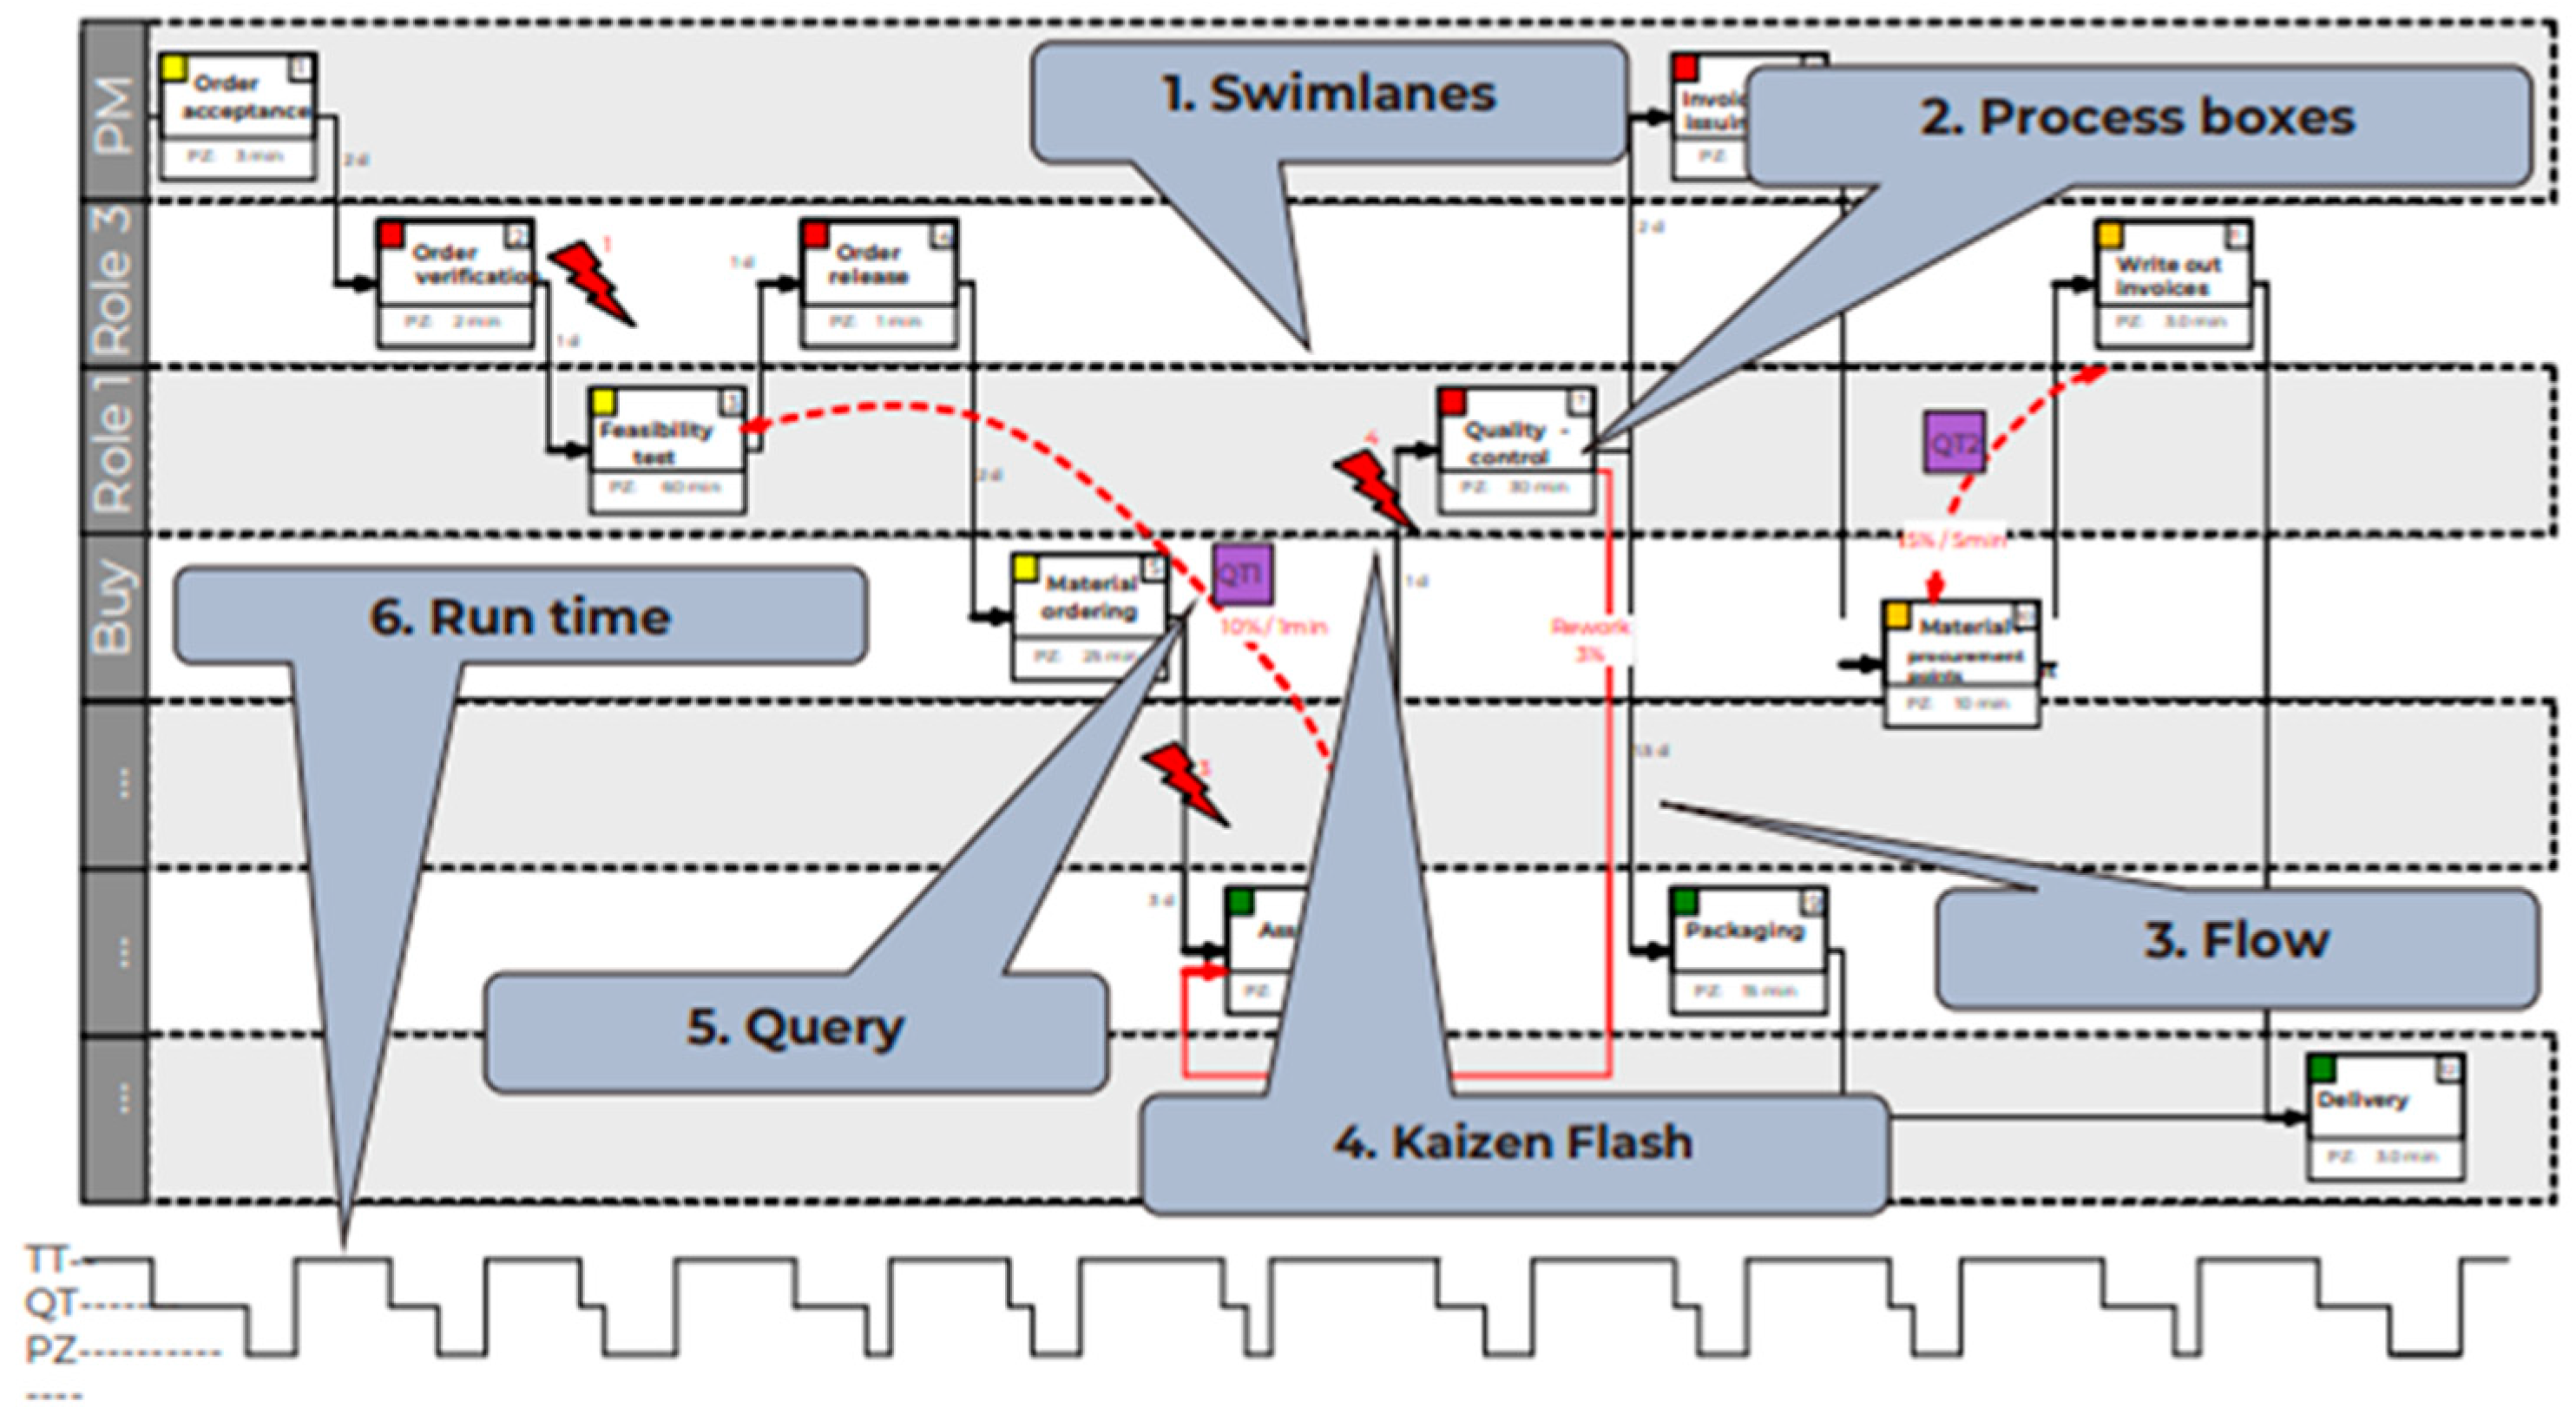
The visualization part of this methodology is represented on Figure 2. It starts with the departments, each participant in the process must be identified here. This identification will be made with a card with the name of the department or group written on it, which will be placed on the left side. The process boxes, flow, kaizen flash, query and run time are also included in the value stream map. The title of the process, the date of creation and the members of the participation team must be documented. The process steps are classified as red, yellow or green activities, that is, activities that added value or if they were support activities or if they were simply waste.

3.3. Preparation

The first step of preparation was about identifying the object to study and the undertaking needs to be “scoped” during the preparation step. The project was a High Voltage Air Heater. This system is for a Battery Electric Vehicle (BEV) with 800 V. This air heating solution warms the cabin for maximum comfort and defrosts windows for visibility.
The objective was to improve PDP, measure the impact of LPPD on PDP, since this was the first project in which the LPPD was implemented, and to reduce Start of Production (SOP) time, costs and increase the quality of the final product.
The Key Performance Indicators (KPI’s) used to measure the success of this VSM were the Lead Time (LT) and Process Efficiency (PE).
To calculate the throughput time of the process, it is necessary to calculate and add up the information transition period (TP), the relative frequency of transition period ( f T P ) , processing time (PT) and query (Q) time, as follows:
L T = T P × f T P + P T × f T P + Q × f Q × f T P
The process efficiency denotes the ratio between the actual value-adding time, during which a team member actively works towards completing a task, and the entire lead time required to complete the task, and it is given as
P E = P T C T
where the CT represents the cycle time which can be estimated as:
C T =   L T + R
in which R denotes the rework time.

3.4. Data Collection

In this step, all the necessary information to create the VSM design was collected and selected. The functions of PDP defined their processes, tasks, and responsibilities in the corresponding departments and the checks they executed to verify if the tasks were finished at the planned milestone. These milestones ensure that the program is running within the previously defined timings.
The checks for each department were acquired and a data collect document was created, represented in Figure 3. This document contains all the PDP deliverables (category and the detailed task), responsible (departments), program gates, LPPD events and LPPD estimated impact.

3.5. Value Stream Mapping Analysis

This section presents the current situation of product development process (PDP) with the visualization of the process as it was developed. In addition, all systematically identified disturbances and problems that occur in the process were listed. The mapping team, who supported the development of this value stream analysis and built the value stream map of PDP, was multidisciplinary with collaborators from different departments: Program Management, Quality, Application Engineering, Manufacturing Engineering, Supply Chain and Sales. To build the value stream map, six workshops were held in the plant with the mapping team and online meetings were scheduled with the ones that are not located in the plant.

3.5.1. Current State

Based on the PDP deliveries above, the current state VSM was initiated. The mapping team met and held six workshops in the plant to map all the processes involved in the current PDP.
Then, the results were transferred to a digital format (i.e., spreadsheet) to clarify uncertainties that remain after the analysis in the tables, and gaps that still exist can thus be close. Figure 4 represents part of Value Stream Map of the current state of the program HVAH.
The next phase consisted of performing a value stream walk-through and fill in data boxes and identify the green, yellow and red, activities, that were respectively, activities that added value or if they were support activities or if they were simply waste. With the help of a visualization of the process in departments, the VSM can show interface problems, double work, waiting time for approval, etc 11.
Then, the calculation of all the process times and all the transition times of the product development process was carried out based on the team expertise and the time frame between some events, and it was verified that the current state had a lead time of 700 days. The process efficiency was calculated according with equation (2), considering a processing time of 228745 min and a cycle time of 336000 min, a value of 68% was achieved.

3.5.2. LPPD Workshops

In this section, the workshops held for this HVAH project are described, as well the major achievements and manufacturing details.
  • LPPD Workshop Design Manufacturing for Quotation (DMFQ)
The Workshop DMFQ arises as way to gain the product and have the low quotation. The focus was the cost reduction. The workshop starts by a quick overview about the program and the product, followed by estimate the process impact, BOM and tooling investment cost and finalizes with risk identification.
The Workshop Team did the Design analysis brainstorming and with the cross-collaboration was possible to aggregate 55 ideas for design for manufacturing and assembly for example removing the cover screws and replacing them with glue, reduce the number of stamped parts and combine two in one and increase the thickness and add ribs of components to improve robustness.
  • LPPD Workshop Program Kick-Off (PKO)
The requirements focus were the cost and customer drive. The timing plan definition was considered across departments. And a deep risk identification and mitigation was performed. In this phase, 22 risks were identified and analyzed. There were some main potential risks on the design, manufacturing and supply chain level, for example the high-volume extension of the product, the Low Voltage (LV) connector specification and location were not closed and that will impact the components layout, the current cycle time for the electric test were too high and the current market conditions are driving up the costs of raw material, freights and production processes.
  • LPPD Workshop Design for Manufacturing and Assembly (DFMA)
The workshop team analyzed the product design concerning reliable and conform manufacturing and assembly. Hence, 53 design solutions for DFM/A were identified, for example reduce the number of components and identify strategies, such as Poka Yoke, by implementing guided pins to connect the components, avoid misalignment, and reduce the time it takes to assemble a product and develop processes and choose lower-cost materials that reduce manufacturing complexity.
  • LPPD Workshop Detailed Manufacturing Process & Lean Line Design (DMP & LLD)
The first part of the Workshop DMP lasted three days and involved the planning of the manufacturing process, and the best possible assembly stations, their cycle times and estimated costs were defined. Then, the CFT team had to develop and select the preferred solutions. Also, to perform the Lean Line Design Workshop they should know the available area for the layout.
In the second part of the workshop LLD, the production line was redesigned into a lean line layout, the work systems and logistics concept were designed and entered into a flow-oriented layout.

3.5.3. Identification of Problems

Although waste can be more visible in manufacturing factories around the world, rather than in Product Development (PD) processes, Lean PD is now taking its first “baby steps”, without many onsite research applications. This requires a robust product design which allows the application of stable and lean processes 4.
The focus in PD is all about distinguishing bad (standardize) and good variability (added value).
The problems identified, consequences and types of wastes are presented on Table 2.

4. Results and discussion

This section presents the value stream design based on the analysis performed of PDP, and the implementation phase in which the necessary measures to achieve the future state and optimization of the PDP are provided.

4.1. Value Stream Design

In this section, the mapping of the future improved process will be described, aiming the lean principles. According to Tapping & Schuker (2003) mapping the future state should consider three aspects 10:
  • Customer Requirements: Customer needs should be well understood;
  • Simplicity and transparency: the process should be as simple as possible for employees in order to provide the desired output to the customer (internal / external);
  • Elimination of all mental barriers: all suggestions should be respected even less hypothetical since they can be beneficial for combination with others.

4.1.1. Future State

The current state of VSM kind is essential to measure process lead time and assure customer deliveries. It was possible to identify that value stream had a lot of waiting times since the lead time was 700 days, inventory, and transport that were not in favor to one-piece-flow strategy. Value-adding activities only represented a low percentage of the throughput time. Additionally, rooms of improvement are identified and marked as a flash kaizen.
Achieving the future state was a hard task to complete, however the initial focus was to address the quality of information measured as queries. To improve the process flow, it is mandatory to improve the quality of information, so queries and the steps marked as red must be all eliminated, because they do not add value and are a waste to the process.
Figure 5 represents part of Value Stream Map future state of the program HVAH. The results that were then desired for the business unit under study, a better organization of the PDP as well as an improvement in it to be able to meet the customer's requirements.

4.1.2. Key performance indicators

Measurement in Product Development plays a key role in the success of Lean Product Development since it can provide a roadmap for identifying improvement areas and system performance 12.
Key performance indicators (KPI) are fundamental and the prerequisite for an effective ramp-up phase, as it can be used to monitor and control the ramp-up phase as well as support decision-making 13.
The Lead Time of Current State (LTCS) was calculated based on the explanation of chapter 3.1, and the total sum is 700 days, as mentioned in section 3.5.1. In turn, the Lead Time of Future State (LTFS) can be obtained as follows:
L T F S = L T C S ( Q + L T E P + R ) + L T A P
where Q is the lead time of queries, R represents the rework, LTEP denotes the lead time of all process steps that were eliminated during the future state mapping and LTEP denotes the lead time of the added processes to improve the PDP.
In order to simplify the calculations, the balance of lead time was considered as the difference between the lead time of current state and the lead time of future state from each process step that was improved, according to
L T = L T A P ( L T Q + L T E P )
in which
L T = L T F S L T C S
In this way, all the variables necessary to obtain the lead time had been calculated, therefore, it was possible to obtain the lead time of the future state through the following expression:
L T F S = L T C S + L T R
Having that in mind, the lead time of the future state was estimated as 177208 minutes, around 369 days. Thus, a reduction from 700 to 369 days was achieved.
As previously mentioned, the Process Efficiency is another tool to measure the efficiency of PDP, and it can be calculated for the future state recurring to Eq.(2). Considering a process time of 151525 min, around 316 days, a process efficiency of 85% was obtained. Therefore, this KPI had an increase from 68% to 85%.

4.2. Implementation

The implementation phase consisted of specifying work and process standards, planning to solve root causes of problems, remove waste to reduce lead-time and improve quality at cheaper cost. The standard plan must be implemented into a one to twelve months period.
In the next section, the necessary measures to achieve the future state are described.

4.2.1. Obeya room

Obeya is a Japanese term that can be translated to “big room”, it refers to a physical or virtual room where teams can collaborate and exchange knowledge to make decisions based on the current information 14.
In this context of lean techniques, Obeya is used to help visualize work and progress, follow-up the Lean Workshops, identify and solve problems, and make fast decisions. The Obeya is claimed to be beneficial in decreasing the lead-time of the development process. This room is big enough for the team, and normally the room’s walls are covered by visual documents in an A3 format, with the goals of information gathering (from the various functional groups involved in the project) and information management.

4.2.2. Quality Function Deployment (QFD)

This method is a lean technique that helps the organization plan to implement various tools and developing costumer-oriented products. QFD successfully enabled corporations to exercise quality assurance from design all the way down to production 15.
This improvement proposal arises as a way to respond to the lack of transparency of customer requirements. Application Engineer (AE) should be responsible for creating a Quality Function Deployment, coordinated by the System Engineer in order to meet customer requirements.
The team responsible for QFD should adjust the 4-Phase Model, represented on Figure 6, for meeting their own conditions and purposes. The team should identify the customer requirements and continue with deploying them into parts characteristics, manufacturing operations and production requirements.
The QFD methodology should be aligned with LPPD Workshops as represented on Figure 7. The model demonstrates how the final phase output ‘plan’ traces all the way back to the original customer input requirements 16.
The first phase model of QFD is the Product Planning. This phase is input for the first LPPD Workshop– PKO since it links customer needs to the development team’s technical responses to meet those needs. The QFD team collects customer requirements for the product called WHAT’s from customer spec book and then transform these needs into technical measures or product design specifications called HOW’s.
The second phase of QFD – Design Deployment focuses on prioritizing technical measures in the first phase into part characteristics. This phase is developed before LPPD Workshop 3-DFMA as an input to this workshop.
When the parts design phase is complete, CFT team will already know how to produce the design. The process planning phase is therefore more about defining and refining the details, including any process equipment, while maintaining the focus on tracking back to the original Voice of Customer. For this reason, QFD 3 – Manufacturing planning is an input that QFD team should bring to LPPD Workshop 4- DMP & LLD and developed based on discussions of this workshop.
Both the manufacturing planning and the production planning phases may find design optimization potential, which will benefit from an iteration back to the initial part design specification for adjustment. The QFD 4 - Production Planning is an output of the last Workshop. In this phase, the process parameters are finally transformed into production requirements or operations. This matrix can be useful creating Prototype Control Plans that are most of time forgotten by AE and Quality, and also for creating work instructions and inspection sheets.

4.2.3. Workload Graphic

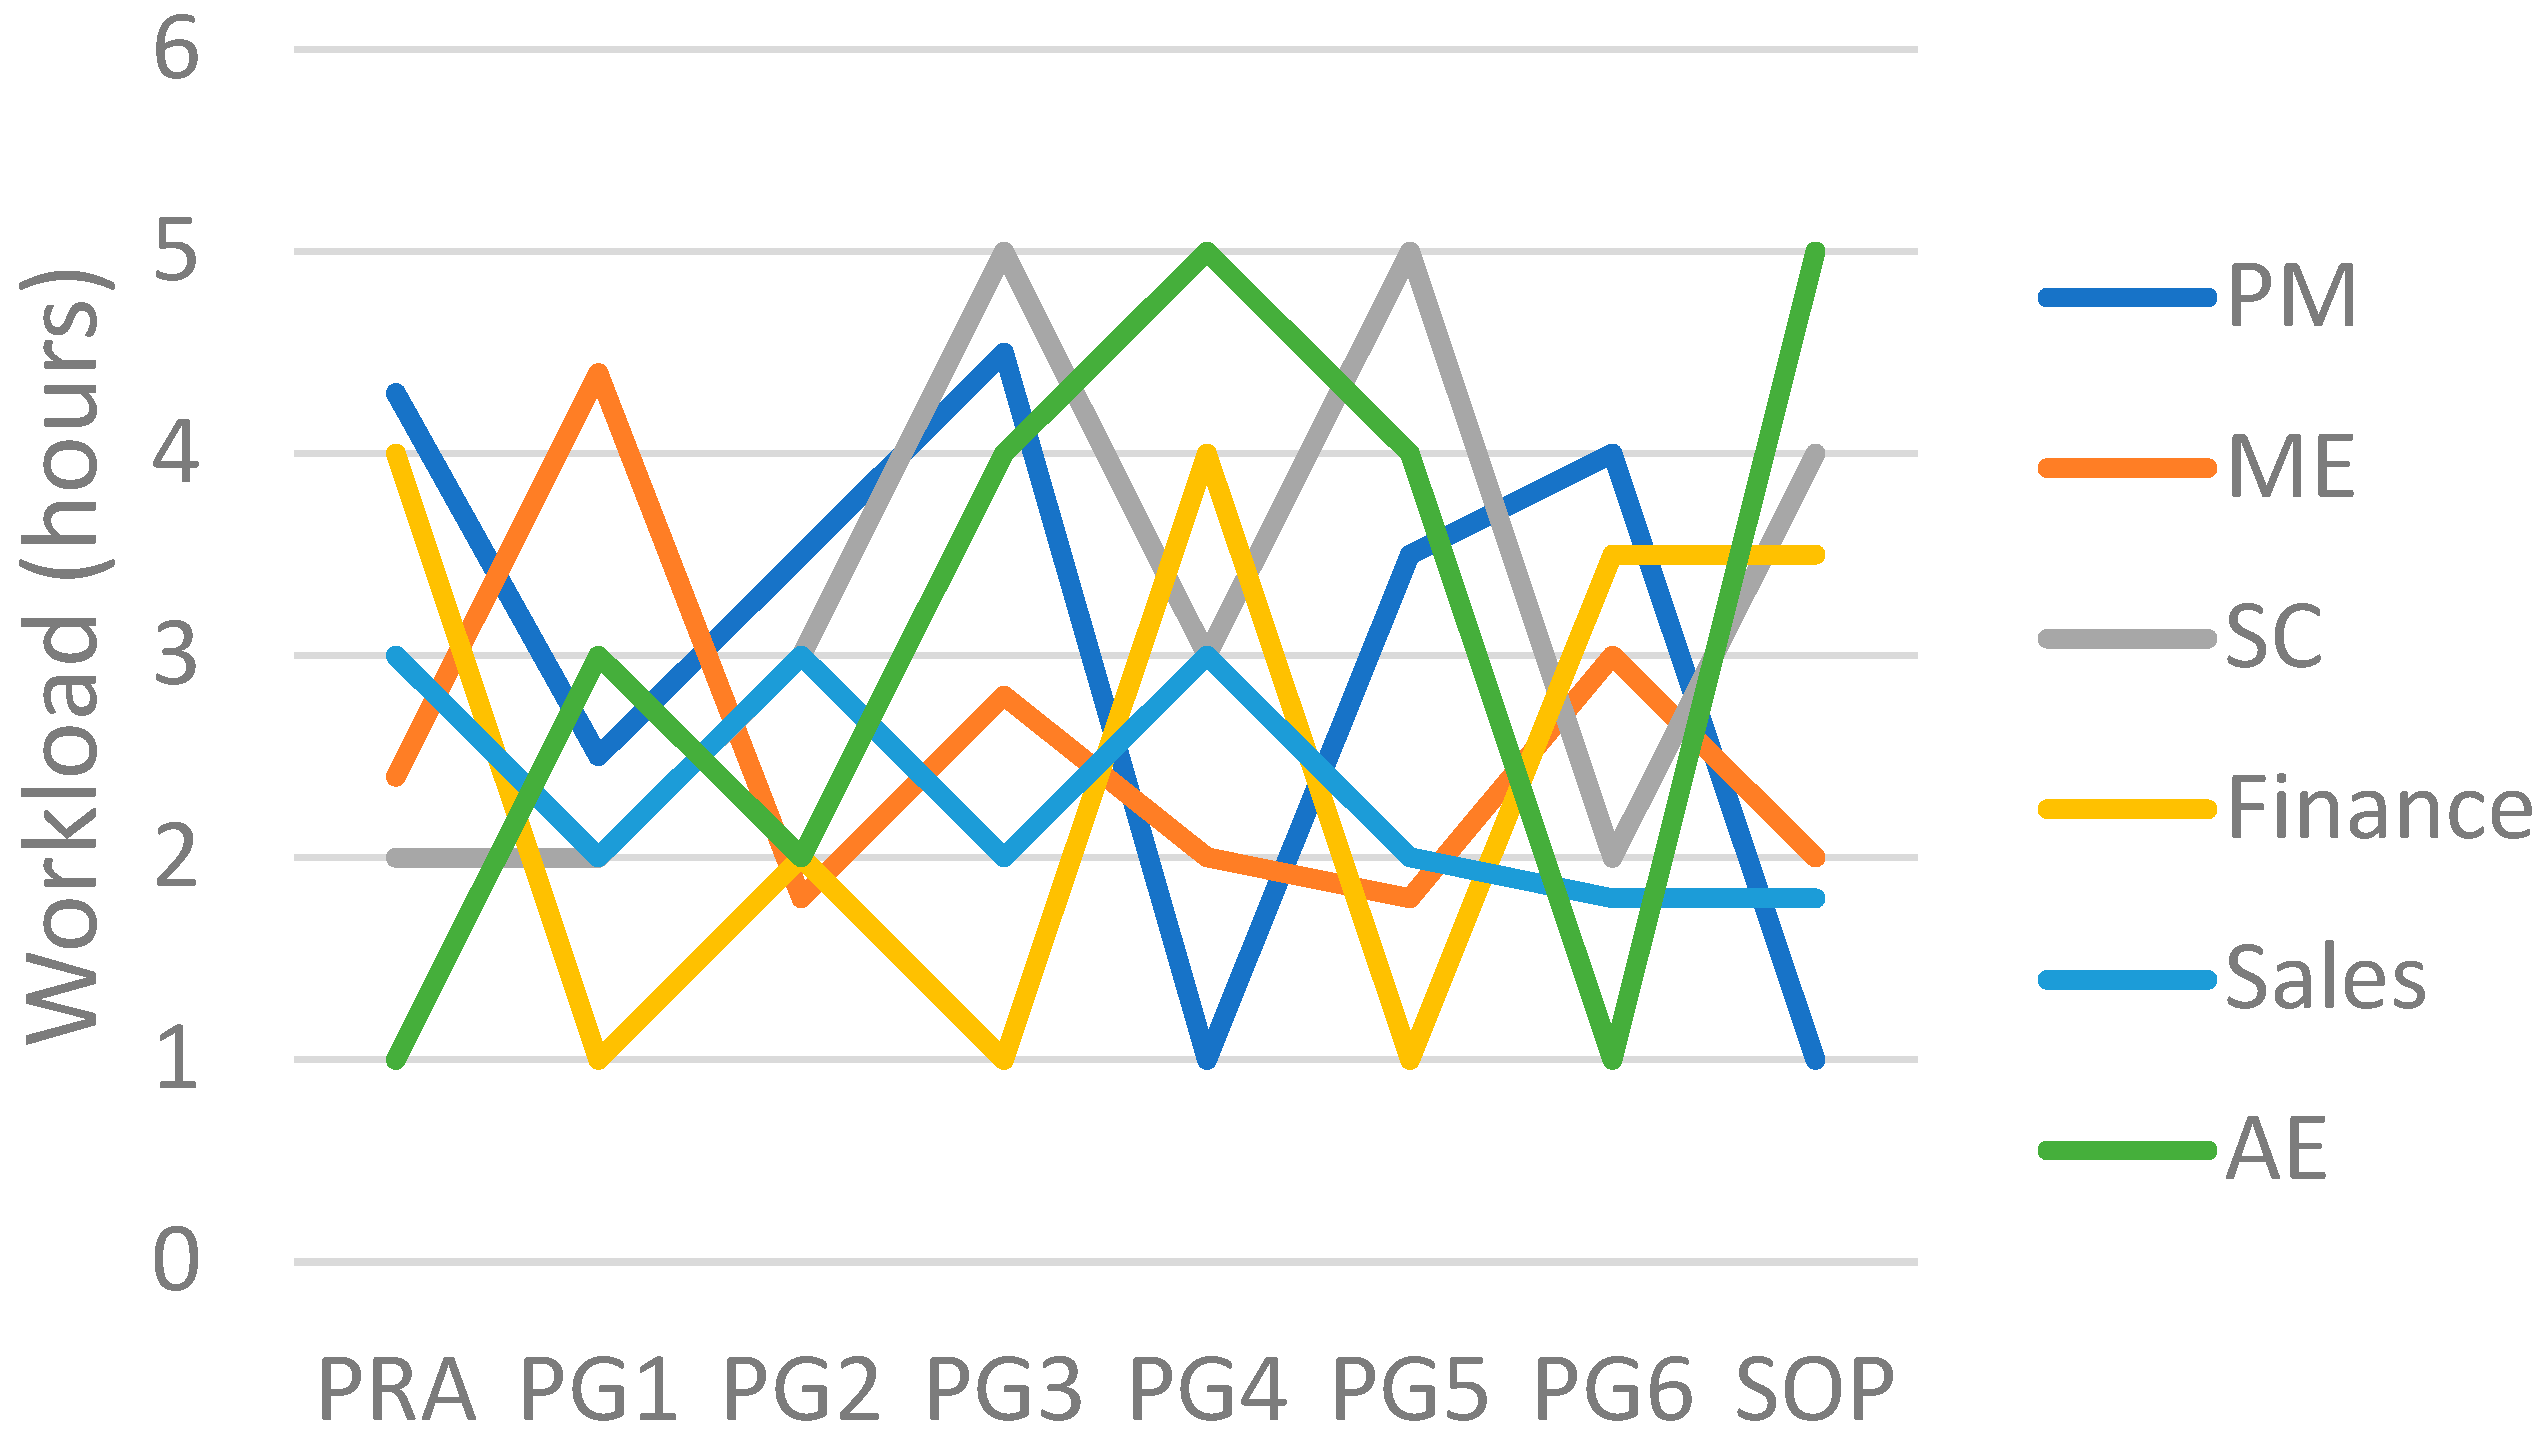
Cross-Functional Team resources are not well allocated since the Program Manager has not a clear idea of the other programs that are also allocated. This leads to overlaps and high workload. A workload graphic, such as the one depicted in Figure 8, could be a possible solution to provide a suitable workload distribution for the available resources. This graphic is done based on VSDiA, with input for timing (process time). It presents the workload from the multiple departments and could be a useful tool to select the responsible from each department to integrate the cross-functional team.

4.2.4. LPPD Workshops improvement proposals

The LPPD Workshops have a big impact on the definition of the product development strategy and contribute to meet customer requirements and improve the product quality. The strategy for LPPD Workshops should be the frontloading definition and for this they should come in an early stage of the PDP.
However, this methodology was taking its first steps and there was room for improvements. Some of the proposed improvements are described below in order to improve performance of the product and process development, namely, the QFD and the VSM.
  • LPPD Workshop – PKO
  • QFD 1 – Product Planning
This Product planning matrix defines the relationship between customer requirements and technical characteristics and can perform successful change by identifying who were the customers and exploring their requirements.
2.
LPPD Workshop – DMFQ
  • Preliminary Process Assembly
The process assembly planning aims at proposing a sequence of the operations that have to be executed to assemble the product from its generic components. Thus, a preliminary process assembly is a partial ordering of the assembly operations. In this way, it is possible to deepen the knowledge of the product and estimate more accurately the program quotation so the savings are greater.
  • Lessons Learned
Lessons learned consists of taking advantage of the knowledge gained from the process of conducting a program. This includes both positives and negatives documented information. The idea is to repeat the positives aspects, not repeat the mistakes and detect new opportunities to achieve in the next project.
3.
LPPD Workshop – DFMA
  • QFD 2 – Production Planning
This second phase of QFD transforms the technical requirements into part characteristics. At this point, some customer requirements might change, so they must be updated and prioritized on the first phase of QFD.
The team is able to specify design requirements by identifying critical parts and assembly components. These are then based on the prioritized list of offering characteristics gathered in the Product Planning phase.
4.
LPPD Workshop – DMP & LLD
  • QFD 3 - Manufacturing Planning
The team must be able to define the manufacturing processes or process steps involved in producing the part for example required operational guidelines, elements, and parameters. The operational characteristics will be defined for each part characteristic and prioritized from the House of Quality to develop the process or manufacturing planning matrix.
  • Data Base for Capital expenditures (Capex) and Tools
The quality of the cost estimates depends heavily on the cost data. Having a complete and well-structured dataset makes the cost estimation much easier. The Data Base is a useful tool that includes a vast array of information, like cost data for materials, equipment and tools.
In this Data Base, it can be found cost information of standard stations, for example press fit machine with statistical control system, rotating plates and integrated inspection camera. So, the Capex and tools costs can be easily estimated on real time during the Workshop.
  • Definition of standard shapes for layouts
The assembly line layout can be defined as the way assembly workstations are placed in the shop-floor to form a line (or batch) that works on single style. The purpose of choosing one line layout over other is to achieve best production with the existing resources.
A standard layout must be defined and established, in order to provide new team members who have worked with other teams an easier start in a new project. They already know the standard layout and know where to look for which resources. The chance of duplicate documents is reduced if the author finds all related documents in the standard location the new document will be stored at.
Standard shapes for layouts encourage consistency across industry and provide effective shapes to represent machinery, storage, and shipping and receiving facilities with measures so the engineers can follow when planning the line layout.
  • Integration of Value Stream Mapping tool
Value stream mapping (VSM) is defined as a lean tool that employs a flowchart documenting every step in the process of the production area. This is a fundamental tool to be prepared for this Workshop 4 to identify waste on the material flow, reduce process cycle times, and implement process improvement.
The current state map that the team prepare for the Workshop has gather high-value information from employees, including:
  • o Cycle time or processing time
  • o Changeover time
  • o Reliability of equipment
  • o First pass yield
  • o Quantities
  • o Number of operators and shifts
  • o Hard copy information
  • o Electronic information
  • o Inventory levels
  • o Queue or waiting times
The future state map is created by questioning what is takt time, if there are bottlenecks and constraints, where can inventory (or queue time) be reduced or supermarkets used, where can you improve flow and if other improvements are required 17.
  • Simulation Tool for Lean Line Design
Nowadays companies tend to present a volume of production that could easily drop with the instability and volatility of the market, and they need to be prepared for that. In this way, it is important to integrate a simulation tool when planning the layout line design.
A process simulation software can plan, simulate and validate human tasks, robotics processes and automation during the entire product development lifecycle from concept, engineering and commissioning to production and continuous improvement.
This involves equipment and people for faster launches and higher production quality, avoiding waste of financial resources since it eliminates bottleneck and waste in a real physical process. Such well-executed planning can improve efficiency at the lowest possible cost.
  • QFD 4 - Production Planning
The final phase of QFD is not so usual among companies. However, this matrix can offer a big help in the production and inspection processes. In this phase, the production requirements are met and continuously undergo evaluation and improvement. This matrix comes as an output from LPPD Workshop – DMP & LLD, because once the stations and layout are defined it is possible to move forward to production planning. The Production Planning matrix helps the team determine which quality controls are most important and develop quality targets.

4.3. Discussion

The Value Stream Design allowed to identify which activities added value, were support activities, or were simply wasteful. Thus, it was necessary to reduce or even eliminate the activities on the last two groups. All other activities were considered as value-added activities, having been identified in the respective field with green. There was no activity considered as wasteful.
Then, the calculation of all the process times and all the transition times of the PDP was carried out and it was verified that the lead time was 700 days. As the objective was to reduce the lead time, a set of lean techniques were applied and a lead time for future state of 369 days was obtained, which consist of a significant reduction.
The process efficiency was also a performance indicator used to measure the productivity and effectiveness of Value stream design. Efficiency increased from 68% to 85%, this means that waste has practically been eliminated and PDP is on a good path, capable of achieving a flawless launch of new products.
The overall results of the Value Stream Design are good since the lead time was reduced and the process flashes eliminated. Also, the solutions proposed on chapter 4.2 for PDP are being implemented. The workshops to do the value stream mapping approach the people and it was clear from the feedback that there were improvements in communication, information and sharing of good practices and the procedure.
The results show that although the overall perspective is good, the Cross-Functional Team responsible for each program needs to follow this methodology to close the gaps that still exists. This requires discipline and a bigger LPPD involvement in the programs.
However, regarding other tools that people do not feel so familiar with, they stated that their competencies and how to use them still need to be enhanced. They specifically referred to QFD and Value Stream Mapping for production area as tools that need to be developed in terms of mind-set and knowledge.
Hence, so far, the LPPD impact is positive and in a good track to improve the process and manufacturability on the automotive company, since it has contributed to implement beneficial changes and establish a continuous improvement mindset.

5. Conclusions

Lean Product Development is an emergent topic, and it is introduced as a concept that can improve Product Development Process, by applying Lean philosophy in the early stages of the product life cycle, from initial concept through to the start of full production or delivery to the client 18. This was the methodology implemented by this automotive company in every department, to respond to the increased international competition in the current open global market.
The mapping of future state was developed considering the customer requirements and the transparency between departments. In this way, all the process steps marked as red were eliminated because they did not add value and were a waste to the process. These changes lead to substantial improvements that resulted in the reduction of the lead time from 700 days to 369 days, and an increase of the process efficiency from 68% to 85%.
Besides the developed work, a set of recommendations for future implementation are also proposed here. It is expected that proposals for improving the LPPD Workshops and Value Stream Design will continue to be carefully followed-up in order to obtain the productivity gains.
It is also important to align it with an effective leadership that continuously guide and inspire team members to undergo with the project.
The activities that require more attention from management should be addressed with regular informal activities to promote them and to gain experience.
After the project ends, the lean management and continuous improvement mindset activities should be maintained to sustain the PDP. It is proposed to establish a lean PDP more improved and with zero defects.
To sum up, with these future work proposals, it could be possible to reduce even more the gaps, promoting a continuous improvement environment and a successful organization.

Acknowledgements

This work has been supported by Portuguese Foundation for Science and Technology, under the national support to R&D units grant, with the reference project UIDB/04436/2020 and UIDP/04436/2020. This work has been supported by FCT – Fundação para a Ciência e Tecnologia within the R&D Units Project Scope: UIDB/00319/2020.

References

  1. Papilloma, Z., Gažová, A. & Šufliarský, L. Implementation of Automation Technologies of Industry 4.0 in Automotive Manufacturing Companies. Procedia Comput Sci 200, 1488–1497 (2022). [CrossRef]
  2. Liker, J. K. & Morgan, J. Lean Product Development as a System: A Case Study of Body and Stamping Development at Ford. Engineering Management Journal 23, 16–28 (2011). [CrossRef]
  3. Morgan, J. M. & Liker, J. K. The Toyota product development system : integrating people, process, and technology. (Productivity Press, 2006).
  4. Parsons, M. J. & Josefik, N. M. Accelerating Production Readiness Using Lean Product Development. Proceedings of the 7th International Conference on Fuel Cell Science, Engineering, and Technology 2009 813–817 (2010) . [CrossRef]
  5. Wangwacharakul, P., Berglund, M., Harlin, U. & Gullander, P. Cultural aspects when implementing lean production and lean product development -experiences from a Swedish perspective. Quality Innovation Prosperity 18, 125–140 (2014). [CrossRef]
  6. O’Brien, R. An Overview of the Methodological Approach of Action Research. (2008).
  7. Susman, G. I. & Evered, R. D. An Assessment of the Scientific Merits of Action Research. Adm Sci Q 23, 582 (1978). [CrossRef]
  8. Deshpande, A. M., Siddhalingeshwar, I. G. & Ekabote, N. Implementation of Advanced Product Quality Planning in Engineering Project. Journal of Engineering Education Transformations 0, (2016). [CrossRef]
  9. Rother, M., Shook, J., Womack, J. & Jones, D. Learning to See: Value Stream Mapping to Add Value and Eliminate MUDA. (Lean Enterprise Institute, 1999).
  10. Tapping, D. & Shuker, T. Value Stream Management for the Lean Office. (Productivity Press, 2003).
  11. Etzel, M. & Kutz, R. Process optimization Value Stream Design in indirect Areas (VSDiA) Basic information for managers. (2010).
  12. Cooper, R. & John, S. Ideation for Product Innovation: What are the Best Methods? www.stage-gate.com (2008).
  13. Yang, N., Kornas, T. & Daub, R. A KPI System for small sample sizes based on the Bayesian estimation of Cpk in the production of Lithium-ion batteries. Procedia CIRP 99, 526–530 (2021). [CrossRef]
  14. Rossi, M., Morgan, J. & Shook, J. Lean Product and Process Development. (2016) . [CrossRef]
  15. Chan, C. Y. P. et al. The US Automotive Industry and Major Developments of QFD. (2019).
  16. Chan, L.-K. & Wu, M.-L. Quality Function Deployment: A Comprehensive Review of Its Concepts and Methods. Qual Eng 15, 23–35 (2002). [CrossRef]
  17. Batwara, A., Sharma, V., Makkar, M. & Giallanza, A. Towards smart sustainable development through value stream mapping – a systematic literature review. Heliyon 9, e15852 (2023). [CrossRef]
  18. Stechert, C. & Balzerkiewitz, H. P. Digitalization of a Lean Product Development Organization. in Procedia CIRP vol. 91 764–769 (Elsevier B.V., 2020). [CrossRef]
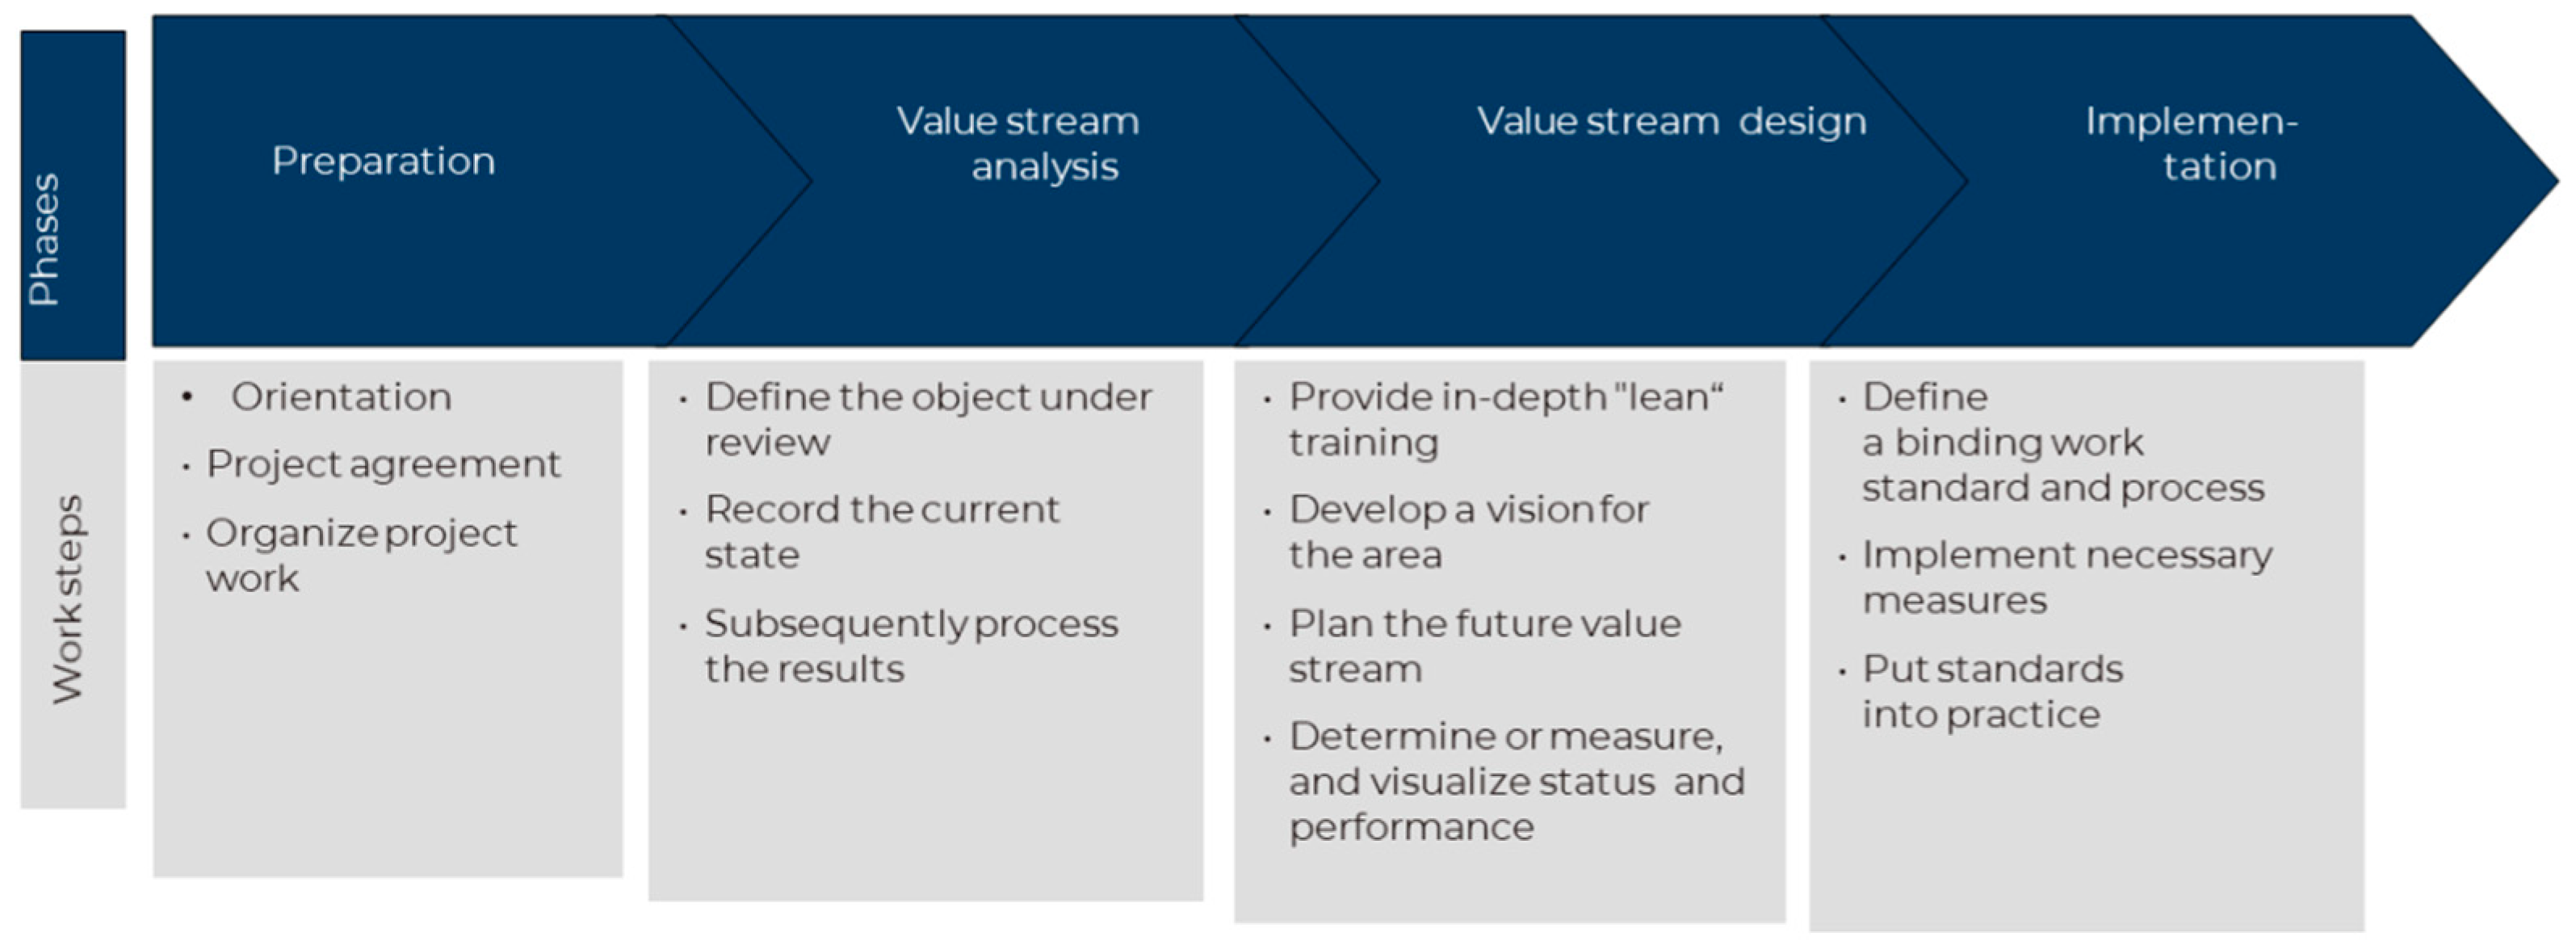
Figure 1. Execution of process improvement in defined phases from preparation up to implementation 11.
Preprints 89590 g001
Figure 2. Schematic representation of the visualization of all elements of the VSDiA 11.
Preprints 89590 g002
Figure 3. PDP Deliverables (blurred due to confidentiality purposes).
Preprints 89590 g003
Figure 4. Value Stream Map Current State.
Preprints 89590 g004
Figure 5. Value Stream Map Future State.
Preprints 89590 g005
Figure 6. 4-Phase Model.
Preprints 89590 g006
Figure 7. From Development to Process: The Integration of Methodologies LPPD and QFD.
Preprints 89590 g007
Figure 8. PDP departments workload example.
Preprints 89590 g008
Table 1. Types of Waste of Lean Production and Lean Product Development 5.
Types of Waste Lean Production Lean PD
Overproduction Wasteful input of raw materials in an early stage Information and analysis not required
Transportation Various types of transports (trucks, conveyers) Flow of communication not effective
Waiting Operator not working Delay for approval a prototype
Inventory Excess of stock not needed Redundant information
Motion Persons not working as they should (not-adding-value) Wrong flow of information to people
Over Processing Improper technology that leads to design gaps and deburring Information not well stored and unnecessary analysis
Defects Damage of machines and rework Testes failed and inaccurate data
Table 2. Summary of identified problems, consequences and types of waste.
Problems Consequences Type of Wastes
Spec-book is not well organized Delay for organize the spec book and write down the specifications Waiting
Customer requirements change Late design changes Rework; Waiting.
Departments do not communicate between each other Flow of communication not effective Transportation
LPPD 2 - DMFQ was developed on a late stage Information and analysis not required: 8 loops of Quotations Overproduction
CFT Resources are not well nominated High workload of resources, overlaps with other programs Waiting
Production Concept is not considering Logistics High storage costs, low rate of turnover, low flexibility and low Transportation; Inventory.
Tear-Down Analysis is not reviewed by Quality Testes failed and inaccurate data Defects
Disclaimer/Publisher’s Note: The statements, opinions and data contained in all publications are solely those of the individual author(s) and contributor(s) and not of MDPI and/or the editor(s). MDPI and/or the editor(s) disclaim responsibility for any injury to people or property resulting from any ideas, methods, instructions or products referred to in the content.
Copyright: This open access article is published under a Creative Commons CC BY 4.0 license, which permit the free download, distribution, and reuse, provided that the author and preprint are cited in any reuse.
Prerpints.org logo

Preprints.org is a free preprint server supported by MDPI in Basel, Switzerland.

Subscribe

© 2024 MDPI (Basel, Switzerland) unless otherwise stated