Submitted:
03 November 2023
Posted:
06 November 2023
You are already at the latest version
Abstract
Keywords:
1. Introduction
2. Context
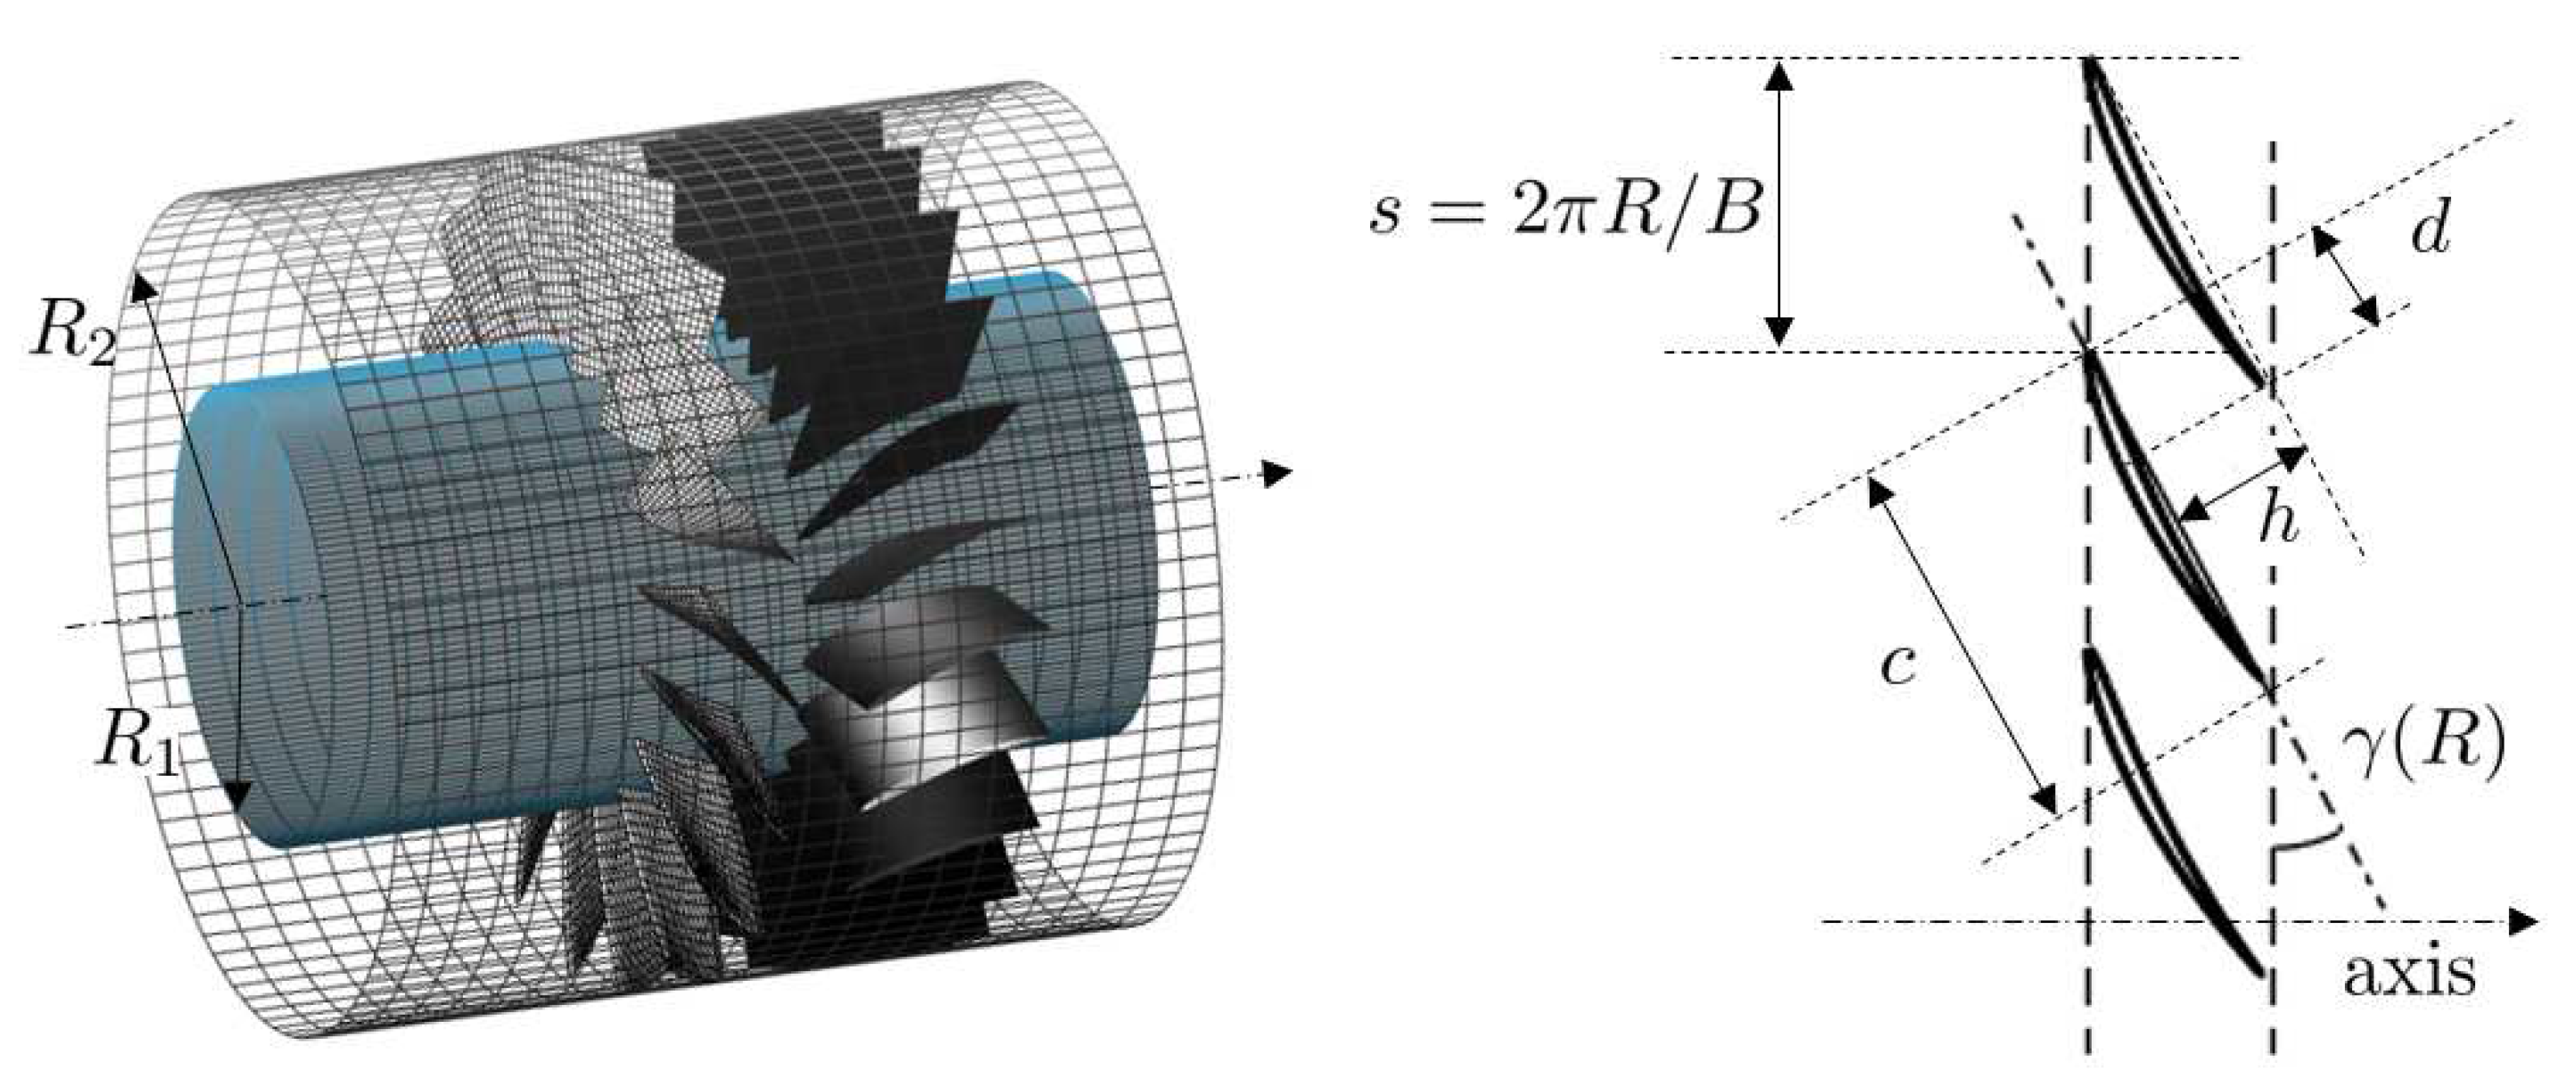
3. Analytical models
3.1. Tonal noise
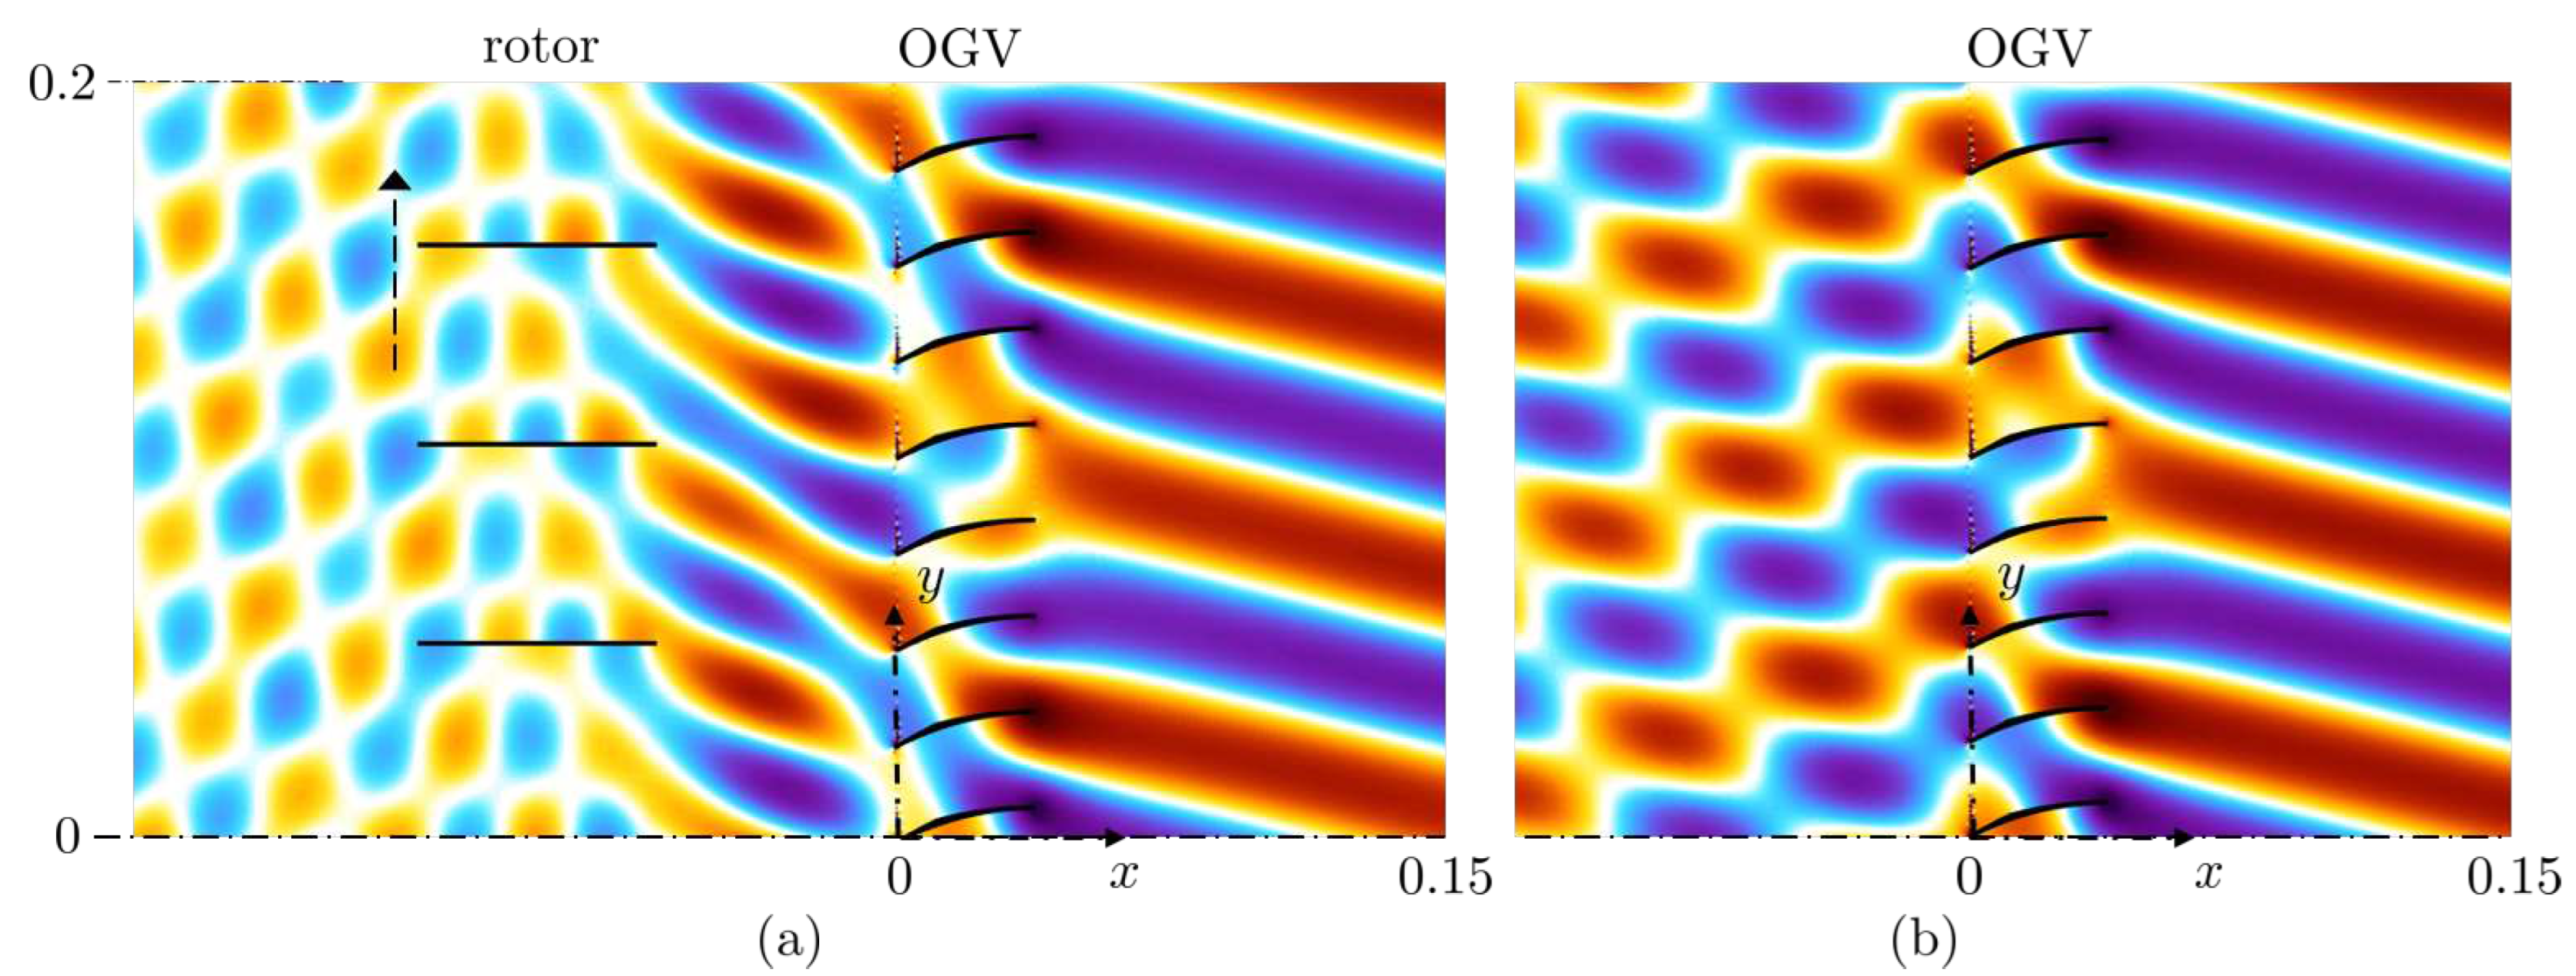
3.2. Broadband noise
4. High-fidelity simulations
4.1. Tonal noise
4.2. Broadband noise
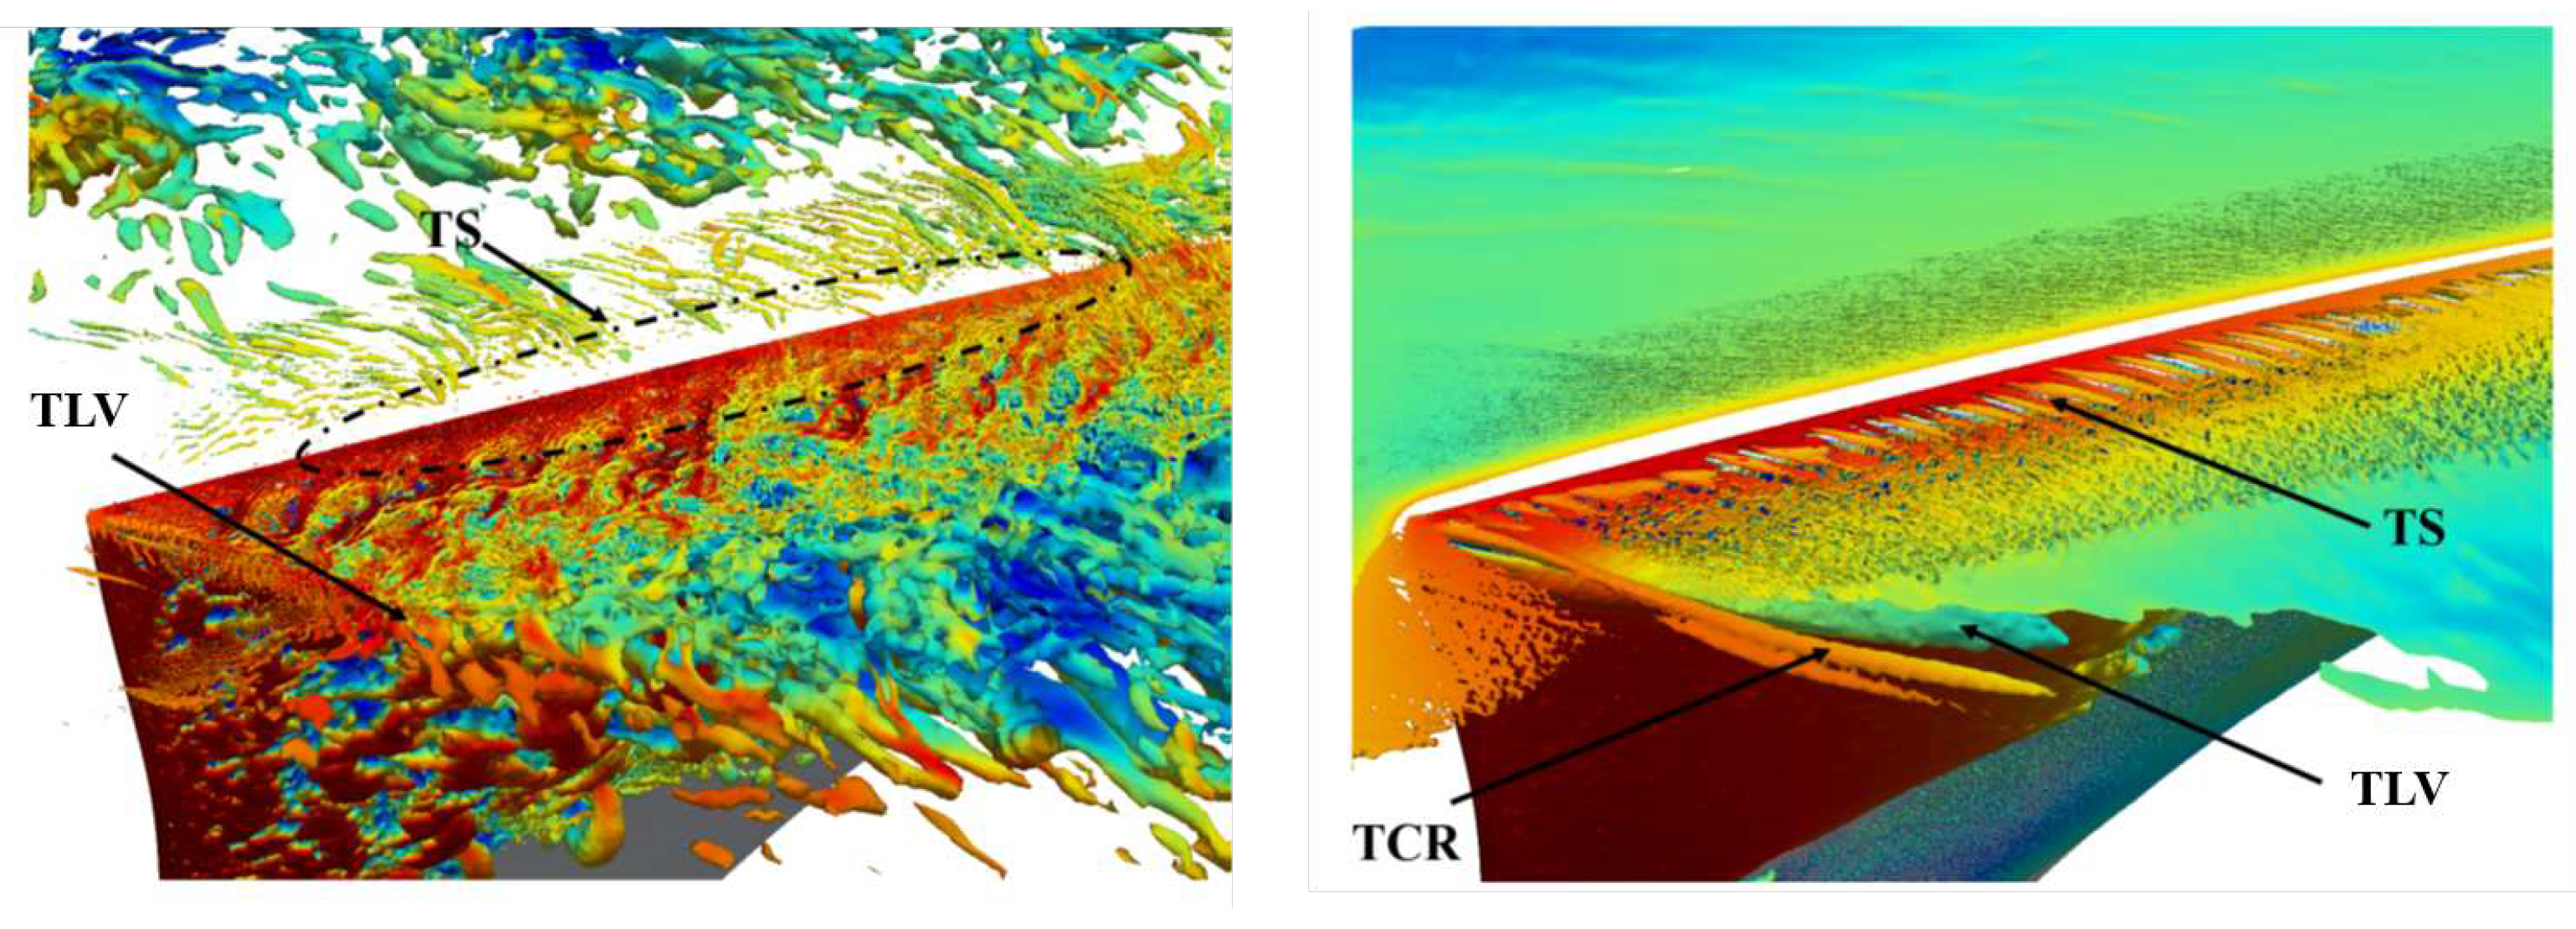
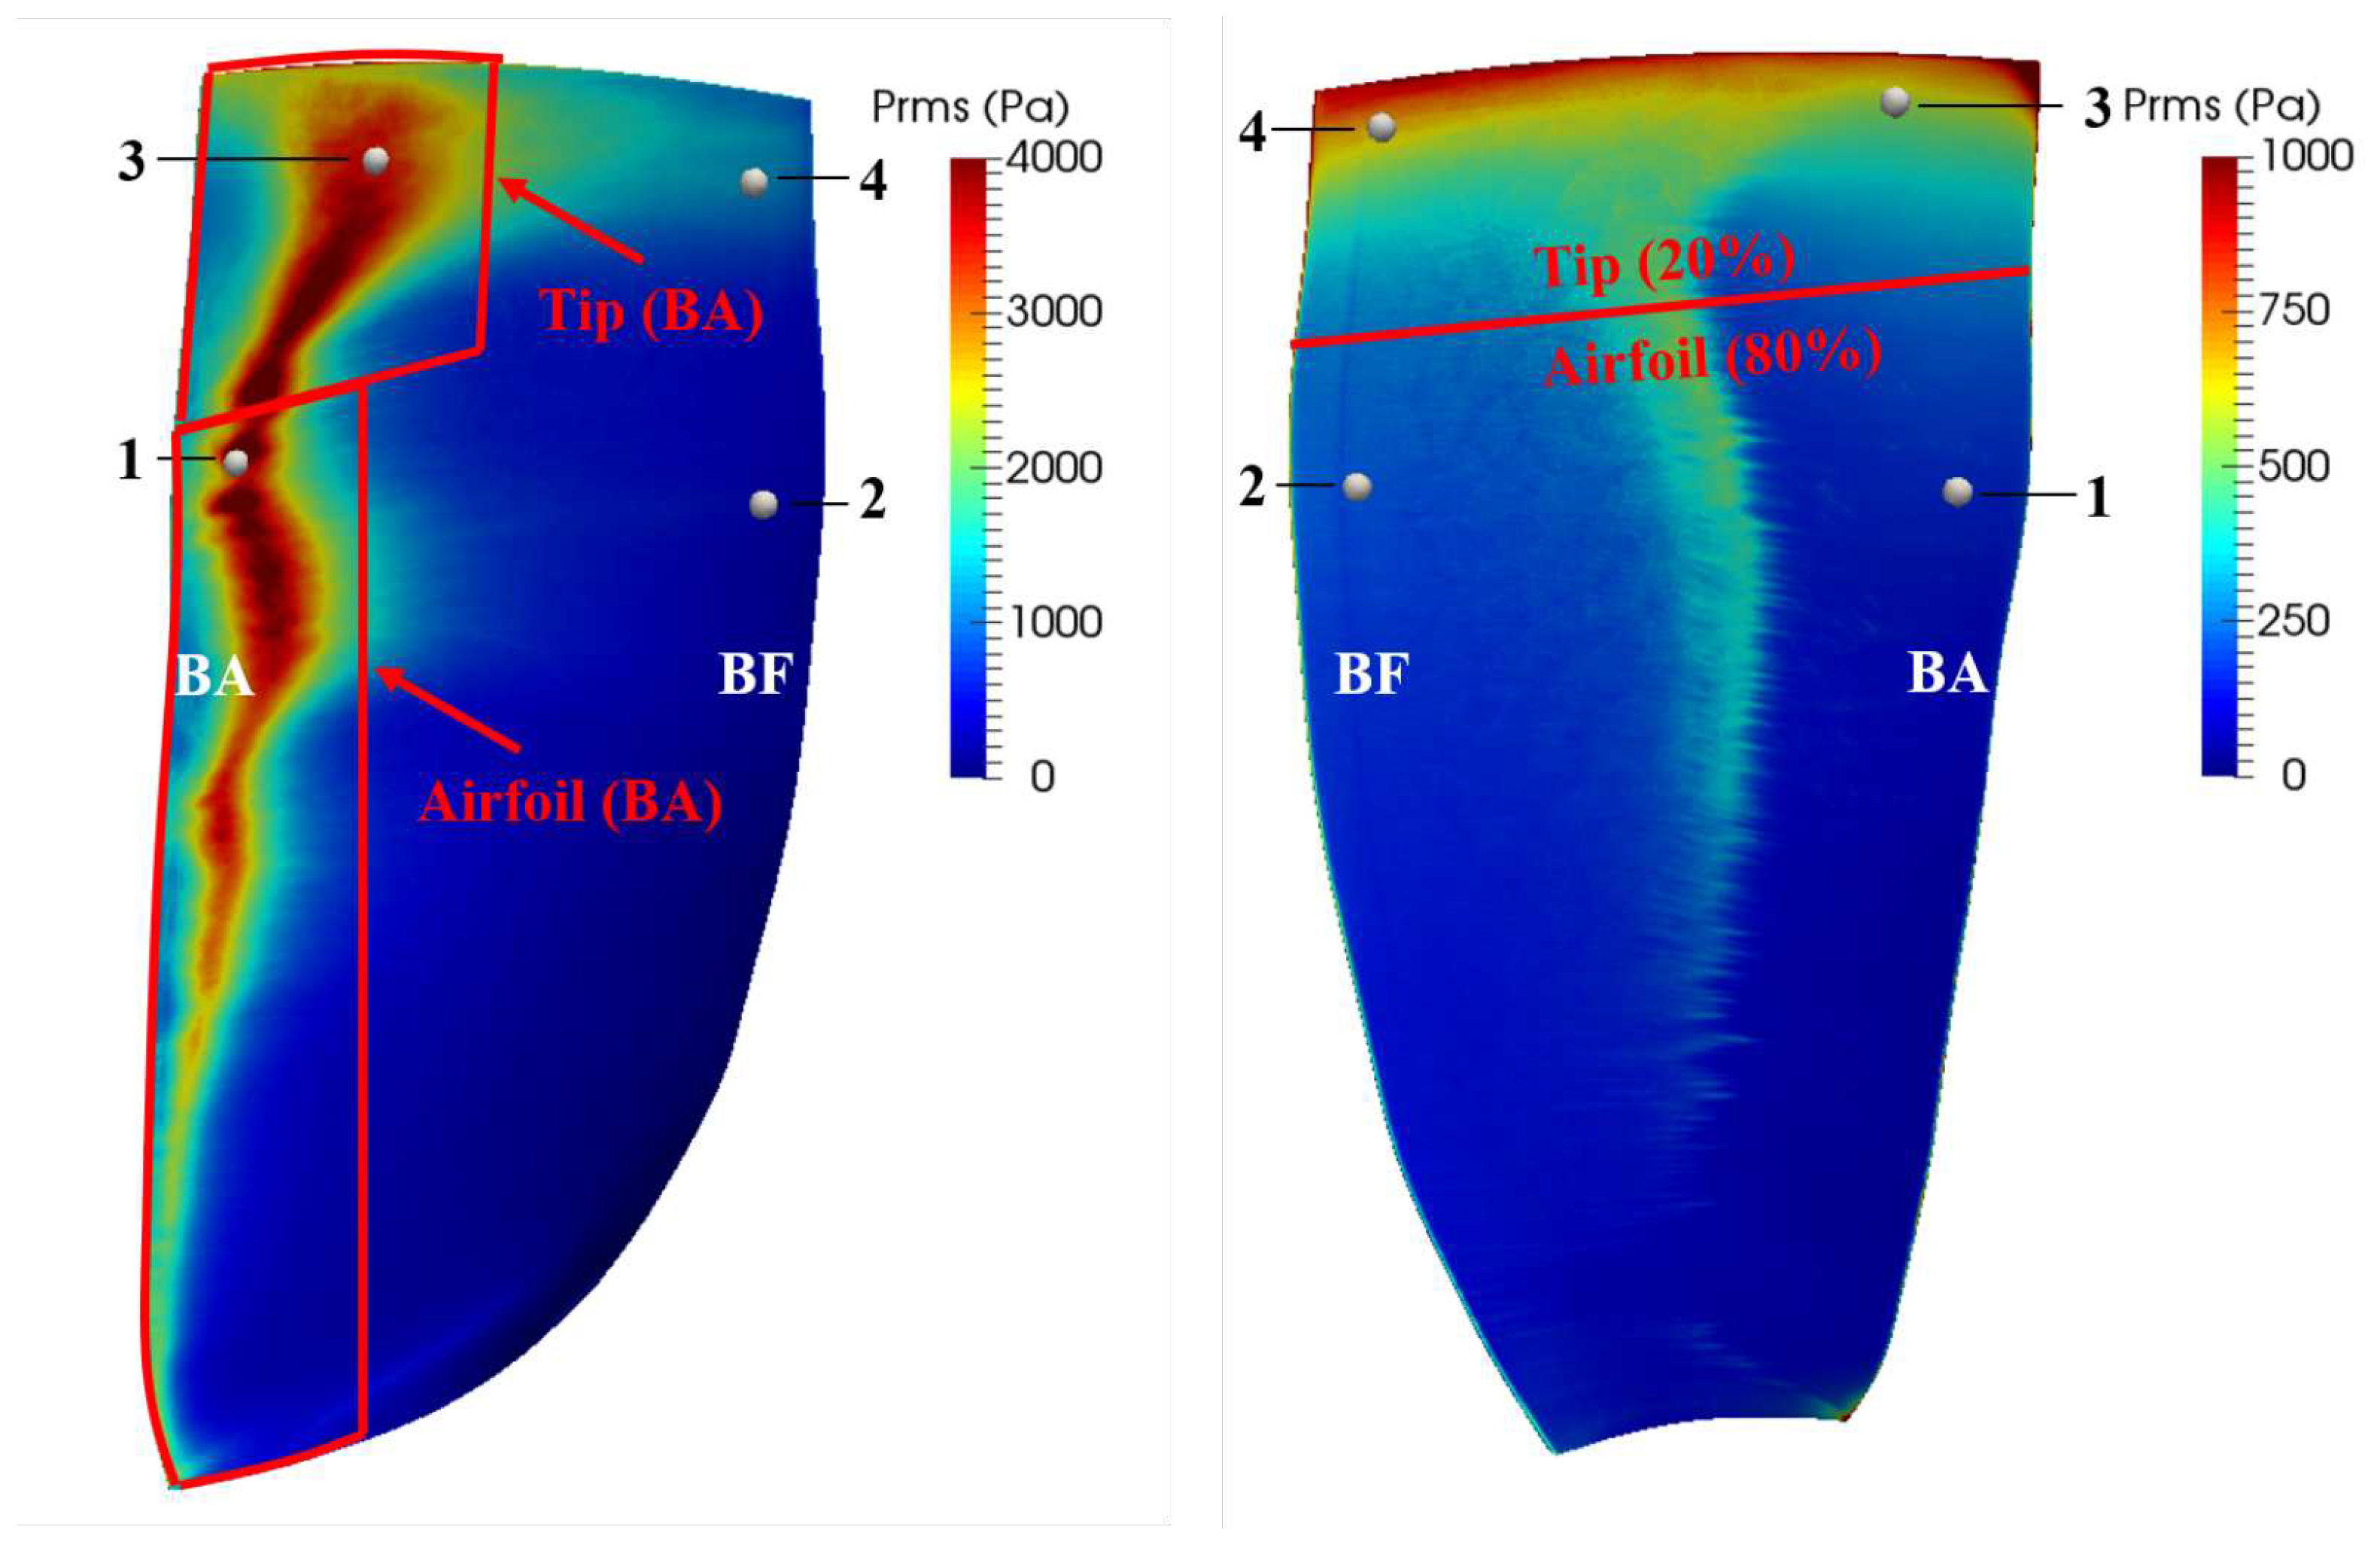
5. Future in turbomachinery noise predictions
5.1. Tonal noise
5.2. Broadband noise
6. Conclusions
Author Contributions
Funding
Acknowledgments
Conflicts of Interest
References
- Moreau, S.; Roger, M. Advanced noise modeling for future propulsion systems. Int. J. of Aeroacoustics 2018, 17, 576–599. [Google Scholar] [CrossRef]
- Moreau, S. Turbomachinery Noise Predictions: Present and Future. Acoustics 2019, 92–116. [Google Scholar] [CrossRef]
- Moreau, S. A Review of Turbomachinery Noise: From Analytical Models to High-Fidelity Simulations. Fundamentals of High-Lift for Future Civil Aircraft, Chap.10; R. Radespliel & R. Semaan, S., Ed., 2021.
- Moreau, S. The third golden age of aeroacoustics. Phys. Fluids 2022, 34, 031301. [Google Scholar] [CrossRef]
- Grasso, G.; Moreau, S.; Christophe, J.; Schram, C. Multi-disciplinary optimization of a contra-rotating fan. Int. J. of Aeroacoustics 2018, 17, 655–686. [Google Scholar] [CrossRef]
- Lallier-Daniels, D.; Bolduc-Teasdale, F.; Rancourt, D.; Moreau, S. Fast Multi-Objective Aeroacoustic Optimization of Propeller Blades. Vertical Flight Society’s 77th Annual Forum & Technology Display, 2021.
- Envia, E.; Nallasamy, M. Design selection and analysis of a swept and leaned stator concept. J. Sound & Vib. 1999, 228, 793–836. [Google Scholar]
- de Laborderie, J.; Moreau, S. Prediction of tonal ducted fan noise. J. Sound & Vib. 2016, 372, 105–132. [Google Scholar]
- Krömer, F.; Moreau, S.; Becker, S. Experimental investigation of the interplay between the sound field and the flow field in skewed low-pressure axial fans. J. Sound & Vib. 2019, 442, 220–236. [Google Scholar]
- Masson, V.; Posson, H.; Sanjosé, M.; Moreau, S.; Roger, M. Fan-OGV interaction broadband noise prediction in a rigid annular duct with swirling and sheared mean flow. 22nd AIAA/CEAS Aeroacoustics Conference. American Institute of Aeronautics and Astronautics, 2016, AIAA Paper 2016-2944.
- Hughes, C. Aerodynamic performance of scale-model turbofan outlet guide vanes designed for low noise. 40th AIAA Aerospace Sciences Meeting & Exhibit; AIAA Papers: Reno, NV, USA, 2002. [Google Scholar]
- Hughes, C.; Jeracki, R.; Woodward, R.; Miller, C. Fan Noise Source Diagnostic Test - Rotor Alone Aerodynamic Performance Results. 8th AIAA/CEAS Aeroacoustics Conference & Exhibit; AIAA papers: Breckenridge, CO, USA, 2002; AIAA-2002-2426. [Google Scholar]
- Podboy, G.; Krupar, M.; Helland, S.; Hughes, C. Steady and unsteady flow field measurements within a NASA 22 inch fan model. 40th AIAA Aerospace Sciences Meeting & Exhibit, 2002, p. 1033.
- Woodward, R.P.; Hughes, C.E.; Jeracki, R.J.; Miller, C.J. Fan Noise Source Diagnostic Test - Far-Field Acoustic Results. Technical Memorandum TM-2002-211591, 2002.
- Tapken, U.; Behn, M.; Spitalny, M.; Pardowitz, B. Radial mode breakdown of the ACAT1 fan broadband872 noise generation in the bypass duct using a sparse sensor array. 25th AIAA/CEAS Aeroacoustics Conference, Delft, Netherlands, 2019, paper 2019-2400.
- Behn, M.; Tapken, U. Investigation of sound generation and transmission effects through the ACAT1 fan stage using compressed sensing-based mode analysis. 25th AIAA/CEAS Aeroacoustics Conference, Delft, Netherlands, 2019, paper 2019-2502.
- Brandstetter, C.; Pagès, V.; Duquesne, P.; Ottavy, X.; Ferrand, P.; Aubert, S.; Blanc, L. UHBR open-test-case fan ECL5/catana Part 1: Geometry and aerodynamic performance. 14th European Turbomachinery Conference, Gdansk, Poland, 2021.
- Ffowcs Williams, J.; Hawkings, D. Sound generation by turbulence and surfaces in arbitrary motion. Phil. Trans. Roy. Soc. 1969, A 264. [Google Scholar]
- Goldstein, M. Aeroacoustics; McGraw-Hill, NY, 1976.
- Guérin, S.; Kissner, C.; Seeler, P.; Blázquez, R.; Carrasco Laraña, P.; de Laborderie, H.; Lewis, D.; Chaitanya, P.; Polacsek, C.; Thisse, J. ACAT1 Benchmark of RANS-informed Analytical Methods for Fan Broadband Noise Prediction: Part II -Influence of the Acoustic Models. Acoustics 2020, 3, 617–649. [Google Scholar] [CrossRef]
- Lewis, D.; de Laborderie, J.; Sanjosé, M.; Moreau, S.; Jacob, M.C.; Masson, V. Parametric study on state-of-the-art analytical models for fan broadband interaction noise predictions. J. Sound & Vib. 2021, 514, 116423. [Google Scholar]
- Bouley, S.; François, B.; Roger, M.; Posson, H.; Moreau, S. On a two-dimensional mode-matching technique for sound generation and transmission in axial-flow outlet guide vanes. J. Sound & Vib. 2017, 403, 190–213. [Google Scholar]
- Roger, M.; François, B.; Moreau, S. Cascade trailing-edge noise modeling using a mode-matching technique and the edge-dipole theory. J. Sound & Vib. 2016, 382, 310–327. [Google Scholar]
- Roger, M.; François, B. Combined analytical models for sound generation and transmission in cambered axial-flow outlet guide vanes. European J. of Mechanics, B/Fluids 2017, 61, 218–225. [Google Scholar] [CrossRef]
- Girier, L.; Roger, M.; Lafitte, A. A Two-Dimensional Mode-Matching Technique for Wake-Interaction Tonal Noise Including Rotor-Stator Coupling. AIAA Aviation Forum; 2023; Paper 2023-4189.
- Ventres, C.S.; Theobald, M.A.; Mark, W.D. Turbofan Noise Generation, Volume 1 : Analysis. Contractor Report CR-167952, 1982.
- Hanson, D.B. Theory for broadband noise of rotor and stator cascades with inhomogeneous inflow turbulence including effects of lean and sweep. Contractor Report NASA-CR-210762, 2001.
- Posson, H.; Moreau, S.; Roger, M. On the use of a uniformly valid analytical cascade response function for fan broadband noise predictions. J. Sound & Vib. 2010, 329, 3721–3743. [Google Scholar]
- Posson, H.; Moreau, S.; Roger, M. Broadband noise prediction of fan outlet guide vanes using a cascade response function. J. Sound & Vib. 2011, 330, 6153–6183. [Google Scholar]
- Posson, H.; Roger, M.; Moreau, S. On a uniformly valid analytical rectilinear cascade response function. J. Fluid Mech. 2010, 663, 22–52. [Google Scholar] [CrossRef]
- Nallasamy, M.; Envia, E. Computation of rotor wake turbulence noise. J. Sound & Vib. 2005, 282, 649–678. [Google Scholar]
- de Laborderie, J. Approches analytiques et numériques pour la prédiction du bruit tonal et large bande de soufflantes de turboréacteurs. PhD thesis, Université de Sherbrooke, Sherbrooke, QC, CANADA, 2013.
- Verdon, J.M.; Hall, K.C. Development of a linearized unsteady aerodynamic analysis for cascade gust response predictions. Contractor Report CR-4308, 1990.
- Maunus, J.; Grace, S.M.; Sondak, D.L. Effect of Rotor Wake Structure on Fan Interaction Noise. 16th AIAA/CEAS Aeroacoustics Conference; 2010; AIAA2010–3746 paper.
- Grace, S.M.; Maunus, J.; Sondak, D.L. Effect of CFD Wake Prediction in a Hybrid Simulation of Fan Broadband Interaction Noise. 17th AIAA/CEAS Aeroacoustics Conference; 2011; AIAA2011–2875 paper.
- Grace, S.M. Fan broadband interaction noise modeling using a low-order method. J. Sound & Vib. 2015, 346, 402–423. [Google Scholar]
- Moreau, S.; Roger, M. Competing Broadband Noise Mechanisms in Low-Speed Axial Fans. AIAA Journal 2007, 45, 48–57. [Google Scholar] [CrossRef]
- Moreau, S.; Roger, M. Back-scattering correction and further extensions of Amiet’s trailing-edge noise model. Part II: Application. J. Sound & Vib. 2009, 323, 397–425. [Google Scholar]
- Roger, M. On broadband jet–ring interaction noise and aerofoil turbulence-interaction noise predictions. J. Fluid Mech. 2010, 653, 337–364. [Google Scholar] [CrossRef]
- Posson, H.; Roger, M. Experimental Validation of a Cascade Response Function for Fan Broadband Noise Predictions. AIAA journal 2011, 49(9), 1907–1918. [Google Scholar] [CrossRef]
- Cheong, C.; Joseph, P.; Lee, S. High frequency formulation for the acoustic power spectrum due to cascade-turbulence interaction. J. Acous. Soc. Amer. 2006, 119, 108–122. [Google Scholar] [CrossRef]
- Grace, S.M. Influence of model parameters and the vane response method on a low-order prediction of fan broadband noise. Int. J. Aeroacoust. 2016, 15, 131–143. [Google Scholar] [CrossRef]
- Kissner, C.; Guérin, S.; Seeler, P.; Billson, M.; Paruchuri, C.; Carrasco Laraña, P.; de Laborderie, H.; François, B.; Lefarth, K.; Lewis, D.; Montero Villar, G.; Nodé-Langlois, T. ACAT1 Benchmark of RANS-informed Analytical Methods for Fan Broadband Noise Prediction: Part I -Influence of the RANS Simulation. Acoustics 2020, 3, 539–578. [Google Scholar] [CrossRef]
- Amiet, R.K. Acoustic Radiation From an Airfoil in a Turbulent Stream. J. Sound & Vib. 1975, 41, 407–420. [Google Scholar]
- Schwarzschild, K. Die Beugung und Polarisation des Lichts durch einen Spalt. I. Mathematische Annalen 1902, 55, 177–247. [Google Scholar] [CrossRef]
- Sears, W.R. Some aspects of non-stationary airfoil theory and its practical application. Journal of the Aeronautical Sciences 1941, 8, 104–108. [Google Scholar] [CrossRef]
- Roger, M.; Moreau, S. Back-scattering correction and further extensions of Amiet’s trailing edge noise model. Part 1: theory. J. Sound Vib. 2005, 286, 477–506. [Google Scholar] [CrossRef]
- Roger, M.; Moreau, S. Addendum to the back-scattering correction of Amiet’s trailing-edge noise model. J. Sound & Vib. 2012, 331, 5383–5385. [Google Scholar] [CrossRef]
- Lee, S.; Ayton, L.; Bertagnolio, F.; Moreau, S.; Chong, T.P.; Joseph, P. Turbulent boundary layer trailing-edge noise: Theory, computation, experiment,and application. Progress in Aerospace Sciences 2021, 126, 100737:1–56. [Google Scholar] [CrossRef]
- Priddin, M.J.; Kisil, A.V.; Ayton, L.J. Applying an iterative method numerically to solve n×n matrix Wiener–Hopf equations with exponential factors. Proc. Roy. Soc. London. Series A. Mathematical and Physical Sciences 2020, 378, 20190241:1–18. [Google Scholar] [CrossRef]
- Quartapelle, L.; Selmin, V. High-order Taylor-Galerkin methods for nonlinear multidimensional problems. Finite Elements in Fluids; Pineridge Press: Swansea, UK, 1993; pp. 1374–84. [Google Scholar]
- Liu, L.; Li, X.; Hu, F.Q. Nonuniform time-step Runge–Kutta discontinuous Galerkin method for Computational Aeroacoustics. J. Comp. Phys. 2010, 229, 6874–6897. [Google Scholar] [CrossRef]
- Léger, R.; Peyret, C.; Piperno, S. Coupled Discontinuous Galerkin/Finite Difference Solver on Hybrid Meshes for Computational Aeroacoustics. AIAA J. 2012, 50, 338–349. [Google Scholar] [CrossRef]
- Brès, G.A.; Ham, F.E.; Nichols, J.W.; Lele, S.K. Unstructured Large-Eddy Simulations of Supersonic Jets. AIAA J. 2017, 55, 1164–1184. [Google Scholar] [CrossRef]
- Chen, H. Volumetric formulation of the lattice Boltzmann method for fluid dynamics: Basic concept. Phys. Rev. E 1998, 58, 3955–3963. [Google Scholar] [CrossRef]
- Chen, H.; Orszag, S.A.; Staroselsky, I.; Succi, S. Expanded analogy between Boltzmann kinetic theory of fluids and turbulence. J. Fluid Mech. 2004, 519, 301–314. [Google Scholar] [CrossRef]
- Brès, G.; Pérot, F.; Freed, D. Properties of the Lattice-Boltzmann Method for Acoustics. 15th AIAA/CEAS Aeroacoustics Conference; 2009; AIAA 2009-3395 paper.
- Moreau, S. Direct Noise Computation of Low-speed Ring Fans. Acta Acustica united with Acustica 2019, 105, 1–13. [Google Scholar] [CrossRef]
- Astoul, T. Towards improved lattice Boltzmann aeroacoustic simulations with non-uniform grids: applicationto landing gears noise prediction. PhD thesis, Université Aix-Marseille Université Marseille, France, 2021.
- Gomar, A.; Bouvy, Q.; Sicot, F.; Dufour, G.; Cinnella, P.; François, B. Non-uniform time sampling for multiple-frequency harmonic balance computations. J. Comp. Phys. 2014, 278, 229–256. [Google Scholar] [CrossRef]
- Guédeney, T.; Gomar, A.; Gallard, F.; Sicot, F.; Dufour, G.; Puigt, G. Non-uniform time sampling for multiple-frequency harmonic balance computations. J. Comp. Phys. 2013, 236, 317–345. [Google Scholar] [CrossRef]
- Daroukh, M.; Moreau, S.; Gourdain, N.; Boussuge, J.F.; Sensiau, C. Effect of Distortion on Turbofan Tonal Noise at Cutback with Hybrid Methods. Int. J. Turbomach. Propuls. Power 2017, 2, 1–22. [Google Scholar] [CrossRef]
- Daroukh, M.; Moreau, S.; Gourdain, N.; Boussuge, J.F.; Sensiau, C. Tonal Noise Prediction of a Modern Turbofan Engine With Large Upstream and Downstream Distortion. J. Turbomach. 2019, 141, 021010. [Google Scholar] [CrossRef]
- Daroukh, M.; Polacsek, C.; Chelius, A. Shock Wave Generation and Radiation from a Turbofan Engine Under Flow Distortion. AIAA J. 2020, 58, 787–801. [Google Scholar] [CrossRef]
- Daroukh, M.; Polacsek, C.; Carini, M. Acoustic Assessment of BLI Effects on Airbus Nautilius EngineIntegration Concept - Part I: Noise Generation. 28th AIAA/CEAS Aeroacoustics Conference; 2022; AIAA paper 2022-2943.
- Lorteau, M.; Le Garrec, T.; Daroukh, M.; Polacsek, C. Acoustic Assessment of BLI Effects on Airbus Nautilius EngineIntegration Concept - Part II: Noise Propagation. 28th AIAA/CEAS Aeroacoustics Conference; 2022; AIAA 2022-2992 paper.
- Casalino, D.; Hazir, A.; Mann, A. Turbofan Broadband Noise Prediction Using the Lattice Boltzmann Method. AIAA J. 2018, 56(2), 609–628. [Google Scholar] [CrossRef]
- Pérez Arroyo, C.; Leonard, T.; Sanjosé, M.; Moreau, S.; Duchaine, F. Large Eddy Simulation of a Scale-model Turbofan for Fan Noise Source Diagnostic. J. Sound & Vib. 2019, 445, 64–76. [Google Scholar]
- AVBP. AVBP Code: www.cerfacs.fr/cfd/avbp_code.php and www.cerfacs.fr/cfd/CFDPublications.html.
- Dassault-Systèmes. SIMULIA PowerFLOW User’s Guide, 2020.
- Kholodov, P.; Moreau, S. Wall-Resolved Large Eddy Simulation of a Realistic Turbofan Rotor for Noise Prediction. 27th AIAA/CEAS Aeroacoustics Conference; 2021; AIAA 2021-2256 paper.
- Pérez Arroyo, C.; Kholodov, P.; Sanjosé, M.; Moreau, S. CFD Modeling of a Realistic Turbofan for Noise Prediction. Part 1: Aerodynamics. Proceedings of Global Power and Propulsion Society; 2019; GPPS-BJ-2019-126 paper.
- Sanjosé, M.; Kholodov, P.; Pérez Arroyo, C.; Moreau, S. CFD Modeling of a Realistic Turbofan for Noise Prediction. Part 2: Analytical Acoustic Predictions. Proceedings of Global Power and Propulsion Society; 2019; GPPS-BJ-2019-224 paper.
- Koch, R.; Sanjose, M.; Moreau, S. Large-Eddy Simulation of a Single Airfoil Tip-Leakage Flow. AIAA J. 2021, 59, 2546–2557. [Google Scholar] [CrossRef]
- Koch, R.; Sanjosé, M.; Moreau, S. Numerical Aeroacoustic Analysis of a Linear Compressor Cascade with Tip Gap. AIAA J. 2022, 60, 4840–4854. [Google Scholar] [CrossRef]
- Shubham, S.; Sandberg, R.; Moreau, S.; Wu, H. Surface pressure spectrum variation with Mach number on a CD airfoil. J. Sound & Vib. 2022, 526, 116762:1–15. [Google Scholar]
- Koch, R. Identification des sources de bruit aérodynamique liées aux écoulements de jeu en tête de pale de soufflante de turboréacteur. PhD thesis, Université de Sherbrooke, Sherbrooke, QC, CANADA, 2021.
- Deuse, M.; Sandberg, R. Different noise generation mechanisms of a controlled diffusion aerofoil and their dependence on Mach number. J. Sound & Vib. 2020, 476, 1–18. [Google Scholar]
- Kholodov, P.; Moreau, S. Identification of noise sources in a realistic turbofan rotor using Large Eddy Simulation. Acoustics 2020, 2, 691–706. [Google Scholar] [CrossRef]
- François, B.; Polacsek, C.; Daroukh, M.; Barrier, R. Zonal Detached Eddy Simulation of the Fan-Outlet Guide Vanes Stage of a Turbofan Engine. Part I – Methodology, Numerical Setup, and Aerodynamic Analysis. J. Turbomachinery 2022, 144, 111004. [Google Scholar] [CrossRef]
- Polacsek, C.; Daroukh, M.; François, B.; Barrier, R. Zonal Detached Eddy Simulation of the Fan-Outlet Guide Vanes Stage of a Turbofan Engine. Part II – Broadband Noise Predictions. J. Turbomachinery 2022, 144, 111005. [Google Scholar] [CrossRef]
- Suzuki, T.; Spalart, P.; Shur, M.; Strelets, M.; Travin, A. Unsteady Simulations of a Fan Outlet-Guide-Vane System Broadband-Noise Computation. AIAA J. 2019, 57, 5168–5181. [Google Scholar] [CrossRef]
- Suzuki, T.; Shur, M.; Strelets, M.; Travin, A. Potential Amplification Mechanism of Rotor–Stator-Interaction Noise via Spiral-Poiseuille-Flow Instability. AIAA J. 2022, 60, 2441–2457. [Google Scholar] [CrossRef]
- Lewis, D. From analytical to fully numerical predictions of the broadband noise radiated by a full fan-OGV. PhD thesis, Ecole Centrale de Lyon, Lyon, France, 2020.
- Lewis, D.; Moreau, S.; Jacob, M.C.; Sanjosé, M. ACAT1 fan stage broadband noise prediction using large-eddy simulation and analytical models. AIAA Journal 2022, 60, 360–380. [Google Scholar]
- Piomelli, U. Large eddy simulations in 2030 and beyond. Phil. Trans. R. Soc. London, Ser. A 2014, 372, 1–13. [Google Scholar] [CrossRef] [PubMed]
- Blàzquez-Navarro, R.; Corral, R. Prediction of fan acoustic blockage on fan/outlet guide vane broadband interaction noise using frequency domain linearised Navier–Stokes solvers. J. Sound & Vib. 2021, 500, 116033. [Google Scholar]
- Posson, H.; Moreau, S. Effect of Rotor Shielding on Fan-Outlet Guide Vanes Broadband Noise Prediction. AIAA J. 2013, 51, 1576–1592. [Google Scholar] [CrossRef]
- Ying, W.; Fattah, R.; Zhong, Z.; Zhang, X.; Gea-Aguilera, F. A numerical investigation of the rotor blockage effect on cascade noise using a sliding mesh method. J. Sound & Vib. 2021, 502, 116030. [Google Scholar]
- Al Am, J.; Clair, V.; Giauque, A.; Boudet, J.; Gea-Aguilera, F. On the effects of a separation bubble on fan noise. J. Sound & Vib. 2022, 537, 117180:1–19. [Google Scholar]
- Al Am, J. Broadband noise predictions of a fan stage using large eddy simulations. PhD thesis, Université de Lyon, Ecole Centrale de Lyon, Ecully, FRANCE, 2022.
- de Laborderie, J.; Moreau, S.; Berry, A. Compressor Stage Broadband Noise Prediction using a Large-Eddy Simulation and Comparisons with a Cascade Response Model. 19th AIAA/CEAS Aeroacoustics Conference; 2013; AIAA 2013-2042 paper.
- Pérez Arroyo, C.; Dombard, J.; Duchaine, F.; Gicquel, L.; Odier, N.; Exilard, G.; Richard, S.; Buffaz, N.; Démolis, J. Large-Eddy Simulation of an Integrated High-Pressure Compressor and Combustion Chamber of a Typical Turbine Engine Architecture. ASME Turbo Expo 2020; 2020; ASME GT2020-16288 paper.
- Sanjosé, M.; Towne, A.; Jaiswal, P.; Moreau, S.; Lele, S. Modal analysis of the laminar boundary layer instability and tonal noise of an airfoil at Reynolds number 150,000. Int. J. of Aeroacoustics 2019, 18, 317–350. [Google Scholar] [CrossRef]
- Jaiswal, P.; Yakhina, G.; Pasco, Y.; Moreau, S. Experimental investigation of aerofoil tonal noise at low Mach number. J. Fluid Mech. 2022, 932, A37. [Google Scholar] [CrossRef]
- Al Am, J.; Clair, V.; Giauque, A.; Boudet, J.; Gea-Aguilera, F. Direct noise predictions of fan broadband noise using LES and analytical models. 28th AIAA/CEAS Aeroacoustics Conference; 2022; AIAA paper 2022-2882.
- Sanjosé, M.; Moreau, S.; Kim, M.S.; Pérot, F. Direct Self-noise Simulation of the Installed Controlled Diffusion Airfoil. 17th AIAA/CEAS Aeroacoustics Conference; 2011; AIAA 2011-2716 paper. AIAA-2011-2716.
- Wu, H.; Moreau, S.; Sandberg, R. Effects of pressure gradient on the evolution of velocity-gradient tensor invariant dynamics on a controlled-diffusion aerofoil at Rec=150000. J. Fluid Mech. 2019, 868, 584–610. [Google Scholar] [CrossRef]
- Wu, H.; Sandberg, R.; Moreau, S. Stability characteristics of different aerofoil flows at Rec=1.5×10⁵ and the implications for aerofoil self-noise. J. Sound & Vib. 2021, 487, 115620. [Google Scholar] [CrossRef]
- Pestana, M.; Sanjosé, M.; Roger, M.; Moreau, S.; Gruber, M. Assessment of the Impact of a Heterogeneous Stator on the Noise of an Axial-Flow Low Mach-Number Stage. 25th AIAA/CEAS Aeroacoustics Conference; 2019; paper 2019-2589.
- Pereira, A.; Roger, M. A modular low-Mach number, axial-flow fan test bench: impact of outlet-guide-vane heterogeneity on the radiated noise. ICSV 29; 2023; paper 396.
- Roger, M.; Pereira, A. Regeneration of ducted rotor-stator wake-interaction tonal noise because of vane-to-vane irregularities. ICSV 29; 2023; paper 347.
- Pestana, M. Impact of a heterogeneous stator on the rotor-stator interaction-noise: an analytical, experimental and numerical investigation. PhD thesis, École Centrale de Lyon, 2020LYSEC03, 2020.
- Sanjosé, M.; Daroukh, M.; Magnet, W.; De Laborderie, J.; Moreau, S.; Mann, A. Tonal fan noise prediction and validation on the ANCF configuration. Noise Control Eng. J. 2015, 63, 552–561. [Google Scholar] [CrossRef]
- Sanjose, M.; Moreau, S.; Pestana, M.; Roger, M. Effect of Weak Outlet-Guide-Vane Heterogeneity on Rotor–Stator Tonal Noise. AIAA J. 2017, 55, 3440–3457. [Google Scholar] [CrossRef]
- Jacob, M.C.; Grilliat, J.; Camussi, R.; Caputi Gennaro, G. Aeroacoustic investigation of a single airfoil tip leakage flow. Int. J. of Aeroacoustics 2010, 9, 253–272. [Google Scholar] [CrossRef]
- Jacob, M.C.; Jondeau, E.; Li, B. Time-resolved PIV measurements of a tip leakage flow. Int. J. of Aeroacoustics 2016, 15, 662–685. [Google Scholar] [CrossRef]
- Boudet, J.; Caro, J.; Li, B.; Jondeau, E.; Jacob, M.C. Zonal large-eddy simulation of a tip leakage flow. Int. J. of Aeroacoustics 2016, 15, 646–661. [Google Scholar] [CrossRef]
- Camussi, R.; Grilliat, J.; Caputi-Gennaro, G.; Jacob, M.C. Experimental study of a tip leakage flow: wavelet analysis of pressure fluctuations. J. Fluid Mech. 2010, 660, 87–113. [Google Scholar] [CrossRef]
- Grilliat, J.; Jacob, M.; Jondeau, E.; Roger, M.; Camussi, R. Broaband noise prediction models and measurements of tip leakage flows. 14th AIAA/CEAS Aeroacoustics Conference (29th AIAA Aeroacoustics Conference) Vancouver, Canada, May, 2008, AIAA2008-2845 paper.
- Saraceno, I.; Palleja-Cabre, S.; Paruchuri, C. On the tip leakage noise generating mechanisms of single-fixed aerofoil. 28th AIAA/CEAS Aeroacoustics Conference; 2022; AIAA 2022-2881 paper.
- Saraceno, I.; Palleja-Cabre, S.; Paruchuri, C.; Ganapathisubramani, B. Influence of non-dimensional parameters on the tip leakage noise. 29th AIAA/CEAS Aeroacoustics Conference; 2023; AIAA 2023-3838 paper.
Disclaimer/Publisher’s Note: The statements, opinions and data contained in all publications are solely those of the individual author(s) and contributor(s) and not of MDPI and/or the editor(s). MDPI and/or the editor(s) disclaim responsibility for any injury to people or property resulting from any ideas, methods, instructions or products referred to in the content. |
© 2023 by the authors. Licensee MDPI, Basel, Switzerland. This article is an open access article distributed under the terms and conditions of the Creative Commons Attribution (CC BY) license (http://creativecommons.org/licenses/by/4.0/).


