1. Introduction
The agricultural sector plays a pivotal role in meeting human food needs, with livestock farming serving as a vital source of meat, milk, and related products. To effectively manage and promote sustainable livestock production, accurate weight estimation of livestock holds a critical position. Traditional livestock weighing methods often involve labor-intensive processes that cause stress to the animals, consequently negatively impacting overall productivity.
The development of an algorithm for livestock weight estimation without direct contact with the animals is essential. This approach addresses ethical concerns by minimizing stress and discomfort during the weighing process.
In today's era of rapid technological advancements, the integration of computer vision-based techniques in livestock farming aligns perfectly with the movement towards smart and precision agriculture. The application of computer vision in livestock weight estimation represents a significant leap forward for automation and data-driven decision-making in agriculture.
Leveraging this technology, farmers can gain real-time insights into livestock weight and health, allowing for more efficient resource allocation, early disease detection, and improved breeding strategies. This has the potential to increase productivity, reduce costs, and contribute to sustainable agricultural practices.
The development of algorithms to predict livestock weight through computer vision-based techniques has garnered significant attention, with various research studies in this area. There are two main approaches: 2D image analysis and 3D image analysis.
First, we review 2D image analysis approaches. Tasdemir and Ozkan [
1] conducted a study to predict the live weight of cows using an Artificial Neural Network (ANN) approach. They captured cows from various angles, applied photogrammetry to calculate body dimensions, and predicted live weight using ANN-based regression. Anifah and Haryanto [
2] proposed a fuzzy rule-based system to estimate cattle weight, extracting body length and circumference as features to feed the fuzzy logic system for weight estimation. Ana et al. [
3] conducted a study to predict live sheep weight using extracted features and machine learning. They captured sheep images from top view, created masks of the top view, and measured six distances in the mask as features to feed a random forest regression model. Weber et al. [
4] proposed a cattle weight estimation approach using active contour and regression trees bagging. They first segmented the image, then created a hull from the segmented image, then extracted features, and predicted weight using a random forest model.
Compared to 2D image processing approaches, 3D image processing approaches have gained more research attention in recent years. Jang et al. [
5] estimated body weight for Korean cattle using 3D images, capturing them from the top view. After extracting body length, body width, and chest width, they built a linear function to calculate cattle weight. Na et al. [
6] proposed a solution to predict cattle weight using depth images, capturing images from the top view, segmenting them, and extracting characteristics of shape and size for cattle weight prediction using machine learning model. Kwon et al. [
7] reconstructed a pig 3D model, created distances along pig’s body as features, and utilized neural networks to predict pig weight. Hou et al. [
8] collected data using LIDAR (Light Detection and Ranging) sensor, segmented 3D beef object models using PointNet++ [
9], measured body length and chest girth, and calculated weight using a pre-defined formula. Ruchay et al. [
10] proposed a model for predicting live weight based on augmenting 3D clouds in the form of flat projections and images with regression deep learning. Na et al. [
11] developed a pig weight prediction system using Raspberry Pi, capturing RGB-D images from the top view of pigs, extracting body characteristics and shape descriptors after segmenting the image, and applying various regression machine learning models to predict pig weight. Le et al. [
12] calculated body sizes, surface area, length, and morphological traits from completed 3D shapes acquired using a laser scanning device to feed into a regression model for dairy cow weight estimation. Cominotte et al. [
13] captured 3D images of cattle from the top view, extracted features from segmented images, and used linear and non-linear regression models to predict beef cattle weight. Martins et al. [
14] also captured 3D images from top view and side view, measuring several distances to feed into the Lasso regression model for body weight estimation.
In all the studies mentioned above, whether employing 2D or 3D image processing approaches, a common formula is followed: the extraction of features for subsequent weight prediction. However, the feature extraction process often relies on 2D segmented images or projection masks of 3D images, which can make it challenging to accurately represent 3D spatial elements, such as chest girth (chest circumference). Research has shown that chest girth is a critical factor in weight calculation [
15].
In this study, we propose an approach that extracts features based on 3D segmentation, enabling us to measure features with precision, incorporating 3D spatial elements accurately. Furthermore, while previous studies were primarily conducted in controlled laboratory or fenced environments, our research predicts weights using 3D shapes acquired from real farm environments.
The main contributions of this proposal are as follows:
We introduce an effective approach for predicting Korean cattle weight using vision-based techniques.
We present a straightforward method for extracting cattle dimensions through 3D segmentation.
We explore multiple regression machine learning algorithms for Korean cattle weight prediction.
Our approach not only predicts Korean cattle weight but also automatically measures three essential body dimensions, facilitating further analysis.
2. Materials and Methods
2.1. Data Acquisition
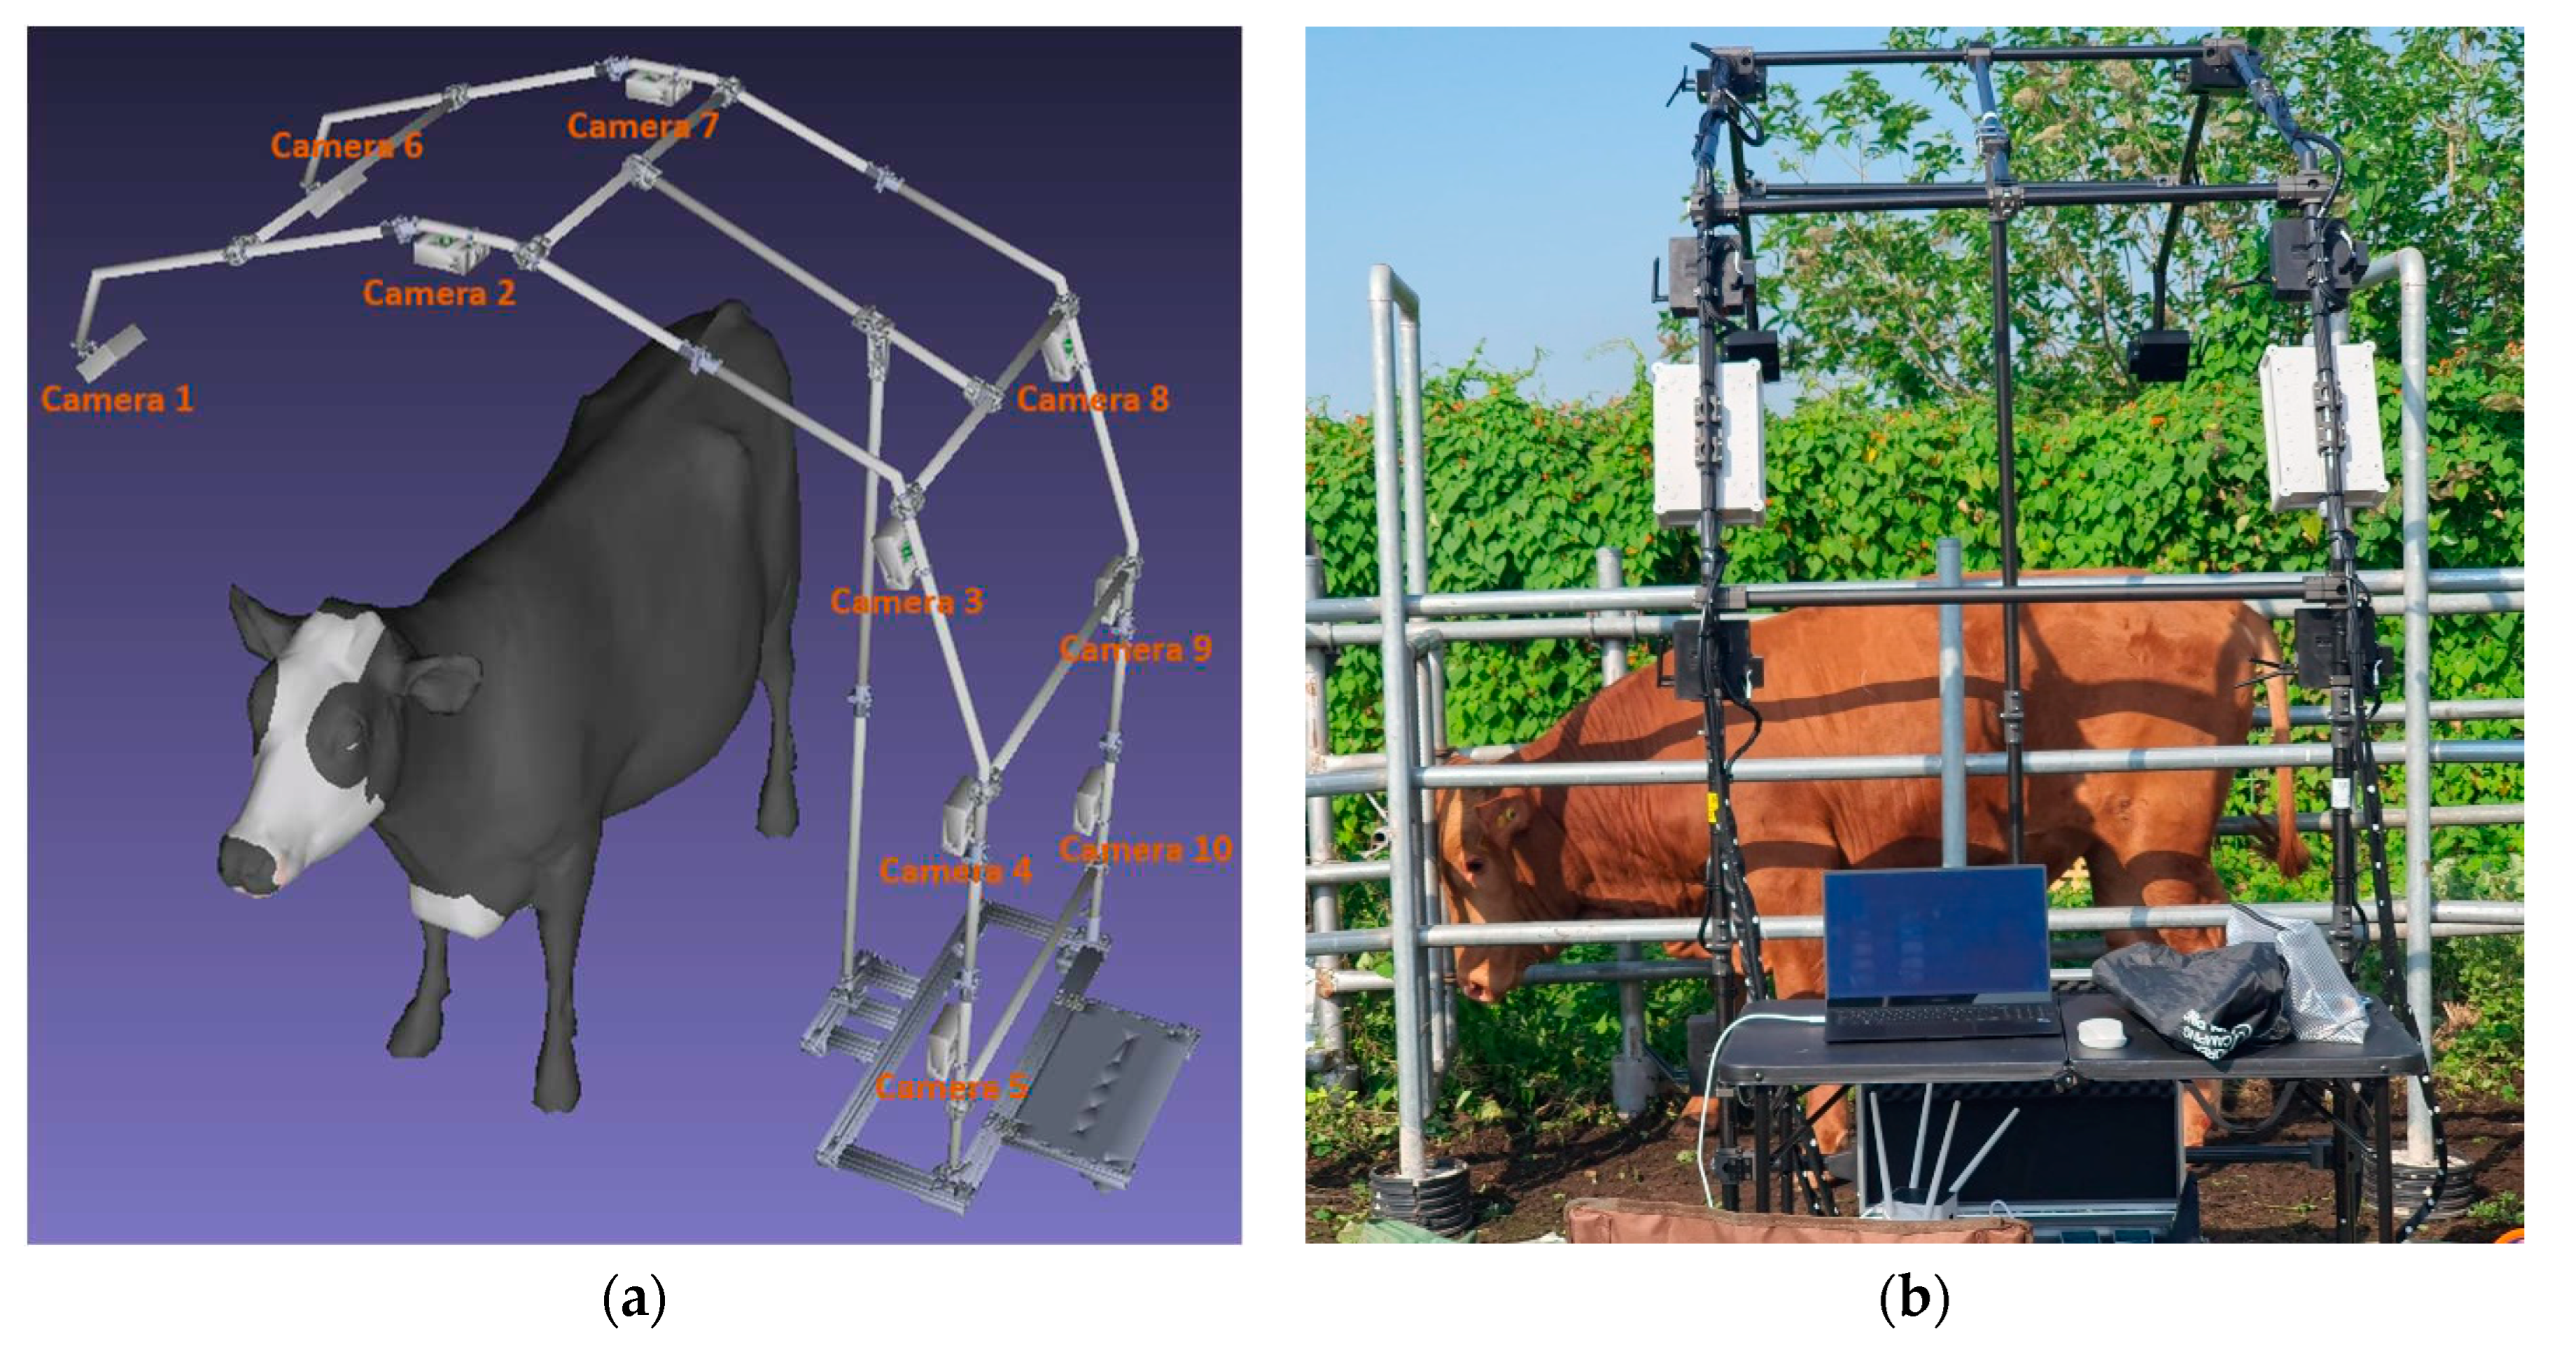
To collect 3D Korean cattle data, we designed a specialized multiple-camera system, which is illustrated in
Figure 1. In
Figure 1a, you can see the system’s design, and in
Figure 1b, you can observe the actual setup.
The system comprises ten stereo cameras arranged in a half-ring configuration, maximizing the coverage of Korean cattle as they pass by. Ideally, an imaging system should form a symmetrical U-shape to capture data from all angles. However, practical considerations, such as bulkiness, mobility issues, and animal fear, make such a design unfeasible. Our mechanical design, in contrast, is lightweight, flexible, and collapsible when not in use. This approach ensures efficient data acquisition without causing distress to the livestock.
The relative translation and rotation between all cameras remained constant throughout the data collection process. We employed stereo cameras, allowing each camera to capture two infrared images: a left infrared image and a right infrared image.
Figure 2 provides an example featuring ten left infrared images from our proposed camera system. The ten right images captured by the system exhibit similar characteristics.
We generated 3D data from the left and right images of each camera using stereo matching, as described in [
16]. Subsequently, guided by the pre-defined relative distances and rotation angles of the cameras, we aligned the 3D images from each individual camera. The 3D mesh data was then reconstructed using the Poisson surface reconstruction algorithm [
17] to construct a comprehensive 3D representation of the entire scene featuring the Korean cattle.
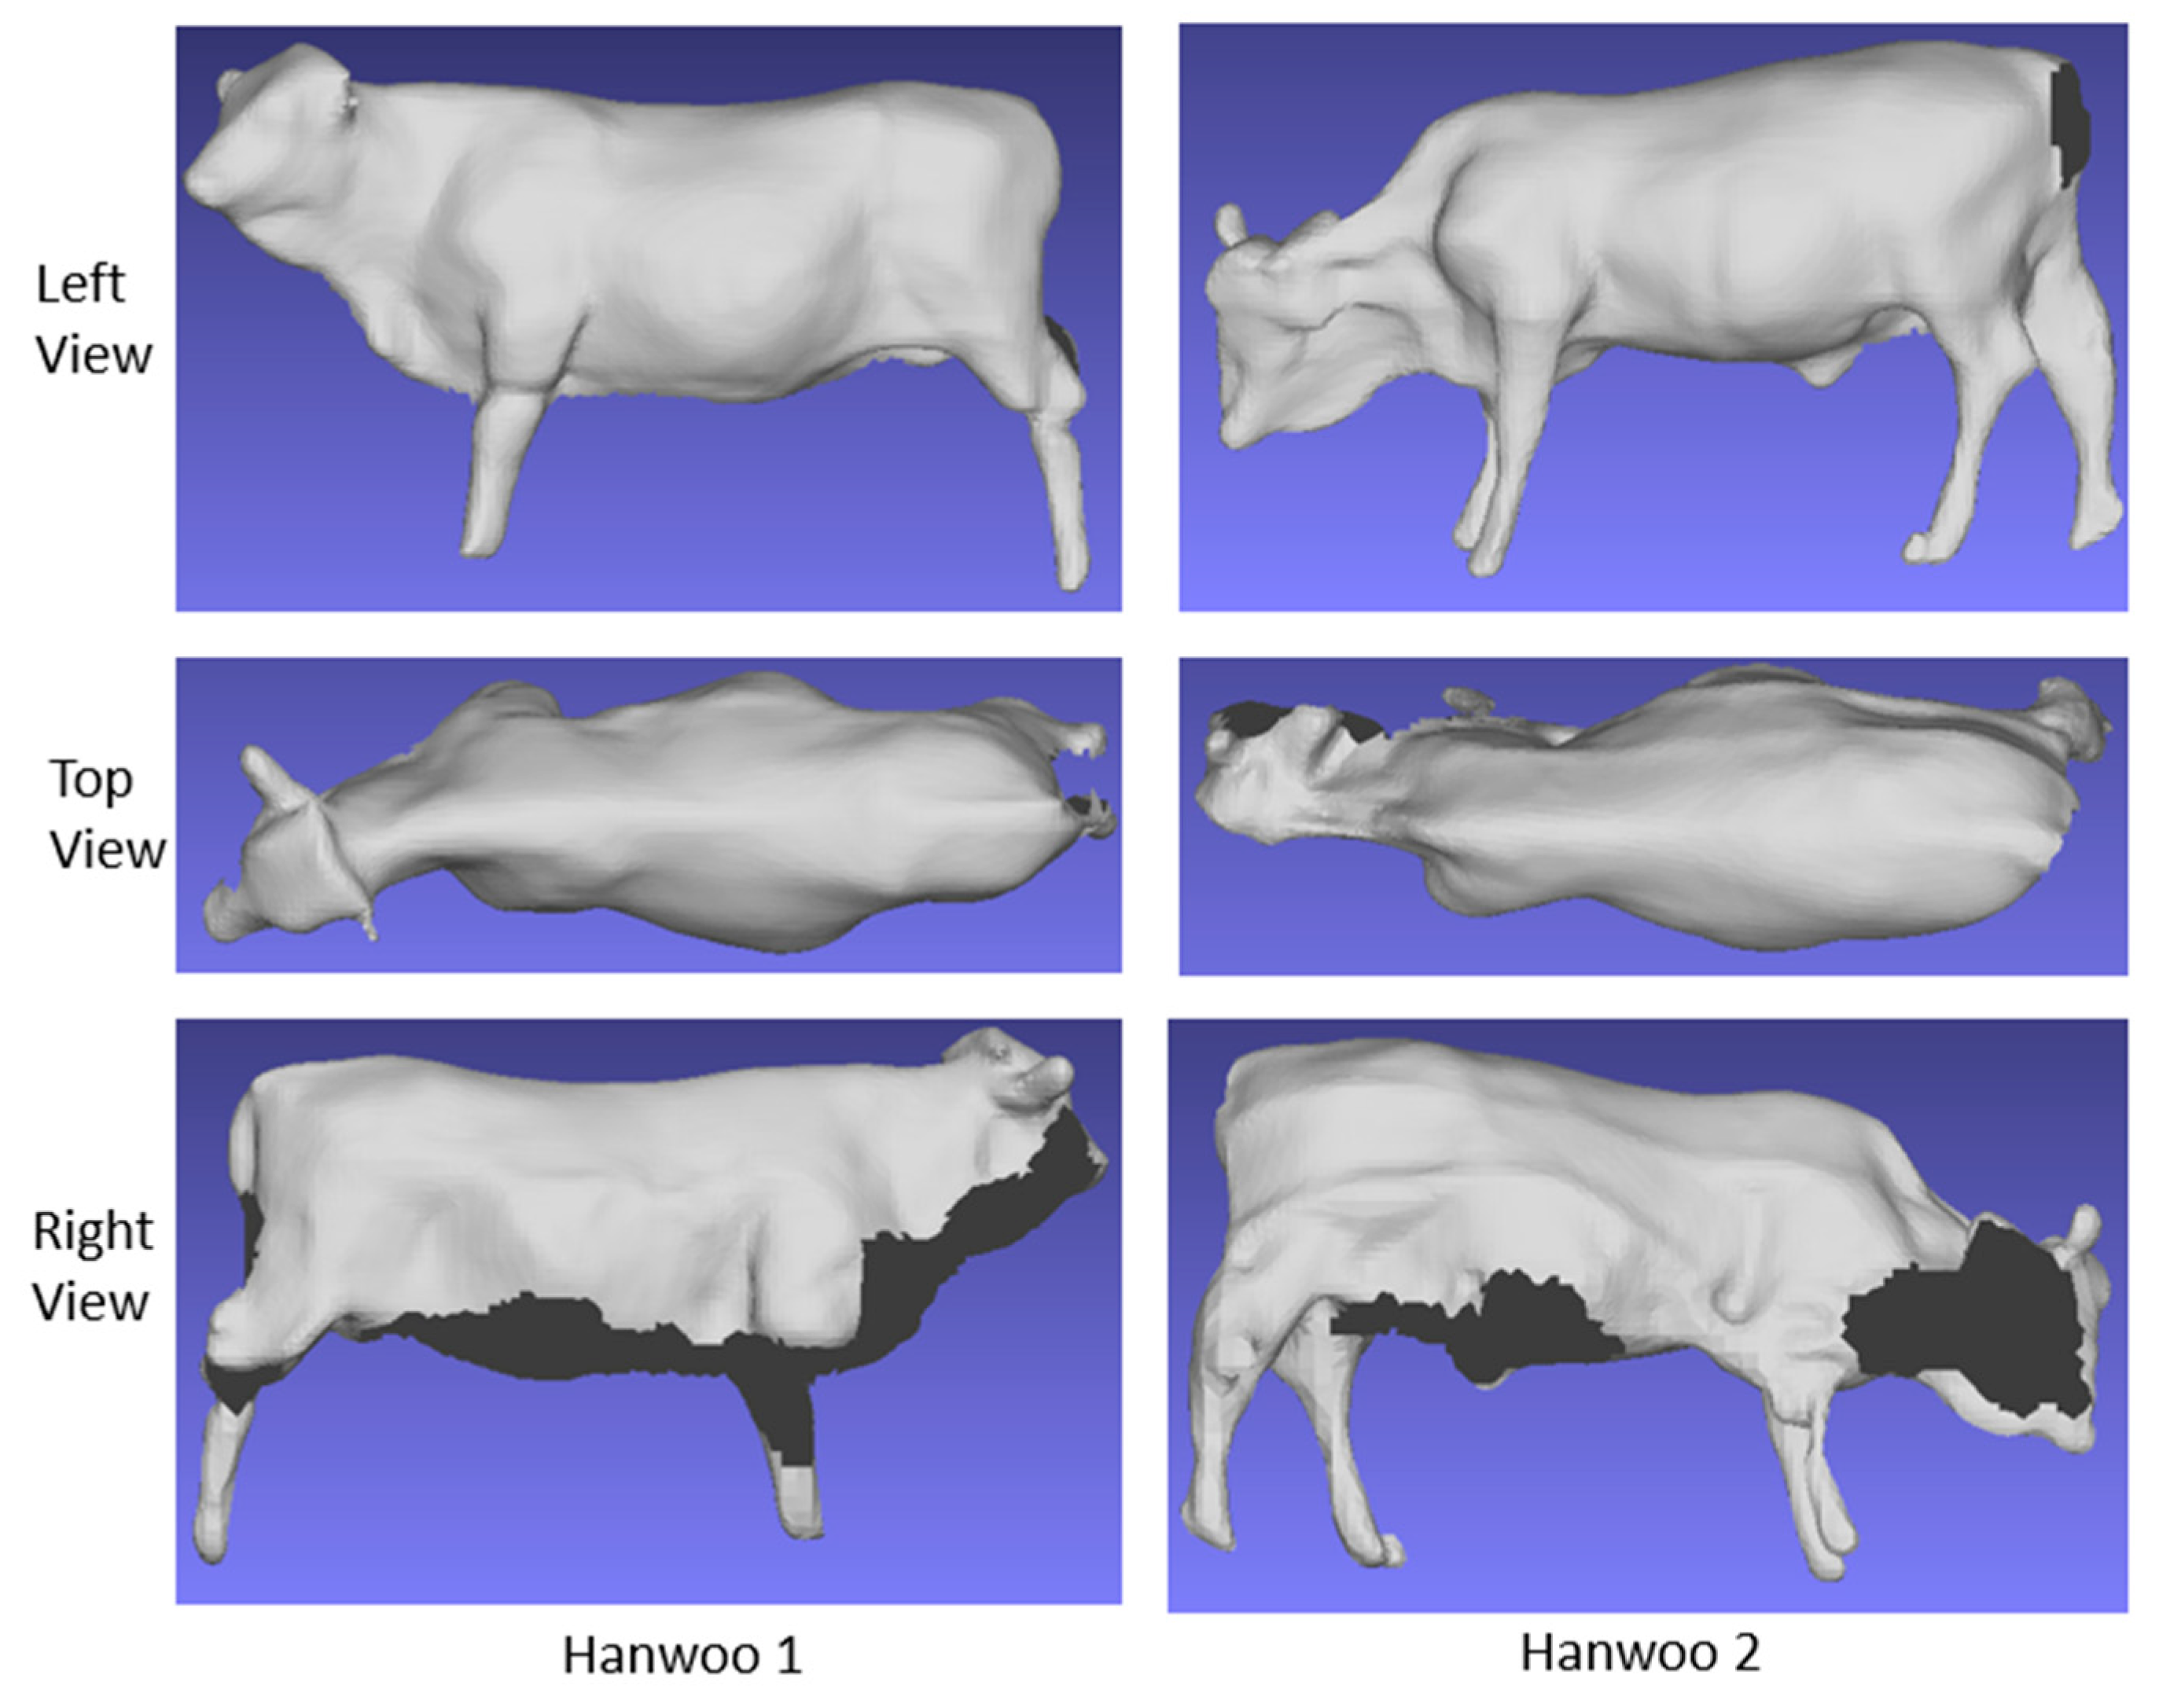
Once this was complete, we subtracted the fixed fence and background scene, resulting in the creation of the 3D mesh data specifically depicting the Korean cattle, as exemplified in
Figure 3. In
Figure 3, each row displays the left view, top view, and right view of a Korean cattle. Notably, the mesh data on the right side and the under area of the cattle appears incomplete due to our system's flexible design, which is designed to adapt to the unpredictable conditions of a real-world farm environment.
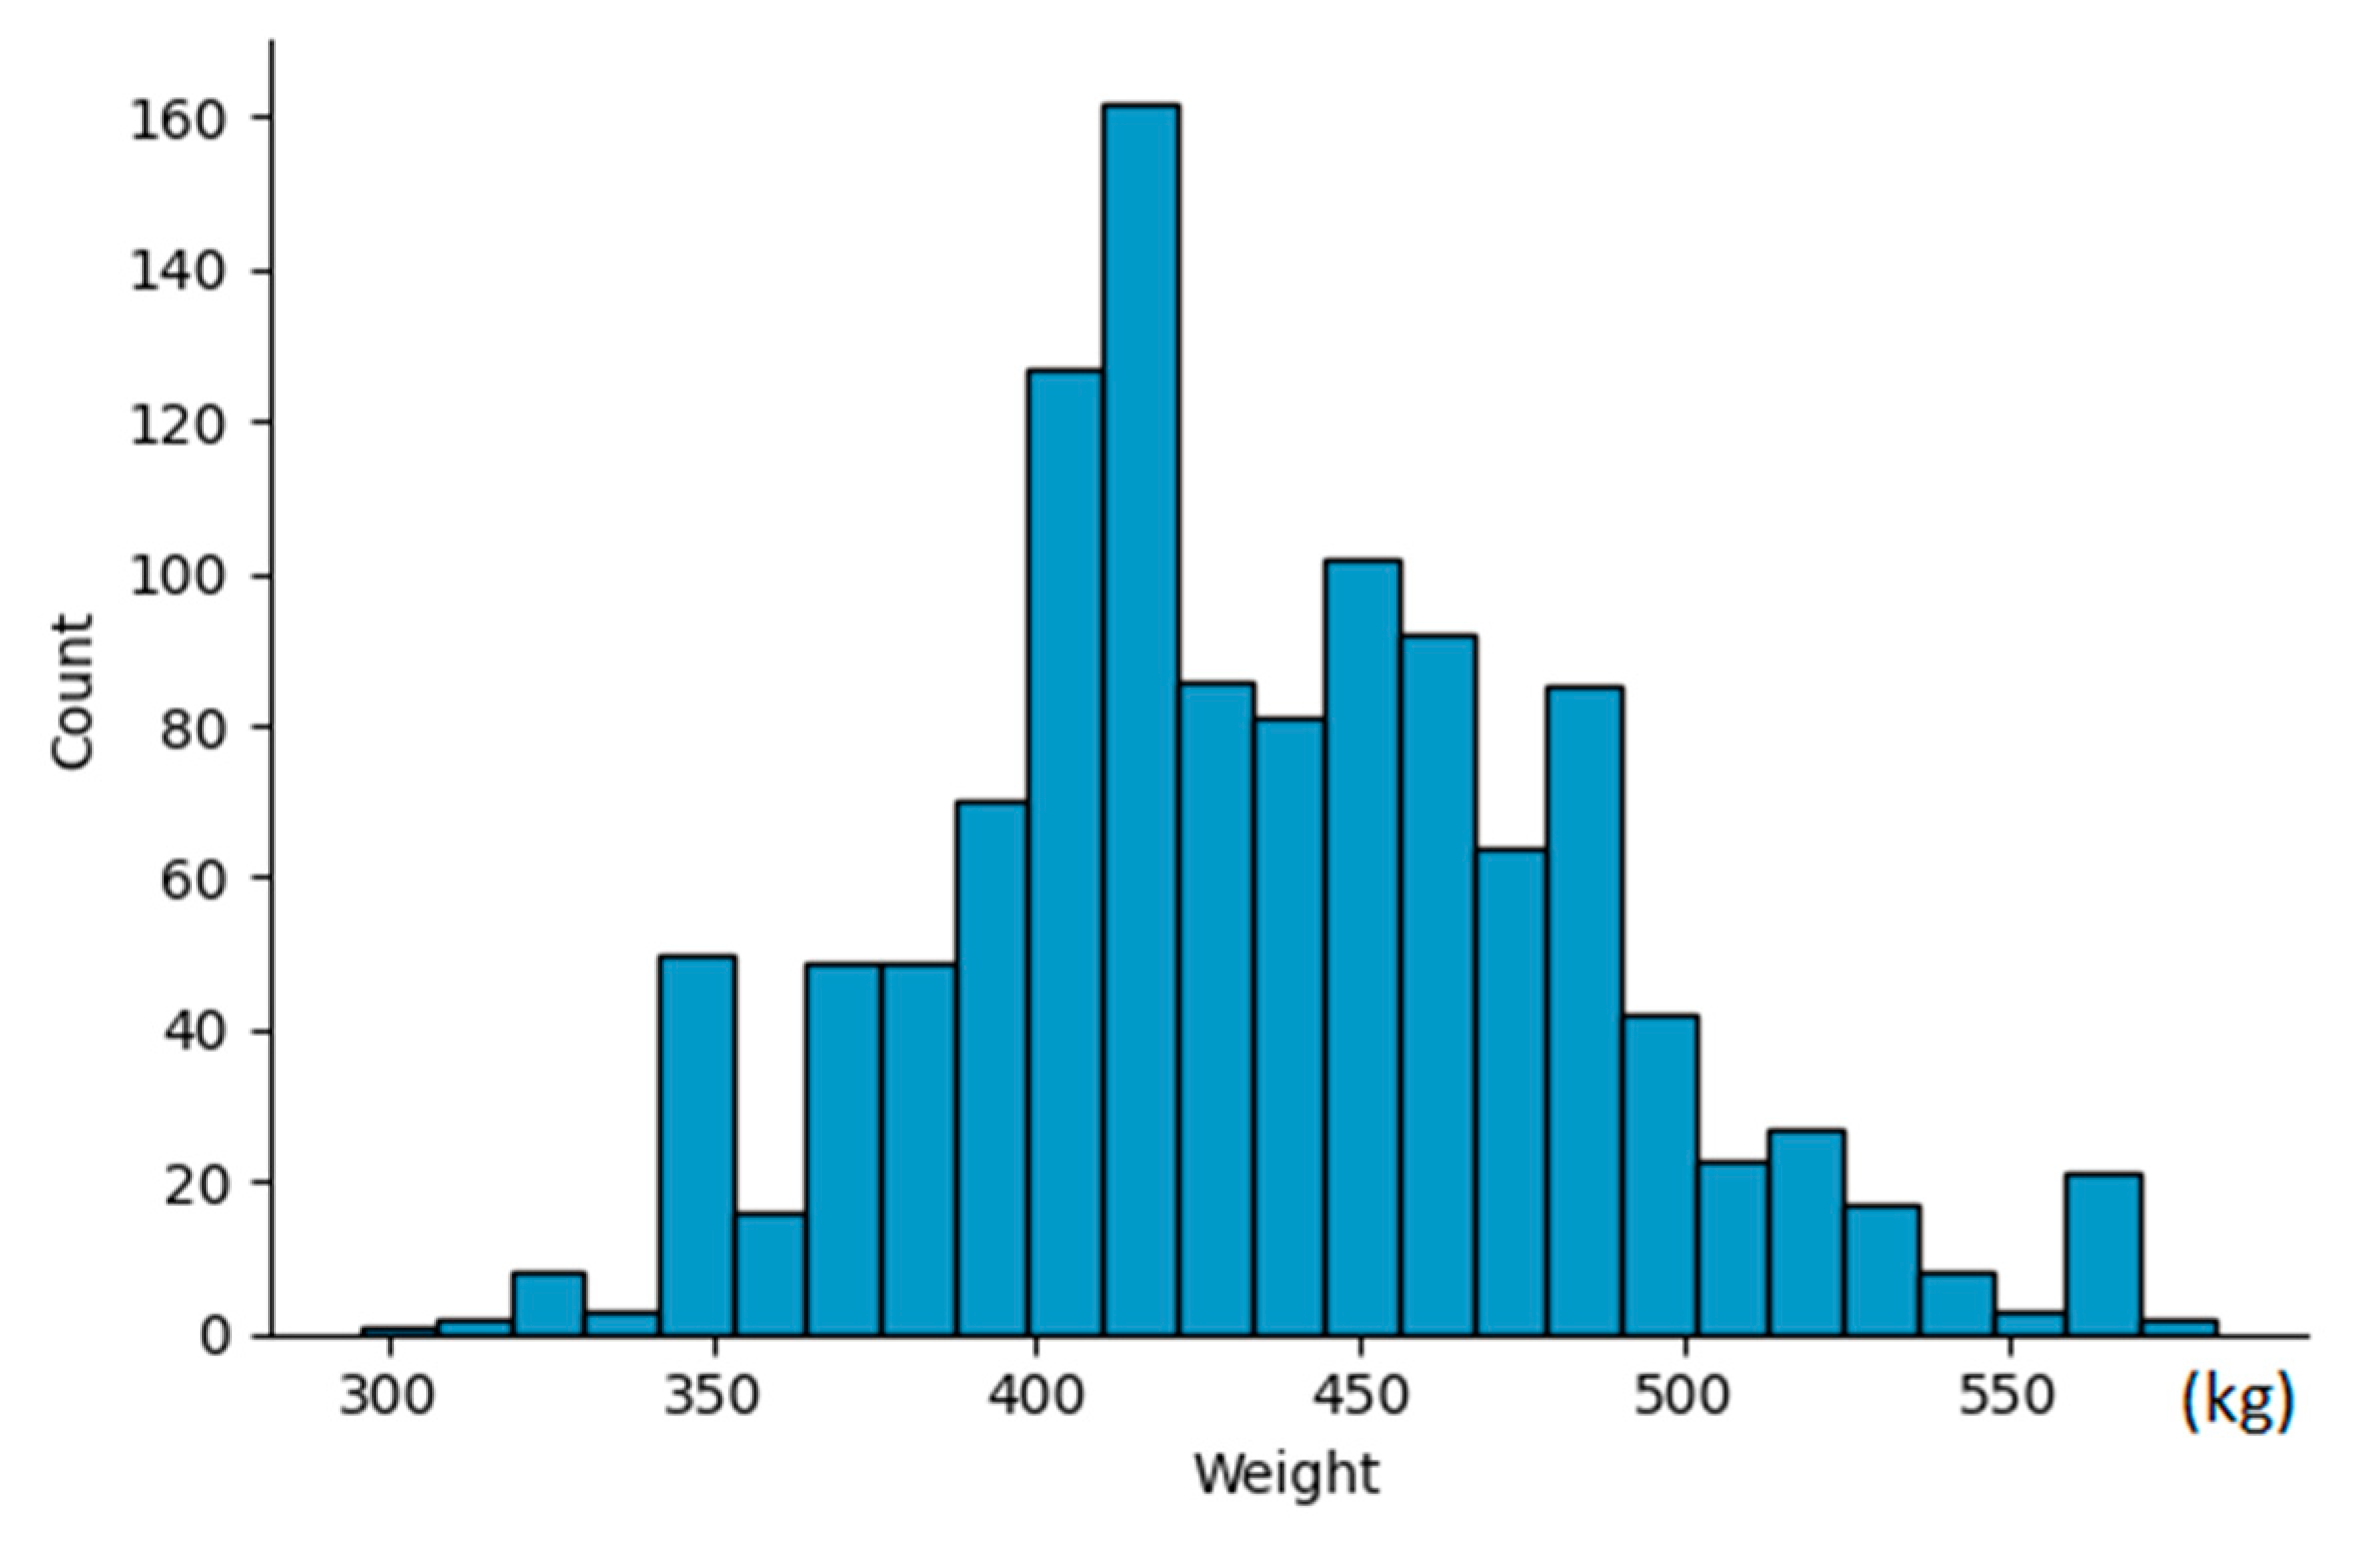
We conducted data collection on two separate occasions, in August 2023 and September 2023, at two distinct farms located in Seosan province, South Korea. Our dataset consisted of a total of 270 cattle, ranging in age from 9 months to 12 months. For each individual cattle, we captured between 3 to 5 shots in various poses, resulting in a collection of 1190 3D data files. Concurrently, we recorded the weight of each cattle during the data capture process. The weight of the cattle in our dataset varies within the range of 300kg to 600kg. The weight distribution is visualized in
Figure 4.
2.2. Proposed Pipeline Overview
The overall diagram of the proposed pipeline is depicted in
Figure 5. After reconstruction process, the 3D image of Korean cattle was saved as 3D mesh files. 3D mesh is sampled into multiple point cloud data for 3D segmentation process. Two segmentation models are designed for this project: torso segmentation and center body segmentation.
The output of the torso segmentation is used to measure the body length, while the output of the center body segmentation was used to extract the chest girth and chest width. After three important dimension characteristics are extracted, a regression machine learning model is developed to predict Korean cattle weight with these three dimensions as input. We applied five of the most advanced regression machine learning models: CatBoost, LightGBM, Polynomial, Random Forest, and XGBoost.
2.3. 3D Segmentation-Based Feature Extraction
2.3.1. Definition of Korean Cattle Body Dimensions
Recent studies [
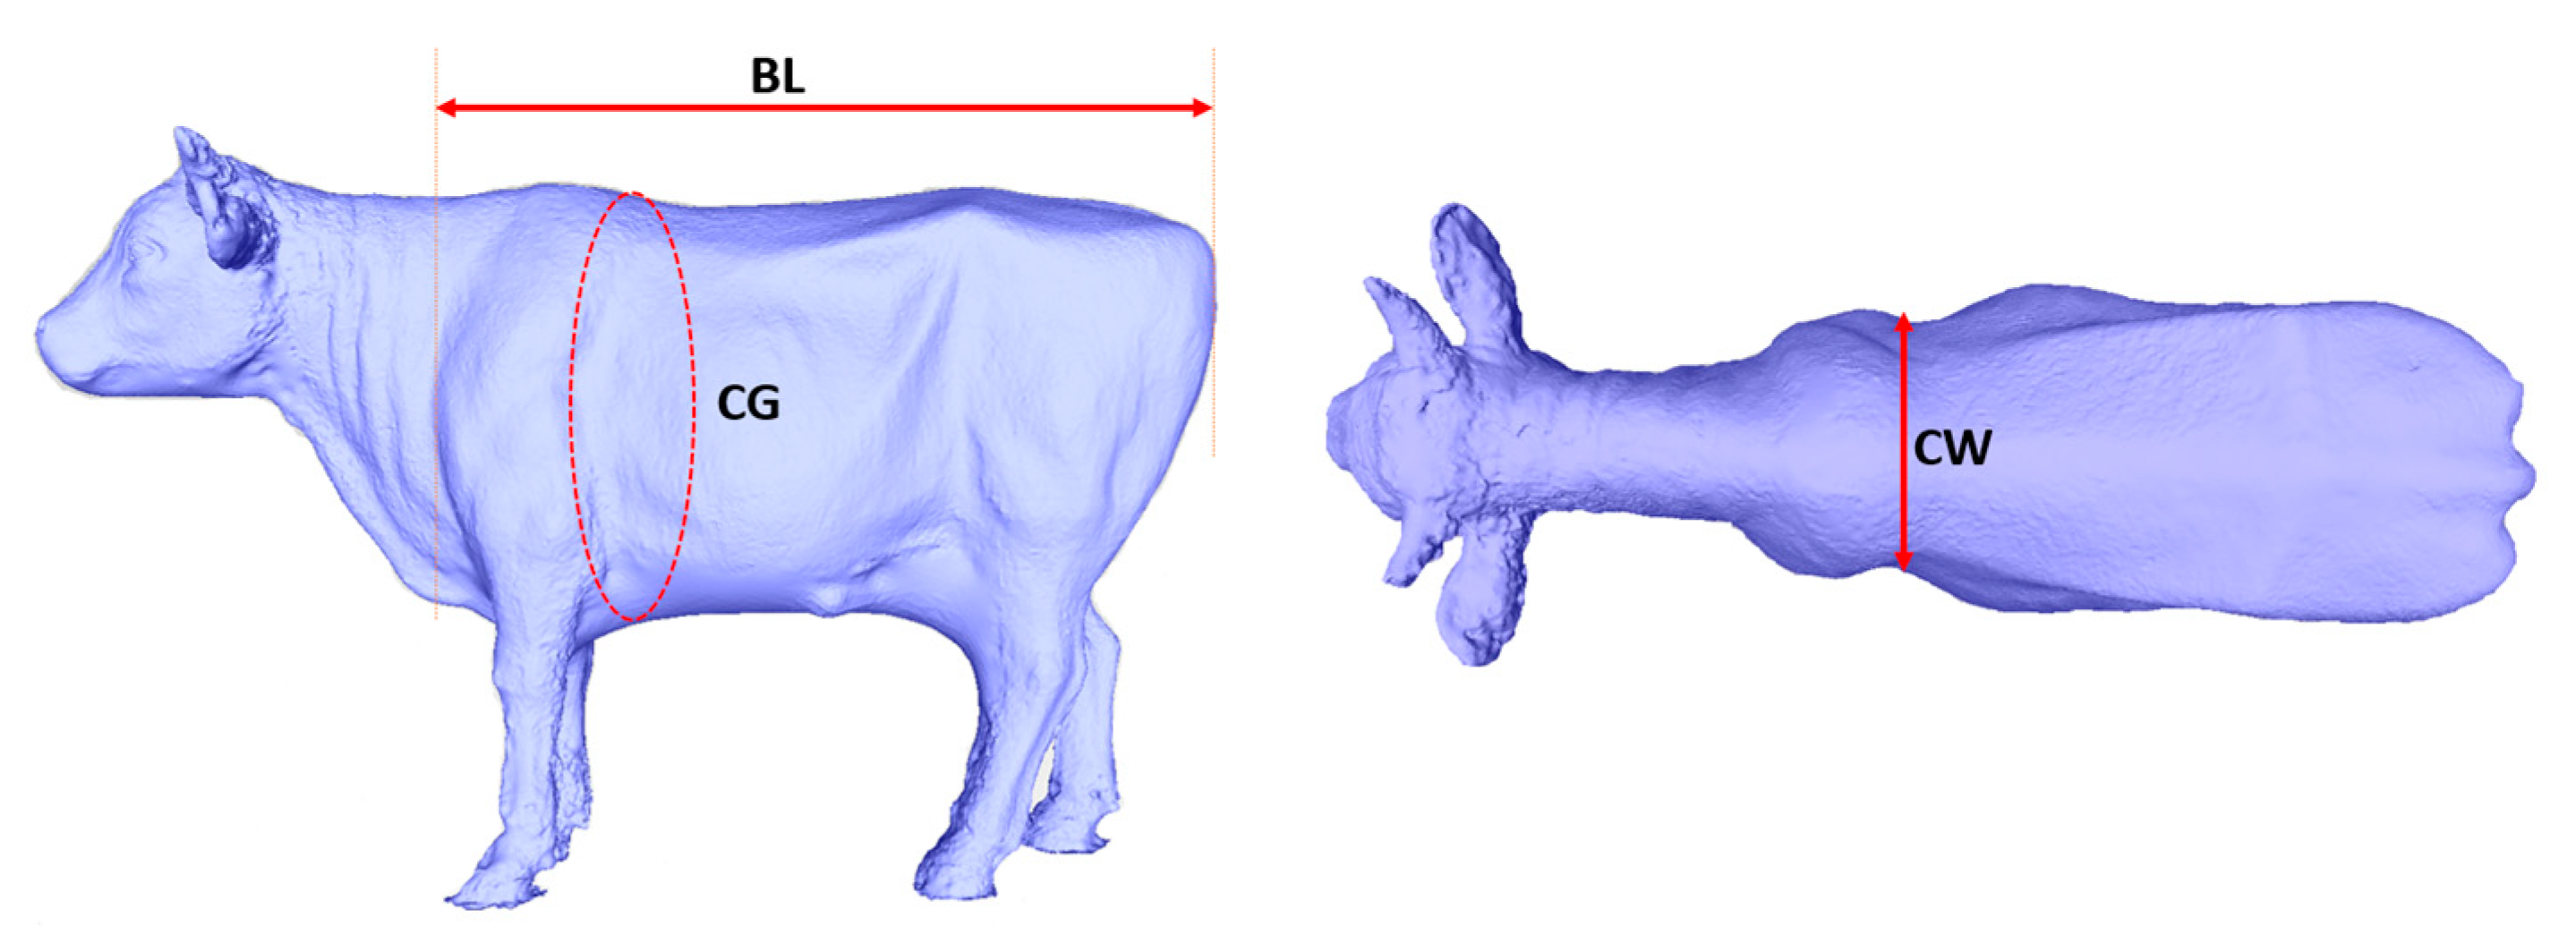
15] have demonstrated the feasibility of determining cattle weight by measuring specific distance parameters. However, it's important to note that among the ten parameters used for determining these distances, each parameter possesses varying levels of significance. In this study, we propose a solution that automates the measurement of three body dimensions with the highest weight ratios, upon which we base our weight prediction model. These three critical dimensions are body length, chest girth, and chest width. Detailed measurement definitions for these body dimensions are provided in
Table 1, and the corresponding measurement sites for each body dimension are visually represented in
Figure 6.
2.3.2. 3D Segmentation-Based Feature Extraction
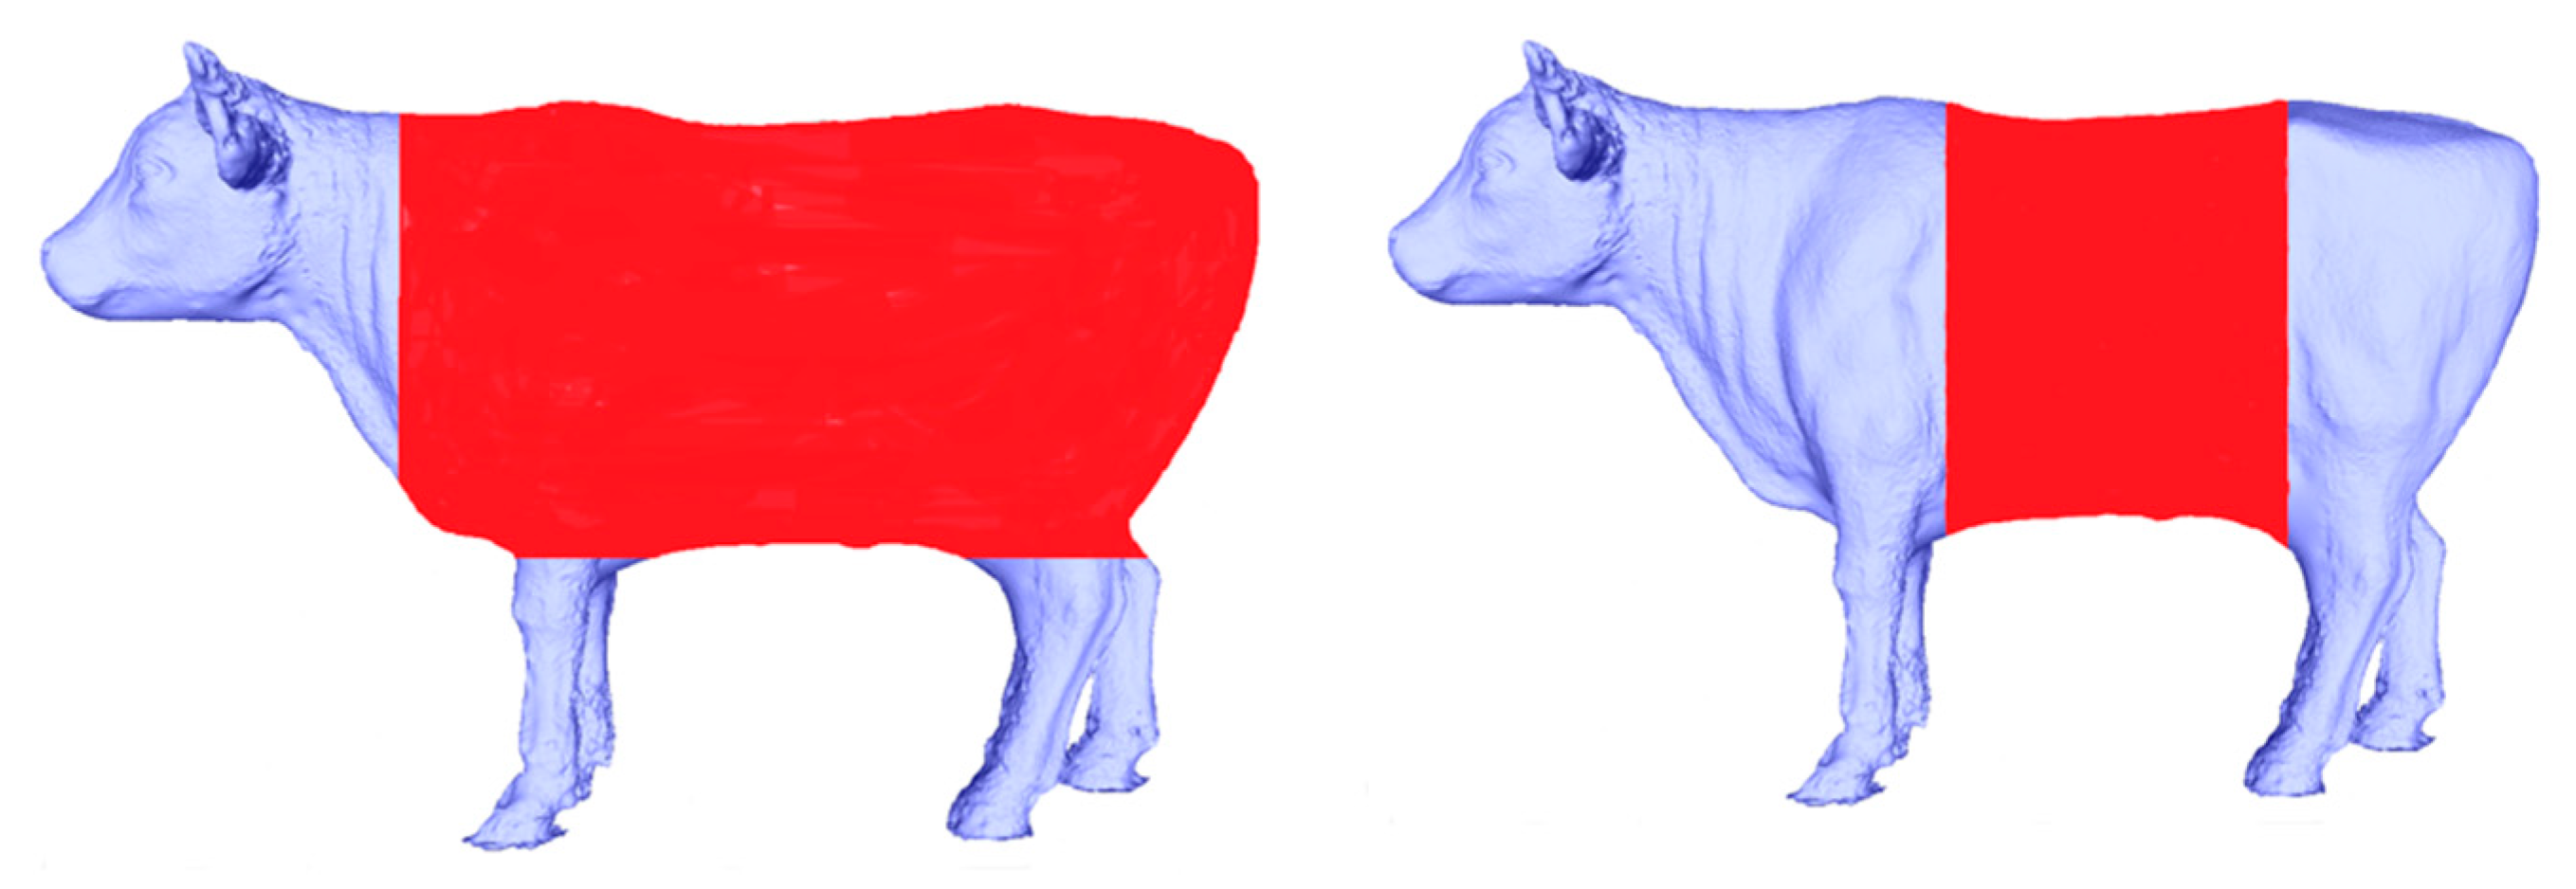
Automatically extracting body dimensions from Korean cattle data acquired in 3D can be a challenging task. To overcome this, we employed a segmentation approach to isolate the specific parts of the cattle for measurement. We conducted two distinct segmentation processes: one for cattle torso segmentation to measure body length and another for center body segmentation, which allows us to measure chest girth and chest width, as illustrated in
Figure 7.
The advancement of artificial intelligence (AI), particularly in deep learning techniques, has introduced powerful tools for 3D data analysis. One such network, PointNet [
18], specializes in 3D data analysis and offers the advantage of learning both global and local features. It can be effectively applied to various 3D tasks, including 3D classification, 3D segmentation, and 3D part segmentation. In this project, we adopt the PointNet network for 3D cattle part segmentation. To streamline the data labeling process while maintaining high accuracy, we exclusively use binary 3D segmentation, simplifying the model's complexity. Consequently, we implemented two models with identical architecture but distinct labeling data: one for cattle torso segmentation and the other for center body segmentation.
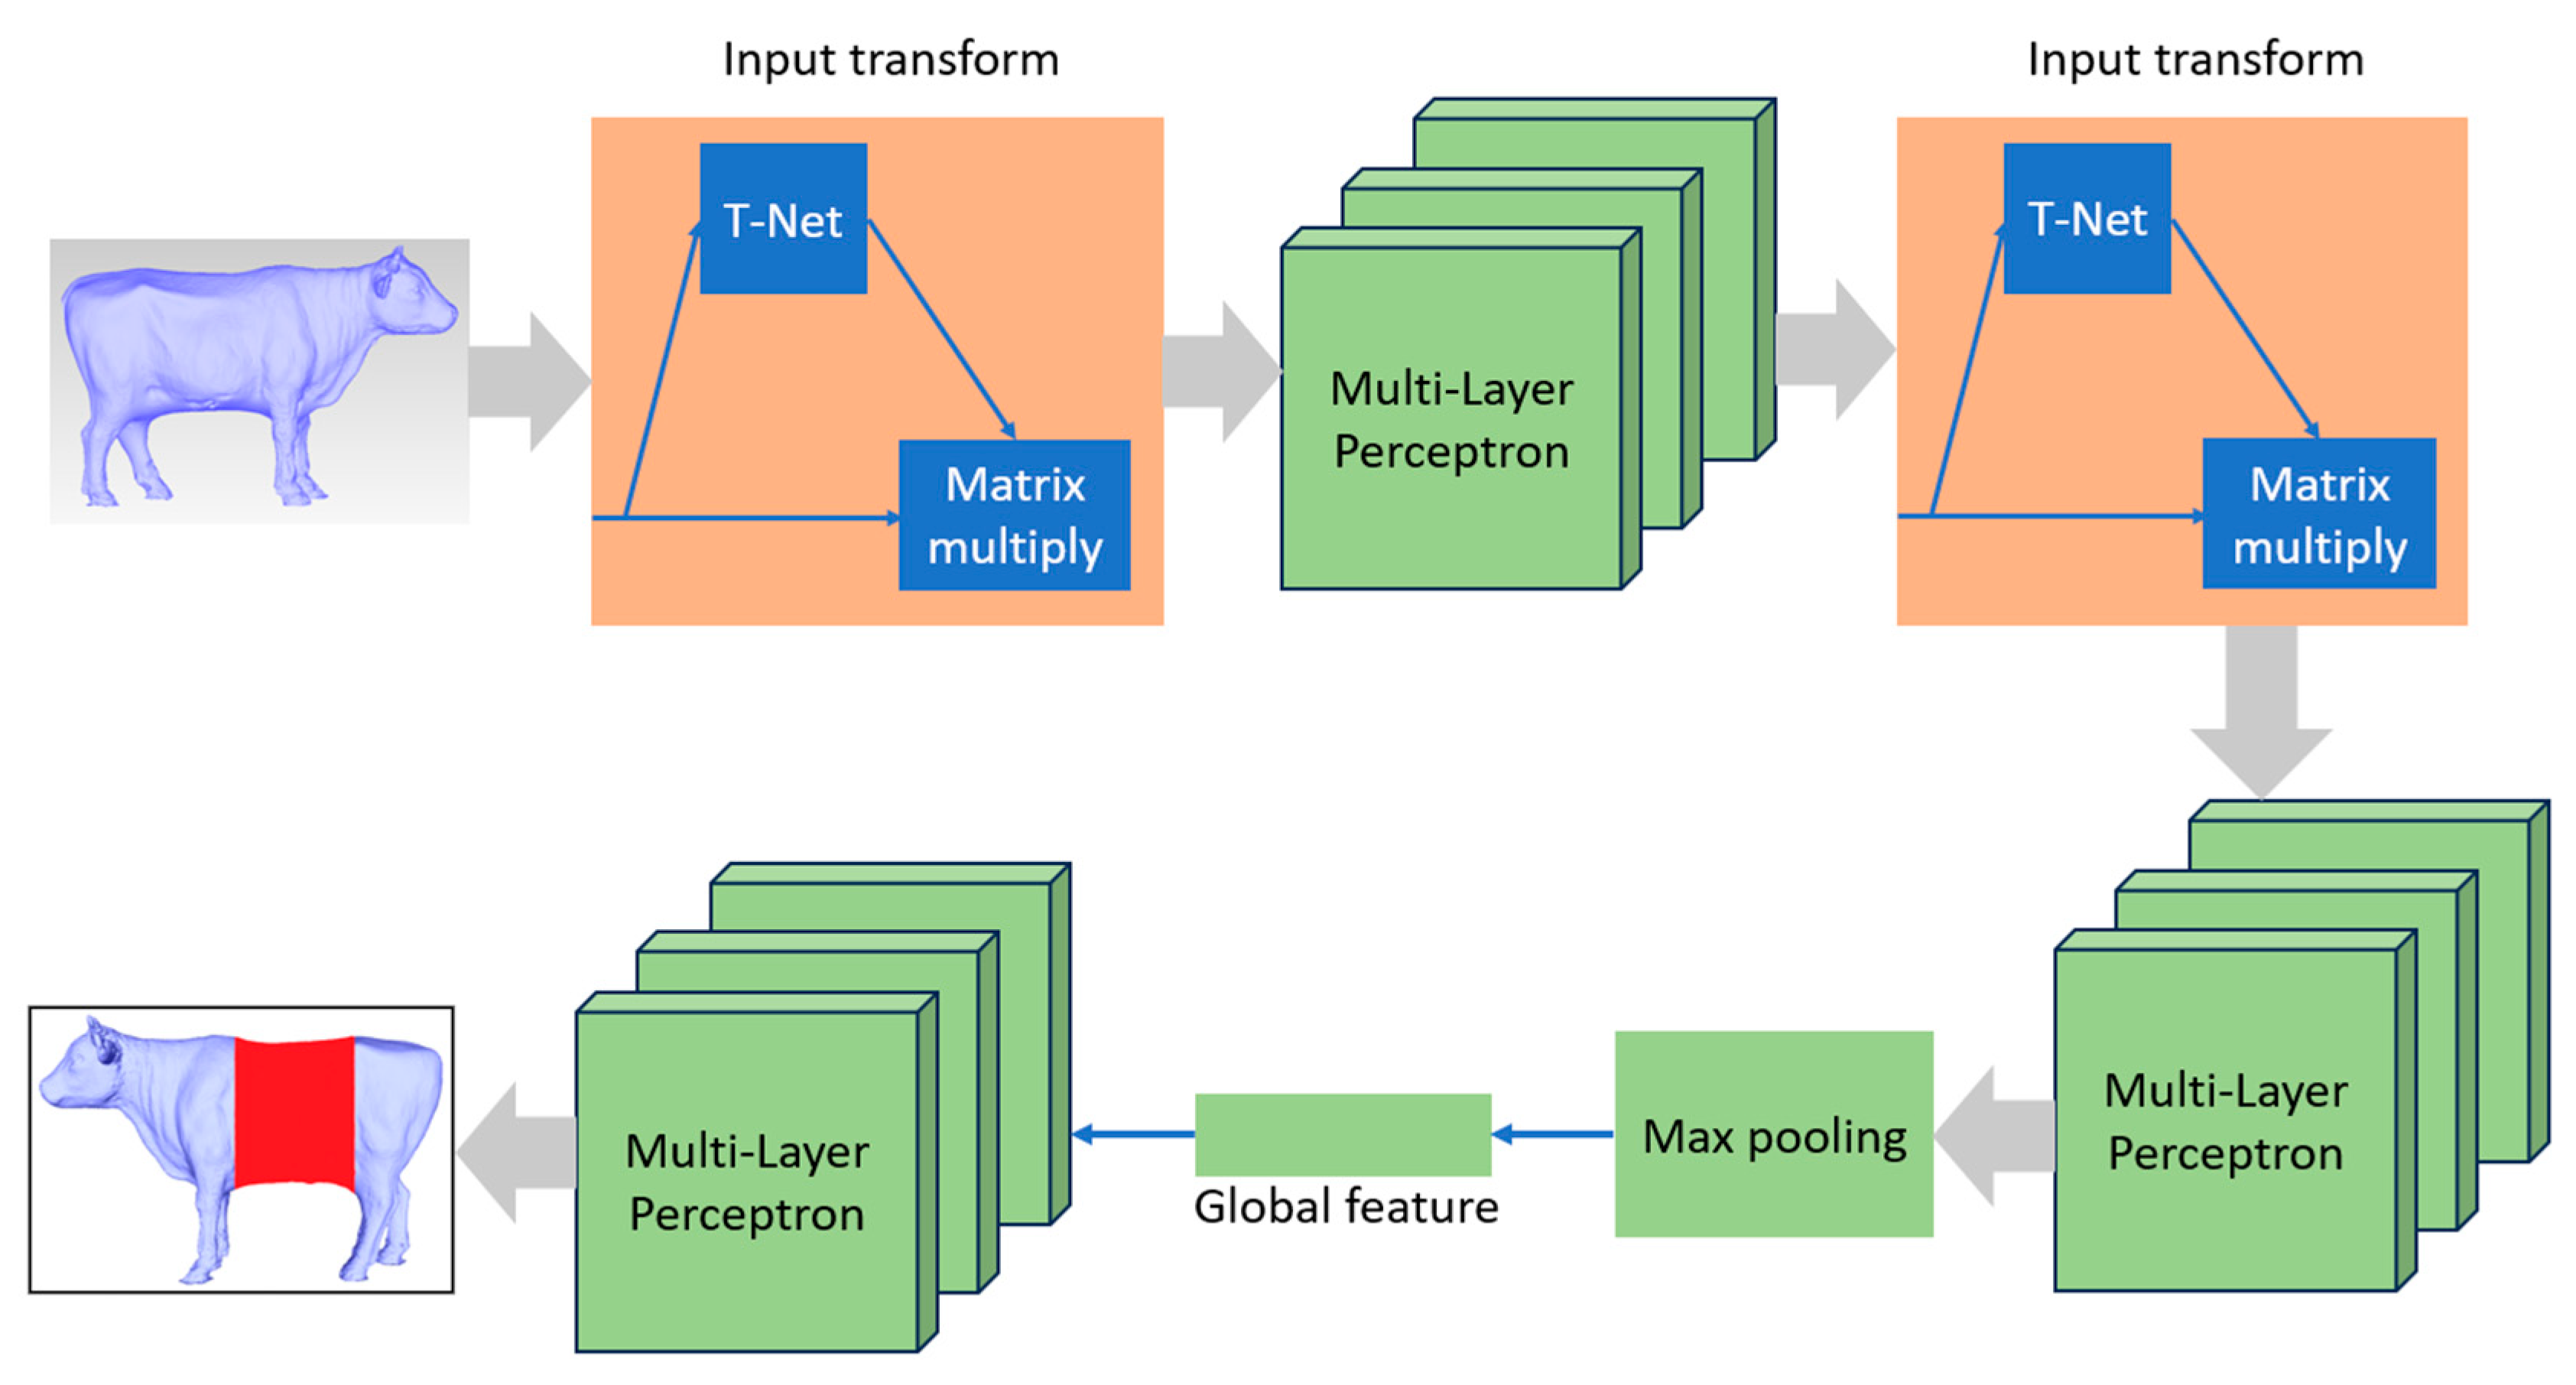
The architectural overview of PointNet, designed for point cloud segmentation tasks, is presented in
Figure 8. It incorporates an Input Transform network (T-Net) followed by a series of Multi-Layer Perceptrons (MLPs) for local feature extraction. The Input Transform network captures transformations to ensure the network's robustness to input point permutations, rotations, and translations. Subsequently, a Feature Transform network (T-Net) enhances the network's capacity to handle diverse point orderings. After local feature extraction, a global feature vector is derived through max pooling, enabling the network to aggregate information from the entire point cloud. This global feature vector is further processed by a set of MLPs to produce the final segmentation mask, which assigns class labels to each point. The combination of Input and Feature Transform networks empowers PointNet to effectively segment complex 3D data.
2.4. Regression Machine Learning
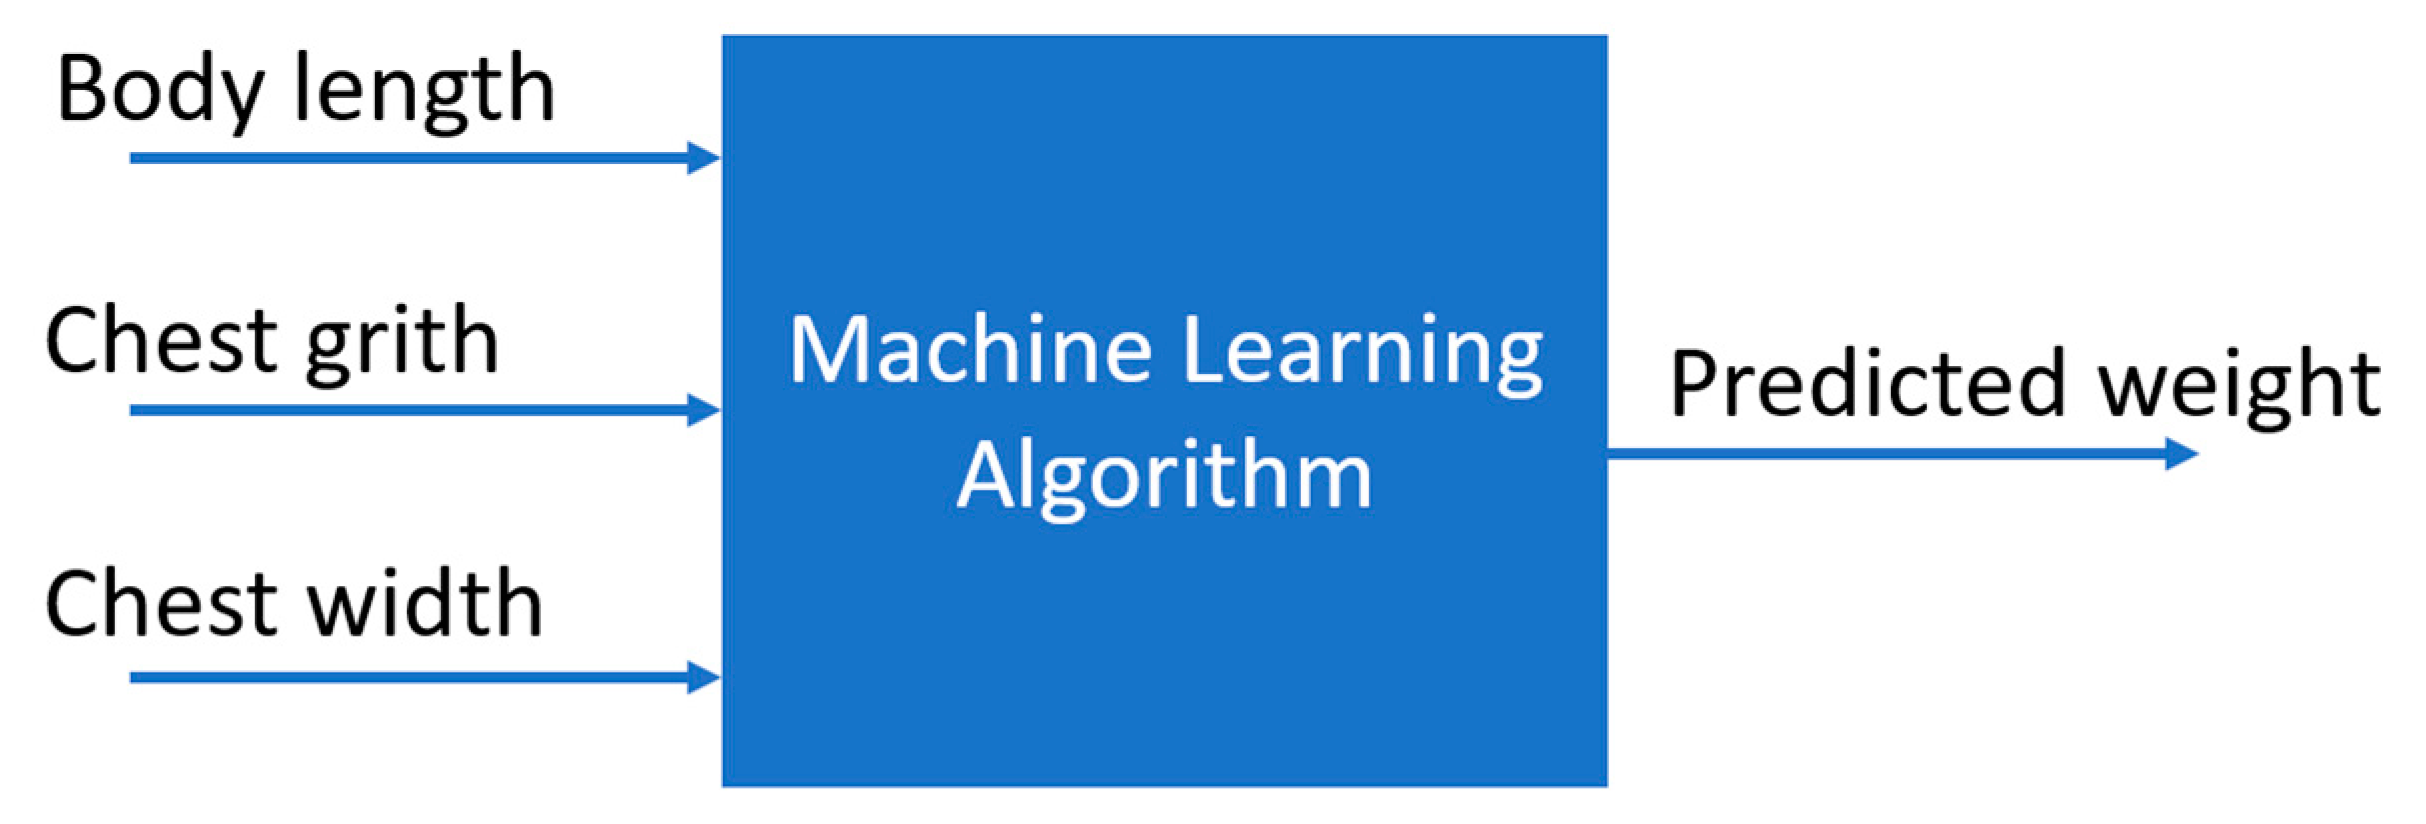
With three numeric inputs (body length, chest girth, chest width) and the numeric output of cattle weight, as illustrated in
Figure 9, regression models are the most appropriate choice. In this project, we have selected five prominent regression machine learning models for Korean cattle weight prediction, CatBoost regression, LightGBM, Polynomial regression, Random Forest regression, XGBoost regression.
2.4.1. CatBoost Regression
CatBoost [
19] is a renowned ensemble machine learning algorithm, particularly effective in regression tasks. It employs category-based optimization to enhance predictive accuracy and utilizes gradient boosting to iteratively construct decision trees, effectively reducing errors. Notable features of CatBoost include its intrinsic handling of categorical data, adept feature selection, and strategies to prevent overfitting. The algorithm also demonstrates efficiency in real-world applications, offering support for parallel computation and fine-tuned hyper parameter optimization.
2.4.2. Light Gradient Boosting Machine
Grounded in gradient boosting techniques, LightGBM [
20] meticulously constructs decision trees to iteratively correct errors. Its innovation lies in histogram-based algorithms and leaf-wise tree growth, ensuring computational efficiency. LightGBM further employs gradient-based one-side sampling and exclusive data filtering to enhance robustness and mitigate overfitting. Its parallel processing capabilities make it an excellent choice for regression tasks.
2.4.3. Polynomial Regression
Polynomial regression [
21] extends linear regression by incorporating basic mathematical functions. This algorithm is particularly useful for handling nonlinear data by employing linear factors. It demonstrates the capability to work effectively with a wide range of nonlinear data while maintaining efficiency comparable to linear functions.
2.4.4. Random Forest Regression
Random forest [
22] is an ensemble learning technique based on decision tree models. During training, it builds a collection of decision trees, with each tree constructed independently and accessing a random subset of the training data. The use of random subsets of data and features helps prevent overfitting, contributing to the model's robustness.
2.4.5. Extreme Gradient Boost Regression
Extreme Gradient Boost Regression (XGBoost) [
23] is another ensemble learning technique rooted in the gradient boosting framework, primarily applied to regression tasks. XGBoost iteratively refines predictive models by constructing a series of decision trees, each correcting the errors of the previous iteration. It is distinguished by its incorporation of sophisticated L1 and L2 regularization techniques to mitigate overfitting and maintain model parsimony. XGBoost is also known for its robust handling of missing data.
2.5. K-Fold Cross-Validation
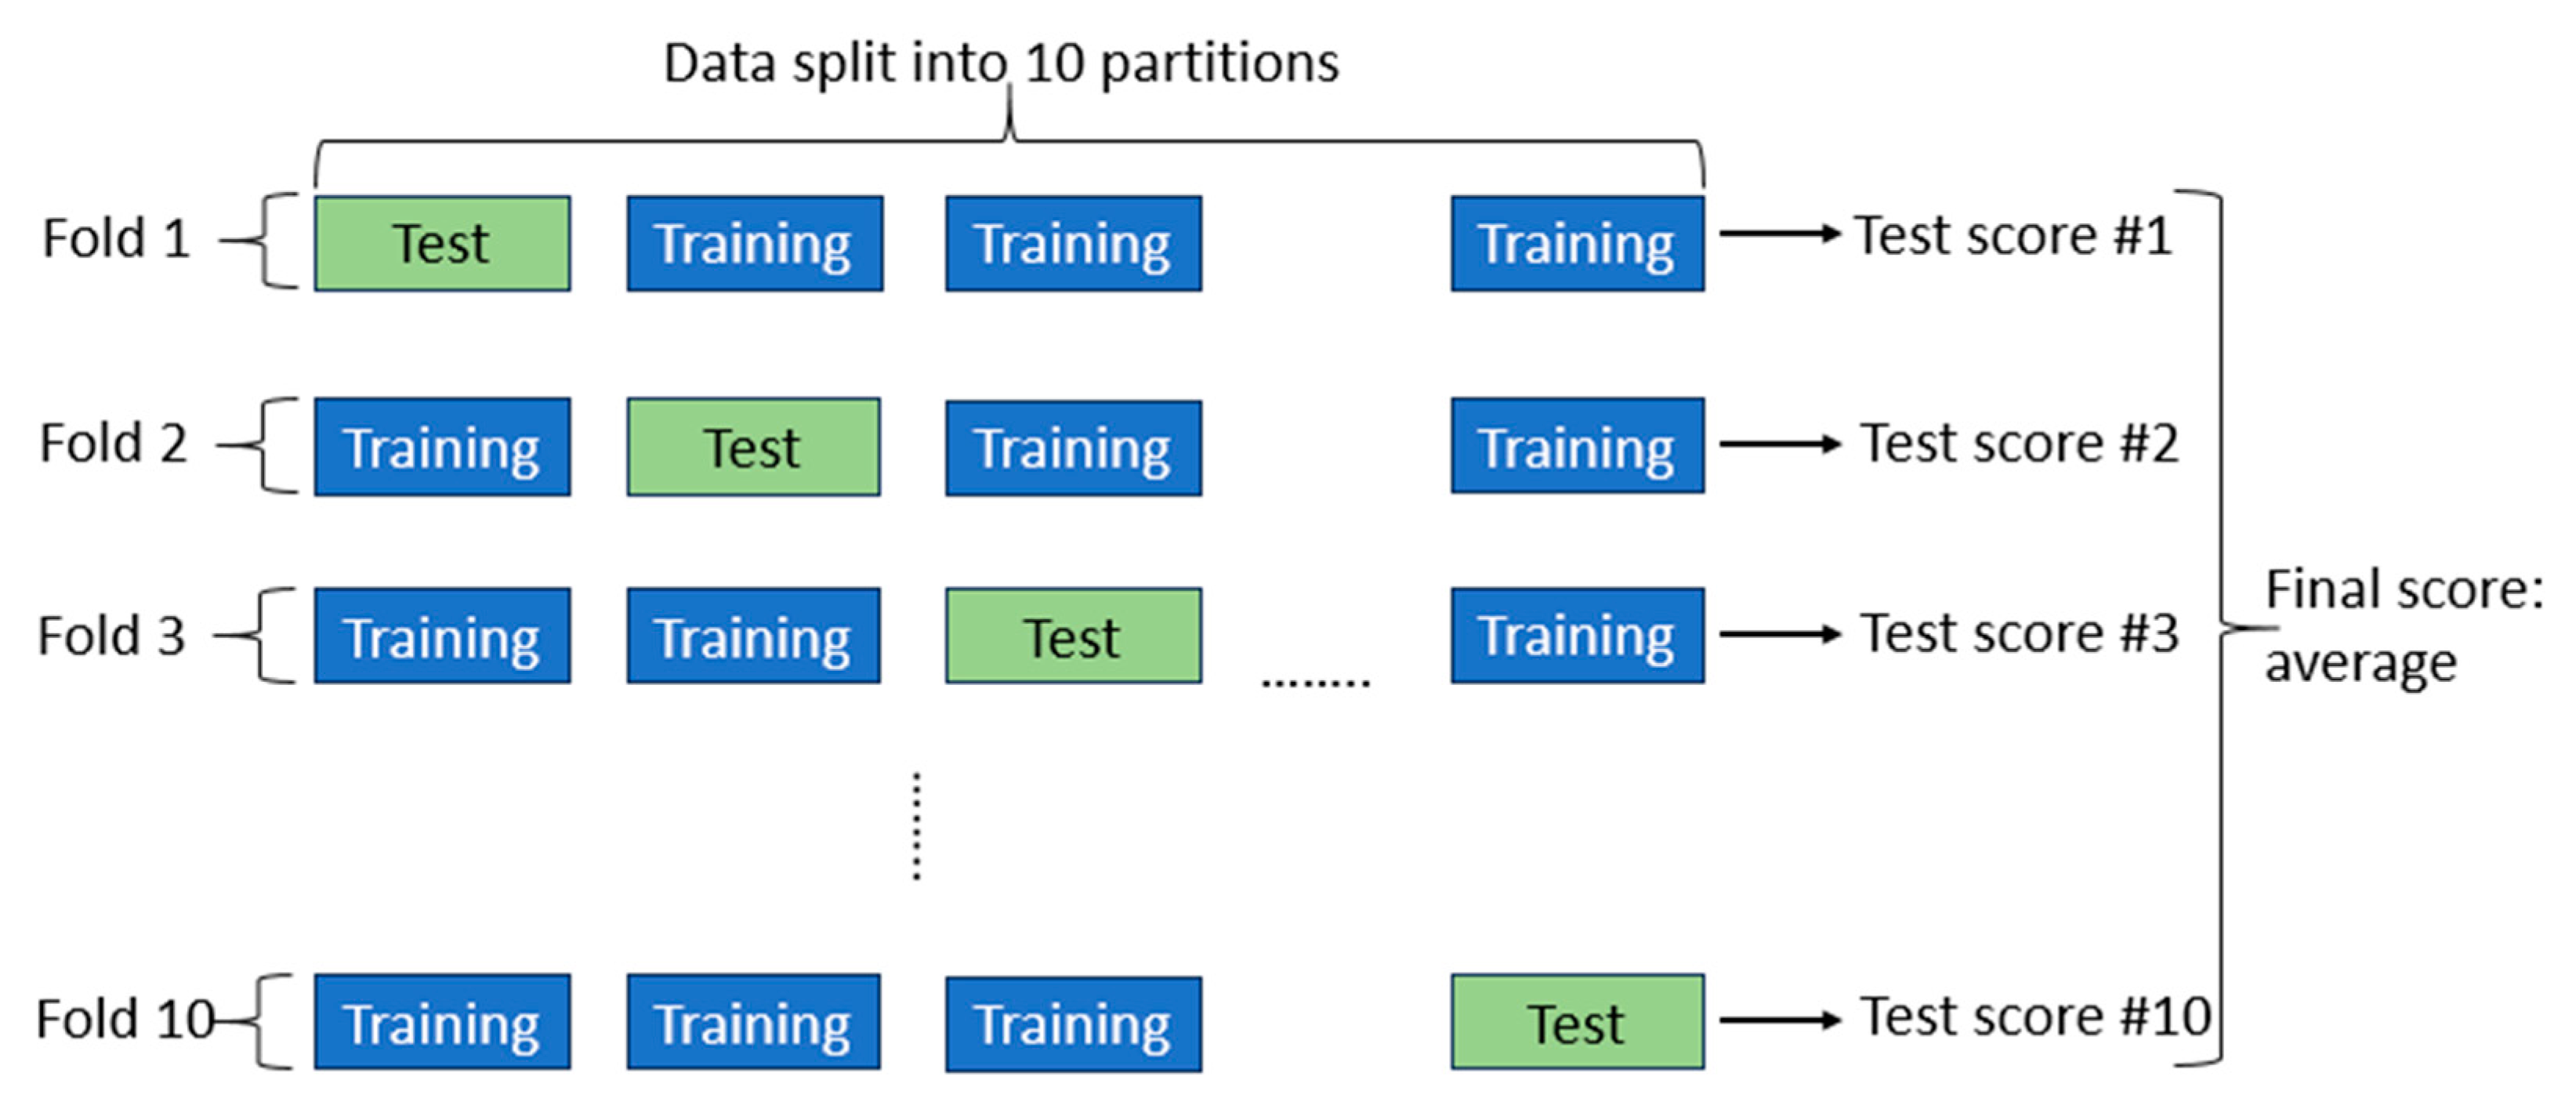
To assess the performance of the chosen machine learning models, we employed K-fold cross-validation. The data were randomly divided into ten partitions of equal size (k=10). For each partition (p), we trained the selected machine learning models on the remaining nine partitions and subsequently tested the models on partition (p). The final score was computed as the average of all ten scores obtained. The schematic of K-fold validation with k=10 is depicted in
Figure 10.
3. Experiments
3.1. Segmentation
3.1.1. Cross-Sampling Augmentation
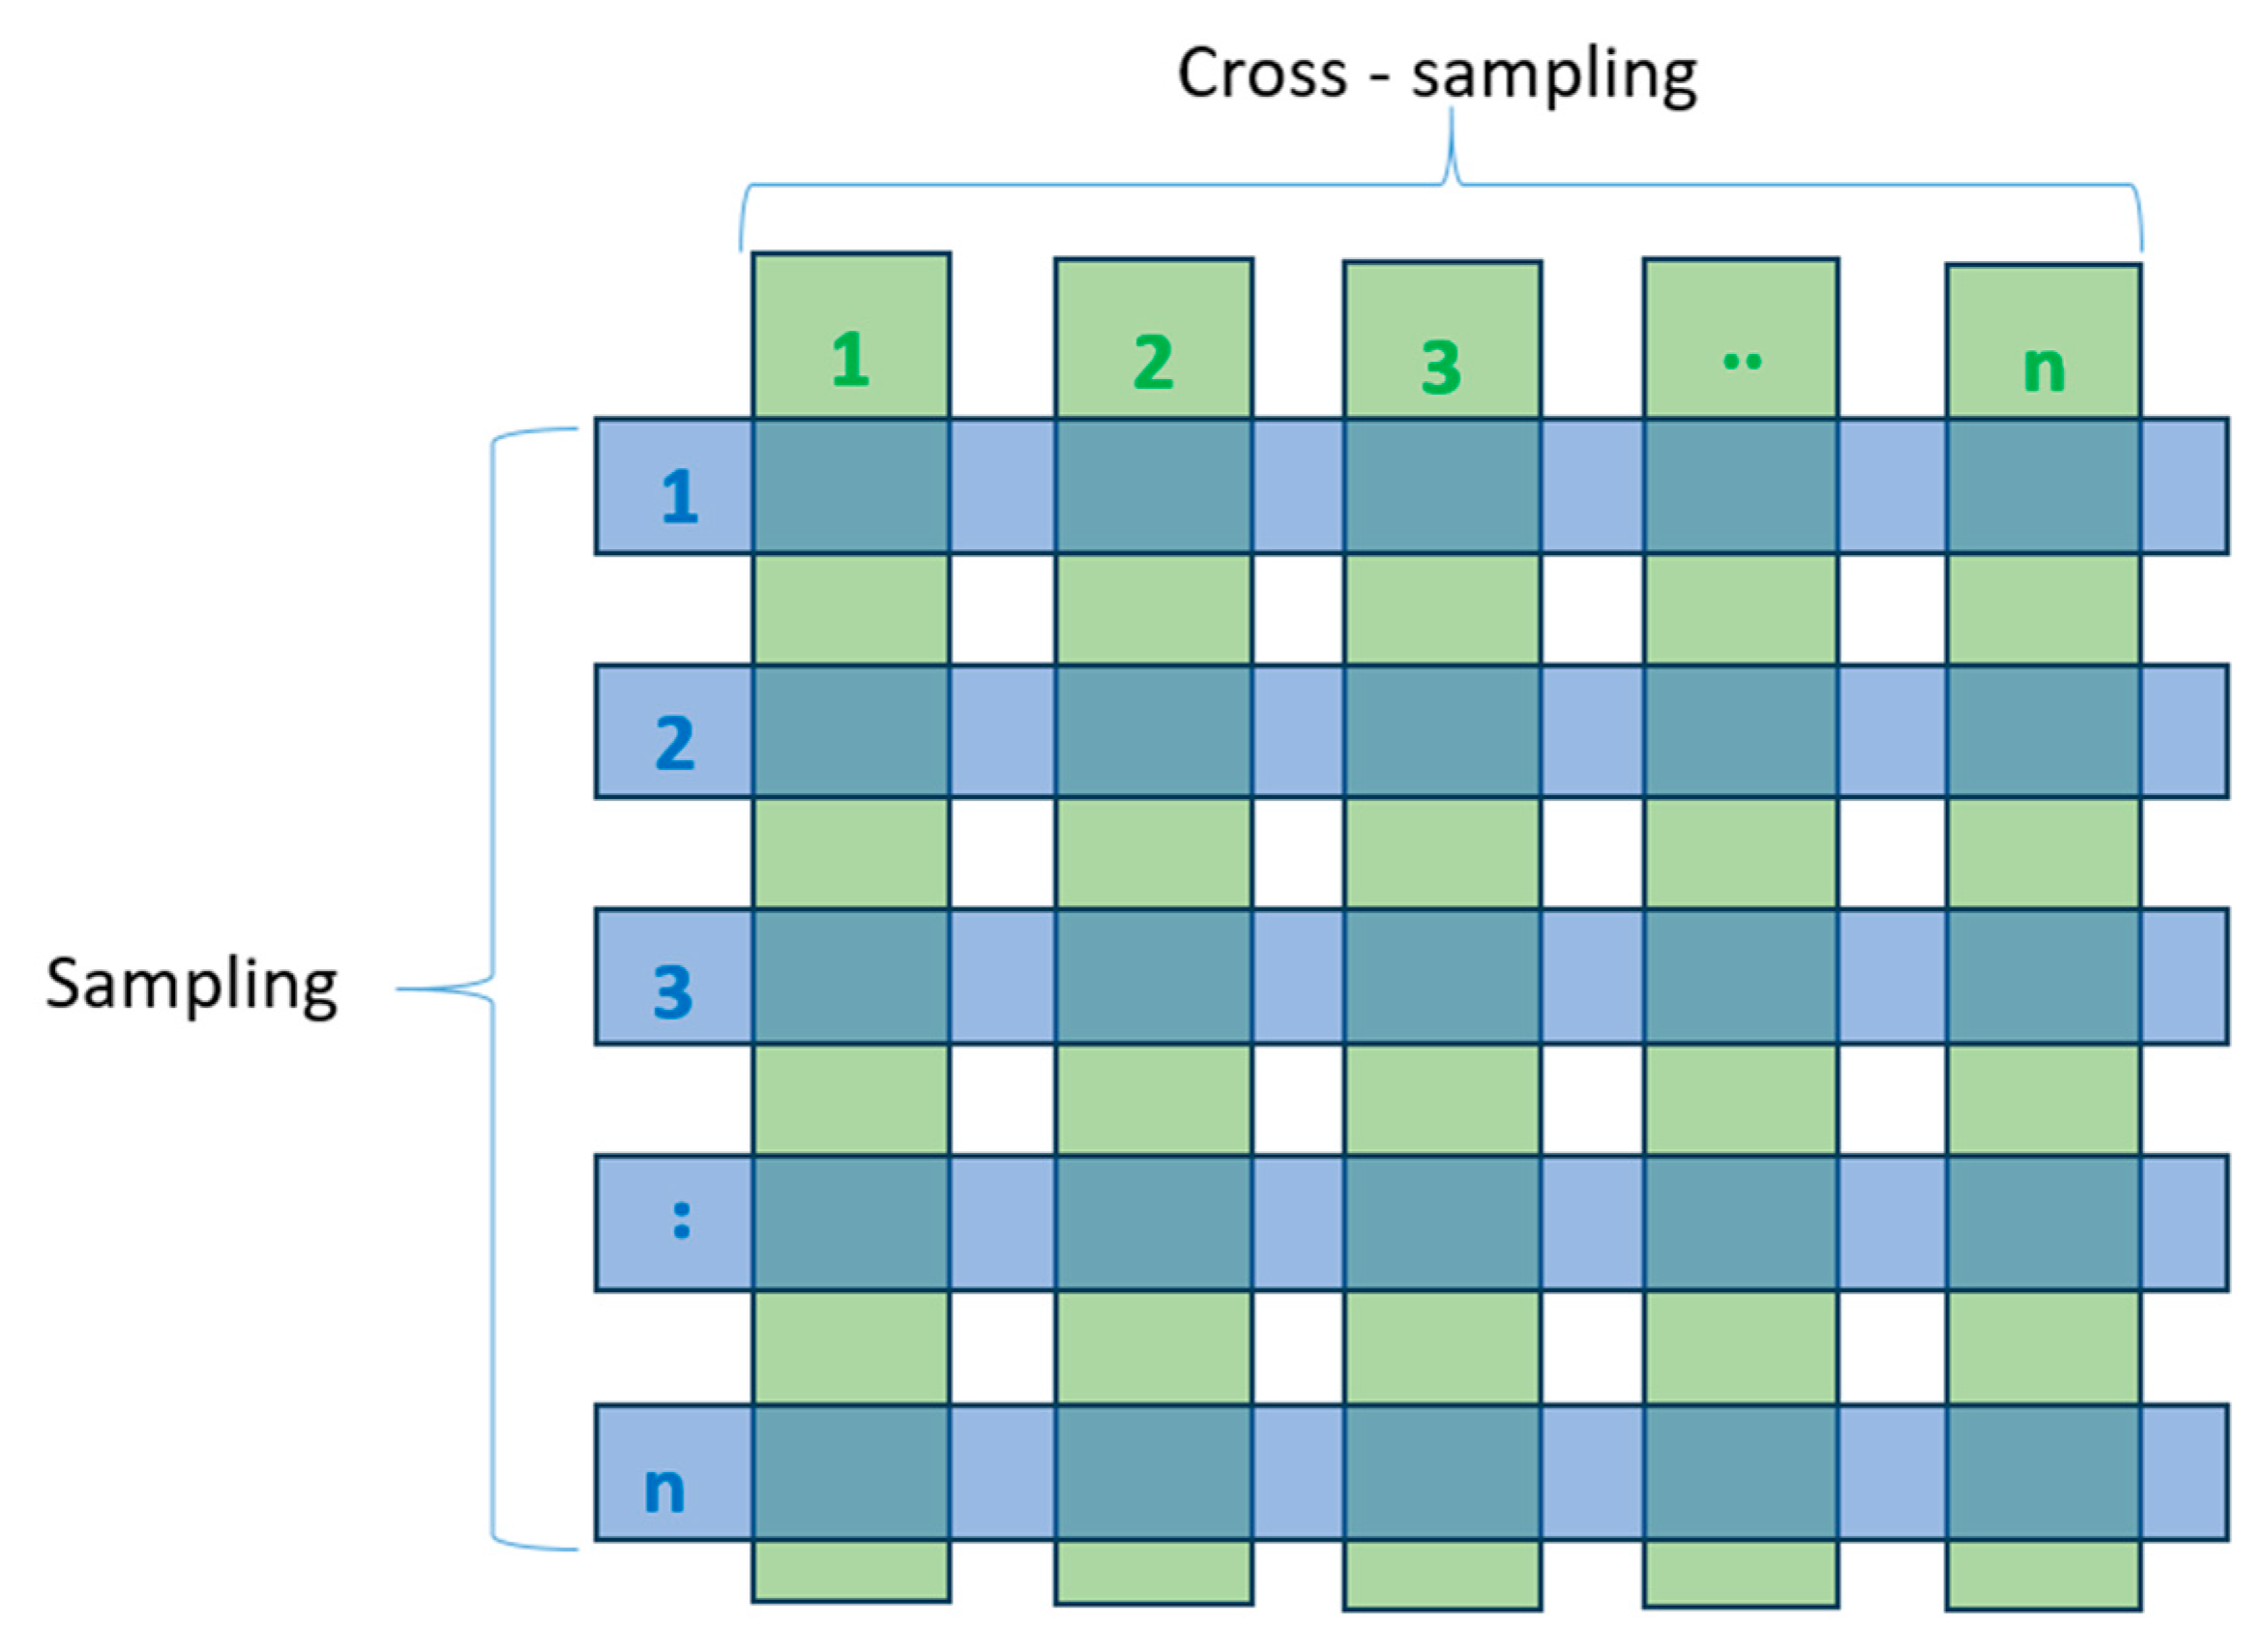
Building deep learning models always necessitates a substantial number of labeled samples for train process. In the case of 3D PointNet networks, achieving high model accuracy demands training on thousands of samples. However, manual labeling of thousands of samples is an exceedingly labor-intensive task. To address this challenge, we have introduced an augmentation method named as cross-sampling.
The cross-sampling process is illustrated in
Figure 11. Starting with each 3D Korean cattle data sample, we conducted down-sampling with a resolution of 0.1 mm. Following down-sampling, each the 3D cattle data typically contains between 11 thousand to 12 thousand points. We partitioned it into ten segments, each consisting of 1024 points (PointNet with 1024 input was selected for this project). This process yielded ten sparse point clouds for each original sample. Subsequently, we further divided each sparse point cloud into ten segments and recombined them to create an additional ten samples, distinct from the previous set. Through this approach, with each original 3D mesh data, we generated twenty sparse point cloud samples, each consisting of 1024 points.
The segmentation process unfolded in the following manner. We manually labeled 100 cattle models. By employing cross-sampling augmentation, we expanded our dataset to include 2000 samples.
3.1.2. Feature Extraction
To verify the accuracy of segmentation process, we employed global accuracy metric [
24], which is defined as below:
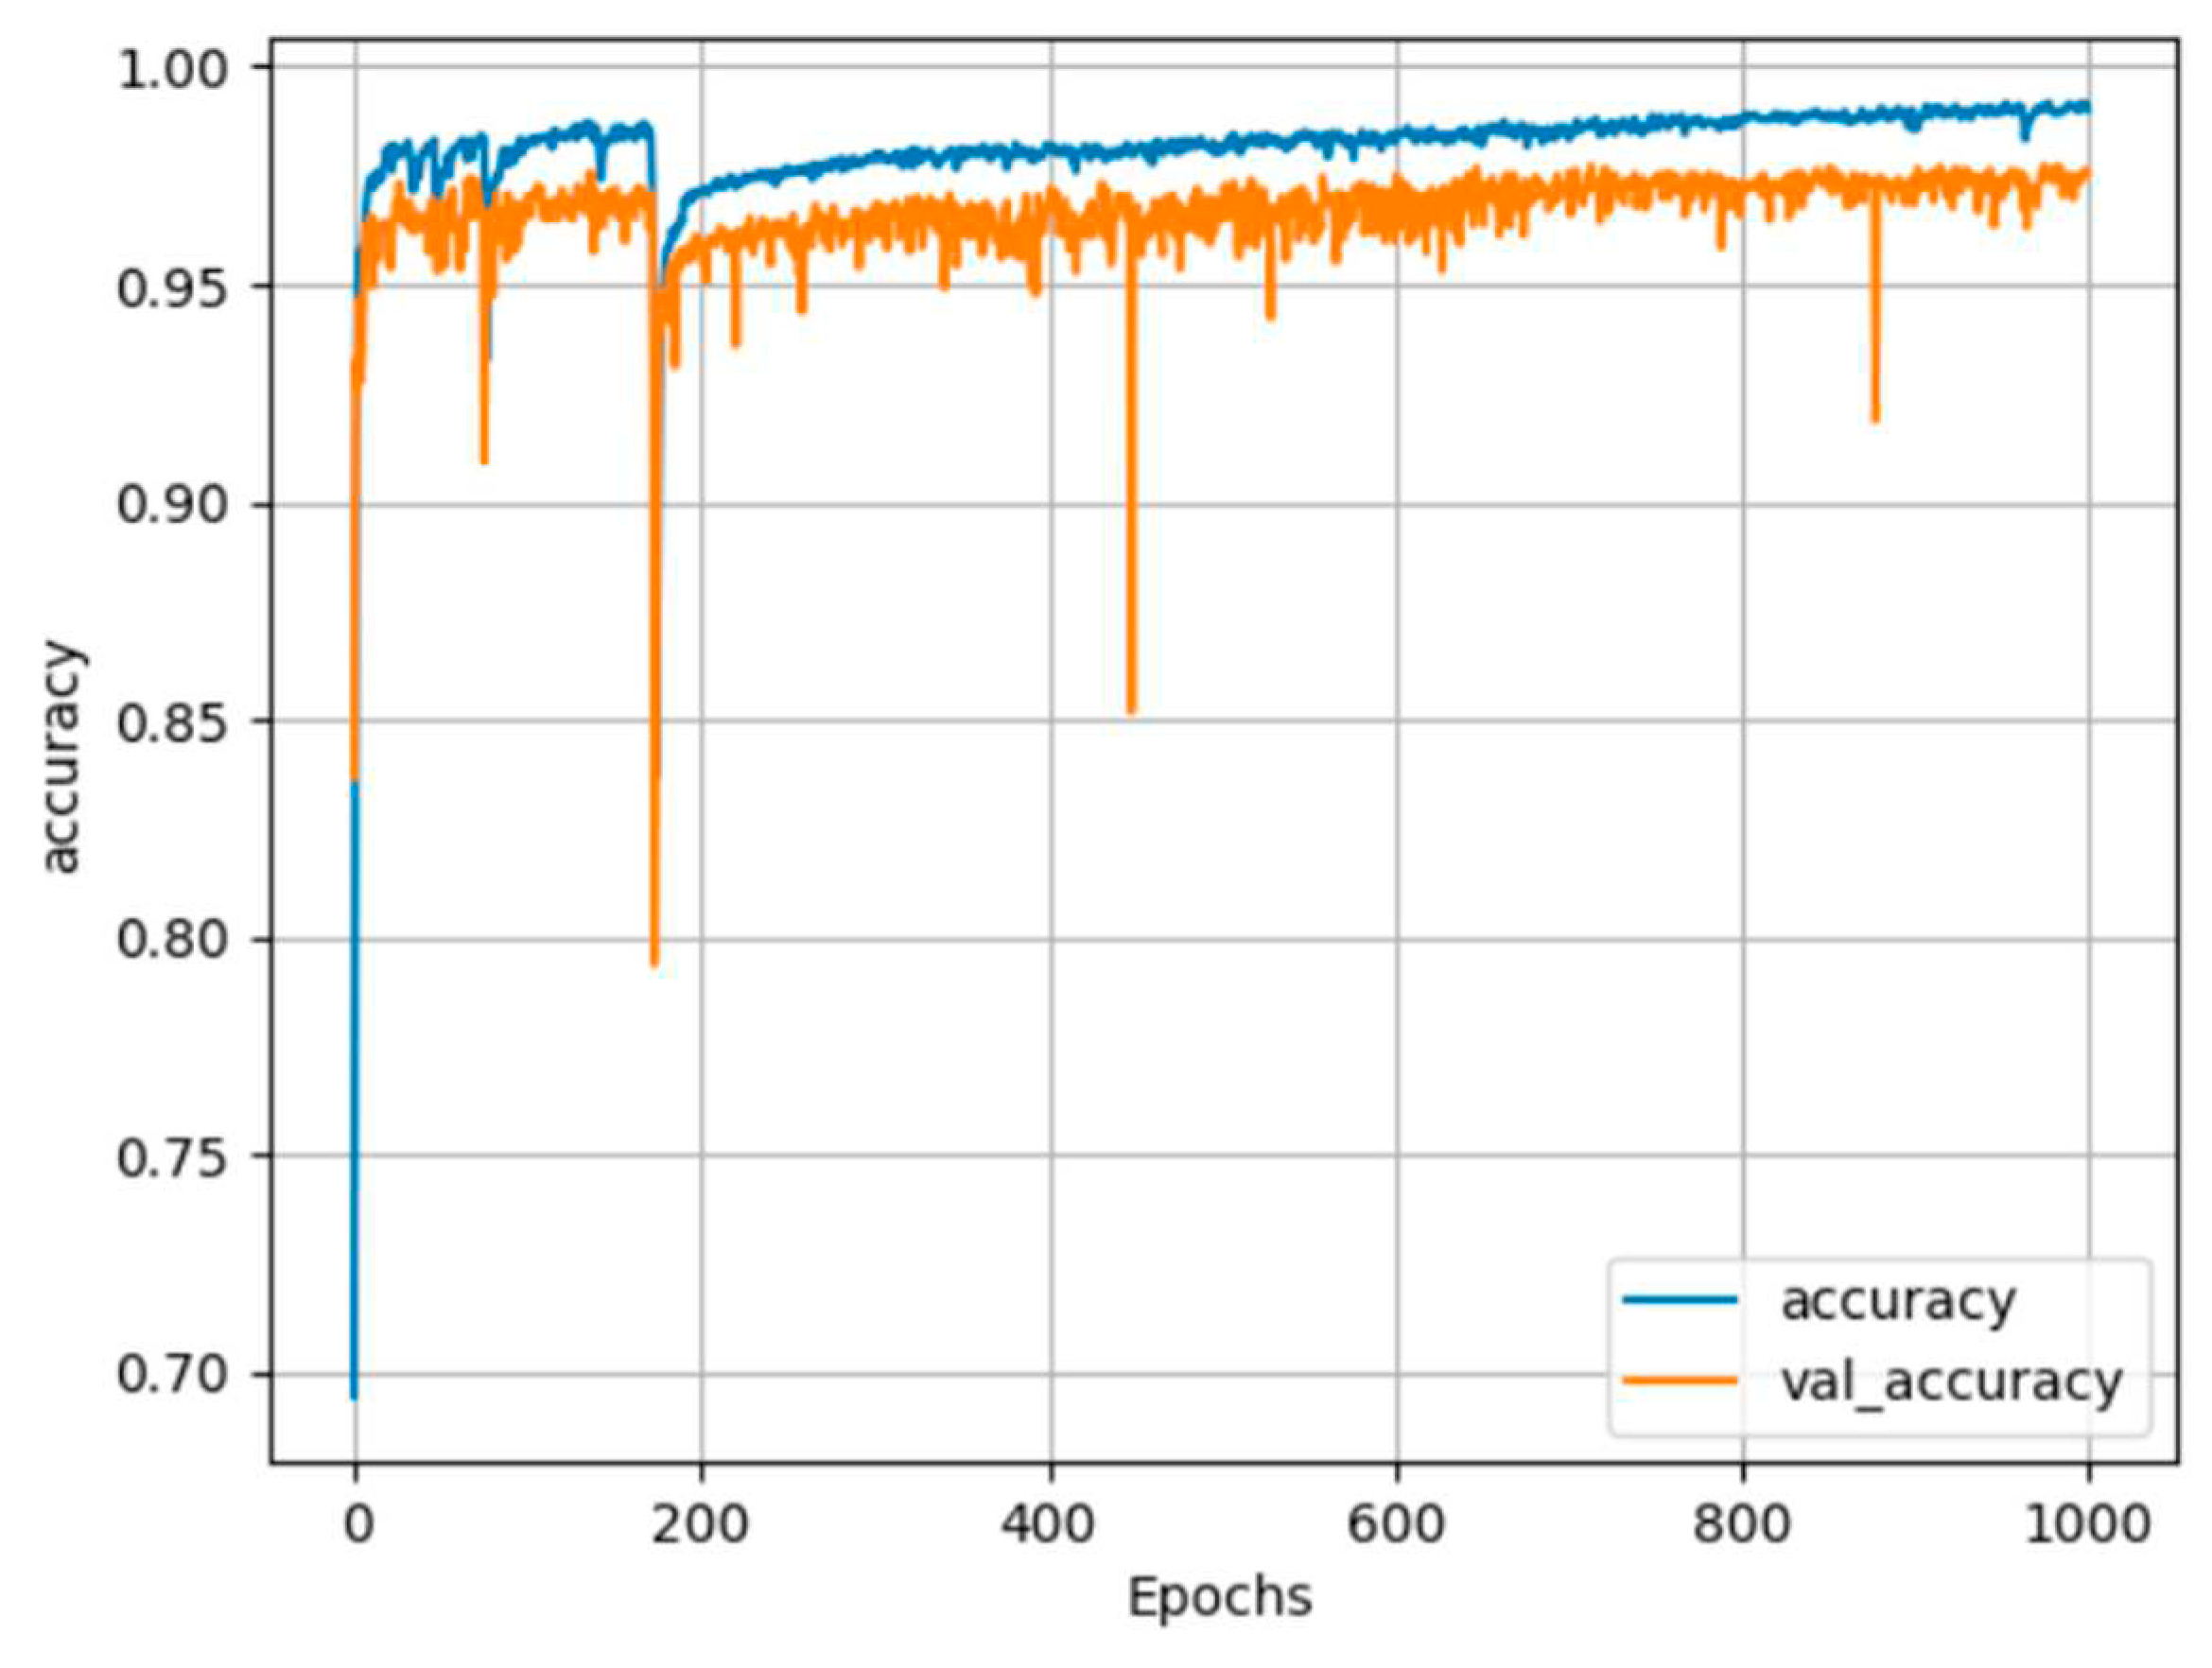
The experiments were conducted on a computational workstation equipped with a CPU Core-i9 3.5GHz and an NVIDIA 3060Ti GPU with 8GB of memory. For deep learning, we chose the TensorFlow 2.1.0 framework [
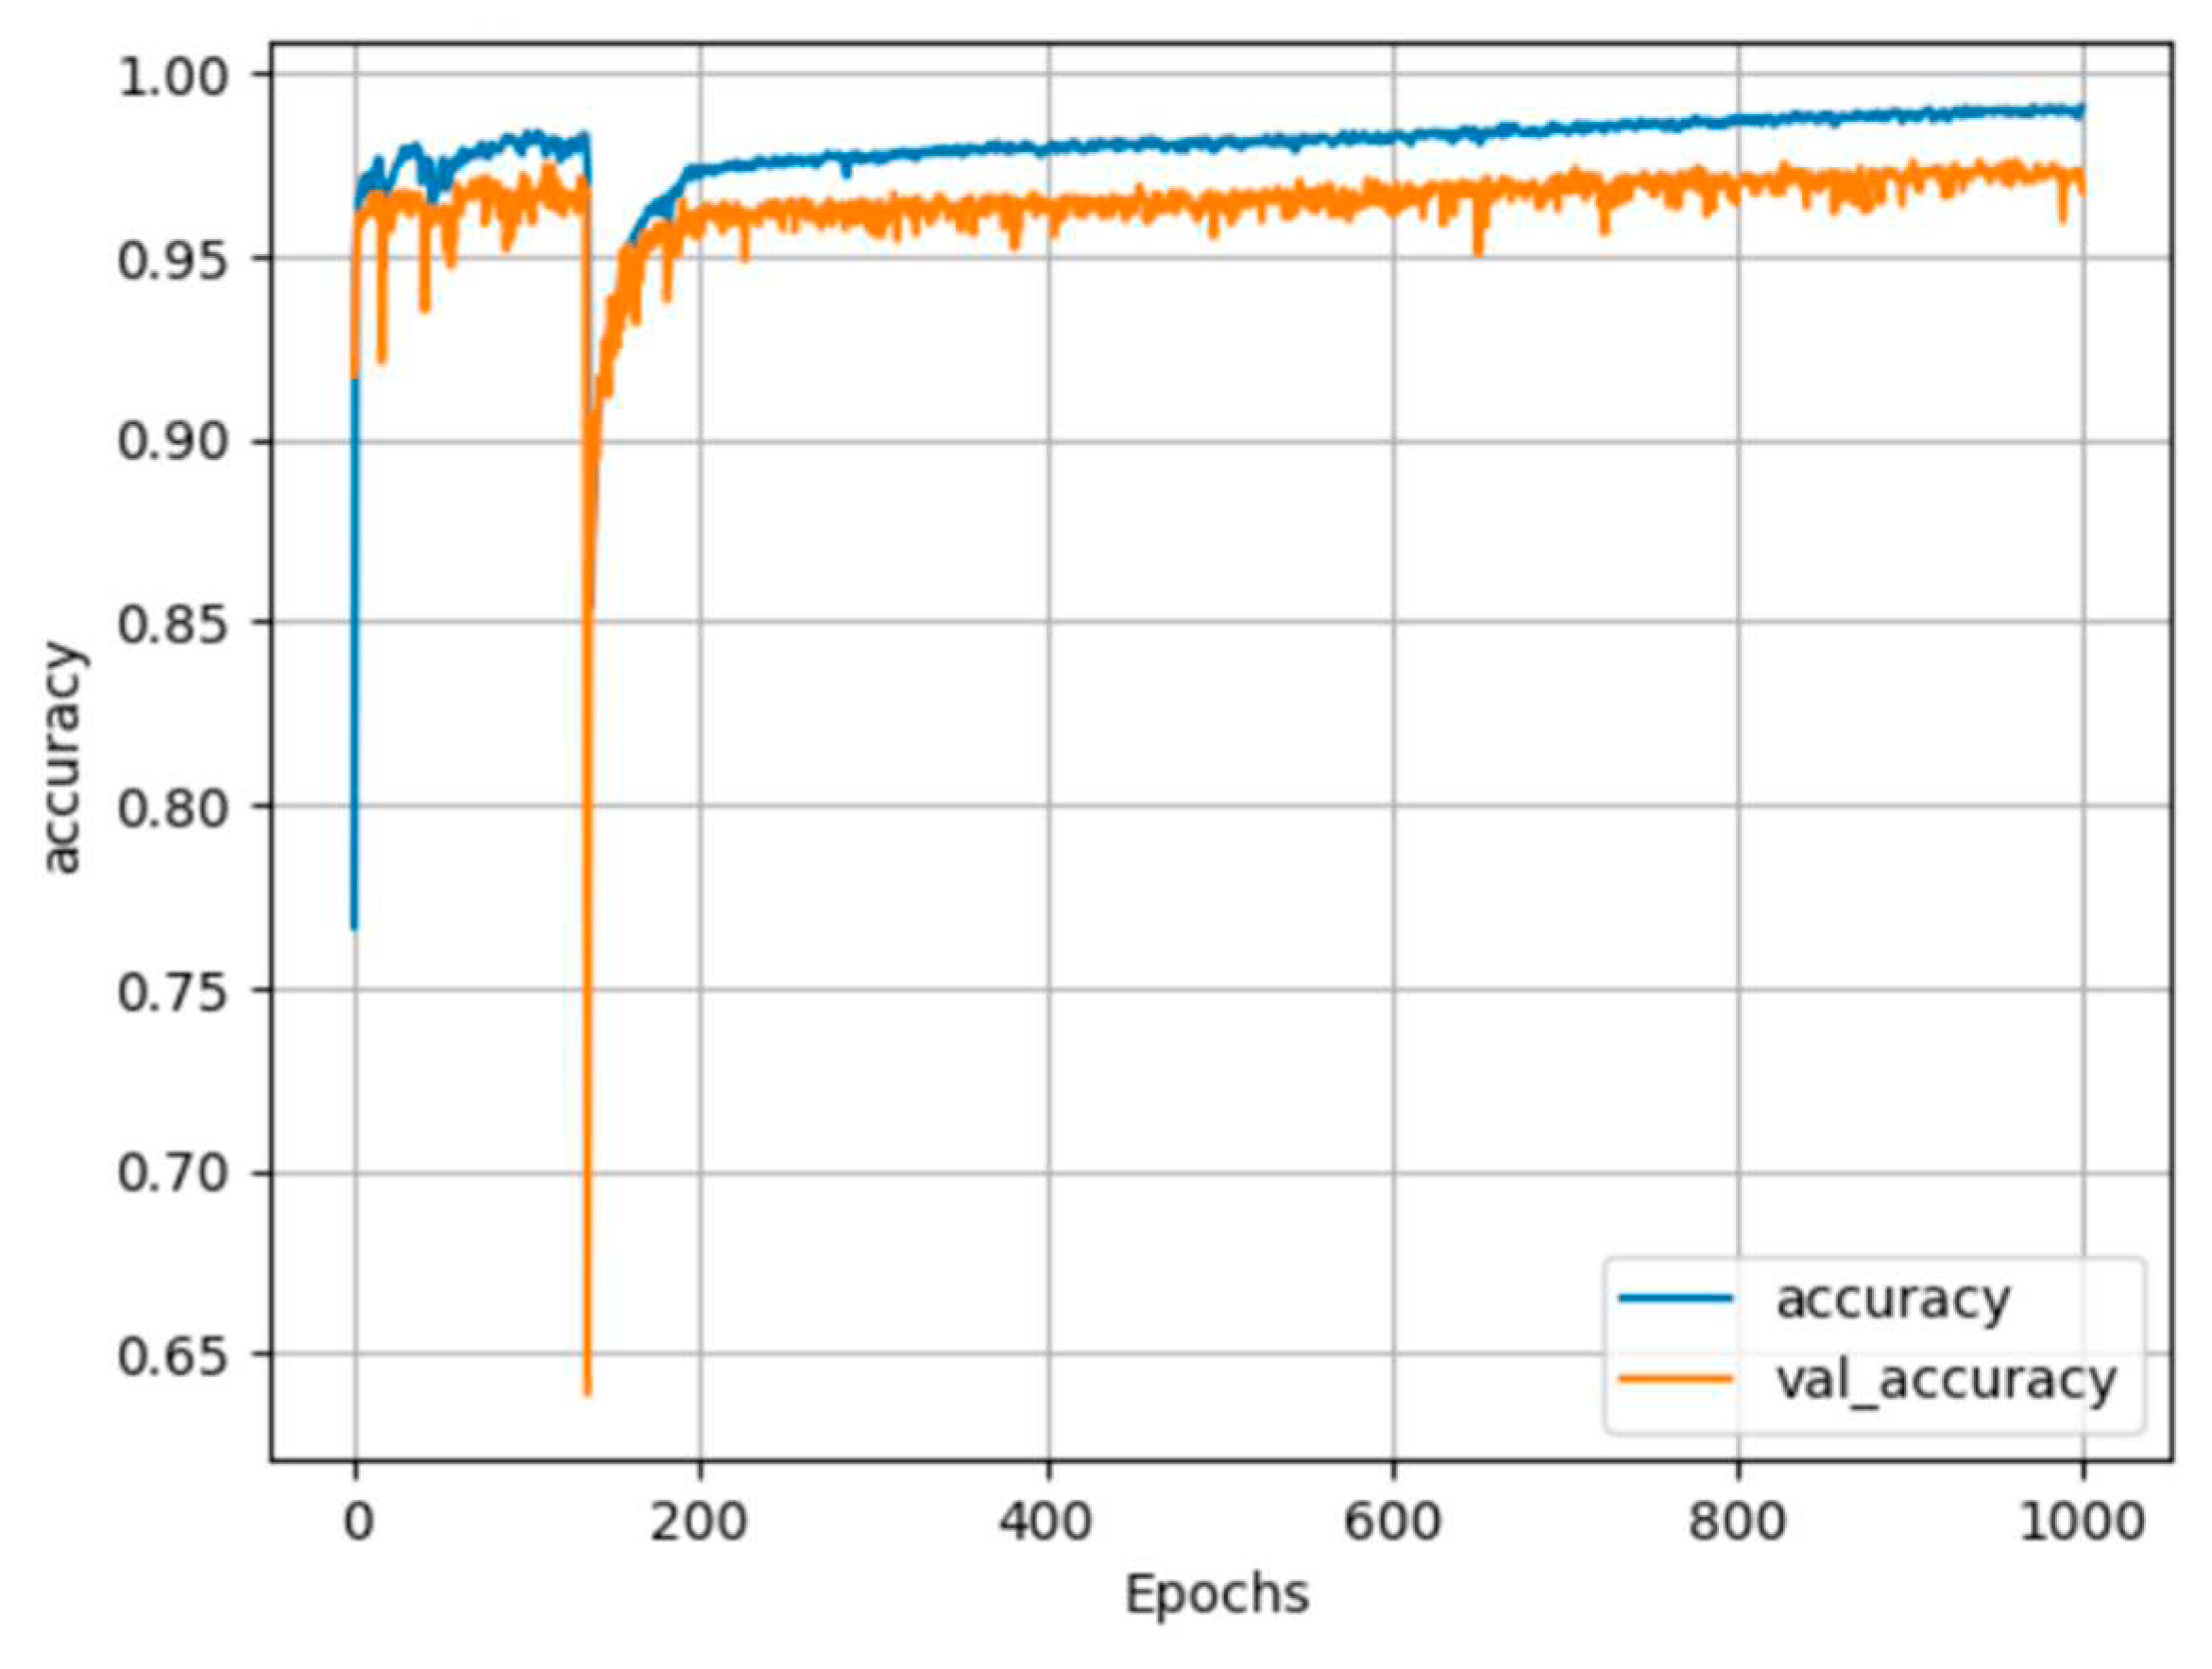
25] and CUDA 11.0. The network parameters included the use of the adaptive moment estimation optimizer (Adam), a batch size of 64, 1000 training epochs, and a learning rate of 0.001. Only the best weights were saved during training. The records of the training history are displayed in
Figure 12 and
Figure 13, and the accuracy results are summarized in
Table 2.
In
Figure 12 and
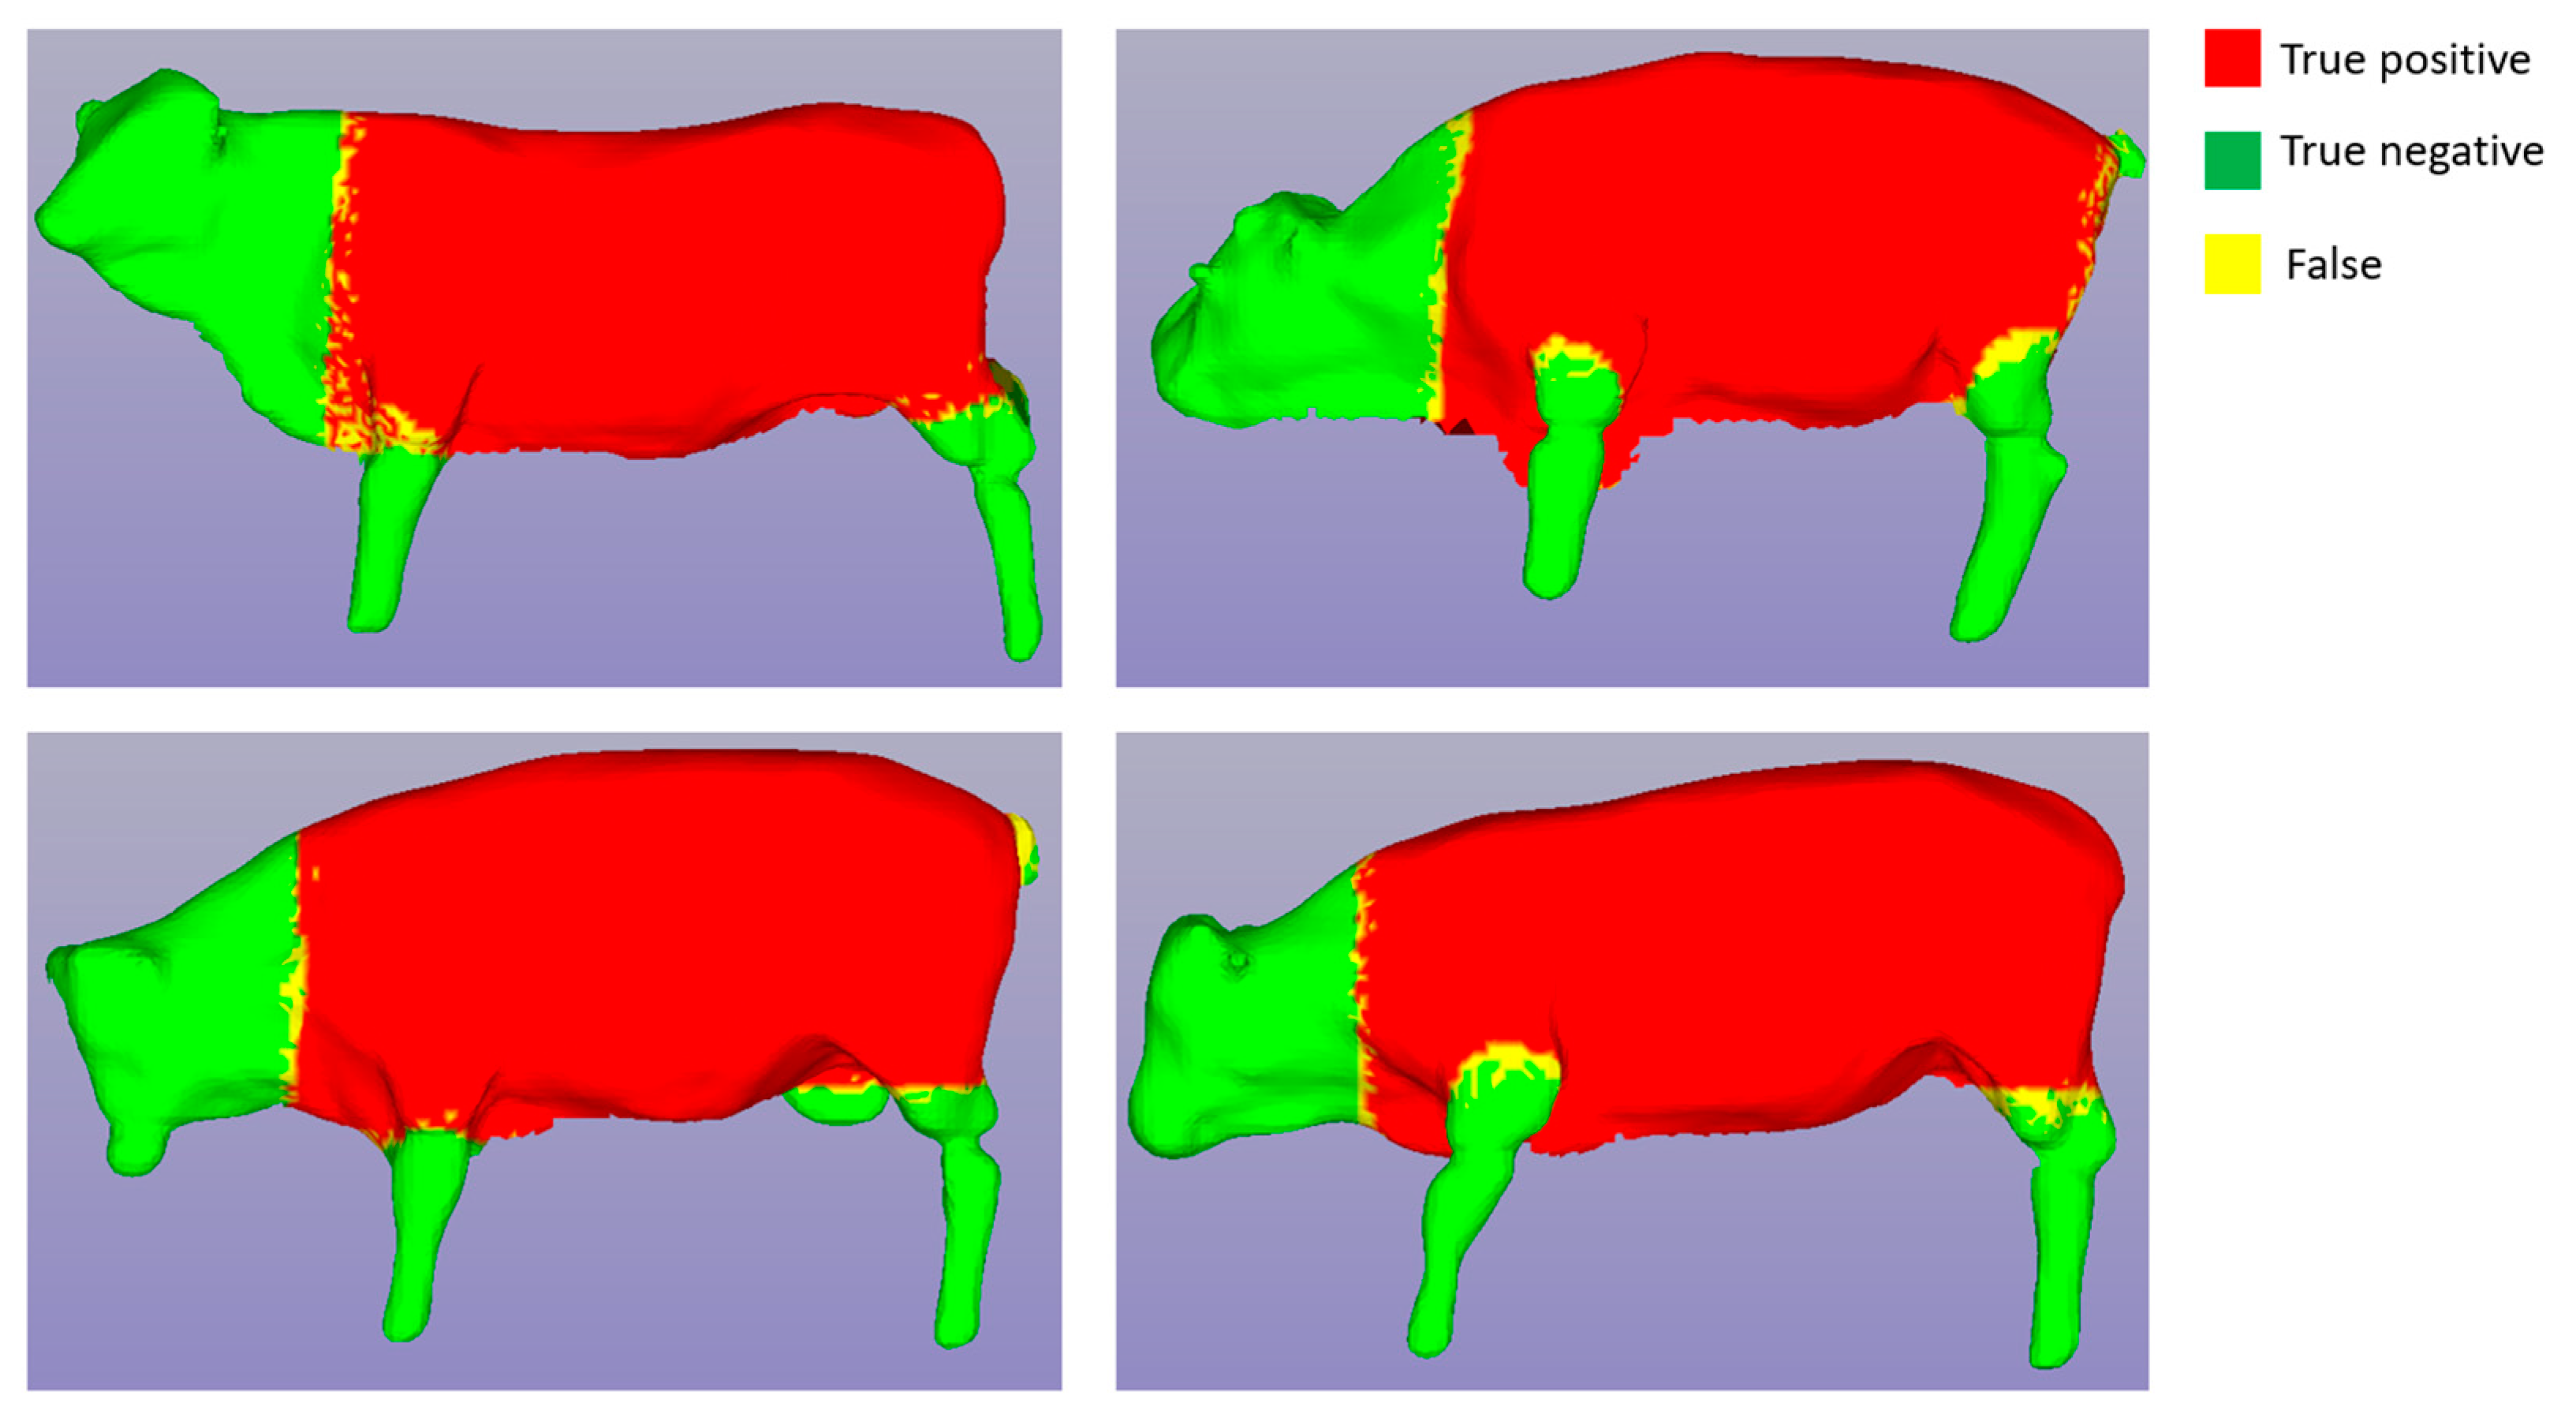
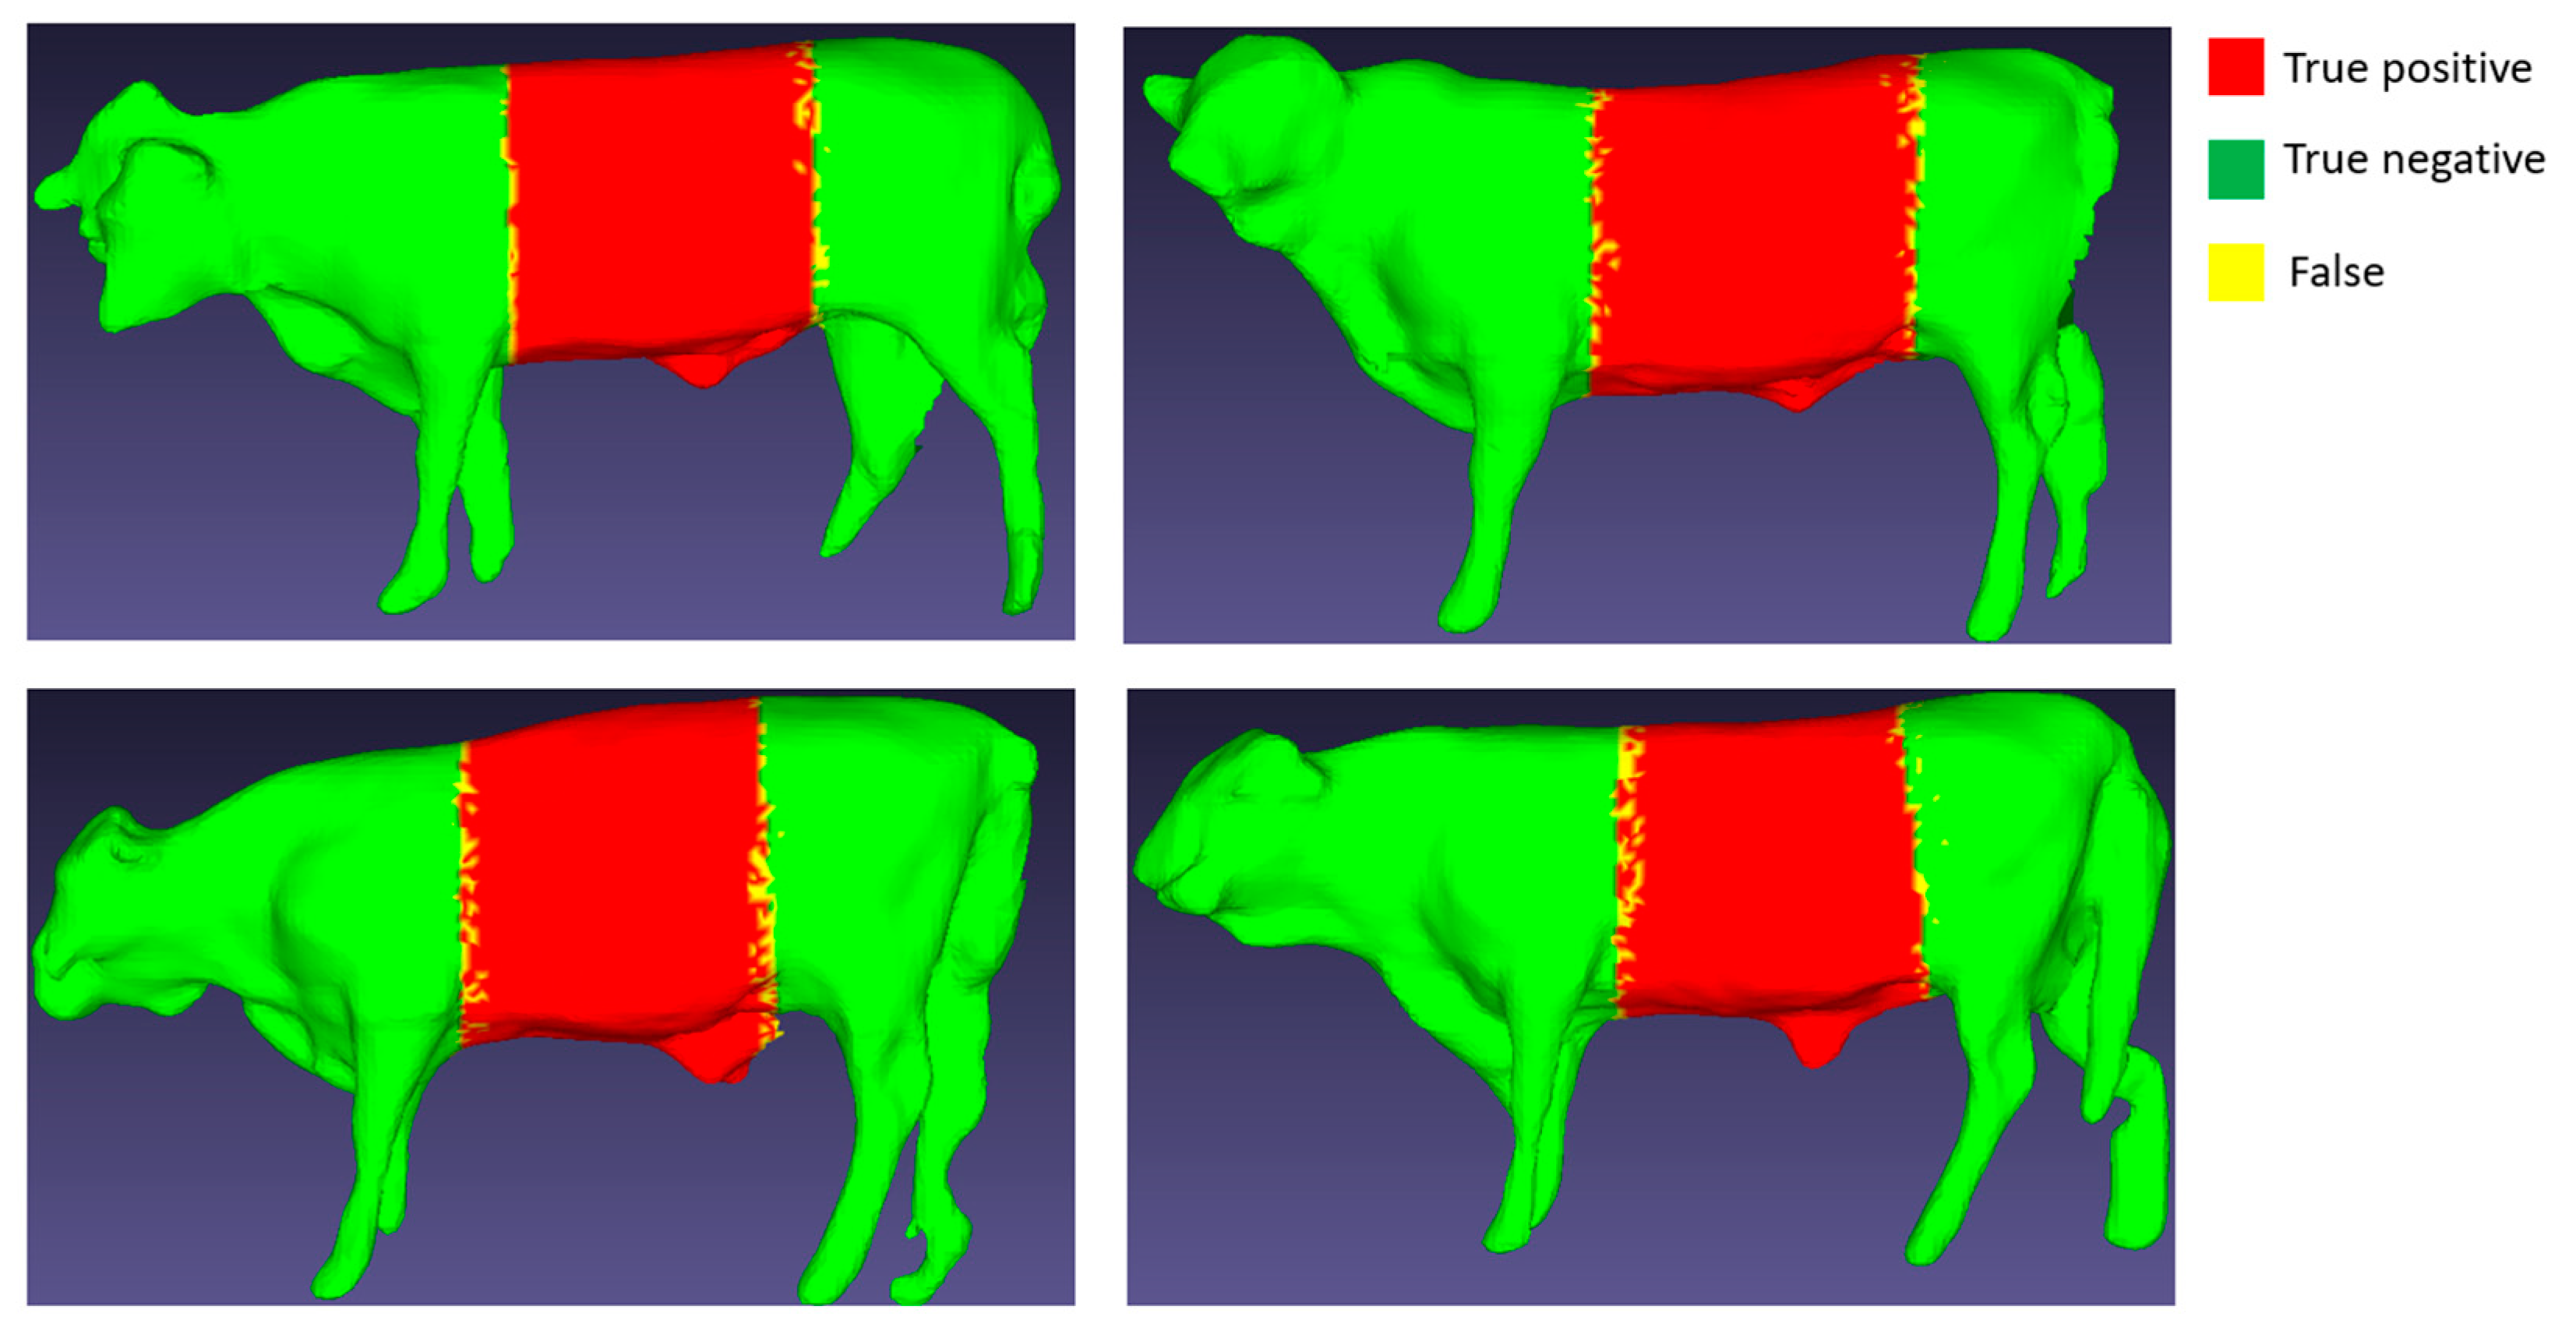
Figure 13, the blue line represents the training process, while the orange line represents the testing process. The training process stabilized after approximately 400 epochs, resulting in a training accuracy of 99% and a testing accuracy of 97% for both segmentation cases. We applied the trained segmentation models to perform 3D cattle segmentation, and the results are visualized in
Figure 14 and
Figure 15.
In
Figure 14 and
Figure 15, the red area represents “True positive”, the green area represents “True negative”, and the yellow region indicates False (“False positive” or “False negative”). It's noteworthy that the yellow area occupies a very small proportion at the border between the red and green areas, which has a negligible impact on the subsequent size measurement.
To achieve accurate measurements of Korean cattle's body dimensions, it's essential for the cattle to be in an upright position from head to tail. However, in reality, cattle often stand in a tilted position. To address this, we corrected the cattle's posture both horizontally and vertically using rendered silhouettes derived from the 3D segmented torso.
We employed the Principal Component Analysis (PCA) method [
26] for posture correction. The process involved extracting contour points from an image, calculating the centroid of these points to center the data, creating a covariance matrix to understand the relationship between x and y coordinates, and computing the eigenvalues and eigenvectors of the covariance matrix. The eigenvector with the largest eigenvalue signified the principal axis, aligning with the contour's orientation in both the vertical and horizontal views. The results of orientation correction are illustrated in
Figure 16.
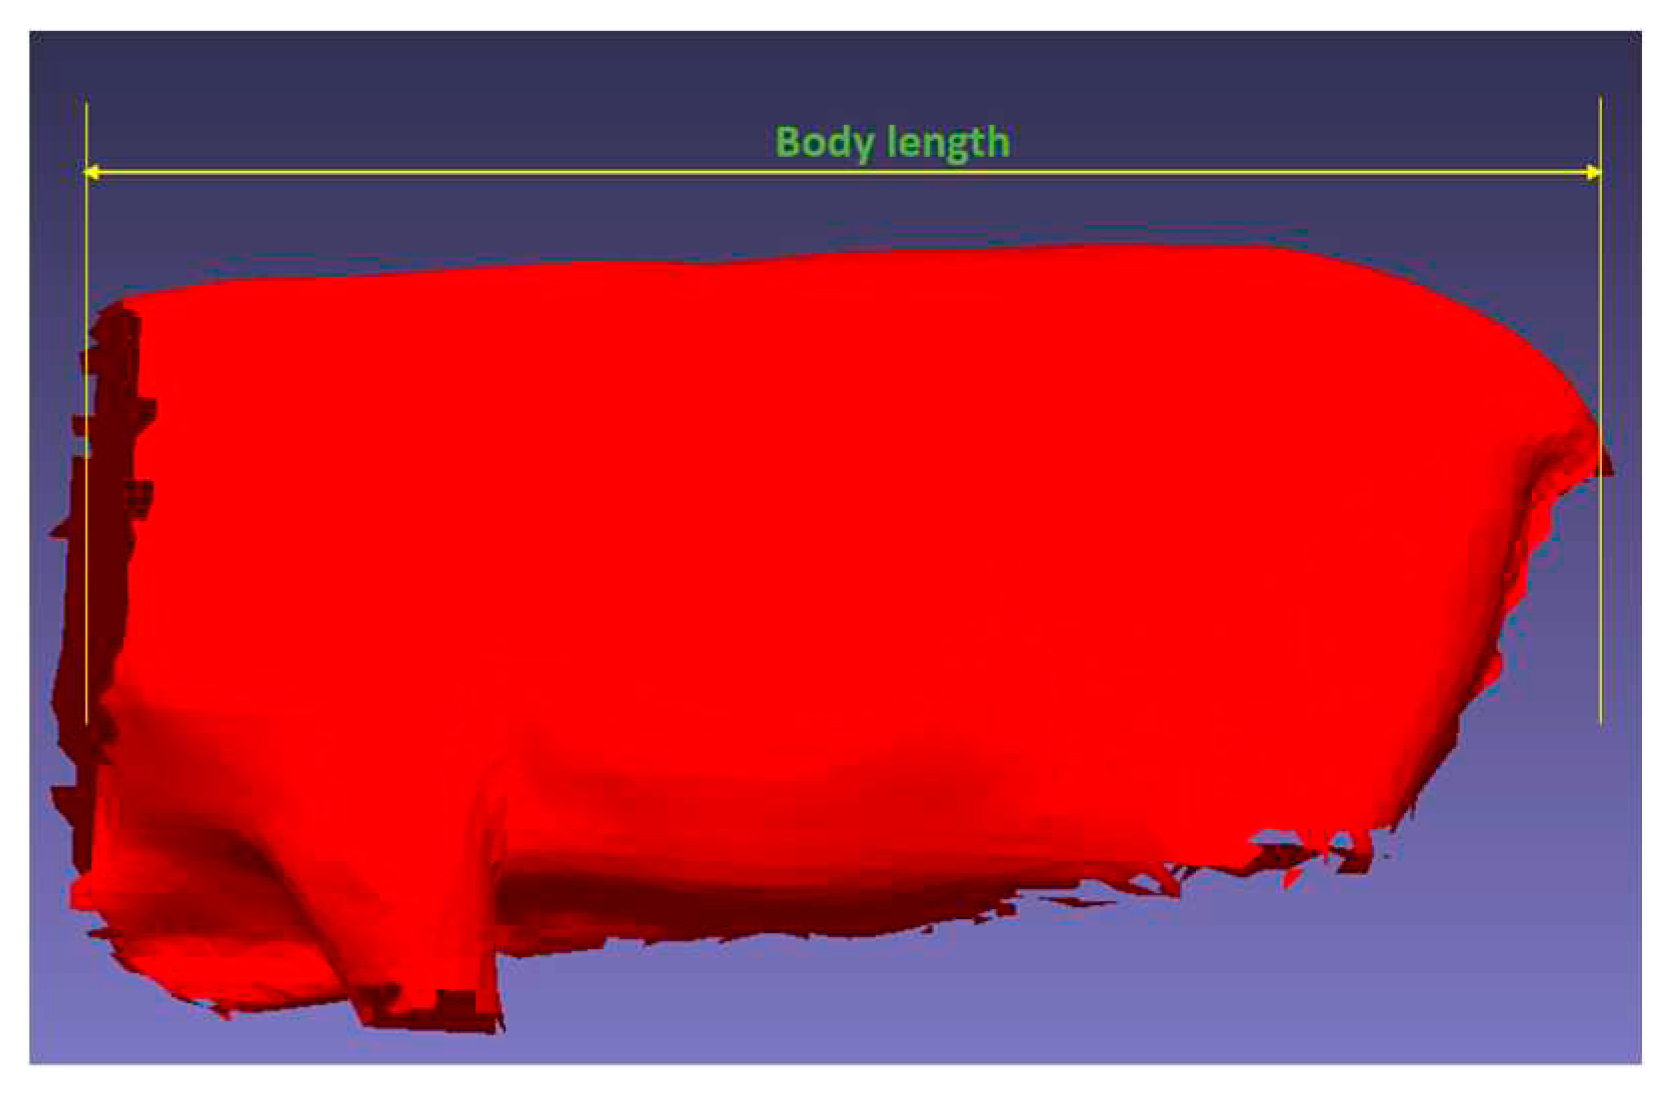
Posture correction allowed us to measure body length by capturing the horizontal length of the segmented torso as in
Figure 17.
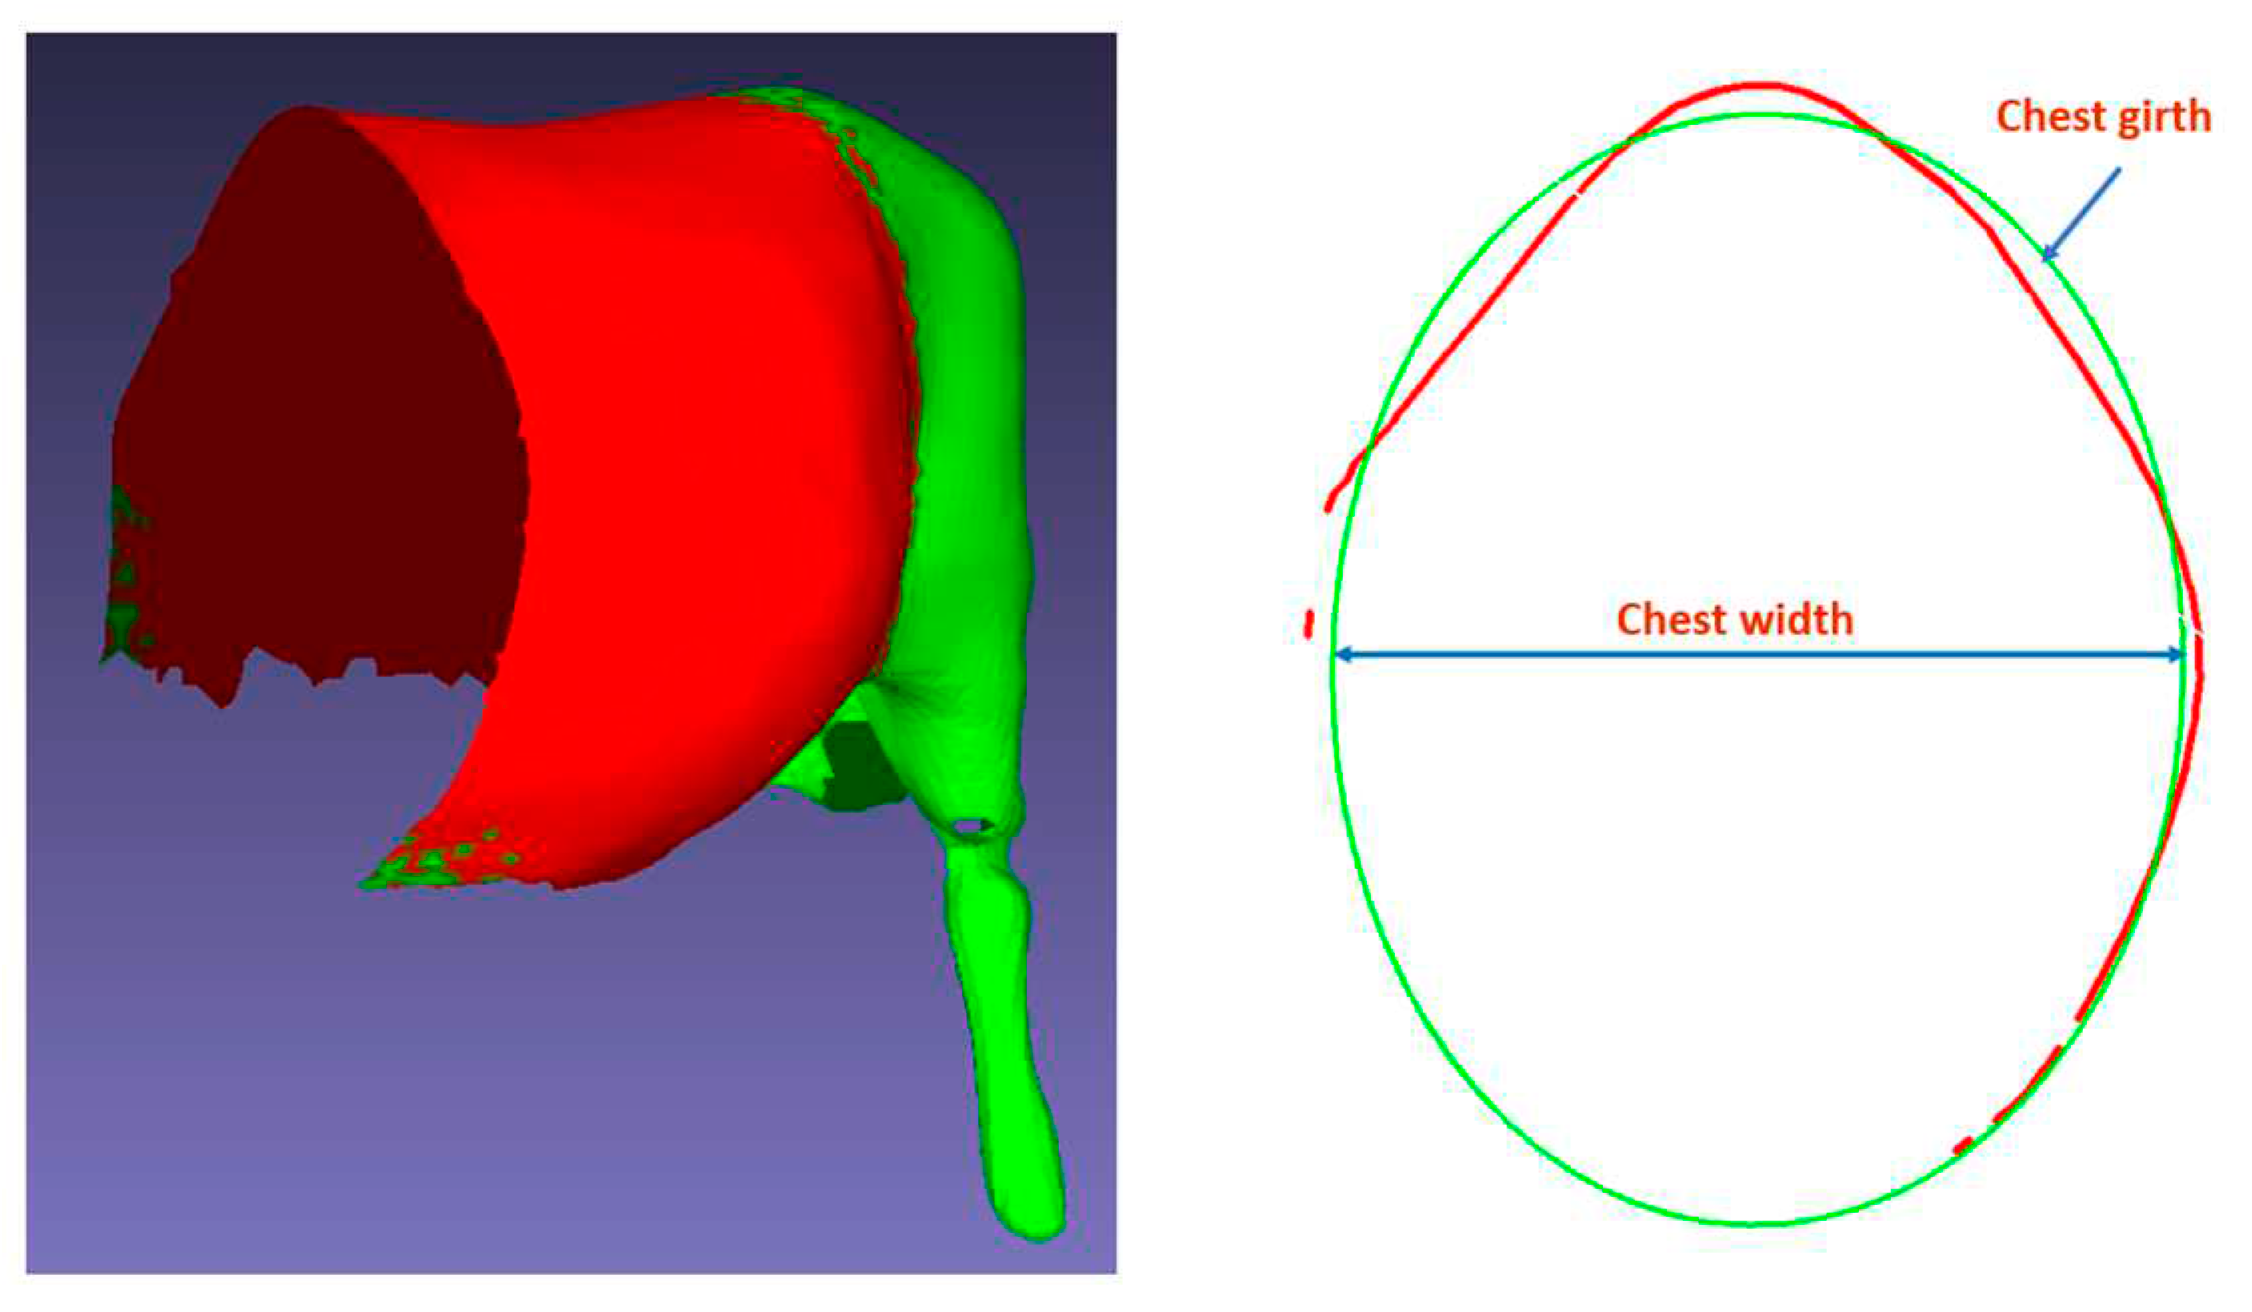
To extract chest girth and chest width, we followed these steps. First, we corrected the cattle’s posture both horizontally and vertically. Then, we cut planes perpendicular to the cattle’s body axis to delineate the boundary surrounding the cattle’s chest. Despite not obtaining a closed contour due to the limitations of the 3D data collection system, the achieved contour encompassed over 60% of the cattle’s chest, facilitating interpolation of a circle. We fitted an ellipse to the achieved contour, with the perimeter of the fitted ellipse measuring chest girth and the minor axis of the ellipse measuring chest width.
Figure 18 on the left displays a 3D image of cattle after center body segmentation, and
Figure 18 on the right depicts the extraction process.
3.2. Weight Prediction
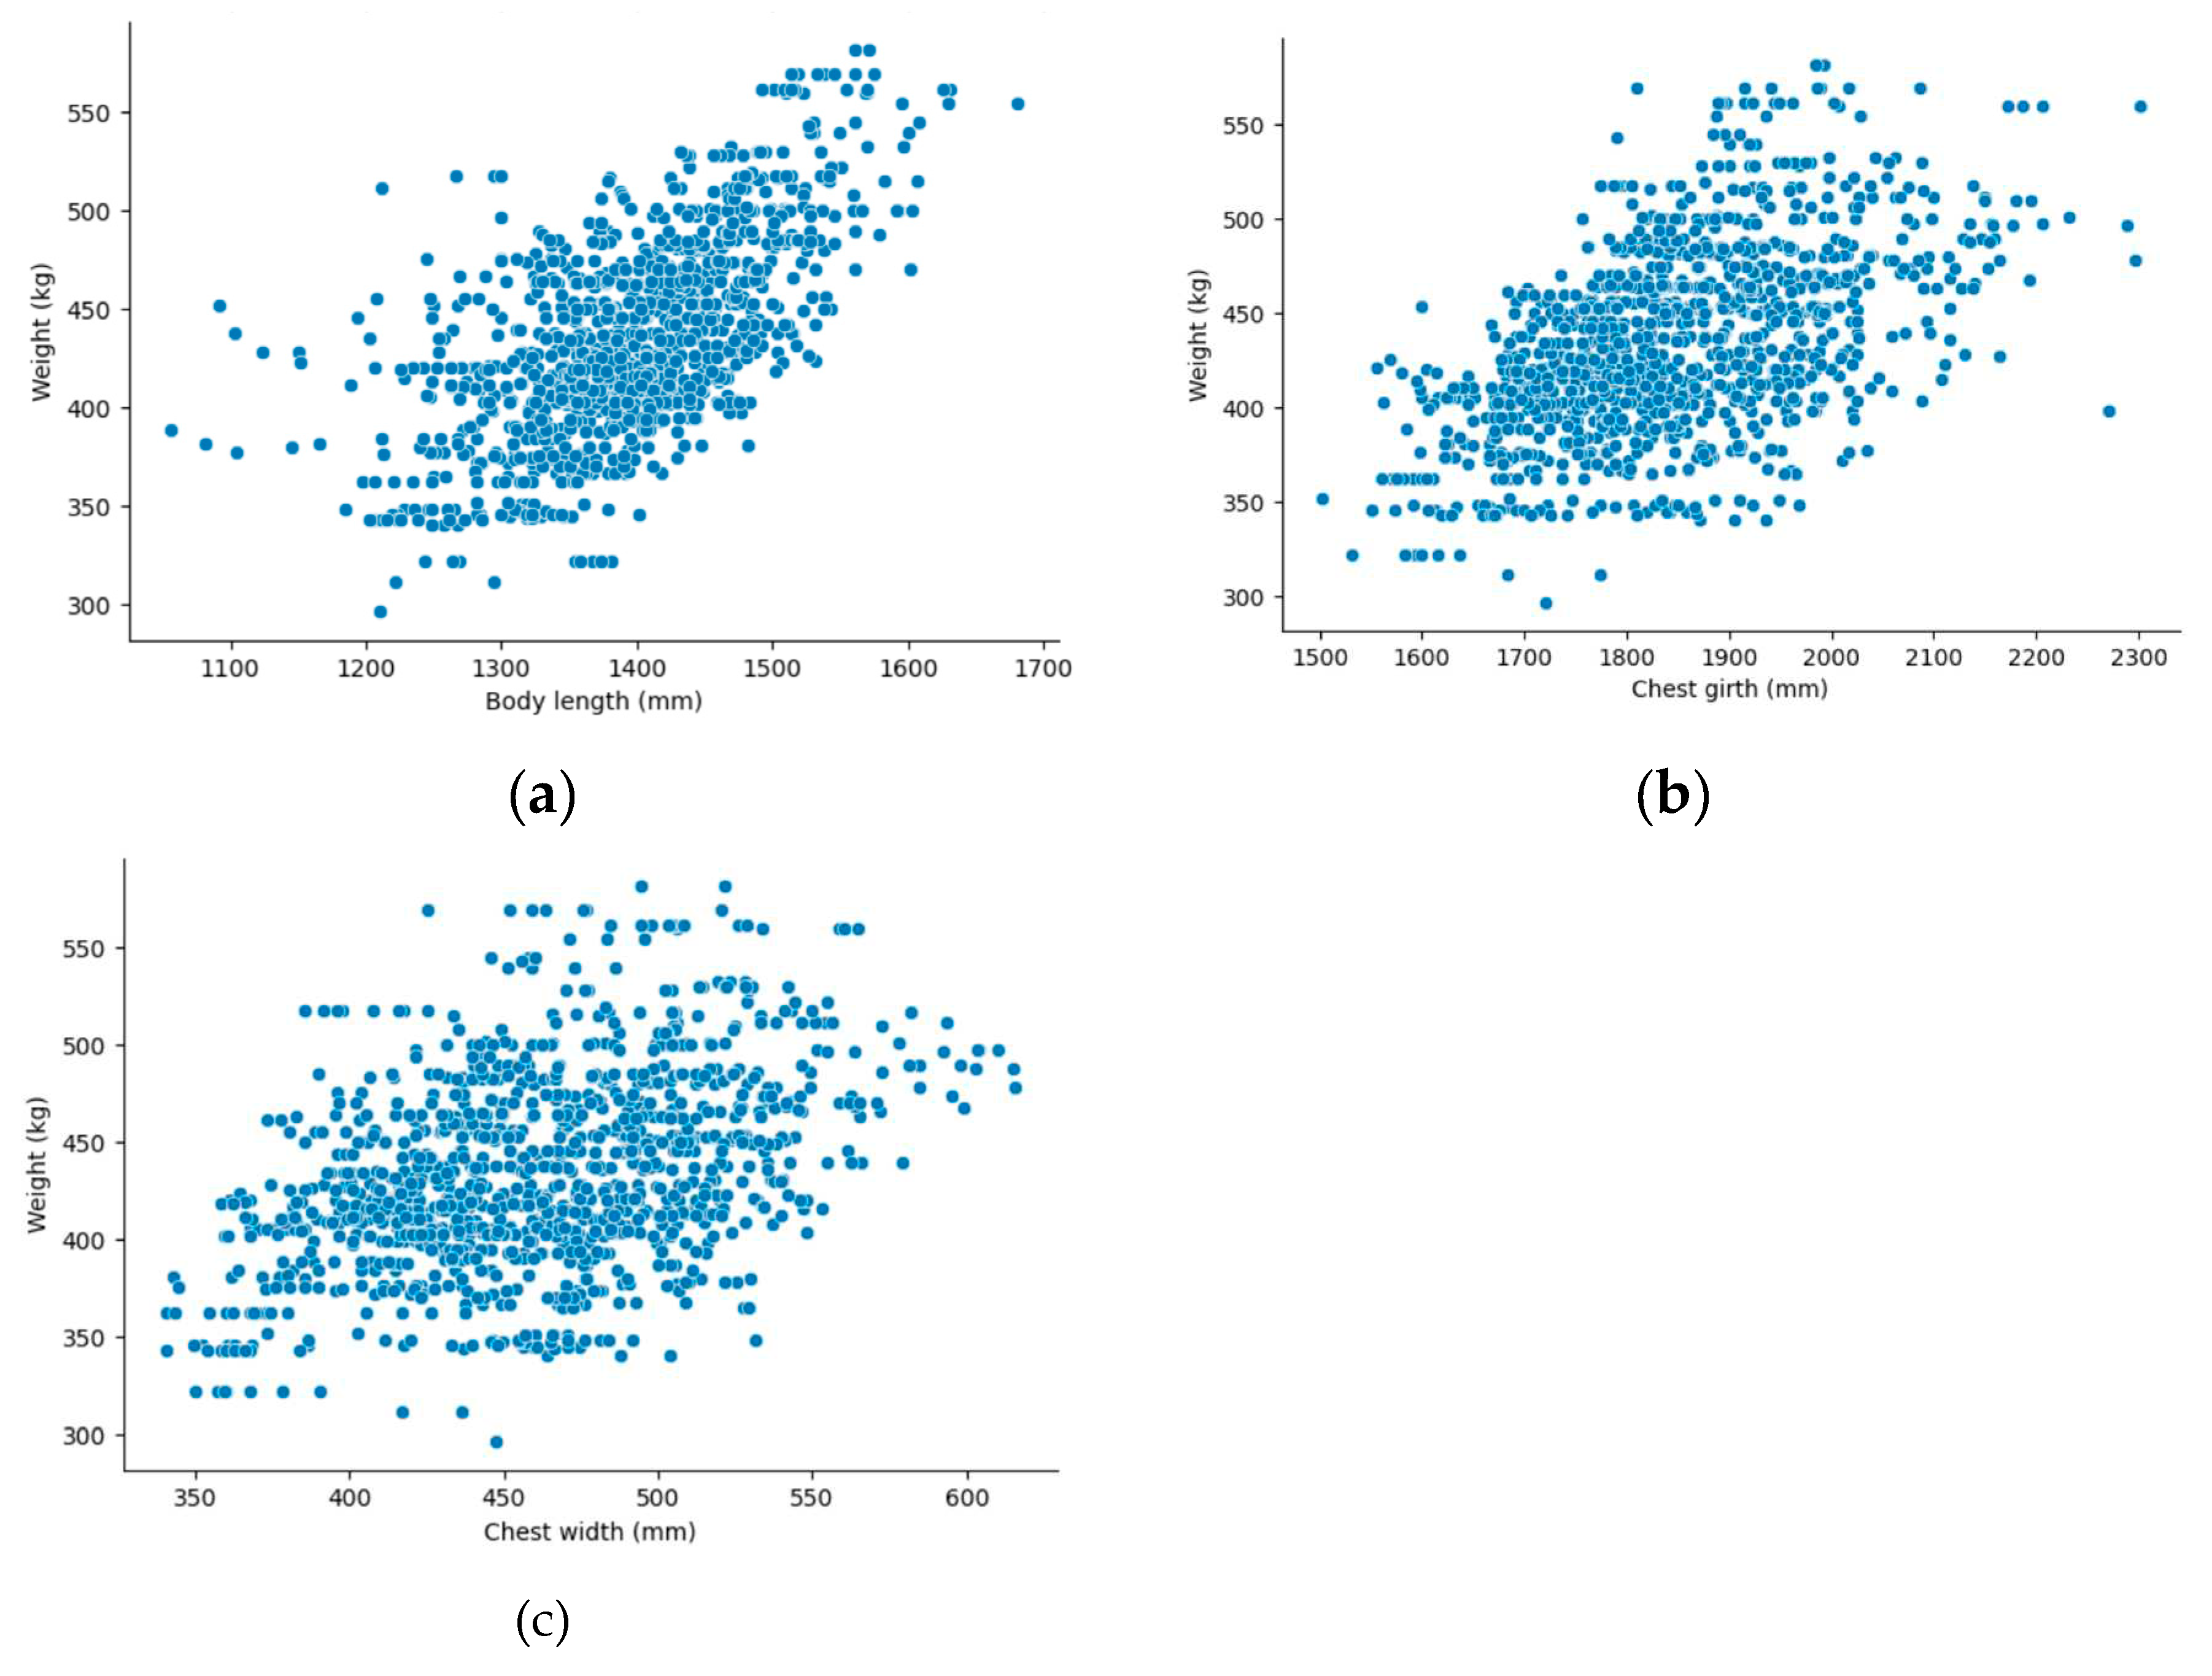
Having extracted the three dimensions from 1190 3D Korean cattle samples in the previous step, we delved into examining the relationship between body sizes and cattle weight within the dataset.
Figure 19 presents a scatter plot showcasing the relationship between the cattle weight and each dimension. As depicted in the graph, a cattle’s weight demonstrates a close correlation with these dimensions.
To evaluate the performance of the proposed approach, two standard evaluation metrics are used. We used the mean absolute error (MAE) and mean absolute percentage error (MAPE).
Where:
is a number of tested samples.
is a known value of cattle weight.
is a predicted value of the cattle weight.
Where:
is a number of tested samples.
is a known value of cattle weight.
is a predicted value of the cattle weight.
The experiments aimed to estimate Korean cattle weight using the five proposed machine learning models: CatBoost regression, LightGBM, Polynomial regression, Random Forest regression, and XGB regression. These experiments were conducted across ten folds. The results are displayed in
Table 3 through
Table 7, respectively, and the average performance across the ten folds is summarized in
Table 8.
Table 3.
CatBoot Regression result.
Table 3.
CatBoot Regression result.
| Fold |
Evaluation metrics |
| MAE (kg) |
MAPE (%) |
| Fold 1 |
27.800 |
6.529 |
| Fold 2 |
27.116 |
6.320 |
| Fold 3 |
27.767 |
6.380 |
| Fold 4 |
25.776 |
6.014 |
| Fold 5 |
26.432 |
6.371 |
| Fold 6 |
26.164 |
6.031 |
| Fold 7 |
25.775 |
5.980 |
| Fold 8 |
26.572 |
6.175 |
| Fold 9 |
29.491 |
6.924 |
| Fold 10 |
25.296 |
5.880 |
| Average |
26.819 |
6.260 |
Table 4.
LightGBM Regression result.
Table 4.
LightGBM Regression result.
| Fold |
Evaluation metrics |
| MAE (kg) |
MAPE (%) |
| Fold 1 |
26.268 |
6.124 |
| Fold 2 |
24.656 |
5.712 |
| Fold 3 |
26.193 |
6.094 |
| Fold 4 |
24.284 |
5.731 |
| Fold 5 |
25.383 |
6.033 |
| Fold 6 |
26.272 |
6.045 |
| Fold 7 |
24.096 |
5.537 |
| Fold 8 |
25.042 |
5.844 |
| Fold 9 |
26.560 |
6.191 |
| Fold 10 |
26.760 |
6.173 |
| Average |
25.551 |
5.948 |
Table 5.
Polynomial Regression result.
Table 5.
Polynomial Regression result.
| Fold |
Evaluation metrics |
| MAE (kg) |
MAPE (%) |
| Fold 1 |
25.302 |
5.903 |
| Fold 2 |
26.085 |
6.078 |
| Fold 3 |
26.187 |
6.066 |
| Fold 4 |
24.871 |
5.805 |
| Fold 5 |
25.594 |
6.116 |
| Fold 6 |
23.714 |
5.433 |
| Fold 7 |
25.017 |
5.790 |
| Fold 8 |
25.301 |
5.858 |
| Fold 9 |
27.933 |
6.527 |
| Fold 10 |
26.233 |
6.080 |
| Average |
25.624 |
5.966 |
Table 6.
Random Forest Regression result.
Table 6.
Random Forest Regression result.
| Fold |
Evaluation metrics |
| MAE (kg) |
MAPE (%) |
| Fold 1 |
25.256 |
5.903 |
| Fold 2 |
24.293 |
5.649 |
| Fold 3 |
26.749 |
6.181 |
| Fold 4 |
25.786 |
5.994 |
| Fold 5 |
24.264 |
5.755 |
| Fold 6 |
24.318 |
5.559 |
| Fold 7 |
24.955 |
5.682 |
| Fold 8 |
25.294 |
5.890 |
| Fold 9 |
26.856 |
6.282 |
| Fold 10 |
24.269 |
5.622 |
| Average |
25.204 |
5.852 |
Table 7.
XGBoost Regression result.
Table 7.
XGBoost Regression result.
| Fold |
Evaluation metrics |
| MAE (kg) |
MAPE (%) |
| Fold 1 |
27.257 |
6.393 |
| Fold 2 |
27.150 |
6.285 |
| Fold 3 |
27.359 |
6.277 |
| Fold 4 |
27.252 |
6.370 |
| Fold 5 |
26.066 |
6.188 |
| Fold 6 |
27.299 |
6.296 |
| Fold 7 |
25.569 |
5.830 |
| Fold 8 |
27.052 |
6.274 |
| Fold 9 |
28.070 |
6.538 |
| Fold 10 |
26.401 |
6.108 |
| Average |
26.948 |
6.256 |
Table 8.
Average result.
| Model |
Evaluation metrics |
| Average of MAE (kg) |
Average of MAPE (%) |
| CatBoost Regression |
26.819 |
6.260 |
| Light GBM Regression |
25.551 |
5.948 |
| Polynomial Regression |
25.624 |
5.966 |
| Random Forest Regression |
25.204 |
5.852 |
| XGBoost Regression |
26.948 |
6.256 |
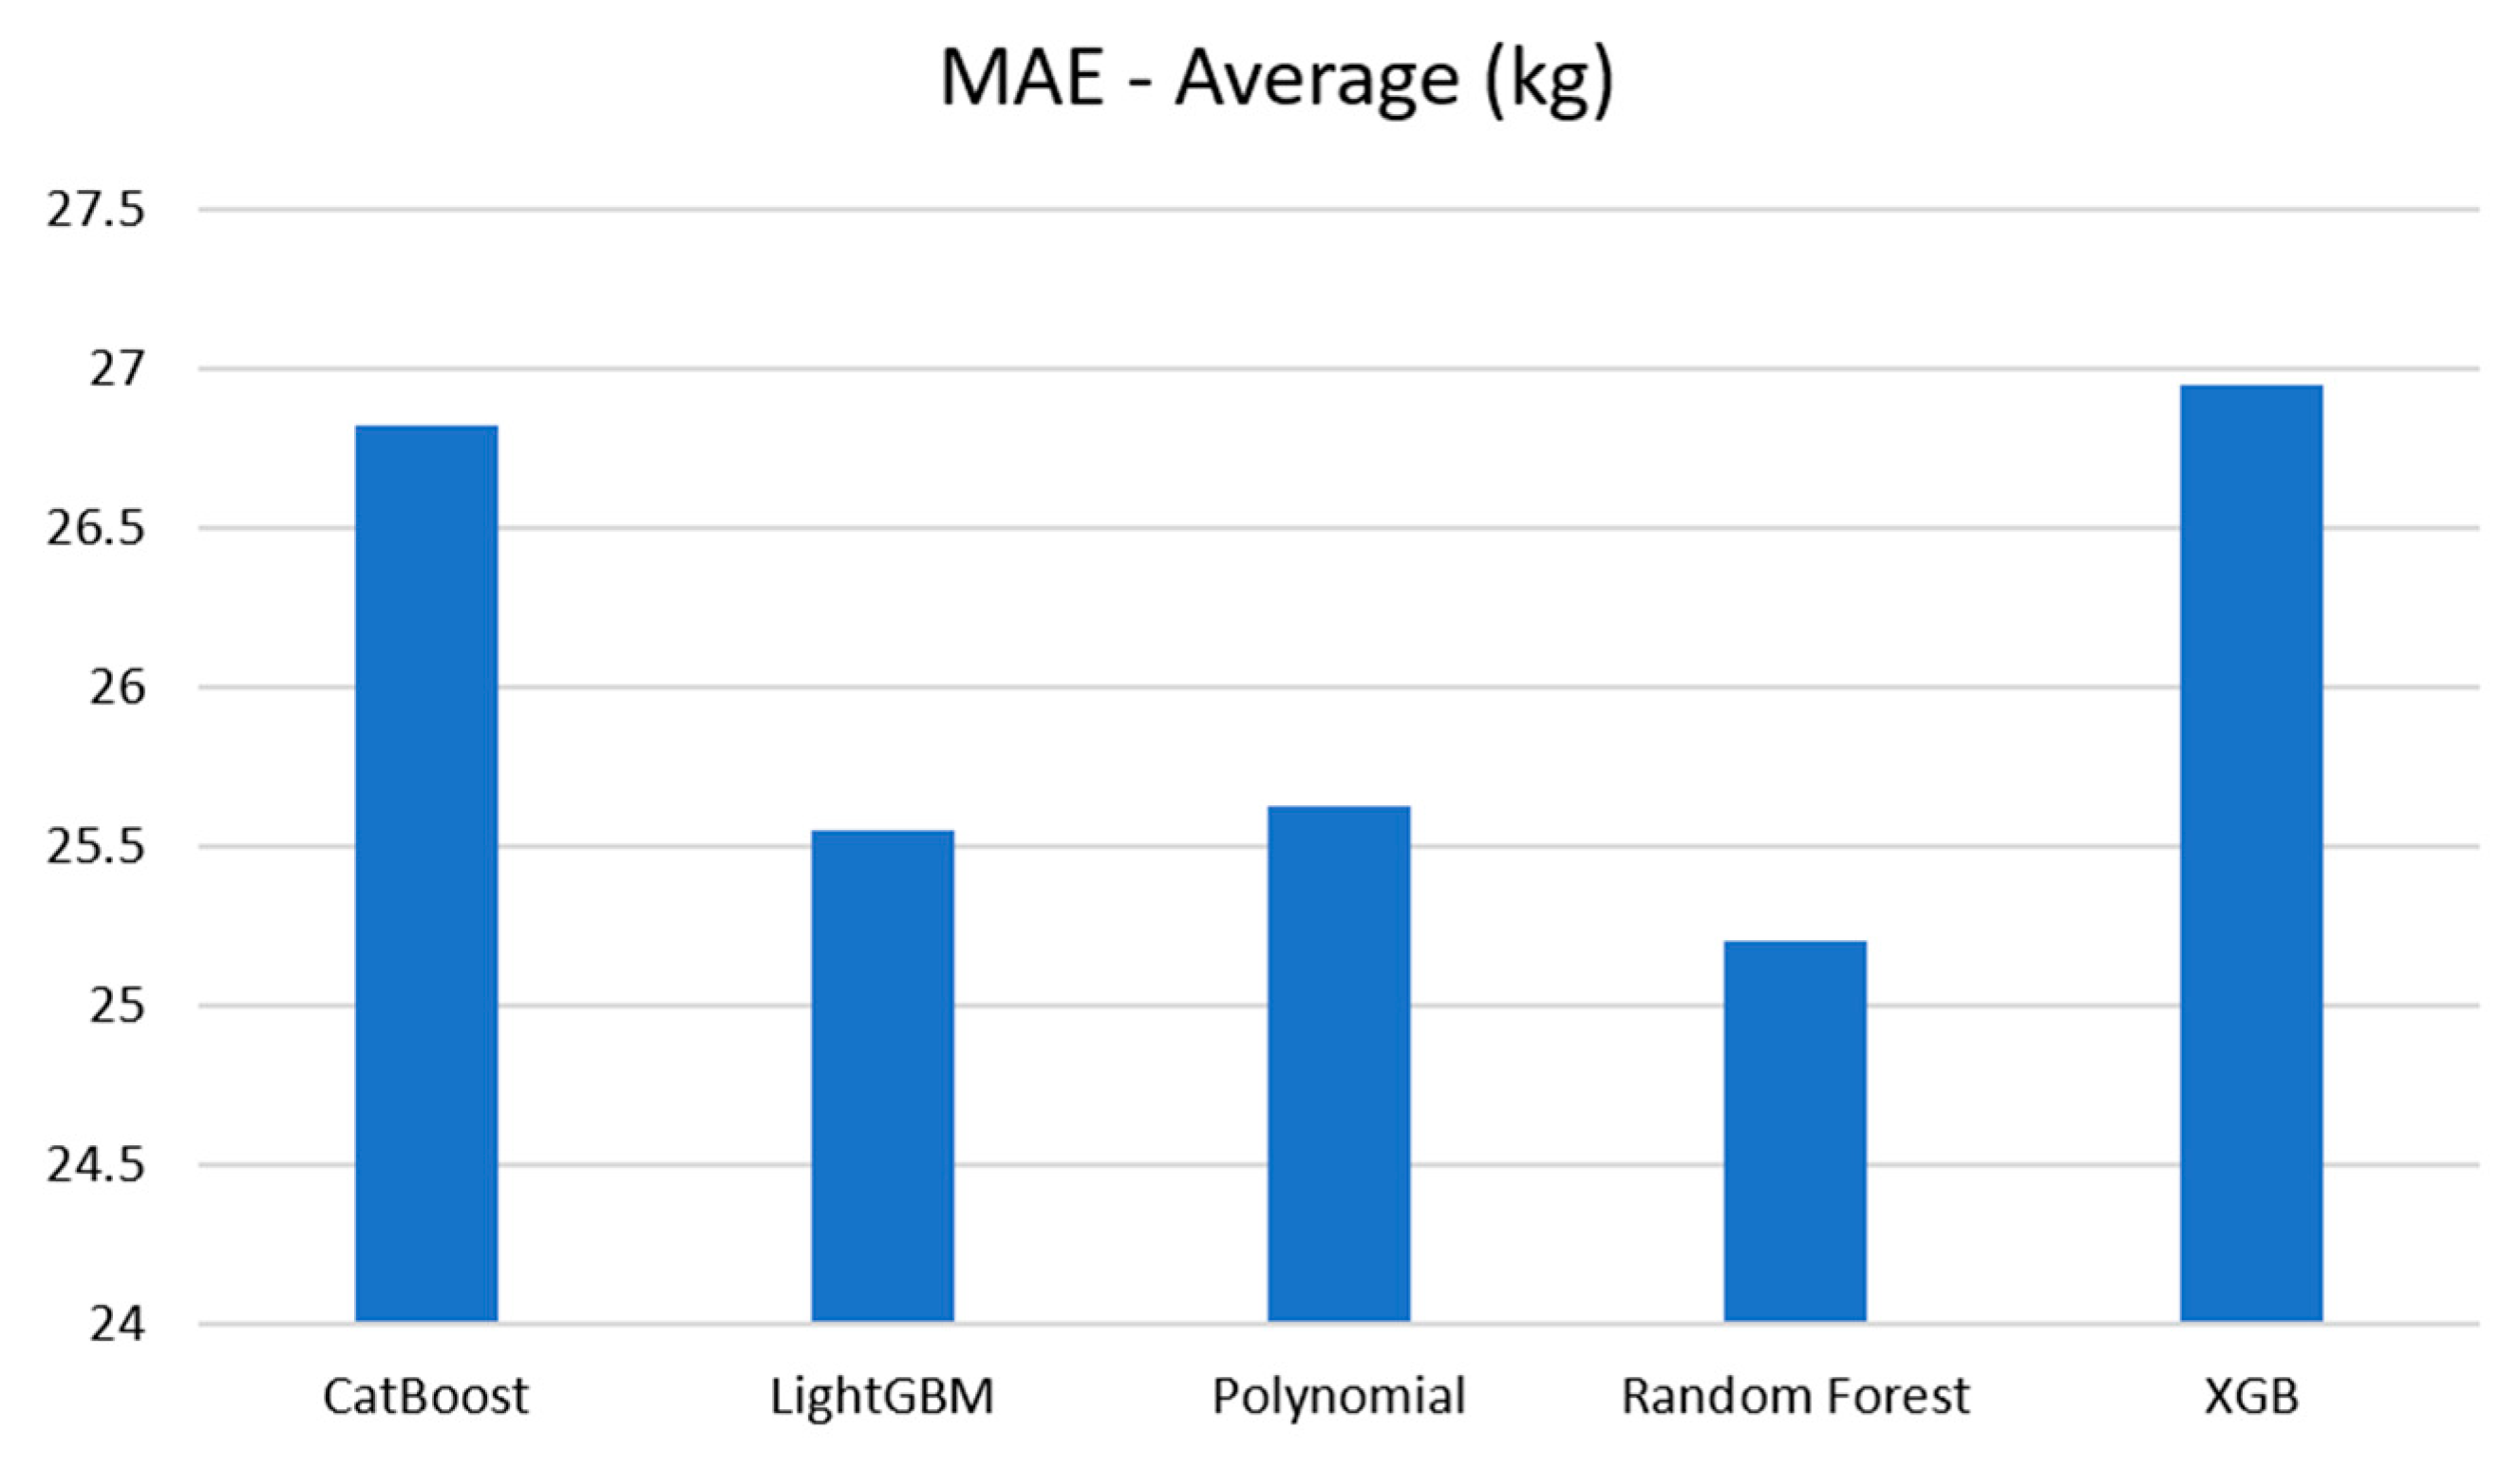
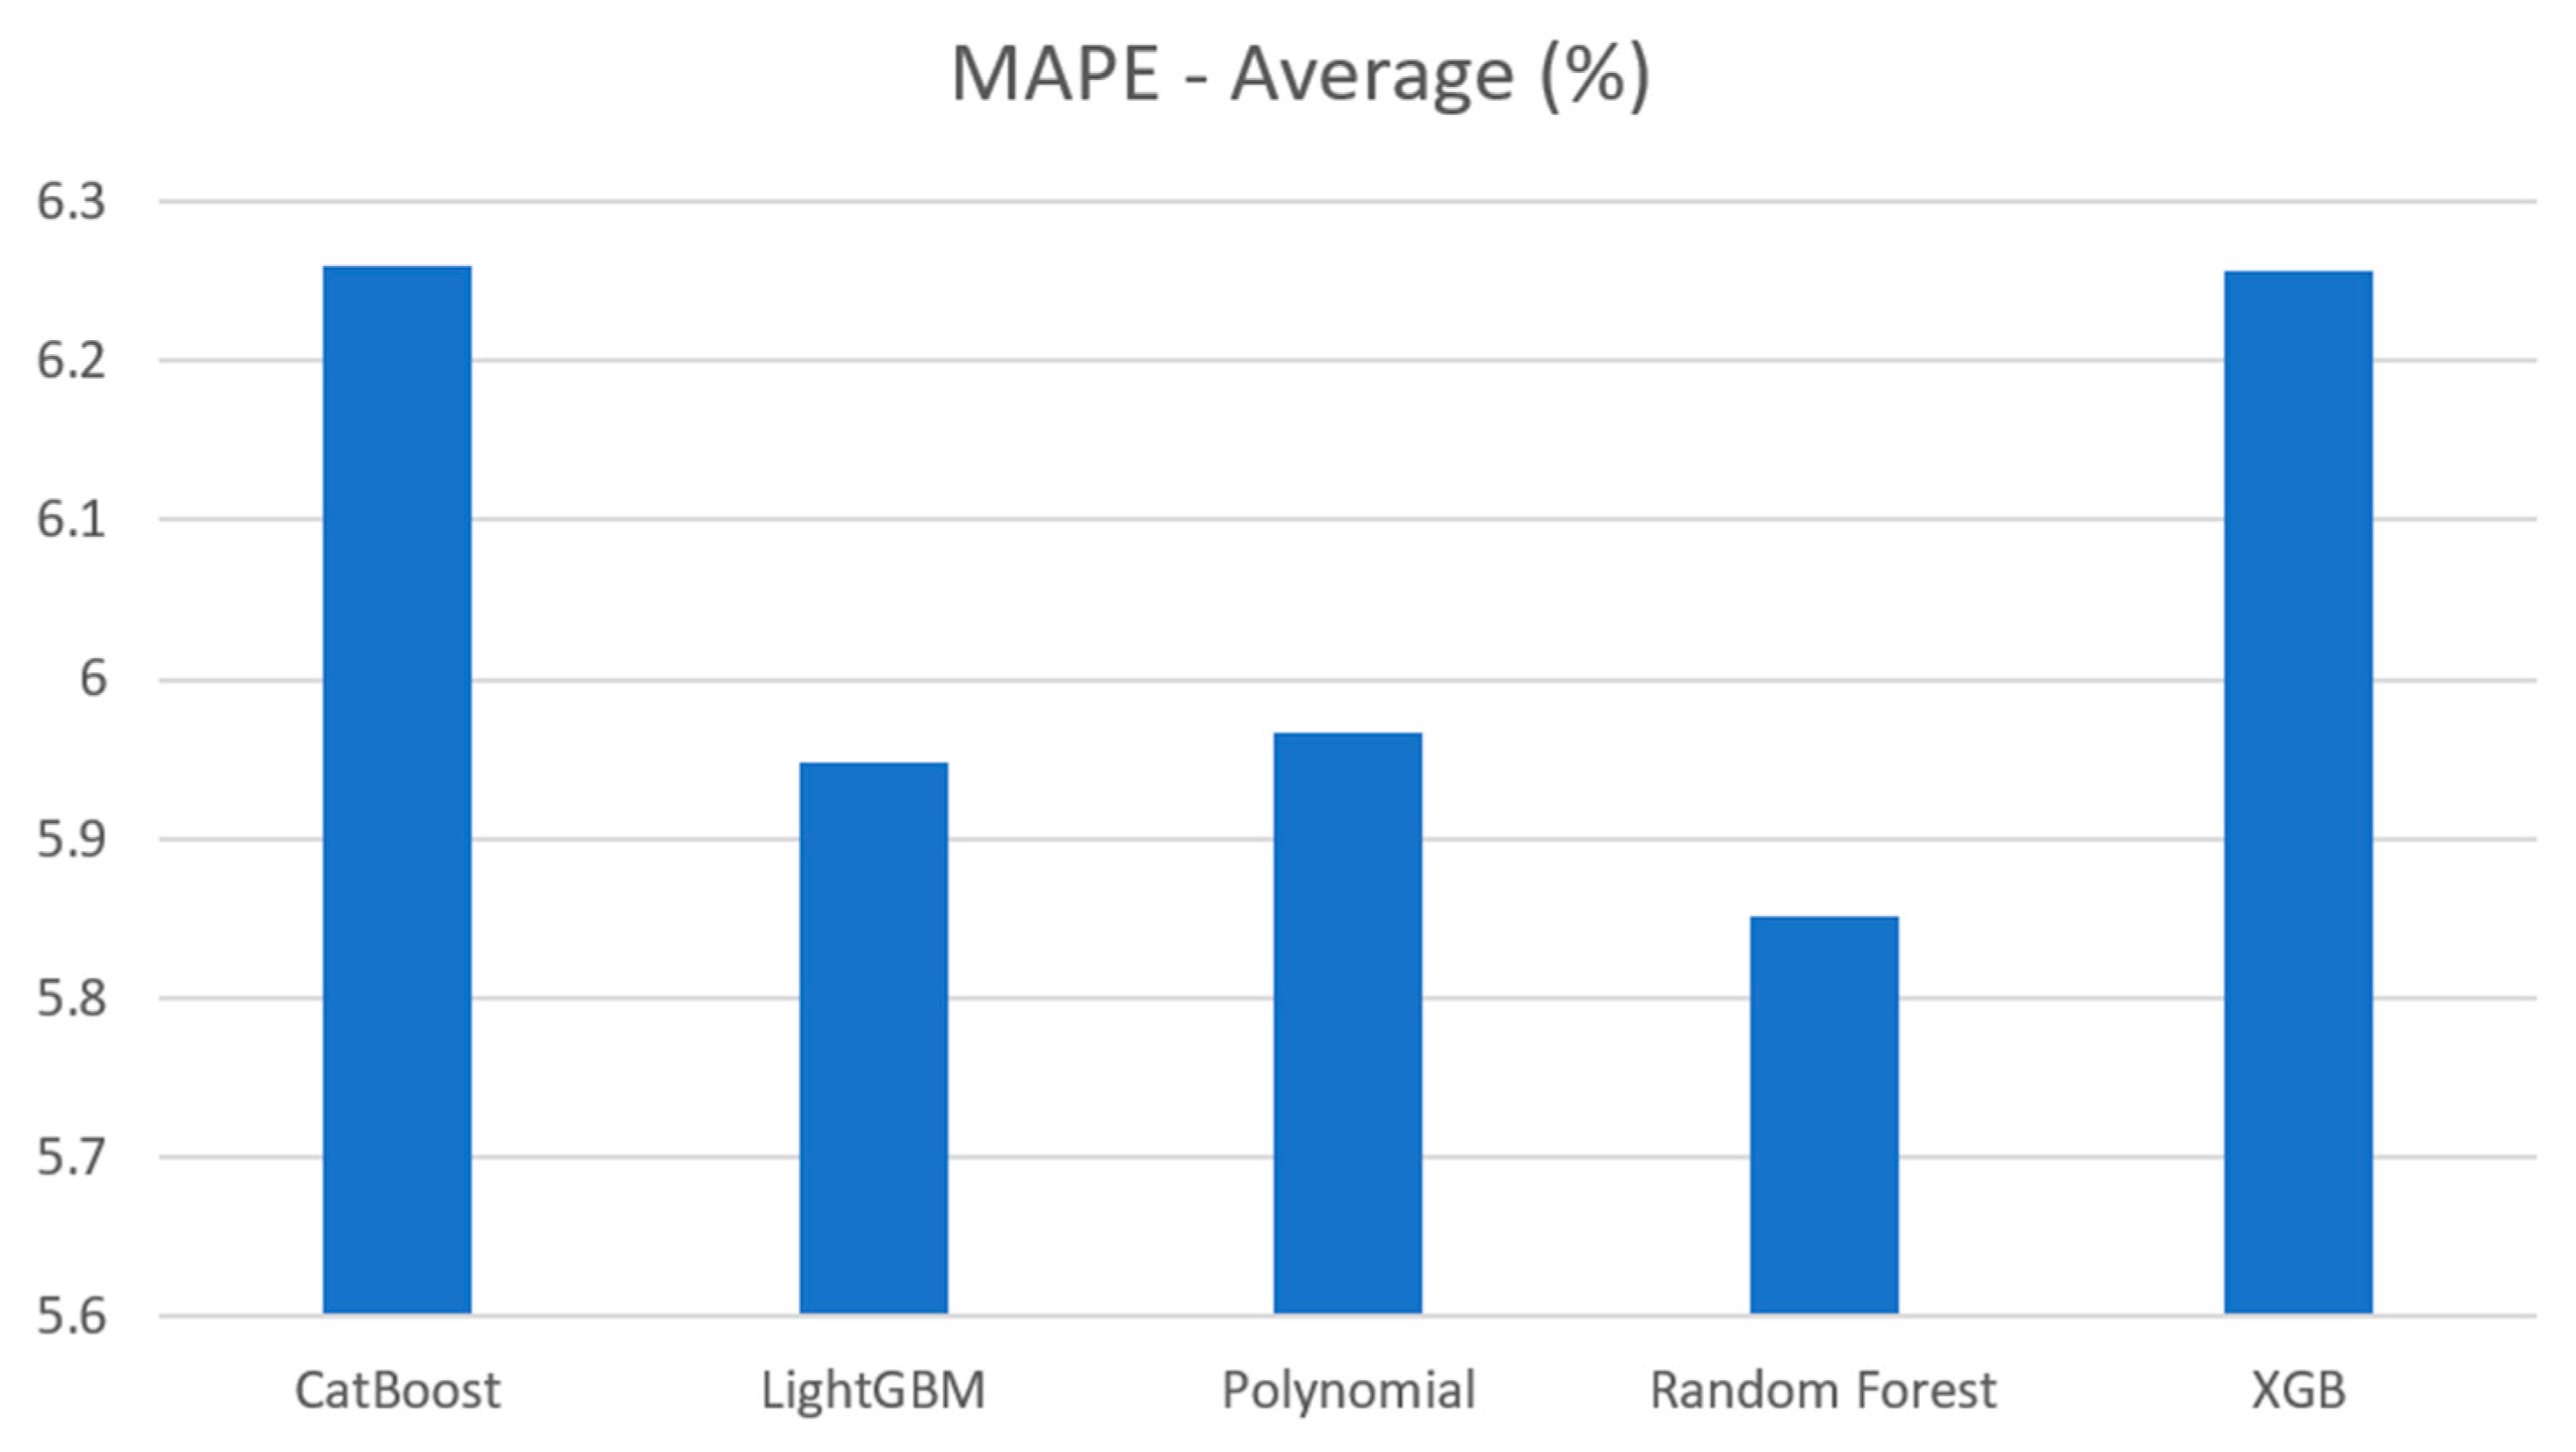
The average MAE and MAPE for these algorithms are visualized in
Figure 20 and
Figure 21. As depicted in the bar graphs, the Random Forest model exhibited the highest performance, achieving an MAE error of 25.2 kg and a MAPE of 5.852%. It was followed by Polynomial and LightGBM. XGBoost and CatBoost also performed well among the models.
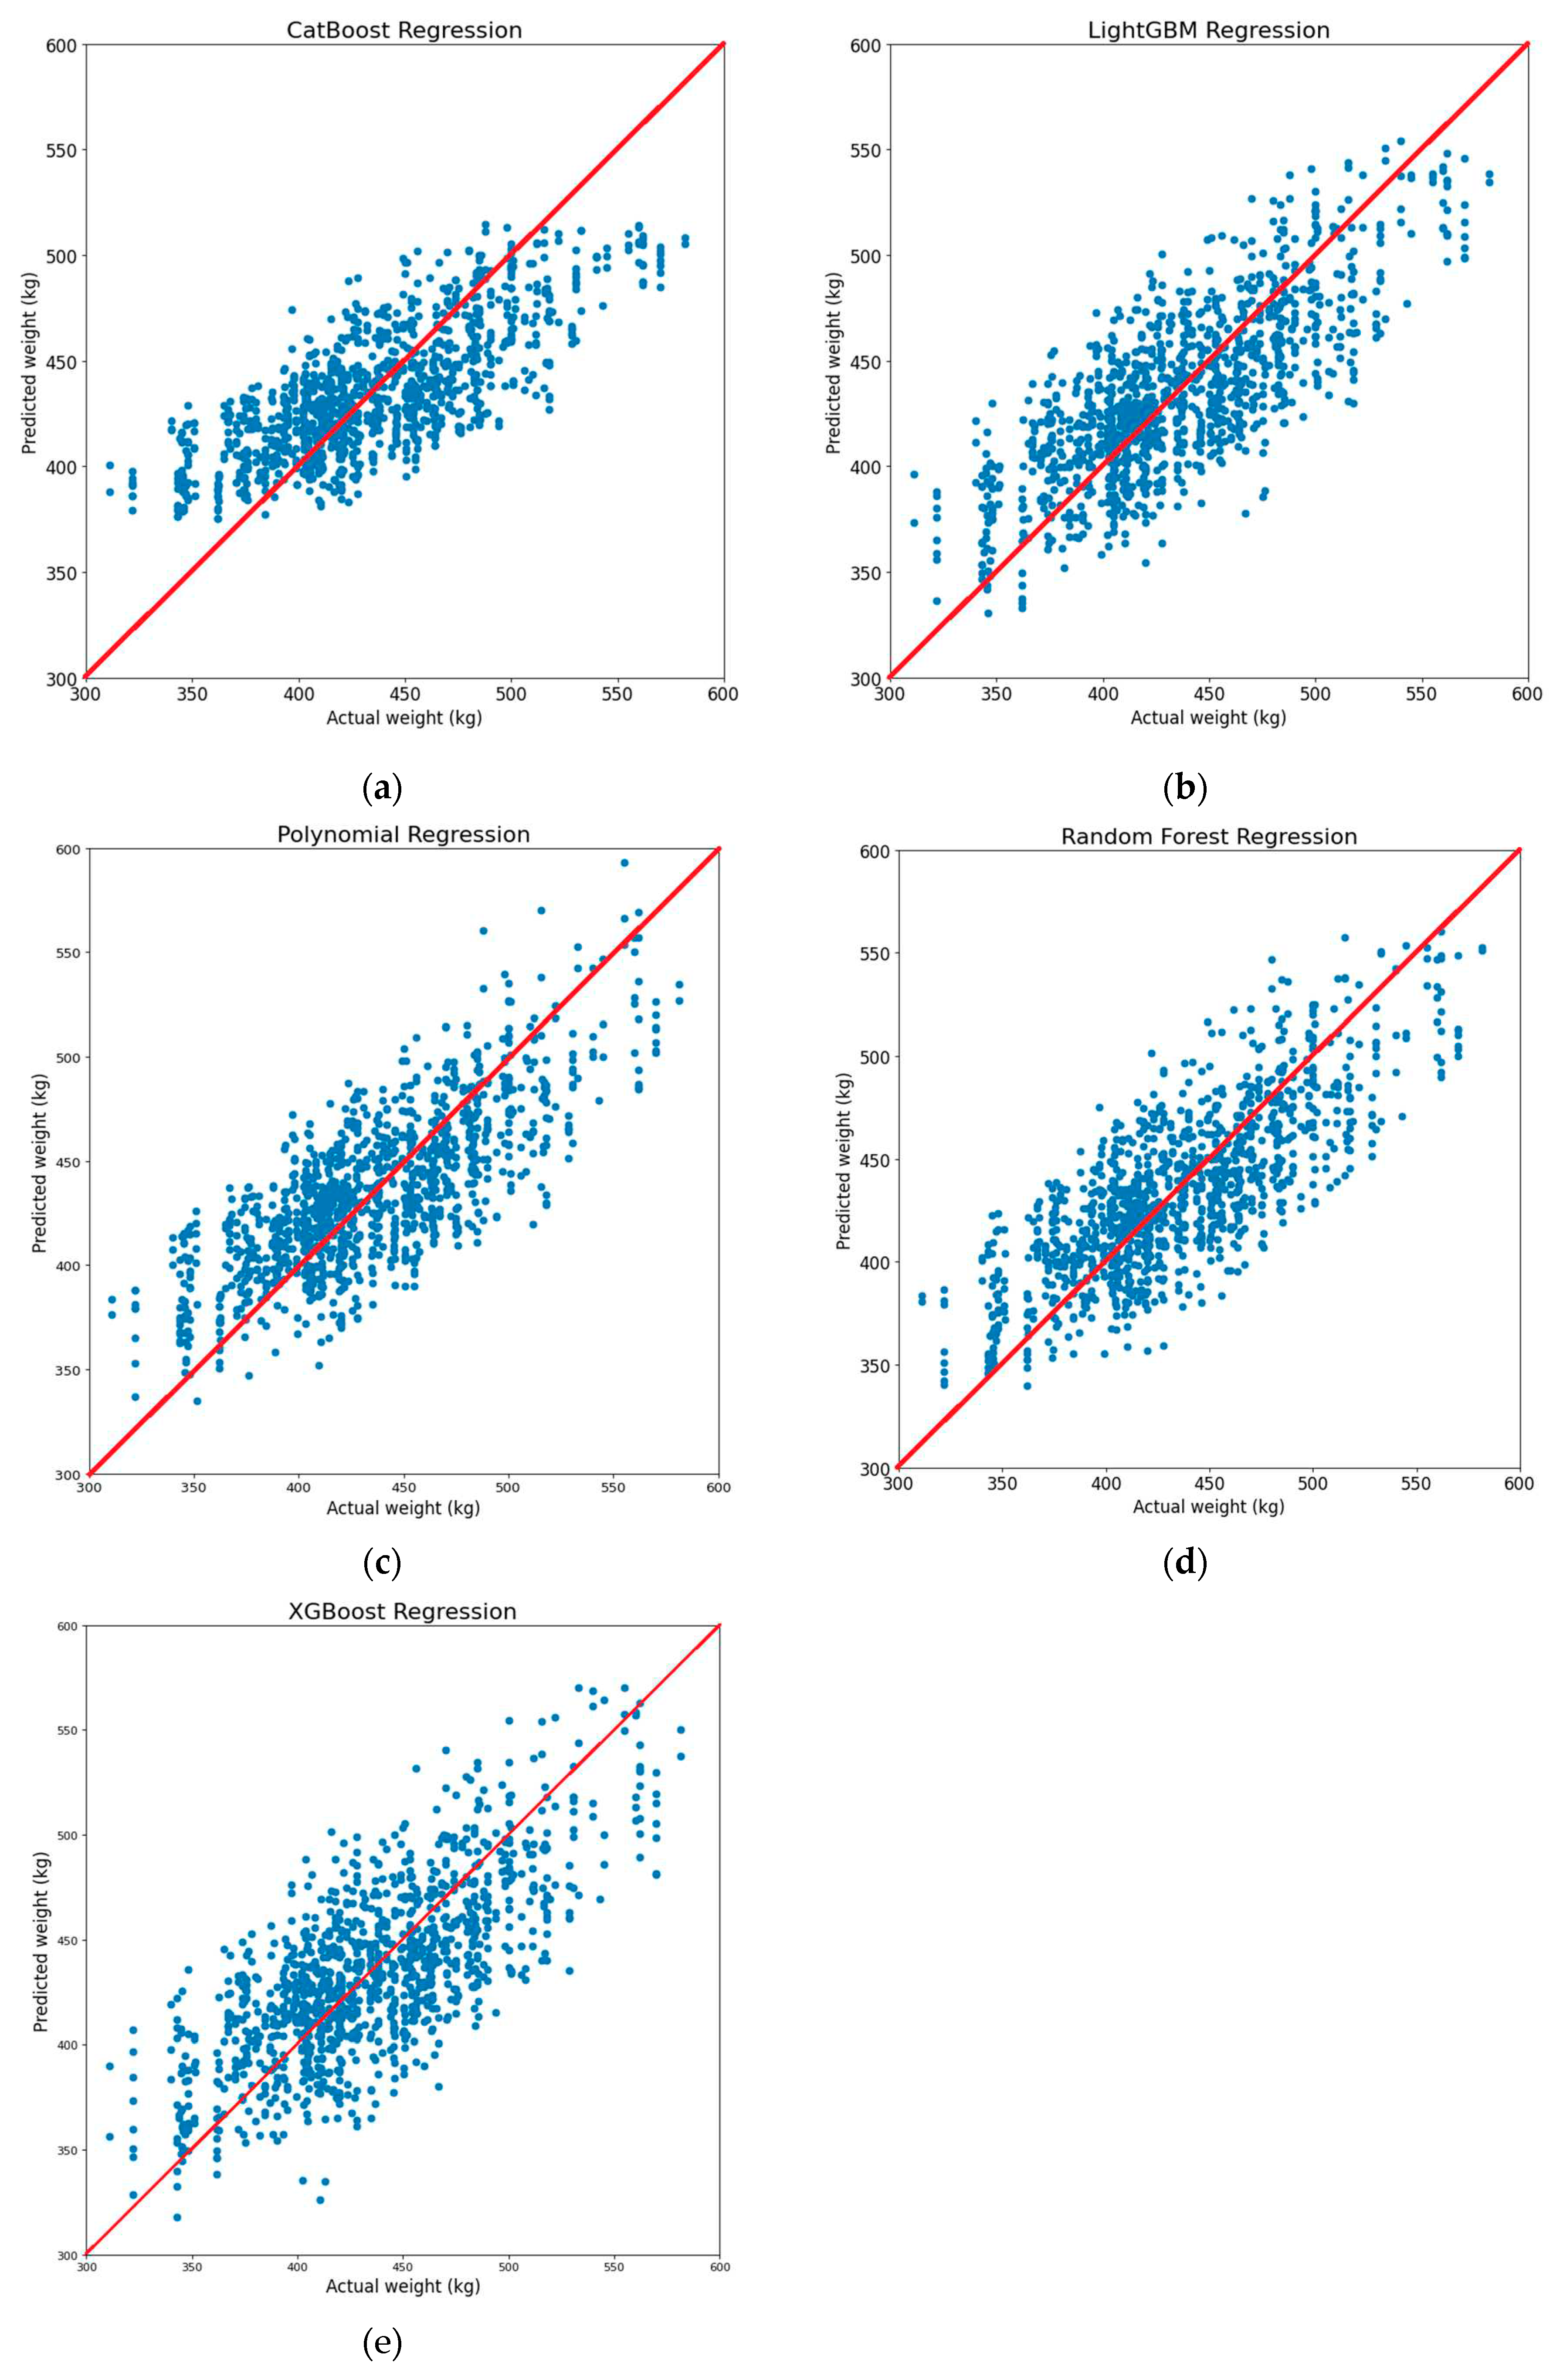
To assess the effectiveness of estimating Korean cattle weight using the proposed dimensions, we analyzed the estimation results in comparison to the actual cattle weight for each machine learning model.
Figure 22 illustrates the correlation between predicted weight and actual weight. The results indicate that, with the exception of the CatBoost model, which exhibited slightly lower performance than the other models, all the remaining models provided quite accurate weight prediction.
4. Conclusions
In this paper, we have presented a vision-based solution for predicting the weight of Korean cattle using 3D segmentation and regression machine learning. After acquiring data from the multi-camera system, we used PointNet for 3D segmentation, we employed PointNet for 3D segmentation, conducting two distinct cases: one to segment the torso for extracting body length and another to segment the center body for extracting chest girth and chest width. Finally, we applied five machine learning algorithms to estimate cattle weight based on the three extracted dimensions. We conducted experiments on 1190 3D Korean cattle samples, captured from various poses of 270 Korean cattle. The results of these experiments demonstrated an accuracy of 25.2 kg in terms of MAE and 5.81% in terms of MAPE. Our approach not only showcases the effectiveness of weight prediction for Korean cattle but also holds the potential for broader applicability to other tetrapod species.
Author Contributions
Conceptualization, C.G.D. and S.H.; methodology, S.H.; software, S.H., M.K.B. and V.T.P.; validation, S.S.L., M.A. and S.M.L.; formal analysis, X.X.; investigation, C.G.D.; resources, M.N.P.; data curation, H.S.S.; writing—original draft preparation, S.H.; writing—review and editing, S.H., C.G.D, and J.G.L; visualization, M.K.B. and V.T.P; supervision, G.G.D.; project administration, C.G.D.; funding acquisition, C.G.D. All authors have read and agreed to the published version of the manuscript.
Funding
This research was funded by Korea Institute of Planning and Evaluation for Technology in Food, Agriculture and Forestry (IPET) and Korea Smart Farm RD Foundation (KosFarm) through Smart Farm Innovation Technology Development Program, funded by Ministry of Agriculture, Food and Rural Affairs (MAFRA) and Ministry of Science and ICT (MSIT). Rural Development Administration (421011-03).
Institutional Review Board Statement
The animal study protocol was approved by the IACUC at National Institute of Animal Science (approval number: NIAS20222380).
Data Availability Statement
The datasets generated during this study are available from corresponding author upon request.
Conflicts of Interest
The authors declare no conflict of interest.
Abbreviations
The following abbreviations are used in this paper.
| 3D |
Three Dimension |
| AI |
Artificial Intelligent |
| ANN |
Artificial Neural Network |
| MAE |
Mean Absolute Error |
| MAPE |
Mean Absolute Percentage Error |
| MLP |
Multiple Layer Perceptron |
| LIDAR |
Light Detection and Ranging |
| PCA |
Principal Component Analysis |
| RGB-D |
Red Green Blue Depth |
| LightGBM |
Light Gradient Boosting Machine |
| XGBoost |
Extreme Gradient Boost |
References
- Tasdemir, S.; Ozkan, I.A. ANN approach for estimation of cow weight depending on photogrammetric body dimensions. Int. J. Eng. Geosci. 2019, 4, 36-44. [CrossRef]
- Anifah, L.; Haryanto. Decision Support System Two-Dimensional Cattle Weight Estimation using Fuzzy Rule Based System. 2021 3rd East Indonesia Conference and Information Technology (EIConCIT), Surabaya, Indonesia, 09-11 April 2021.
- Ana D. et el. Weighing live sheep using computer vision techniques and regression machine learning. MLWA. 2021, 5, 100076. [CrossRef]
- Weber, V.A.M.; Weber, F.L.; Oliveira, A.S.; Astolfi, G.; et al. Cattle weight estimation using active contour models and regression trees Bagging. Comput Electron Agric 2020, 179, 105804. [CrossRef]
- Jang, D.H.; Kim, C.; Ko, Y.G. et al. Estimation of Body Weight for Korean Cattle Using Three-Dimensional Image. J. Biosyst. Eng. 2020, 45, 36-44. [CrossRef]
- Na, M.H.; Cho, W.H.; Kim, S.K.; Na, I.S. Automatic Weight Prediction System for Korean Cattle Using Bayesian Ride Algorithm on RGB-D Image. Electronics 2022, 11, 1663. [CrossRef]
- Kwon, K.; Park, A.; Lee, H.; Mun, D. Deep learning-based weight estimation using a fast-reconstructed mesh model from point cloud of a pig. Comput Electron Agric. 2023, 210, 107903. [CrossRef]
- Hou, L.; Huang, L.; Zhang, Q.; Miao, Y. Body weight estimation of beef cattle with 3D deep learning model: PointNet++. Comput Electron Agric 2023, 213, 108184. [CrossRef]
- Qi, C.R.; Yi, L.; Su, H.; Guibas, L.J. PointNet++: Deep Hierarchical Feature Learning on Point Sets in a Metric Space. arXiv 2017, arXiv:1706.02413.
- Ruchay, A.; Kober, V.; Dorofeev, K.; Gladkov, A.; Guo, H. Live Weight Prediction of Cattle Based on Deep Regression of RGB-D Images. Agriculture. 2022, 12, 1794. [CrossRef]
- Na, M.H.; Cho, W.H.; Kim, S.K.; Na, I.S. The Development of a Weight Prediction System for Pigs Using Raspberry Pi. Agriculture 2023, 13, 2027. [CrossRef]
- Le Cozler, Y.; Allain, C.; Xavier, C.; Depuille, L.; Caillot, A.; Delouard, J.; Delattre, L.; Luginbuhl, T.; Faverdin, P. Volume and surface area of Holstein dairy cows calculated from complete 3D shapes acquired using high-precision scanning system: Interest for body weight estimation. Comput. Electron. Agric. 2019, 165, 104977. [CrossRef]
- Cominotte, A.; Fernandes, A.; Dorea, J.; Rosa, G.; Baldassini, W.; Neto, O.M. Automated computer vision system to predict body weight and average daily gain in beef cattle during growing and finishing phases. Livest. Sci. 2020, 232, 103904. [CrossRef]
- Martins, B.; Mendes, A.; Silva, L.; Moreira, T.; Costa, J.; Rotta, P.; Chizzotti, M.; Marcondes, M. Estimating body weight, body condition score, and type traits in dairy cows using three dimensional cameras and manual body measurements. Livest. Sci. 2020, 236, 104054. [CrossRef]
- Dang, C.; Choi, T.; Lee, S.; Lee, S.; Alam, M.; Park, M.; Han, S.; Lee, J.; Hoang, D. Machine Learning-Based Live Weight Estimation for Hanwoo Cow. Sustainability 2022, 14, 12661. [CrossRef]
- Li J.; Wang, P.; Xiong, P.; Cai, T.; Yan, Z.; Yang, L.; Liu, J.; Fan, H.; Liu, S. Practical Stereo Matching via Cascaded Recurrent Network with Adaptive Correlation. arXiv 2022, arXiv:2203.11483.
- Kazhdan, M.; Bolitho, M.; Hoppe, H. Poisson Surface Reconstruction. In Proceedings of the Fouth Eurographics Symposium on Geometry Processing (SGP 2006), Cagliari, Italy, 26-28 June 2006; Volume 7. https://api.semanticscholar.org/CorpusID:14224.
- Qi, C.R.; Su, H.; Mo, K.; Guibas, L.J. PointNet: Deep Learning on Point Sets for 3D Classification and Segmentation. In Proceedings of the IEEE Conference on Computer Vision and Pattern Recognition (CVPR), Honolulu, HI, USA, 21-26 July 2017; pp. 77-85.
- Sergey, I.; Boisits. CatBoost: unbiased boosting with categorical features. arXiv 2018, arXiv:1706.09516.
- Ke, G.; Meng, Q. LightGBM: A Highly Efficient Gradient Boosting Decision Tree. In Proceedings of the 31st International Conference on Neural Information Processing Systems, Long Beach, CA, USA, 4-9 December 2017; pp.3146-3154.
- Hastie, T.; Tibshirani, R.; Friedman, J. The Elements of Statistical Learning, 3rd ed.; Springer, 2009.
- Breiman, L. Random Forests. Machine Learning 2001, 45(1), 5-32.
- Chen, T.; Guestrin, C. XGBoost: A Scalable Tree Boosting System. arXiv 2016, arXiv:1603.02754.
- Shin, Y.-H.; Son, K.-W.; Lee, D.-C. L Sematic Segmentation and Building Extraction from Airborne LiDAR Data with Multiple Return Using PointNet++. Appl. Sci. 2022, 12, 1975.
- Abadi, M.; Barham, P.; Chen, J.; Chen, Z.; Davis, A.; and et al. TensorFlow: A System for Large-Scale Machine Learning. In Proceedings of the 12th USENIX Symposium on Operating Systems Design and Implementation (OSDI 16), Savannah, GA, USA, 2-4 November 2016; pp.265-283.
- Jolliffe, I.T. Principal Component Analysis. J. Stat. Plan. Inference 2002, 31(2), 331-336.
Figure 1.
Multiple-camera system. (a) System design; (b) Real-world deployment
Figure 1.
Multiple-camera system. (a) System design; (b) Real-world deployment
Figure 2.
Left infrared images from our capturing system.
Figure 2.
Left infrared images from our capturing system.
Figure 3.
Two random of 3D Korean cattle mesh data after reconstruction.
Figure 3.
Two random of 3D Korean cattle mesh data after reconstruction.
Figure 4.
Weight distribution of Korean cattle used in this study.
Figure 4.
Weight distribution of Korean cattle used in this study.
Figure 5.
Overview structure diagram of proposed pipeline.
Figure 5.
Overview structure diagram of proposed pipeline.
Figure 6.
Three body dimensions of Korean cattle.
Figure 6.
Three body dimensions of Korean cattle.
Figure 7.
Torso segmentation (left), and center body segmentation (right).
Figure 7.
Torso segmentation (left), and center body segmentation (right).
Figure 8.
PointNet Architecture for 3D segmentation [
18].
Figure 8.
PointNet Architecture for 3D segmentation [
18].
Figure 9.
Simple schematic of regression machine learning for weight prediction.
Figure 9.
Simple schematic of regression machine learning for weight prediction.
Figure 10.
Schematic of K-fold cross-validation with k = 10.
Figure 10.
Schematic of K-fold cross-validation with k = 10.
Figure 11.
Cross-sampling.
Figure 11.
Cross-sampling.
Figure 12.
Torso segmentation training history plot.
Figure 12.
Torso segmentation training history plot.
Figure 13.
Center body segmentation training history plot.
Figure 13.
Center body segmentation training history plot.
Figure 14.
Segmentation results with the case of torso segmentation.
Figure 14.
Segmentation results with the case of torso segmentation.
Figure 15.
Segmentation results with the case of center body segmentation.
Figure 15.
Segmentation results with the case of center body segmentation.
Figure 16.
Posture correction using PCA: (a) Top view; (b) Side view.
Figure 16.
Posture correction using PCA: (a) Top view; (b) Side view.
Figure 17.
Extracting body length from 3D segmented torso.
Figure 17.
Extracting body length from 3D segmented torso.
Figure 18.
Extracting chest girth and chest width from segmented center body.
Figure 18.
Extracting chest girth and chest width from segmented center body.
Figure 19.
Scatter plot of the relationship between three body dimensions and Korean cattle weight: (a) Body length and weight; (b) Chest girth and weight. (c) Chest width and weight.
Figure 19.
Scatter plot of the relationship between three body dimensions and Korean cattle weight: (a) Body length and weight; (b) Chest girth and weight. (c) Chest width and weight.
Figure 20.
Average MAE results of 10 folds.
Figure 20.
Average MAE results of 10 folds.
Figure 21.
Average MAPE results of 10 folds.
Figure 21.
Average MAPE results of 10 folds.
Figure 22.
Scatter plot of predicted weight values and measured weight values on different regression machine learning models: (a) CatBoost regression; (b) LightGBM regression; (c) Polynomial regression; (d) Random Forest regression; (e) XGBoost regression.
Figure 22.
Scatter plot of predicted weight values and measured weight values on different regression machine learning models: (a) CatBoost regression; (b) LightGBM regression; (c) Polynomial regression; (d) Random Forest regression; (e) XGBoost regression.
Table 1.
Definition of Korean cattle body dimension.
Table 1.
Definition of Korean cattle body dimension.
| Body dimensions |
Symbol |
Definition |
| Body length |
BL |
Horizontal length of the body |
| Chest girth |
CG |
Perimeter of the vertical body axis at the chest |
| Chest width |
CW |
Maximum width of chest |
Table 2.
3D segmentation accuracy.
Table 2.
3D segmentation accuracy.
| Case |
Training Accuracy |
Validation Accuracy |
| Torso segmentation |
99.04% |
97.55% |
| Center body segmentation |
99.01% |
97.21% |
|
Disclaimer/Publisher’s Note: The statements, opinions and data contained in all publications are solely those of the individual author(s) and contributor(s) and not of MDPI and/or the editor(s). MDPI and/or the editor(s) disclaim responsibility for any injury to people or property resulting from any ideas, methods, instructions or products referred to in the content. |
© 2023 by the authors. Licensee MDPI, Basel, Switzerland. This article is an open access article distributed under the terms and conditions of the Creative Commons Attribution (CC BY) license (http://creativecommons.org/licenses/by/4.0/).
