1. Introduction
Although the UN reports that the annual population growth rate has been dropping (and is expected to keep dropping), the total population of the planet is expected to surpass 10 billion people in the 2050s [
1]. This increasing population prompts need for more sustainable source of food [
2], and perhaps the most challenging is a low-cost abundant protein source [
3]. It is now widely accepted that meat production uses more energy and has a greater negative environmental impact than plant-based meat alternatives [
4]. The average American meat-based diet demands more energy, land, and water resources in comparison to an ovo-lacto vegetarian diet, which underscores the need to shift from current meat-based food systems to sustainably meet the dietary demands of the increasing global population [
5]. In addition to poor protein conversion efficiency, meat-based diets are unhealthy [6-8], whereas vegetarian diets are associated with a long list of health benefits including: lower rates of death from ischemic heart disease, lower cholesterol levels, lower blood pressure, and lower rates of hypertension and type 2 diabetes [
9]. There are also public concerns about animal welfare [
10,
11] and serious public health issues related to animal diseases and animal husbandry practices that result in antibiotic-resistant bacteria [
12,
13]. Finally, agriculture is a major contributor to greenhouse gas (GHG) emissions; specifically, methane accounted for 35% of total food system GHG emissions in 2015 [
14]. Livestock is a leading source of global methane emissions and in 2010, 23% of global temperature warming was attributed to livestock emissions [
15].
For these reasons, a more efficient plant-based protein diet may be used to mitigate the agriculture’s contribution to GHG emissions and other environmental hazards [
16,
17,
18]. This relates to UN Sustainable Development Goal 1 as the cost of animal-based protein has increased globally but can be particularly inaccessible because of costs in the developing world. Consumers have been shifting towards this as the plant-based market [
19] has grown from
$4.8 billion in 2018 to
$7.4 billion in 2020 [
20]. Although clinically vegan/vegetarian diets have proven healthy for humans [
21] and the planet [
22], converting to a plant-based diet is challenging for some [
23,
24]. To overcome this challenge a range of plant-based meat substitutes is under development [25-27] and commercialized (Beyond Meat, Impossible Burger, etc.) [
28]. Unfortunately, these meat substitutes are often more expensive than the meat they aim to replace. For example, at Walmart Canada, 340 g of Beyond Meat Ground Beef is CAD
$7.97 (2.3cents/g), while multiple 450 g farm ground beef options range from CAD
$4.97-7.47 (1.1 cent/g to 1.6 cents/g), which substantially restricts their uptake [
29,
30]. Yet alternative proteins on the market are generally substantially less costly than meat protein as shown in
Table 1. The protein cost was calculated by dividing the purchase cost by the protein content. Note that the purchase cost has been converted from the reported USD
$/lb to USD
$/kg.
As can be seen in
Table 1, the wholesale price of plant proteins ranges from 0.00294
$/g protein (rice) – 0.0142
$/g protein (spirulina) while meat purchase cost has an overall more expensive range of 0.0203
$/g protein (chicken) – 0.0946
$/g protein (lamb) (
Table 1). The most inexpensive plant protein cost is derived from the protein concentration of the raw source material without considering any protein isolation method costs. Raw green peas are the exception to this trend, due to the low protein content in comparison to other plant sources. Overall, soy is the most inexpensive plant protein, followed by pea, rice, and spirulina as the most expensive. To make these meat alternatives more appealing, they normally undergo substantial processing. In order to make meat substitutes more accessible the basic thermal and rheological properties are needed for alternative sources of protein and their processing, such as extrusion [
58]. This paper analyzes characteristics of spirulina, soy, pea, and brown rice proteins; these compounds naturally grow in various parts of the world and are commercially available. The thermal and rheological properties, viscosity, density, and particle size distribution are analyzed for feasibility comparisons that can be used for further study on alternative protein-based food processing and production. This study is important as it analyzes more sustainable sources of alternative protein, which can be used to reduce the environmental footprint of the agriculture industry. Specifically, this work provides a means of using economic screw extruders to process a wide range of plant-based proteins into low-cost edible food.
2. Materials and Methods
2.1. Materials
The alternative protein materials were sourced from Healthy Planet Canada and were as follows: spirulina [
42], soy protein isolate [
47], pea protein isolate [
52], and rice protein isolate [
57].
2.2. Density
Densities of all the materials were determine by 1) massing an empty one dram (3.69669 cm3) vial with a digital scale, 2) filling the vial with the material, packing it down to flatten the top and record the mass, 3) the bulk density (d) was given by the below equation where m is mass and V is volume:
2.3. Particle Size
Using a digital microscope (Celestron), a calibration slide (Walfront, Micrometer Calibration Slide) was imaged and imported into the open-source ImageJ package (version 1.53) [
59] and a line was drawn on the length of 1 division to provide the scale for all photos (938 pixels/mm). All five materials were then imaged three times using the same magnification of 200x.
It should be noted when placing the protein particles on the microscope slides, they would often clump together. To ensure even distribution, after the particles were placed onto the slide, they were brushed off slightly. The images were imported into ImageJ and with the scale were analyzed. Firstly, the colour threshold of the particles was adjusted to differentiate them from the background. Depending on the image a threshold method was chosen. The Shanbhag method [
60] was the most accurate, which selected only the particles and no additional area in the background. For some images the Shanbhag method did not work so other methods such as the Intermodes method [
61] was used. The particle size distribution was determined for each protein sample and the mean particle size was summarized.
2.4. Differential scanning calorimetry (DSC) analysis
Differential scanning calorimetry was conducted using a Mettler Toledo DSC 3 and the DSC STARe System to analyze the thermal stability of the materials by obtaining endothermic peak temperatures. DSC samples were both wet and dry. Dry samples were unchanged from the retail purchase. Wet (paste) samples were prepared by measuring 100 – 150 mg of each material into a clean aluminum boat and adding 50% by weight deionized water with a clean glass pipette. The paste was thoroughly mixed for 1 minute. Samples were prepared freshly immediately before each paste DSC run. 1.56 – 4.64 mg of each powder sample and 3.98 - 6.38 mg of each paste sample were weighed accurately and placed into an aluminum DSC pan, and then hermetically sealed. An empty pan was also hermetically sealed to be used as a reference. Both pans were placed into the module for the experiment. All samples were heated from 20-150ºC at a heating rate 5ºC/min. Nitrogen was used as a purge gas at flow rates of 30 or 50 mL/min, depending on the run. All DSC runs were analyzed to find the denaturation temperature (endothermic peak temperature) and the stable temperature processing ranges.
2.5. Viscosity measurements
A Brookfield DV-II+ with an S62 spindle viscometer was used to test the materials. 600 grams of the sample was measured and mixed with water to reach the desired concentration, referred to as Composition A. This sample slurry was transferred to a 600 mL glass beaker to undergo testing with the viscometer. The spindle was set 1.1 inches above the bottom of the beaker. The viscometer was set at RPM values of 5, 15, 25, 40, and 80. After testing concluded with composition A, additional water was added to reach composition B in the interest of saving sample material. The same experiment was duplicated with the new composition B. This method was repeated for all samples. A summary of compositions tested is shown in
Table 2.
3. Results
3.1. Density
The density of the alternative proteins is shown in
Table 3.
3.2. Particle Size
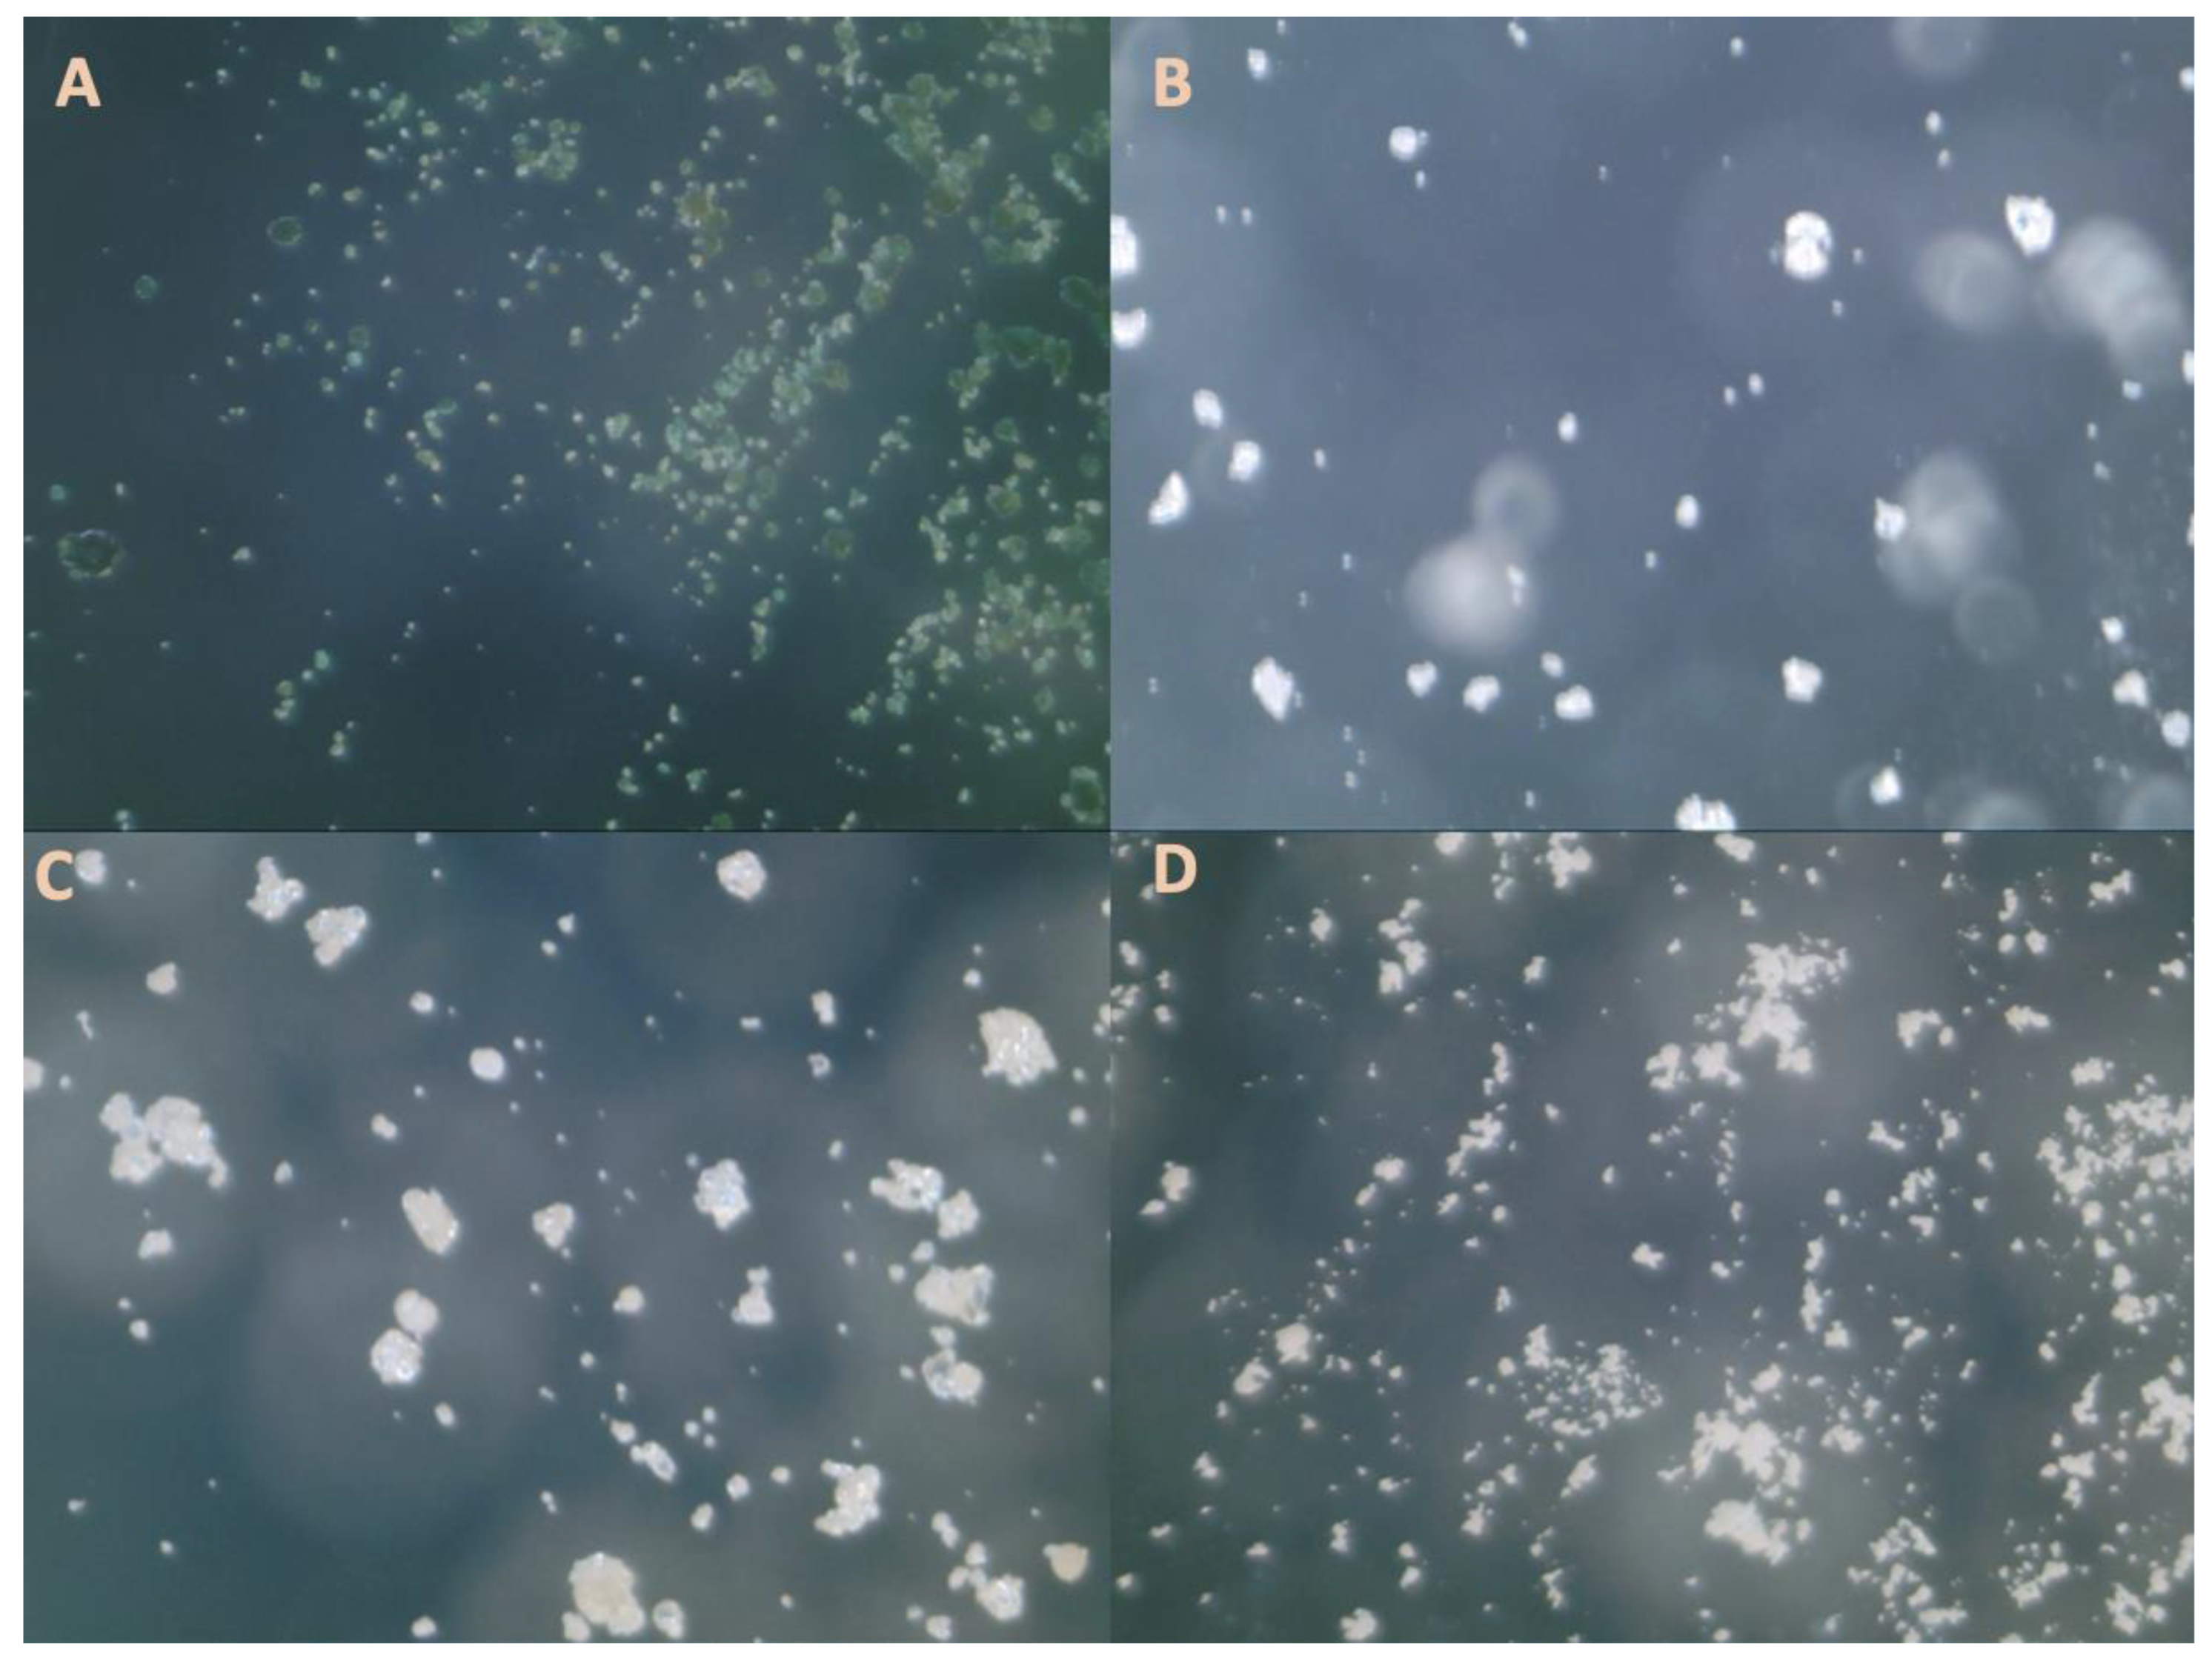
Figure 1 shows the micrographs and
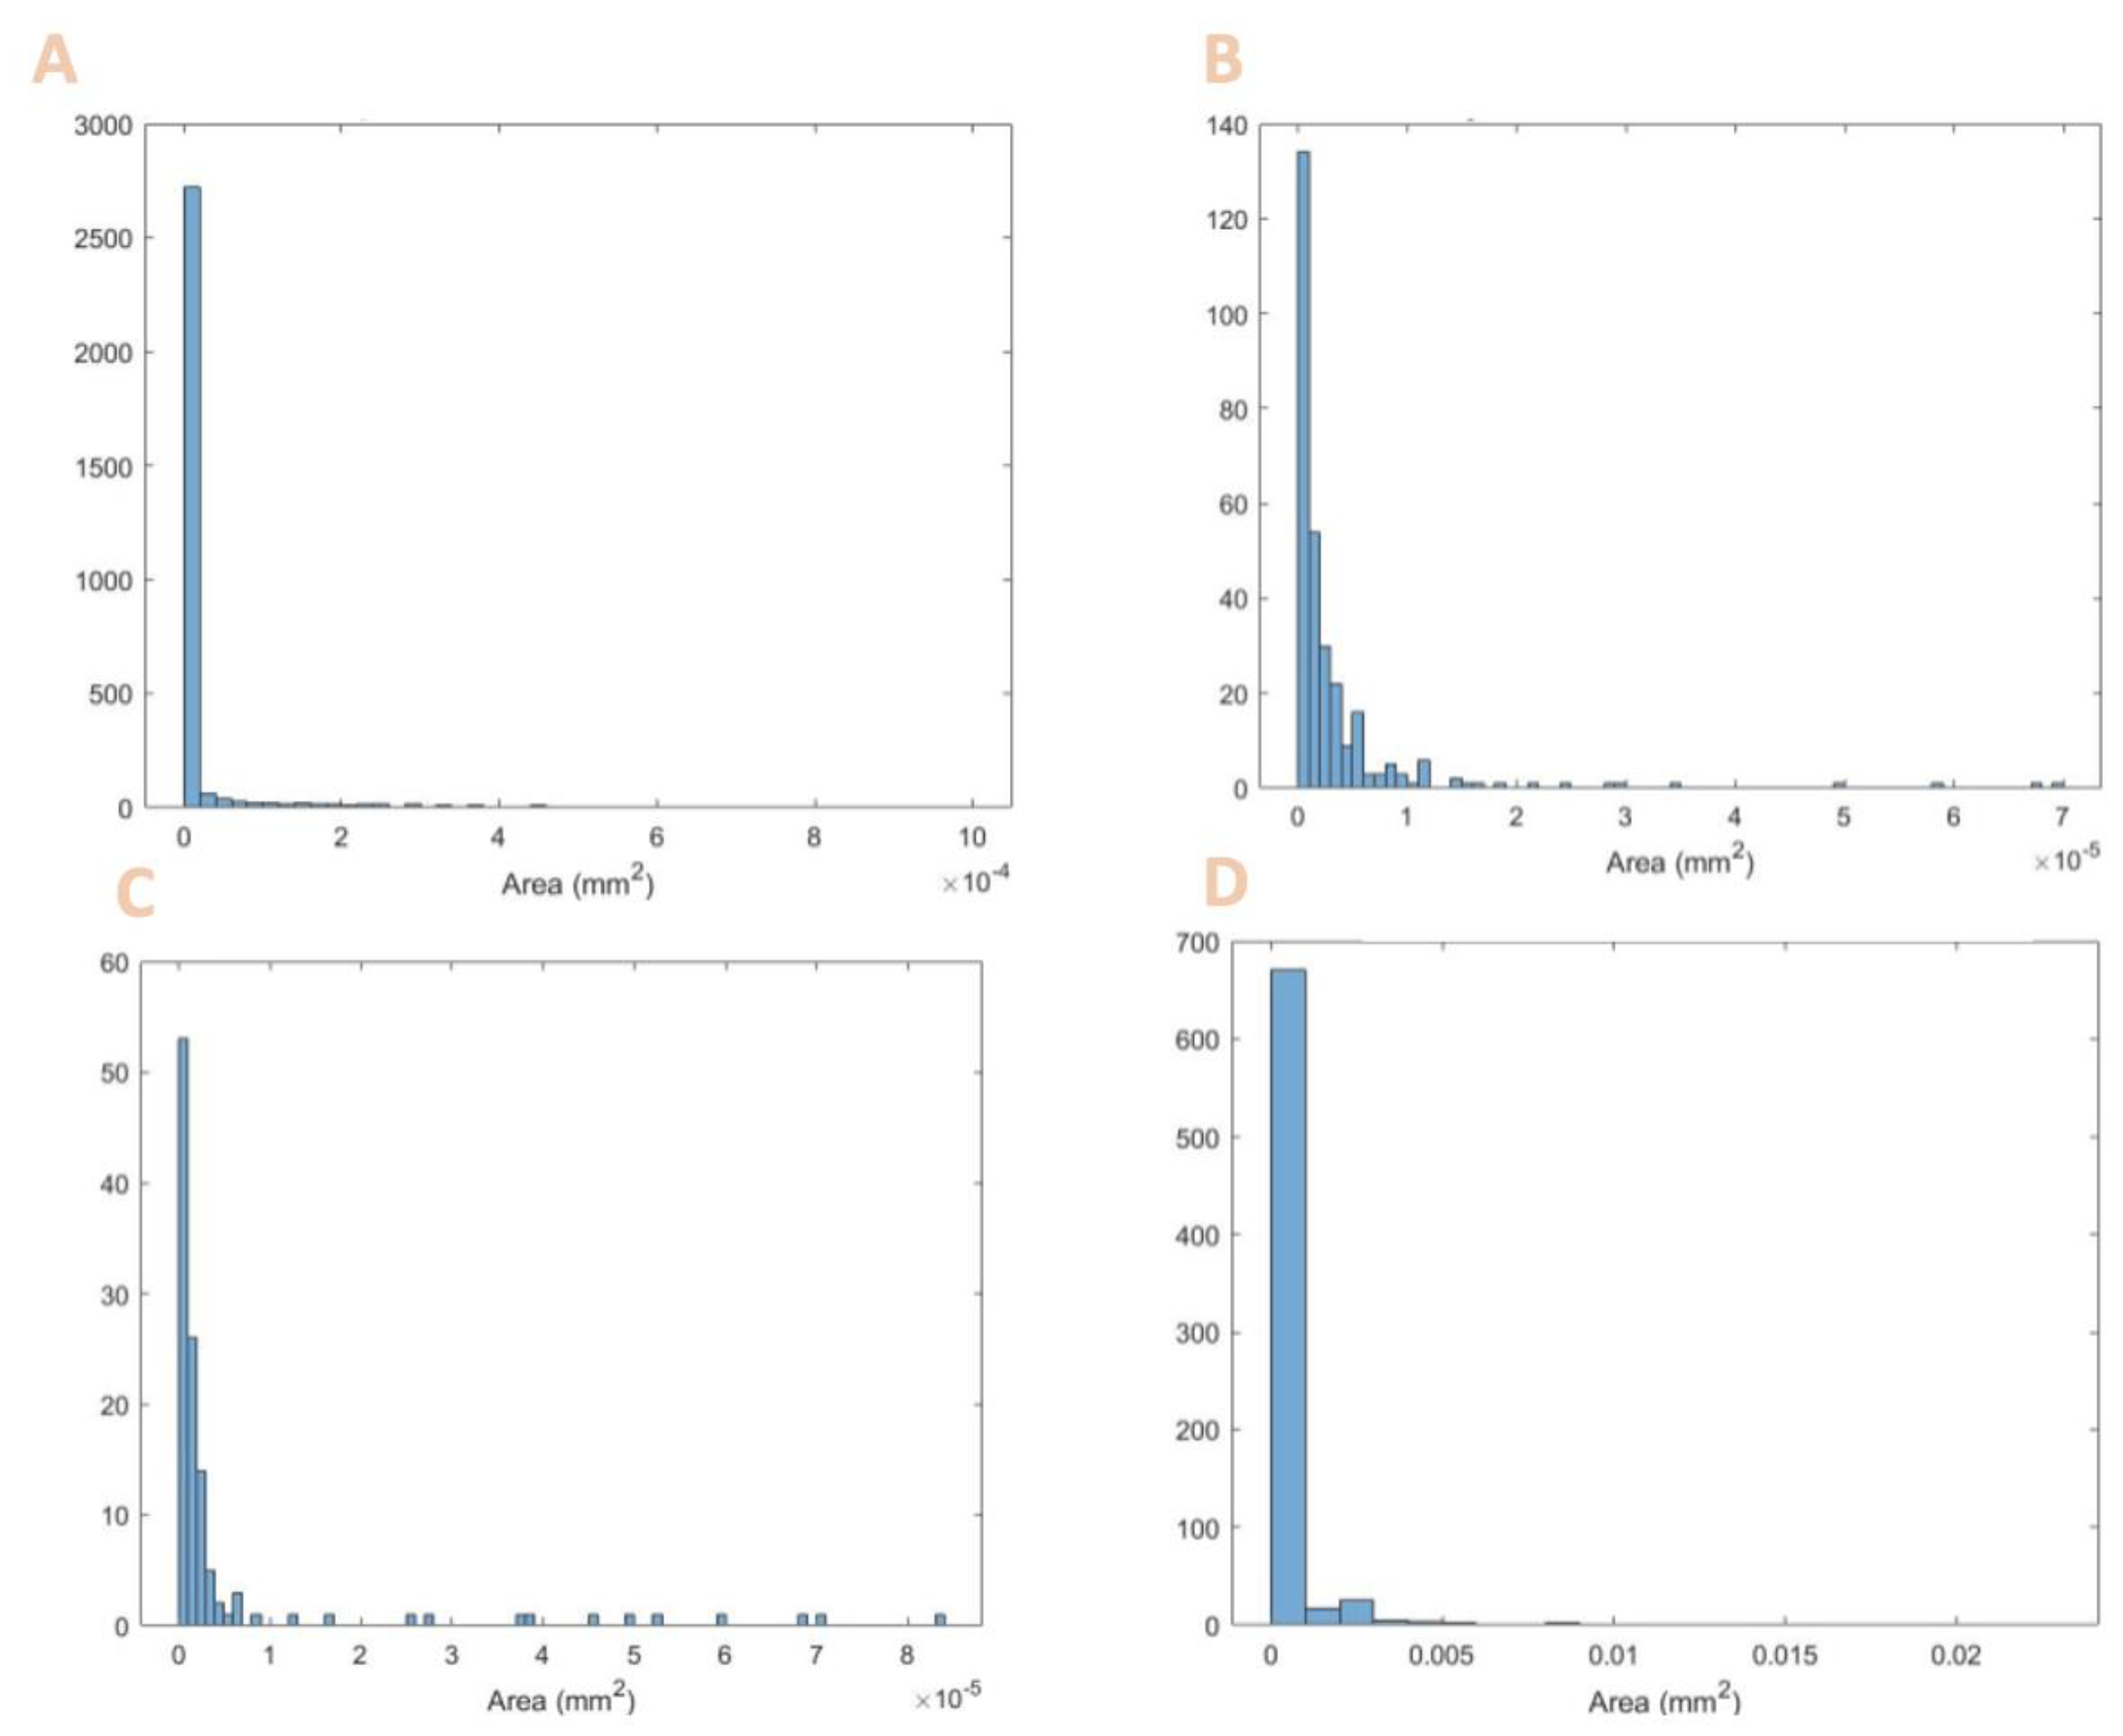
Figure 2 shows the histogram of particle size distribution for each protein powder.
Table 4 summarizes the particle size and provides literature values for comparison.
As seen from
Table 4, the diameters found fit the range of known values for that particle. Although some are the minimum accepted values, though they still fit within the range. The smaller particle sizes do enable some advantages in processing higher-resolution features.
3.3. DSC
3.3.1. Spirulina DSC Results
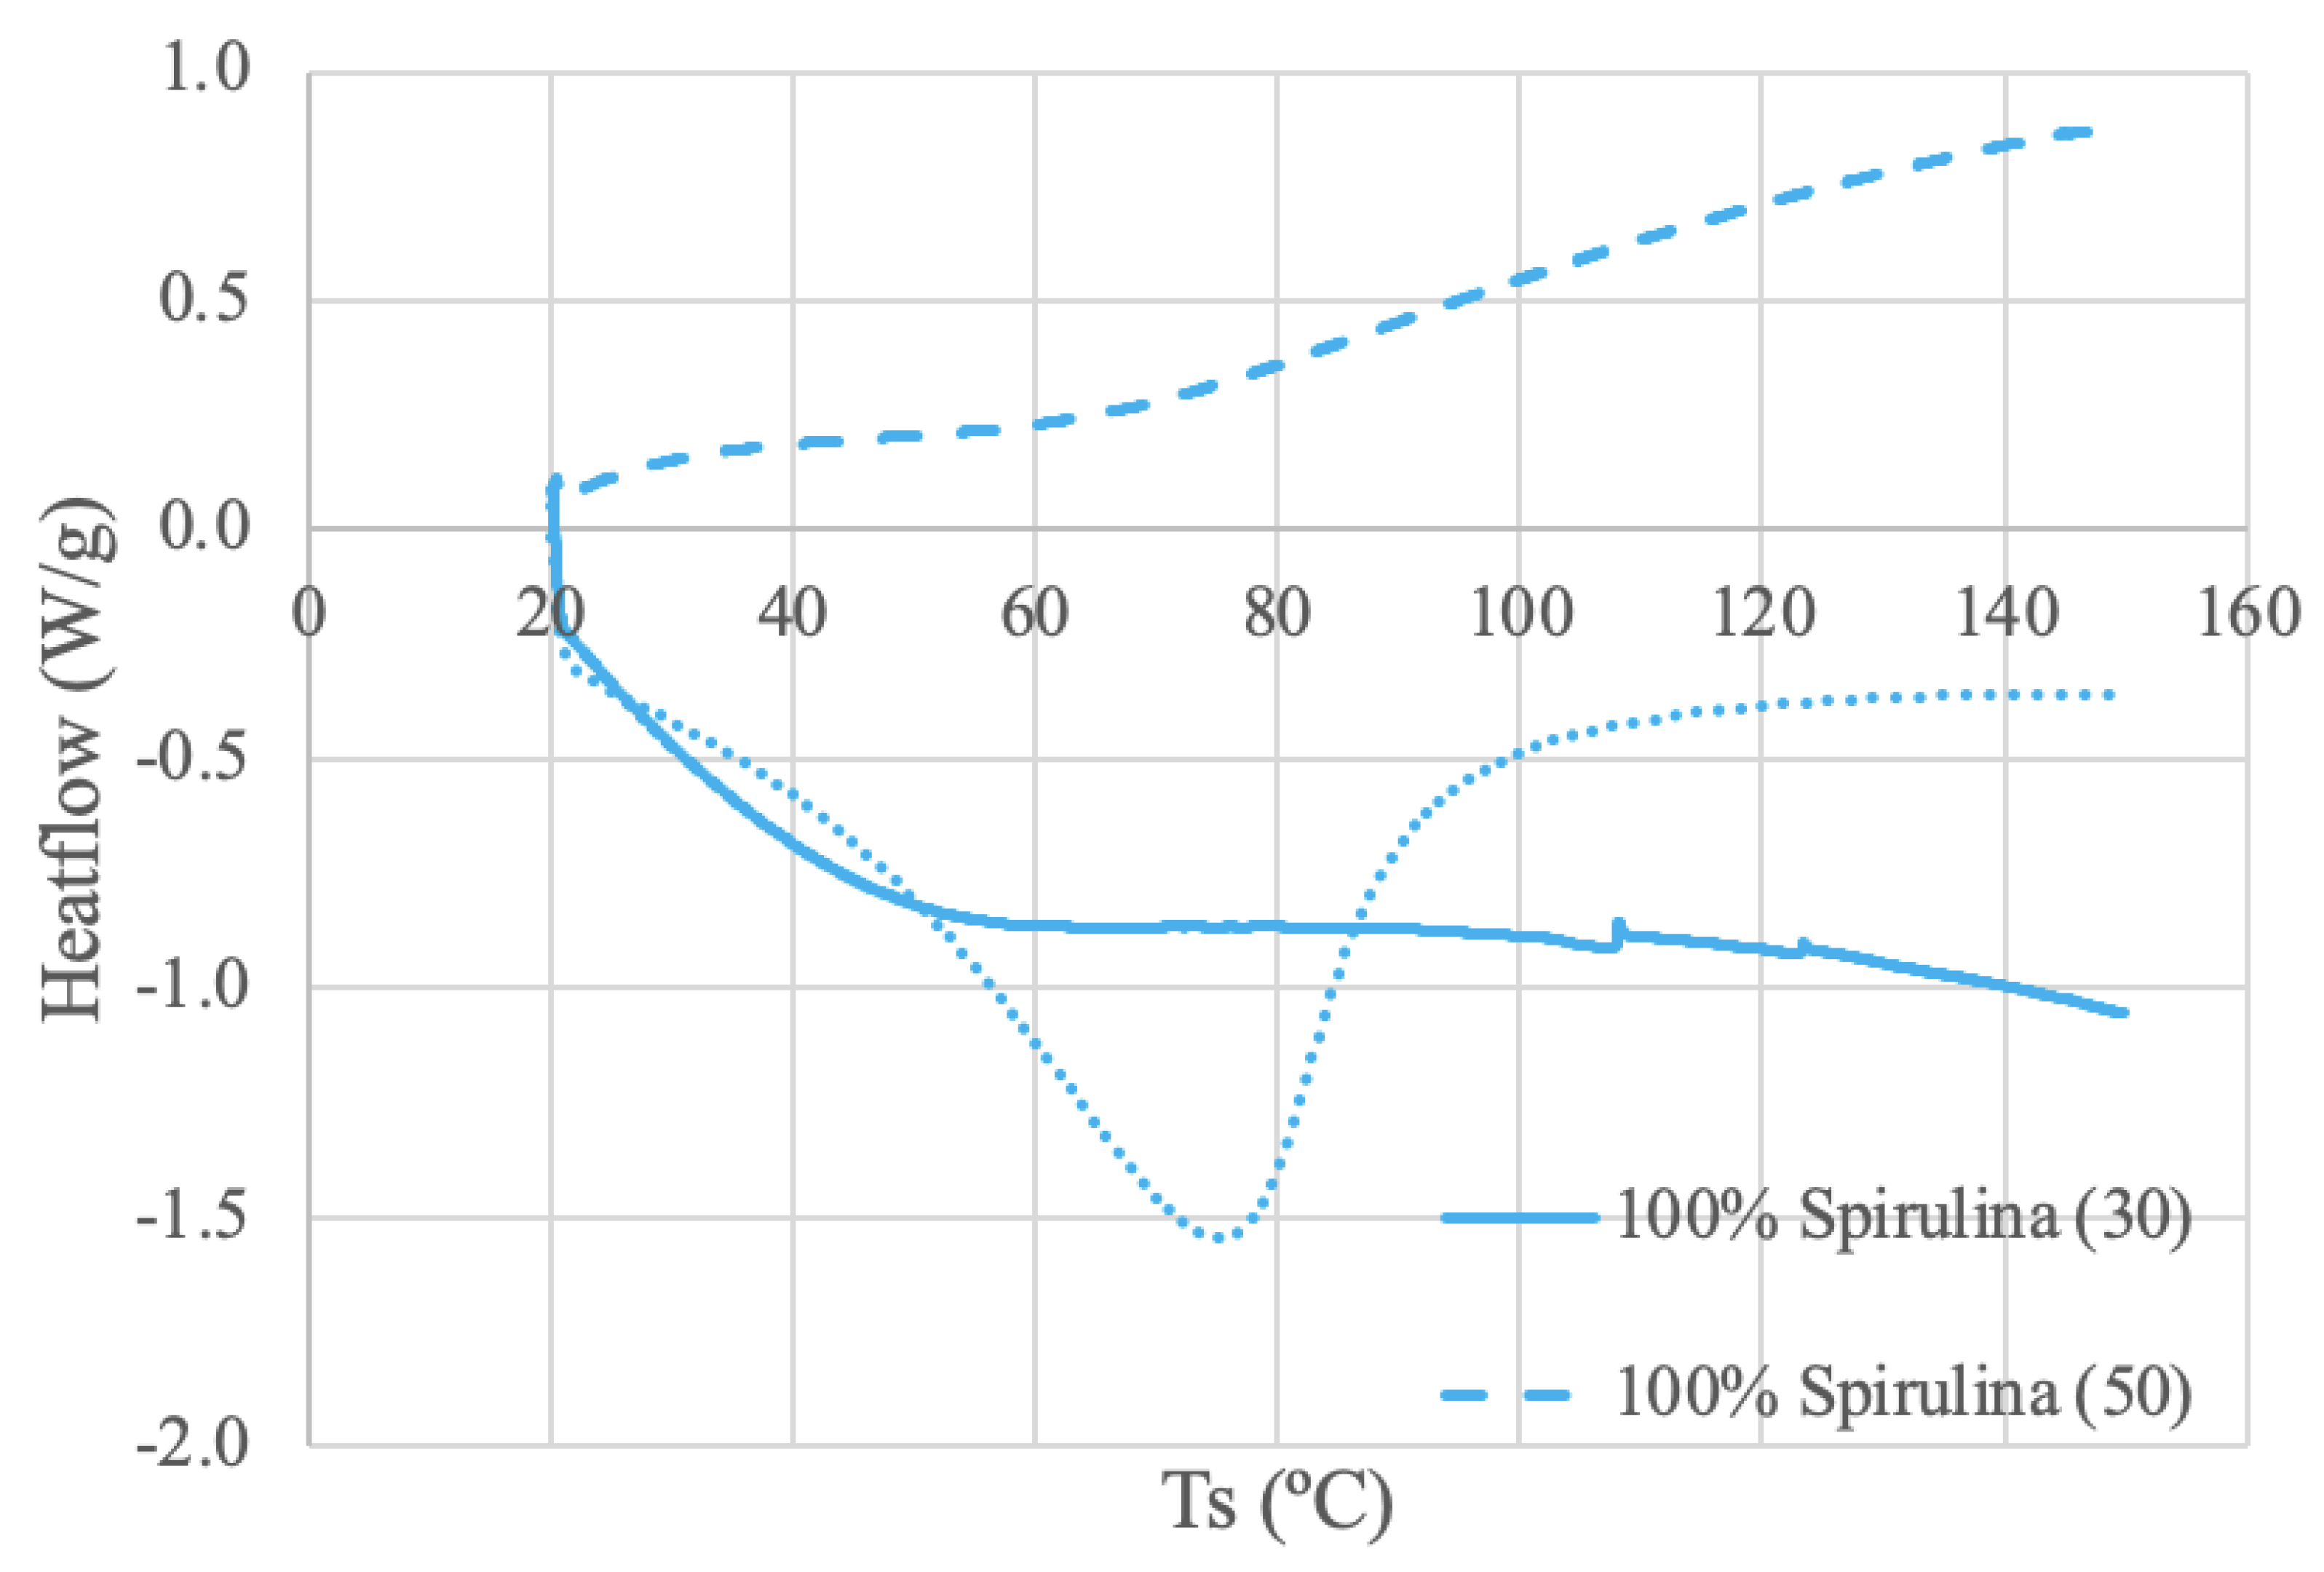
The spirulina protein samples were run under 3 different conditions: 100% spirulina powder using 30 mL/min N2 and 50 mL/min N2, and a 50-50 ratio of spirulina and deionized water paste using 50 mL/min N2. Despite having overall different curve shapes, both powder samples exhibit a relatively linear trend line between 70-90ºC. Thermal deviations are evident in the Spirulina (30) curve around 107ºC and again around 125ºC. This activity may be interpreted as possible thermal transition temperatures. Alternatively, the slight spikes may be an electrical effect and a result of static electricity discharge, although no significant power disturbance was observed [
66]. A DSC study using 4 mg of spirulina protein isolated from spray-dried algal powder and dissolved in a 20 mL buffer solution displayed a DSC curve with a similar stability range of 73-83ºC [
67]. The same curve also illustrated an endothermic melting phase change at 108.7ºC, like the Spirulina (30) [
67]. The DSC analysis in this study used a heating rate of 10ºC/min over a temperature range of 30-180ºC [
67]. There are noticeable differences between the literature and obtained results, which can most likely be attributed to the differences in sample preparation and source material. Moreover, the different shapes of the powder curves may be attributed to increased heat transfer through increased purge gas flow rate [
68].
The spirulina and water paste curve looks like a more typical DSC curve with an obvious baseline and clear endothermic peak around 76ºC. In comparison, the dry samples lack the obvious thermal deviation present in the paste, demonstrating the amorphous shape of the dry curves [
66]. Further, the difference in curve shape between the paste and powder samples suggests that a lower water content results in a lower denaturation enthalpy (∆Hd), assuming peak area is equal to the enthalpy of denaturation [
69]. This same result was reflected in a study using water and soybean protein [
70]. Increasing heat promotes denaturation, and proteins unfold and lose their structure during denaturation [
70]. Dehydration was determined to increase destabilization in the unfolded state [
70]. Compared to folded, the unfolded state permits more contact between the compound and water [
70]. Therefore, the unfolded state should have more internal bonding and be more compact at low water levels which results in a lower ∆Hd [
70]. Moreover, the paste curve’s endothermic peak (76ºC) is located within the assumed stable temperature range of the dry samples (70-90ºC). This discrepancy may be attributed to the decrease in water content. The lack of water may result in a rise in denaturation temperature (Td), also due to the destabilization of the unfolded states [
70].
3.3.2. Soy Protein DSC Results
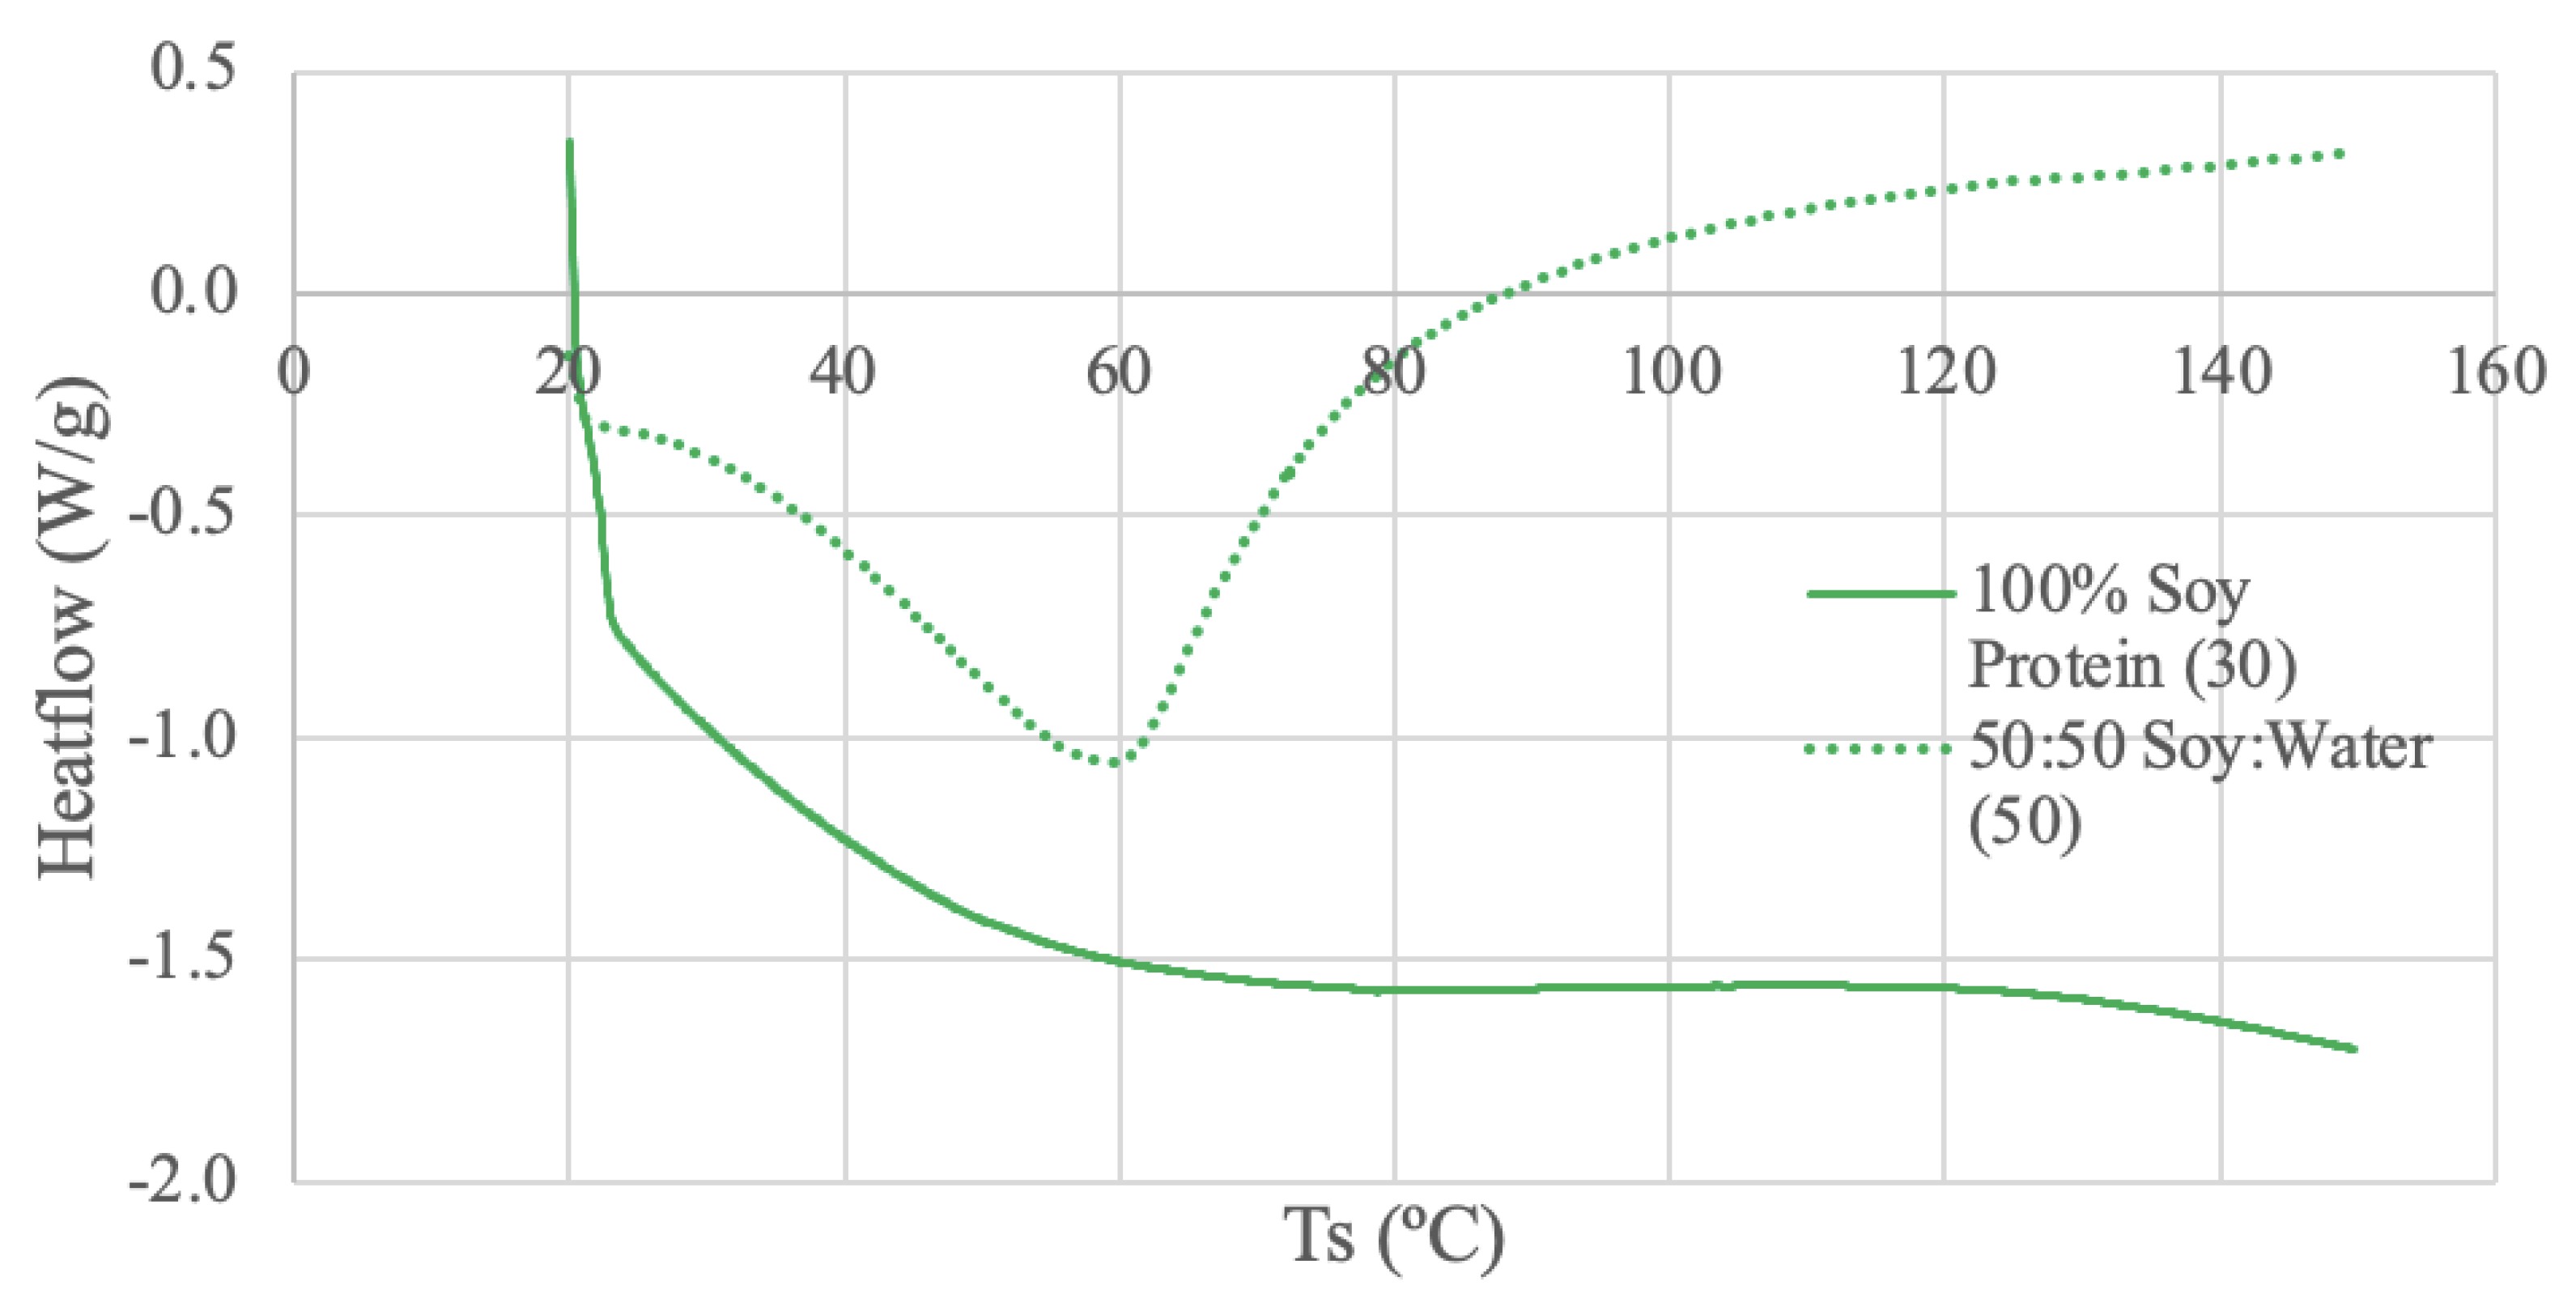
The soy protein samples were run under 2 different conditions: dry powder using 30 mL/min N2, and a 50-50 ratio of soy protein and deionized water using 50 mL/min N2. The dry sample thermogram does not exhibit distinct peaks or deviations, but a plateaued temperature range is exhibited from 87-116ºC. The dry sample curve also has a large endothermic start-up hook, which may be attributed to calibration between the sample and reference pans [
71]. This large start-up sloping baseline can hinder the detection of weak transitions [
71]. The DSC study using soybean protein extracted from soybean flour exhibits similar looking curves as obtained for low water contents (1% and 5% water content) [
70]. Little thermal activity was observed for the soy globular protein samples at low water contents, and only until after 150ºC were any deviations visible, which is outside the temperature range of
Figure 4 [
70]. Another soybean protein DSC study using silver pans and a heating rate of 5ºC/min from 25 to 200ºC also found similar results [
72]. Soybean protein isolate with a low water content (11%) did not exhibit an endothermic peak until past 180ºC [
72].
The half soy protein, half deionized water sample exhibits an endothermic peak at 59ºC. The thermal activity for the paste sample is more distinct than the dry sample, likely due to the increased water content [
70]. Further, the slope of the curve increases after the peak, which suggests a shifted baseline [
71]. Baseline shifts can be caused by changes in specific heat which is evidence the sample has gone through a transition, such as melting [
71]. A different DSC study using soybean protein extracted from soybean flour and mixed with distilled water at a 50-50 ratio demonstrated an endothermic peak of approximately 110ºC [
73]. The DSC conditions for this study were a heating rate of 10ºC/min between 20 to 130ºC, nitrogen flow rate of 50 mL/min, and aluminum pans [
73]. Despite the similar water content and DSC conditions, the endothermic peak temperatures are not similar which can likely be attributed to the differences in sample source and preparation. In the literature the water-protein paste was stored for 24 hours at 4ºC in polyethylene bags to promote even distribution of water, rather than just mixing followed by testing [
73]. Another DSC study comparing corn starch and soy protein ratios with 80% water content and heating rate of 5ºC/min from 25 to 150ºC also found different results [
74]. Despite having a water content of 80%, no endothermic peak was observed for the pure soy protein and water sample possibly due to previous heat treatment of the soy in manufacturing stages [
74].
3.3.3. Pea DSC Results
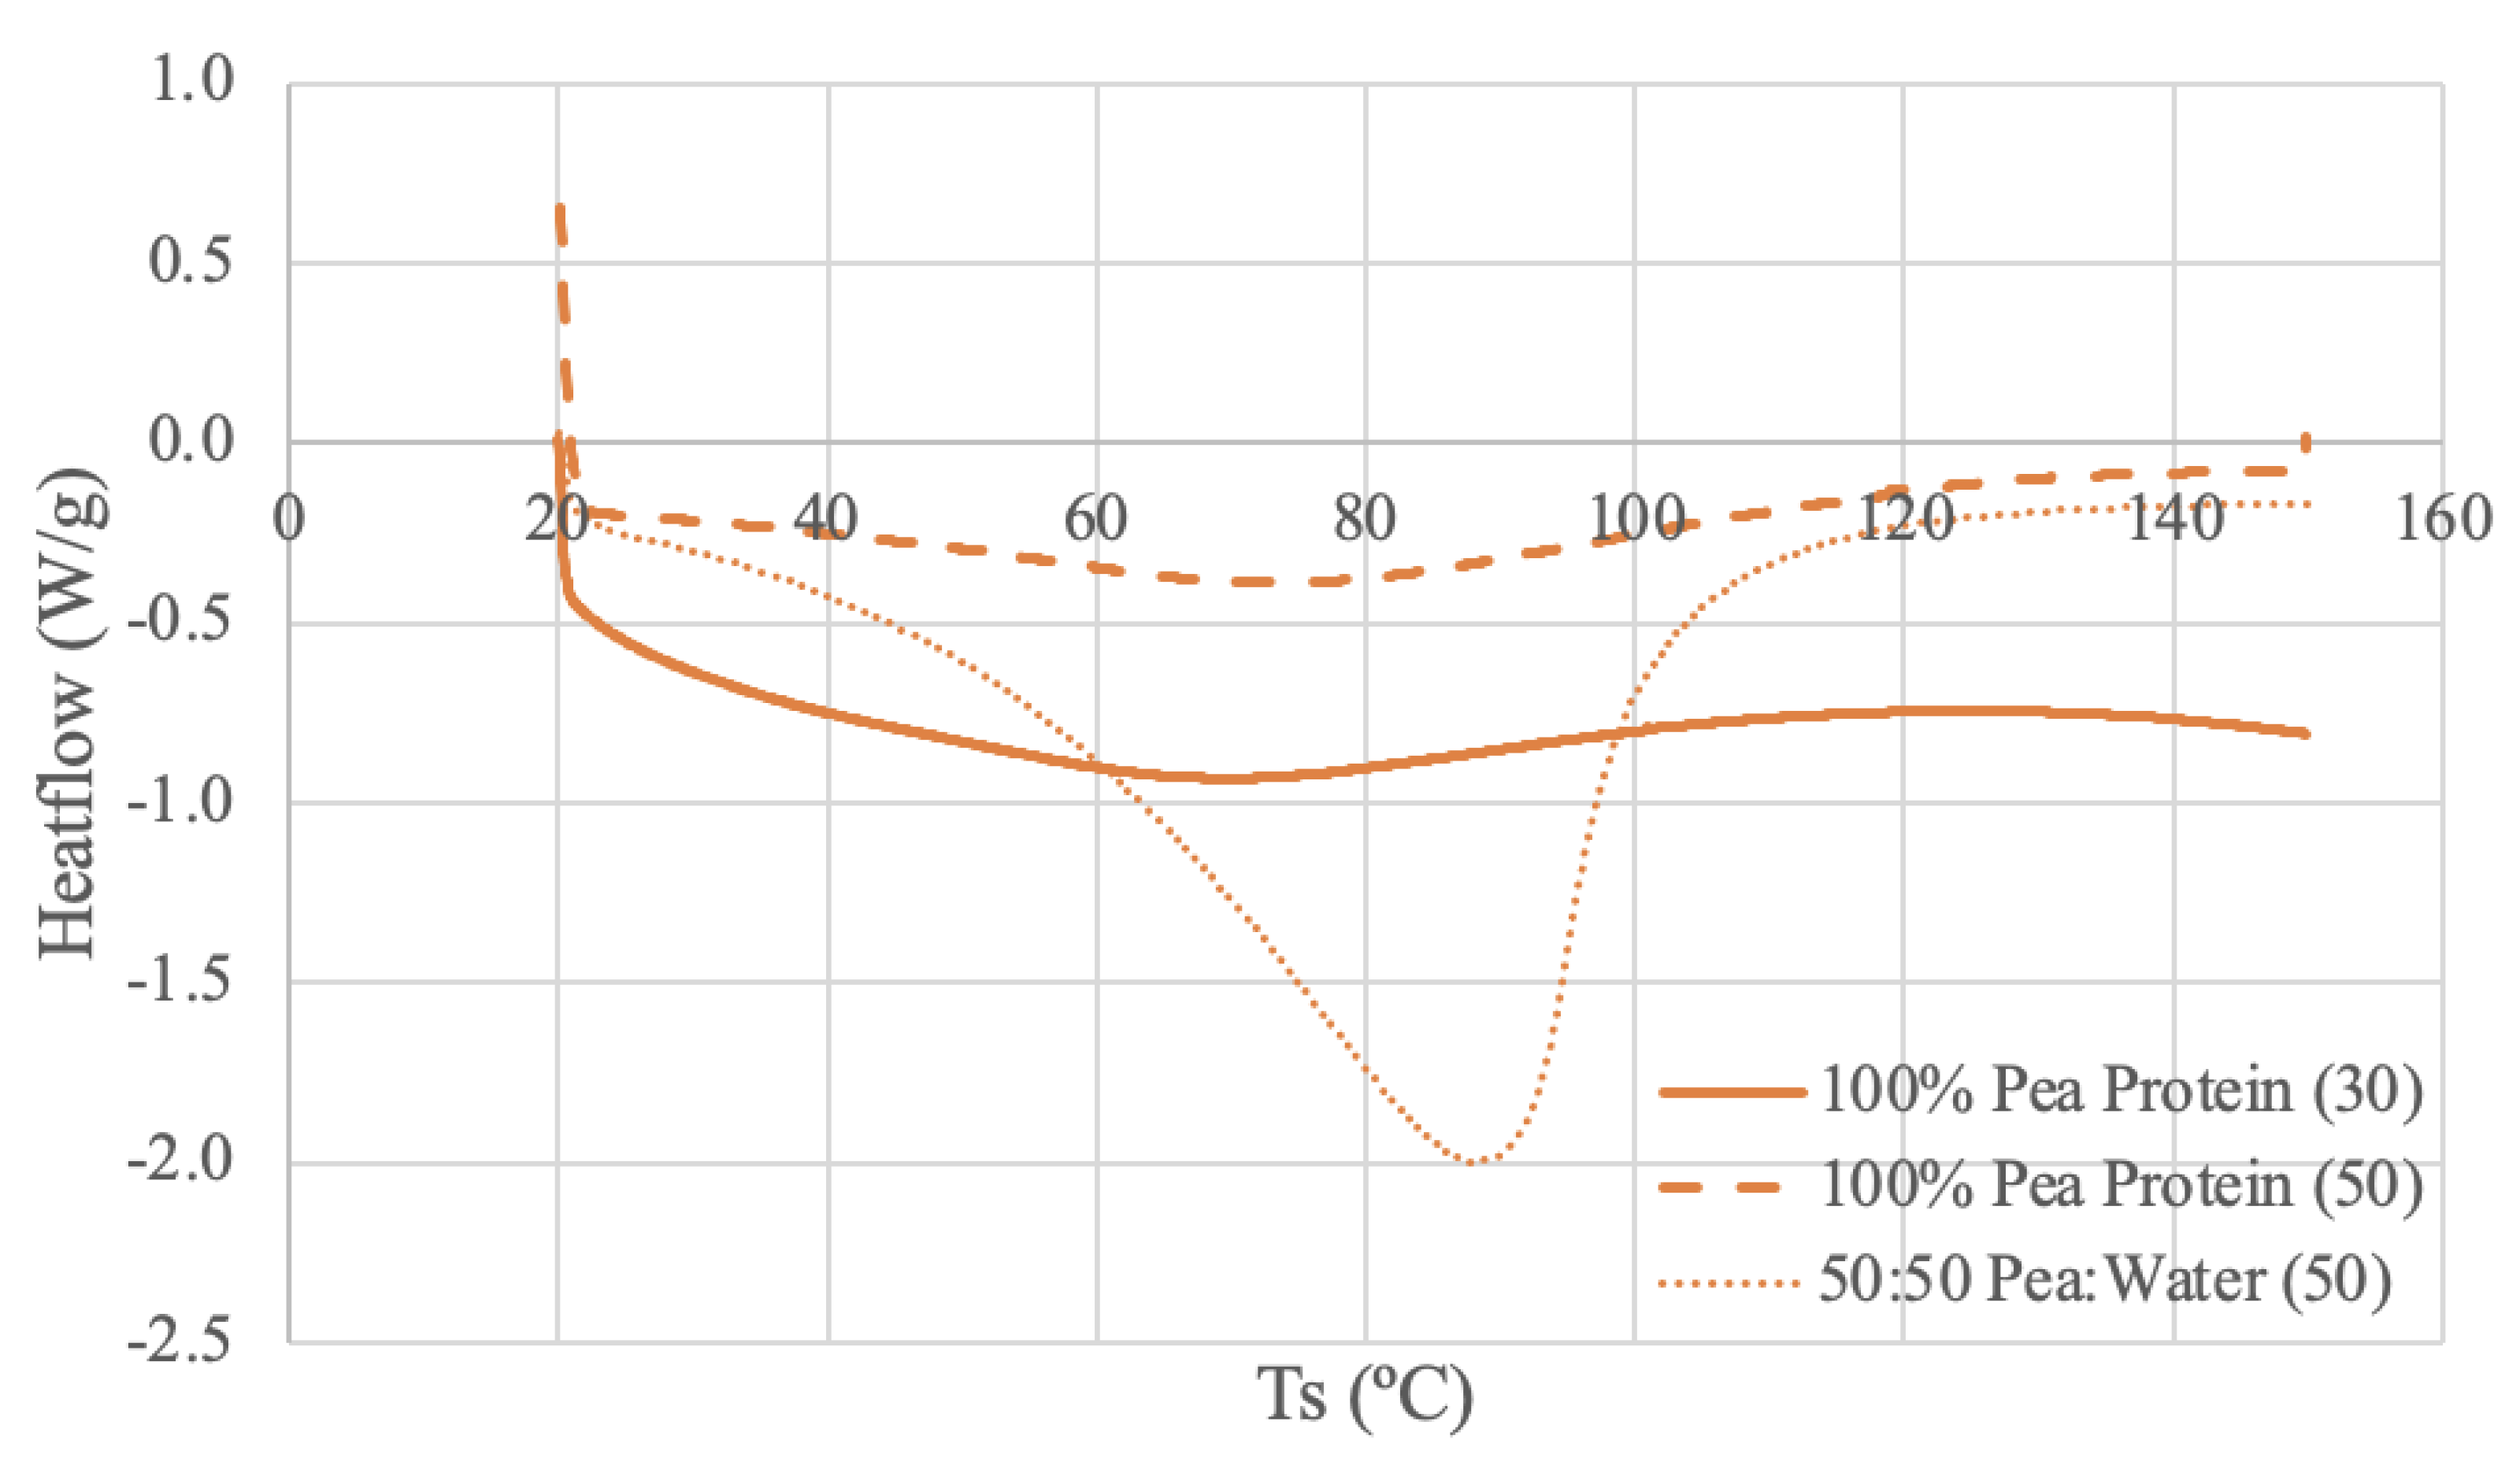
The pea protein samples were run under 3 different conditions: pure powder using 30 mL/min N2 and 50 mL/min N2, and a 50-50 ratio of pea protein and deionized water paste using 50 mL/min N2. Both dry samples have similar curve shapes and an indication of thermal activity through a broad endothermic peak from 67-77ºC. Pea Protein (50) has a longer endothermic start-up hook, potentially due to a larger baseline adjustment requirement because of the increased purge flow rate [
71]. The difference in heat flow levels is likely attributed to the varying nitrogen flow rate for the dry sample.
Comparing to the literature, a DSC study using low-denatured pea protein isolate and heating rate of 5ºC/min from 20 to 110ºC obtained similar results [
75]. The literature thermogram obtained only one broad endothermic peak around 78.5ºC [
75]. Another DSC study using field peas at a pea starch:water ratio of 1:2 and heating rate of 10ºC from 30-100ºC also obtained similar results of an endothermic peaks from 75.5-89.9ºC [
76]. Some literature reports both weaker and stronger peaks, possibly due to the denaturation of different components in peas like legumin and vicilin [
77]. The multiple peaks are not present in the observed data, which may be due to the endothermic start-up hooks which can diminish the detectability of weaker peaks [
71]. Further, previous heat treatment on the sample source such a spray-drying may have had thermal effects on the sample which would influence the shape of the DSC curve [
77].
The pea protein and water DSC run produced an endothermic peak around 89ºC. This value aligns with the high protein sample in the literature, despite having a different pea to water ratio of 1:2 versus 1:1 [
76]. The peak is more distinct than the dry peaks, which again suggests increased water content results in an increase in denaturation enthalpy [
70]. Unlike other samples, the paste curve appears to have a higher thermal stability than the powder curves, as the peak is at a higher temperature.
3.3.4. Brown Rice Protein DSC Results
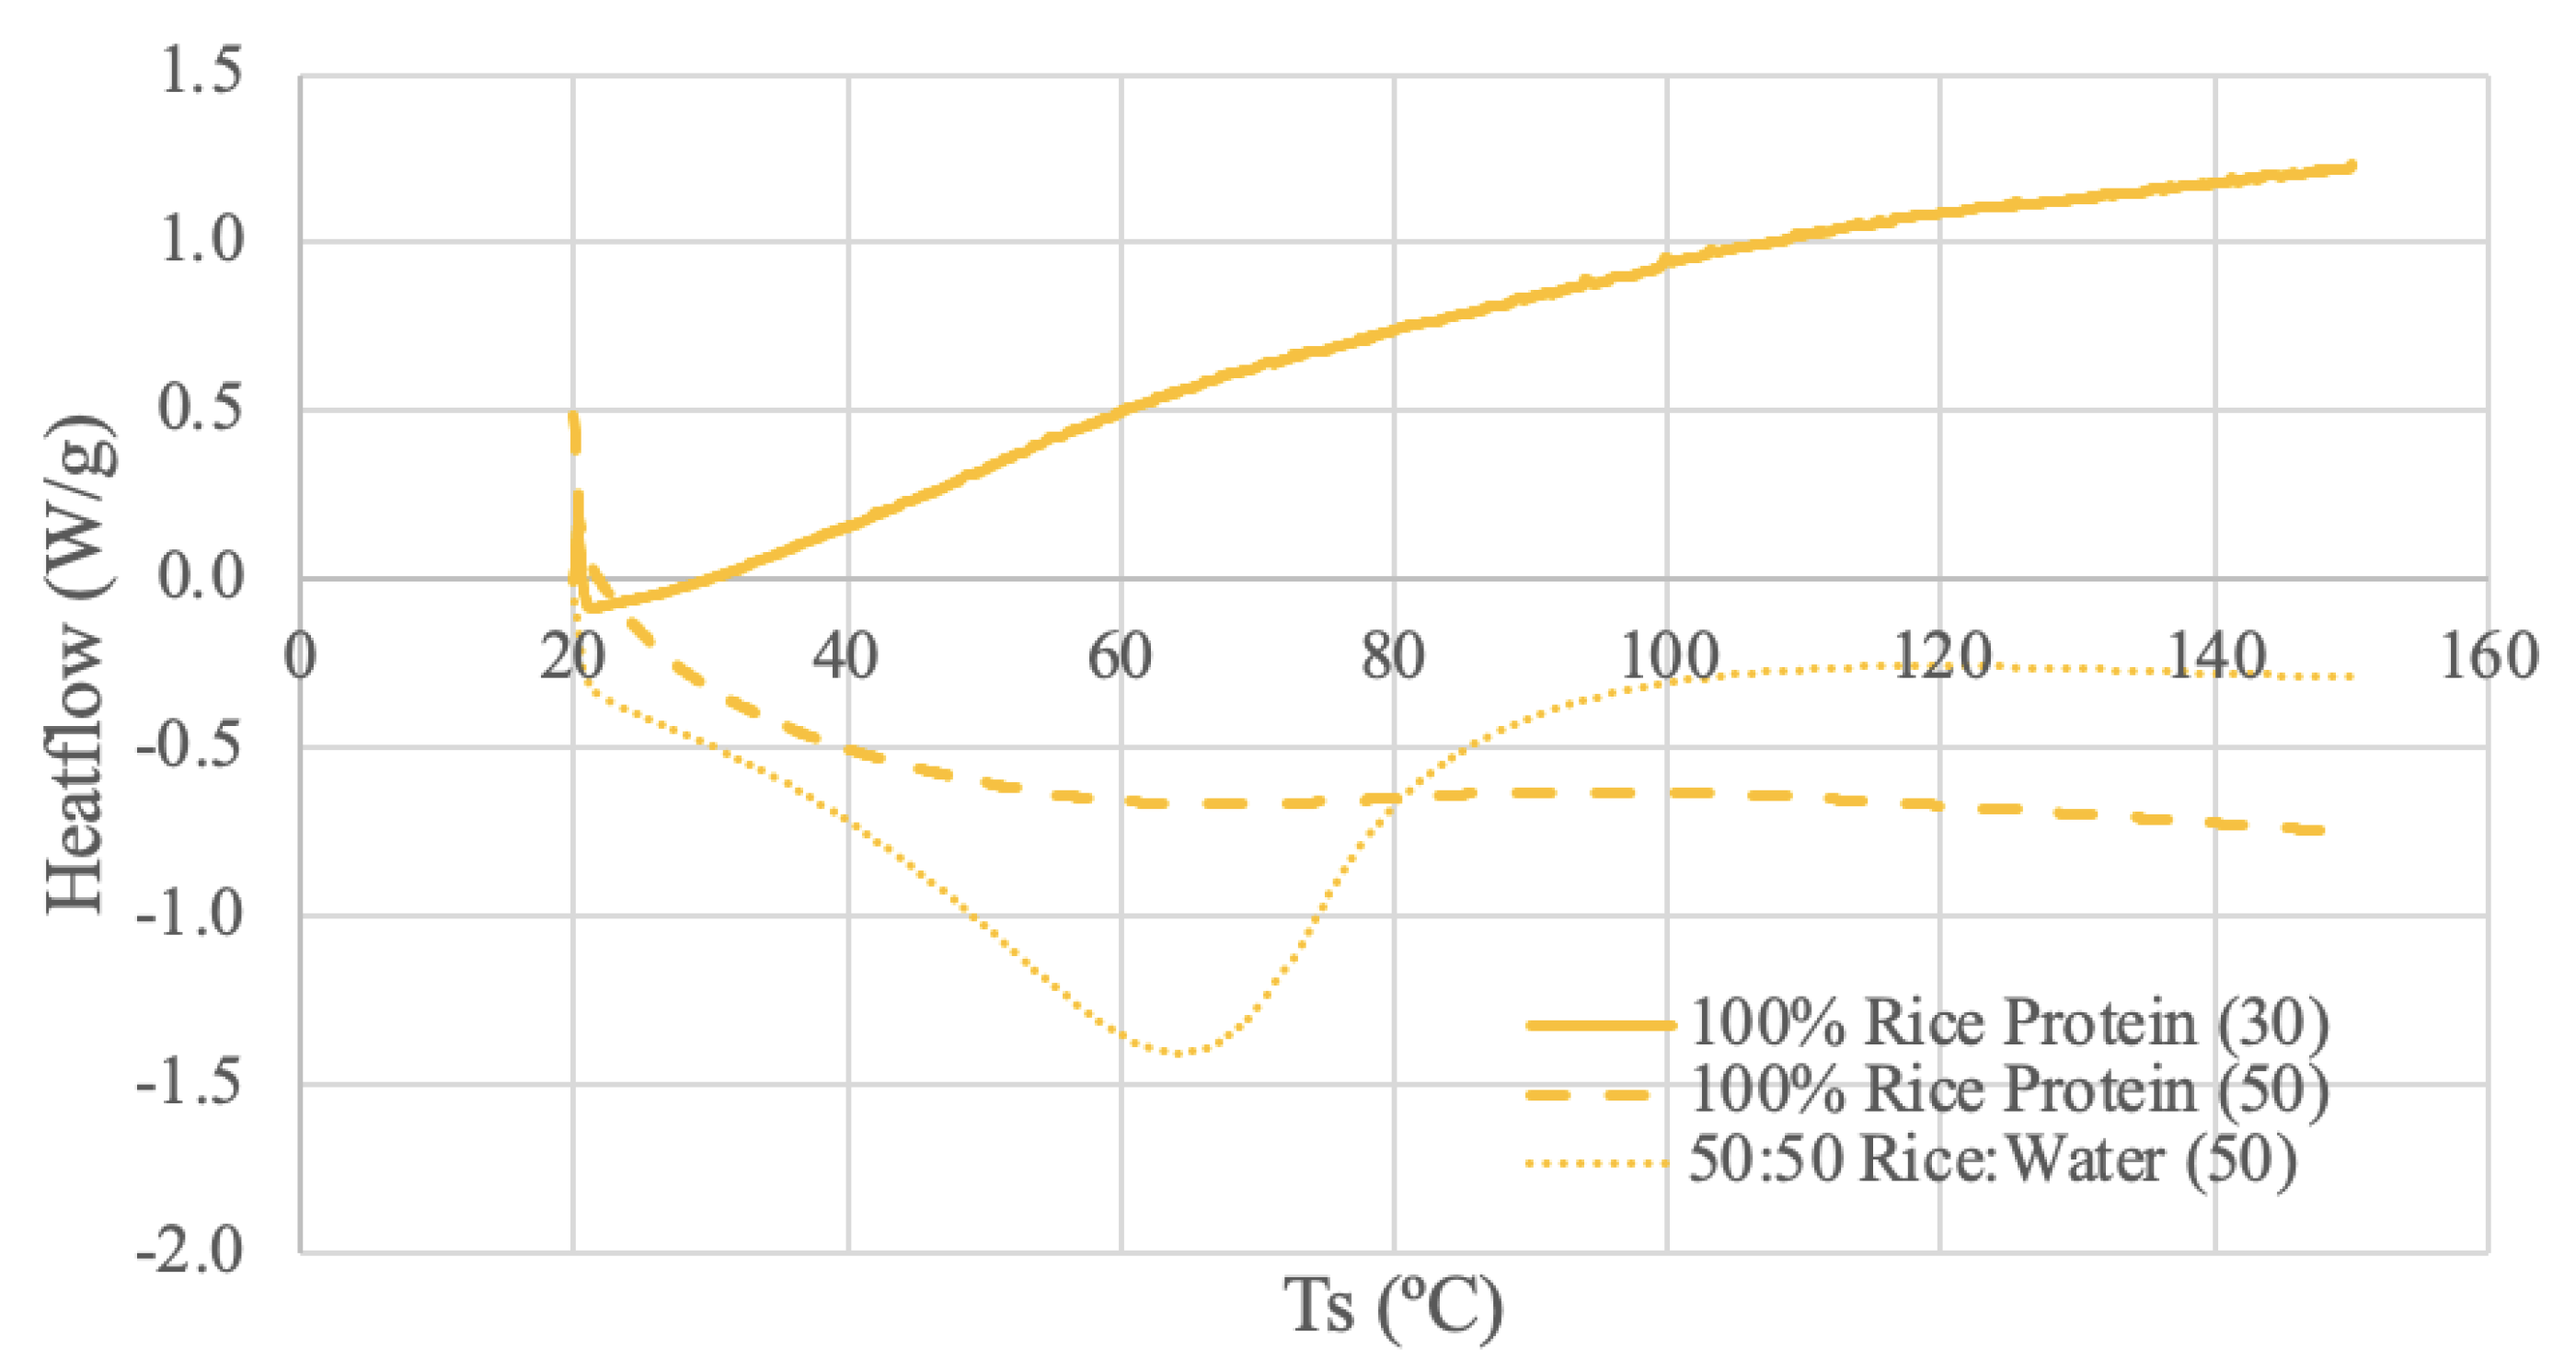
The rice protein samples were run under 3 different DSC conditions: dry rice protein powder using 30 mL/min N2 and 50 mL/min N2, and a 50-50 ratio of rice protein and deionized water using 50 mL/min N2. The Rice Protein (30) thermogram appears to calibrate at the beginning of the run and then have a consistently increasing slope. It is difficult to identify any meaningful temperature trends for this range. The Rice Protein (50) thermogram has a similar smooth and amorphous shape to the other dry sample, but with a different slope. A stable, plateaued temperature range can be observed between 87-97ºC for the Rice Protein (50) curve. There may be a glass transition occurring around 100ºC, as the slope of the curve decreases following this point [
66]. A study using rice protein derived from long-grain rice combined with soy protein produced very similar looking curves as the Rice Protein (50) [
78]. In this study a sample with a 1:0.1 ratio of rice protein:soy protein produced a very smooth and amorphous curve [
78]. However, 2 mg of the sample was mixed with 10 μL of distilled water and allowed to reach full hydration [
78]. Therefore, it may not be a completely accurate comparison, however this literature does demonstrate the possibility of amorphous curves and highlights the significance of sample preparation and source [
78].
The paste curve reaches a steady baseline and has a more distinct endothermic peak at 65ºC. Again, the water content of the paste sample appears to increase the denaturation enthalpy [
70]. A DSC study using 3 rice protein concentrates and a heating rate of 5ºC between 5ºC and 100ºC in an aluminum pan obtain peak temperatures of 63.6-70.2ºC [
65]. These values align with the peak value of the paste; however, the literature states the samples were powders [
65]. Regardless, obtaining a peak temperature within the range of the literature confirms that 65ºC is a reasonable endothermic peak temperature for rice protein.
3.4. Viscosity
Viscosity in cP at various RPM values were graphed. Viscosity curves often compare viscosity (units of cP or mPa*S) to shear rate (units of s-1). For a concentric cylinder viscometer, shear rate is equal to 1.7 times the RPM value of the outer cylinder [
79]. For the purposes of this analysis, shear rate is taken as proportional to RPM – when RPM increases, so does shear rate [
79].
Figure 7.
Spirulina Viscosity Curve.
Figure 7.
Spirulina Viscosity Curve.
3.4.1. Spirulina Viscosity Results
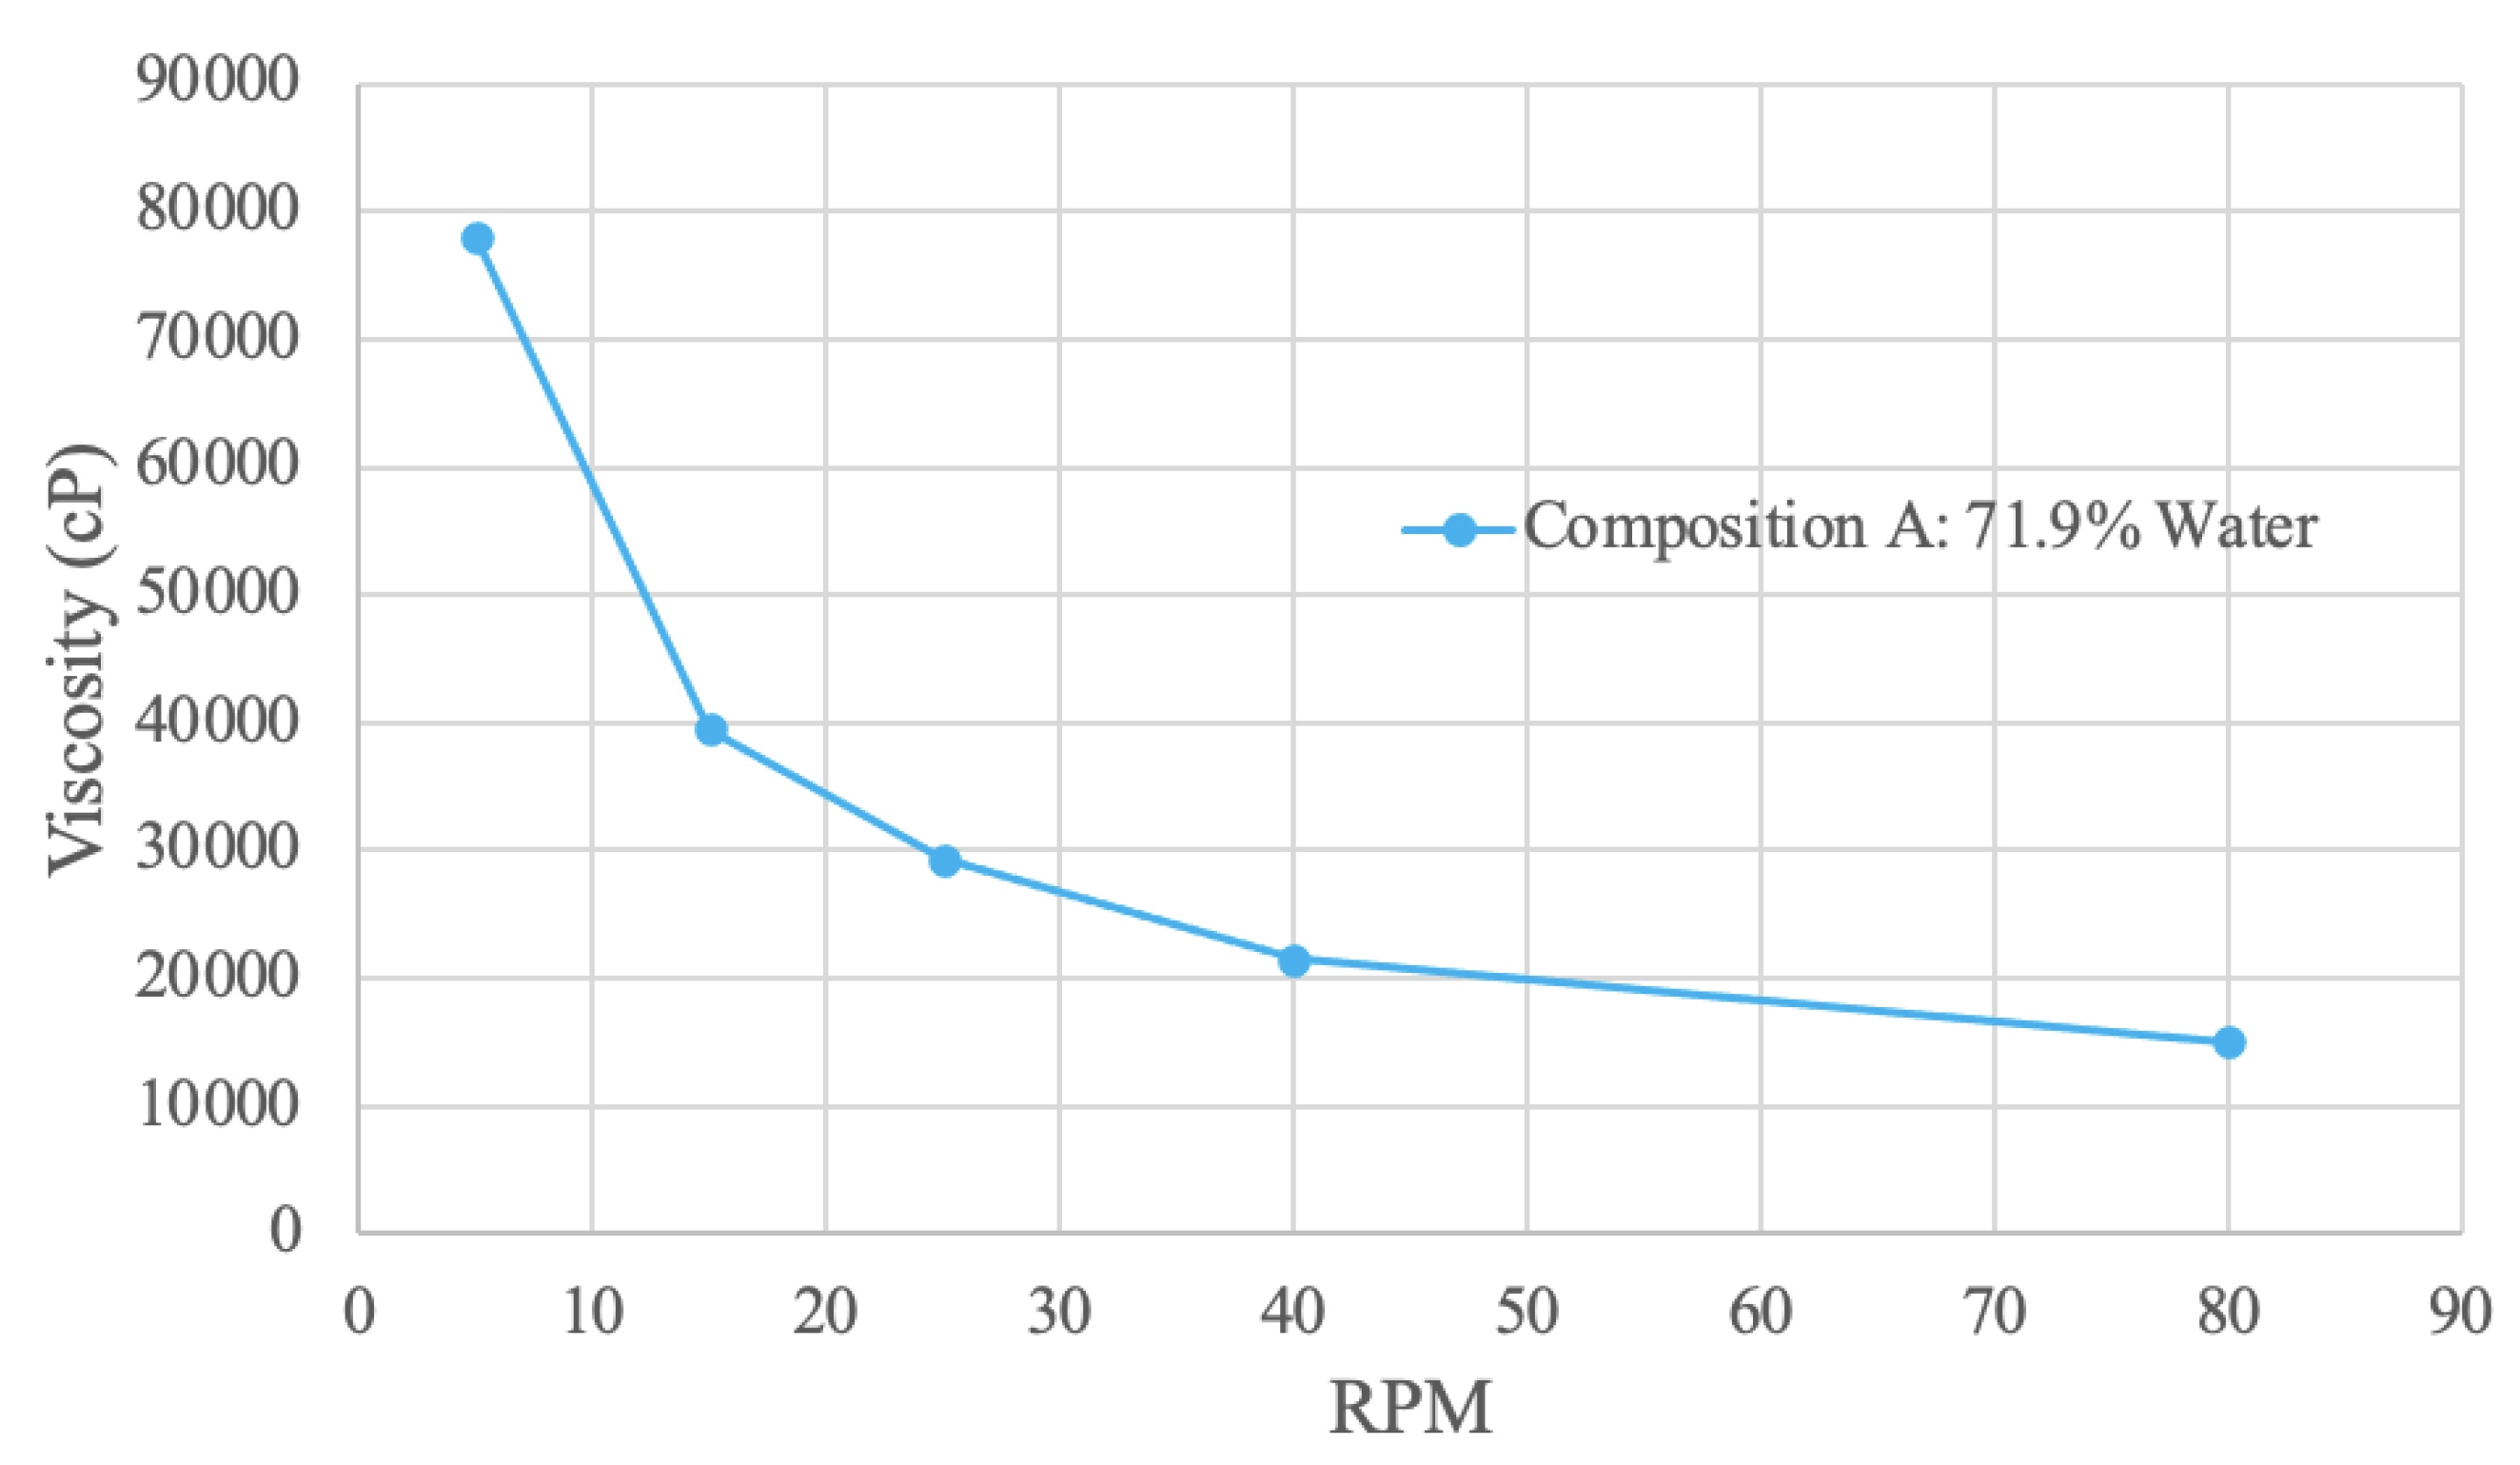
The spirulina sample viscosity results were obtained with a water concentration of 71.9%. The curve shape is exponentially decreasing – as RPM increases, viscosity decreases. Therefore, the sample exhibits shear-thinning behaviour, since RPM is proportional to shear rate [
79]. At 5 RPM, the viscosity value is 78000 cP, and decreases to 15100 at 80 RPM. The spirulina sample was also tested at 65% water; however, the viscosity was too high and could not be measured. This result is expected, as the increased solid concentration correlates with an increase in viscosity because of stronger intermolecular bonds [
80]. Conversely, an increase in water – the solvent – decreases the viscosity of the solution.
Similar trend results were obtained in a study using 2% spirulina concentration in a juice sample [
81]. In this study, the viscosity versus shear rate curve had a decreasing slope with viscosity values ranging from 3-5 mPa*s [
81]. However, similar viscosity values were not obtained, which is attributed to the different solution and lower spirulina concentration. Further, the addition of spirulina in the juice sample significantly increased the viscosity of the juice [
81]. This observation from the literature aligns with the result of the 65% water sample having a greatly increased viscosity.
3.4.2. Soy Protein Viscosity Results
Figure 8.
Soy Protein Viscosity Curve.
Figure 8.
Soy Protein Viscosity Curve.
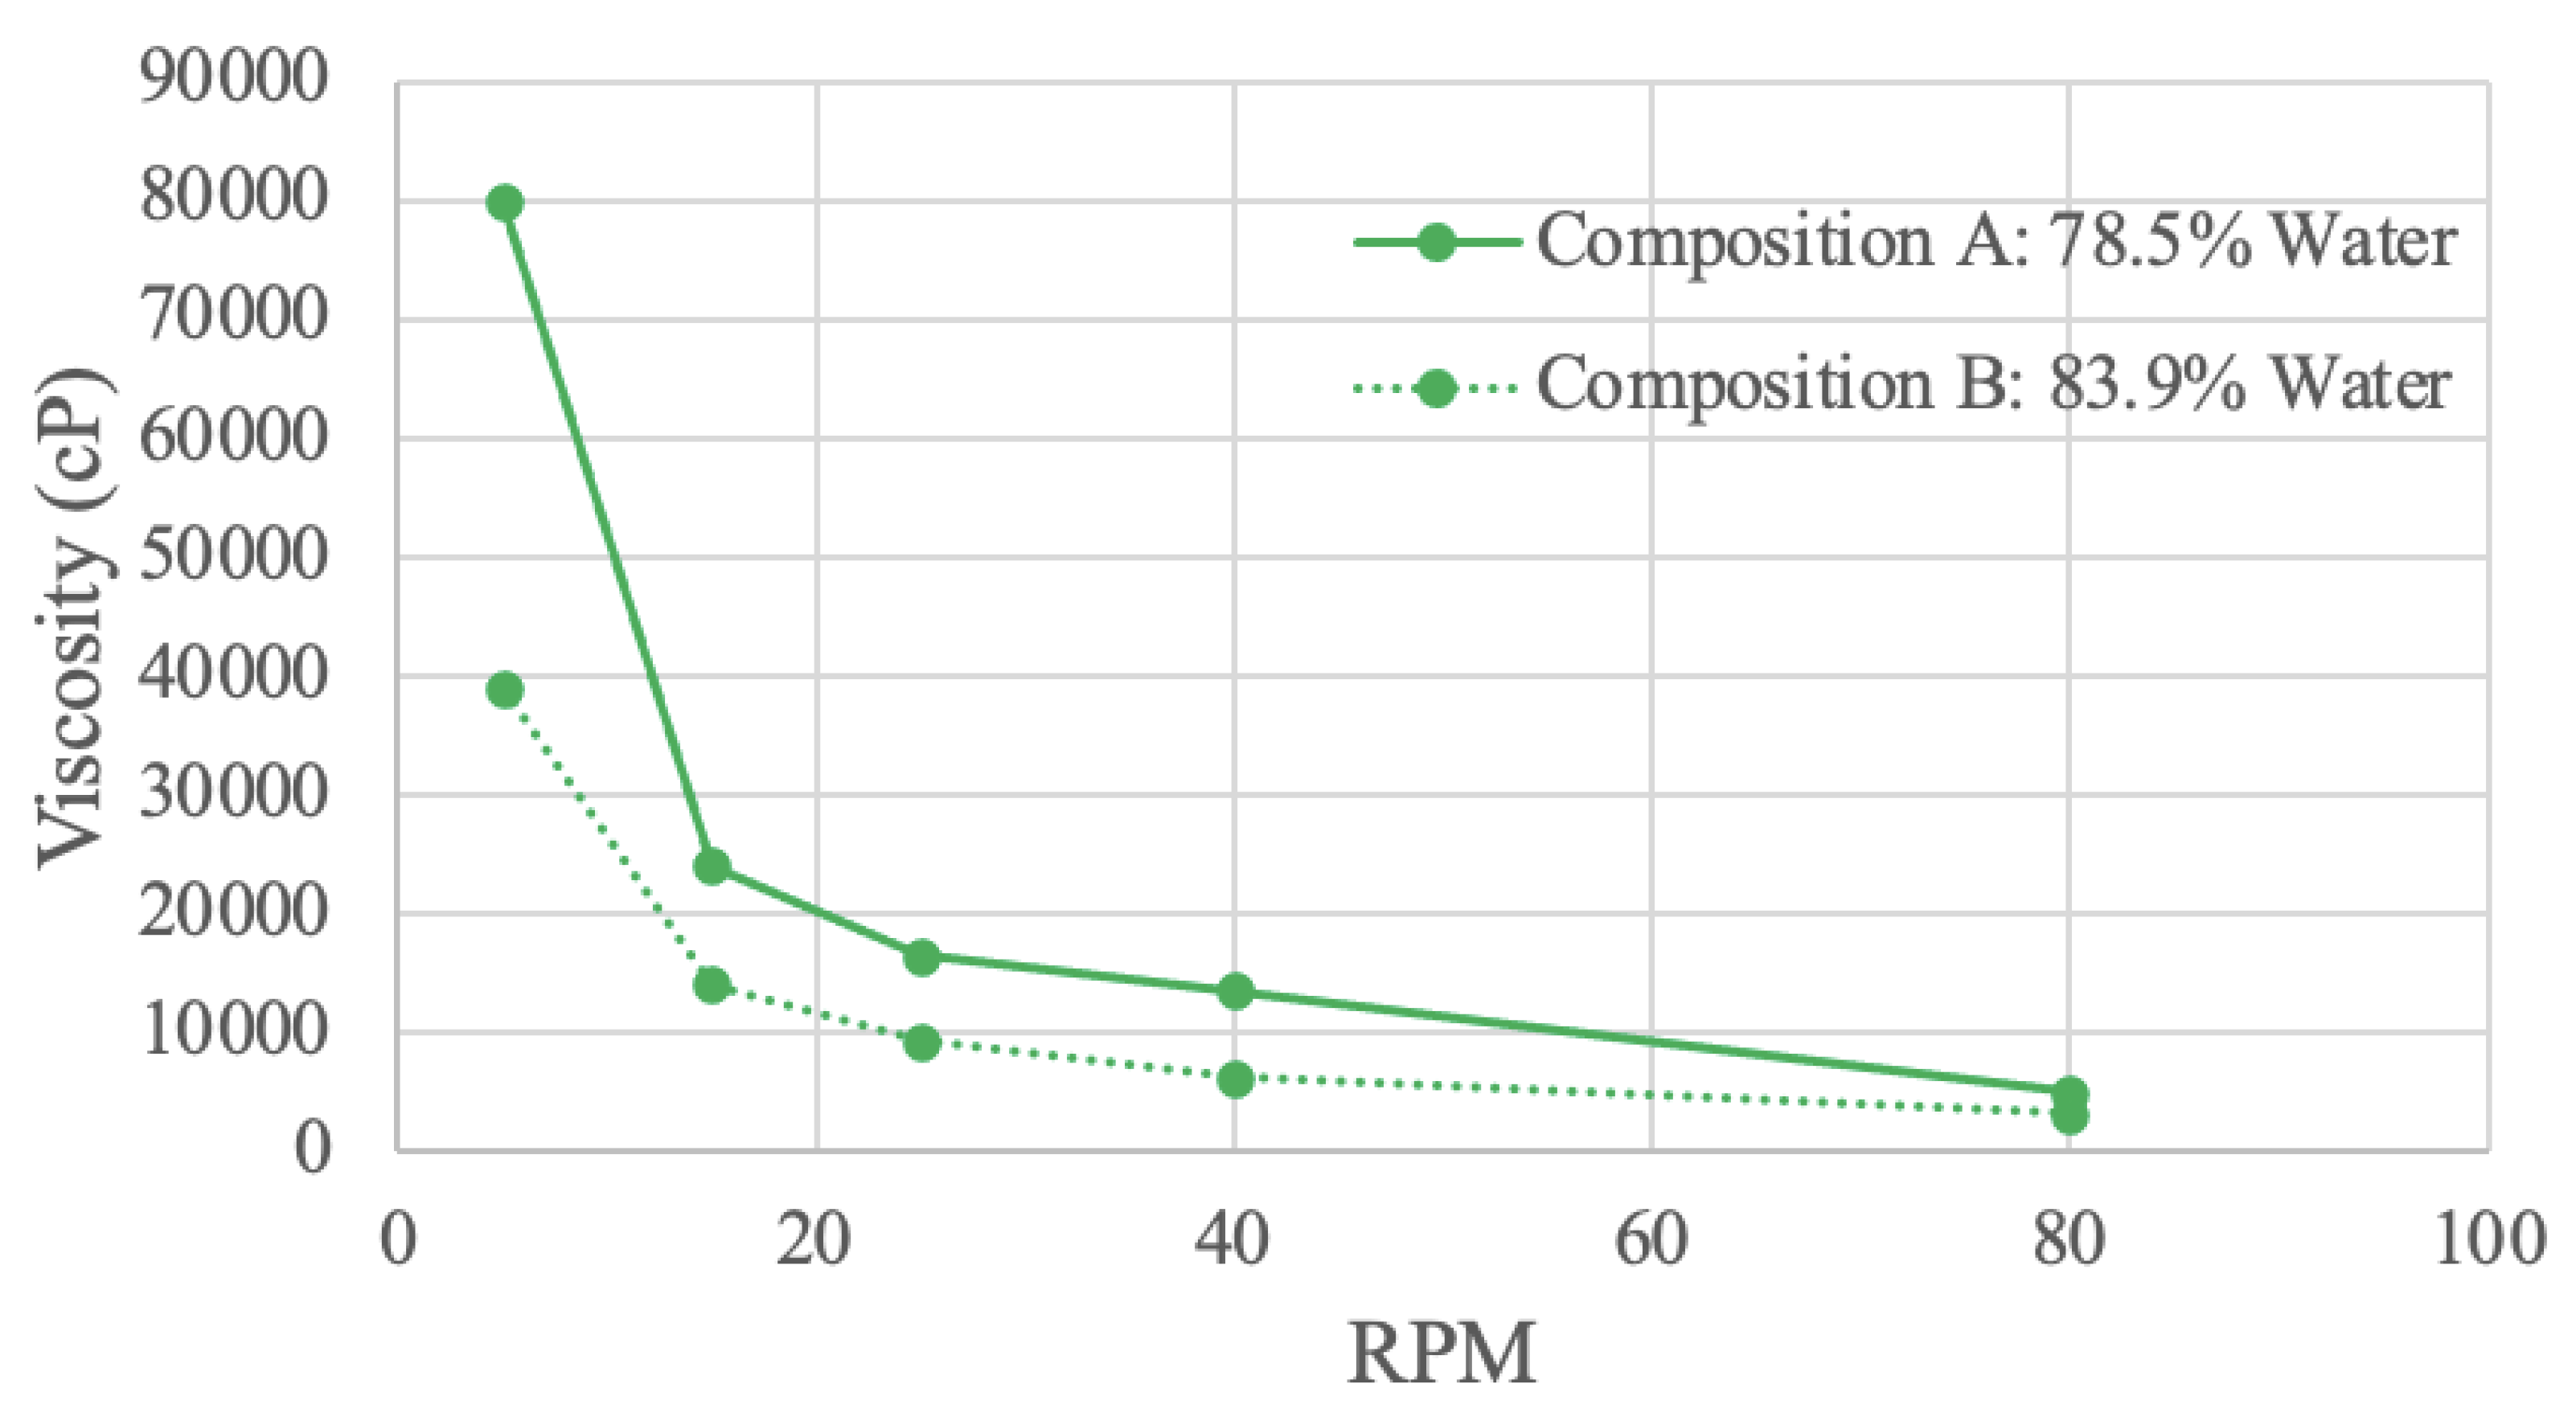
Soy protein samples were tested in a viscometer with 2 different concentrations. Composition A has 78.5% water, and composition B has 83.9% water. At all RPM values, composition A is more viscous than composition B, most likely due to the increase in intermolecular forces and friction with a higher solute concentration [
80].
At 5 RPM, compositions A and B have viscosities of 80000 cP and 39000 cP, respectively. These values continually decreases until 80 RPM, where composition A has a viscosity of 5000 cP, and composition B a viscosity of 3200 cP. The decreasing exponential curve shape is characteristic of certain pseudo-plastic polymer proteins, including soy protein isolate [
82,
83]. The downward trend indicates shear-thinning behavior since viscosity decreases with increasing RPM [
82]. Further, composition A has a steeper slope than composition B. This observation suggests that concentration influences shear-thinning behaviour, as a higher concentration has more entanglement [
82].
A study investigating viscosity’s response to shear rate using various soy protein and sodium bisulfate (NaHSO3) solution concentrations also resulted in a decreasing exponential curve shape [
84]. This study illustrated shear-thinning viscosity that decreased with an increase in the NaHSO3 solvent [
84]. The viscosity of the soy protein-NaHSO3 solution was attributed to the various forces within soy protein like disulfide bonds, hydrophobic forces, and electrostatic interactions [
84]. The influence on viscosity of these forces would decrease with a lower solid concentration, exhibited in the study and in the obtained results [
84].
3.4.3. Pea Protein Viscosity Results
Figure 9.
Pea Protein Viscosity Curve.
Figure 9.
Pea Protein Viscosity Curve.
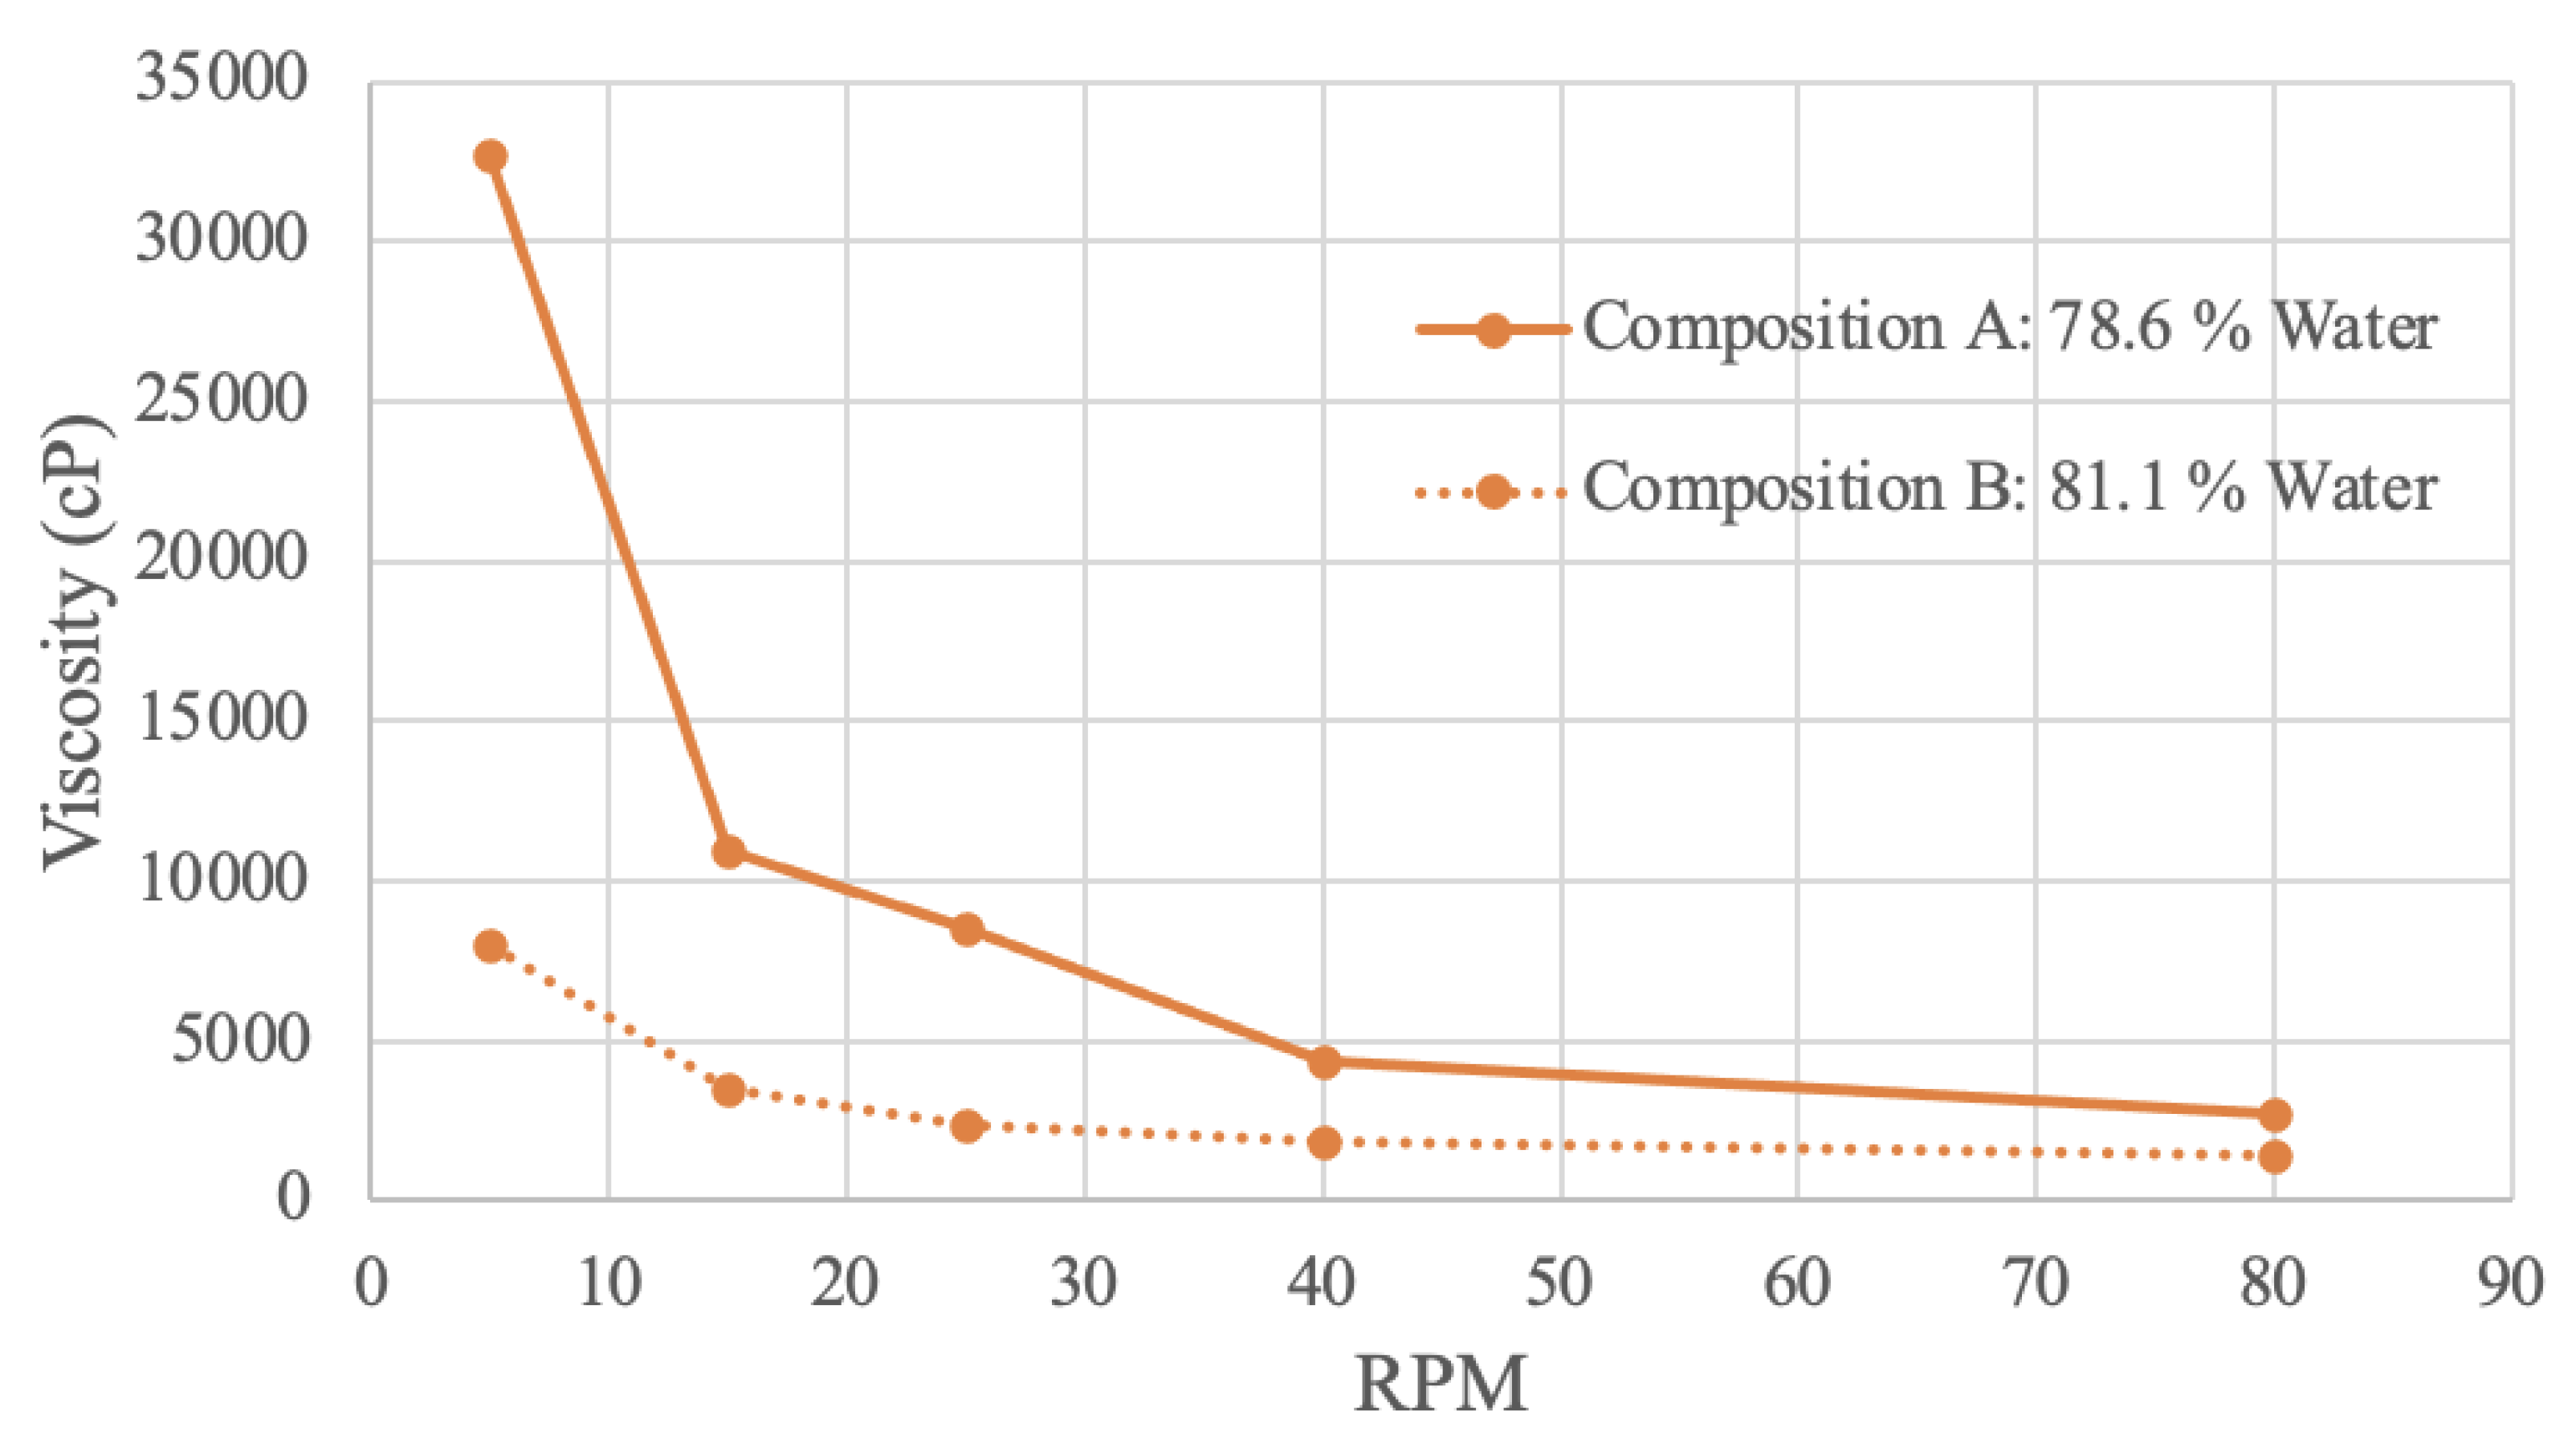
Pea protein samples were tested in a viscometer with 2 different concentrations. Composition A has 78.6% water, and composition B has 81.1% water. At all RPM, composition A was found to be more viscous. This result again demonstrates that decreased water content tends to result in increased viscosity.
At an RPM of 5, composition A has a viscosity value of 32700 cP, while composition B has a viscosity level of 8000 cP. At an RPM of 80, composition A’s viscosity decreases to a value of 2700, and composition B’s value decreases to 1400. This downwards trend may be attributed to the protein particles expanding once absorbing water, resulting in a viscous flow, that then decreases with more rotations and mechanical energy [
85]. Illustrated in the graph, as RPM increases, viscosity decreases - the sample is shear-thinning [
79]. Further, composition B appears less effected by shear-thinning behaviour, as the slope of the curve is overall less steep. This finding implies that shear-thinning behaviour is proportionally related to concentration, likely due to molecular bonds and entanglement [
82].
A study analyzing the RVA viscosity of pea protein slurry at 15% w/w produces a similar exponential curve shape [
85]. The viscosity value begins at 2000 mPa*s, decreasing over time to 500 mPa*s – similar to the obtained results [
85]. Differences in the initial viscosity value may be attributed to the preparation of the sample. In this study, the protein slurry was preheated 50ºC and 95ºC [
85]. Heating would influence viscosity, as viscosity is directly related to temperature [
86]. This literature confirms that increased mechanical energy into the fluid, whether that be with increased time or RPM, is a factor resulting in a less viscous fluid [
85]. A different study investigating the relationship between shear rate and viscosity for pea protein isolate with 35% moisture content also found the sample to be shear-thinning [
87].
3.4.4. Brown Rice Protein Viscosity Results
Figure 10.
Brown Rice Protein Viscosity Curve.
Figure 10.
Brown Rice Protein Viscosity Curve.
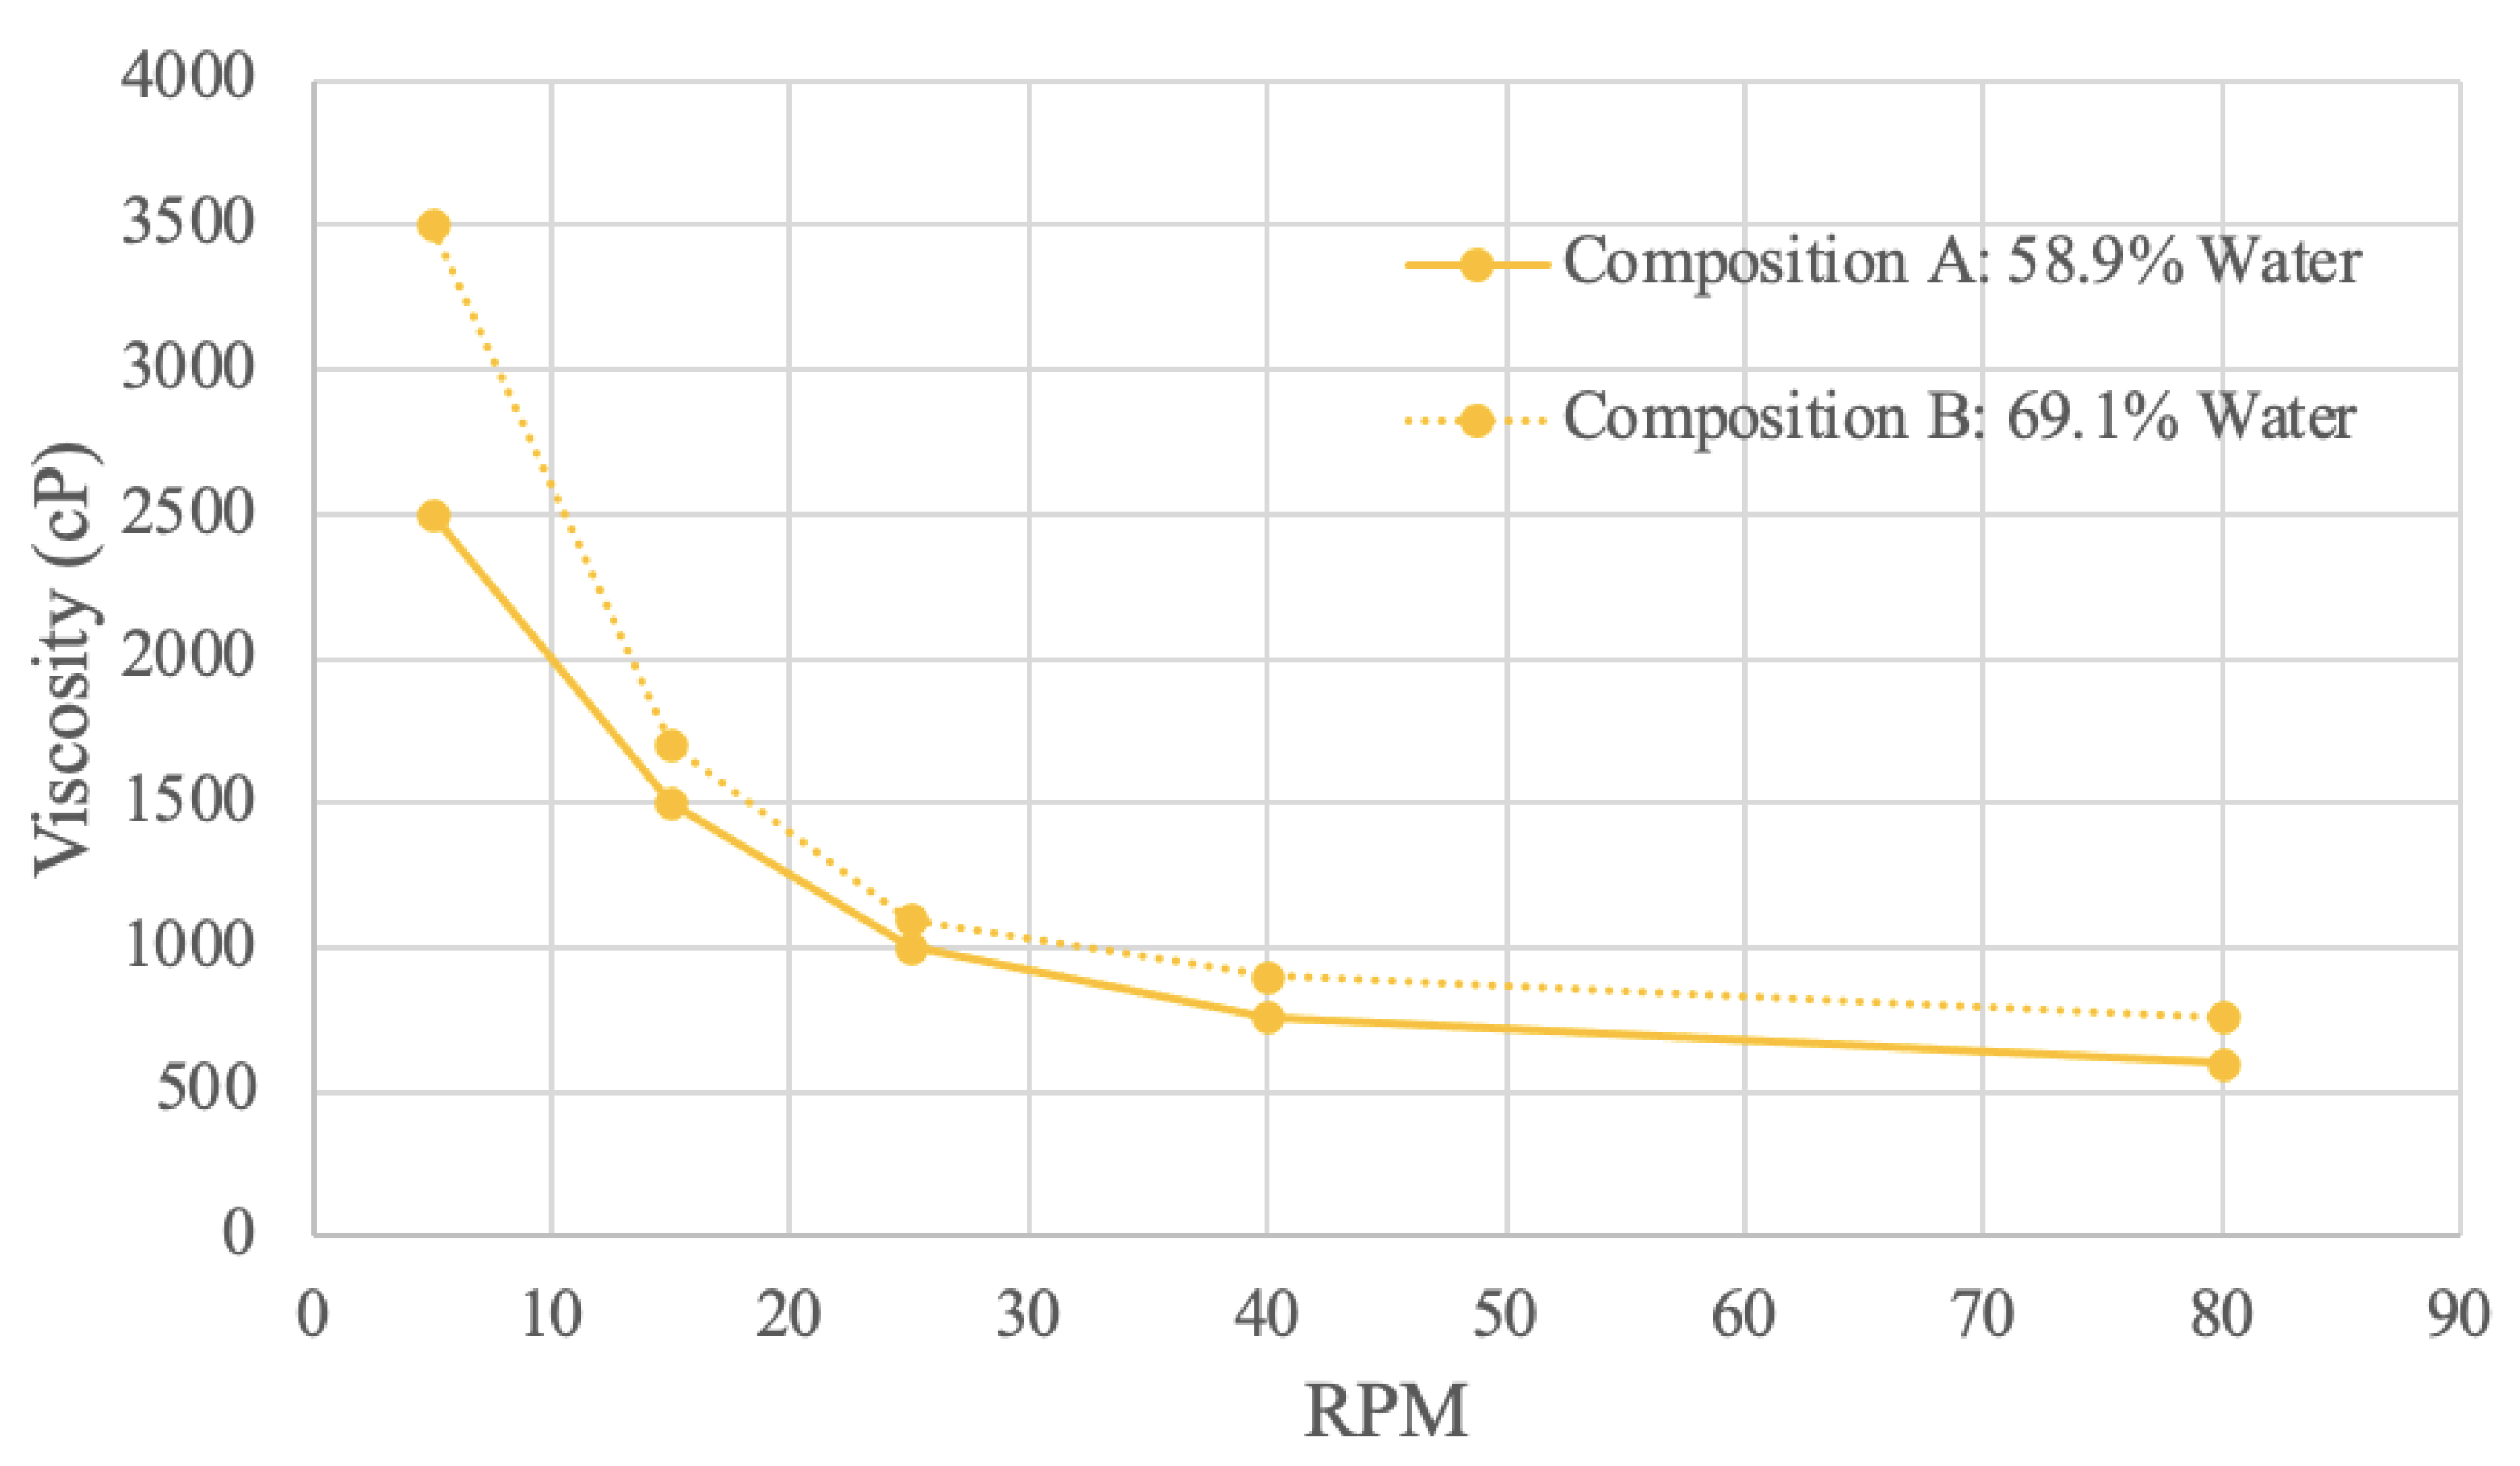
Rice protein samples were tested in the viscometer with 2 different concentrations. Composition A has 58.9% water, and composition B has 69.1% water. The rice viscosity results are the only measured samples where a lower powder concentration has a higher measured viscosity. In other words, an increase in water concentration resulted in an increase in viscosity. This observation suggests that the rice protein sample may have different hydrogen bonding patterns resulting in different velocity distortion, compared to the other materials tested [
80]. Other compounds within the commercial rice protein, such as carbohydrates, may also interfere with the bonding behaviour. A study involving homogenized rice protein and starch samples at various concentrations also produced results where the addition of protein decreased viscosity [
88]. Since the rice protein used to make compositions A and B was commercially obtained, it is not unreasonable to assume that possible previous treatments such as homogenization may have taken place would influence the viscosity.
Both viscosity curves demonstrate that viscosity decreases as RPM increases, which indicates shear-thinning behaviour. The increased stress from the raised mechanical energy disorganizes the molecule arrangement, which decreases viscosity [
89]. At 5 RPM, composition A has a viscosity of 2500 cP, and composition B has a viscosity of 3500 cP. At 80 RPM, composition A has a viscosity of 600 RPM, and composition B has a viscosity of 760 RPM. Of all the materials sampled, both rice compositions have the least difference in viscosity levels. Shear-thinning viscosity curves for rice protein were also reflected in the literature, even with different sample preparation techniques [
88,
89]. This shear-thinning flow behavior suggests that the rice protein acts as a pseudoplastic fluid [
88].
4. Discussion
4.1. Physical Properties and Nutrition
To summarize the material properties,
Table 5 compares the alternative proteins to each other in terms of linear processing temperature range and their viscosities. In addition, the Alibaba wholesale retail purchase cost is provided [
39,
45,
50,
55]. These ranges are graphed in
Figure 11 and
Figure 12.
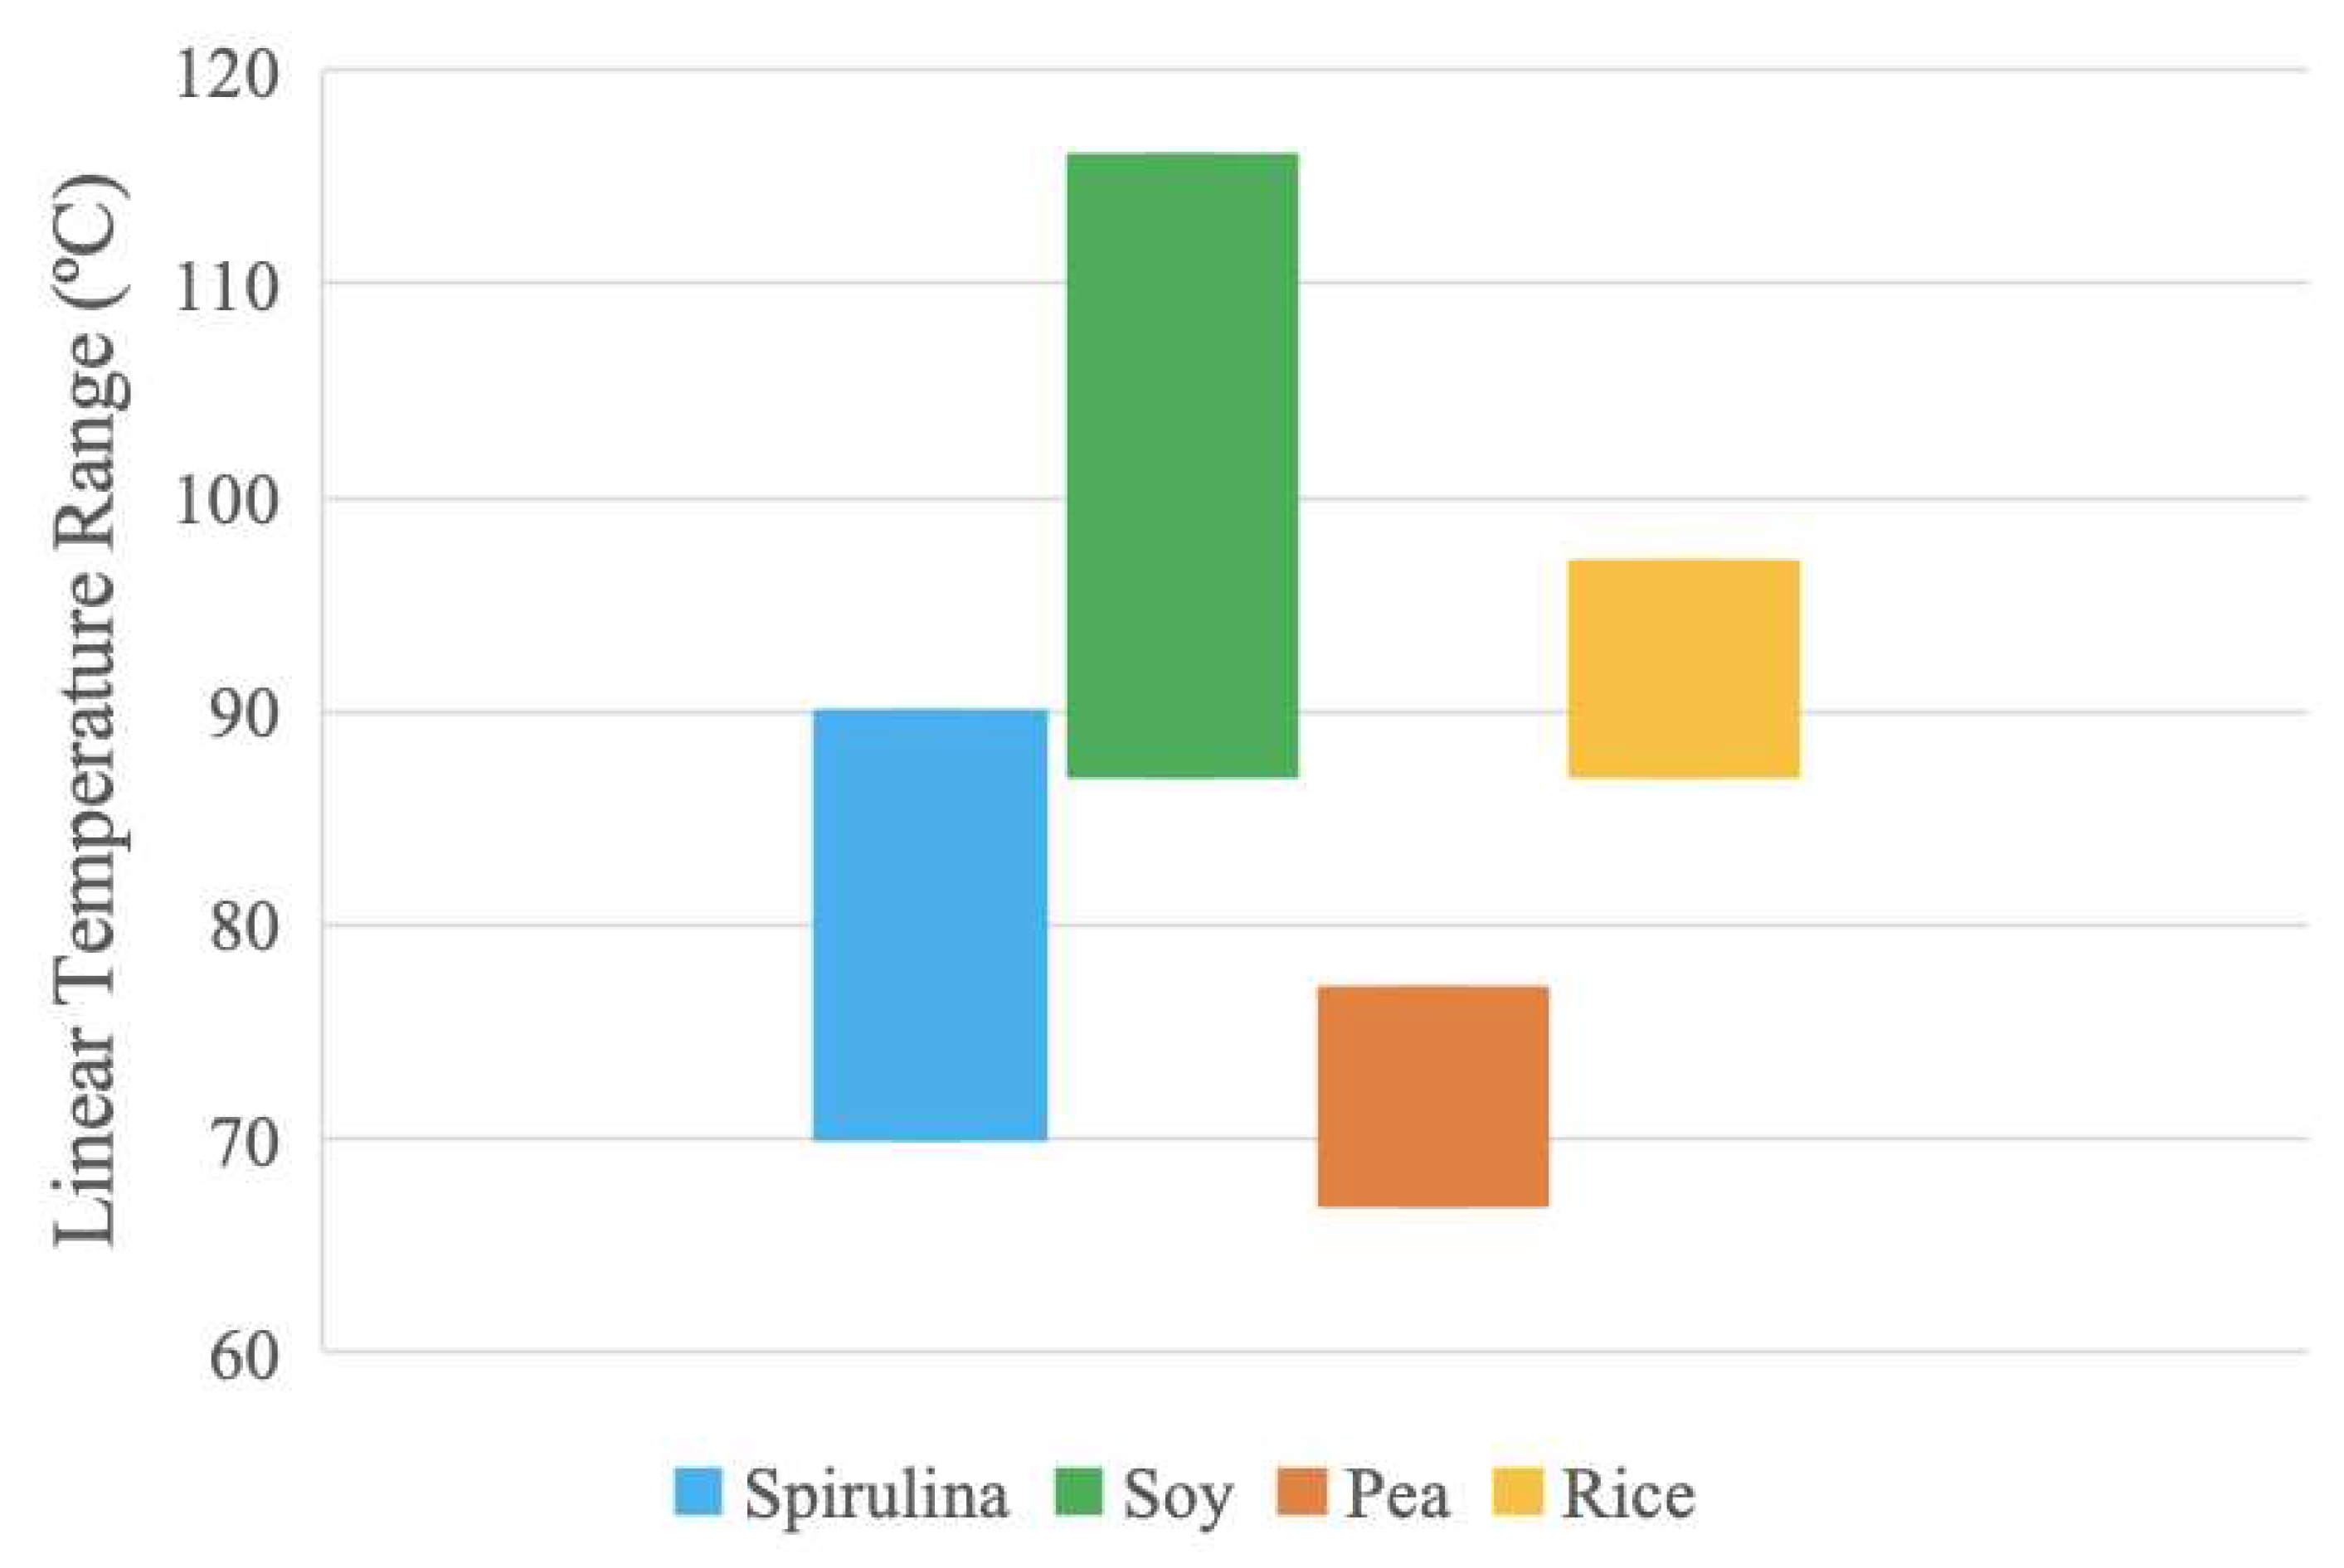
The temperature ranges in
Figure 11 were extracted from the linear trend present in the pure protein thermograms produced by the DSC analysis. These temperature ranges are assumed to be relatively more stable due to the lack of thermal activity. Optimum processing temperatures may be found in these regions as the protein samples have more predictable thermal behavior. Soy and spirulina samples have the largest stable temperature ranges. The results suggest that the soy sample can be processed at higher temperatures compared to the other samples due to increased thermal stability over a broader temperature range.
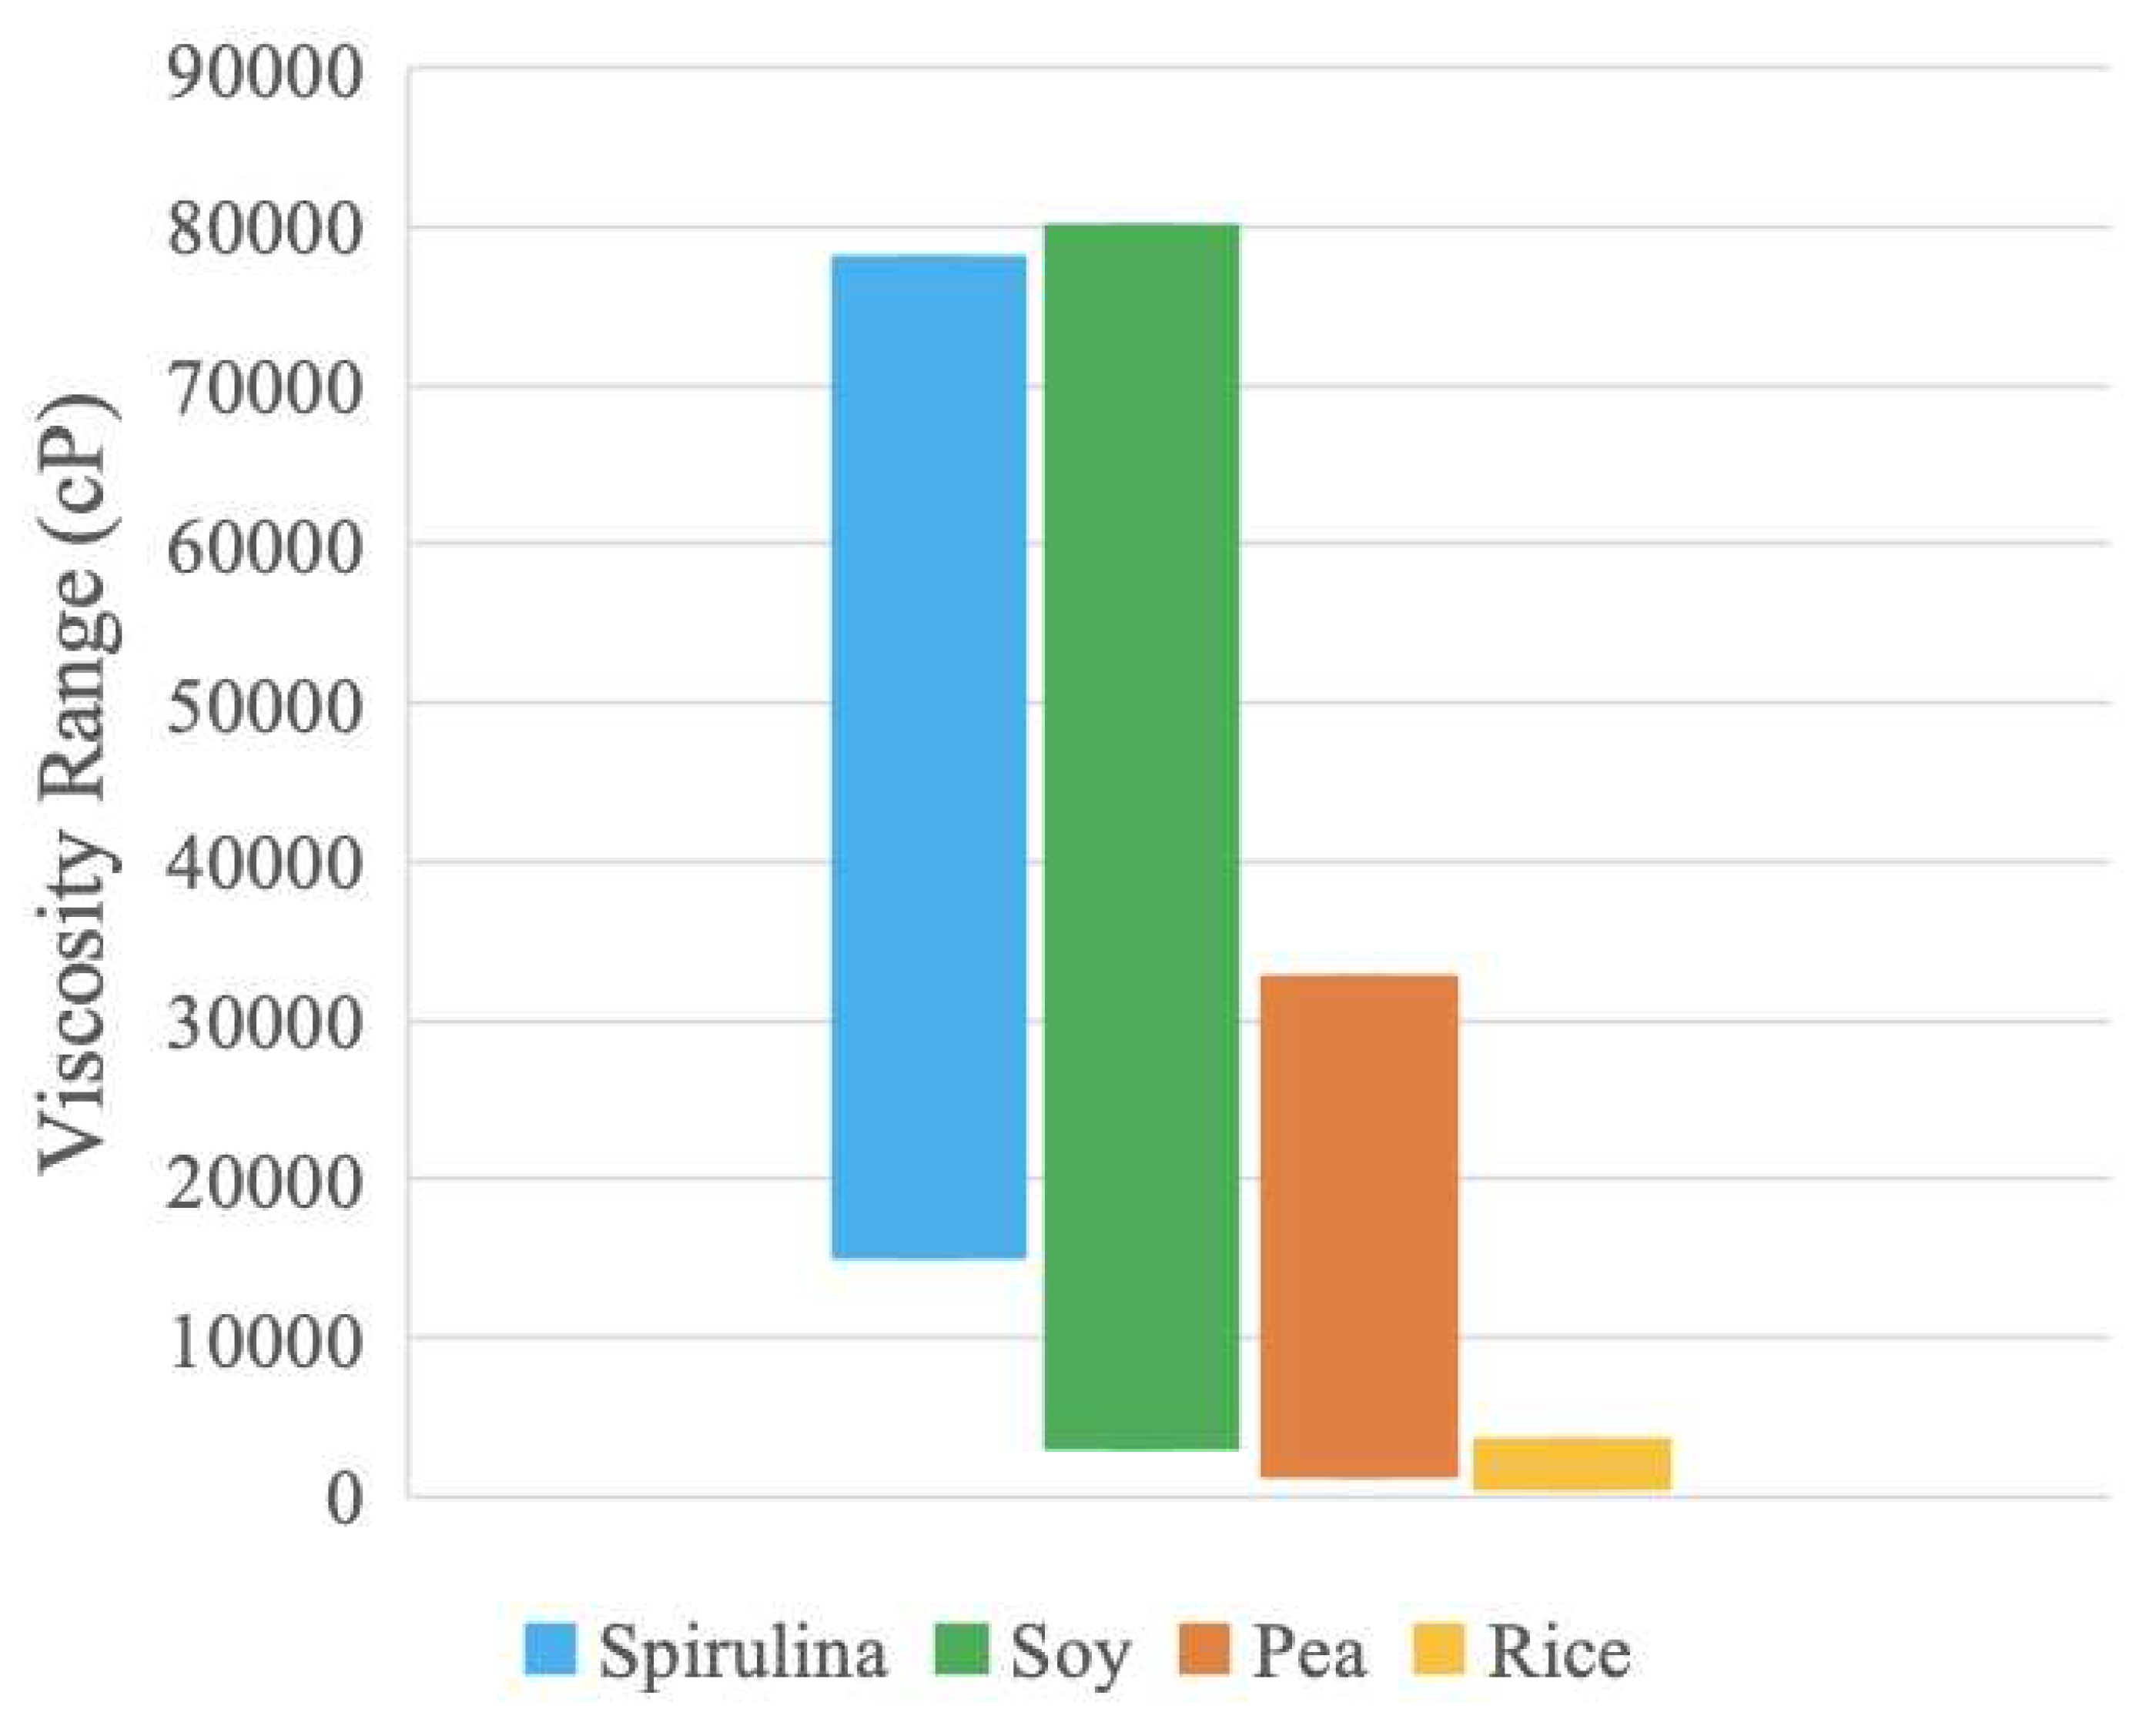
Figure 12 displays the viscosity ranges exhibited by both compositions of the protein samples between 5-80 RPM. Soy and spirulina exhibit the largest viscosity values and ranges and may be appropriate materials to use with screw extruders for processing as these extruders are used for highly viscous non-Newtonian materials [
90]. Rice has a much smaller range which suggests that of the samples, the viscosity of rice is the least influenced by water concentration. Rice may have different hydrogen bonding patterns than the other samples, which could result in a narrower range [
80].
In both temperature and viscosity data, soy and spirulina have the largest ranges. These protein samples can likely be used across more processing options and parameters, compared to pea and rice. Moreover, the pea range is in the region of the spirulina range for both temperature and viscosity, which suggests the pea has similar thermal and rheological responses as spirulina and can possibly be used as a less-expensive substitute. These materials can also be mixed to provide composite protein sources with various beneficial properties (e.g., amino acid profiles, although it should be noted that there are many complexities with amino acids such as bio-availability including digestibility, availability, and absorption, which is left for future work).
Various plant protein options contain multiple essential amino acids, and content varies greatly across plant protein source. Spirulina contains essential amino acids such as leucine and tryptophane; the superfood also has non-essential amino acid content, including glutamic acid and aspartic [
91]. Minerals like potassium, calcium, phosphorous, magnesium, zinc, and iron are present in spirulina in significant concentrations [
91]. Spirulina also contains vitamin B12, which is notable since animal products tend to be the greatest source of B12 [
91]. Despite richness in vitamins, minerals, and presence of multiple amino acids, microalgae fall short of the recommended essential amino acid percentage at 23% [
92]. Therefore, if spirulina (algae protein) was the only protein source consumed, the essential amino acid requirement would not be met.
Legumes such as soybeans and peas are generally good sources of protein, carbohydrates, fiber, vitamins, and minerals. Of the essential amino acids, histidine, isoleucine, leucine, lysine, threonine, and valine are generally present in legumes [
93]. Certain amino acids – methionine, phenylamine, and tryptophan – are not as abundant across legumes [
94,
95]. Gorissen et al. demonstrated that soy and pea amino acid percentage levels of 27% and 30%, respectively, meet the WHO/FAO/UN amino acid percentage level, based on protein consumption of 0.66 g/kg body weight/day [
92]. These levels, however, are lower than the overall animal-based protein essential amino acid percentage (37 ± 2%) [
92].
Cereal grains such as rice are widely consumed and a readily available protein source globally. Essential and non-essential amino acids are present in certain strains of rice like rice bran and brown rice [
96,
97]. Generally, limiting amino acids in cereals are lysine, methionine, and threonine [
98]. Brown rice also meets the WHO/FAO/UNU amino acid requirement, with an essential amino acid percentage of total protein of 28% [
92]. This value is also lower than the animal-based protein percentage [
92].
4.2. Plant Protein Processing Options
Heating is a widely used food processing technique, especially in cooking, that has demonstrated positive impacts on plant protein digestibility and nutritional quality [
93,
99]. Heating processes utilize thermal treatments for sterilization, flavour and texture enhancement, improvement of functional properties like emulsification, and destruction of undesired compounds [
93,
100]. Adverse effects of thermal treatment have also been observed such as degradation of protein and micronutrients, which can alter amino acid composition [
93]. However, protein digestibility can be improved through denaturation of proteins by heating [
93]. Temperature processing parameters for cooking with plant protein usually occur around 100ºC [
93,
100]. Therefore, cooking may be a feasible processing method for compounds comprised of soy and rice protein, as their linear temperature ranges were found to be 87-116 ºC, and 87-97 ºC.
Drying is another common food processing method. Techniques include spray drying, freeze drying, and use of supercritical fluid technology [
102]. In terms of protein functional properties, drying technology is commonly used to improve emulsifying and foaming properties, protein solubility, and water-holding capacity [
93]. Spray drying inlet temperatures are typically well over 100ºC, therefore each protein sample in this study may experience thermal effects if used in a drying process [
103,
104]. Vacuum drying, however, can also be effective below 100 ºC [
105].
Autoclaving can be used as a sterilization technique and is a high-pressure cooking method [
93]. This process utilizes steam, which is important to note as thermal stability can be affected by water concentration [
70]. Typical autoclaving process parameters for plant-based proteins are 5-15 psi, 112-127 ºC, and 10-50 minutes [
93,
99]. Therefore, the soy protein sample may be a possible candidate for autoclaving processing.
Extrusion combines mechanical shear, pressure, and heat by using a large rotating screw and high temperatures to result in a high temperature short time (HTST) food processing technique [
106]. Denaturation, unfolding, and realignment of plant protein molecules can be present in extrusion, which can improve the functionality of the compound and produce a meat-like texture [
106]. The high temperature in extrusion leads to hydrogen and intramolecular disulfide bond breakage, which can promote the formation of new protein aggregates [
107]. Overall, extrusion temperatures have a large range but typically fall in the 90-200ºC span, and screw speeds have RPM values in the hundreds [
106]. Zahari et. al produced a meat analogues product by using various soy protein isolate and hemp protein concentrate mixtures at extrusion temperatures ranging from 40-100ºC and screw speeds of 300-800 RPM [
108]. Due to the encompassing temperature range, extrusion is a feasible processing method for the spirulina, soy protein, pea protein, and rice protein samples used in this study. The increased industrial RPM values, however, would have mechanical effects by decreasing the viscosity of the protein isolates. Moreover, particle size has also been demonstrated to influence extrusion. Carvalho et. al found that corn meal extrudates expansion increased with particle size, and that mechanical resistance of the extrudates was significantly larger for the smallest particle size than the largest particle size [
109]. If this same result is extended to all plant proteins, the rice protein sample would have the highest level of expansion, and the soy protein sample would have the most mechanical resistance based off of the results of the materials used in this study. Moreover, increased density correlates with decreased viscosity, which would influence extrusion behavior [
110].
4.3. Viability and Sustainability
Compared to an ovo-lacto vegetarian diet, the average meat-based American diet requires more land, energy, and water resources [
5]. Vegetarian diets have been demonstrated to produce less per capita GHG emissions than Mediterranean and pescetarian diets, and the average global diet in 2009 [
111]. Further, a vegetarian diet is likely to require less additional cropland than meat-including diets [
111]. A life cycle analysis performed by Detzal et. al found that a meat analogous plant-based extrudate had a lower carbon footprint in terms of carbon dioxide equivalents than chicken, using a functional unit of 30 g of protein and 30 g of product [
17]. In the same study, when compared to chicken, an optimized plant-based meat alternative performed better in environmental categories including water processing, land use, climate change, eutrophication, acidification, particulate matter, ozone depletion, and oxidants formation, and was comparable in cumulative non-renewable energy demand [
17]. Additionally, crops such as soybeans are used to feed livestock and poultry [
112]. Of all soya and grain produced, 75% and 40% is directed towards animal feed, respectively [
112]. Countries with a high level of animal products consumed, especially beef, have a larger area of agricultural land usage [
113]. Alexander et al. found that global consumption of an average American omnivorous diet would require 178% more land for agriculture than is currently in use, highlighting the importance of plant-based food options that can be produced on a global scale [
113].
The proteins chosen in this study – spirulina, soy, pea, and brown rice – are strong candidates for plant-based food and meat analogous products because of protein content and geographic availability. Per
Table 1, the average protein content as a percentage for spirulina isolate, soy protein isolate, pea protein isolate, and brown rice protein isolate is 67%, 88%, 78%, and 81%, respectively. Those values are higher than the reported plant protein contents for hemp at 51%, lupin at 61%, oat at 64%, and corn at 65% [
92]. Further, the protein samples used in this study have a higher protein content than egg at 51%, and a comparable percentage to animal-based proteins of whey at 72-84%, milk around 75%, and casein at 67-78% [
92]. Spirulina is found across the globe as it is naturally occurring in salt water, fresh water, brackish water, soil, sand, and marshes [
114]. Soya beans are grown primarily in the Americans and Asia, with top producers being the USA, Brazil, Argentina, China, and India [
115]. There is also soya production scattered through Europe and Africa [
115]. Green peas are mainly produced in Asia, with China and India dominating the production market; Europe, the Americas, and Africa also produce green peas [
115]. Asia has the largest production share of rice, with China, India, and Southeast Asian countries as the top producers [
115]. The Americas and Africa also have a smaller share of rice production [
115].
4.4. Future Work
The results presented here are the first step in making low-cost non-meat-based protein affordable at the retail scale, as the base thermal and rheological properties have been elucidated that can allow for greater competition and lower costs. Further work and process testing, however, is needed to establish these protein isolates in a range of foods. For example, as the results here and elsewhere have conveyed that temperature and percent water impact the viscosities of the materials, an in-depth study is needed on both the pure materials and protein mass percent combinations for the available temperature processing ranges and viscosity ranges summarized in section 4.1. Future work could also assess the impacts of mixing various volume fractions of the proteins to create ideal properties for a specific materials processing technique. In addition, the geographical availability of each protein source could be evaluated both for local optimization of protein source availability during agricultural times as well as considering their use as a resilient food [
116,
117,
118,
119] to help provide adequate nutrition during emergencies [
120]. Even excluding emergencies with rapid growth observed in the global population, the demand for meat is increasing and can be offset with plant-based meat alternatives that solve the economic, environmental and health problems caused by human over-consumption of meat products [
121,
122]. Far more work is needed to build upon the preliminary results here to meet the complex challenges of replacing meat entirely [
122].
5. Conclusions
Density and the particle size were found for a) spirulina, b) soy protein, c) pea protein, and d) brown rice protein. The spirulina sample had a density of 0.49 g/cm3, mean area of 28 µm2, and mean diameter of 6.0 µm. The soy protein sample had a density of 0.68 g/cm3, mean area of 3.8 µm2, and mean diameter of 2.2 µm. The pea protein sample had a density of 0.76 g/cm3, mean area of 6.6 µm2, and mean diameter of 2.9 µm. The brown rice protein sample had a density of 0.54 g/cm2, mean area of 340 µm2 and mean diameter of 21 µm. The DSC analysis produced dry curves with an amorphous shape and paste curves with a more distinct endothermic peak. Linear temperature ranges were extracted and interpreted as processing parameters for food production. The linear temperature range for spirulina was 70-90 ºC; soy protein was 87-116 ºC; pea protein was 67-77 ºC; and brown rice protein was 87-97 ºC. Soy had the largest linear temperature range and is likely the most thermally stable due to less deviations. The viscosity analysis determined each protein sample was shear-thinning and that viscosity increased with decreased water concentration, with rice being an exception to the latter trend. The obtained viscosity range for spirulina was 15100-78000 cP; soy protein was 3200-80000 cP; pea protein was 1400-32700 cP; and brown rice protein was 600-3500 cP. Additionally, extrusion seems to be a viable method for further processing of the protein isolates as this technique has a large temperature operating range and variable screw speed. Extrusion has been used to develop meat analogous products with plant proteins. Plant-based protein products can be used as an alternative to traditional poultry, livestock and other meat proteins as they have a large range of essential and non-essential amino acids and are considered more resource efficient. The protein isolates analyzed in this study have high protein concentrations and a wide geographic availability, making them strong candidates for further research into extruded meat analogous products.
Author Contributions
Conceptualization, J.M.P.; methodology, K.B., T.C., N.A.S., and J.M.P.; validation, K.B., T.C., N.A.S., and J.M.P.; formal analysis, K.B., T.C., N.A.S., and J.M.P.; investigation, K.B., T.C., and N.A.S.; resources, N.A.S. and J.M.P.; data curation, K.B., T.C., and N.A.S.; writing—original draft preparation, K.B., T.C., N.A.S., and J.M.P.; writing—review and editing, K.B., T.C., N.A.S., and J.M.P.; visualization, K.B. and T.C,; supervision, J.M.P.; funding acquisition, J.M.P. All authors have read and agreed to the published version of the manuscript.
Funding
This work was supported by BeeHex, LLC and the Thompson Endowment.
Data Availability Statement
Data is available upon request.
Acknowledgments
The authors would like to thank Surface Science Western, Gleb Meirson, and Eric Pilles for technical support.
Conflicts of Interest
The authors declare no conflict of interest.
References
- United Nations, DESA, Population Division World Population Prospects 2022 Growth Rate. Available online: https://population.un.org/wpp/Graphs/Probabilistic/POP/GrowthRate/900 (accessed on 22 November 2022).
- Lindgren, E.; Harris, F.; Dangour, A.; Gasparatos, A.; Hiramatsu, M.; Javadi, F.; Loken, B.; Murakami, T.; Scheelbeek, P.; Haines, A. Sustainable Food Systems—a Health Perspective. Sustainability science 2018, 13, 1505–1517. [Google Scholar] [CrossRef] [PubMed]
- Cole, M.; Augustin, M.; Robertson, M.; Manners, J. The Science of Food Security. npj Science of Food 2018, 2, 1–8. [Google Scholar] [CrossRef] [PubMed]
- Dagevos, H.; Voordouw, J. Sustainability and Meat Consumption: Is Reduction Realistic? Sustainability: Science, Practice and Policy 2013, 9, 60–69. [Google Scholar] [CrossRef]
- Pimentel, D.; Pimentel, M. Sustainability of Meat-Based and Plant-Based Diets and the Environment. The American Journal of Clinical Nutrition 2003, 78, 660S–663S. [Google Scholar] [CrossRef] [PubMed]
- Song, M.; Fung, T.T.; Hu, F.B.; Willett, W.C.; Longo, V.D.; Chan, A.T.; Giovannucci, E.L. Association of Animal and Plant Protein Intake With All-Cause and Cause-Specific Mortality. JAMA Intern Med 2016, 176, 1453. [Google Scholar] [CrossRef] [PubMed]
- Abete, I.; Romaguera, D.; Vieira, A.R.; Lopez De Munain, A.; Norat, T. Association between Total, Processed, Red and White Meat Consumption and All-Cause, CVD and IHD Mortality: A Meta-Analysis of Cohort Studies. Br J Nutr 2014, 112, 762–775. [Google Scholar] [CrossRef] [PubMed]
- Bernstein, A.M.; Sun, Q.; Hu, F.B.; Stampfer, M.J.; Manson, J.E.; Willett, W.C. Major Dietary Protein Sources and Risk of Coronary Heart Disease in Women. Circulation 2010, 122, 876–883. [Google Scholar] [CrossRef] [PubMed]
- Kim, H.; Caulfield, L.E.; Garcia-Larsen, V.; Steffen, L.M.; Coresh, J.; Rebholz, C.M. Plant-Based Diets Are Associated With a Lower Risk of Incident Cardiovascular Disease, Cardiovascular Disease Mortality, and All-Cause Mortality in a General Population of Middle-Aged Adults. JAHA 2019, 8, e012865. [Google Scholar] [CrossRef] [PubMed]
- Alonso, M.; González-Montaña, J.; Lomillos, J. Consumers’ Concerns and Perceptions of Farm Animal Welfare. Animals 2020, 10, 385. [Google Scholar] [CrossRef]
- Beausoleil, N.; Mellor, D.; Baker, L.; Baker, S.; Bellio, M.; Clarke, A.; Dale, A.; Garlick, S.; Jones, B.; Harvey, A.; et al. “Feelings and Fitness” Not “Feelings or Fitness”–The Raison d’être of Conservation Welfare, Which Aligns Conservation and Animal Welfare Objectives. Frontiers in veterinary science 2018, 5, 296. [Google Scholar] [CrossRef]
- Manyi-Loh, C.; Mamphweli, S.; Meyer, E.; Okoh, A. Antibiotic Use in Agriculture and Its Consequential Resistance in Environmental Sources: Potential Public Health Implications. Molecules 2018, 23, 795. [Google Scholar] [CrossRef]
- Serwecińska, L. Antimicrobials and Antibiotic-Resistant Bacteria: A Risk to the Environment and to Public Health. Water 2020, 12, 3313. [Google Scholar] [CrossRef]
- Crippa, M.; Solazzo, E.; Guizzardi, D.; Monforti-Ferrario, F.; Tubiello, F.N.; Leip, A. Food Systems Are Responsible for a Third of Global Anthropogenic GHG Emissions. Nat Food 2021, 2, 198–209. [Google Scholar] [CrossRef] [PubMed]
- Reisinger, A.; Clark, H. How Much Do Direct Livestock Emissions Actually Contribute to Global Warming? Global Change Biology 2018, 24, 1749–1761. [Google Scholar] [CrossRef] [PubMed]
- Chai, B.; van der Voort, J.; Grofelnik, K.; Eliasdottir, H.; Klöss, I.; Perez-Cueto, F. Which Diet Has the Least Environmental Impact on Our Planet? A Systematic Review of Vegan, Vegetarian and Omnivorous Diets. Sustainability 2019, 11, 4110. [Google Scholar] [CrossRef]
- Detzel, A.; Krüger, M.; Busch, M.; Blanco-Gutiérrez, I.; Varela, C.; Manners, R.; Bez, J.; Zannini, E. Life Cycle Assessment of Animal-based Foods and Plant-based Protein-rich Alternatives: An Environmental Perspective. Journal of the Science of Food and Agriculture 2022, 102, 5111–5120. [Google Scholar] [CrossRef]
- Rabès, A.; Seconda, L.; Langevin, B.; Allès, B.; Touvier, M.; Hercberg, S.; Lairon, D.; Baudry, J.; Pointereau, P.; Kesse-Guyot, E. Greenhouse Gas Emissions, Energy Demand and Land Use Associated with Omnivorous, Pesco-Vegetarian, Vegetarian, and Vegan Diets Accounting for Farming Practices. Sustainable Production and Consumption 2020, 22, 138–146. [Google Scholar] [CrossRef]
- Aschemann-Witzel, J.; Gantriis, R.; Fraga, P.; Perez-Cueto, F. Plant-Based Food and Protein Trend from a Business Perspective: Markets, Consumers, and the Challenges and Opportunities in the Future. Critical Reviews in Food Science and Nutrition 2021, 61, 3119–3128. [Google Scholar] [CrossRef]
- Plant Based Foods Association 2021 US Retail Sales Data for the Plant-Based Food Industry. Available online: https://www.plantbasedfoods.org/2021-u-s-retail-sales-data-for-the-plant-based-foods-industry/ (accessed on 7 November 2022).
- Remde, A.; DeTurk, S.; Almardini, A.; Steiner, L.; Wojda, T. Plant-Predominant Eating Patterns–How Effective Are They for Treating Obesity and Related Cardiometabolic Health Outcomes? – A Systematic Review. Nutrition Reviews 80, 1094–1104.
- Fresán, U.; Sabaté, J. Vegetarian Diets: Planetary Health and Its Alignment with Human Health. Advances in Nutrition 2019, 10, S380–S388. [Google Scholar] [CrossRef]
- Fehér, A.; Gazdecki, M.; Véha, M.; Szakály, M.; Szakály, Z. A Comprehensive Review of the Benefits of and the Barriers to the Switch to a Plant-Based Diet. Sustainability 2020, 12, 4136. [Google Scholar] [CrossRef]
- Von Essen, E. Young Adults’ Transition to a Plant-Based Diet as a Psychosomatic Process: A Psychoanalytically Informed Perspective. Appetite 2021, 157, 105003. [Google Scholar] [CrossRef] [PubMed]
- Tziva, M.; Negro, S.; Kalfagianni, A.; Hekkert, M. Understanding the Protein Transition: The Rise of Plant-Based Meat Substitutes. Environmental Innovation and Societal Transitions 2021, 35, 217–231. [Google Scholar] [CrossRef]
- Santo, R.E.; Kim, B.F.; Goldman, S.E.; Dutkiewicz, J.; Biehl, E.M.B.; Bloem, M.W.; Neff, R.A.; Nachman, K.E. Considering Plant-Based Meat Substitutes and Cell-Based Meats: A Public Health and Food Systems Perspective. Front. Sustain. Food Syst. 2020, 4, 134. [Google Scholar] [CrossRef]
- Bakhsh, A.; Lee, S.; Lee, E.; Hwang, Y.; Jo, S. Traditional Plant-Based Meat Alternatives, Current and a Future Perspective: A Review. J. Agric. Life Sci 2021, 28, 1–11. [Google Scholar] [CrossRef]
- Curtain, F.; Grafenauer, S. Plant-Based Meat Substitutes in the Flexitarian Age: An Audit of Products on Supermarket Shelves. Nutrients 2019, 11, 2603. [Google Scholar] [CrossRef] [PubMed]
- Walmart Canada Beyond Meat Plant Based Ground, 340g. Available online: https://www.walmart.ca/en/ip/beyond-meat-plant-based-ground-340g/6000200853971 (accessed on 26 November 2022).
- Walmart Canada Search: Ground Beef. Available online: https://www.walmart.ca/search?q=ground%20beef&c=10019 (accessed on 26 November 2022).
- U.S. Department of Agriculture Chicken, Broilers or Fryers, Breast, Meat Only, Cooked, Roasted 2019.
- USDA Livestock, Poultry, & Grain Market News Broiler/Fryer: USDA Weekly Retail Chicken Feature Activity Report (Fri) 2022.
- U.S. Department of Agriculture Central Beef, Ground, Patties, Frozen, Cooked, Broiled 2019.
- USDA Agricultural Marketing Service, Livestock, Poultry, & Grain Market News USDA Weekly Retail Beef Feature Activity 2022.
- U.S. Department of Agriculture Central Pork, Fresh, Shoulder, Blade, Boston (Roasts), Separable Lean and Fat, Cooked, Roasted 2019.
- USDA Livestock, Poultry, & Grain Market News National Monthly Pasture Raised Pork Report 2022.
- U.S. Department of Agriculture Lamb, Ground, Raw 2019.
- USDA Livestock, Poultry, & Grain Market News National Estimated Lamb Carcass Cutout (PDF) (LM_XL502) 2022.
- Alibaba.com Factory Spirulina Suppliers Organic Green Colors Spirulina Powder Bulk Super Spirulina Powder Tablets. Available online: https://www.alibaba.com/product-detail/Factory-Spirulina-Suppliers-Organic-Green-Colors_1600345281535.html (accessed on 7 November 2022).
- U.S. Department of Agriculture Spirulina Powder 2021.
- MRM Nutrition Superfoods - Spirulina Powder . Available online: https://mrmnutrition.com/products/superfoods-raw-spirulina-powder (accessed on 7 November 2022).
- Healthy Planet Canada Organika Organic Spirulina 500g. Available online: https://www.healthyplanetcanada.com/organika-organic-spirulina-500g.html (accessed on 7 November 2022).
- U.S. Department of Agriculture Soybeans, Mature Seeds, Dry Roasted 2019.
- U.S. Department of Agriculture Feed Grains Custom Query Soybean Meal, High Protein 2022.
- Alibaba.com Soy Protein Isolate/ISP Isolated Soy Protein for Beverage Use/Bulk Price Soy Protein Isolates. Available online: https://www.alibaba.com/product-detail/Soy-Protein-Isolate-ISP-Isolated-Soy_1600627163803.html (accessed on 7 November 2022).
- BulkFoods.com Soy Isolate Protein 90%. Available online: https://bulkfoods.com/pure-protein-powders/soy-isolate-protein-90.html (accessed on 7 November 2022).
- Healthy Planet Canada NOW Soy Protein Isolate Unflavoured 544g. Available online: https://www.healthyplanetcanada.com/now-soy-protein-isolate-unflavoured-544g.html (accessed on 7 November 2022).
- U.S. Department of Agriculture Peas, Green, Raw 2019.
- Gittlein, J. USDA Weekly Bean, Pea, and Lentil Market Review 2022.
- Alibaba.com Hot Sell Non-GMO Organic Pea Protein Powder 85% For Food Supplement. Available online: https://www.alibaba.com/product-detail/Pea-Protein-Hot-Sell-Non-GMO_1600565503077.html (accessed on 7 November 2022).
- BulkFoods.com Pea Protein Powder. Available online: https://bulkfoods.com/pure-protein-powders/pea-protein-powder.html (accessed on 7 November 2022).
- Healthy Planet Canada NOW Pea Protein Unflavoured 907g. Available online: https://www.healthyplanetcanada.com/now-pea-protein-907g.html (accessed on 7 November 2022).
- U.S. Department of Agriculture Rice Bran, Crude 2019.
- U.S. Department of Agriculture Feed Grains Custom Query Rice Bran, f. o. b. Mills 2022.
- Alibaba.com Pincredit Supply Plant Protein Supplement Wholesale Brown Rice Protein Powder. Available online: https://www.alibaba.com/product-detail/Protein-Brown-Rice-Pincredit-Supply-Plant_1600558111076.html?spm=a2700.7735675.topad_classic.d_title.2d213cadln1a31 (accessed on 7 November 2022).
- BulkFoods.com Brown Rice Protein Powder. Available online: https://bulkfoods.com/pure-protein-powders/brown-rice-protein-powder.html (accessed on 7 November 2022).
- Healthy Planet Canada North Coast Naturals Brown Rice Protein 340g. Available online: https://www.healthyplanetcanada.com/north-coast-naturals-brown-rice-protein-340g.html (accessed on 7 November 2022).
- Zhang, J.; Chen, Q.; Kaplan, D.L.; Wang, Q. High-Moisture Extruded Protein Fiber Formation toward Plant-Based Meat Substitutes Applications: Science, Technology, and Prospect. Trends in Food Science & Technology 2022, 128, 202–216. [Google Scholar] [CrossRef]
- Rasband, W. ImageJ 2022.
- Shanbhag, A.G. Utilization of Information Measure as a Means of Image Thresholding. CVGIP: Graphical Models and Image Processing 1994, 56, 414–419. [Google Scholar] [CrossRef]
- Prewitt, J.M.S.; Mendelsohn, M.L. THE ANALYSIS OF CELL IMAGES*. Annals of the New York Academy of Sciences 2006, 128, 1035–1053. [Google Scholar] [CrossRef] [PubMed]
- Cyanotech Corporation 100% Pure All Natural Hawaiian Spirulina (Fine Powder) Specifications and General Composition. Available online: https://www.cyanotech.com/pdfs/spirulina/specifications.html#:~:text=It%20has%20a%20mild%20seaweed,0.48%20(g%2Fml).&text=Store%20at%20room%20temperature (accessed on 7 November 2022).
- John, H.; Mansuri, S.; Giri, S.; Sinha, L. Rheological Properties and Particle Size Distribution of Soy Protein Isolate as Affected by Drying Methods. NFSIJ 2018, 7, 1–0. [Google Scholar] [CrossRef]
- Overduin, J.; Guérin-Deremaux, L.; Wils, D.; Lambers, T.T. NUTRALYS ® Pea Protein: Characterization of in Vitro Gastric Digestion and in Vivo Gastrointestinal Peptide Responses Relevant to Satiety. Food & Nutrition Research 2015, 59, 25622. [Google Scholar] [CrossRef]
- Amagliani, L.; O’Regan, J.; Kelly, A.L.; O’Mahony, J.A. Physical and Flow Properties of Rice Protein Powders. Journal of Food Engineering 2016, 190, 1–9. [Google Scholar] [CrossRef]
- Schawe, J.; Riesen, R.; Widmann, J.; Schubnell, M.; Jörimann, U. UserCom, Information for Users of Mettler Toledo Thermal Analysis Systems 2000.
- Chronakis, I. Gelation of Edible Blue-Green Algae Protein Isolate (Spirulina Platensis Strain Pacifica): Thermal Transitions, Rheological Properties, and Molecular Forces Involved. J Agric Food Chem 2001, 49, 888–898. [Google Scholar] [CrossRef] [PubMed]
- Poel, G.V.; Istrate, D.; Magon, A.; Mathot, V. Performance and Calibration of the Flash DSC 1, a New, MEMS-Based Fast Scanning Calorimeter. J Therm Anal Calorim 2012, 110, 1533–1546. [Google Scholar] [CrossRef]
- Sun, X.; Lee, K.O.; Medina, M.A.; Chu, Y.; Li, C. Melting Temperature and Enthalpy Variations of Phase Change Materials (PCMs): A Differential Scanning Calorimetry (DSC) Analysis. Phase Transitions 2018, 91, 667–680. [Google Scholar] [CrossRef]
- Zhong, Z.K.; Sun, X.S. Thermal Behavior and Nonfreezing Water of Soybean Protein Components. Cereal Chem 2000, 77, 495–500. [Google Scholar] [CrossRef]
- TA Instruments Interpreting Unexpected Events and Transitions in DSC Results 2017.
- Kitabatake, N.; Tahara, M.; Doi, E. Thermal Denaturation of Soybean Protein at Low Water Contents. Agricultural and Biological Chemistry 1990, 54, 2205–2212. [Google Scholar] [CrossRef]
- Li, S.; Wei, Y.; Fang, Y.; Zhang, W.; Zhang, B. DSC Study on the Thermal Properties of Soybean Protein Isolates/Corn Starch Mixture. J Therm Anal Calorim 2014, 115, 1633–1638. [Google Scholar] [CrossRef]
- Li, J.-Y.; Yeh, A.-I.; Fan, K.-L. Gelation Characteristics and Morphology of Corn Starch/Soy Protein Concentrate Composites during Heating. Journal of Food Engineering 2007, 78, 1240–1247. [Google Scholar] [CrossRef]
- Mession, J.-L.; Sok, N.; Assifaoui, A.; Saurel, R. Thermal Denaturation of Pea Globulins ( Pisum Sativum L.)—Molecular Interactions Leading to Heat-Induced Protein Aggregation. J. Agric. Food Chem. 2013, 61, 1196–1204. [Google Scholar] [CrossRef]
- Shen, S.; Hou, H.; Ding, C.; Bing, D.-J.; Lu, Z.-X. Protein Content Correlates with Starch Morphology, Composition and Physicochemical Properties in Field Peas. Can. J. Plant Sci. 2016, 96, 404–412. [Google Scholar] [CrossRef]
- Oyinloye, T.M.; Yoon, W.B. Stability of 3D Printing Using a Mixture of Pea Protein and Alginate: Precision and Application of Additive Layer Manufacturing Simulation Approach for Stress Distribution. Journal of Food Engineering 2021, 288, 110127. [Google Scholar] [CrossRef]
- Wang, T.; Xu, P.; Chen, Z.; Zhou, X.; Wang, R. Alteration of the Structure of Rice Proteins by Their Interaction with Soy Protein Isolates to Design Novel Protein Composites. Food Funct. 2018, 9, 4282–4291. [Google Scholar] [CrossRef] [PubMed]
- Bridges, S.; Robinson, L. Chapter 1 - Rheology. In A Practical Handbook for Drilling Fluids Processing; Gulf Professional Publishing, 2022; pp. 3–26.
- Kar, F.; Arslan, N. Effect of Temperature and Concentration on Viscosity of Orange Peel Pectin Solutions and Intrinsic Viscosity–Molecular Weight Relationship. Carbohydrate Polymers 1999, 40, 277–284. [Google Scholar] [CrossRef]
- Hassanzadeh, H.; Ghanbarzadeh, B.; Galali, Y.; Bagheri, H. The Physicochemical Properties of the Spirulina-wheat Germ-enriched High-protein Functional Beverage Based on Pear-cantaloupe Juice. Food Science & Nutrition 2022, 10, 3651–3661. [Google Scholar] [CrossRef]
- Liu, P.; Xu, H.; Zhao, Y.; Yang, Y. Rheological Properties of Soy Protein Isolate Solution for Fibers and Films. Food Hydrocolloids 2017, 64, 149–156. [Google Scholar] [CrossRef]
- Zhang, Z.; Liu, Y. Recent Progresses of Understanding the Viscosity of Concentrated Protein Solutions. Current Opinion in Chemical Engineering 2017, 16, 48–55. [Google Scholar] [CrossRef]
- Qi, G.; Li, N.; Wang, D.; Sun, X.S. Adhesion and Physicochemical Properties of Soy Protein Modified by Sodium Bisulfite. J Americ Oil Chem Soc 2013, 90, 1917–1926. [Google Scholar] [CrossRef]
- Osen, R.; Toelstede, S.; Wild, F.; Eisner, P.; Schweiggert-Weisz, U. High Moisture Extrusion Cooking of Pea Protein Isolates: Raw Material Characteristics, Extruder Responses, and Texture Properties. Journal of Food Engineering 2014, 127, 67–74. [Google Scholar] [CrossRef]
- Lee, K.; Lee, J. Chapter 6 - Hybrid Thermal Recovery Using Low-Salinity and Smart Waterflood. In Hybrid Enhanced Oil Recovery using Smart Waterflooding; Gulf Professional Publishing, 2019; pp. 129–135.
- Beck, S.M.; Knoerzer, K.; Sellahewa, J.; Emin, M.A.; Arcot, J. Effect of Different Heat-Treatment Times and Applied Shear on Secondary Structure, Molecular Weight Distribution, Solubility and Rheological Properties of Pea Protein Isolate as Investigated by Capillary Rheometry. Journal of Food Engineering 2017, 208, 66–76. [Google Scholar] [CrossRef]
- Wu, J.; Xu, S.; Yan, X.; Zhang, X.; Xu, X.; Li, Q.; Ye, J.; Liu, C. Effect of Homogenization Modified Rice Protein on the Pasting Properties of Rice Starch. Foods 2022, 11, 1601. [Google Scholar] [CrossRef]
- Li, X.; Liu, Y.; Yi, C.; Cheng, Y.; Zhou, S.; Hua, Y. Microstructure and Rheological Properties of Mixtures of Acid-Deamidated Rice Protein and Dextran. Journal of Cereal Science 2010, 51, 7–12. [Google Scholar] [CrossRef]
- Chhabra, R.; Richardson, J. Chapter 3 - Flow in Pipes and in Conduits of Non-Circular Cross-Sections. In Non-Newtonian Flow and Applied Rheology (Second Edition); ). Oxford: Butterworth-Heinemann, 2008; pp. 110–205.
- Liestianty, D.; Rodianawati, I.; Arfah, R.A.; Assa, A. ; Patimah; Sundari; Muliadi Nutritional Analysis of Spirulina Sp to Promote as Superfood Candidate. IOP Conf. Ser.: Mater. Sci. Eng. 2019, 509, 012031. [Google Scholar] [CrossRef]
- Gorissen, S.H.M.; Crombag, J.J.R.; Senden, J.M.G.; Waterval, W.A.H.; Bierau, J.; Verdijk, L.B.; Van Loon, L.J.C. Protein Content and Amino Acid Composition of Commercially Available Plant-Based Protein Isolates. Amino Acids 2018, 50, 1685–1695. [Google Scholar] [CrossRef] [PubMed]
- Sá, A.G.A.; Moreno, Y.M.F.; Carciofi, B.A.M. Plant Proteins as High-Quality Nutritional Source for Human Diet. Trends in Food Science & Technology 2020, 97, 170–184. [Google Scholar] [CrossRef]
- Vasconcelos, I.M.; Campello, C.C.; Oliveira, J.T.A.; Carvalho, A.F.U.; Souza, D.O.B.D.; Maia, F.M.M. Brazilian Soybean Glycine Max (L.) Merr. Cultivars Adapted to Low Latitude Regions: Seed Composition and Content of Bioactive Proteins. Rev. bras. Bot. 2006, 29, 617–625. [Google Scholar] [CrossRef]
- Montoya, C.A.; Gomez, A.S.; Lallès, J.-P.; Souffrant, W.B.; Beebe, S.; Leterme, P. In Vitro and in Vivo Protein Hydrolysis of Beans (Phaseolus Vulgaris) Genetically Modified to Express Different Phaseolin Types. Food Chemistry 2008, 106, 1225–1233. [Google Scholar] [CrossRef]
- Amagliani, L.; O’Regan, J.; Kelly, A.L.; O’Mahony, J.A. The Composition, Extraction, Functionality and Applications of Rice Proteins: A Review. Trends in Food Science & Technology 2017, 64, 1–12. [Google Scholar] [CrossRef]
- Liu, K.; Zheng, J.; Chen, F. Relationships between Degree of Milling and Loss of Vitamin B, Minerals, and Change in Amino Acid Composition of Brown Rice. LWT - Food Science and Technology 2017, 82, 429–436. [Google Scholar] [CrossRef]
- Vendemiatti, A.; Rodrigues Ferreira, R.; Humberto Gomes, L.; Oliveira Medici, L.; Antunes Azevedo, R. Nutritional Quality of Sorghum Seeds: Storage Proteins and Amino Acids. Food Biotechnology 2008, 22, 377–397. [Google Scholar] [CrossRef]
- Boye, J.; Wijesinha-Bettoni, R.; Burlingame, B. Protein Quality Evaluation Twenty Years after the Introduction of the Protein Digestibility Corrected Amino Acid Score Method. Br J Nutr 2012, 108, S183–S211. [Google Scholar] [CrossRef]
- Sarwar Gilani, G.; Wu Xiao, C.; Cockell, K.A. Impact of Antinutritional Factors in Food Proteins on the Digestibility of Protein and the Bioavailability of Amino Acids and on Protein Quality. Br J Nutr 2012, 108, S315–S332. [Google Scholar] [CrossRef] [PubMed]
- Park, S.J.; Kim, T.W.; Baik, B.-K. Relationship between Proportion and Composition of Albumins, and in Vitro Protein Digestibility of Raw and Cooked Pea Seeds ( Pisum Sativum L.): Composition and in Vitro Digestibility of Pea Protein. J. Sci. Food Agric. 2010, 90, 1719–1725. [Google Scholar] [CrossRef] [PubMed]
- Abdul-Fattah, A.M.; Kalonia, D.S.; Pikal, M.J. The Challenge of Drying Method Selection for Protein Pharmaceuticals: Product Quality Implications. Journal of Pharmaceutical Sciences 2007, 96, 1886–1916. [Google Scholar] [CrossRef] [PubMed]
- Zhao, Q.; Xiong, H.; Selomulya, C.; Chen, X.D.; Huang, S.; Ruan, X.; Zhou, Q.; Sun, W. Effects of Spray Drying and Freeze Drying on the Properties of Protein Isolate from Rice Dreg Protein. Food Bioprocess Technol 2013, 6, 1759–1769. [Google Scholar] [CrossRef]
- Burger, T.G.; Singh, I.; Mayfield, C.; Baumert, J.L.; Zhang, Y. The Impact of Spray Drying Conditions on the Physicochemical and Emulsification Properties of Pea Protein Isolate. LWT 2022, 153, 112495. [Google Scholar] [CrossRef]
- Hubbard, B.R.; Putman, L.I.; Techtmann, S.; Pearce, J.M. Open Source Vacuum Oven Design for Low-Temperature Drying: Performance Evaluation for Recycled PET and Biomass. JMMP 2021, 5, 52. [Google Scholar] [CrossRef]
- Nikbakht Nasrabadi, M.; Sedaghat Doost, A.; Mezzenga, R. Modification Approaches of Plant-Based Proteins to Improve Their Techno-Functionality and Use in Food Products. Food Hydrocolloids 2021, 118, 106789. [Google Scholar] [CrossRef]
- Ma, W.; Qi, B.; Sami, R.; Jiang, L.; Li, Y.; Wang, H. Conformational and Functional Properties of Soybean Proteins Produced by Extrusion-Hydrolysis Approach. International Journal of Analytical Chemistry 2018, 2018, 1–11. [Google Scholar] [CrossRef]
- Zahari, I.; Ferawati, F.; Helstad, A.; Ahlström, C.; Östbring, K.; Rayner, M.; Purhagen, J.K. Development of High-Moisture Meat Analogues with Hemp and Soy Protein Using Extrusion Cooking. Foods 2020, 9, 772. [Google Scholar] [CrossRef]
- Carvalho, C.W.P.; Takeiti, C.Y.; Onwulata, C.I.; Pordesimo, L.O. Relative Effect of Particle Size on the Physical Properties of Corn Meal Extrudates: Effect of Particle Size on the Extrusion of Corn Meal. Journal of Food Engineering 2010, 98, 103–109. [Google Scholar] [CrossRef]
- Chen, Z.C.; Ikeda, K.; Murakami, T.; Takeda, T. Effect of Particle Packing on Extrusion Behavior of Pastes. Journal of Materials Science 2000, 35, 5301–5307. [Google Scholar] [CrossRef]
- Tilman, D.; Clark, M. Global Diets Link Environmental Sustainability and Human Health. Nature 2014, 515, 518–522. [Google Scholar] [CrossRef] [PubMed]
- Kumar, P.; Chatli, M.K.; Mehta, N.; Singh, P.; Malav, O.P.; Verma, A.K. Meat Analogues: Health Promising Sustainable Meat Substitutes. Critical Reviews in Food Science and Nutrition 2017, 57, 923–932. [Google Scholar] [CrossRef] [PubMed]
- Alexander, P.; Brown, C.; Arneth, A.; Finnigan, J.; Rounsevell, M.D.A. Human Appropriation of Land for Food: The Role of Diet. Global Environmental Change 2016, 41, 88–98. [Google Scholar] [CrossRef]
- Saranraj, P.; Sivasakthi, S. Spirulina Platensis – Food for Future: A Review. Asian Journal of Pharmaceutical Science & Technology 2014, 4, 26–33. [Google Scholar]
- Food and Agriculture Organization of the United Nations FAOSTAT Crops and Livestock Products from Year 1994 to 2021 2022.
- Denkenberger, D.; Pearce, J. Feeding Everyone No Matter What: Managing Food Security after Global Catastrophe; Academic Press, 2014.
- Denkenberger, D.; Pearce, J. Feeding Everyone: Solving the Food Crisis in Event of Global Catastrophes That Kill Crops or Obscure the Sun. Futures 2015, 72, 57–68. [Google Scholar] [CrossRef]
- Baum, S.D.; Denkenberger, D.C.; Pearce, J.M.; Robock, A.; Winkler, R. Resilience to Global Food Supply Catastrophes. Environ Syst Decis 2015, 35, 301–313. [Google Scholar] [CrossRef]
- Franc-Dąbrowska, J.; Drejerska, N. Resilience in the Food Sector – Environmental, Social and Economic Perspectives in Crisis Situations. IFAM 2022, 25, 757–770. [Google Scholar] [CrossRef]
- Pham, A.; García Martínez, J.B.; Brynych, V.; Stormbjorne, R.; Pearce, J.M.; Denkenberger, D.C. Nutrition in Abrupt Sunlight Reduction Scenarios: Envisioning Feasible Balanced Diets on Resilient Foods. Nutrients 2022, 14, 492. [Google Scholar] [CrossRef]
- Munialo, C.; Vriesekoop, F. Plant-Based Foods as Meat and Fat Substitutes. Food Science & Nutrition 2023.
- Wang, Y.; Lyu, B.; Fu, H.; Li, J.; Ji, L.; Gong, H.; Zhang, R.; Liu, J.; Yu, H. The Development Process of Plant-Based Meat Alternatives: Raw Material Formulations and Processing Strategies. Food Research International 2023, 13, 112689. [Google Scholar] [CrossRef]
|
Disclaimer/Publisher’s Note: The statements, opinions and data contained in all publications are solely those of the individual author(s) and contributor(s) and not of MDPI and/or the editor(s). MDPI and/or the editor(s) disclaim responsibility for any injury to people or property resulting from any ideas, methods, instructions or products referred to in the content. |
© 2023 by the authors. Licensee MDPI, Basel, Switzerland. This article is an open access article distributed under the terms and conditions of the Creative Commons Attribution (CC BY) license (http://creativecommons.org/licenses/by/4.0/).
