
Submitted:
07 November 2023
Posted:
07 November 2023
You are already at the latest version
Abstract
The latest experimental measurements of cosmic rays (CRs) have discovered a series of anomalies, including the hardening of the nuclear spectra at R ∼200 GV followed by softening at R ∼10 TV and complicated energy dependence of anisotropy from GeV to PeV. Recent works have demonstrated nearby sources are crucial for these anomalies of spectra and anisotropy. In this work, we analyze the contributions of five nearby sources within 1 kpc around solar system to the spectra and anisotropy, finally find out which source is the best candidate source. In the calculation process, we also introduce the anisotropic diffusion of CRs induced by the local interstellar magnetic field (LIMF) nearby the solar system based on spatial-dependent propagation (SDP) model. As a result, we find Geminga SNR source can simultaneously account for CR spectra and anisotropy, whereas the other sources can not . Measurements of CR anisotropy and spectra by experiments such as LHAASO and HAWC are expected to test this scenario in the near future.
Keywords:
galatic cosmic rays
; nearby source
; cosmic ray anisotropy
; cosmic ray spectra
0. Introduction
CRs less than PeV are generally believed to be produced in the Galaxy, and supernova remnants (SNRs) are considered to be the most important galactic sources [1]. CR spectrum follows approximately a power-law from GeV to eV [2]. In addition to the overall power-law spectrum, there are some anomalous features, such as the "knee" at ∼ 4 PeV [3], the "second knee" at ∼ 400 PeV [4], the "ankle" at ∼ 4 EeV [5], and the "GZK" truncation at tens of EeV [6].
Besides the above key spectral features, several fine anomalous spectral structures have been discovered in recent years. A large amount of space experiments such as ATIC-2 [7] CREAM [8,9] PAMELA [10] and AMS-02 [11,12] and calorimeter experiment CALET [13], PAMELA [10] have found nuclear spectra become hard at GV. Furthermore, the nuclear spectra of proton and helium become soft again at TV were shown by DAMP [14], CREAM [15] and NUCLEON [16]. In recent years, the following theoretical models have been proposed to explain these spectral anomalies: the nearby sources near the solar system contribute to the "bulge" of the CR spectra [17,18]; interaction between CRs and accelerating shock waves [19,20]; CR propagation process effect [18,21]; multiple acceleration sources superimposed factors [22,23].
CRs, mostly charged particles, are deflected by the Galactic magnetic field (GMF) and interact with the interstellar medium during their propagation, so CRs are roughly isotropic when they arrive at the Earth. However, subtle CR anisotropy with relative amplitudes in the order of is observed at a wide energy range from 100 GeV to PeV by a large number of underground detectors and EAS array experiments. Experiments such as Tibet [24,25,26],Super-Kamiokande [27], Milagro [28,29], IceCube/Ice-Top [30,31,32,33,34], ARGO-YBJ [35,36], HAWC [37], EASTOP [38] KASCADE [39,40] HWAC [41] have revealed the complex evolution of anisotropy with energy. Experiment results of anisotropy show that the amplitude of anisotropy increases first and then decreases with energy below 100 TeV, but gradually increases again above 100 TeV. At the same time the phase is reversed at about 100 TeV. It is clear that both amplitude and phase contradict the expectations of the standard CR diffusion scenario. In general, the origin of anisotropy may consist of the following reasons: nearby sources near the solar system [18,42], the deflection of local regular magnetic field [42,43,44], CR propagation [18] and Compton-Getting effect caused by the relative motion between Earth rotation and CRs [45,46].
CR spectra and anisotropy from GeV to TeV have some common anomalous characteristics, suggesting that they may have a common origin. In recent years, a large number of studies have supported that nearby sources are well correlated with the anomalies. [42] shows that the Geminga source and anisitorpic diffusion of CRs induced by the LIMF can explain both nuclear spectra and anisotropy. [47] demonstrates that three local SNRs, i.e., Geminga, Monogem, and Vela, could have important contributions to both proton and electron spectra. However, the expected anisotropy from Monogem is obviously inconsistent with the observations. And the bump in electron spectrum above several TeV could stem from the young Vela SNR. [48] demonstrates that only Geminga SNR could be the proper candidate of the local CR source by fitting calculation. [49] have found that Monogem can reasonably account for primary electron excess and proton spectrum. [44] presents that an excellent candidate of the local CR source responsible for the dipole anisotropy at TeV is the Vela SNR.
There are 12 nearby SNR sources around the solar system within 1kpc. In this work, We analyze the contribution of five different nearby sources including Geminga, Monogem, Vela, Loop I and Cygnus listed in Table 1 to CR spectra and anisotropy and explore which single source is the best candidate. Our calculation is based on the SDP model and introduce the anisotropic diffusion of CRs induced by LIMF. The paper is organized as follows: Section 1 presents the model description; In Section 2, the results of CR spectra and anisotropy are presented and discussed; Section 3 gives the summary.

1. Model Description
1.1. Spatially dependent diffusion
The region where CRs diffuse in the Galaxy is called a magnetic halo, which is usually approximated as a cylinder with its radial boundary equal to the Galactic radius, i.e. kpc and its half thickness is about a few kpc. is usually determined by fitting the B/C ratio along with diffusion coefficient [55]. Both CR sources and the interstellar medium are usually assumed to be concentrated near the galactic disk, whose average thickness is roughly 200 pc.
HAWC experiment obtained by observing B/C that the diffusion coefficient of CRs near the source of the galactic disk was two orders of magnitude lower than that away from the source. In the past few years, the SDP model of CRs with different propagation coefficients in the near and away galactic disk has been proposed and widely applied [21,56,57]. In the SDP model, the galactic diffusion halo is divided into two regions, i.e inner halo (IH) and outer halo (OH). The galactic disk and its surrounding region is called the IH, while the diffusion region outside the IH is called the OH. In IH region, where are more sources, the activity of supernova explosion will lead to more intense turbulence. Therefore, the diffusion of CRs will be slow, and the diffusion coefficient will be less dependent on the rigidity. Whereas in OH region, the diffusion of CRs is less affected by stellar activity, and diffusion coefficient is consistent with the traditional propagation model and only depends on rigidity.
In this work, we adopt SDP model and the diffusion coefficient is parameterized as [58,59]
where r and z are cylindrical coordinates, is particle’s rigidity and is a constant. The total half thickness of the propagation halo is , and the half-thickness of the IH is . The parameterization of can be parameterized as
where , and is the source density distribution. In this work, we adopt numerical package DRAGON to solve the transport equation [60].
1.2. Background sources
The injection spectrum of background sources is assumed to be a power-law of rigidity with a high-energy exponential cutoff, . The cutoff rigidity of each element could be either Z- or A-dependent.
The spatial distribution of sources takes the form of SNR distribution [61]:
where kpc and kpc.
1.3. Nearby source
We solve the time-varying propagation equation of CRs from the nearby sources assuming a spherical geometry with infinite boundary conditions and using Green’s function method [62,63].
The CR density of nearby source as a function of location,time and rigity is calculated by
where is the instantaneous injection spectrum of a point source, is the effective diffusion length within time t, is the diffusion coefficient which is adopted as the value nearby the solar system. The injection spectrum is also parameterized as a cutoff power-law form, . The normalization is obtained through fitting to the CR energy spectra.
In this work, five nearby sources, i.e. Geminga, Monogem, Vela, Loop I and Cygnus are analyzed and their location and age are shown in Table 1.
1.4. Anisotropic Diffusion and Large-Scale Anisotropy
The amplitude of the dipole anisotropy is proportional to the spatial gradient of the CR density and the diffusion coefficient. The anisotropy can be written as [44,64]
By observing neutral particles passing through the heliosphere boundary, the IBEX experiment revealed that the LIMF, in the range of 20 pc, follows , which coincides with the anisotropic phase below the 100 TeV region [65]. Some work has also revealed that TeV cosmic ray anisotropy is related to LIMF [44,66]. CRs diffuse anisotropically in magnetic field, and the diffusion tensor associated with the magnetic field is written as
Where and are the diffusion coefficients aligned parallel and perpendicular to the ordered magnetic field, is the i-th component of the unit vector [67], respectively. The values and of rigidity in this work refer to the form [42,68] and are shown as follows,
where is the ratio between perpendicular and parallel diffusion coefficient at the reference rigidity .
Under the anisotropic diffusion model, the form of formula 5 can be written as,
2. Results and Discussion
2.1. ratio
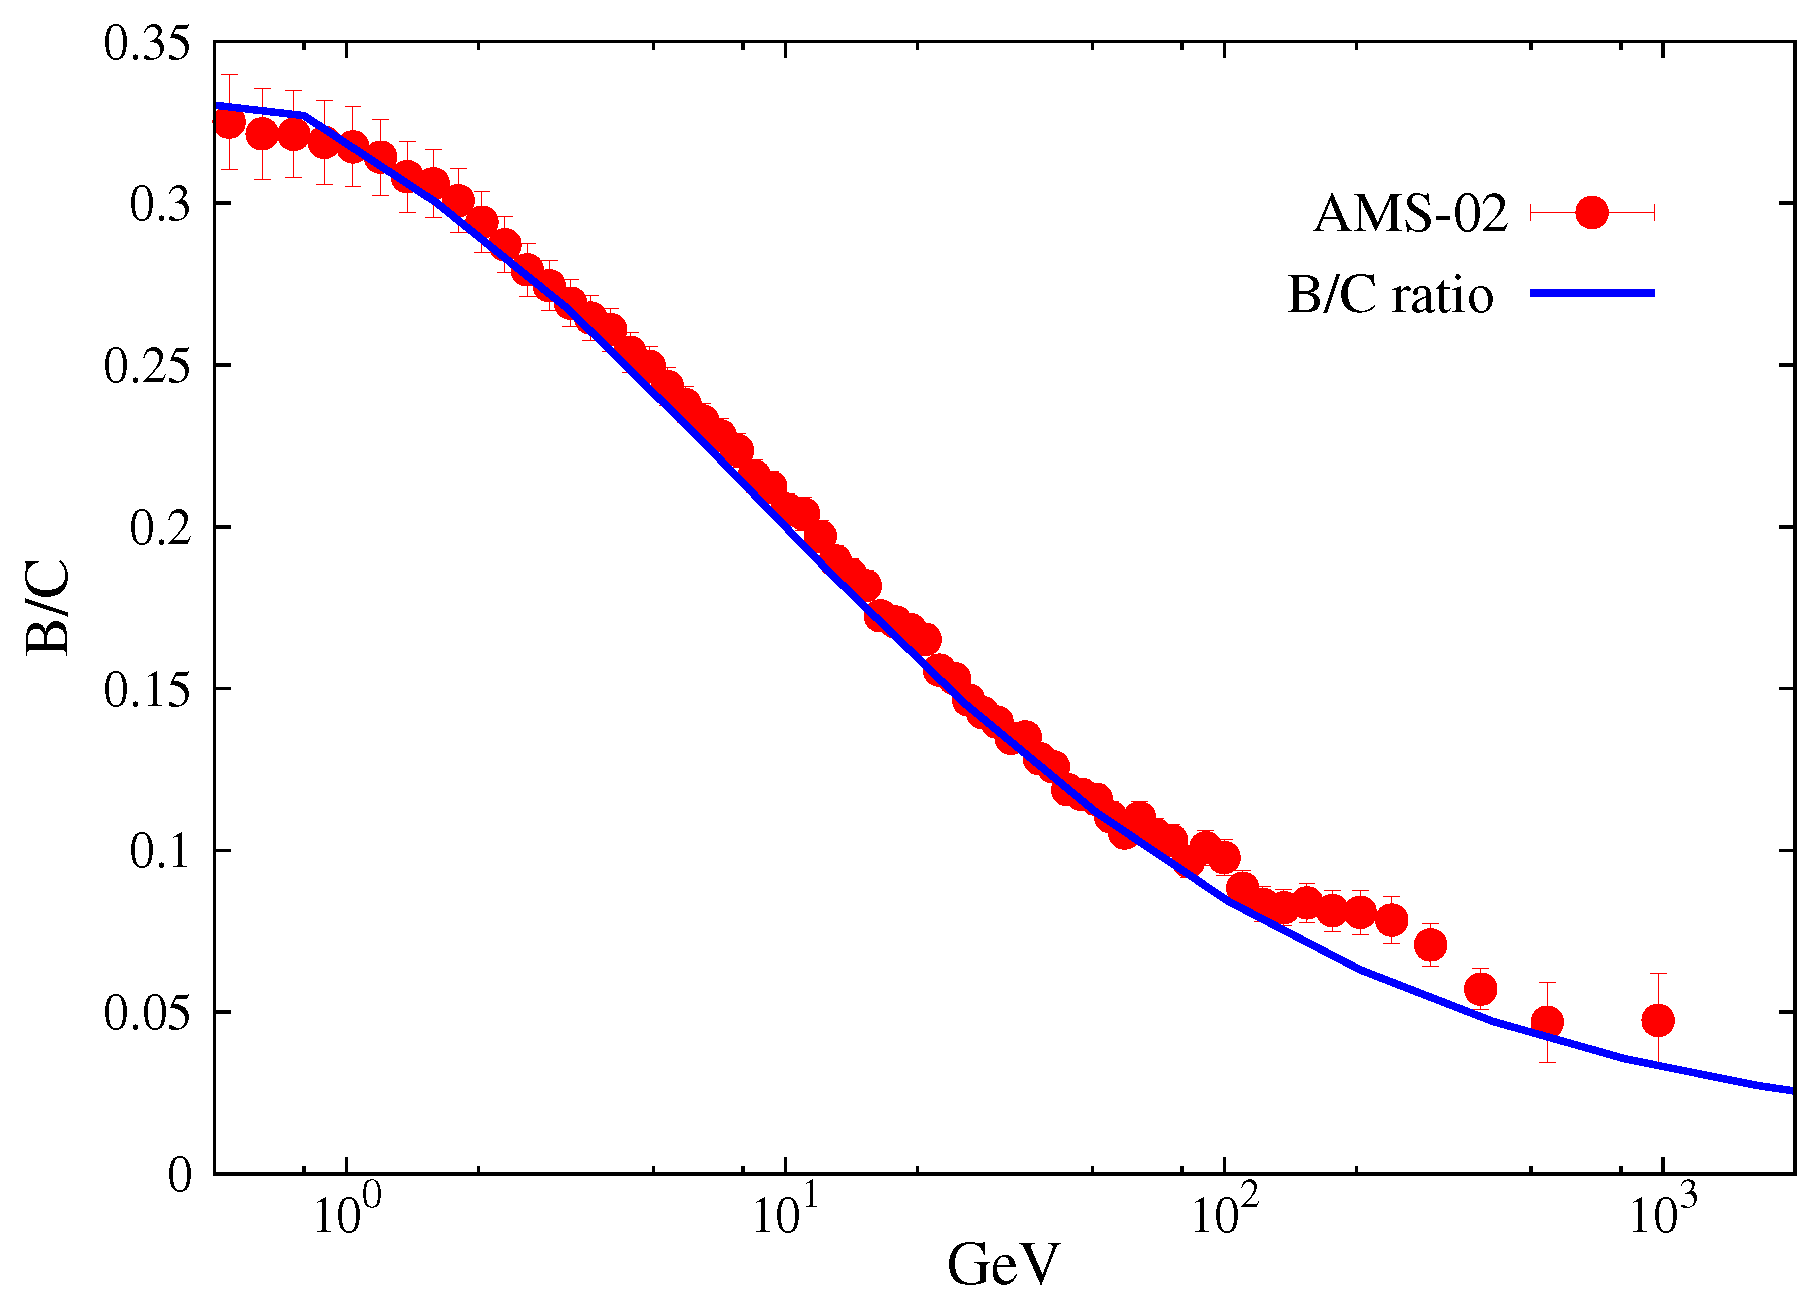
We obtained the propagation parameters by fitting the B/C ratio. The comparison of the B/C ratio between the model prediction and the observation data of AMS-02 is shown in Figure 1, which indicates that the relevant parameters are reasonable. The corresponding propagation parameters are respectively , , , , . The Alfvénic velocity is , and thhe half thickness of the propagation halo is .
Figure 1.
Fitting to B/C ratio with the Model prediction. The B/C data points are taken from AMS-02 experiment [69].
Figure 1.
Fitting to B/C ratio with the Model prediction. The B/C data points are taken from AMS-02 experiment [69].
2.2. Proton and Helium spectra of five nearby sources
First, we calculate the proton and helium spectra for different five nearby sources as listed in Table 1. Z-dependent cutoff is applied to the injection spectra of background sources with a high-energy exponential cutoff. We obtained the cutoff rigidity by fitting the proton and helium spectra observed by KASCADE. Similarly, the injection spectra of the nearby sources are also based on Z-dependent cutoff. In order to better match the CR spectra, the injection spectra of the background sources are fine-tuned, when we calculate the contribution of different nearby sources to CR spectra. The corresponding injection parameters of background and nearby sources are shown in Table 2. Only the injection spectra for Geminga and Monogem sources are listed here.
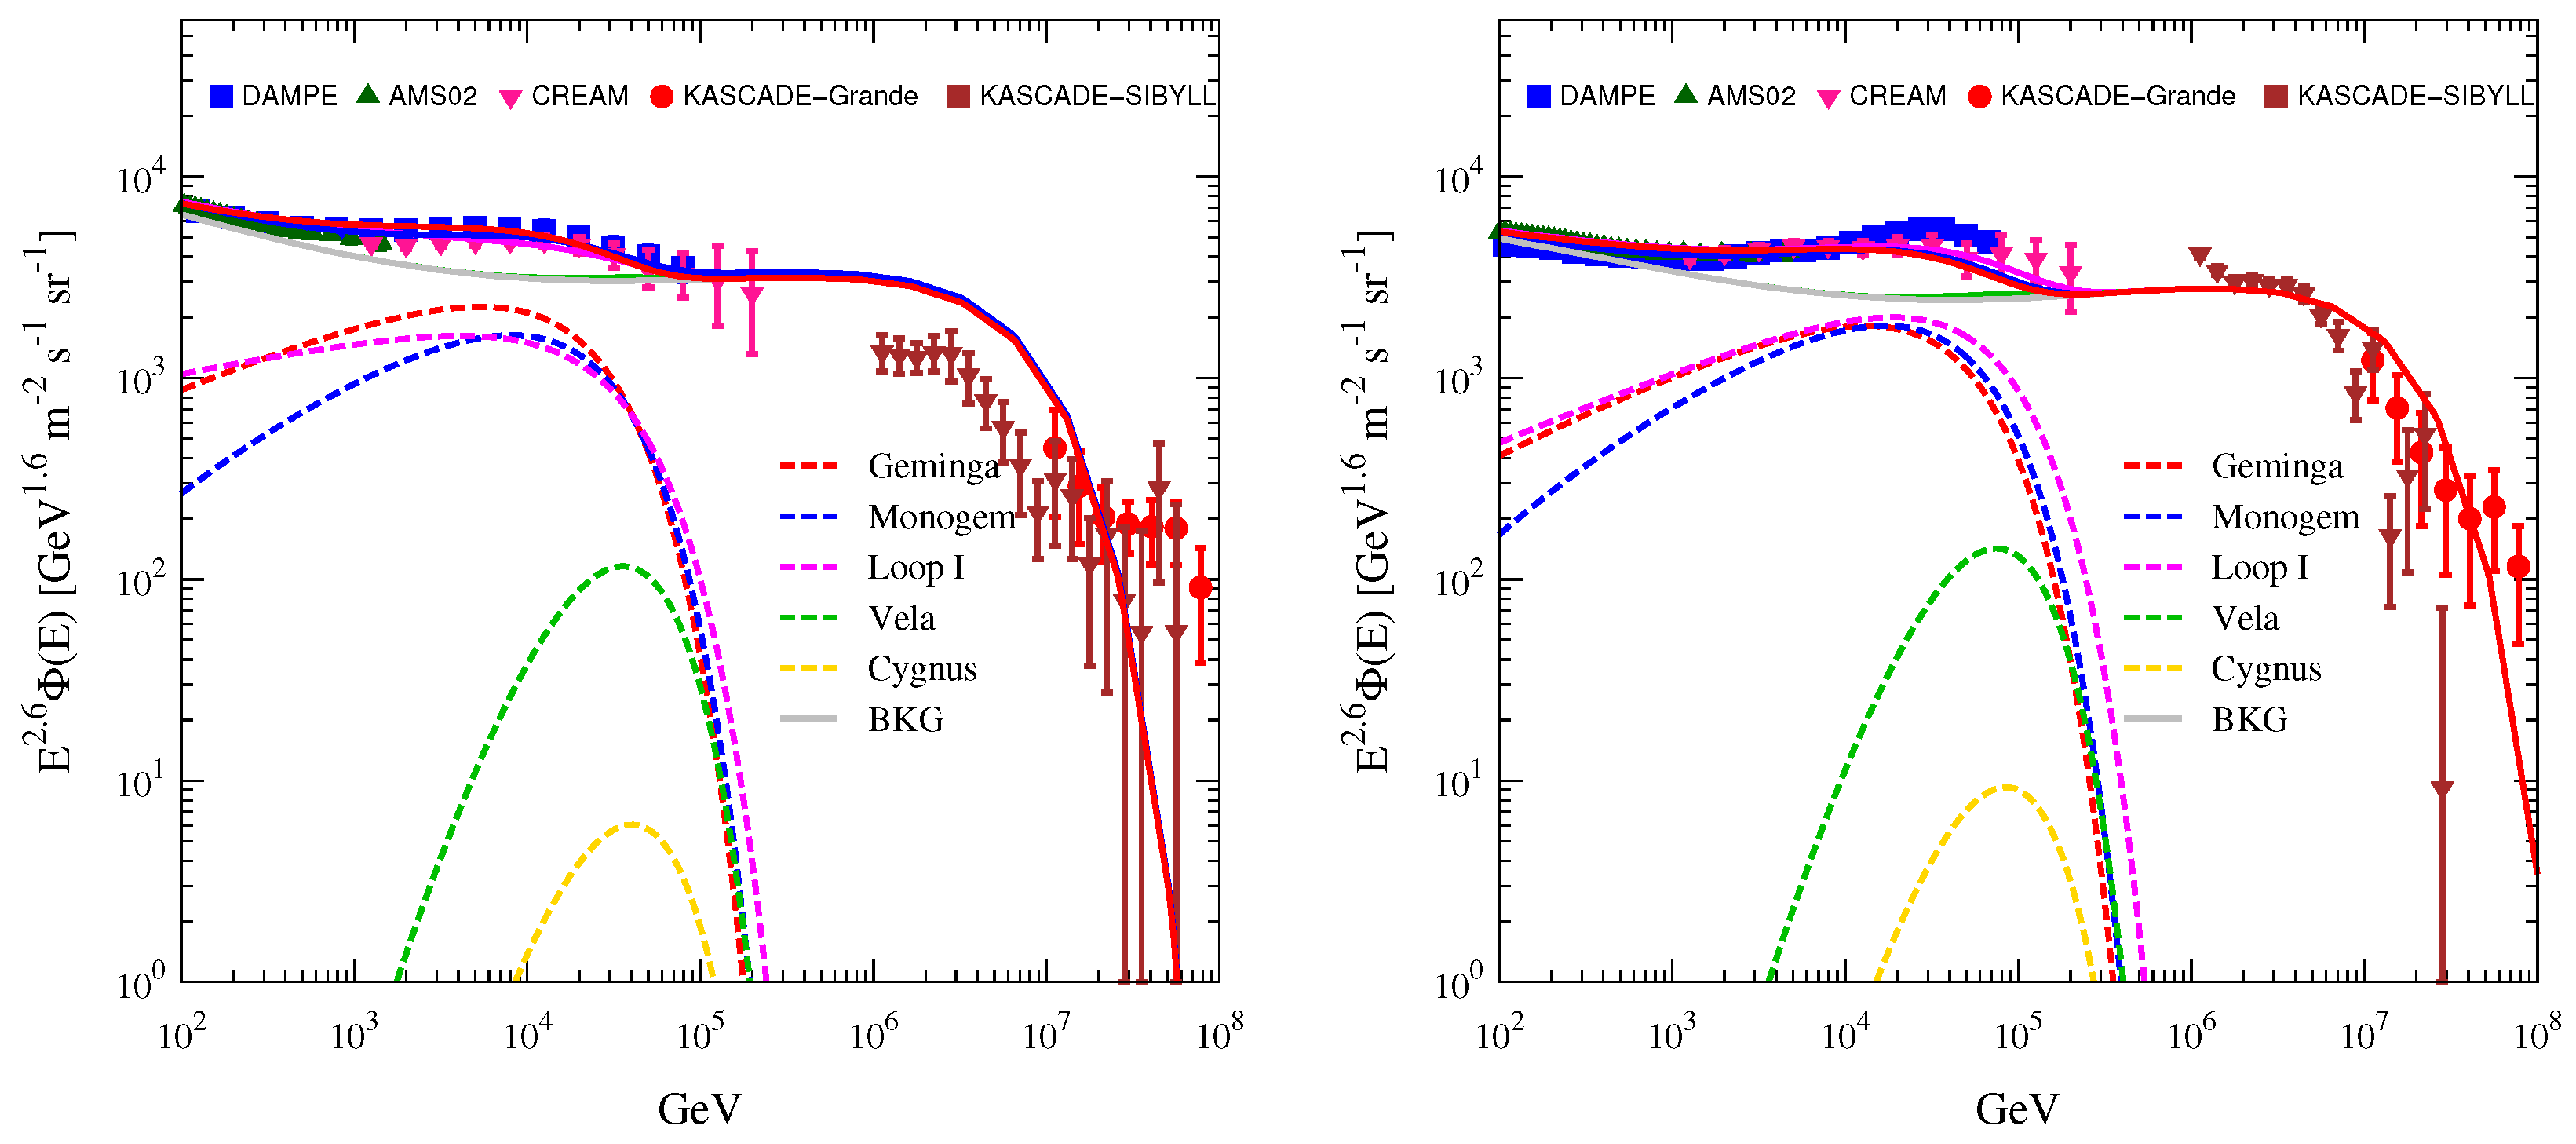
Figure 2 presents the spectral results of proton (left) and helium (right), where the solid gray line is the contribution of the background sources, the dashdotted lines in different colors represent the contributions from different single nearby sources, and the solid lines in corresponding colors display the sum of single nearby sources and background sources. It can be seen that the contribution of Geminga, Monogem and Loop I SNR can account for spectral hardening at ∼ 200 GeV and softening features at ∼ 10 TeV, but Vela and Cygnus can not. Because Vela and Cygnus source are younger than the others, low-energy CRs produced by them are difficult to reach the solar system, so the flux of CRs below 100 TeV is lower.
Figure 2.
Energy spectra of protons (left) and helium nuclei (right) from the different single nearby sources. The data points are taken from DAMPE [70,71], AMS-02 [11,72], CREAM-III [73], NUCLEON [74], KASCADE [75] and KASCADE-Grande [76] respectively. The grey solid lines (BKG) represent the fluxes of background sources, and the dashdotted lines in different colors are the fluxes from different single nearby SNR sources respectively, and the solid lines of corresponding color represent the sum contributions of the background and nearby sources.
2.3. Anisotropy of Geminga, Monogem and Loop I
Since only the energy spectra of Geminga, Monogem and Loop I sources are consistent with the experimental data, we will only analyze the anisotropy of these three sources next.
The anisotropic propagation diffusion coefficient of CRs is a tensor related to the magnetic field. In this work, we adopted the LIMF observed by IBEX. The parameters of parallel diffusion coefficient are set as those in Section 2.1. CRs from TeV to PeV energy region are thought to travel faster parallel to the magnetic field than perpendicular to it, therefore we set , and the difference between and is 0.32.
The amplitude and phase of CR anisotropy with Geminga SNR are shown in Figure 3. It is obvious that both phase and amplitude agree well with experimental data, which indicates that Geminga SNR is a good candidate source. Below 100 TeV, the phase points in the direction of the LIMF, which indicates that Geminga source and the LIMF deflection dominate the anisotropic phase, although the nearby source flux is sub-dominant. Above 100 TeV, the phase points to Galactic Center(GC) indicates background sources dominate, since galactic CR sources are more abundant in the inner galaxy
Figure 3.
The amplitude (left) and phase (right) of anisotropy with the contribution from nearby Geminga SNR source. The data points are taken from underground muon detectors: Norikura [77], Ottawa [78], London [79], Bolivia [2], Budapest [80], Hobart [80], London [80], Misato [80], Socorro [80], Yakutsk [80], Banksan [81], Hong Kong [82], Sakashita [83], Utah [84], Liapootah [85], Matsushiro [86], Poatina [87], Kamiokande [88], Marco [89],SuperKamiokande [27]; and air shower array experiments: PeakMusala [89], Baksan [91], Norikura [92], EAS-TOP [38,93,94], Baksan [95], Milagro [29], IceCube [30,32], Ice-Top [33], ARGO-YBJ [36], Tibet [46,96,97], HAWC [43], HAWC-IceCube [43].
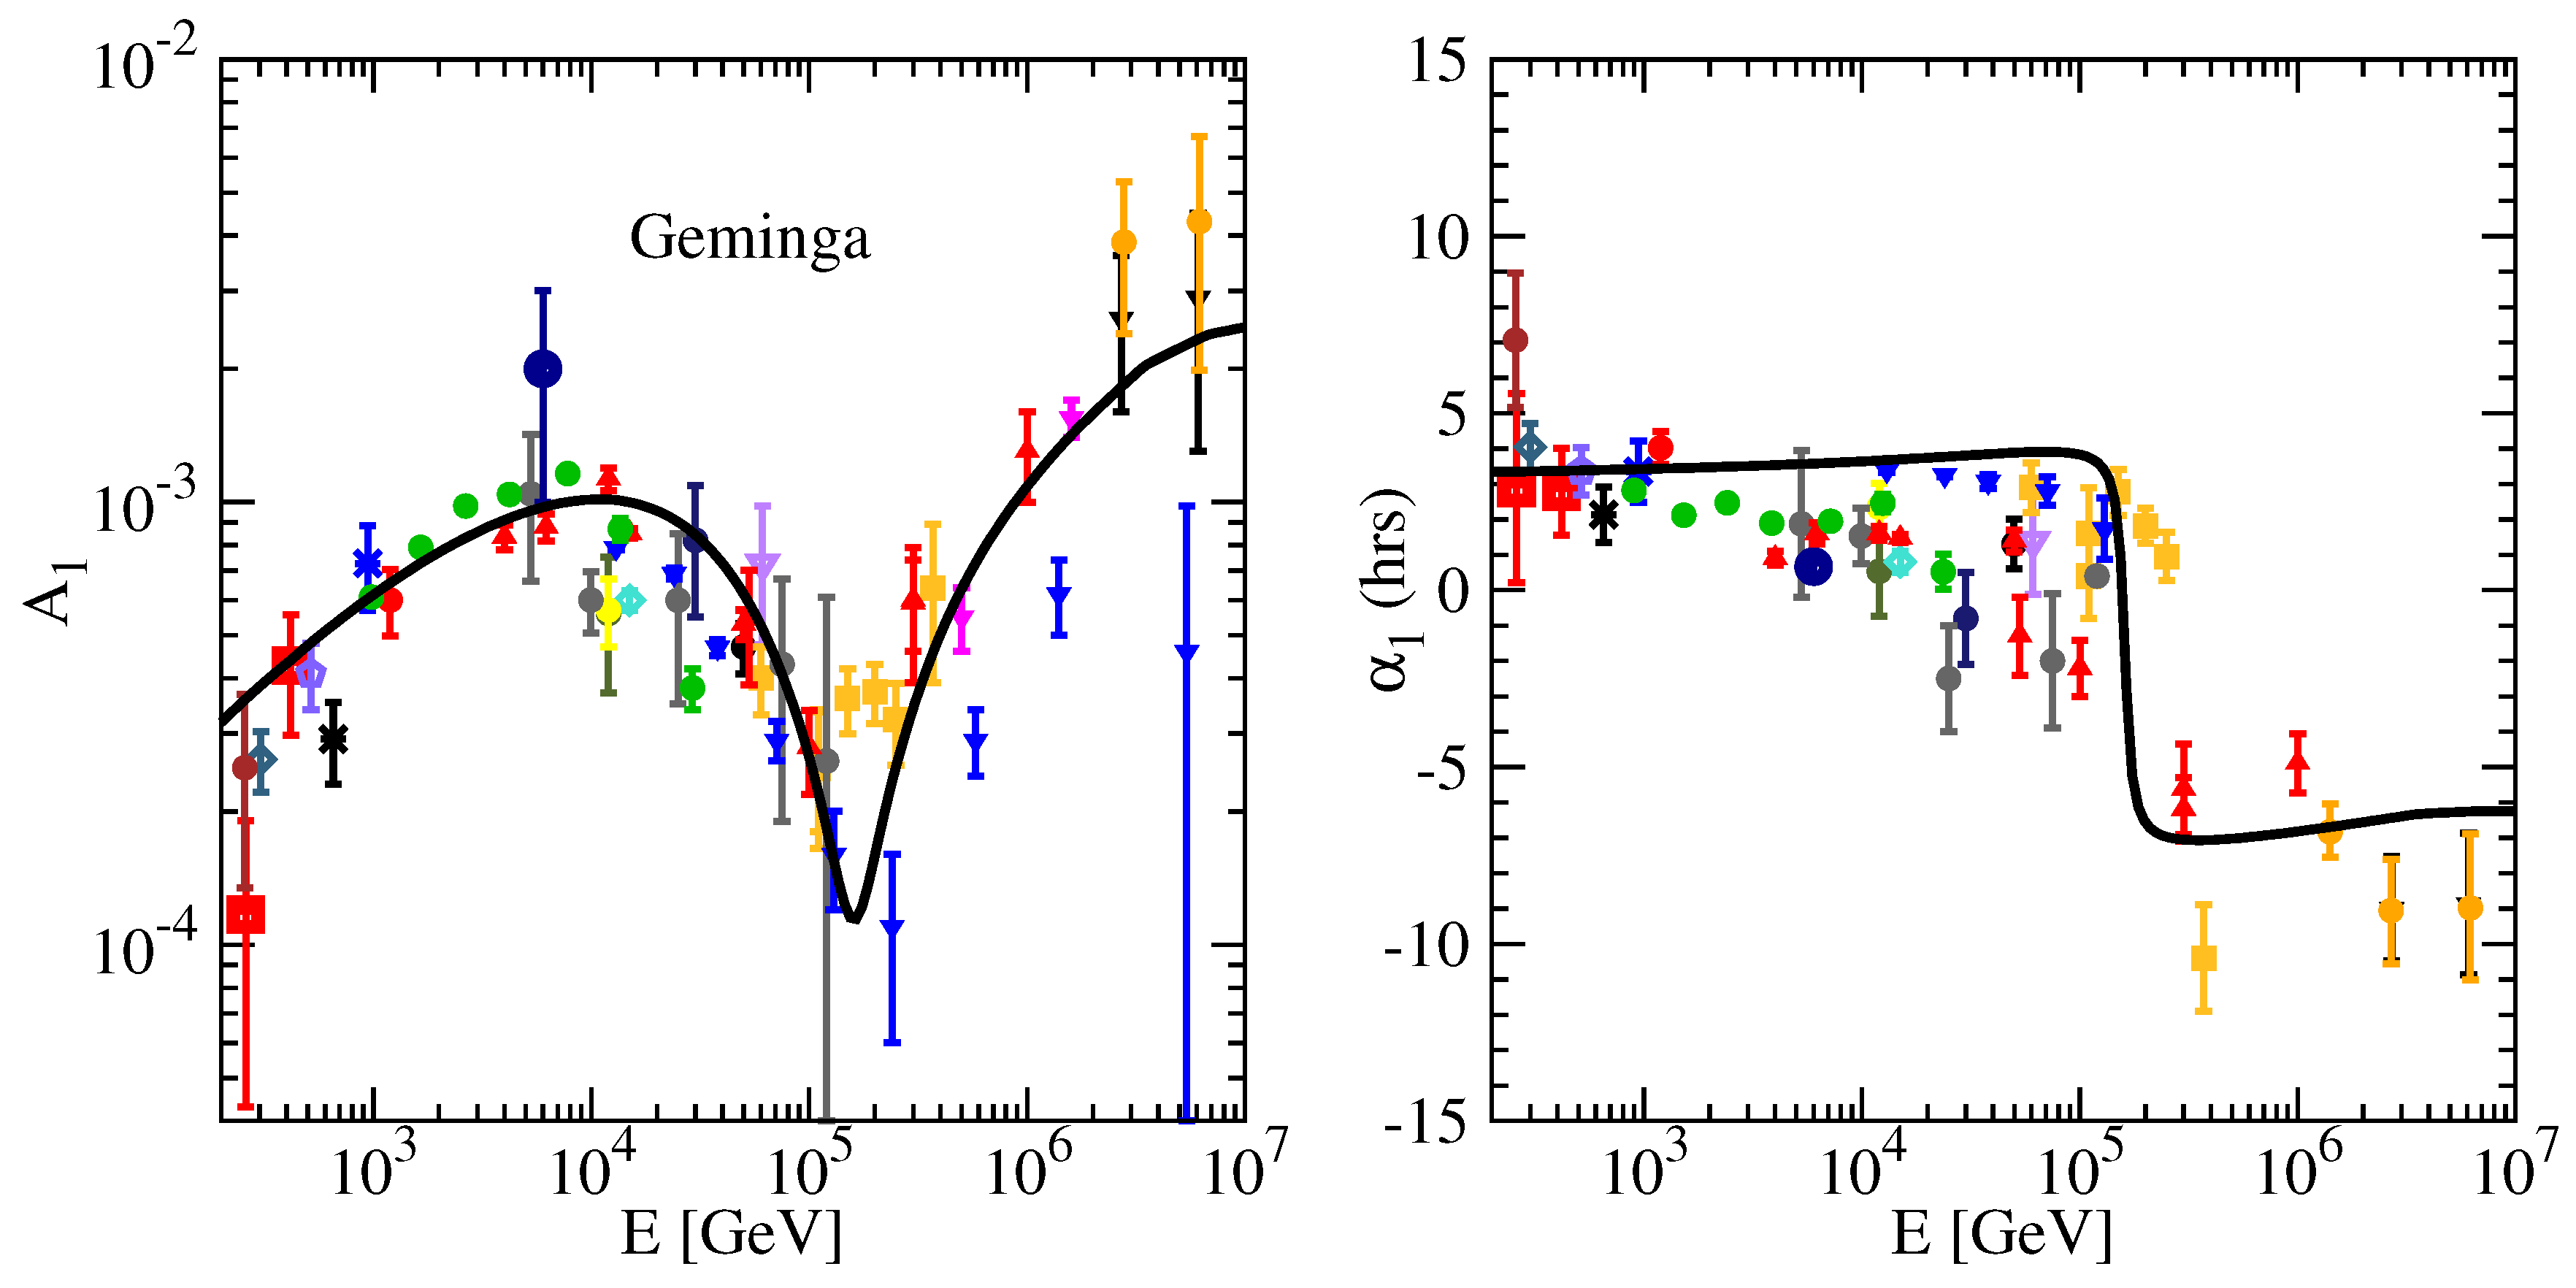
Figure 4 shows the amplitude and phase of the anisotropy with Monogem SNR source. It can be seen from Figure 4 that the amplitude is consistent with the experimental data, while the phase clearly contradicts the observations. The anisotropic phase of Monogem is similar to that of Geminga except at about 100 TeV. At about 100 TeV, the anisotropy contribution of the background sources and the nearby source is close, so the phase points to the direction of their vector synthesis. The direction of Monogem and background source synthes is contrary to the experimental observation, because Monogem is located above the galactic disk.
Figure 4.
The amplitude (left) and phase (right) of the dipole anisotropy with the contribution from nearby Monogem SNR source.
Figure 4.
The amplitude (left) and phase (right) of the dipole anisotropy with the contribution from nearby Monogem SNR source.
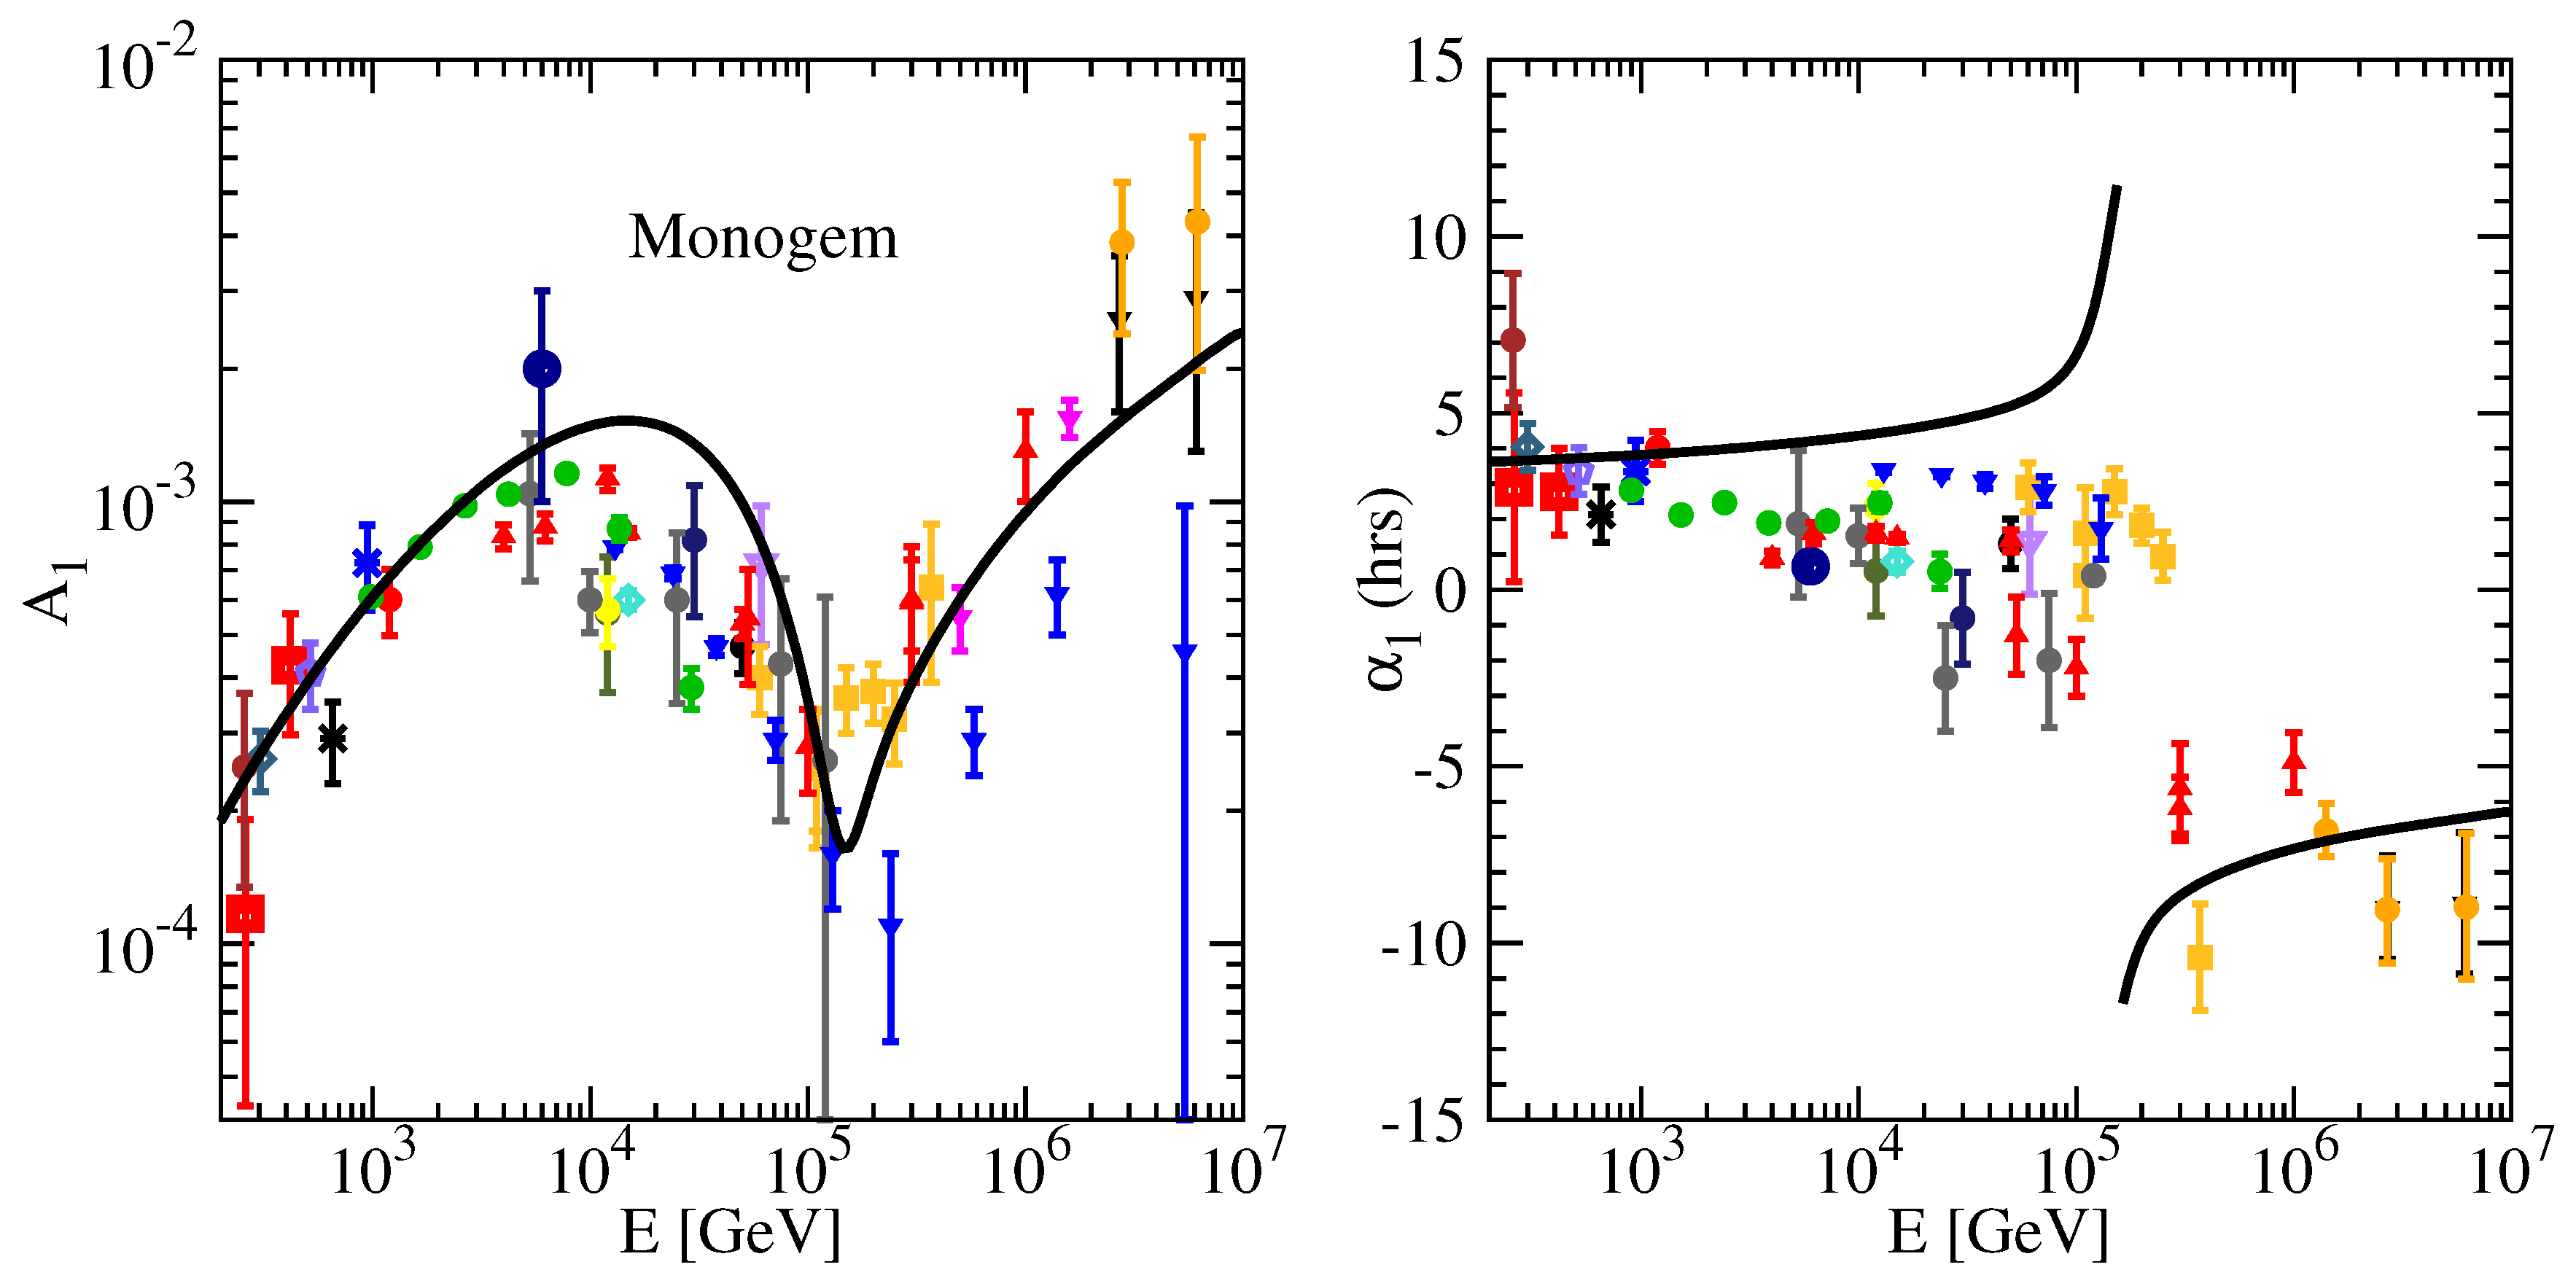
Figure 5 shows the anisotropy with Loop I SNR source. It is clear that neither amplitude nor phase agree with the measurements of experiment. Loop I source located in the direction of the GC are in the same direction as the background sources located mainly in the inner Galaxy, so their amplitude of synthesis increases as the energy increases, meanwhile the phase always points toward the GC.
Figure 5.
The amplitude (left) and phase (right) of anisotropy with the contribution from nearby Loop I SNR source.
Figure 5.
The amplitude (left) and phase (right) of anisotropy with the contribution from nearby Loop I SNR source.
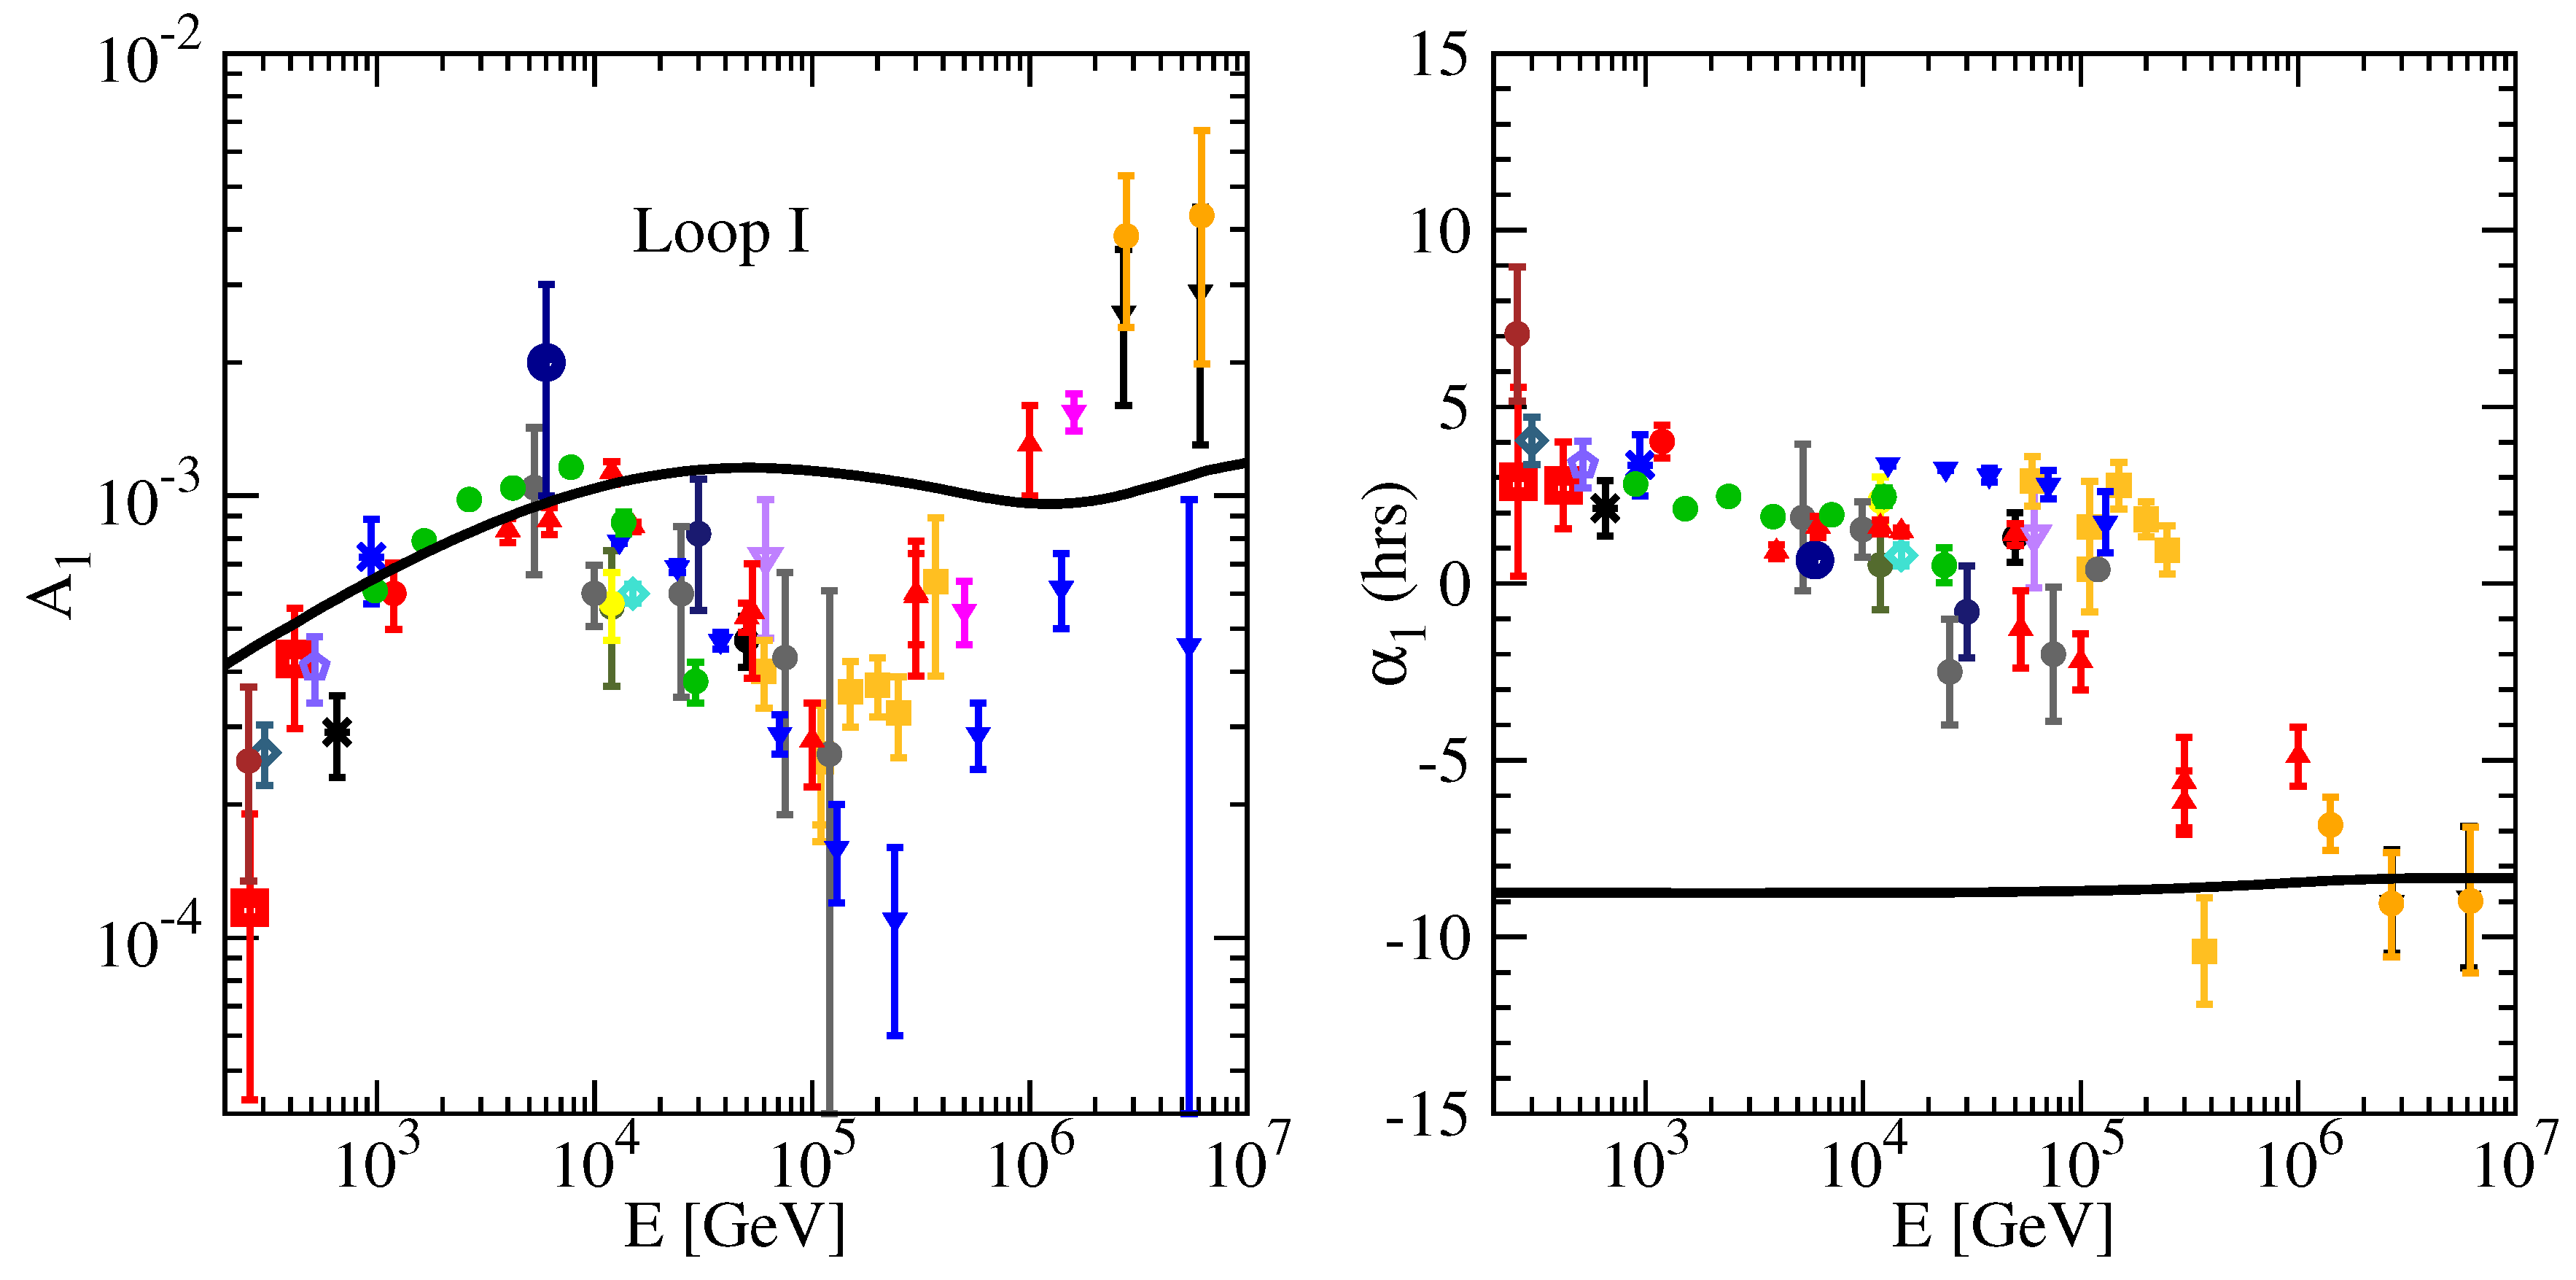
By studying the anisotropy of three sources namely Geminga, Monogem and Loop I, we found that the location of the nearby source and LIMF dominate the phase of anisotropy below 100 TeV. For below 100 TeV, the anisotropic phase of Geminga and Monogem located in the anti-GC direction and close to the galactic disk is consistent with the experimental observations, while that of Loop I located in the GC direction is not. At about 100 TeV, the anisotropy of the Geminga source located below the galactic disk closer to the LIMF direction agrees with the experimental observations because the contributions of the nearby source and background sources are close, while that of the Monogem source located above the galactic disk does not. For above 100 TeV, the background source dominates, so the phase points towards GC.
3. Summary
In view of the anomalous results of recent experiments on CR spectra and anisotropy, we analyze the contributions of different five nearby sources including Geminga, Monogem, Loop I, Vela and Cygnus to CR nuclear spectra and anisotropy, based on the anisotropic diffusion of CRs induced by the LIMF nearby the solar system and SDP model. CR spectra results indicate that only older nearby sources such as Geminga, Monogem and Loop I can explain the nuclear spectral hardening at GeV, while younger ones such as Vela and Cygnus can not. CR anisotropy results reveal that the location of the nearby source and LIMF dominate together the phase of anisotropy below 100 TeV. Nearby Geminga source, which is located at the anti-GC, below the galactic disk and near the LIMF direction, can simultaneously explain the proton and helium spectral hardening at GeV, softening at ∼ 10 TeV and the anisotropy from 100 GeV to PeV energy region well, while other sources can not. The future high-precision measurements of CR spectra and anisotropy by experiments such as LHAASO and HAWC will help to check our model.
Author Contributions
Conceptualization, A.L. and W.L.; methodology, A.L.; software, F.Z.; validation, A.L., F.Z. and Z.L.; formal analysis, D.L.; investigation, A.L.; resources, A.L.; data curation, X.C.; writing—original draft preparation, A.L.; writing—review and editing, A.L., W.L., D.L. and F.Z.; visualization, A.L. and X.C.; supervision, A.L. and W.l.; project administration, W.L.; funding acquisition, A.L. All authors have read and agreed to the published version of the manuscript.
Funding
This work is supported by the National Natural Science Foundation of China ( U2031110, 11963004) and Shandong Province Natural Science Foundation ( ZR2020MA095).
References
- M. Ackermann, M. Ajello, A. Allafort, et al. Detection of the Characteristic Pion-Decay Signature in Supernova Remnants. Science 2013, 339, 807–811. [CrossRef] [PubMed]
- Pasquale Blasi. The origin of galactic cosmic rays. A&A Rev. 2013, 21, 70. [CrossRef]
- S. Ogio, F. Kakimoto, Y. Kurashina, et al. The Energy Spectrum and the Chemical Composition of Primary Cosmic Rays with Energies from 1014 to 1016 eV. ApJ. 2004, 612, 268–275. [CrossRef]
- W. D. Apel, J. C. Arteaga, A. F. Badea, et al. Energy spectra of elemental groups of cosmic rays: Update on the KASCADE unfolding analysis. Astroparticle Physics. 2009, 31, 86–91. [CrossRef]
- W.D. Apel, J.C. Arteaga-Velázquez, K. Bekk,et al. Ankle-like Feature in the Energy Spectrum of Light Elements of Cosmic Rays Observed with KASCADE-Grande. PRD. 2013, 87, 081101. [CrossRef]
- Kenneth Greisen. End to the Cosmic-Ray Spectrum? Phys. Rev. Lett. 1966, 16, 748–750. [CrossRef]
- A. D. Panov, Jr. Adams, J. H., H. S. Ahn, et al. Elemental energy spectra of cosmic rays from the data of the ATIC-2 experiment. Bulletin of the Russian Academy of Sciences, Physics. 2007, 71, 494–497. [CrossRef]
- H. S. Ahn, P. Allison, M. G. Bagliesi, et al. Discrepant Hardening Observed in Cosmic-ray Elemental Spectra. ApJ. 2010, 714, L89–L93. [CrossRef]
- Y. S. Yoon, H. S. Ahn, P. S. Allison, et al. Cosmic-ray Proton and Helium Spectra from the First CREAM Flight. ApJ. 2011, 728, 122. [CrossRef]
- O. Adriani, G. C. Barbarino, G. A. Bazilevskaya, et al. PAMELA Measurements of Cosmic-Ray Proton and Helium Spectra. Science. 2011, 332, 69. [CrossRef]
- M. Aguilar, D. Aisa, B. Alpat, et al. Precision Measurement of the Proton Flux in Primary Cosmic Rays from Rigidity 1 GV to 1.8 TV with the Alpha Magnetic Spectrometer on theInternational Space Station. Phys. Rev. Lett. 2015, 114, 171103. [CrossRef] [PubMed]
- M. Aguilar, D. Aisa, B. Alpat, et al. Precision Measurement of the Helium Flux in Primary Cosmic Rays of Rigidities 1.9 GV to 3 TV with the Alpha Magnetic Spectrometer on the International Space Station. Phys. Rev. Lett. 2015, 115, 211101. [CrossRef] [PubMed]
- O. Adriani, Y. Akaike, K. Asano, et al. Direct Measurement of the Cosmic-Ray Proton Spectrum from 50 GeV to 10 TeV with the Calorimetric Electron Telescope on the International Space Station. Phys. Rev. Lett. 2019, 112, 181102. [CrossRef]
- DAMPE Collaboration; An, Q.; Asfandiyarov, R.; Azzarello, P.; Bernardini, P.; Bi, X.J.; Cai, M.S.; Chang, J.; Chen, D.Y.; Chen, H.F.; et al. Measurement of the cosmic ray proton spectrum from 40 GeV to 100 TeV with the DAMPE satellite. Sci.2019 5, eaax 3793. [CrossRef]
- Yoon, Y.S.; Anderson, T.; Barrau, A.; Conklin, N.B.; Coutu, S.; Derome, L.; Han, J.H.; Jeon, J.A.; Kim, K.C.; Kim, M.H.; et al. Proton and Helium Spectra from the CREAM-III Flight. Astrophys. J. 2017, 839, 5. [CrossRef]
- Atkin, E.; Bulatov, V.; Dorokhov, V.; Gorbunov, N.; Filippov, S.; Grebenyuk, V.; Karmanov, D.; Kovalev, I.; Kudryashov, I.; Kurganov, A.; et al. New Universal Cosmic-Ray Knee near a Magnetic Rigidity of 10 TV with the NUCLEON Space Observatory. J. Exp. Theor. Phys. Lett. 2018, 108, 5-12. [CrossRef]
- Satyendra Thoudam and Jörg R. Hörandel. Nearby supernova remnants and the cosmic ray spectral hardening at high energies. MNRAS. 2012, 421, 1209–1214. [CrossRef]
- Wei Liu, Yi-Qing Guo, and Qiang Yuan. Indication of nearby source signatures of cosmic rays from energy spectra and anisotropies. jcap. 2019, 2019, 010. [CrossRef]
- Peter L. Biermann, Julia K. Becker, Jens Dreyer, et al. The Origin of Cosmic Rays: Explosions of Massive Stars with Magnetic Winds and Their Supernova Mechanism. ApJ. 2010, 725,184–187. [CrossRef]
- S. Thoudam, J. P. Rachen, A. van Vliet, et al. Cosmic-ray energy spectrum and composition up to the ankle: the case for a second Galactic component. A&A. 2016, 595, A33. [CrossRef]
- N. Tomassetti. Origin of the Cosmic-Ray Spectral Hardening. ApJ, 2012, 752, L13. [CrossRef]
- Qiang Yuan, Bing Zhang, and Xiao-Jun Bi. Cosmic ray spectral hardening due to dispersion in the source injection spectra. Phys. Rev. D. 2011, 84, 043002. [CrossRef]
- V. I. Zatsepin and N. V. Sokolskaya. Three component model of cosmic ray spectra from 10 GeV to 100 PeV. A&A. 2006, 458, 1–5. [CrossRef]
- M. Amenomori, S. Ayabe, X. J. Bi, et al. Anisotropy and Corotation of Galactic Cosmic Rays. Science. 2006, 314, 439–443. [CrossRef] [PubMed]
- M. Amenomori et al. On Temporal Variations of the Multi-TeV Cosmic Ray Anisotropy using the Tibet III Air Shower Array. Astrophys. J. 2010, 711, 119–124. [CrossRef]
- M. Amenomori. Northern sky Galactic Cosmic Ray anisotropy between 10-1000 TeV with the Tibet Air Shower Array. Astrophys. J. 2017, 836, 153. [CrossRef]
- G. Guillian, J. Hosaka, K. Ishihara, et al. Observation of the anisotropy of 10TeV primary cosmic ray nuclei flux with the Super-Kamiokande-I detector. Phys. Rev. D. 2007, 75, 062003. [CrossRef]
- A. A. Abdo, B. Allen, T. Aune, et al. Discovery of Localized Regions of Excess 10-TeV Cosmic Rays. Physical Review Letters. 2008, 101, 221101. [CrossRef]
- A. A. Abdo, B. T. Allen, T. Aune, et al. The Large-Scale Cosmic-Ray Anisotropy as Observed with Milagro. apj. 2009, 698, 2121–2130. [CrossRef]
- R. Abbasi, Y. Abdou, T. Abu-Zayyad, et al. Measurement of the Anisotropy of Cosmic-ray Arrival Directions with IceCube. apj. 2010, 718, L194–L198. [CrossRef]
- R. Abbasi, Y. Abdou, T. Abu-Zayyad, et al. Observation of Anisotropy in the Arrival Directions of Galactic Cosmic Rays at Multiple Angular Scales with IceCube. apj. 2011, 740, 16. [CrossRef]
- R. Abbasi, Y. Abdou, T. Abu-Zayyad, et al. Observation of Anisotropy in the Galactic Cosmic-Ray Arrival Directions at 400 TeV with IceCube. apj. 2011, 746, 33. [CrossRef]
- M. G. Aartsen, R. Abbasi, Y. Abdou, et al. Observation of Cosmic-Ray Anisotropy with the IceTop Air Shower Array. apj. 2013, 765, 55. [CrossRef]
- M. G. Aartsen, K. Abraham, M. Ackermann, et al. Anisotropy in Cosmic-Ray Arrival Directions in the Southern Hemisphere Based on Six Years of Data from the IceCube Detector. apj. 2016, 826, 220. [CrossRef]
- B. Bartoli, P. Bernardini, X. J. Bi, et al. Medium scale anisotropy in the TeV cosmic ray flux observed by ARGO-YBJ. prd. 2013, 88, 082001. [CrossRef]
- B. Bartoli, P. Bernardini, X. J. Bi, et al. ARGO-YBJ Observation of the Large-scale Cosmic Ray Anisotropy During the Solar Minimum between Cycles 23 and 24. apj. 2015, 809, 90. [CrossRef]
- A. U. Abeysekara, R. Alfaro, C. Alvarez, et al. Observation of Small-scale Anisotropy in the Arrival Direction Distribution of TeV Cosmic Rays with HAWC. apj. 2014, 796, 108. [CrossRef]
- M. Aglietta, V. V. Alekseenko, B. Alessandro, et al. Evolution of the Cosmic-Ray Anisotropy Above 1014 eV. ApJ. 2009, 692, L130–L133. [CrossRef]
- A. Chiavassa, W. D. Apel, J. C. Arteaga-Velázquez, et al. A study of the first harmonic of the large scale anisotropies with the KASCADE-Grande experiment. In 34th International Cosmic Ray Conference. 2015, 34, 281.
- W. D. Apel, J. C. Arteaga-Velázquez, K. Bekk, et al. Search for Large-scale Anisotropy in the Arrival Direction of Cosmic Rays with KASCADE-Grande. ApJ. 2019, 870,91. [CrossRef]
- A. U. Abeysekara, R. Alfaro, C. Alvarez, et al. Observation of Anisotropy of TeV Cosmic Rays with Two Years of HAWC. ApJ. 2018, 865, 57. [CrossRef]
- Aifeng Li, Shiyu Yin, Maoyuan Liu, et al. Interpretation of the Spectra and Anisotropy of Galactic Cosmic Rays. Universe. 2022, 8, 307. [CrossRef]
- A. U. Abeysekara, R. Alfaro, C. Alvarez, et al. All-sky Measurement of the Anisotropy of Cosmic Rays at 10 TeV and Mapping of the Local Interstellar Magnetic Field. ApJ. 2019, 871, 96. [CrossRef]
- M. Ahlers. Deciphering the Dipole Anisotropy of Galactic Cosmic Rays. Physical Review Letters. 2016, 117, 151103. [CrossRef] [PubMed]
- Arthur H. Compton and Ivan A. Getting. An Apparent Effect of Galactic Rotation on the Intensity of Cosmic Rays. Physical Review. 1935, 47,817–821. [CrossRef]
- M. Amenomori, X. J. Bi, D. Chen, et al. On Temporal Variations of the Multi-TeV Cosmic Ray Anisotropy Using the Tibet III Air Shower Array. ApJ. 2010, 711, 119–124. [CrossRef]
- Qing Luo, Bing-qiang Qiao, Wei Liu, Shu-wang Cui, and Yi-qing Guo. Statistical Study of the Optimal Local Sources for Cosmic Ray Nuclei and Electrons. ApJ. 2022, 930, 82. [CrossRef]
- Bing Zhao, Wei Liu, Qiang Yuan, et al. Geminga SNR: Possible Candidate of the Local Cosmic-Ray Factory. ApJ. 2022, 926, 41. [CrossRef]
- Tian-Peng Tang, Zi-Qing Xia, Zhao-Qiang Shen, et al. Explanation of nearby SNRs for primary electron excess and proton spectral bump. Physics Letters B. 2022, 825, 13684. [CrossRef]
- Verne V. Smith, Katia Cunha, and Bertrand Plez. Is Geminga a runaway member of the Orion association? A&A. 1994, 281, L41–L44.
- Walter F. Brisken, S. E. Thorsett, A. Golden, and W. M. Goss. The Distance and Radius of the Neutron Star PSR B0656+14. ApJ. 2003, 593, L89–L92. [CrossRef]
- E. M. Berkhuijsen, C. G. T. Haslam, and C. J. Salter. Are the galactic loops supernova remnants? A&A. 1971, 14, 252.
- Kartick C. Sarkar. Possible connection between the asymmetry of the North Polar Spur and Loop I and Fermi bubbles. MNRAS. 2019, 482, 4813–4823. [CrossRef]
- D. A. Green. A catalogue of 294 Galactic supernova remnants. Bulletin of the Astronomical Society of India. 2014, 42, 47–58.
- Andrew W. Strong, Igor V. Moskalenko, and Vladimir S. Ptuskin. Cosmic-Ray Propagation and Interactions in the Galaxy. Annual Review of Nuclear and Particle Science. 2007, 27, 285–327. [CrossRef]
- Y.-Q. Guo, Z. Tian, and C. Jin. Spatial-dependent Propagation of Cosmic Rays Results in the Spectrum of Proton, Ratios of P/P, and B/C, and Anisotropy of Nuclei. ApJ. 2016, 819, 54. [CrossRef]
- Chao Jin, Yi-Qing Guo, and Hong-Bo Hu. Spatial dependent diffusion of cosmic rays and the excess of primary electrons derived from high precision measurements by AMS-02. Chinese Physics C. 2016, 40, 015101. [CrossRef]
- Yi-Qing Guo and Qiang Yuan. Understanding the spectral hardenings and radial distribution of Galactic cosmic rays and Fermi diffuse γ rays with spatially-dependent propagation. Phys. Rev. D. 2018, 97, 063008. [CrossRef]
- Wei Liu, Yu-hua Yao, and Yi-Qing Guo. Revisiting the Spatially Dependent Propagation Model with the Latest Observations of Cosmic-Ray Nuclei. ApJ. 2018, 869, 176. [CrossRef]
- Carmelo Evoli, Daniele Gaggero, Dario Grasso, and Luca Maccione. Cosmic Ray propagation in the Galaxy and diffuse gamma-ray emission. American Institute of Physics Conference Series. 2008, 1085, 380-383. [CrossRef]
- G. Case and D. Bhattacharya. Revisiting the galactic supernova remnant distribution. A&AS. 1996, 120, 437–440.
- P. Blasi and E. Amato. Diffusive propagation of cosmic rays from supernova remnants in the Galaxy. II: anisotropy. jcap. 2012, 1, 11. [CrossRef]
- L. G. Sveshnikova, O. N. Strelnikova, and V. S. Ptuskin. Spectrum and anisotropy of cosmic rays at TeV-PeV-energies and contribution of nearby sources. Astroparticle Physics. 2013, 50, 33–46. [CrossRef]
- Wei Liu, Su-jie Lin, Hong-bo Hu, Yi-qing Guo, and Ai-feng Li. Two Numerical Methods for the 3D Anisotropic Propagation of Galactic Cosmic Rays. ApJ. 2020, 892, 6. [CrossRef]
- H. O. Funsten, R. DeMajistre, P. C. Frisch, et al. Circularity of the Interstellar Boundary Explorer Ribbon of Enhanced Energetic Neutral Atom (ENA) Flux. ApJ. 2013, 776, 30. [CrossRef]
- N. A. Schwadron, F. C. Adams, E. R. Christian, et al. Global Anisotropies in TeV Cosmic Rays Related to the Sun rsquos Local Galactic Environment from IBEX. Science. 2014, 343, 988–990. [CrossRef] [PubMed]
- J. Giacalone and J. R. Jokipii. The Transport of Cosmic Rays across a Turbulent Magnetic Field. ApJ. 1999, 520, 204–214. [CrossRef]
- S. S. Cerri, D. Gaggero, A. Vittino, C. Evoli, and D. Grasso. A signature of anisotropic cosmic-ray transport in the gamma-ray sky. jcap. 2017, 10, 019. [CrossRef]
- M. Aguilar, L. Ali Cavasonza, G. Ambrosi, et al. Precision Measurement of the Boron to Carbon Flux Ratio in Cosmic Rays from 1.9 GV to 2.6 TV with the Alpha Magnetic Spectrometer on the International Space Station. Phys. Rev. Lett. 2016, 117, 231102. [CrossRef] [PubMed]
- Q. An, R. Asfandiyarov, P. Azzarello, et al. Measurement of the cosmic ray proton spectrum from 40 GeV to 100 TeV with the DAMPE satellite. Science Advances. 2019, 5, eaax3793. [CrossRef]
- F. Alemanno, Q. An, P. Azzarello, et al. Measurement of the Cosmic Ray Helium Energy Spectrum from 70 GeV to 80 TeV with the DAMPE Space Mission. Phys. Rev. Lett. 2021, 126, 201102. [CrossRef]
- M. Aguilar, L. Ali Cavasonza, B. Alpat, et al. Observation of the Identical Rigidity Dependence of He, C, and O Cosmic Rays at High Rigidities by the Alpha Magnetic Spectrometer on the International Space Station. Phys. Rev. Lett. 2017, 119, 251101. [CrossRef]
- Y. S. Yoon, T. Anderson, A. Barrau, et al. Proton and Helium Spectra from the CREAM-III Flight. ApJ. 2017, 839, 5. [CrossRef]
- E. Atkin, V. Bulatov, V. Dorokhov, et al. First results of the cosmic ray NUCLEON experiment. jcap. 2017, 2017, 020. [CrossRef]
- T. Antoni, W. D. Apel, A. F. Badea, et al. KASCADE measurements of energy spectra for elemental groups of cosmic rays: Results and open problems. Astroparticle Physics. 2005, 24, 1–25. [CrossRef]
- W. D. Apel, J. C. Arteaga-Velázquez, K. Bekk, et al. KASCADE-Grande measurements of energy spectra for elemental groups of cosmic rays. Astroparticle Physics. 2013, 47, 54–66. [CrossRef]
- S. Sakakibara, H. Ueno, K. Fujimoto, I. Kondo, and K. Nagashima. Sidereal Time Variation of Small Air Showers Observed at Mt. Norikura. In International Cosmic Ray Conference. 1973, volume 2, 1058.
- M. Bercovitch and S. P. Agrawal. Cosmic ray anisotropies at median primary rigidities between 100 and 1000 GV. In International Cosmic Ray Conference. 1981, volume 10, 246–249.
- T. Thambyahpillai. The Sidereal Diurnal Variation Measured Underground in London. In International Cosmic Ray Conference. 1983, volume 3, 383.
- Swinson, D.B.; Nagashima, K. Corrected sidereal anisotropy for underground muons. Planet. Space Sci. 1985, 33, 1069–1072. [CrossRef]
- Yu. M. Andreyev, A. E. Chudakov, V. A. Kozyarivsky, et al. Cosmic Ray Sidereal Anisotropy Observed by Baksan Underground Muon Telescope. In International Cosmic Ray Conference. 1987, volume 2, 22.
- Y. W. Lee and L. K. Ng. Observation of Cosmic-Ray Intensity Variation Using AN Underground Telescope. In International Cosmic Ray Conference. 1987, volume 2, 18.
- H. Ueno, Z. Fujii, and T. Yamada. 11 Years Variations of Sidereal Anisotropy Observed at Sakashita Underground Station. International Cosmic Ray Conference. 1990, volume 6, 361.
- D. J. Cutler and D. E. Groom. Mayflower Mine 1500 GV Detector: Cosmic-Ray Anisotropy and Search for Cygnus X-3. ApJ. 1991, 376, 322. [CrossRef]
- K. Munakata, S. Yasue, S. Mori, et al. Two Hemisphere Observations of the North-South Sidereal Asymmetry at ∼ 1 TeV. International Cosmic Ray Conference. 1995, volume 4, 639. [CrossRef]
- S. Mori, S. Yasue, K. Munakata, et al. Observation of Sidereal Anisotropy of Cosmic Rays at ∼1 TV. International Cosmic Ray Conference. 1995, volume 4, 648.
- K. B. Fenton, A. G. Fenton, and J. E. Humble. Sidereal Variations at High Energies - Observations at Poatina. International Cosmic Ray Conference. 1995, volume 4, 635.
- K. Munakata, T. Kiuchi, S. Yasue, et al. Large-scale anisotropy of the cosmic-ray muon flux in Kamiokande. Phys. Rev. D. 1997, 56, 23–26. [CrossRef]
- M. Ambrosio, R. Antolini, A. Baldini, et al. Search for the sidereal and solar diurnal modulations in the total MACRO muon data set. Phys. Rev. D. 2003, 67, 042002. [CrossRef]
- T. Gombosi, J. Kóta, A. J. Somogyi, et al. Galactic cosmic ray anisotropy at ≈ 6 × 10¹³ eV. International Cosmic Ray Conference. 1975, volume 2, 586–591.
- V. V. Alexeyenko, A. E. Chudakov, E. N. Gulieva, and V. G. Sborschikov. Anisotropy of Small EAS (about 1013 eV). International Cosmic Ray Conference. 1981, volume 2, 146.
- K. Nagashima, K. Fujimoto, S. Sakakibara, et al. Galactic cosmic-ray anisotropy and its modulation in the heliomagnetosphere, inferred from air shower observation at Mt. Norikura. Nuovo Cimento C Geophysics Space Physics C. 1989, 12, 695–749. [CrossRef]
- M. Aglietta, B. Alessandro, P. Antonioli, et al. Study of the Cosmic Ray Anisotropy at Eo ∼ 100 TeV from EAS-TOP: 1992-1994. International Cosmic Ray Conference. 1995, volume 2, 800.
- M. Aglietta, B. Alessandro, P. Antonioli, et al. A Measurement of the Solar and Sidereal Cosmic-Ray Anisotropy at E 0 approximately 10 14 eV. ApJ. 1996, 470, 501. [CrossRef]
- V. V. Alekseenko, A. B. Cherniaev, D. D. Djappuev, et al. 10-100 TeV cosmic ray anisotropy measured at the Baksan EAS “Carpet” array. Nuclear Physics B Proceedings Supplements. 2009, 196, 179–182. [CrossRef]
- M. Amenomori, S. Ayabe, S. W. Cui, et al. Large-Scale Sidereal Anisotropy of Galactic Cosmic-Ray Intensity Observed by the Tibet Air Shower Array. ApJ. 2005, 626, L29–L32. [CrossRef]
- M. Amenomori, X. J. Bi, D. Chen, et al. Northern Sky Galactic Cosmic Ray Anisotropy between 10 and 1000 TeV with the Tibet Air Shower Array. ApJ. 2017, 836, 153. [CrossRef]
Table 2.
Injection parameters of the background and nearby sources.
| Background | Geminga source | Monogem source | |||||||
|---|---|---|---|---|---|---|---|---|---|
| Element | Normalization † | ||||||||
| PV | TV | TV | |||||||
| p | 2.34 | 7 | 2.16 | 25 | 2.20 | 22 | |||
| He | 2.27 | 7 | 2.08 | 25 | 2.18 | 22 | |||
| C | 2.31 | 7 | 2.13 | 25 | 2.13 | 22 | |||
| N | 2.34 | 7 | 2.13 | 25 | 2.13 | 22 | |||
| O | 2.36 | 7 | 2.13 | 25 | 2.13 | 22 | |||
| Ne | 2.28 | 7 | 2.13 | 25 | 2.13 | 22 | |||
| Mg | 2.39 | 7 | 2.13 | 25 | 2.13 | 22 | |||
| Si | 2.37 | 7 | 2.13 | 25 | 2.13 | 22 | |||
| Fe | 2.29 | 7 | 2.13 | 25 | 2.13 | 22 | |||
† The normalization is set at total energy GeV.
Disclaimer/Publisher’s Note: The statements, opinions and data contained in all publications are solely those of the individual author(s) and contributor(s) and not of MDPI and/or the editor(s). MDPI and/or the editor(s) disclaim responsibility for any injury to people or property resulting from any ideas, methods, instructions or products referred to in the content. |
© 2023 by the authors. Licensee MDPI, Basel, Switzerland. This article is an open access article distributed under the terms and conditions of the Creative Commons Attribution (CC BY) license (http://creativecommons.org/licenses/by/4.0/).
Copyright: This open access article is published under a Creative Commons CC BY 4.0 license, which permit the free download, distribution, and reuse, provided that the author and preprint are cited in any reuse.


