
You are currently viewing a beta version of our website. If you spot anything unusual, kindly let us know.
Preprint
Review
A Review into the Energy Policies of the BRICS Countries: A Possible Just Energy Transition Policy Adoption for South Africa
Altmetrics
Downloads
240
Views
69
Comments
0
A peer-reviewed article of this preprint also exists.


This version is not peer-reviewed
Abstract
This review focuses on the Just Energy Transition (JET) policies of the BRICS member countries, with the aim of finding lessons and possible adoption of some of the key energy policy aspects utilized in other countries for benchmarking for the South African context. Considerations of the present stage of JET in South Africa and the energy-source mix supporting the electricity sector, cognisant of the lifespan and condition of power plants. Analysis of the energy mix revealed that all nations were energy dependent on electricity which was produced by predominantly fossil fuelled power plants with high GHG (concentrating on high CO2 emissions). It was concluded that some of the learnings and lessons learnt from the BRICS countries might be incorporated into a South African energy plan for the transition with options and guidance for formulation of policies. This study will attract responsible environmentally conscious audience that has a commitment and drive to combat global warming and curbing climate change.
Keywords:
Subject: Engineering - Energy and Fuel Technology
1. Introduction
At inception there were four BRIC member countries comprised of Brazil, Russia, India and China which was formed in 2006. In 2010 South Africa was offered to become a member of BRIC, which evolved into BRICS [1]. The new five member countries alliance was formed in the year 2006 as BRICS. South Africa joined in December 2010 to promote peace, security, economic development and cooperation amongst these countries [2]. The main objective is to contribute significantly to improve the socio-economic landscape of these five member countries which has over three billion people. This is approximately 40% of the global population and approximately 25% of the world’s Gross Domestic Product (GDP). The international growth, particularly true in developing countries are positively impacted by the sheer magnitude of the BRICS member countries geodemographic and summated economy [1]. BRICS also assists to curb and soften the adverse impacts during world’s financial challenges in a recession by advocating resilience in commerce [3].
BRICS alliance objectives, advancements and successes of the member countries energy plans, can be objectively measured by the Energy Transition Index (ETI) ratings (with a range from 0 to 100) and the Just Energy Transition (JET) rankings published by the World Economic Forum (WEF). The BRICS countries JET rankings and ETI ratings respectively are Brazil (30, 66), Russia (73, 56), India (87, 53), China (68, 57) and South Africa (110, 48) [4]. These ratings and rankings are a direct correlation to evaluate the robustness and flexibility the JET. For a resilient or robust transformation, the interregnum of JET must maintain the forward transitional momentum in order to achieve dependable, cost-effective and self-sustaining energy system in adversity such as the COVID-19 pandemic the world experienced.
2. India’s Energy Policy
2.1. India’s Macroeconomics
India’s economic growth in 2022, was 6.7% with an anticipated GDP of 5.6% in years 2023 to 2024. Currently India is ranked 59 from 152 countries in the global data country risk index [50]. As a positive spin off from the present regulation of the “Securities and Exchange Board of India” (SEBI), India’s equity market has become world class and attractive as a result of concerted efforts towards regulation and liberalization. The World Bank indicated that India’s country’s equity of the local organisations listed as a constituent of GDP improved from 80.8% of GDP in year 2019 to 97.3% of GDP in year 2020, exceeding China’s percentage of GDP of 83.2% which is exceptional for India [5].
2.2. India’s Energy Policy
The current energy mix of India is comprised of 46% coal, 25% petroleum (and other liquid fuels), 20% biomass and waste, 6% natural gas, 1% nuclear, 1% hydroelectric and 1% other sources of renewable energy as shown in Figure 1[6]. The social impact on the Indian population is a key focus and the energy plan enforces this as a pivotal point to transition harmoniously with respect to the quality of life of their population, especially the low-income rural communities which makes up approximately 700 million people that has been forced to use biomass as fuel to cook their meals [6]. The Indian government’s “Prime Minister, Narendra Modi,” announced India is committed to zero CO2 emissions by year 2070 at the COP 26 meeting held in Glasgow in year 2021 [7].
The country’s new “National Electricity Plan (NEP) of the Central Electricity Authority (CEA)” in draft was published for communal participation which has an appraisal of the detailed electricity capacity expansion plans for 2032 [8]. The predicted expansion of generating power plants by approximately 40%, from 623 GW to 866 GW by 2032. The bulk of the increase of 214 GW is planned to be from renewable energy sources with approximately 69% contribution from solar photovoltaics (PV). An additional of 10 GW, offshore wind power plant by 2032 is expected.
Therefore, the total renewable energy is expected to contribute 60% (approximately, 516MW) of the total electricity supply by 2032. The contribution of fossil fuel electricity production is forecasted to decline by 2032, from 46% to 28%. Gas power plants installed capability is projected to decrease to 3% by 2032. Hydropower contribution of 69GW is also expected to increase to 7% by 2032 as depicted in Figure 2. Nuclear power plant capacity of 22.5GW, contributing 2.5% of the electricity pool [9].
The unavailability of affordable electricity results in poor air quality negatively impacting the health of the communities and the environment. This was exacerbated by the “Covid-19 pandemic” and financially constrained electricity sector. The distribution utility companies resulted in Indian cities to have one of the poorest quality of air globally in the year 2021 [9]. The country with its population of one billion, is the world’s third largest electricity consumer which is fuelled by 71% fossil fuel (coal 46%, petroleum and other fossil fuels 25%) power plants [6]. However, in compliance to the energy policy, India has approved budget and committed to transition towards 50% of renewable energy by 2030 [10].
India has adopted a strategy of planned implementation whereby 38% of the total energy market is from renewable energy sources with emphasis on solar energy technologies [11]. The urgency spearheading the international reaction to climate related change is a fundamental priority which India has committed to. India is seen as a huge participant in the world’s energy ecosystem with energy consumption that increased two times the energy demand from year 2000. Commendable success of electrification connections to meet demands for approximately 900 million citizens was achieved in 2019 [6]. The global Covid-19 pandemic has delayed some progress to energy transition to an environmentally friendly fuel technology to reduce Greenhouse Gases (GHG). However, the pandemic resulted in slow economic growth of 35% in comparison with forecasted economic growth of 50% between year 2019 and 2030 which assist to reduce impact of the delay to transform to green fuels [12].
The sustainable development case supports how India could initiate additional increase on green energy investment to produce a faster peak resulting in a decline in GHG emissions in synergy with zero CO2 emissions targets [12]. This would be a positive impact for speedily attaining “Sustainable Development Goals” (SDG). It is important to reiterate that the economic growth of the country was led predominantly by the nonmanufacturing precinct instead of the electricity dependant industrial and commercial sector. This slowed down the rate of industrialisation and urbanisation, but this is about to change as a population 270 billion people are destined to be urbanised in the next 20 years giving rise to an exponential growth of the infrastructure to support this parabolic increase [12]. The expansion would also be supportive of the ILO, 2015 policy as huge infrastructure projects will increase the country’s labour requirements, thereby increasing the employment rate.
Over the past two decades, the power generation mix for India’s sustainable development plan of cost efficient and more affordable renewable energy of 450 GW by 2030 is on target [6]. In order to meet the planned targets of moving forward with new power plants (fossil fuel or renewables); design considerations of robustness, reliability, dependability, flexibility and cost effectiveness will be factored in [13]. Currently India’s electricity grid and its fossil fuel power plants meets the majority of India’s needs, supplemented by hydroelectric and gas power plants to meet the grid stability more especially during power swing conditions. This ensures the quality of power supply of voltage, frequency and reactive power control to sustain and protect the power system from failure. Battery energy storage systems is ideal to render interim leeway or resilience that India requires meet the country’s solar driven midday electricity maximum production. India’s earlier evening maximum load requirements of which, planned capacity of 140 GW from Battery Energy Storage System (BESS) [6].
In conclusion India’s commitment to their JET plans are further reinforced by G7 countries, including Norway, Denmark and the European Union (EU) “Just Energy Transition Partnership” (JETP) will financially empower India to reduce climate changing emissions from power production. India reiterated the country’s commitment to assist to eradicate global warming by achieving the following just energy transition objectives/goals [6].
- “Target 500 GW of non-fossil electricity capacity by 2030”
- “Renewable energy contribution of 50% of its electricity demands by 2030”.
- “Forecasted decrease of CO2 emissions by one billion tonnes from present to 2030”.
- “Decline by 45% of the CO2 intensity of the economy by 2030, referenced with 2005 emissions”.
- “The zero carbonisation goals by 2070”
3. China
3.1. China’s Macroeconomics
The real GDP growth was 4.5% in year 2022 and it is predicted to be 4.8% in year 2023, while consumption (use of goods and services) was 6.5% in year 2022 (Macroeconomic Outlook Report: China, 2023). The “World Bank’s conducting business ranking” of China in year 2022 is 31 of 190 countries. China’s electrical and electronic trade magnitude is forecasted to grow at a “Compound Annual Growth Rate” (CAGR) of 11.6% from year 2021 and 2025, to a targeted monetary amount of $3.3 trillion in year 2025 [14].
3.2. China’s Energy Policy
The current energy mix of China comprises of 52% coal, 3% solar, 2% biomass, 10% natural gas, 3% nuclear, 8% hydro, 4% wind and 18% oil as shown in Figure 3. China’s planned transition by 2060 would result in 3% coal, 23% solar, 5% biomass, 3% natural gas, 19% nuclear, 15% hydro, 24% wind and 8% oil by 2060 as depicted in Figure 4. With the Accelerated Transition Scenario (ATS) and the Announced Pledges Scenario (APS) China has been adding nuclear (70 GW) (20 new reactors) and solar (110 GW) capacity to cater for the requirements of 33 million homes [15].
China is a major player in the world energy markets since it is the world’s biggest energy consumer since 2009 [16]. The country is ranked first on the world’s carbon emissions ranking and is one of the world’s leading energy user and CO2 producer which makes up 33% of the worlds’ CO2 discharge [15]. The power producing plants is the origin of approximately 90% of the country’s GHG, highlighting that energy plans are imperative for carbon neutrality [16].
China believes in collaborative engagements with the IEA and other countries in the common vision of eliminating carbon emissions. The spin off from achieving nett zero carbonisation is envisaged to foster China’s sustainable economic and environmental development goals yet cultivating prosperity in improving technology leadership resulting in sustainable economic growth led by innovation [16]. One of the extremely noteworthy achievements and contributions globally, is that China produces 70% of electric vehicle battery demand. The rapid rate of solar plant deployment has hedged or counterbalanced in terms of reducing their environmental impact of being the second largest consumer of oil globally. It must also be noted that China is the biggest supplier of steel and cement which makes up more than 50% of the global demands. The impact is that the carbon emissions generated by these plants are astronomical and are deemed to be more than the European Union’s carbon emissions [16].
The major contributors of the country’s CO2 emissions are the electricity utility area whereby 48% of CO2 production are from energy and industrial activities, 36% is from the industry (steel and cement), 8% is from the transport and 5% is from the infrastructure (buildings). China has a five-year plan termed “Modern Energy System” which was formulated to reduce the energy intensity by 13.5% (from 65% to 51.5%) that will result in the reduction of CO2 intensity by approximately 18% and a reduction in integrated energy systems with the focus to grow the renewable energy market percentage of the whole energy consumption to 20% by 2025 [17]. It is imperative for China to achieve these short-term policy targets, as it will show the IEA and global authorities that the country’s CO2 emissions from coal was on target in year 2020 of achieving 15.9% non-fossil fuels of and a modest decline will be reached by the year 2030. China's pledge in 2021, at the “United Nations General Assembly” (UNGA) reiterates the country’s determination to end the construction of coal-fired power stations in solidarity for greener economy in the energy sector. In the association with the economic growth forecast, it is predicted that the energy demand will not increase at the same rate as the economy due to efficiency gains of the energy transition to cleaner fuel sources resulting in improved air quality [16]. The future energy mix of China will be dominated by solar and hydrogen of at least 60% of the total energy requirements by the year 2045. The emphasise will be to reduce the dependency on fossil fuels especially coal by 80%, oil by 60% and natural gas by more than 45% by 2060 [16]. China is in favourable financial position to fund the transformation to clean energy and infrastructure with a committed budget of $640 billion to the year 2030 and $900 billion from the year 2031 to the year 2060 [15]. In comparison, the annual energy investment’s share of the country’s “Gross Domestic Product” (GDP) was at an average of 2.5% in the year 2016 to 2020 which will substantially decline to approximately 1.1% by the year 2060 [17].
In addition, another target is to decrease the CO2 emissions in the building sector by at least 95% of the current emissions by the year 2060 through electrification, solar powered climate control (air conditioning, and innovative energy reduction concepts in building designs) to make buildings less energy intensive [15]. Synchronising the level of the emissions’ maximum, also the rate of emissions reduction at the instance that the maximum is attained are paramount for the success of China’s ultimate objectives of zero CO2 emissions. China is fortunate to have the technical knowledge, economic strength and sound policy to accomplish the efficient green energy transition by the year 2030 [18].
The energy policy’s success would result in rapid reduction of fossil fuels utilised in the electricity generation by fostering the use of enhanced, readily available less CO2 emitting renewable fuel sources that’s more efficient. The electricity production plants carbon produced in the year 2030 would be approximately 2gigatons which approximately one fifth less than the Accelerated Transition Scenario (ATS). Cumulative investments in the ATS are similar to those in the Announced Pledges Scenario (APS) and investment funding requirements is not a constraint for China [16]. Prosperity in some regions in China did not realise the gains from the economic expansion however, renewable sources supply chain together and developing green technologies will enhance the country’s economic growth [16]. The energy transition is welcomed and supported by labour as it is thought to have a potential of increasing the employment rate. Employment growth may increase significantly if China is successful in securing part of the increasing renewables energy requirements of countries that are not skilled in these emerging technologies. The advantage of increasing the range of the country’s net zero CO2 goal to include all GHG would result in the energy sector achieving a net zero carbon emissions much earlier than the year 2060 [16]. This will cater for the other industry CO2 emissions that are not easily dispensed. The government acknowledges that accelerated success in reducing carbon emissions through to the year 2030 is critical. Solar PV and wind energy of approximately 1.4 TW which equates to approximately a fifth larger than the year 2050 APS, fostering the compliance to the Paris Agreement [15].
In the Announced Pledges Scenario (APS), 40% of the country’s electricity generation carbon emissions reductions by year 2060 is dependent on technologies that are currently being prototyped or in testing and under demonstration phases that should accessible as scheduled to replace present fossil fuel generation. It is envisioned that this would eradicate CO2 emitted from the country’s heavy industry (iron, steel, coal, etc.) of approximately 15% of the projected worlds CO2 financial allocation has a probability of 50% to limit the average planetary increase in temperature to 1.5°C [18].
4. Russia
4.1. Russia’s Macroeconomic
The real GDP growth was 2.1% in year 2022 and it is predicted to be 1.2% in year 2023 [19]. Unemployment is at a record low of 3.5% and forecasted to remain low till year 2026 with the challenge of the Russia-Ukraine war. Russia's current account surplus is declining rapidly to approximately 73% in the first quarter of 2023. However, increased oil and gas exports was at record high in year 2022. The Russian ministry reduced its forecast by 50% for the present unused budget in year 2023 from $158b to $87b with a reduced the commerce budget surplus prediction from $228b to $152b [19].
Russia (prior to the start of the Russia-Ukraine war) as in the case for numerous resource (oil, coal and gas) affluent and electricity exporting countries, JET results in recently sparked extended period impediments. Challenging the feasibility of the country’s financial status, that is extremely contingent on “hydrocarbon export” income. From year 2000, Russia has controlled to raise “energy-resource” exports substantially between year 2000 to 2005, exports increased by 56%. Providing a fast growth of the economy and reinforcing Russia’s stance on the global arena as an “energy superpower” [20]. The worldwide economic recession in 2008, energy resources export was minimised unfortunately. After the recession years of 2011 to 2014 which resulted in inflated oil costs as a result of poor international trade demand and declining “petrodollar” income adversely impacted GDP decline with an oil price of $110 per barrel. Income from oil and gas global sales income decreased from high prices of year 2008 to 2012 compounded by decreasing prices of hydrocarbons. However, in 2017, hydrocarbons supplemented 25% of GDP and 39% of Russian planned income, 65% export revenue and 25% of total funding in Russian economy [46]. Global renewable energy objectives and the transition towards zero carbonization is rendering a significant decrease of hydrocarbon export revenues in Russia and exacerbated by the Russia-Ukraine war.
4.2. Russia’s Energy Policy
In the primary energy consumption, production of electricity is mainly from gas which accounts for 47%, coal accounts for 16%, hydro accounts for 17%, nuclear accounts for 18%, oil accounts for 1% and renewables accounts for 1% as illustrated in Figure 5. The country’s tactical behaviour with respect to JET is paramount for Russia and the planet. Numerous constituents of macroeconomics, institutional frameworks in the power production industry, climate change and technology plans or policies exist which defines the federations strategy towards the energy transition [24].
Figure 5 illustrates the envisaged energy mix by 2030 with successful execution of the Energy Strategy of Russia (ESR, 2010) with from gas 36%, coal 5%, hydro 8%, nuclear 4%, oil 39% and renewables 8% [24]. Russia ranked 4th on the world emissions rankings and is ranked as the fourth-largest primary energy consumer globally. Russia’s “climate change” related policies is ongoing to improve with opportunities to bridge the gaps and develop the required strategies to improve climate-energy interface effectiveness [22]. Russia is committed to the “United Nations Framework Convention on Climate Change” (UNFCCC) and the “Kyoto Protocol” (Russia had a set CO2 aspiration of 5% below the 1990 level for the first commitment period between 2008 and 2012 which was achieved). Furthermore, the country supplies 10% of the world’s energy fuel sources, 5% of the international electricity usage and 16% of foreign commercial dealing in energy [22]. Russia currently, is classified as the biggest largest supplier of power fuels (ranked first in gas, second in oil, and third in coal [24]. Cognisant of this fact, the country’s planned intent with JET is mutually beneficial for national and international outcomes.
The 2022 Russia-Ukraine war has unfortunately negatively affected the global energy transition with financial and trade sanctions imposed on Russia by the “European Union (EU) countries, United Kingdom (UK) and United States of America (USA)”. President, Putin has halted the supply of coal, oil and gas to the countries that were dependent on these supplies as a result of the sanctions imposed on Russia. Consequentially this is causing an energy crisis mostly for the EU countries while the USA is using their oil reserves to dampen the crisis and prevent the increase of energy cost in their country. Other countries have no choice but to refurbish and recommission their fossil fuel power plants to try to curb their energy crisis challenges. This crisis has fortunately resulted in a positive spin off, with short-term contingency plans to soften the impact to the populations from the energy crisis, governments are rapidly initiating longer-term actions. The United States of America (USA) “Inflation Reduction Act (IRA)”, the European Unions (EU) “Fit for 55 package and REPowerEU”, Japan’s “Green Transformation (GT) programme”, Korea’s intent to expand the portion of nuclear and other renewable sources in their energy mix, and renewable aspiration goals of India and China [20].
Internationally the “energy sector” is experiencing a drastic switch due to a change in the requirements for “hydrocarbons” within 20 years [20]. The “Energy Research Institute of the Russian Academy of Sciences (ERI RAS)” projects with the unavoidable reshaping of the intercontinental trade and declining requirements for the country’s “hydrocarbons,” the foreign revenue from oil and gas to the Russian GDP will be reduced by 18% between year 2015 to 2040 [20]. The consequence of “climate change” mitigating plans would adversely impact the countries financial stature unfortunately. A decrease of economic growth results in growth-less national energy needs, fixed sales cost, and decline in capital available for latest technology implementation [20].
The long evolution of the Russian electricity sector has eventually transformed as having many privately and state-owned companies [21]. “State owned companies” are in majority (approximately 70%), in electricity production and in the power network. Russian government owns the “high voltage” power network of 220 kV and above which Russia defined as “Transmission Network” and majority of the electricity distribution networks. Approximately 60% of country’s electricity is produced from combustion of fuel sources [21].
Russia pledged their commitment to the “Paris Agreement” in the year 2016 which included the development (by year 2020) of a plan for “socio-economic” expansion with a reduction of GHG by 2050 [22]. To soften the adverse impacts of the country’s energy resources to the compliance of the “Paris Agreement”, a co-ordinated strict legislative methodology is required to mitigate “climate change” effectively. From year 1998 to 2008, GHG emissions increased to 16% over 11 years, which is considerably at a decreased rate compared to GDP. Since the year 2017, the electricity production decreased its CO2 impact (g/CO2 per kWh) as compared to countries such as, Australia, China, India, Poland, Germany Kazakhstan, the Arab countries of the Persian Gulf, the USA, Chile, and South Africa [25,46]. This is as a result of approximately 35% of electricity generated from nuclear and hydropower plants with minimal CO2 emissions [25]. Gas power plants contributes to 48% of the electricity capacity of Russia enabling the energy transition from petroleum and fossil fuelled electricity production (gas substitution into fossil-fuelled electricity production expanded by 5% from year 2006 to 2017) [25]. The “Paris agreement and the Addis Ababa Agenda 2030” adversely impacts the country’s “fossil-fuel” international trade (natural gas and coal trades substantially affected by the zero-carbon emissions agreement globally by year 2050). The short-term exports affected by the Russia-Ukraine war with export and financial sanctions against Russia. Russia is confronted by the impediments of international commerce of its “energy-intensive” products. Considering this point and low foreign revenue, is rendering the national zero CO2 goals to be the lesser priority as it’s challenging to attract investment with imminent national recession and enforced embargos. This impacts the energy cost negatively with huge socio-economic implications for the Russian population. Cognisant of this information substantiates the reasons for Russia’s isolation from the global decarbonisation trend for many years [22].
Russia is proactive in regular climate change impacts analysis on the Russian ecosystems and economy. Analysis shows that global warming may result in few favourable effects on the country’s financial status with larger agricultural growth requirements and declined need for heating with some conceivable adverse effects that will arise during harsh weather conditions and permafrost liquefying, impacting the energy architecture [26]. Russia is focusing on aggressive and brave energy plans of improving energy efficiency as a result of increased interest in energy efficiency and energy saving from academic researchers and practitioners in Russia [27].The studies also showed that social obstacles impede the transformation towards an energy-efficient economy in the urban small businesses region as a result of disregard for recent energy-efficient technologies, and from social hierarchical behaviour in large corporations creates social barriers.
To defeat these hurdles, organisations are required to introduce positive dynamics and internal educational plans to introduce “Energy Management Systems” (EMS) [27]. Increasing the contribution of renewable energy and revamping the energy industry showing that they are a responsible nation. The quantity of electricity needed to yield a unit of “Gross Domestic Product (GDP)” (in buying capability equivalent terms) is, currently more than 200% higher than the “International Energy Agency (IEA)” average, which reemphasises the major inefficiencies that must be remedied. Russia has a mammoth capability for energy efficiency with a specialised potential of approximately 260 million tonnes of oil equivalent (Mtoe) [27].
The capability to materialise this in the future years will configure the country’s energy equity, influence the upstream electricity production, thermal industry funding requirements, industrial edge and the availability of energy fuels for international commerce. Advancement in energy efficiency, is conducive in relieving the effects of high energy price for the citizens. Energy efficiency can encourage a move towards “cost-reflective pricing” by inviting funding into revamping generation, transmission and distribution to reduce prices to end users [22].
5. Brazil’s Energy Policy
5.1. Brazil’s Macroeconomics
The real GDP growth was 1.2% in year 2022 and it is predicted to be 1.6% in year 2023, while consumption (use of goods and services) was 3.2% in year 2022 [23]. The World Bank’s conducting business ranking of Brazil in year 2022 is 91 out of 190 countries. There was a significant increase in international tourist in Brazil by 107.5% in 2021 despite the Covid-19 pandemic and is predicted to grow by 61.5% in year 2022 to 2023 [23].
5.2. Brazil’s Energy Policy
Brazil has the greenest energy mix with the usage of renewable energy of hydro, wind, solar, bioenergy and geothermal power plants which contributes to 46% of the country’s energy requirements [28]. After China and Canada, Brazil is the third largest hydroelectricity producer globally. Brazil’s hydroelectric sector almost has an unlimited potential which has not been fully exploited given that the country has the capacity to construct numerous hydroelectric power plants [29]. A total electricity demand of 77% is produced from hydropower (Hydro is 12% of the total energy source but used as a major source to produce electricity) the rest being generated from coal, gas and other renewables in Brazil [29].With the dependency on hydropower puts Brazil in a vulnerable to potential power supply shortages in drought years, as experienced during year 2001 and 2002 when the country had severe droughts which resulted in energy supply crisis [29].
The energy mix is depicted in Figure 7 where oil accounts for 36%, biomass accounts for 32%, hydro accounts for 12%, gas accounts for 11%, coal accounts for 5%, nuclear accounts for 2%, other renewables (wind, solar, etc.) accounts for 2% [28]. Brazil is the 5th biggest globally, by ground area and rated second amongst the top ten economies by magnitude of “Gross Domestic Product (GDP)” [30]. Brazil is a major ally in commerce and at times a competitor of the USA, with respect to energy fuels (E.g., Petroleum and ethanol). The country was massively reliant on imports for its energy resources. Brazil has become an energy exporter which produces more energy than it consumes after 35 years of policy development to promote domestic energy resources (hydro, fossil fuels, biomass, gas, wind, nuclear, and solar) [28]. Brazil is the tenth biggest producer of electricity globally and the eighth leading world user of energy [28].
Brazil’s energy security was significantly challenged throughout its history. Major energy sources were inadequate, ethanol fuel for cars (in the beginning of the 1990’s), droughts resulted in reduced hydropower (in the beginning of 2000’s) and expecting the provincial energy from Bolivia and Argentina for natural gas would improve energy security [30]. Bolivia's choice to nationalize their oil and gas sites surprised Brazil, as a major setback, particularly as Brazil did not interpret the country as a dominion. The nationalization specifically shocked “Petrobras”, which was Brazil’s oil company that had approximately $1 billion of financial stake in Bolivia [30]. Argentina added to the crisis by implementing policies that restricted the country's capability to achieve its natural gas foreign commerce agreements. Depending on providers for a reliable energy source was identified as risk to Brazil, however, by adopting better enabling strategies to encourage energy production and diversification [30]. Brazil succeeded in making momentous growth by energy security advancements. Argentina had nationalized its energy resources as it recognised “European and American” organisations as wings of EU and U.S. dominion. Brazil, as one of the colonies, did not anticipate an associate “Latin country” to annex Brazil’s partnership, as Brazil did not deem the country as a dominion rule with the likes of the United Kingdom, Spain and Portugal [30]. Incentivised reduced borrowing rate and funding plans, together with fair prices was established by electric power bidding initiatives resulted in the wind power industry to expand substantially in the country.
The solar source for distributed generation is becoming an effective energy source. The vast use of flexible fuel cars renders ethanol a widely used fuel. There’s a blend mandate of 27.5% on the gas including the opportunity of operating on 100% ethanol coupled with biodiesel mixing plans in year 2018 [28]. Natural gas is a huge alternative and can be a transition fossil fuel by year 2050 with the focus to decrease the usage of fossil fuels. The “Climate Transparency Policy Paper: Energy Transition in Brazil” provides the generic energy plan of the country and determines initiatives, gaps and prospects to accomplish “Greenhouse Gas (GHG)” emission alleviation objectives, providing “policies and legislation” to sustain a vigorous evolution of the energy segment [28]. Brazil’s renewable energy resources makes up 46% of entire primary energy resource and 85% of the electricity generation. Currently, non-renewable energy sources comprise of approximately 57% of full primary energy supply and 32.7% is utilised in the transport industry [28]. Brazilian energy intensity has been constant from the year 1990, below 4 TJ / million US$ [28]. Brazil’s entire GHG production is approximately 1.6 billion tons of CO2 and ranked 12th on the world emission rankings [47]. The power segment investments was in renewable energy from year 2000 to year 2013 due to the structural reform in the energy sector. This led to change in Energy Policy which was more focused on the production of electricity by the IPPs and thus an increase usage of renewable energy from 48% to 51%. Wind power was the majority investments in the power sector between the year 2014 and 2016. Solar energy investments augmented considerably to approximately 35% of overall funding in the power segment by year 2016 [28].
Funding authorized and approved for year 2021 included fourteen Solar Photovoltaic (SPV), eight wind farms, two hydropower and one biomass fired thermo-power plants, increasing a further 880MW capacity into the “National Integrated System” (SIN) [31]. Figure 8 shows that future energy mix would improve to greener energy mix with the additional capital injection by the Brazilian government executing their energy transition strategy. A total of $4.5b and 4040 undeviating employment are projected to be formed which is positive in compliance to the ILO 2015. Wind power sprouted as a substitute aimed at the expansion of the electricity sector subsequent to the energy emergency of year 2001 and is currently the ninth leading international volume (13 GW), with an average capacity factor of 40%, representing 8% of Brazil’s electricity sector in terms of connected electrical power capacity.
The overall potential in Brazil is approximately 300GW [31]. It’s forecasted from the “Ministry of Mines and Energy” a growth of 125% by year 2026 when the predicted target of 28.6% wind power of the total capacity of the power pool in Brazil will be installed. It’s estimated by the “Brazilian Industrial Development Agency (ABDI)” that by year 2026 the wind power sector would produce approximately 200 000 novel undeviating and ancillary employment [32,36]. The wind energy value chain has been rising by the enticements offered by the government. (“Tax exemption, long-term financing, etc.”). The country recently has considerably advanced their industrialized structure of the wind power segment to assemble the wind turbines and the fabrication of numerous modules (towers, blades, subcomponents of the pivot and nacelle) locally, with reduced quantity of imported components equated to former years [31].
The “International Labour Organization (ILO, 2015)” specified, if suitable strategies are implemented, the evolution of the global economy to a “greener” and extra viable framework ought to craft 620000 additional employment opportunities in Brazil, which adequately supersedes the possible 180 000 employment opportunities that may be reduced (ILO, 2015). Funding in renewable energy resources, linked by incentive plans (“tax reductions and attractiveness in financing”) coupled to decreasing GHG discharges, may yield a large quantity of employment. [48]. The wind power segment created 150 000 undeviating employments in the year 2016, at present totalling 13 GW, or 8.6% of the nationwide electricity segment [32]. The “Light for All” initiative is conspicuous by achievement in pursuing the standardisation of availability to electrical power in pastoral areas, selecting old-fashioned inhabitants and regions of great scarceness. Started in 2003, it helped approximately 16 million of the population in 2016 [48]. An investment of $250m in year 2019 was intended to connect approximately, 96000 additional electrical connections in 17 states [34].
Numerous strategies were compiled in Brazil aimed at diversifying the energy mix, through “Proalcool and Proinfa” programs by means of its chief indicators [34]. These plans permitted the triumph of Brazil’s biofuels and wind energy segment correspondingly. Public funding and incentives of substitute energy sources contributed an essential part in the progression and in launching the nation’s wind energy value chain. Currently, replicating strategies would remain critically imperative aimed at, increased progression of the solar energy value chain, integrated through major funding in research and development. Brazil with “Light for All” program, has been fulfilling its social objectives [34]. In summary, renewable energies in the country are progressing swiftly and the “energy transition” will predictably evolve along with the nation’s technical financial progression [25].
6. History of Energy Policy in SA
6.1. South Africa’s Social and Economic Context in Comparison with the Rest of the BRICS Partners
South Africa makes up 1% of the world’s land area with a population of 59 million people which is 1.9% of the total BRICS countries population as shown in Table 1 [2]. The BRICS countries makes up 30% of the world territory. The average life expectancy of South Africans is 64 years which coincidentally also the lowest amongst the BRICS countries [2]. South Africa’s GDP growth rate of 2.1% in comparison with an average GDP growth rate of 3.32% of the BRICS countries.
6.2. South Africa’s Macroeconomics
The real GDP growth was 2.1% in year 2022 and it is predicted to be 4.8% in year 2023, while consumption (use of goods and services) was 6.5% in year 2022 [35]. The World Bank’s doing business ranking of China in year 2022 is 71 out of 190 countries. South Africa is rich with various natural resources (gold, diamonds, coal, etc) with the mining industry being one of the largest employers, providing the country huge export revenue while supporting the local labour force. The large agricultural landscape of South Africa is also a crucial economic strength [35].
6.3. Current Energy Mix in South Africa
South Africa is the 7th largest producer of coal with most of the coal used to fuel the fossil fuel power stations locally or internationally at power plants [37]. Coal although used vastly as a fuel source, it also contributes to many other industrial processes of steel production, cement processing, paper and aluminium industries, chemical and pharmaceutical activities, coal gas and coal liquid as transportation energy and plant fertiliser as detailed in Figure 9 [38]. South Africa’s transactions of 69million tons of coal, at $5billion, was the country’s fourth greatest treasured mineral exported, after gold ($201billion), diamonds ($11billion), and platinum ($8.5 billion), funding 4.5% of foreign income [37]. South Africa’s domestic trades of approximately 183million tons of coal created revenue of more than 20% greater than coal exported [37]. Price, nonetheless, is not an acceptable justification for the comparative tardiness. Cognisant of this fact, the coal mining labour force will be extremely concerned with the future reduction in coal usage in the generation of electrical power and replaced with cleaner and “greener” fuel sources as it has a direct correlation with future job losses due to reduced activity to mine coal. If not managed sensitively and with appropriate engagements with labour, the initiatives towards decarbonisation and most initiatives of Just Energy Transition (JET) will be derailed [37].
Demonstrating and reiterating that the coal reserves are being depleted and only a finite reserve will be available in the near future. Besides the drive to achieve the target of zero carbon emissions by 2050 in a desperate attempt to prevent global warming and climate change. The conservation of coal resources to realistically and urgently change the global image as illustrated in Figure 8 which depicts the present energy resources where 56% is coal, 14% hydro, 10% wind, 8% solar, 7% gas, 3% biomass and 2% nuclear. It is apparent that coal is required for future sustainability of various vital industries which are very much dependent on coal including the pharmaceutical industry which are overlooked currently due to the insignificant volumes of coal used in comparison to the large volumes consumed in the energy sector [39].
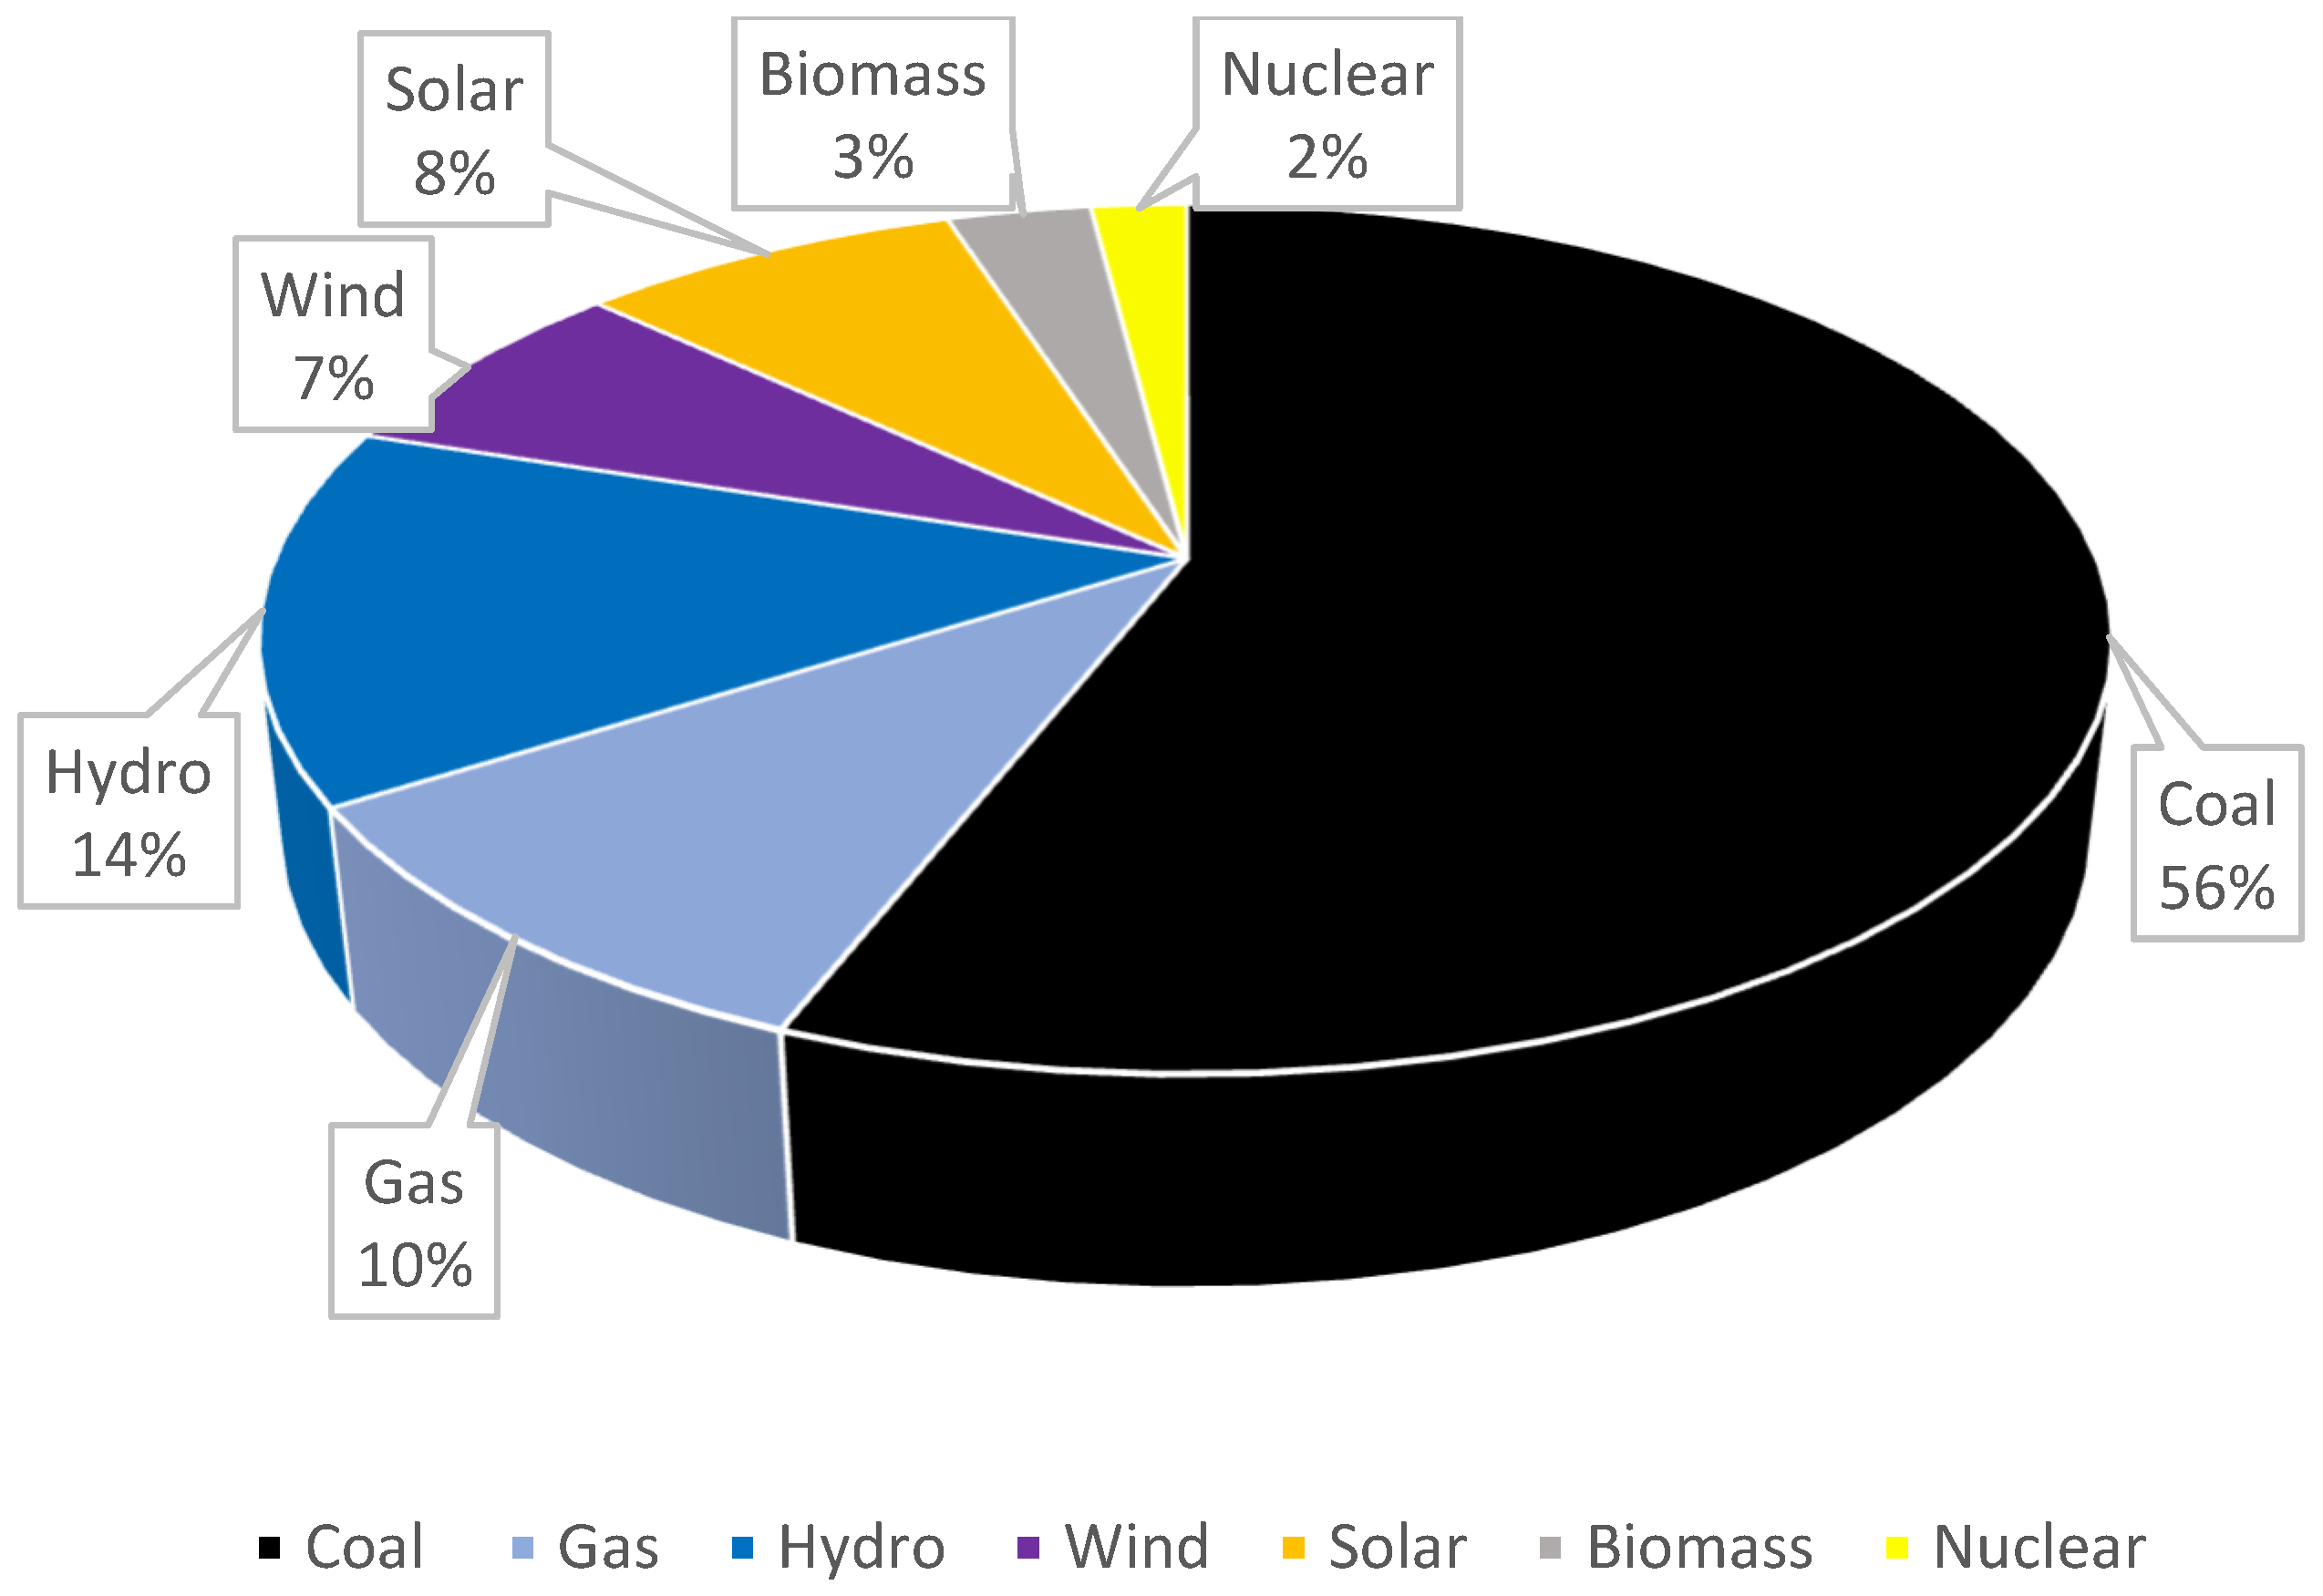
Figure 10.
Power plants fuel sources [39].
Figure 10.
Power plants fuel sources [39].
In South Africa most of the fossil fuel power stations are in their mid to end-of-life phase as illustrated in Figure 11 [40].
The decommissioning plan of power plants as the shown in Table 2 coincides favourably to the country’s just energy transition into alternative lower carbon fuel sources. Legislations and policies incumbent to just energy transition requires attention as there is no evidence of a policy encompassing South Africa’s energy transition. Traditionally or historical approaches of funding methodology for the power utility business must change to accommodate the huge burden on the state and investigate innovative investment models with public and private participation partnerships models. These models require development into models to allow the local communities and citizens to be able to contribute and be able to have a shareholding into the future renewable and greener power plants. With this participation or funding initiative like a trust or “crowdfunding” the loss of employment impacts can be alleviated by this shared equity opportunities.
6.4. Insight into the “Just” Energy Transition in South Africa
South Africa as a developing country, initially did not have a commitment to reduce carbon emissions by a specific value within a given period. However, the Kyoto protocol and subsequent post-Kyoto protocol international initiatives aimed at the reduction of GHG’s to which South Africa voluntarily committed had an influence on government with regards to the energy policy [41,42]. This is in the form of mandating the use of significantly more renewable energy sources as seen in the “Integrated Resource Plan” (IRP 2010 and 2019) as well as more specifically addressing fossil fuel for electricity generation. The government took a stance in 2008 that all future fossil fuel-fired power plants will only be licensed if they are Carbon Capture Sequestration (CCS) compliant. This initiated the process of South Africa to investigate viable options of renewable energy sources [41].
In South Africa there are significant shortcomings with labour and urgent remedial action is required in compliance to the International Labour Organisation’s (ILO) policy, 2015 and policies of environmentally friendly fuel sources and adaptation of technologies to utilise a sole or multiple renewable fuel sources. There is also a huge necessity in bridging the gap that exists in the conventional funding methodology versus the green funding imperatives [43]. Presently, the policies are not clear but there are various collaborative initiatives with South African government departments, (Presidential Climate Commission (PCC), labour, environment, mineral council of South Africa, trade, industry and competition), Eskom, Sasol, Council for Scientific and Industrial Research (CSIR), National Business Initiative (NBI), Business Unity South Africa (BUSA), private and public sectors in evaluating, paving the path and bridging the gap for the Just Energy Transition (JET). The Presidential Climate Commission (PCC) report provides confirmation that the South African government is pursuing a Just Energy Transition (JET) with conviction, but time will tell if the transition will indeed be a “just” one. The “Climate Investment Funds” (CIF) announced the launch of the “Accelerating Coal Transition” (ACT) program in April 2021. ACT would be the catalyst in speeding up the transition from fossil fuels, predominantly coal in a consistent and sequential approach with governance, human resources, and infrastructure which is the three pillars of the program [44].
CIF issued a call for “Expressions of Interest” (EOI) to which South Africa in June 2021 and was responded to favourably in August 2021 with a proposal to concentrate on decarbonisation of the electrical energy sector in the context of its Just Energy Transition (JET) initiative. CIF announced that South Africa’s proposal in response to the EOI was favourably selected for the preparation of approximately $500m funding by the government in cooperation with the “World Bank “(WB) and the “African Development Bank” (AfDB) in October 2021[44]. The PCC completed “South Africa's Just Energy Transition Investment Plan” (JET-IP) in 2022. The JET framework focused on ensuring a “just and equitable” transition to net-zero CO2 emissions in South Africa by year 2050. The JET plans provide the required reference guidelines to various planning and policy setting processes ensuring the JET framework gain synergy across all JET planning in countrywide. The PCC commissioned numerous research studies with integrated public consultations to support the development of the JET plan in year 2021. The studies and consultations aided to unfold fundamental challenges JET in South Africa, paving the path for the development of the JET framework that is practical, time synchronised, and executable and matched with the requirements of all social partners [44]. The PCC report is the findings of the assessments and consultations, emphasizing critical considerations for the development of the “Just Transition” framework. The information derived and extracted from each related study was developing a vision and establishing policies to support a just and equitable transition, supporting sustainable livelihoods, financing a just energy transition, improving water security and creating good governance structures to manage JET [44]
These engagements will be referenced to the “ILO guidelines, 2015 for Just Transition” towards environmentally sustainable economies and humanities for all in South Africa [33]. The ILO principles have an emphasis on solid social confluence on the aim and passageways to energy sustainability [33]. Policies must conform, stimulate and realize necessary values and rights at which are critical to energy sustainability. Comprehensible policies across the economic, environmental, social, education/training and labour groups essential to deliver an empowering environment for enterprises, labour, financiers and users to embrace and drive the evolution to environmentally sustainable and comprehensive economies and humanities [33].
7. Conclusion and Policy Implications
The comparative energy policies of BRICS countries studies have shown that the populations’ lifestyle, energy mix, industry and commitments from their governments are extremely similar. South Africa is a small-scale representation in many aspects to Brazil, India and China of a developing nation with social and environmental responsibilities of “Just Energy Transition.” Russia shares some similar energy related mix of fossil fuels of coal and natural gas. South Africa can replicate hybrid or tailored energy policies of the BRICS countries in accordance with the South African landscape of energy sources readily available with the common objectives of decarbonisation. The financial situation in South Africa is rather constraint compared to BRICS countries but could be offset by the similar funding requirements to decommission and build new power plants in any event. South Africa could apply and entered into some negotiations for green finances and green bonds with the motivation of the compliance to the ILO, 2015 and the Paris Agreement [33].
It is strongly recommended that we take a phased approach that should form the basis to next Integrated Resource Plan (IRP) for country. The energy plan should assess electrical power requirements of the country for the next 8 years cognisant of the end of life or near end-of-life power plants to 2030. The proposal for the next IRP would categorically state that South Africa would not invest in fossil fuels (coal, oil and natural gas) for new plants. Although natural gas is more efficient from a power plant perspective, there is still carbon emissions from these plants. CCS will also make these gas plants less cost effective as it would be a requirement to meet the targets of nett zero carbon emissions by year 2050. The drive to replace power stations that are at their end of economically and technically feasible lifespan with greener power alternatives and the introduction of CCUS (Carbon Capture Usage and Sequestration) to the fossil fuel power stations which have 10 to 25 years production lifespan in South Africa would ensure a future of the energy mix in the right direction. The drive needs to rapidly increase the pace of Just Energy Transition (JET) in South Africa to take the least cost options to benefit the country both environmentally and economically yet ensuring sustainable employment opportunities with readily available technologies.
The focus would be to grant approval to the state-owned utility company Eskom or private sector to replace the approximate capacity of 8201MW of retiring power plant by 2030 with alternative renewable energy plants in the most effective and efficient manner [49]. The fastest and most cost-effective technology currently would be to construct solar PV coupled with Battery Energy Storage System (BESS) to replace majority of the capacity requirement (proven in China and especially cognisant that China produces most of solar panels and auxiliary equipment). The BESS/Solar PV can be hybridised to incorporate aquaponics or agrivoltaics, the later can be assessed on climate considerations and economics. The newer generating power plants (with a lifespan of 20 years or more), the feasibility of retrofitting Carbon Capture Usage and Sequestration (CCUS) or at least Carbon Capture and Sequestration (CCS) plants must be economically evaluated to deduce the viability [45]. This would provide some support and buffer while the SA energy sector can research and assess the viability of hydrogen, nuclear, wind and gravitational power generators based on effectiveness and eventually their efficiencies to reduce global carbon emissions and produce electrical power.
Conflicts of Interest
The authors declare no conflict of interest in interpretation of data; in the writing of the manuscript; or in the decision to publish the results.
References
- Morazan, P., Knoke. I., Knoblauch, D., Schafer, T., (2012). The Role of BRICS in the Developing World, https://www.europarl.europa.eu/thinktank/en/document.html?reference=EXPO-DEVE_ET(2012)433779.
- JSP, (2018). BRICS https://www.statssa.gov.za/wp-content/uploads/2018/11/BRICS-JSP-2018.pdf.
- IMF, (2011a:8). New Growth Drivers for Low-Income Countries: The Role of BRICS. https://www.imf.org/external/np/pp/eng/2011/011211.pdf.
- World Economic Forum (WEF), (2021). https://www.weforum.org/reports/annual-report-2021-2022/.
- Macroeconomic Outlook Report: India, (2023). https://www.globaldata.com/store/report/india-pestle-macroeconomic-analysis-2/.
- IEA, (2021). India Energy Outlook. https://www.iea.org/reports/india-energy-outlook-2021.
- COP26, (2021). The Glasgow Climate Pact, UN Climate Change Conference, United Kingdom. https://www.efaidnbmnnnibpcajpcglclefindmkaj/https://ukcop26.org/wp-content/uploads/2021/11/COP26-Presidency-Outcomes-The-Climate-Pact.pdf.
- NEP-India, (2022). National Electricity Plan of India. https://powermin.gov.in/en/content/national-electricity-plan-0.
- Kaur, R., Pandey, P., (2021). Air Pollution, Climate Change, and Human Health in Indian Cities. https://www.frontiersin.org/articles/10.3389/frsc.2021.705131/full.
- Agarwal, S., Mani, S., Aggarwal, D., Hareesh, C., Ganesan, K., Jain, A., (2020). Awareness and Adoption of Energy Efficiency in Indian Homes. New Delhi: Council on Energy, Environment and Water. https://www.ceew.in.
- Mani, S., Agarwal, S., Ganesan, K., Jain, A., (2020). State of Electricity Access in India: Insights from the India Residential Energy Survey (IRES) 2020. New Delhi: Council on Energy, Environment and Water. https://www.ceew.in/publications/state-electricity-access-india.
- Aklin, M., Harish, S.P., Urpelainen, J., (2015). Quantifying slum electrification in India and explaining local variation. http://eprints.gla.ac.uk/115751/.
- Chandran, R., (2018). Forced to walk miles, India water crisis hits rural women hardest. https://www.reuters.com/article/us-india-water-women-idUSKBN1K318B.
- Macroeconomic Outlook Report: China, (2023). https://www.globaldata.com/data-insights/macroeconomic/china-macroeconomic-country-outlook/.
- IEA, (2021). An Energy Sector Roadmap to Carbon Neutrality in China. https://www.iea.org/reports/an-energy-sector-roadmap-to-carbon-neutrality-in-china.
- Chang, S., Zhuo, J., Meng, S., Qin, S., (2016). Clean Coal Technologies in China: Current Status and Future Perspectives. https://www.sciencedirect.com/science/article/pii/S2095809917300814?via%3Dihub.
- Chen, Y., (2018). Comparing North-South Technology Transfer and South-South Technology Transfer: The Technology Transfer Impact of Ethiopian Wind Farms, Energy Policy. [CrossRef]
- Hasanbeigi, A., Becqué, R., Springer, C., (2019). Curbing Carbon from Consumption: The Role of Green Public Procurement, Global Efficiency Intelligence. https://www.climateworks.org/wp-content/uploads/2019/09/Green-Public-Procurement-Final-28Aug2019.pdf.
- Korsunskaya, D., Marrow, A., (2023). Russia Raises 2023 GDP Growth Forecast, Longer-term Outlook Worsens. https://www.reuters.com/markets/europe/russian-economy-ministry-improves-2023-gdp-growth-forecast-2023-04-14/.
- Henderson, J., Mitrova T., (2017). Natural Gas Pricing in Russia Between Regulation and Markets. SKOLKOVO Centre, Russia. https://energy.skolkovo.ru/downloads/documents/SEneC/research02.pdf.
- ERI RAS, (2019). Global and Russian Energy Outlook up to 2040. https://www.eriras.ru/files/forecast_2016.pdf.
- Mitrova, T., (2019). Energy Transition in Russia, Moscow, Russia. [CrossRef]
- Macroeconomic Outlook Report: Brazil, (2023). https://www.globaldata.com/data-insights/macroeconomic/brazil-macroeconomic-country-outlook/.
- IEA, (2018). Coal Analysis and Forecasts. https://www.iea.org/coal2018.
- Staffell, I., Jansen, M., Chase, A., Cotton, E., Lewis, C., (2018). Energy Revolution: Global Outlook. Selby, Drax .https://scholar.google.com/scholar?q=related:4ocQEJoNd7AJ.
- Grushevenko, E., Mitrova T., Malov A., (2018). The Future of Russian Oil Production: Life Under Sanctions SKOLKOVO Energy Centre. https://energy.skolkovo.ru/downloads/documents/SEneC/research04-en.pdf.
- Ratner, S., Berezin, A., Gomonov, K., Serletis, A., Sergi, BS., (2021). What is Stopping Energy Efficiency in Russia? Exploring the Confluence of Knowledge, Negligence, and Other Social Barriers in the Krasnodar Region. [CrossRef]
- Wills, W., Westin, FF., (2019). Energy Transition in Brazil. https://www.climate-transparency.org/wp-content/uploads/2019/04/Brazilian-Policy-Paper-En.pdf.
- Karpavicius, LM., (2021). Brazil Sources 45% of its Energy from Renewables, Brazil. https://www.climatescorecard.org/2021/01/brazil-sources-45-of-its-energy-from-renewables.
- Sewalk, S., (2015). Brazil’s Energy Policy and Regulations, Brazil. https://www.jstor.org/stable/26195861.
- Ambiente Energia., (2018). MME Authorizes the Installation of 25 Clean Energy Plants to Generate 883 MW, Brazil. https://www.ambienteenergia.com.br/index.php/2018/09/governo-autoriza-instalacao-de-25-usinas-geradoras-de-energia-limpa/34721#.W5r1BOhKiUk.
- ABDI., (2014). Mapping of the Production Chain of the Wind Industry in Brazil. https://www.investimentos.mdic.gov.br/public/arquivo/arq1410360044.pdf.
- ILO., (2015). https://www.ilo.org/wcmsp5/groups/public/---ed_dialogue/---actrav/documents/publication/wcms_826060.pdf.
- Agência Brazil., (2018). Increase Percentage of Biodiesel Takes Effect, Brazil. https://agenciabrasil.ebc.com.br/economia/noticia/2018-03/aumento-para-10-do-percentual-de-biodiesel-no-diesel-entra-em-vigor.
- Macroeconomic Outlook Report: South Africa, (2023). https://www.globaldata.com/data-insights/macroeconomic/south+africa-macroeconomic-country-outlook/.
- ABEEólica., (2018). Wind Energy is Expected to Generate Jobs in Brazil by 2026. Brazil. https://abeeolica.org.br/noticias/estudo-abdi-ventos-que-trazem-empregos.
- Lawrence, A., (2020). South Africa’s Energy Transition. Wits School of Governance, University of the Witwatersrand, Johannesburg, Gauteng, South Africa.
- Malumbazo, N., (2020). A New Normal; Coal. SANEA Energy Webinar, 06 August 2020.
- Central Electricity Authority (CEA), 2022. https://cercind.gov.in/2022/draft_reg/Sharing-Regulations_Amend-2022/CEA%20COMMENTS.pdf.
- Juodaityte, J., (2011). Microalgal Biotechnology for Carbon Capture and Bioenergy Production. Eskom, Research and Innovation Report, Johannesburg, South Africa.
- Ritchie, H., Roser, M., (2017). CO₂ and Greenhouse Gas Emissions. https://ourworldindata.org/co2-and-other-greenhouse-gas-emissions#future-emissions.
- Hirsch, T., Matthess, M., Dr. Funfgelt, J., (2017). Guiding Principles and Lessons Learnt for a Just Energy Transition in the Global South. Friedrich Ebert Stiftung, Berlin, Germany.
- Naidoo, C., (2019). Transcending the Interregnum: Exploring How Financial Systems Relate to Sustainability Transition Processes. University of Sussex, Business School, UK.
- PCC, (2021). Laying the Foundation for A Just Transition Framework For South Africa. https://www.climatecommission.org.za.
- Condor, J., Unatrakarn, D., Asghari, K., Wilson, M., (2011). Current Status of CCS Initiatives in the Major Emerging Economies. https://pdf.sciencedirectassets.com/277910/1-s2.0-S1876610211X00036.
- Melnikov, Y., Mitrova, T., (2019). A carbon-free world: What is Russia’s response? Energy Centre, SKOLKOVO Business School, Moscow, Russia. https://www.cairn.info/revue-responsabilite-et-environnement-2019-3-page-128.htm.
- Grattan,S., (2022). Brazil's 2021 climate emissions. https://www.reuters.com/world/americas/brazils-2021-climate-emissions-highest-since-2006-report-says-2022-11-01/.
- Drummond, C., (2016). Understand How Light for All Works, Brazil. https://www.cartacapital.com.br/especiais/infraestrutura/entenda-como-funciona-o-luz-para-todos.
- Halsey, R., Schubert, T., Maguire, G., Lukuko, T., Worthington, R., McDaid, L., (2020).Energy Sector Transformation in South Africa. Project 90 by 2030, Cape Town, South Africa. https://www.90by2030.0rg.za.
- Globaldata Country Risk Index (GCRI, 2023). https://www.globaldata.com/store/report/global-economic-risk-quarterly-analysis/.
Figure 1.
India’s current Energy mix [6].
Figure 1.
India’s current Energy mix [6].
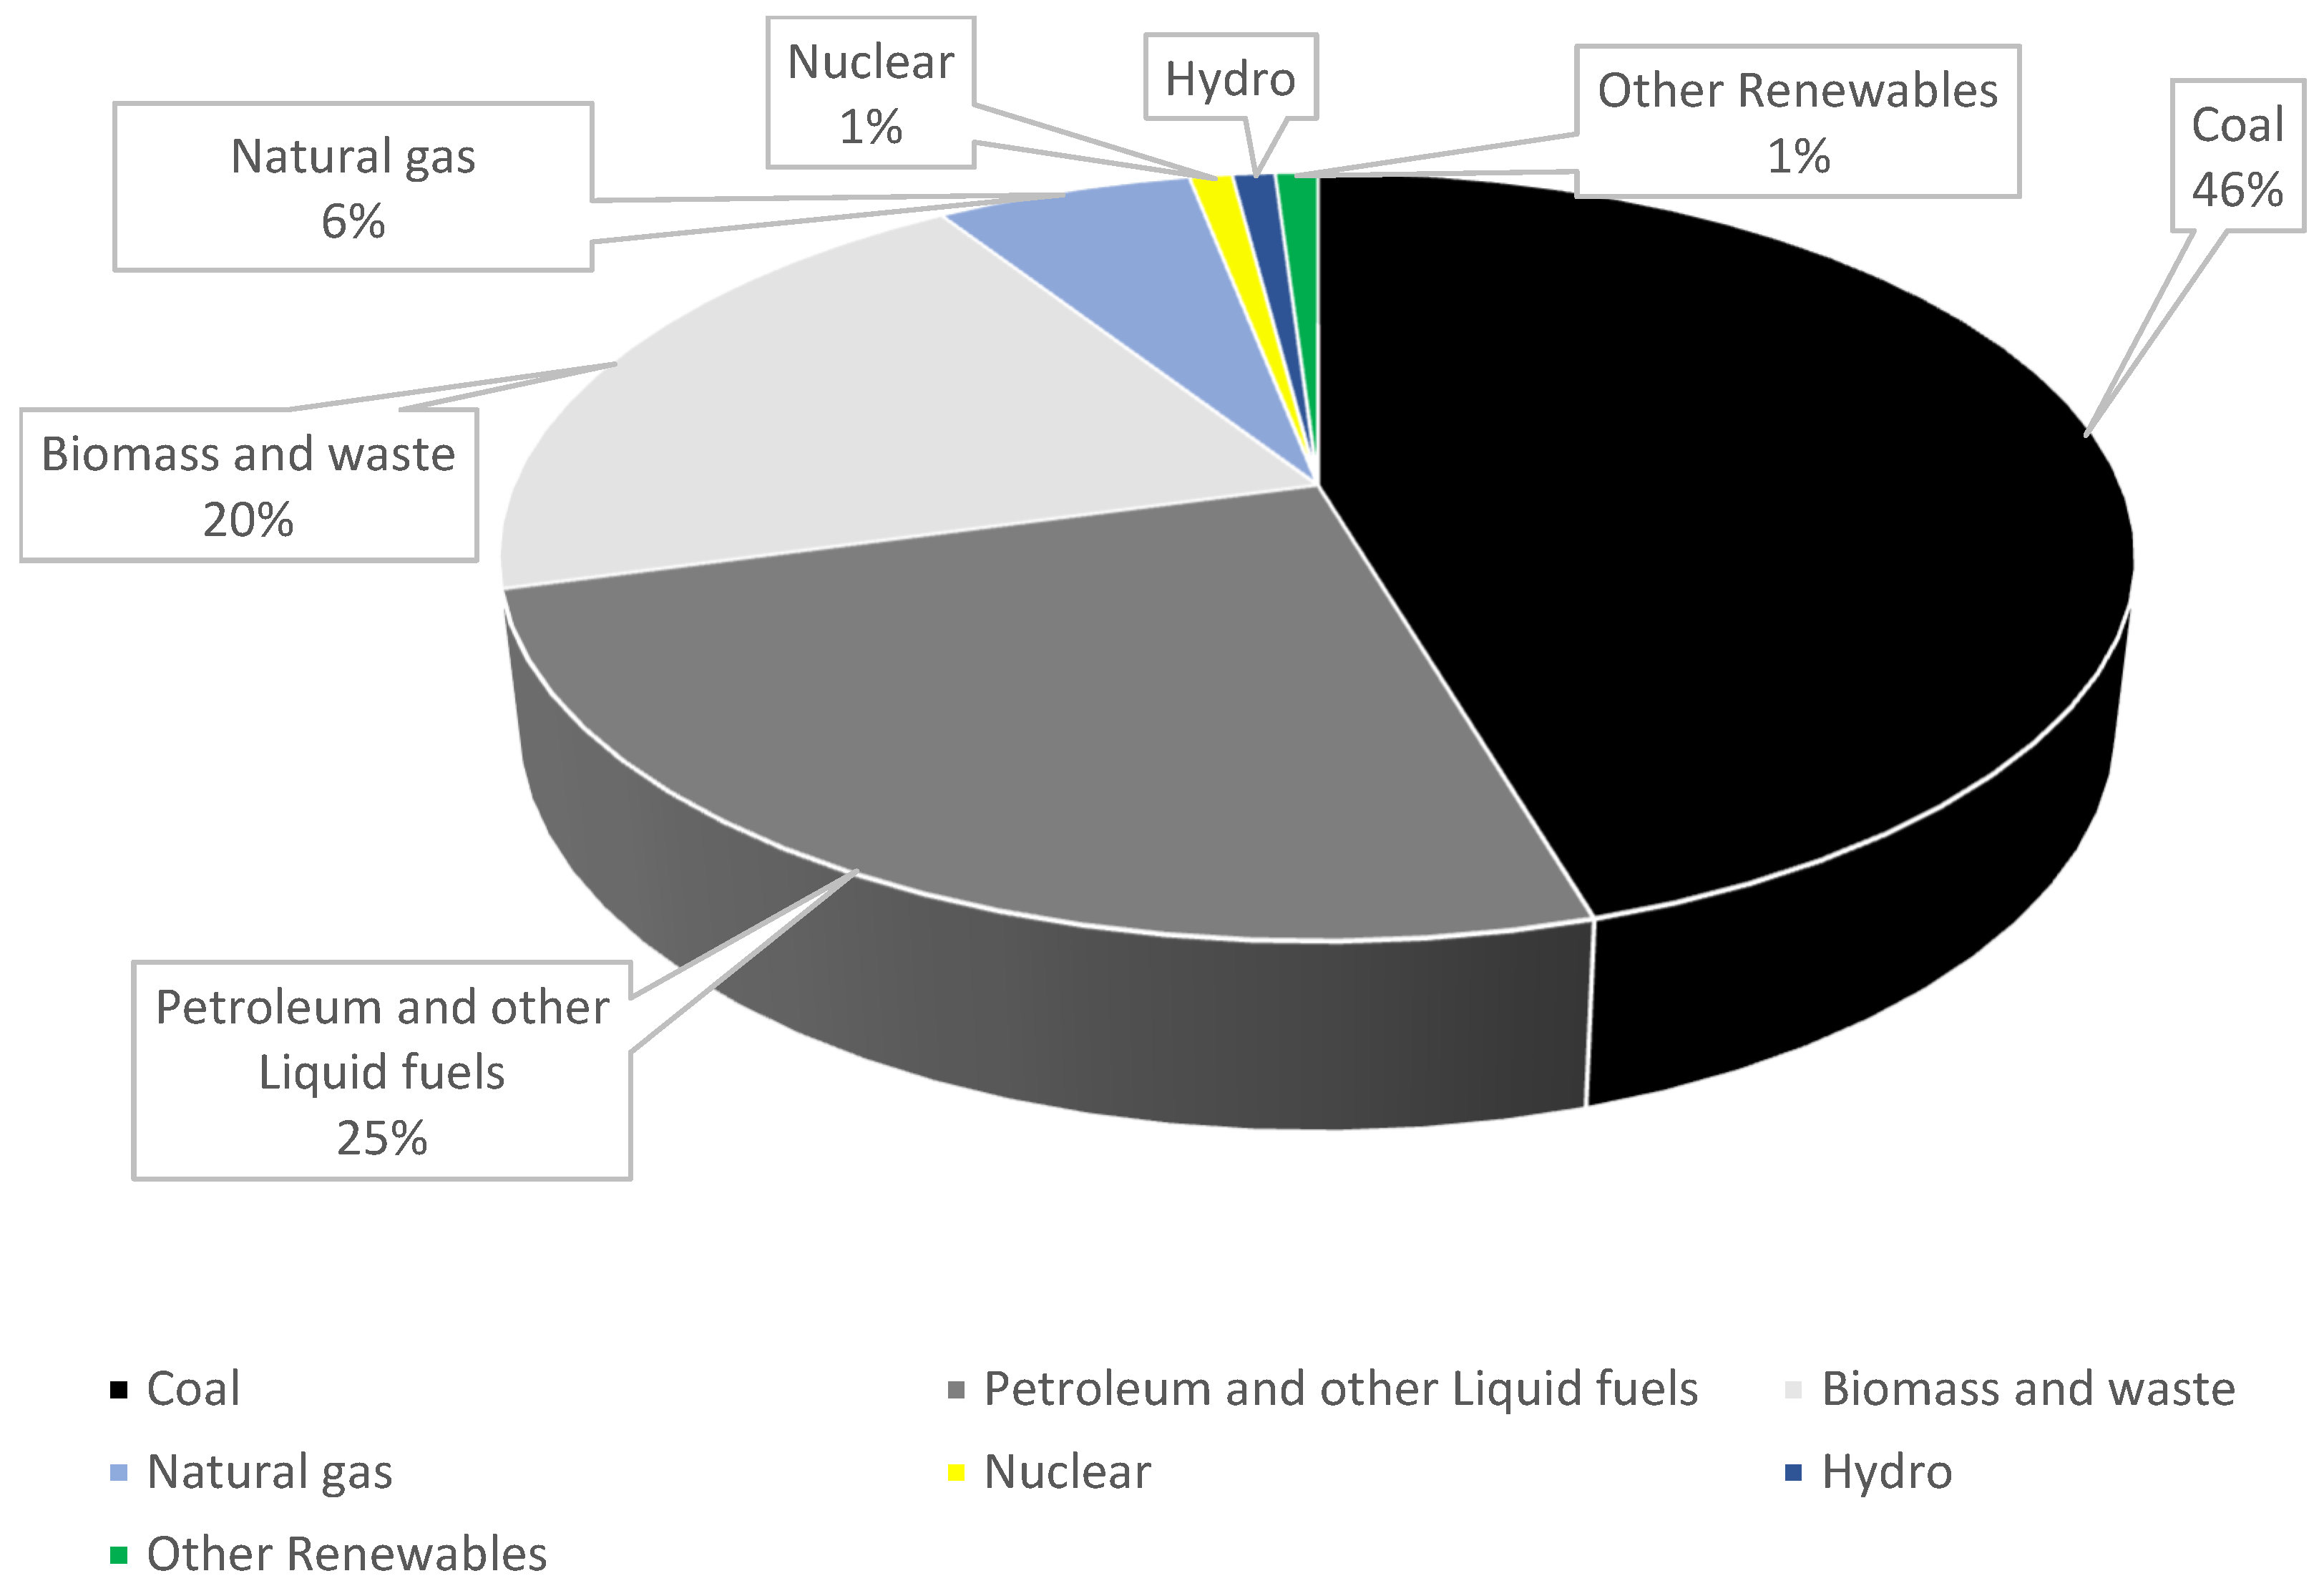
Figure 2.
India’s envisioned 2032 Energy mix [8].
Figure 2.
India’s envisioned 2032 Energy mix [8].
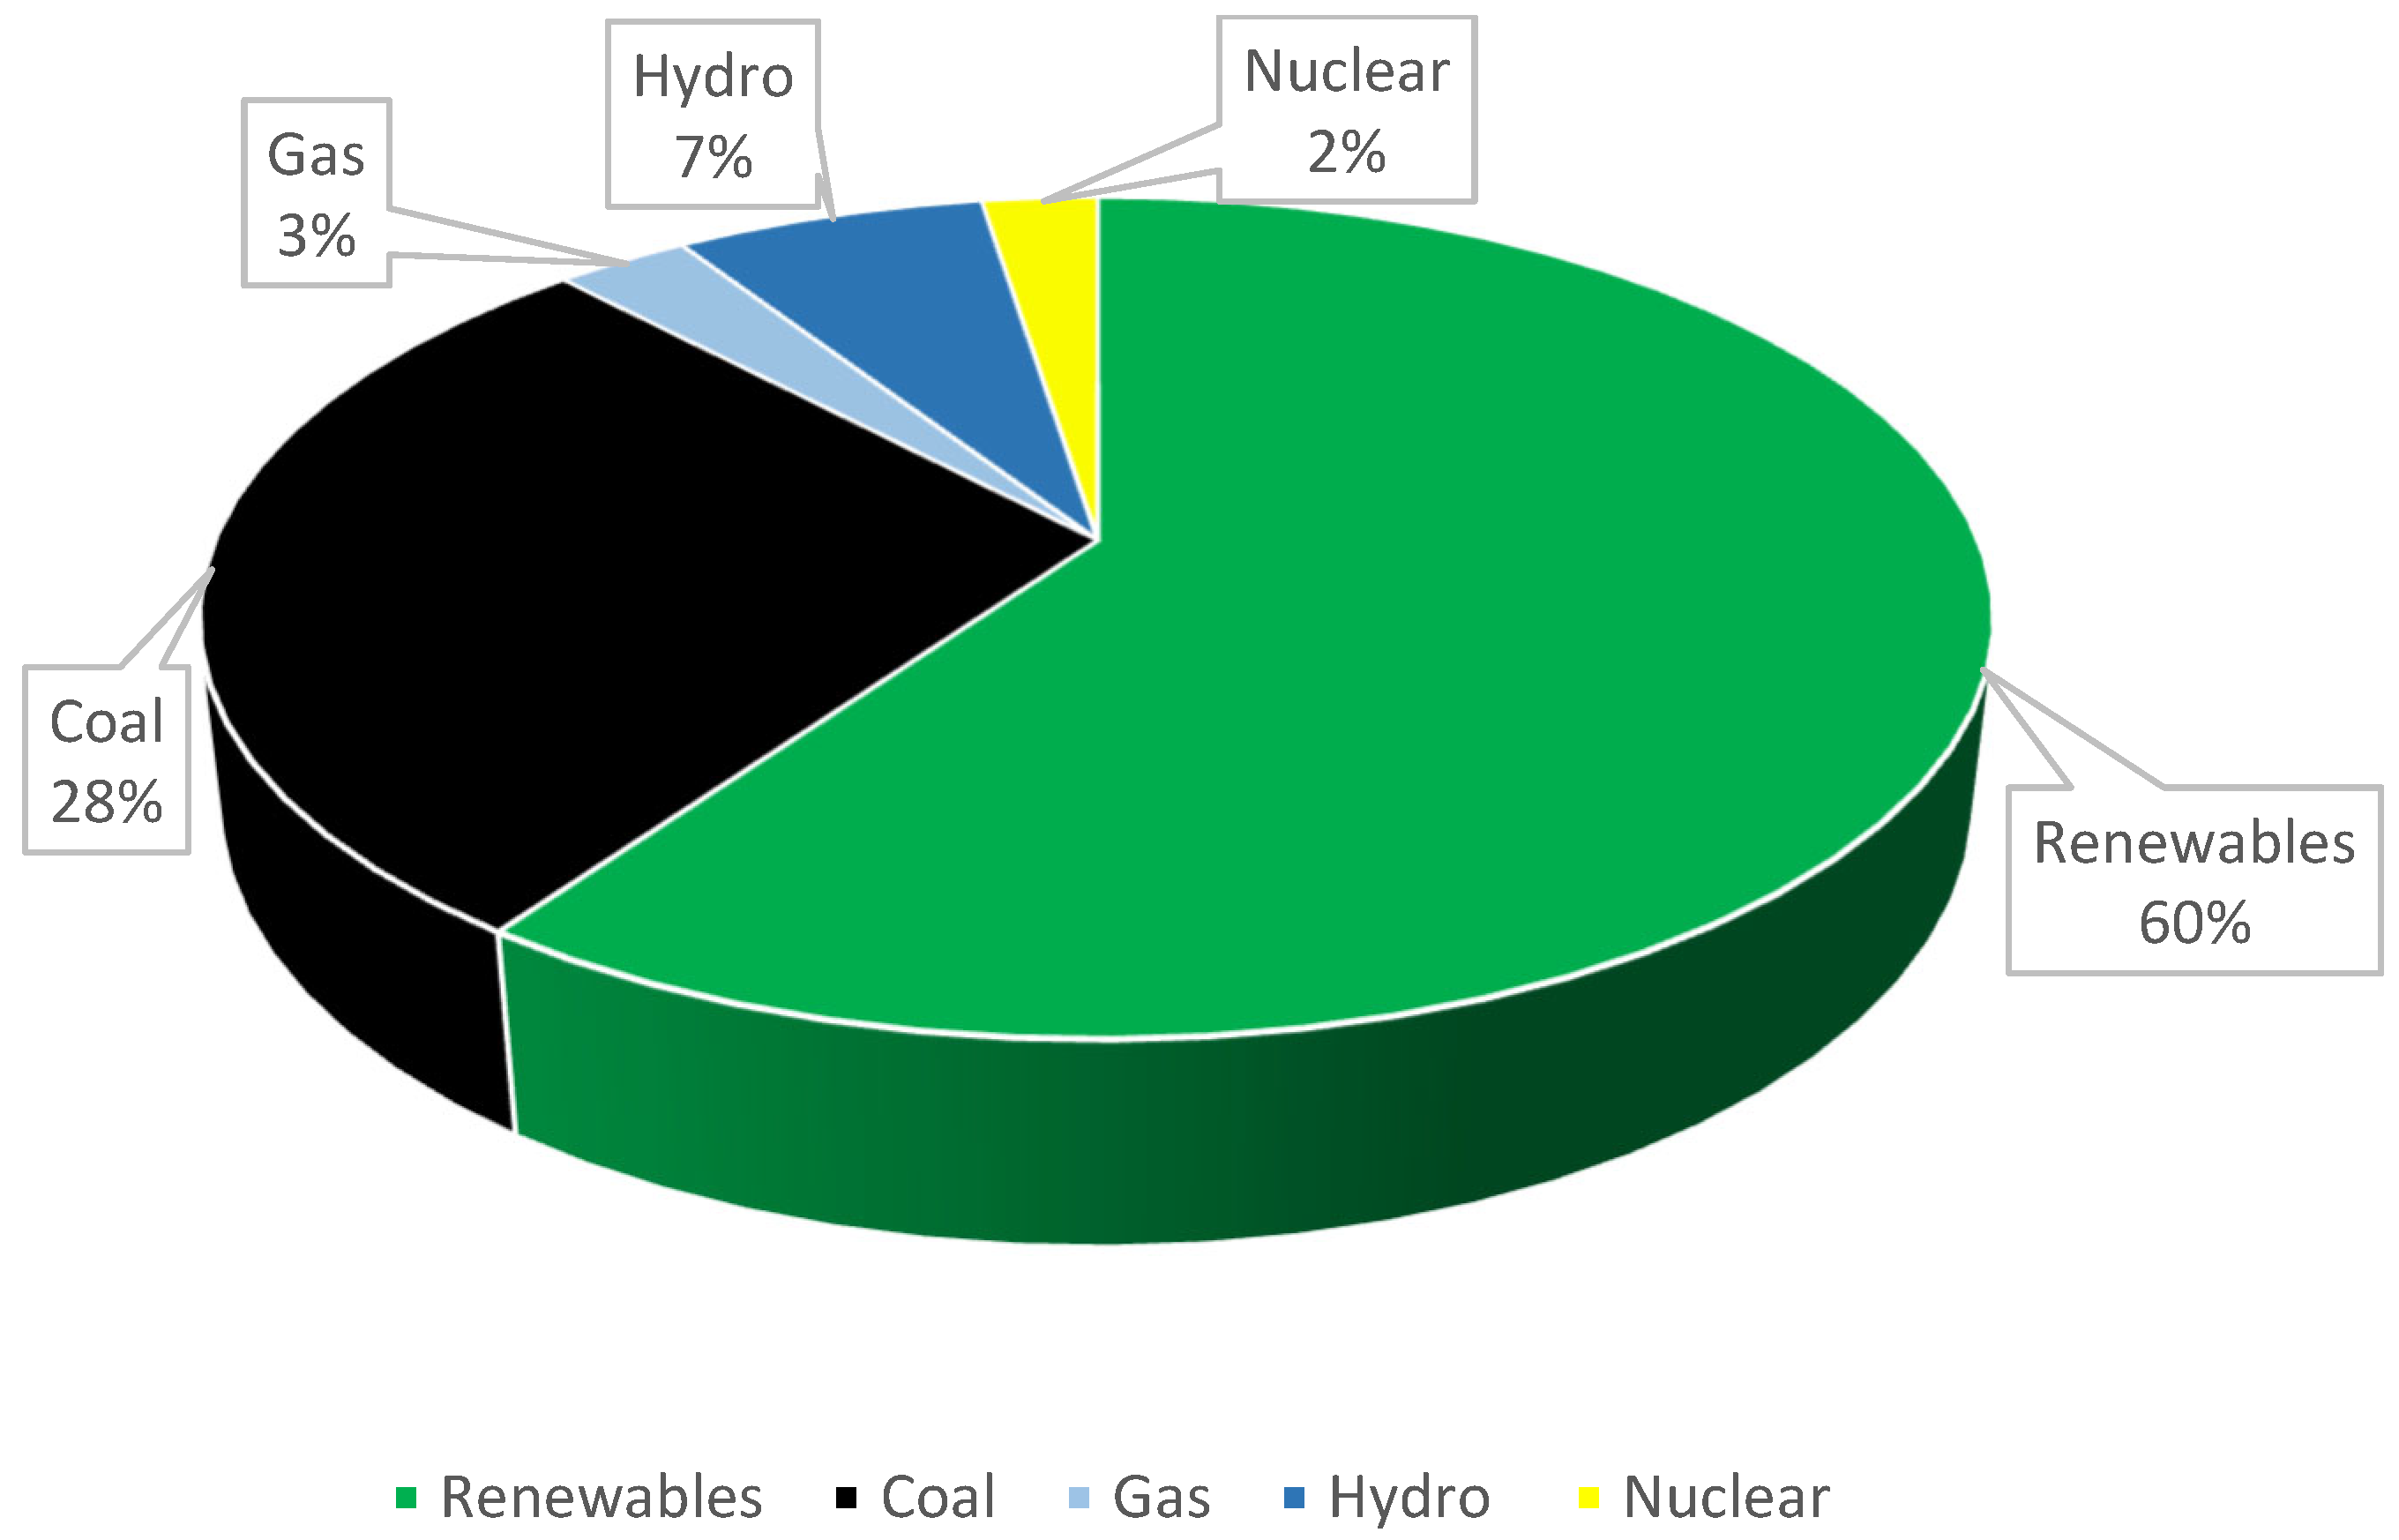
Figure 3.
China’s current Energy mix [15].
Figure 3.
China’s current Energy mix [15].
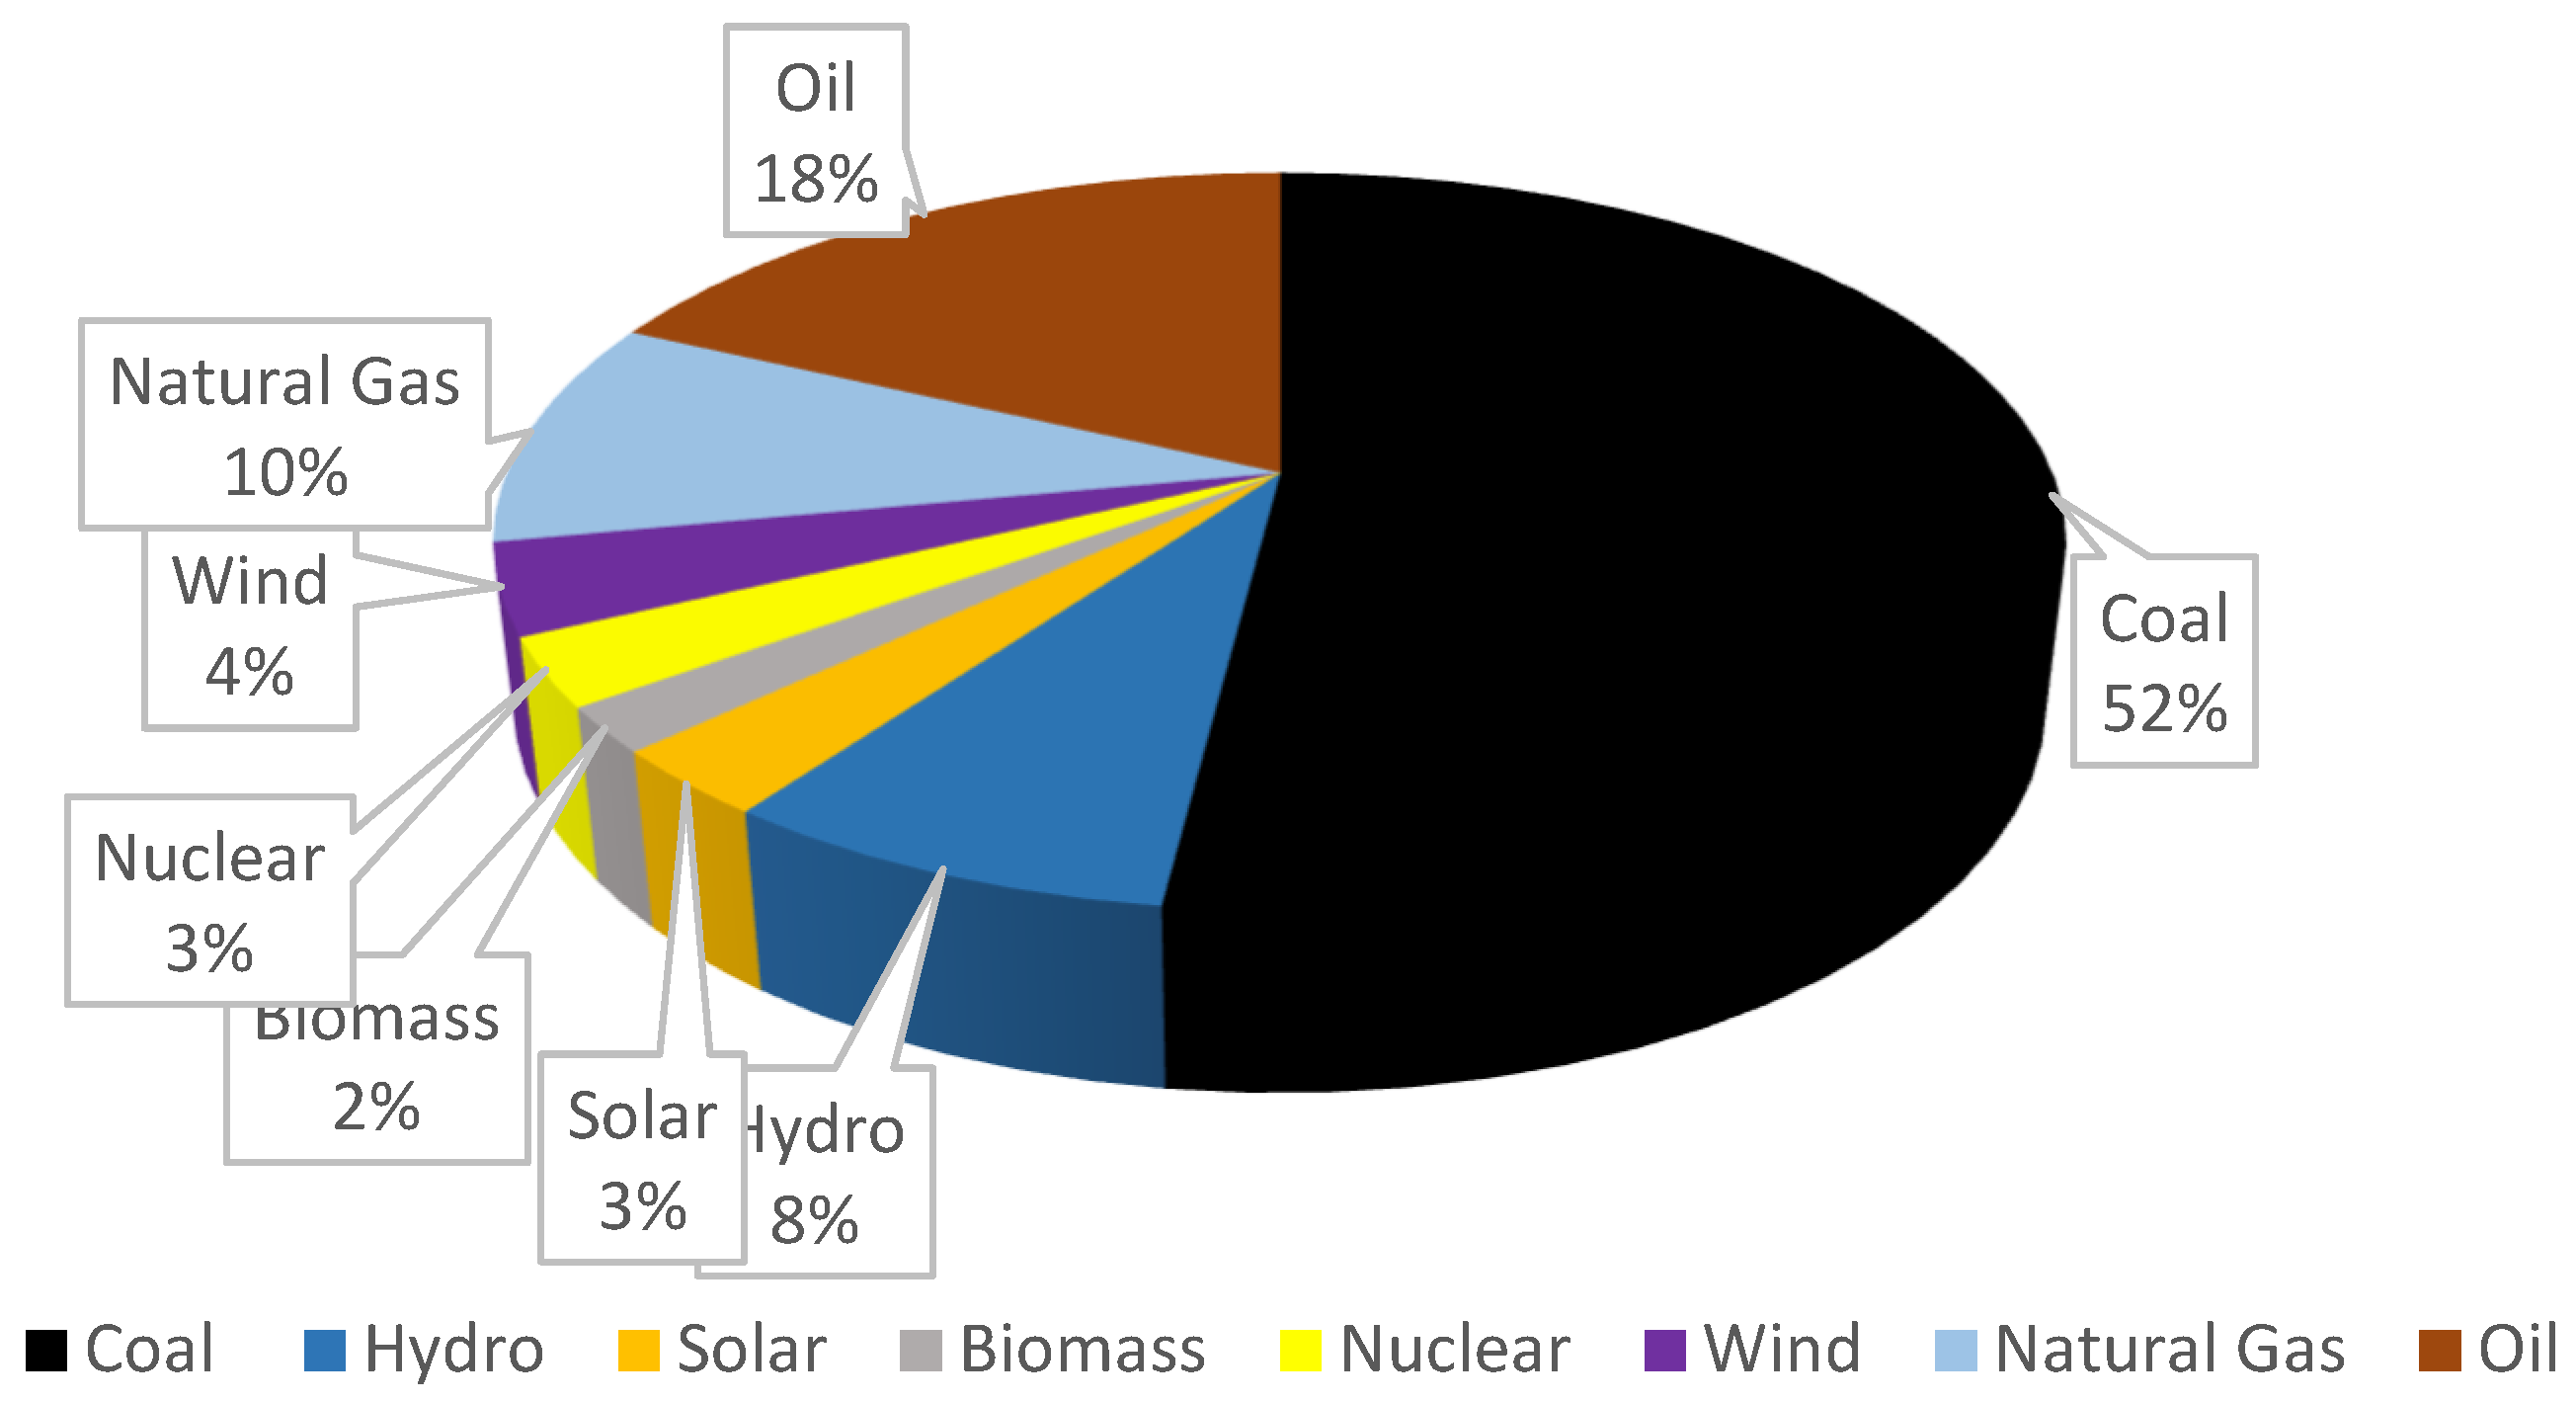
Figure 4.
China’s envisioned Energy mix by 2060 [15].
Figure 4.
China’s envisioned Energy mix by 2060 [15].
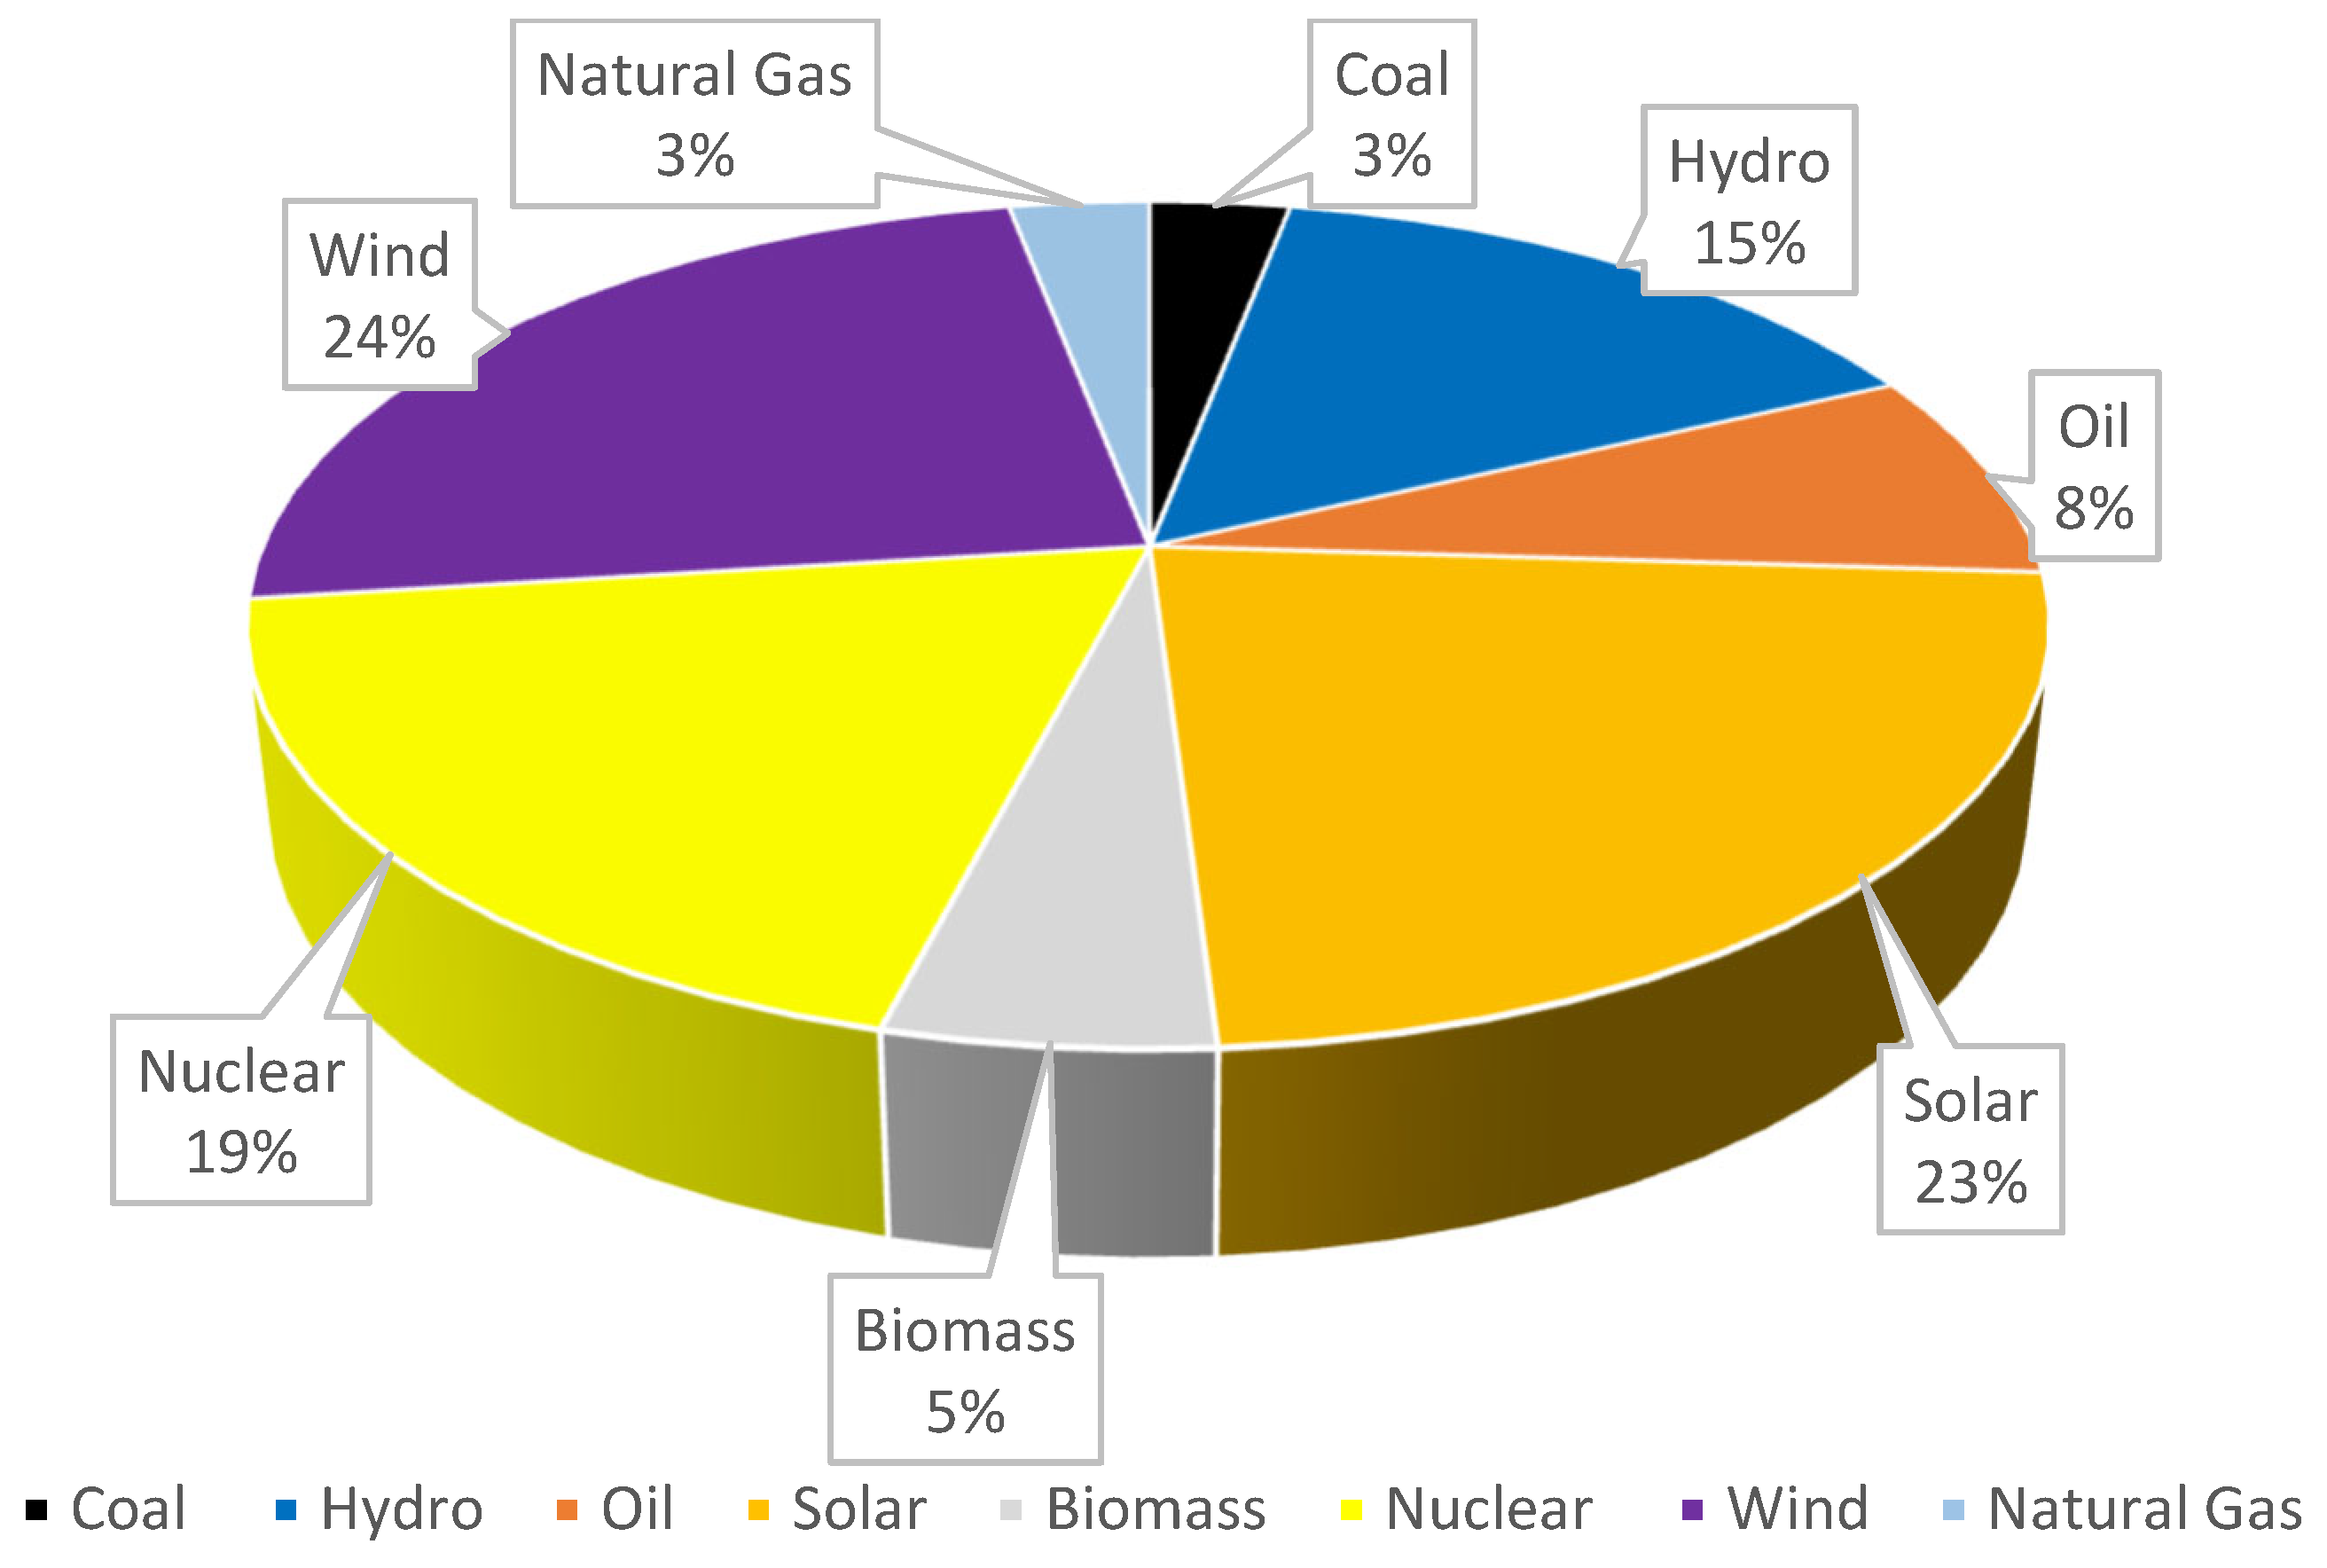
Figure 5.
Russian Energy current mix [24]. .
Figure 5.
Russian Energy current mix [24]. .
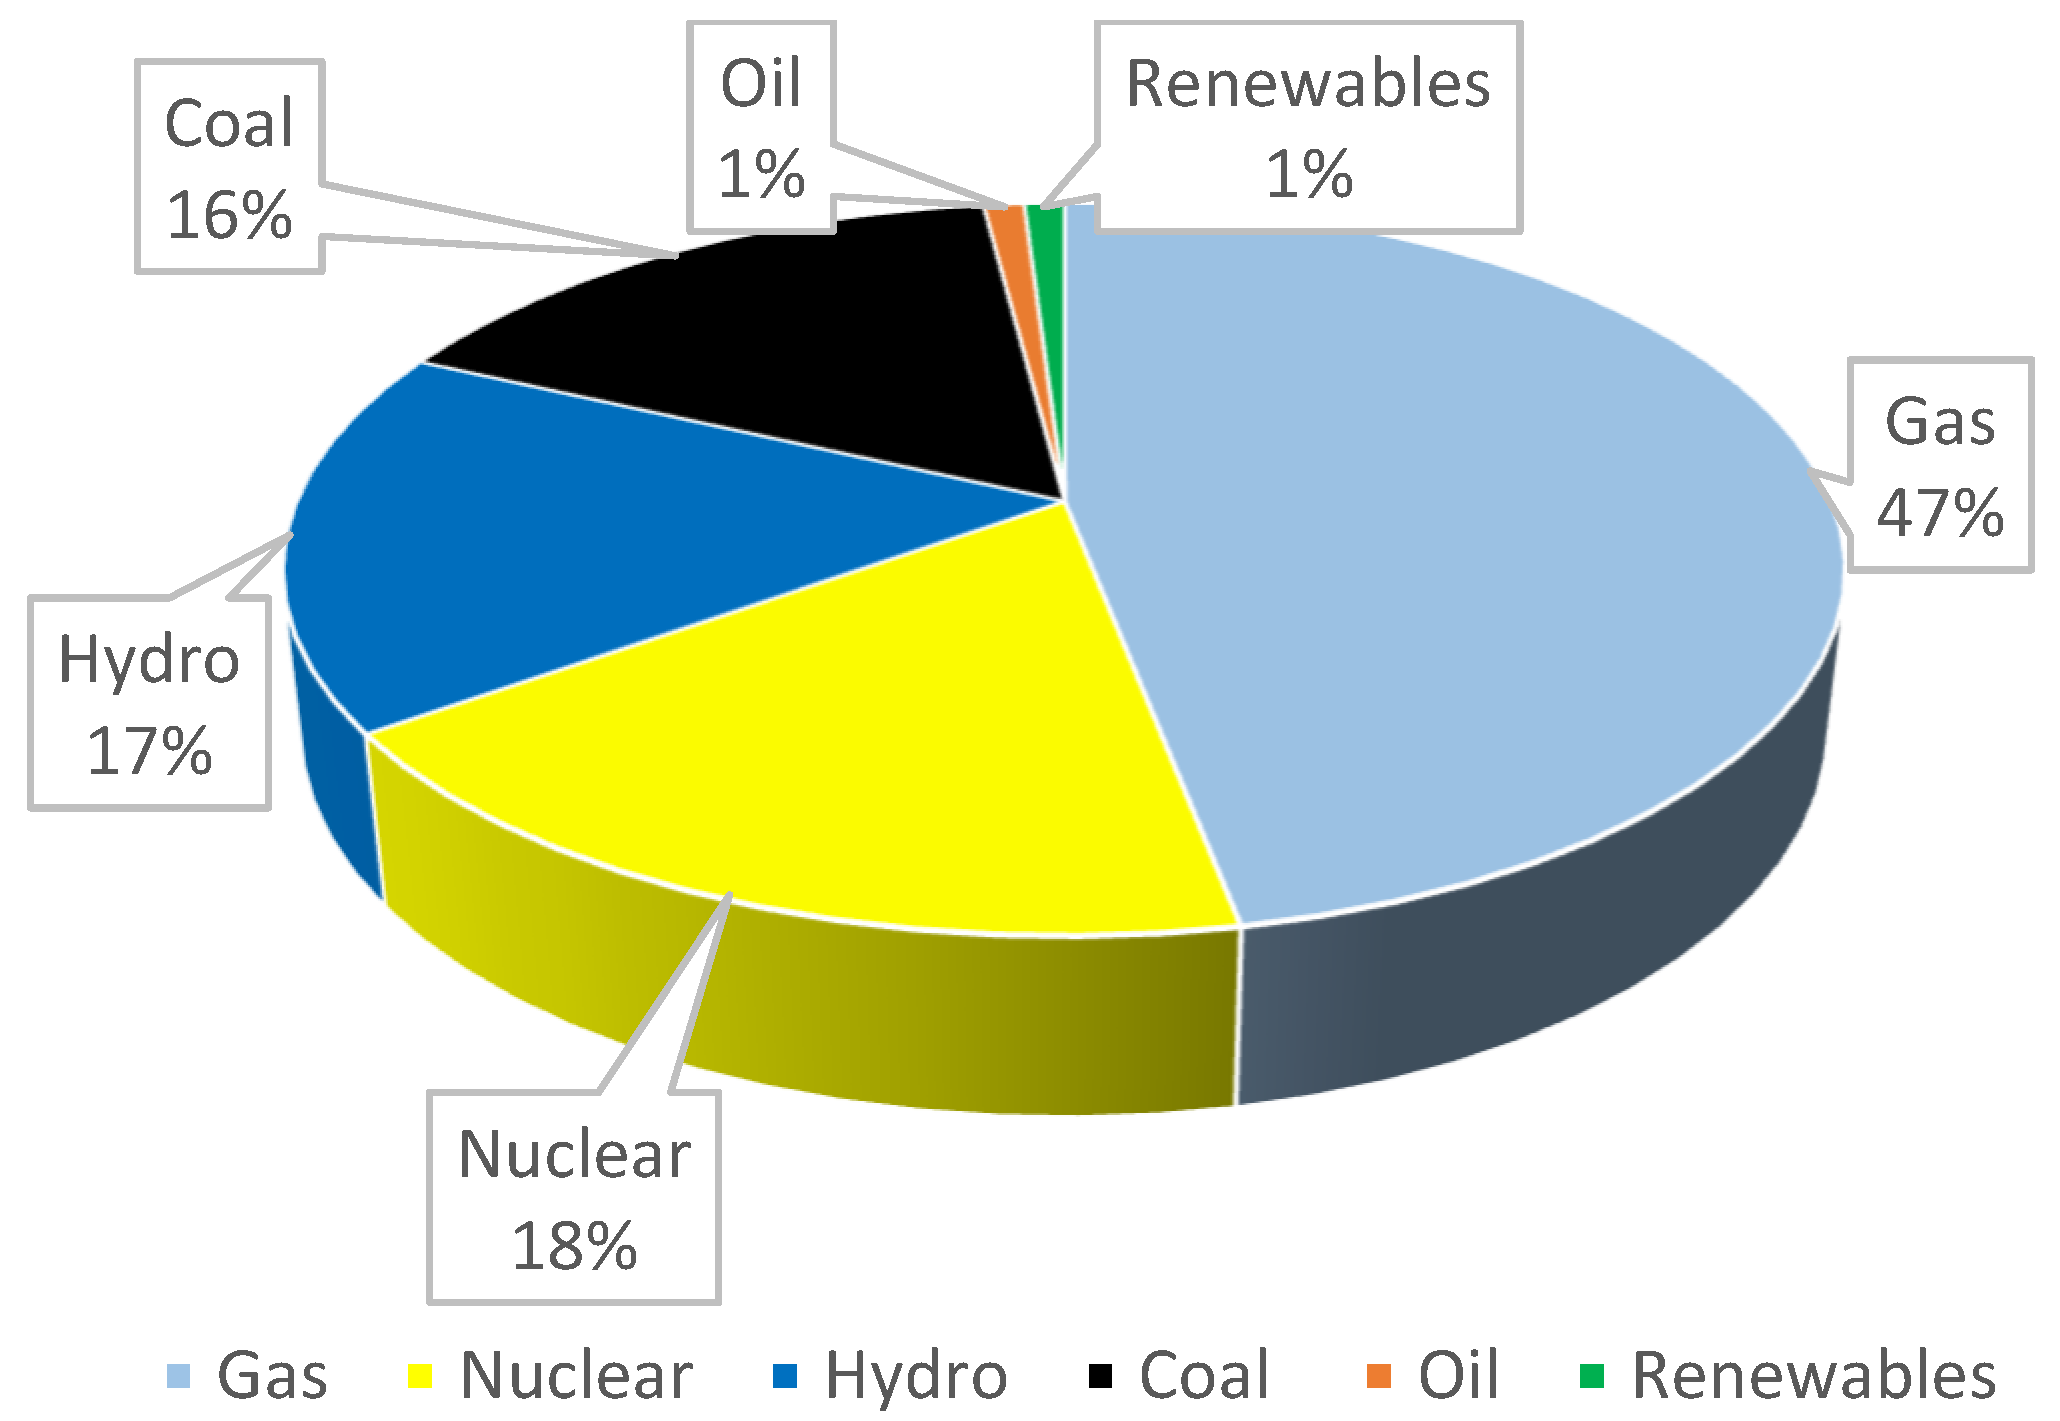
Figure 6.
Russia’s envisioned Energy mix by 2030 [24].
Figure 6.
Russia’s envisioned Energy mix by 2030 [24].
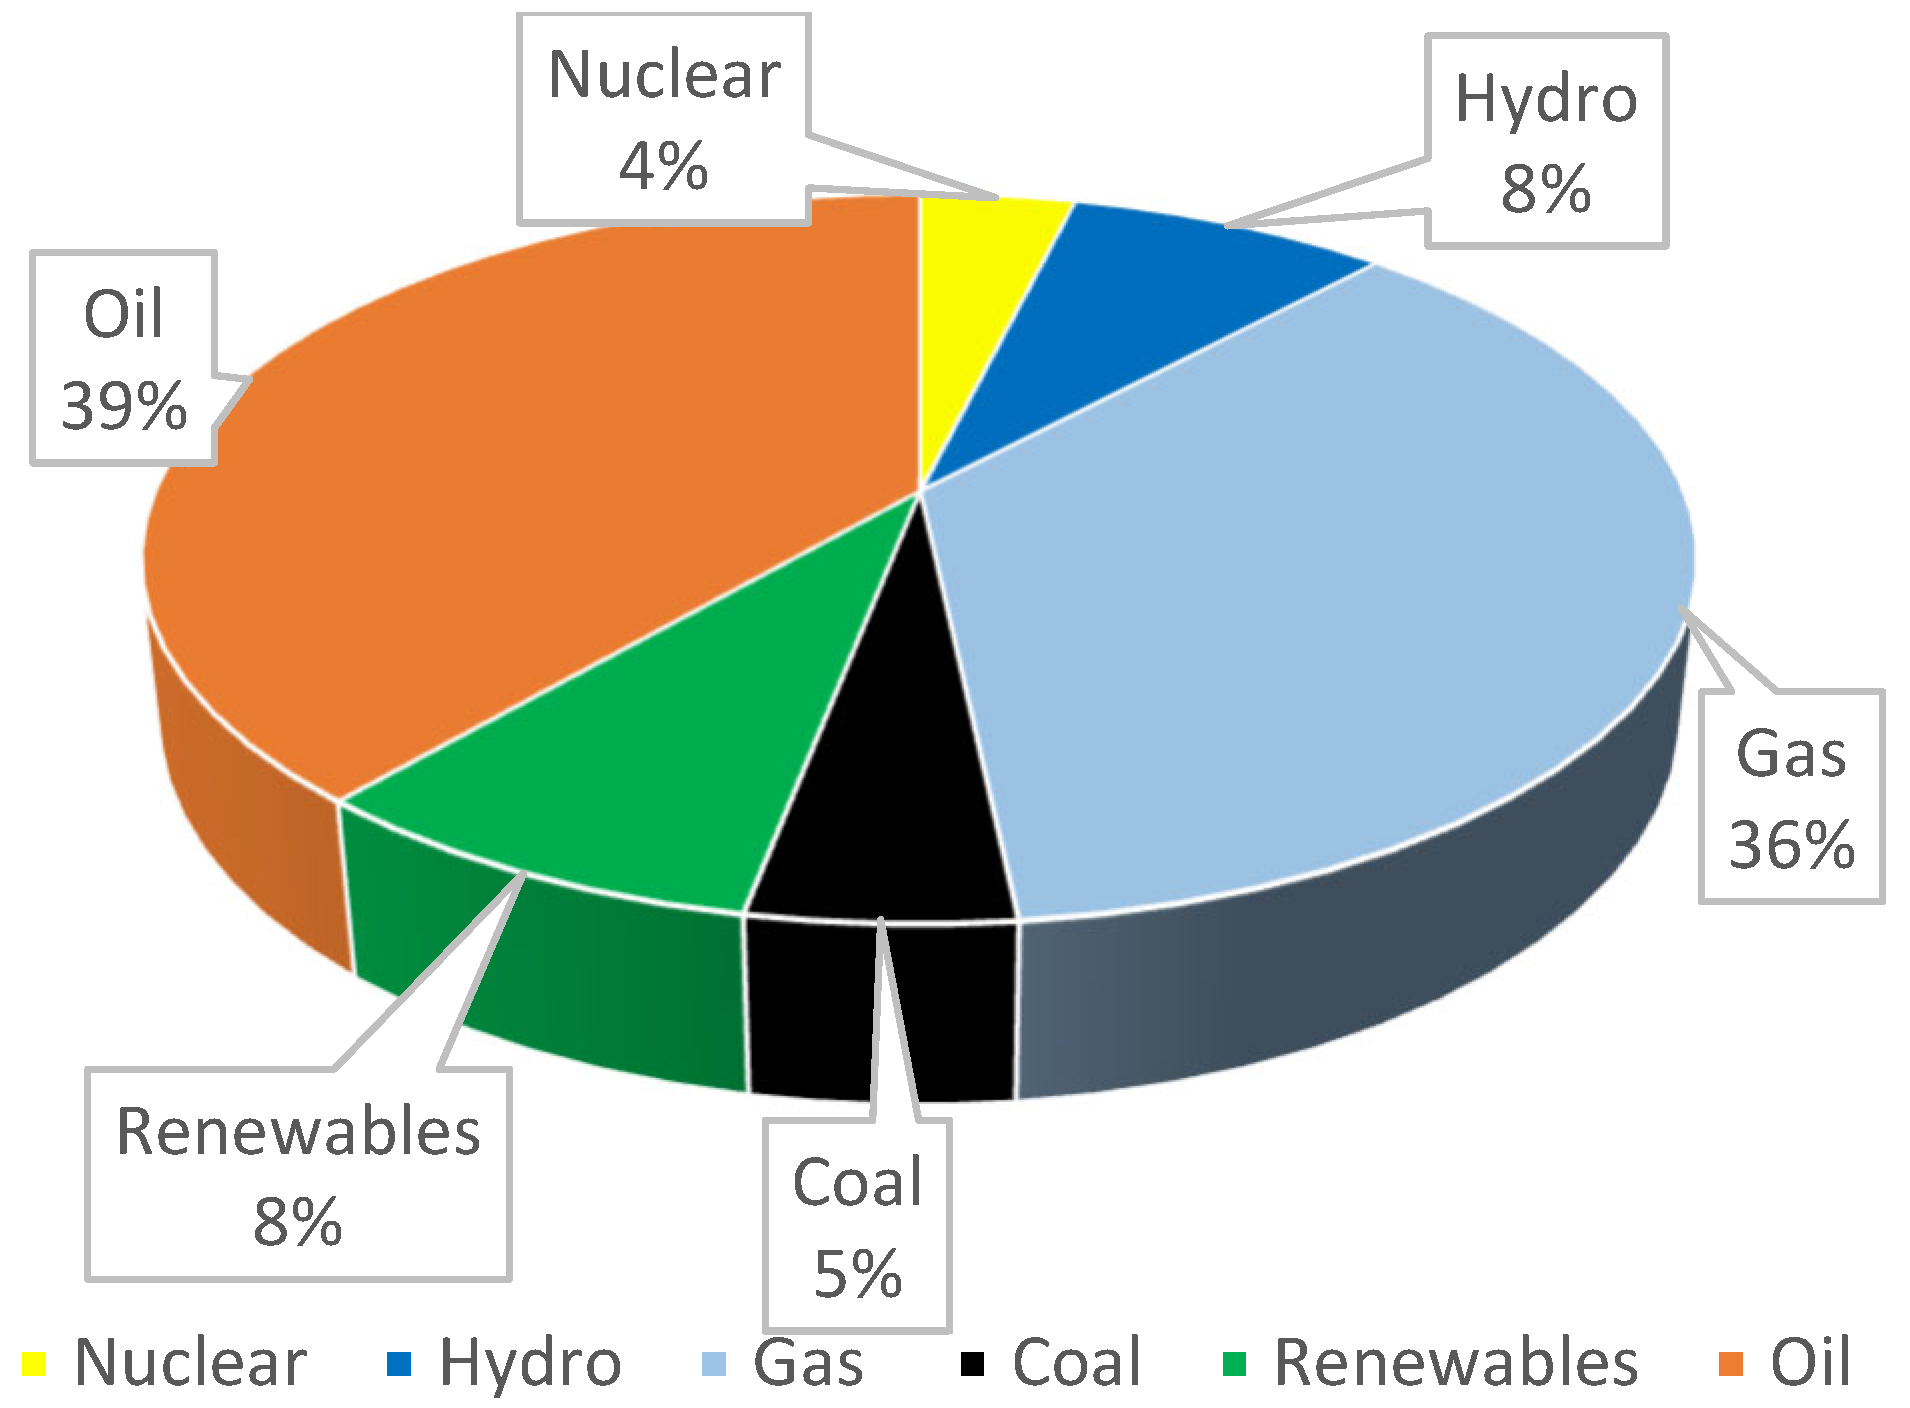
Figure 7.
Brazil’s current Energy mix [28].
Figure 7.
Brazil’s current Energy mix [28].
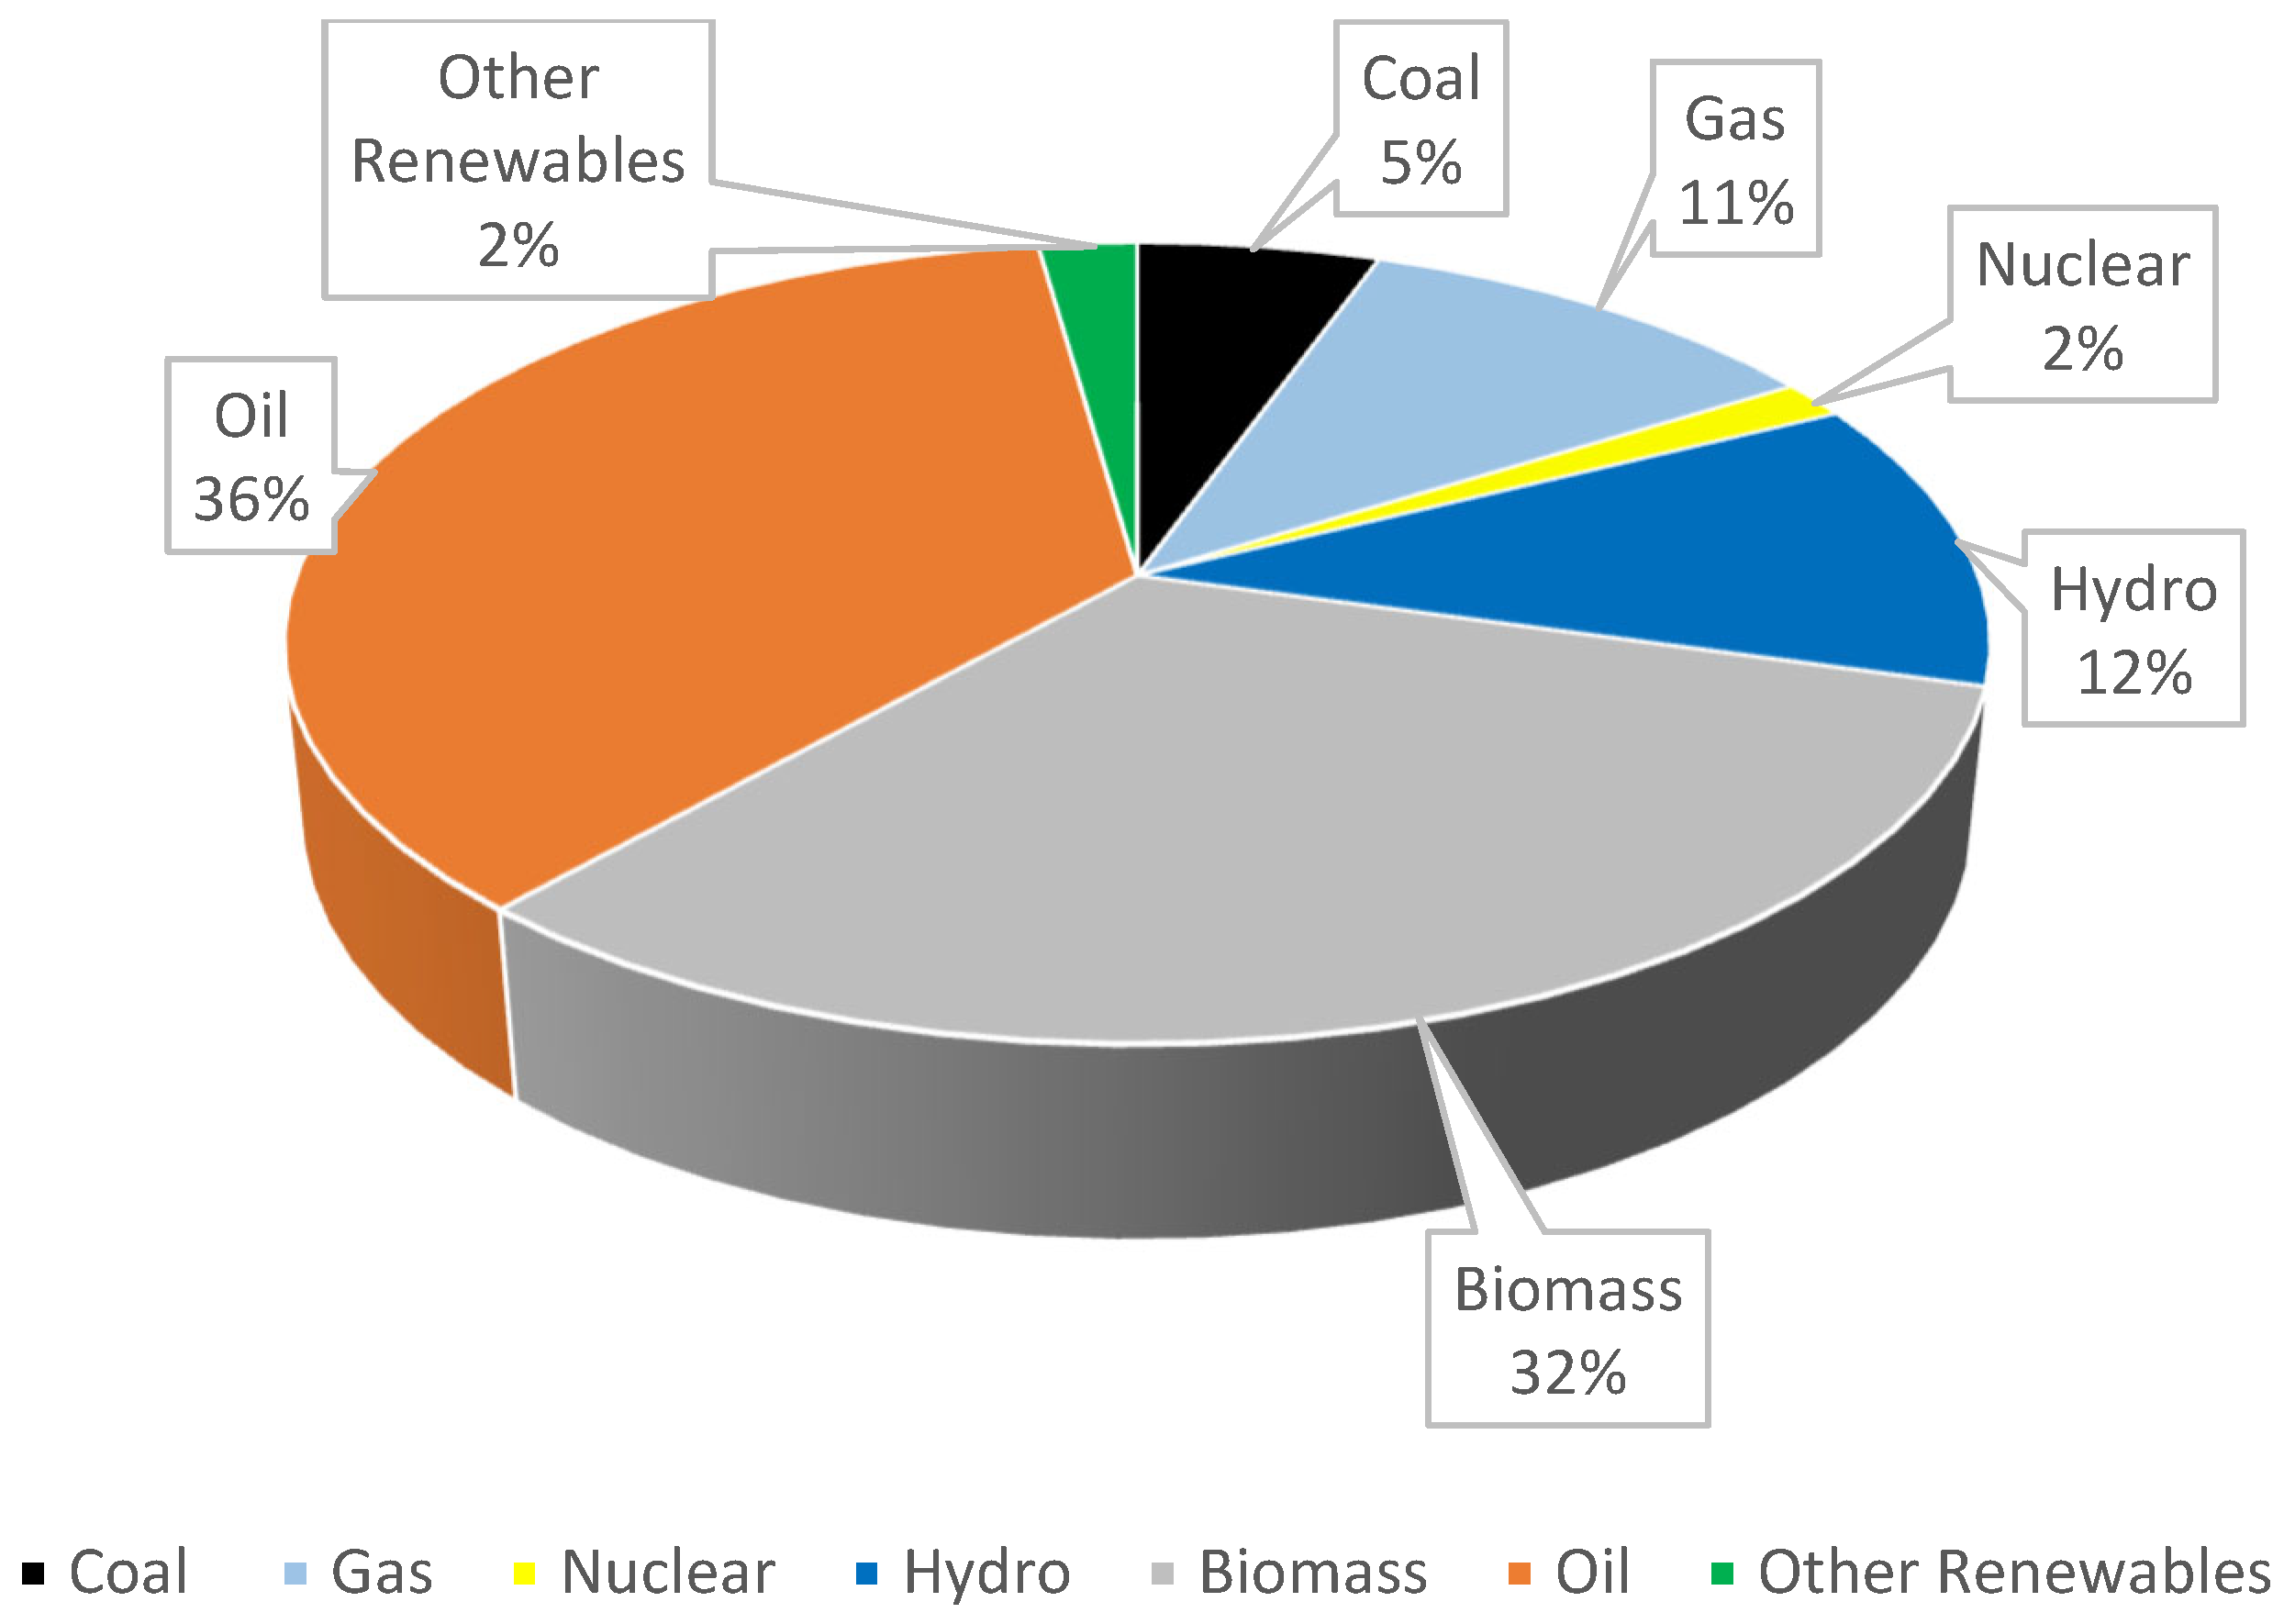
Figure 8.
Brazil’s envisioned Energy mix by 2030 [31]. .
Figure 8.
Brazil’s envisioned Energy mix by 2030 [31]. .
Figure 9.
Uses of Coal [38].
Figure 9.
Uses of Coal [38].
Figure 11.
South Africa’s fossil fuel power stations economical life [40].
Figure 11.
South Africa’s fossil fuel power stations economical life [40].

Table 1.
BRICS countries size, population and GDP.
| Country | Area of Countr (1000 sq.km) | Population (million person) | Life Expectancy in years | Gross Domestic Product (GDP) growth rate % |
|---|---|---|---|---|
| Brazil | 8516 | 208 | 76 | 1.2% |
| Russia | 17125 | 147 | 71.9 | 2.1% |
| India | 3287 | 1269 | 68.7 | 6.7% |
| China | 9600 | 1386 | 76.3 | 4.5% |
| South Africa | 1221 | 59 | 64 | 2.1% |
Table 2.
South Africa’s fossil fuel power plant decommissioning planned (IRP, 2019).
 |
Disclaimer/Publisher’s Note: The statements, opinions and data contained in all publications are solely those of the individual author(s) and contributor(s) and not of MDPI and/or the editor(s). MDPI and/or the editor(s) disclaim responsibility for any injury to people or property resulting from any ideas, methods, instructions or products referred to in the content. |
© 2023 by the authors. Licensee MDPI, Basel, Switzerland. This article is an open access article distributed under the terms and conditions of the Creative Commons Attribution (CC BY) license (http://creativecommons.org/licenses/by/4.0/).
Copyright: This open access article is published under a Creative Commons CC BY 4.0 license, which permit the free download, distribution, and reuse, provided that the author and preprint are cited in any reuse.
Submitted:
07 November 2023
Posted:
08 November 2023
You are already at the latest version
Alerts
A peer-reviewed article of this preprint also exists.
This version is not peer-reviewed
Submitted:
07 November 2023
Posted:
08 November 2023
You are already at the latest version
Alerts
Abstract
This review focuses on the Just Energy Transition (JET) policies of the BRICS member countries, with the aim of finding lessons and possible adoption of some of the key energy policy aspects utilized in other countries for benchmarking for the South African context. Considerations of the present stage of JET in South Africa and the energy-source mix supporting the electricity sector, cognisant of the lifespan and condition of power plants. Analysis of the energy mix revealed that all nations were energy dependent on electricity which was produced by predominantly fossil fuelled power plants with high GHG (concentrating on high CO2 emissions). It was concluded that some of the learnings and lessons learnt from the BRICS countries might be incorporated into a South African energy plan for the transition with options and guidance for formulation of policies. This study will attract responsible environmentally conscious audience that has a commitment and drive to combat global warming and curbing climate change.
Keywords:
Subject: Engineering - Energy and Fuel Technology
1. Introduction
At inception there were four BRIC member countries comprised of Brazil, Russia, India and China which was formed in 2006. In 2010 South Africa was offered to become a member of BRIC, which evolved into BRICS [1]. The new five member countries alliance was formed in the year 2006 as BRICS. South Africa joined in December 2010 to promote peace, security, economic development and cooperation amongst these countries [2]. The main objective is to contribute significantly to improve the socio-economic landscape of these five member countries which has over three billion people. This is approximately 40% of the global population and approximately 25% of the world’s Gross Domestic Product (GDP). The international growth, particularly true in developing countries are positively impacted by the sheer magnitude of the BRICS member countries geodemographic and summated economy [1]. BRICS also assists to curb and soften the adverse impacts during world’s financial challenges in a recession by advocating resilience in commerce [3].
BRICS alliance objectives, advancements and successes of the member countries energy plans, can be objectively measured by the Energy Transition Index (ETI) ratings (with a range from 0 to 100) and the Just Energy Transition (JET) rankings published by the World Economic Forum (WEF). The BRICS countries JET rankings and ETI ratings respectively are Brazil (30, 66), Russia (73, 56), India (87, 53), China (68, 57) and South Africa (110, 48) [4]. These ratings and rankings are a direct correlation to evaluate the robustness and flexibility the JET. For a resilient or robust transformation, the interregnum of JET must maintain the forward transitional momentum in order to achieve dependable, cost-effective and self-sustaining energy system in adversity such as the COVID-19 pandemic the world experienced.
2. India’s Energy Policy
2.1. India’s Macroeconomics
India’s economic growth in 2022, was 6.7% with an anticipated GDP of 5.6% in years 2023 to 2024. Currently India is ranked 59 from 152 countries in the global data country risk index [50]. As a positive spin off from the present regulation of the “Securities and Exchange Board of India” (SEBI), India’s equity market has become world class and attractive as a result of concerted efforts towards regulation and liberalization. The World Bank indicated that India’s country’s equity of the local organisations listed as a constituent of GDP improved from 80.8% of GDP in year 2019 to 97.3% of GDP in year 2020, exceeding China’s percentage of GDP of 83.2% which is exceptional for India [5].
2.2. India’s Energy Policy
The current energy mix of India is comprised of 46% coal, 25% petroleum (and other liquid fuels), 20% biomass and waste, 6% natural gas, 1% nuclear, 1% hydroelectric and 1% other sources of renewable energy as shown in Figure 1[6]. The social impact on the Indian population is a key focus and the energy plan enforces this as a pivotal point to transition harmoniously with respect to the quality of life of their population, especially the low-income rural communities which makes up approximately 700 million people that has been forced to use biomass as fuel to cook their meals [6]. The Indian government’s “Prime Minister, Narendra Modi,” announced India is committed to zero CO2 emissions by year 2070 at the COP 26 meeting held in Glasgow in year 2021 [7].
The country’s new “National Electricity Plan (NEP) of the Central Electricity Authority (CEA)” in draft was published for communal participation which has an appraisal of the detailed electricity capacity expansion plans for 2032 [8]. The predicted expansion of generating power plants by approximately 40%, from 623 GW to 866 GW by 2032. The bulk of the increase of 214 GW is planned to be from renewable energy sources with approximately 69% contribution from solar photovoltaics (PV). An additional of 10 GW, offshore wind power plant by 2032 is expected.
Therefore, the total renewable energy is expected to contribute 60% (approximately, 516MW) of the total electricity supply by 2032. The contribution of fossil fuel electricity production is forecasted to decline by 2032, from 46% to 28%. Gas power plants installed capability is projected to decrease to 3% by 2032. Hydropower contribution of 69GW is also expected to increase to 7% by 2032 as depicted in Figure 2. Nuclear power plant capacity of 22.5GW, contributing 2.5% of the electricity pool [9].
The unavailability of affordable electricity results in poor air quality negatively impacting the health of the communities and the environment. This was exacerbated by the “Covid-19 pandemic” and financially constrained electricity sector. The distribution utility companies resulted in Indian cities to have one of the poorest quality of air globally in the year 2021 [9]. The country with its population of one billion, is the world’s third largest electricity consumer which is fuelled by 71% fossil fuel (coal 46%, petroleum and other fossil fuels 25%) power plants [6]. However, in compliance to the energy policy, India has approved budget and committed to transition towards 50% of renewable energy by 2030 [10].
India has adopted a strategy of planned implementation whereby 38% of the total energy market is from renewable energy sources with emphasis on solar energy technologies [11]. The urgency spearheading the international reaction to climate related change is a fundamental priority which India has committed to. India is seen as a huge participant in the world’s energy ecosystem with energy consumption that increased two times the energy demand from year 2000. Commendable success of electrification connections to meet demands for approximately 900 million citizens was achieved in 2019 [6]. The global Covid-19 pandemic has delayed some progress to energy transition to an environmentally friendly fuel technology to reduce Greenhouse Gases (GHG). However, the pandemic resulted in slow economic growth of 35% in comparison with forecasted economic growth of 50% between year 2019 and 2030 which assist to reduce impact of the delay to transform to green fuels [12].
The sustainable development case supports how India could initiate additional increase on green energy investment to produce a faster peak resulting in a decline in GHG emissions in synergy with zero CO2 emissions targets [12]. This would be a positive impact for speedily attaining “Sustainable Development Goals” (SDG). It is important to reiterate that the economic growth of the country was led predominantly by the nonmanufacturing precinct instead of the electricity dependant industrial and commercial sector. This slowed down the rate of industrialisation and urbanisation, but this is about to change as a population 270 billion people are destined to be urbanised in the next 20 years giving rise to an exponential growth of the infrastructure to support this parabolic increase [12]. The expansion would also be supportive of the ILO, 2015 policy as huge infrastructure projects will increase the country’s labour requirements, thereby increasing the employment rate.
Over the past two decades, the power generation mix for India’s sustainable development plan of cost efficient and more affordable renewable energy of 450 GW by 2030 is on target [6]. In order to meet the planned targets of moving forward with new power plants (fossil fuel or renewables); design considerations of robustness, reliability, dependability, flexibility and cost effectiveness will be factored in [13]. Currently India’s electricity grid and its fossil fuel power plants meets the majority of India’s needs, supplemented by hydroelectric and gas power plants to meet the grid stability more especially during power swing conditions. This ensures the quality of power supply of voltage, frequency and reactive power control to sustain and protect the power system from failure. Battery energy storage systems is ideal to render interim leeway or resilience that India requires meet the country’s solar driven midday electricity maximum production. India’s earlier evening maximum load requirements of which, planned capacity of 140 GW from Battery Energy Storage System (BESS) [6].
In conclusion India’s commitment to their JET plans are further reinforced by G7 countries, including Norway, Denmark and the European Union (EU) “Just Energy Transition Partnership” (JETP) will financially empower India to reduce climate changing emissions from power production. India reiterated the country’s commitment to assist to eradicate global warming by achieving the following just energy transition objectives/goals [6].
- “Target 500 GW of non-fossil electricity capacity by 2030”
- “Renewable energy contribution of 50% of its electricity demands by 2030”.
- “Forecasted decrease of CO2 emissions by one billion tonnes from present to 2030”.
- “Decline by 45% of the CO2 intensity of the economy by 2030, referenced with 2005 emissions”.
- “The zero carbonisation goals by 2070”
3. China
3.1. China’s Macroeconomics
The real GDP growth was 4.5% in year 2022 and it is predicted to be 4.8% in year 2023, while consumption (use of goods and services) was 6.5% in year 2022 (Macroeconomic Outlook Report: China, 2023). The “World Bank’s conducting business ranking” of China in year 2022 is 31 of 190 countries. China’s electrical and electronic trade magnitude is forecasted to grow at a “Compound Annual Growth Rate” (CAGR) of 11.6% from year 2021 and 2025, to a targeted monetary amount of $3.3 trillion in year 2025 [14].
3.2. China’s Energy Policy
The current energy mix of China comprises of 52% coal, 3% solar, 2% biomass, 10% natural gas, 3% nuclear, 8% hydro, 4% wind and 18% oil as shown in Figure 3. China’s planned transition by 2060 would result in 3% coal, 23% solar, 5% biomass, 3% natural gas, 19% nuclear, 15% hydro, 24% wind and 8% oil by 2060 as depicted in Figure 4. With the Accelerated Transition Scenario (ATS) and the Announced Pledges Scenario (APS) China has been adding nuclear (70 GW) (20 new reactors) and solar (110 GW) capacity to cater for the requirements of 33 million homes [15].
China is a major player in the world energy markets since it is the world’s biggest energy consumer since 2009 [16]. The country is ranked first on the world’s carbon emissions ranking and is one of the world’s leading energy user and CO2 producer which makes up 33% of the worlds’ CO2 discharge [15]. The power producing plants is the origin of approximately 90% of the country’s GHG, highlighting that energy plans are imperative for carbon neutrality [16].
China believes in collaborative engagements with the IEA and other countries in the common vision of eliminating carbon emissions. The spin off from achieving nett zero carbonisation is envisaged to foster China’s sustainable economic and environmental development goals yet cultivating prosperity in improving technology leadership resulting in sustainable economic growth led by innovation [16]. One of the extremely noteworthy achievements and contributions globally, is that China produces 70% of electric vehicle battery demand. The rapid rate of solar plant deployment has hedged or counterbalanced in terms of reducing their environmental impact of being the second largest consumer of oil globally. It must also be noted that China is the biggest supplier of steel and cement which makes up more than 50% of the global demands. The impact is that the carbon emissions generated by these plants are astronomical and are deemed to be more than the European Union’s carbon emissions [16].
The major contributors of the country’s CO2 emissions are the electricity utility area whereby 48% of CO2 production are from energy and industrial activities, 36% is from the industry (steel and cement), 8% is from the transport and 5% is from the infrastructure (buildings). China has a five-year plan termed “Modern Energy System” which was formulated to reduce the energy intensity by 13.5% (from 65% to 51.5%) that will result in the reduction of CO2 intensity by approximately 18% and a reduction in integrated energy systems with the focus to grow the renewable energy market percentage of the whole energy consumption to 20% by 2025 [17]. It is imperative for China to achieve these short-term policy targets, as it will show the IEA and global authorities that the country’s CO2 emissions from coal was on target in year 2020 of achieving 15.9% non-fossil fuels of and a modest decline will be reached by the year 2030. China's pledge in 2021, at the “United Nations General Assembly” (UNGA) reiterates the country’s determination to end the construction of coal-fired power stations in solidarity for greener economy in the energy sector. In the association with the economic growth forecast, it is predicted that the energy demand will not increase at the same rate as the economy due to efficiency gains of the energy transition to cleaner fuel sources resulting in improved air quality [16]. The future energy mix of China will be dominated by solar and hydrogen of at least 60% of the total energy requirements by the year 2045. The emphasise will be to reduce the dependency on fossil fuels especially coal by 80%, oil by 60% and natural gas by more than 45% by 2060 [16]. China is in favourable financial position to fund the transformation to clean energy and infrastructure with a committed budget of $640 billion to the year 2030 and $900 billion from the year 2031 to the year 2060 [15]. In comparison, the annual energy investment’s share of the country’s “Gross Domestic Product” (GDP) was at an average of 2.5% in the year 2016 to 2020 which will substantially decline to approximately 1.1% by the year 2060 [17].
In addition, another target is to decrease the CO2 emissions in the building sector by at least 95% of the current emissions by the year 2060 through electrification, solar powered climate control (air conditioning, and innovative energy reduction concepts in building designs) to make buildings less energy intensive [15]. Synchronising the level of the emissions’ maximum, also the rate of emissions reduction at the instance that the maximum is attained are paramount for the success of China’s ultimate objectives of zero CO2 emissions. China is fortunate to have the technical knowledge, economic strength and sound policy to accomplish the efficient green energy transition by the year 2030 [18].
The energy policy’s success would result in rapid reduction of fossil fuels utilised in the electricity generation by fostering the use of enhanced, readily available less CO2 emitting renewable fuel sources that’s more efficient. The electricity production plants carbon produced in the year 2030 would be approximately 2gigatons which approximately one fifth less than the Accelerated Transition Scenario (ATS). Cumulative investments in the ATS are similar to those in the Announced Pledges Scenario (APS) and investment funding requirements is not a constraint for China [16]. Prosperity in some regions in China did not realise the gains from the economic expansion however, renewable sources supply chain together and developing green technologies will enhance the country’s economic growth [16]. The energy transition is welcomed and supported by labour as it is thought to have a potential of increasing the employment rate. Employment growth may increase significantly if China is successful in securing part of the increasing renewables energy requirements of countries that are not skilled in these emerging technologies. The advantage of increasing the range of the country’s net zero CO2 goal to include all GHG would result in the energy sector achieving a net zero carbon emissions much earlier than the year 2060 [16]. This will cater for the other industry CO2 emissions that are not easily dispensed. The government acknowledges that accelerated success in reducing carbon emissions through to the year 2030 is critical. Solar PV and wind energy of approximately 1.4 TW which equates to approximately a fifth larger than the year 2050 APS, fostering the compliance to the Paris Agreement [15].
In the Announced Pledges Scenario (APS), 40% of the country’s electricity generation carbon emissions reductions by year 2060 is dependent on technologies that are currently being prototyped or in testing and under demonstration phases that should accessible as scheduled to replace present fossil fuel generation. It is envisioned that this would eradicate CO2 emitted from the country’s heavy industry (iron, steel, coal, etc.) of approximately 15% of the projected worlds CO2 financial allocation has a probability of 50% to limit the average planetary increase in temperature to 1.5°C [18].
4. Russia
4.1. Russia’s Macroeconomic
The real GDP growth was 2.1% in year 2022 and it is predicted to be 1.2% in year 2023 [19]. Unemployment is at a record low of 3.5% and forecasted to remain low till year 2026 with the challenge of the Russia-Ukraine war. Russia's current account surplus is declining rapidly to approximately 73% in the first quarter of 2023. However, increased oil and gas exports was at record high in year 2022. The Russian ministry reduced its forecast by 50% for the present unused budget in year 2023 from $158b to $87b with a reduced the commerce budget surplus prediction from $228b to $152b [19].
Russia (prior to the start of the Russia-Ukraine war) as in the case for numerous resource (oil, coal and gas) affluent and electricity exporting countries, JET results in recently sparked extended period impediments. Challenging the feasibility of the country’s financial status, that is extremely contingent on “hydrocarbon export” income. From year 2000, Russia has controlled to raise “energy-resource” exports substantially between year 2000 to 2005, exports increased by 56%. Providing a fast growth of the economy and reinforcing Russia’s stance on the global arena as an “energy superpower” [20]. The worldwide economic recession in 2008, energy resources export was minimised unfortunately. After the recession years of 2011 to 2014 which resulted in inflated oil costs as a result of poor international trade demand and declining “petrodollar” income adversely impacted GDP decline with an oil price of $110 per barrel. Income from oil and gas global sales income decreased from high prices of year 2008 to 2012 compounded by decreasing prices of hydrocarbons. However, in 2017, hydrocarbons supplemented 25% of GDP and 39% of Russian planned income, 65% export revenue and 25% of total funding in Russian economy [46]. Global renewable energy objectives and the transition towards zero carbonization is rendering a significant decrease of hydrocarbon export revenues in Russia and exacerbated by the Russia-Ukraine war.
4.2. Russia’s Energy Policy
In the primary energy consumption, production of electricity is mainly from gas which accounts for 47%, coal accounts for 16%, hydro accounts for 17%, nuclear accounts for 18%, oil accounts for 1% and renewables accounts for 1% as illustrated in Figure 5. The country’s tactical behaviour with respect to JET is paramount for Russia and the planet. Numerous constituents of macroeconomics, institutional frameworks in the power production industry, climate change and technology plans or policies exist which defines the federations strategy towards the energy transition [24].
Figure 5 illustrates the envisaged energy mix by 2030 with successful execution of the Energy Strategy of Russia (ESR, 2010) with from gas 36%, coal 5%, hydro 8%, nuclear 4%, oil 39% and renewables 8% [24]. Russia ranked 4th on the world emissions rankings and is ranked as the fourth-largest primary energy consumer globally. Russia’s “climate change” related policies is ongoing to improve with opportunities to bridge the gaps and develop the required strategies to improve climate-energy interface effectiveness [22]. Russia is committed to the “United Nations Framework Convention on Climate Change” (UNFCCC) and the “Kyoto Protocol” (Russia had a set CO2 aspiration of 5% below the 1990 level for the first commitment period between 2008 and 2012 which was achieved). Furthermore, the country supplies 10% of the world’s energy fuel sources, 5% of the international electricity usage and 16% of foreign commercial dealing in energy [22]. Russia currently, is classified as the biggest largest supplier of power fuels (ranked first in gas, second in oil, and third in coal [24]. Cognisant of this fact, the country’s planned intent with JET is mutually beneficial for national and international outcomes.
The 2022 Russia-Ukraine war has unfortunately negatively affected the global energy transition with financial and trade sanctions imposed on Russia by the “European Union (EU) countries, United Kingdom (UK) and United States of America (USA)”. President, Putin has halted the supply of coal, oil and gas to the countries that were dependent on these supplies as a result of the sanctions imposed on Russia. Consequentially this is causing an energy crisis mostly for the EU countries while the USA is using their oil reserves to dampen the crisis and prevent the increase of energy cost in their country. Other countries have no choice but to refurbish and recommission their fossil fuel power plants to try to curb their energy crisis challenges. This crisis has fortunately resulted in a positive spin off, with short-term contingency plans to soften the impact to the populations from the energy crisis, governments are rapidly initiating longer-term actions. The United States of America (USA) “Inflation Reduction Act (IRA)”, the European Unions (EU) “Fit for 55 package and REPowerEU”, Japan’s “Green Transformation (GT) programme”, Korea’s intent to expand the portion of nuclear and other renewable sources in their energy mix, and renewable aspiration goals of India and China [20].
Internationally the “energy sector” is experiencing a drastic switch due to a change in the requirements for “hydrocarbons” within 20 years [20]. The “Energy Research Institute of the Russian Academy of Sciences (ERI RAS)” projects with the unavoidable reshaping of the intercontinental trade and declining requirements for the country’s “hydrocarbons,” the foreign revenue from oil and gas to the Russian GDP will be reduced by 18% between year 2015 to 2040 [20]. The consequence of “climate change” mitigating plans would adversely impact the countries financial stature unfortunately. A decrease of economic growth results in growth-less national energy needs, fixed sales cost, and decline in capital available for latest technology implementation [20].
The long evolution of the Russian electricity sector has eventually transformed as having many privately and state-owned companies [21]. “State owned companies” are in majority (approximately 70%), in electricity production and in the power network. Russian government owns the “high voltage” power network of 220 kV and above which Russia defined as “Transmission Network” and majority of the electricity distribution networks. Approximately 60% of country’s electricity is produced from combustion of fuel sources [21].
Russia pledged their commitment to the “Paris Agreement” in the year 2016 which included the development (by year 2020) of a plan for “socio-economic” expansion with a reduction of GHG by 2050 [22]. To soften the adverse impacts of the country’s energy resources to the compliance of the “Paris Agreement”, a co-ordinated strict legislative methodology is required to mitigate “climate change” effectively. From year 1998 to 2008, GHG emissions increased to 16% over 11 years, which is considerably at a decreased rate compared to GDP. Since the year 2017, the electricity production decreased its CO2 impact (g/CO2 per kWh) as compared to countries such as, Australia, China, India, Poland, Germany Kazakhstan, the Arab countries of the Persian Gulf, the USA, Chile, and South Africa [25,46]. This is as a result of approximately 35% of electricity generated from nuclear and hydropower plants with minimal CO2 emissions [25]. Gas power plants contributes to 48% of the electricity capacity of Russia enabling the energy transition from petroleum and fossil fuelled electricity production (gas substitution into fossil-fuelled electricity production expanded by 5% from year 2006 to 2017) [25]. The “Paris agreement and the Addis Ababa Agenda 2030” adversely impacts the country’s “fossil-fuel” international trade (natural gas and coal trades substantially affected by the zero-carbon emissions agreement globally by year 2050). The short-term exports affected by the Russia-Ukraine war with export and financial sanctions against Russia. Russia is confronted by the impediments of international commerce of its “energy-intensive” products. Considering this point and low foreign revenue, is rendering the national zero CO2 goals to be the lesser priority as it’s challenging to attract investment with imminent national recession and enforced embargos. This impacts the energy cost negatively with huge socio-economic implications for the Russian population. Cognisant of this information substantiates the reasons for Russia’s isolation from the global decarbonisation trend for many years [22].
Russia is proactive in regular climate change impacts analysis on the Russian ecosystems and economy. Analysis shows that global warming may result in few favourable effects on the country’s financial status with larger agricultural growth requirements and declined need for heating with some conceivable adverse effects that will arise during harsh weather conditions and permafrost liquefying, impacting the energy architecture [26]. Russia is focusing on aggressive and brave energy plans of improving energy efficiency as a result of increased interest in energy efficiency and energy saving from academic researchers and practitioners in Russia [27].The studies also showed that social obstacles impede the transformation towards an energy-efficient economy in the urban small businesses region as a result of disregard for recent energy-efficient technologies, and from social hierarchical behaviour in large corporations creates social barriers.
To defeat these hurdles, organisations are required to introduce positive dynamics and internal educational plans to introduce “Energy Management Systems” (EMS) [27]. Increasing the contribution of renewable energy and revamping the energy industry showing that they are a responsible nation. The quantity of electricity needed to yield a unit of “Gross Domestic Product (GDP)” (in buying capability equivalent terms) is, currently more than 200% higher than the “International Energy Agency (IEA)” average, which reemphasises the major inefficiencies that must be remedied. Russia has a mammoth capability for energy efficiency with a specialised potential of approximately 260 million tonnes of oil equivalent (Mtoe) [27].
The capability to materialise this in the future years will configure the country’s energy equity, influence the upstream electricity production, thermal industry funding requirements, industrial edge and the availability of energy fuels for international commerce. Advancement in energy efficiency, is conducive in relieving the effects of high energy price for the citizens. Energy efficiency can encourage a move towards “cost-reflective pricing” by inviting funding into revamping generation, transmission and distribution to reduce prices to end users [22].
5. Brazil’s Energy Policy
5.1. Brazil’s Macroeconomics
The real GDP growth was 1.2% in year 2022 and it is predicted to be 1.6% in year 2023, while consumption (use of goods and services) was 3.2% in year 2022 [23]. The World Bank’s conducting business ranking of Brazil in year 2022 is 91 out of 190 countries. There was a significant increase in international tourist in Brazil by 107.5% in 2021 despite the Covid-19 pandemic and is predicted to grow by 61.5% in year 2022 to 2023 [23].
5.2. Brazil’s Energy Policy
Brazil has the greenest energy mix with the usage of renewable energy of hydro, wind, solar, bioenergy and geothermal power plants which contributes to 46% of the country’s energy requirements [28]. After China and Canada, Brazil is the third largest hydroelectricity producer globally. Brazil’s hydroelectric sector almost has an unlimited potential which has not been fully exploited given that the country has the capacity to construct numerous hydroelectric power plants [29]. A total electricity demand of 77% is produced from hydropower (Hydro is 12% of the total energy source but used as a major source to produce electricity) the rest being generated from coal, gas and other renewables in Brazil [29].With the dependency on hydropower puts Brazil in a vulnerable to potential power supply shortages in drought years, as experienced during year 2001 and 2002 when the country had severe droughts which resulted in energy supply crisis [29].
The energy mix is depicted in Figure 7 where oil accounts for 36%, biomass accounts for 32%, hydro accounts for 12%, gas accounts for 11%, coal accounts for 5%, nuclear accounts for 2%, other renewables (wind, solar, etc.) accounts for 2% [28]. Brazil is the 5th biggest globally, by ground area and rated second amongst the top ten economies by magnitude of “Gross Domestic Product (GDP)” [30]. Brazil is a major ally in commerce and at times a competitor of the USA, with respect to energy fuels (E.g., Petroleum and ethanol). The country was massively reliant on imports for its energy resources. Brazil has become an energy exporter which produces more energy than it consumes after 35 years of policy development to promote domestic energy resources (hydro, fossil fuels, biomass, gas, wind, nuclear, and solar) [28]. Brazil is the tenth biggest producer of electricity globally and the eighth leading world user of energy [28].
Brazil’s energy security was significantly challenged throughout its history. Major energy sources were inadequate, ethanol fuel for cars (in the beginning of the 1990’s), droughts resulted in reduced hydropower (in the beginning of 2000’s) and expecting the provincial energy from Bolivia and Argentina for natural gas would improve energy security [30]. Bolivia's choice to nationalize their oil and gas sites surprised Brazil, as a major setback, particularly as Brazil did not interpret the country as a dominion. The nationalization specifically shocked “Petrobras”, which was Brazil’s oil company that had approximately $1 billion of financial stake in Bolivia [30]. Argentina added to the crisis by implementing policies that restricted the country's capability to achieve its natural gas foreign commerce agreements. Depending on providers for a reliable energy source was identified as risk to Brazil, however, by adopting better enabling strategies to encourage energy production and diversification [30]. Brazil succeeded in making momentous growth by energy security advancements. Argentina had nationalized its energy resources as it recognised “European and American” organisations as wings of EU and U.S. dominion. Brazil, as one of the colonies, did not anticipate an associate “Latin country” to annex Brazil’s partnership, as Brazil did not deem the country as a dominion rule with the likes of the United Kingdom, Spain and Portugal [30]. Incentivised reduced borrowing rate and funding plans, together with fair prices was established by electric power bidding initiatives resulted in the wind power industry to expand substantially in the country.
The solar source for distributed generation is becoming an effective energy source. The vast use of flexible fuel cars renders ethanol a widely used fuel. There’s a blend mandate of 27.5% on the gas including the opportunity of operating on 100% ethanol coupled with biodiesel mixing plans in year 2018 [28]. Natural gas is a huge alternative and can be a transition fossil fuel by year 2050 with the focus to decrease the usage of fossil fuels. The “Climate Transparency Policy Paper: Energy Transition in Brazil” provides the generic energy plan of the country and determines initiatives, gaps and prospects to accomplish “Greenhouse Gas (GHG)” emission alleviation objectives, providing “policies and legislation” to sustain a vigorous evolution of the energy segment [28]. Brazil’s renewable energy resources makes up 46% of entire primary energy resource and 85% of the electricity generation. Currently, non-renewable energy sources comprise of approximately 57% of full primary energy supply and 32.7% is utilised in the transport industry [28]. Brazilian energy intensity has been constant from the year 1990, below 4 TJ / million US$ [28]. Brazil’s entire GHG production is approximately 1.6 billion tons of CO2 and ranked 12th on the world emission rankings [47]. The power segment investments was in renewable energy from year 2000 to year 2013 due to the structural reform in the energy sector. This led to change in Energy Policy which was more focused on the production of electricity by the IPPs and thus an increase usage of renewable energy from 48% to 51%. Wind power was the majority investments in the power sector between the year 2014 and 2016. Solar energy investments augmented considerably to approximately 35% of overall funding in the power segment by year 2016 [28].
Funding authorized and approved for year 2021 included fourteen Solar Photovoltaic (SPV), eight wind farms, two hydropower and one biomass fired thermo-power plants, increasing a further 880MW capacity into the “National Integrated System” (SIN) [31]. Figure 8 shows that future energy mix would improve to greener energy mix with the additional capital injection by the Brazilian government executing their energy transition strategy. A total of $4.5b and 4040 undeviating employment are projected to be formed which is positive in compliance to the ILO 2015. Wind power sprouted as a substitute aimed at the expansion of the electricity sector subsequent to the energy emergency of year 2001 and is currently the ninth leading international volume (13 GW), with an average capacity factor of 40%, representing 8% of Brazil’s electricity sector in terms of connected electrical power capacity.
The overall potential in Brazil is approximately 300GW [31]. It’s forecasted from the “Ministry of Mines and Energy” a growth of 125% by year 2026 when the predicted target of 28.6% wind power of the total capacity of the power pool in Brazil will be installed. It’s estimated by the “Brazilian Industrial Development Agency (ABDI)” that by year 2026 the wind power sector would produce approximately 200 000 novel undeviating and ancillary employment [32,36]. The wind energy value chain has been rising by the enticements offered by the government. (“Tax exemption, long-term financing, etc.”). The country recently has considerably advanced their industrialized structure of the wind power segment to assemble the wind turbines and the fabrication of numerous modules (towers, blades, subcomponents of the pivot and nacelle) locally, with reduced quantity of imported components equated to former years [31].
The “International Labour Organization (ILO, 2015)” specified, if suitable strategies are implemented, the evolution of the global economy to a “greener” and extra viable framework ought to craft 620000 additional employment opportunities in Brazil, which adequately supersedes the possible 180 000 employment opportunities that may be reduced (ILO, 2015). Funding in renewable energy resources, linked by incentive plans (“tax reductions and attractiveness in financing”) coupled to decreasing GHG discharges, may yield a large quantity of employment. [48]. The wind power segment created 150 000 undeviating employments in the year 2016, at present totalling 13 GW, or 8.6% of the nationwide electricity segment [32]. The “Light for All” initiative is conspicuous by achievement in pursuing the standardisation of availability to electrical power in pastoral areas, selecting old-fashioned inhabitants and regions of great scarceness. Started in 2003, it helped approximately 16 million of the population in 2016 [48]. An investment of $250m in year 2019 was intended to connect approximately, 96000 additional electrical connections in 17 states [34].
Numerous strategies were compiled in Brazil aimed at diversifying the energy mix, through “Proalcool and Proinfa” programs by means of its chief indicators [34]. These plans permitted the triumph of Brazil’s biofuels and wind energy segment correspondingly. Public funding and incentives of substitute energy sources contributed an essential part in the progression and in launching the nation’s wind energy value chain. Currently, replicating strategies would remain critically imperative aimed at, increased progression of the solar energy value chain, integrated through major funding in research and development. Brazil with “Light for All” program, has been fulfilling its social objectives [34]. In summary, renewable energies in the country are progressing swiftly and the “energy transition” will predictably evolve along with the nation’s technical financial progression [25].
6. History of Energy Policy in SA
6.1. South Africa’s Social and Economic Context in Comparison with the Rest of the BRICS Partners
South Africa makes up 1% of the world’s land area with a population of 59 million people which is 1.9% of the total BRICS countries population as shown in Table 1 [2]. The BRICS countries makes up 30% of the world territory. The average life expectancy of South Africans is 64 years which coincidentally also the lowest amongst the BRICS countries [2]. South Africa’s GDP growth rate of 2.1% in comparison with an average GDP growth rate of 3.32% of the BRICS countries.
6.2. South Africa’s Macroeconomics
The real GDP growth was 2.1% in year 2022 and it is predicted to be 4.8% in year 2023, while consumption (use of goods and services) was 6.5% in year 2022 [35]. The World Bank’s doing business ranking of China in year 2022 is 71 out of 190 countries. South Africa is rich with various natural resources (gold, diamonds, coal, etc) with the mining industry being one of the largest employers, providing the country huge export revenue while supporting the local labour force. The large agricultural landscape of South Africa is also a crucial economic strength [35].
6.3. Current Energy Mix in South Africa
South Africa is the 7th largest producer of coal with most of the coal used to fuel the fossil fuel power stations locally or internationally at power plants [37]. Coal although used vastly as a fuel source, it also contributes to many other industrial processes of steel production, cement processing, paper and aluminium industries, chemical and pharmaceutical activities, coal gas and coal liquid as transportation energy and plant fertiliser as detailed in Figure 9 [38]. South Africa’s transactions of 69million tons of coal, at $5billion, was the country’s fourth greatest treasured mineral exported, after gold ($201billion), diamonds ($11billion), and platinum ($8.5 billion), funding 4.5% of foreign income [37]. South Africa’s domestic trades of approximately 183million tons of coal created revenue of more than 20% greater than coal exported [37]. Price, nonetheless, is not an acceptable justification for the comparative tardiness. Cognisant of this fact, the coal mining labour force will be extremely concerned with the future reduction in coal usage in the generation of electrical power and replaced with cleaner and “greener” fuel sources as it has a direct correlation with future job losses due to reduced activity to mine coal. If not managed sensitively and with appropriate engagements with labour, the initiatives towards decarbonisation and most initiatives of Just Energy Transition (JET) will be derailed [37].
Demonstrating and reiterating that the coal reserves are being depleted and only a finite reserve will be available in the near future. Besides the drive to achieve the target of zero carbon emissions by 2050 in a desperate attempt to prevent global warming and climate change. The conservation of coal resources to realistically and urgently change the global image as illustrated in Figure 8 which depicts the present energy resources where 56% is coal, 14% hydro, 10% wind, 8% solar, 7% gas, 3% biomass and 2% nuclear. It is apparent that coal is required for future sustainability of various vital industries which are very much dependent on coal including the pharmaceutical industry which are overlooked currently due to the insignificant volumes of coal used in comparison to the large volumes consumed in the energy sector [39].
Figure 10.
Power plants fuel sources [39].
Figure 10.
Power plants fuel sources [39].
In South Africa most of the fossil fuel power stations are in their mid to end-of-life phase as illustrated in Figure 11 [40].
The decommissioning plan of power plants as the shown in Table 2 coincides favourably to the country’s just energy transition into alternative lower carbon fuel sources. Legislations and policies incumbent to just energy transition requires attention as there is no evidence of a policy encompassing South Africa’s energy transition. Traditionally or historical approaches of funding methodology for the power utility business must change to accommodate the huge burden on the state and investigate innovative investment models with public and private participation partnerships models. These models require development into models to allow the local communities and citizens to be able to contribute and be able to have a shareholding into the future renewable and greener power plants. With this participation or funding initiative like a trust or “crowdfunding” the loss of employment impacts can be alleviated by this shared equity opportunities.
6.4. Insight into the “Just” Energy Transition in South Africa
South Africa as a developing country, initially did not have a commitment to reduce carbon emissions by a specific value within a given period. However, the Kyoto protocol and subsequent post-Kyoto protocol international initiatives aimed at the reduction of GHG’s to which South Africa voluntarily committed had an influence on government with regards to the energy policy [41,42]. This is in the form of mandating the use of significantly more renewable energy sources as seen in the “Integrated Resource Plan” (IRP 2010 and 2019) as well as more specifically addressing fossil fuel for electricity generation. The government took a stance in 2008 that all future fossil fuel-fired power plants will only be licensed if they are Carbon Capture Sequestration (CCS) compliant. This initiated the process of South Africa to investigate viable options of renewable energy sources [41].
In South Africa there are significant shortcomings with labour and urgent remedial action is required in compliance to the International Labour Organisation’s (ILO) policy, 2015 and policies of environmentally friendly fuel sources and adaptation of technologies to utilise a sole or multiple renewable fuel sources. There is also a huge necessity in bridging the gap that exists in the conventional funding methodology versus the green funding imperatives [43]. Presently, the policies are not clear but there are various collaborative initiatives with South African government departments, (Presidential Climate Commission (PCC), labour, environment, mineral council of South Africa, trade, industry and competition), Eskom, Sasol, Council for Scientific and Industrial Research (CSIR), National Business Initiative (NBI), Business Unity South Africa (BUSA), private and public sectors in evaluating, paving the path and bridging the gap for the Just Energy Transition (JET). The Presidential Climate Commission (PCC) report provides confirmation that the South African government is pursuing a Just Energy Transition (JET) with conviction, but time will tell if the transition will indeed be a “just” one. The “Climate Investment Funds” (CIF) announced the launch of the “Accelerating Coal Transition” (ACT) program in April 2021. ACT would be the catalyst in speeding up the transition from fossil fuels, predominantly coal in a consistent and sequential approach with governance, human resources, and infrastructure which is the three pillars of the program [44].
CIF issued a call for “Expressions of Interest” (EOI) to which South Africa in June 2021 and was responded to favourably in August 2021 with a proposal to concentrate on decarbonisation of the electrical energy sector in the context of its Just Energy Transition (JET) initiative. CIF announced that South Africa’s proposal in response to the EOI was favourably selected for the preparation of approximately $500m funding by the government in cooperation with the “World Bank “(WB) and the “African Development Bank” (AfDB) in October 2021[44]. The PCC completed “South Africa's Just Energy Transition Investment Plan” (JET-IP) in 2022. The JET framework focused on ensuring a “just and equitable” transition to net-zero CO2 emissions in South Africa by year 2050. The JET plans provide the required reference guidelines to various planning and policy setting processes ensuring the JET framework gain synergy across all JET planning in countrywide. The PCC commissioned numerous research studies with integrated public consultations to support the development of the JET plan in year 2021. The studies and consultations aided to unfold fundamental challenges JET in South Africa, paving the path for the development of the JET framework that is practical, time synchronised, and executable and matched with the requirements of all social partners [44]. The PCC report is the findings of the assessments and consultations, emphasizing critical considerations for the development of the “Just Transition” framework. The information derived and extracted from each related study was developing a vision and establishing policies to support a just and equitable transition, supporting sustainable livelihoods, financing a just energy transition, improving water security and creating good governance structures to manage JET [44]
These engagements will be referenced to the “ILO guidelines, 2015 for Just Transition” towards environmentally sustainable economies and humanities for all in South Africa [33]. The ILO principles have an emphasis on solid social confluence on the aim and passageways to energy sustainability [33]. Policies must conform, stimulate and realize necessary values and rights at which are critical to energy sustainability. Comprehensible policies across the economic, environmental, social, education/training and labour groups essential to deliver an empowering environment for enterprises, labour, financiers and users to embrace and drive the evolution to environmentally sustainable and comprehensive economies and humanities [33].
7. Conclusion and Policy Implications
The comparative energy policies of BRICS countries studies have shown that the populations’ lifestyle, energy mix, industry and commitments from their governments are extremely similar. South Africa is a small-scale representation in many aspects to Brazil, India and China of a developing nation with social and environmental responsibilities of “Just Energy Transition.” Russia shares some similar energy related mix of fossil fuels of coal and natural gas. South Africa can replicate hybrid or tailored energy policies of the BRICS countries in accordance with the South African landscape of energy sources readily available with the common objectives of decarbonisation. The financial situation in South Africa is rather constraint compared to BRICS countries but could be offset by the similar funding requirements to decommission and build new power plants in any event. South Africa could apply and entered into some negotiations for green finances and green bonds with the motivation of the compliance to the ILO, 2015 and the Paris Agreement [33].
It is strongly recommended that we take a phased approach that should form the basis to next Integrated Resource Plan (IRP) for country. The energy plan should assess electrical power requirements of the country for the next 8 years cognisant of the end of life or near end-of-life power plants to 2030. The proposal for the next IRP would categorically state that South Africa would not invest in fossil fuels (coal, oil and natural gas) for new plants. Although natural gas is more efficient from a power plant perspective, there is still carbon emissions from these plants. CCS will also make these gas plants less cost effective as it would be a requirement to meet the targets of nett zero carbon emissions by year 2050. The drive to replace power stations that are at their end of economically and technically feasible lifespan with greener power alternatives and the introduction of CCUS (Carbon Capture Usage and Sequestration) to the fossil fuel power stations which have 10 to 25 years production lifespan in South Africa would ensure a future of the energy mix in the right direction. The drive needs to rapidly increase the pace of Just Energy Transition (JET) in South Africa to take the least cost options to benefit the country both environmentally and economically yet ensuring sustainable employment opportunities with readily available technologies.
The focus would be to grant approval to the state-owned utility company Eskom or private sector to replace the approximate capacity of 8201MW of retiring power plant by 2030 with alternative renewable energy plants in the most effective and efficient manner [49]. The fastest and most cost-effective technology currently would be to construct solar PV coupled with Battery Energy Storage System (BESS) to replace majority of the capacity requirement (proven in China and especially cognisant that China produces most of solar panels and auxiliary equipment). The BESS/Solar PV can be hybridised to incorporate aquaponics or agrivoltaics, the later can be assessed on climate considerations and economics. The newer generating power plants (with a lifespan of 20 years or more), the feasibility of retrofitting Carbon Capture Usage and Sequestration (CCUS) or at least Carbon Capture and Sequestration (CCS) plants must be economically evaluated to deduce the viability [45]. This would provide some support and buffer while the SA energy sector can research and assess the viability of hydrogen, nuclear, wind and gravitational power generators based on effectiveness and eventually their efficiencies to reduce global carbon emissions and produce electrical power.
Conflicts of Interest
The authors declare no conflict of interest in interpretation of data; in the writing of the manuscript; or in the decision to publish the results.
References
- Morazan, P., Knoke. I., Knoblauch, D., Schafer, T., (2012). The Role of BRICS in the Developing World, https://www.europarl.europa.eu/thinktank/en/document.html?reference=EXPO-DEVE_ET(2012)433779.
- JSP, (2018). BRICS https://www.statssa.gov.za/wp-content/uploads/2018/11/BRICS-JSP-2018.pdf.
- IMF, (2011a:8). New Growth Drivers for Low-Income Countries: The Role of BRICS. https://www.imf.org/external/np/pp/eng/2011/011211.pdf.
- World Economic Forum (WEF), (2021). https://www.weforum.org/reports/annual-report-2021-2022/.
- Macroeconomic Outlook Report: India, (2023). https://www.globaldata.com/store/report/india-pestle-macroeconomic-analysis-2/.
- IEA, (2021). India Energy Outlook. https://www.iea.org/reports/india-energy-outlook-2021.
- COP26, (2021). The Glasgow Climate Pact, UN Climate Change Conference, United Kingdom. https://www.efaidnbmnnnibpcajpcglclefindmkaj/https://ukcop26.org/wp-content/uploads/2021/11/COP26-Presidency-Outcomes-The-Climate-Pact.pdf.
- NEP-India, (2022). National Electricity Plan of India. https://powermin.gov.in/en/content/national-electricity-plan-0.
- Kaur, R., Pandey, P., (2021). Air Pollution, Climate Change, and Human Health in Indian Cities. https://www.frontiersin.org/articles/10.3389/frsc.2021.705131/full.
- Agarwal, S., Mani, S., Aggarwal, D., Hareesh, C., Ganesan, K., Jain, A., (2020). Awareness and Adoption of Energy Efficiency in Indian Homes. New Delhi: Council on Energy, Environment and Water. https://www.ceew.in.
- Mani, S., Agarwal, S., Ganesan, K., Jain, A., (2020). State of Electricity Access in India: Insights from the India Residential Energy Survey (IRES) 2020. New Delhi: Council on Energy, Environment and Water. https://www.ceew.in/publications/state-electricity-access-india.
- Aklin, M., Harish, S.P., Urpelainen, J., (2015). Quantifying slum electrification in India and explaining local variation. http://eprints.gla.ac.uk/115751/.
- Chandran, R., (2018). Forced to walk miles, India water crisis hits rural women hardest. https://www.reuters.com/article/us-india-water-women-idUSKBN1K318B.
- Macroeconomic Outlook Report: China, (2023). https://www.globaldata.com/data-insights/macroeconomic/china-macroeconomic-country-outlook/.
- IEA, (2021). An Energy Sector Roadmap to Carbon Neutrality in China. https://www.iea.org/reports/an-energy-sector-roadmap-to-carbon-neutrality-in-china.
- Chang, S., Zhuo, J., Meng, S., Qin, S., (2016). Clean Coal Technologies in China: Current Status and Future Perspectives. https://www.sciencedirect.com/science/article/pii/S2095809917300814?via%3Dihub.
- Chen, Y., (2018). Comparing North-South Technology Transfer and South-South Technology Transfer: The Technology Transfer Impact of Ethiopian Wind Farms, Energy Policy. [CrossRef]
- Hasanbeigi, A., Becqué, R., Springer, C., (2019). Curbing Carbon from Consumption: The Role of Green Public Procurement, Global Efficiency Intelligence. https://www.climateworks.org/wp-content/uploads/2019/09/Green-Public-Procurement-Final-28Aug2019.pdf.
- Korsunskaya, D., Marrow, A., (2023). Russia Raises 2023 GDP Growth Forecast, Longer-term Outlook Worsens. https://www.reuters.com/markets/europe/russian-economy-ministry-improves-2023-gdp-growth-forecast-2023-04-14/.
- Henderson, J., Mitrova T., (2017). Natural Gas Pricing in Russia Between Regulation and Markets. SKOLKOVO Centre, Russia. https://energy.skolkovo.ru/downloads/documents/SEneC/research02.pdf.
- ERI RAS, (2019). Global and Russian Energy Outlook up to 2040. https://www.eriras.ru/files/forecast_2016.pdf.
- Mitrova, T., (2019). Energy Transition in Russia, Moscow, Russia. [CrossRef]
- Macroeconomic Outlook Report: Brazil, (2023). https://www.globaldata.com/data-insights/macroeconomic/brazil-macroeconomic-country-outlook/.
- IEA, (2018). Coal Analysis and Forecasts. https://www.iea.org/coal2018.
- Staffell, I., Jansen, M., Chase, A., Cotton, E., Lewis, C., (2018). Energy Revolution: Global Outlook. Selby, Drax .https://scholar.google.com/scholar?q=related:4ocQEJoNd7AJ.
- Grushevenko, E., Mitrova T., Malov A., (2018). The Future of Russian Oil Production: Life Under Sanctions SKOLKOVO Energy Centre. https://energy.skolkovo.ru/downloads/documents/SEneC/research04-en.pdf.
- Ratner, S., Berezin, A., Gomonov, K., Serletis, A., Sergi, BS., (2021). What is Stopping Energy Efficiency in Russia? Exploring the Confluence of Knowledge, Negligence, and Other Social Barriers in the Krasnodar Region. [CrossRef]
- Wills, W., Westin, FF., (2019). Energy Transition in Brazil. https://www.climate-transparency.org/wp-content/uploads/2019/04/Brazilian-Policy-Paper-En.pdf.
- Karpavicius, LM., (2021). Brazil Sources 45% of its Energy from Renewables, Brazil. https://www.climatescorecard.org/2021/01/brazil-sources-45-of-its-energy-from-renewables.
- Sewalk, S., (2015). Brazil’s Energy Policy and Regulations, Brazil. https://www.jstor.org/stable/26195861.
- Ambiente Energia., (2018). MME Authorizes the Installation of 25 Clean Energy Plants to Generate 883 MW, Brazil. https://www.ambienteenergia.com.br/index.php/2018/09/governo-autoriza-instalacao-de-25-usinas-geradoras-de-energia-limpa/34721#.W5r1BOhKiUk.
- ABDI., (2014). Mapping of the Production Chain of the Wind Industry in Brazil. https://www.investimentos.mdic.gov.br/public/arquivo/arq1410360044.pdf.
- ILO., (2015). https://www.ilo.org/wcmsp5/groups/public/---ed_dialogue/---actrav/documents/publication/wcms_826060.pdf.
- Agência Brazil., (2018). Increase Percentage of Biodiesel Takes Effect, Brazil. https://agenciabrasil.ebc.com.br/economia/noticia/2018-03/aumento-para-10-do-percentual-de-biodiesel-no-diesel-entra-em-vigor.
- Macroeconomic Outlook Report: South Africa, (2023). https://www.globaldata.com/data-insights/macroeconomic/south+africa-macroeconomic-country-outlook/.
- ABEEólica., (2018). Wind Energy is Expected to Generate Jobs in Brazil by 2026. Brazil. https://abeeolica.org.br/noticias/estudo-abdi-ventos-que-trazem-empregos.
- Lawrence, A., (2020). South Africa’s Energy Transition. Wits School of Governance, University of the Witwatersrand, Johannesburg, Gauteng, South Africa.
- Malumbazo, N., (2020). A New Normal; Coal. SANEA Energy Webinar, 06 August 2020.
- Central Electricity Authority (CEA), 2022. https://cercind.gov.in/2022/draft_reg/Sharing-Regulations_Amend-2022/CEA%20COMMENTS.pdf.
- Juodaityte, J., (2011). Microalgal Biotechnology for Carbon Capture and Bioenergy Production. Eskom, Research and Innovation Report, Johannesburg, South Africa.
- Ritchie, H., Roser, M., (2017). CO₂ and Greenhouse Gas Emissions. https://ourworldindata.org/co2-and-other-greenhouse-gas-emissions#future-emissions.
- Hirsch, T., Matthess, M., Dr. Funfgelt, J., (2017). Guiding Principles and Lessons Learnt for a Just Energy Transition in the Global South. Friedrich Ebert Stiftung, Berlin, Germany.
- Naidoo, C., (2019). Transcending the Interregnum: Exploring How Financial Systems Relate to Sustainability Transition Processes. University of Sussex, Business School, UK.
- PCC, (2021). Laying the Foundation for A Just Transition Framework For South Africa. https://www.climatecommission.org.za.
- Condor, J., Unatrakarn, D., Asghari, K., Wilson, M., (2011). Current Status of CCS Initiatives in the Major Emerging Economies. https://pdf.sciencedirectassets.com/277910/1-s2.0-S1876610211X00036.
- Melnikov, Y., Mitrova, T., (2019). A carbon-free world: What is Russia’s response? Energy Centre, SKOLKOVO Business School, Moscow, Russia. https://www.cairn.info/revue-responsabilite-et-environnement-2019-3-page-128.htm.
- Grattan,S., (2022). Brazil's 2021 climate emissions. https://www.reuters.com/world/americas/brazils-2021-climate-emissions-highest-since-2006-report-says-2022-11-01/.
- Drummond, C., (2016). Understand How Light for All Works, Brazil. https://www.cartacapital.com.br/especiais/infraestrutura/entenda-como-funciona-o-luz-para-todos.
- Halsey, R., Schubert, T., Maguire, G., Lukuko, T., Worthington, R., McDaid, L., (2020).Energy Sector Transformation in South Africa. Project 90 by 2030, Cape Town, South Africa. https://www.90by2030.0rg.za.
- Globaldata Country Risk Index (GCRI, 2023). https://www.globaldata.com/store/report/global-economic-risk-quarterly-analysis/.
Figure 1.
India’s current Energy mix [6].
Figure 1.
India’s current Energy mix [6].
Figure 2.
India’s envisioned 2032 Energy mix [8].
Figure 2.
India’s envisioned 2032 Energy mix [8].
Figure 3.
China’s current Energy mix [15].
Figure 3.
China’s current Energy mix [15].
Figure 4.
China’s envisioned Energy mix by 2060 [15].
Figure 4.
China’s envisioned Energy mix by 2060 [15].
Figure 5.
Russian Energy current mix [24]. .
Figure 5.
Russian Energy current mix [24]. .
Figure 6.
Russia’s envisioned Energy mix by 2030 [24].
Figure 6.
Russia’s envisioned Energy mix by 2030 [24].
Figure 7.
Brazil’s current Energy mix [28].
Figure 7.
Brazil’s current Energy mix [28].
Figure 8.
Brazil’s envisioned Energy mix by 2030 [31]. .
Figure 8.
Brazil’s envisioned Energy mix by 2030 [31]. .
Figure 9.
Uses of Coal [38].
Figure 9.
Uses of Coal [38].
Figure 11.
South Africa’s fossil fuel power stations economical life [40].
Figure 11.
South Africa’s fossil fuel power stations economical life [40].
Table 1.
BRICS countries size, population and GDP.
| Country | Area of Countr (1000 sq.km) | Population (million person) | Life Expectancy in years | Gross Domestic Product (GDP) growth rate % |
|---|---|---|---|---|
| Brazil | 8516 | 208 | 76 | 1.2% |
| Russia | 17125 | 147 | 71.9 | 2.1% |
| India | 3287 | 1269 | 68.7 | 6.7% |
| China | 9600 | 1386 | 76.3 | 4.5% |
| South Africa | 1221 | 59 | 64 | 2.1% |
Table 2.
South Africa’s fossil fuel power plant decommissioning planned (IRP, 2019).
|
Disclaimer/Publisher’s Note: The statements, opinions and data contained in all publications are solely those of the individual author(s) and contributor(s) and not of MDPI and/or the editor(s). MDPI and/or the editor(s) disclaim responsibility for any injury to people or property resulting from any ideas, methods, instructions or products referred to in the content. |
© 2023 by the authors. Licensee MDPI, Basel, Switzerland. This article is an open access article distributed under the terms and conditions of the Creative Commons Attribution (CC BY) license (http://creativecommons.org/licenses/by/4.0/).
Copyright: This open access article is published under a Creative Commons CC BY 4.0 license, which permit the free download, distribution, and reuse, provided that the author and preprint are cited in any reuse.
Energy Communities Implementation in the European Union: Case Studies from Pioneer and Laggard Countries
Elena Tarpani
et al.
Sustainability,
2022
Energy Transition as a Response to Energy Challenges in Post-Pandemic Reality
Darya Gribkova
et al.
Energies,
2022
Policy Analysis of the Challenges to an Effective Switch to Low-Carbon Energy in the Economic Community of West African States
Herve Mewenemesse
et al.
Energies,
2023


MDPI Initiatives
Important Links
© 2024 MDPI (Basel, Switzerland) unless otherwise stated