1. Introduction
1.1. General considerations
With an increasingly dynamic global system, the perspectives of the agri-food sector are determined by climatic conditions, the limited nature of resources, the level of digitization, but also by new technologies and consumer preferences. In order to meet the growing demand for affordable and healthy food, policy makers will need to implement measures and strategies that encourage economically-socially and ecologically sustainable agri-food systems, ensuring at the same time a sustainable economic return. Today, environmental management practices and attention are not only focused on addressing emissions and waste from production processes, but are shifting to analyse product life cycles and their impact on the environment. Global environmental impact assessment tools such as Life Cycle Assessment (LCA) and Life Cycle Cost Analysis (LCCA) are successfully applied by companies and research institutions to identify, investigate and calculate the environmental effects of a product through its life cycle. LCCA, also known as "whole cost accounting" or "total cost of ownership," is a methodology for evaluating the economic performance of a process over its entire life span, balancing between the initial monetary investment with the long-term associated expenses of the ownership and operational costs.
LCCA is a method that addresses the economic component of sustainability, by evaluating the initial investment costs and the recurring operational costs of the various existing options that may occur throughout the entire life of a product or service. The analysis of some potential scenarios can be done under conditions of similar benefits, but with different financial resources.
Thus, the aim of this research is to identify a framework for selecting the best information to be used for the LCCA method in organic apple production systems and decide on the key elements that determine the best option for establishing and exploring the organic orchard in South part of Romania. The study covered a detailed investigation by help of the LCCA method, which can be very useful in the horticulture, for specialists in the apple sector looking for a financial approach on the orchard.
The food production and agri-food systems, are currently diversified and highly sophisticated, using new technologies and methodologies such as LCA (Life Cycle Assessment) and LCCA (Life Cycle Cost Analysis). The borders of the process and the specific procedures could contribute to a differentiation in the application of the methods in fruit production systems, which sometimes lead to different results, as indicated in the literature [
1]. Even though, LCCA is a tool under development for analyzing economic sustainability of products or services, the concept being less utilized in agriculture sector [
2]. The literature also notes that uses of life cycle cost analysis (LCC) in the development of a wide range of technological solutions are presented, while the evaluation focuses on identifying hot spots and potential design improvements. In the substantiation of this research, papers from the specific literature describing the LCCA method have been tackled. In this respect, there have been presented limits and particularities of the LCCA method in different approaches, which were sometimes introduced together with the Life Cycle Assessment (LCA) method. So far, there is a wide range of examinations on the products and processes that have been taken into consideration in the specific literature.
While the LCCA is a decision support tool and there are papers indicated a certain number of platforms that offers support for the LCCA method [
3], it is also known that Life cycle cost analysis, together Life cycle assessment and social life cycle assessment, are decision tools that lead to sustainable decisions and investments [
4]. On the apple research side, there is approach where the aim of the paper was to identify the apple consumer profiles in Romania [
5], beside the fact that there were authors stressed on the importance to understand the cost distribution along the supply chain regarding both investment and operating costs, so that could facilitate decision making [
6], there are studies approaching statistical presentation of the information regarding the results of the LCCA method [
7,
8]. Meanwhile, it worth to mention studies that covers very well the LCCA methodology showed that the by-products would not only contribute to the profitability, but also be a source of raw materials that would avoid the use of resources and processes in the production of other products [
9]. In a similar paper [
10], LCA and LCCA methods were used to shape technical options for wastewater treatment and by-product recovery, with the focus on identifying hotspots and potential design improvements. Also, the specific literature commonly indicated comparative studies between conventional and organic methods [
11,
12]. Along with this kind of research, there have been challenges addressed to the field, telling about the limited water resources and the effects of climate change [
13], we noticed that this statement could be also the case for the apple orchards.
On the other hand, the literature also indicated studies based on the LCCA method [
14] focusing on the food waste issues, underlining that it has become a global problem due to the impact on the environment; analyzed together with the economic perspective, the life cycle cost method (LCCA) become an appropriate tool for assessing the sustainability. Other pragmatic approaches to these methods also targeted food waste, which has become a global problem due to its impact on the economy and the environment. Appropriate ways of preventing, valorizing and managing food waste could mitigate or avoid these effects.
Together with these methodologies that have become a benchmark in recent years, there is also the concept of circular economy. The Circular Economy (CE) is a pillar of the European Green Deal and an increasingly important area of EU external action, including EU international cooperation and development policy [
15]. Within the EU Circular Economy Action Plan (CEAP) it is provided a powerful policy steering to guide EU diplomacy and international cooperation, by communicating the EU ambition to lead efforts at global level, while contributing to Policy Coherence for Development. Thus, it aligns CE with the context of the economic transformation promoted by the Green Deal, underlining the ambition to promote the transition to a climate-neutral, resource-efficient and circular economy globally. These approaches, together with the measures developed and the implementation of sustainable solutions, are all the more urgent, as studies show the imminence of the deterioration of the natural space and the speed with which the entire planet is affected. In this context, the Life-cycle cost analysis (LCCA) become an appropriate method for assessing the total cost of the ownership, by taking into consideration all the costs of acquiring, owning and disposing of a process, becoming useful when project alternatives fulfilling the same performance requirements, but differ with respect to capital costs and operating costs, then select that option which maximizes the net savings [
16].
1.2. Apple sector in Romania
For a better understanding of the analysis carried out in the present study, technological particularities of planting and maintenance of apple orchards were presented. The apple (Malus domestica) is very widespread in Romania. In our country, apple culture is characteristic of hilly areas, where there are numerous fruit-growing areas [
17,
18]. Among the counties well-known for apple cultivation, we mentioned Argeș, Dâmbovița, Vâlcea, Prahova, Buzău, Suceava, Iași, Maramureș, Bistrița, Sălaj and Mureș. In Romania, the apple areas occupy approximately one third of the total area of the orchards, which places it in second place, after the plum species [
19,
20]. Both international and Romanian varieties are divided into three groups: summer varieties, autumn varieties and winter varieties [
21,
22]. Apples have special biological characteristics, being among the fruits that retain their freshness for a long time, can be transported over long distances and consumed at any time of the year [
23,
24,
25,
26]. This fruit has in its composition a series of nutrients and important elements, such as: sugars, vitamins (A, B1, B2, C), iron, phosphorus, calcium, magnesium, their quantity being higher in the peel than in pulp [
27]. Among the particularities of apple tree growth and fruiting, we mention the fact that the apple has a relatively small trunk and a widely wreath. [
28,
29]. Depending on the vigor of the varieties used, the apple trees can be planted in intensive orchards (500-1250 trees/ha) or super-intensive (over 1250 trees/ha) orchards. Less often, they can be planted on rugged terrain or in the pre-mountainous area, with densities of 300-400 trees/ha, where specific varieties are used [
30]. Regarding the climate and soil requirements, it is mentioned that the apple grows well in areas where average annual recorded temperatures are between 8 and 11 °C. The apple trees have moderate light requirements: they prefer sunny areas, but they can also grow in semi-shade conditions [
31]. Establishing an orchard begins with choosing and preparing the land. At the time of planting, the trees must be in vegetative rest and the soil must not be frozen. The best time to plant is autumn after the leaves have fallen. [
32]. Harvesting must be done at the optimal time for each apple variety. The handling and transport of the fruits is carried out in varied types of packages, in order to maintain the quality of the products and to reduce the time from harvesting to conditioning. Fruits can be stored in boxes, in dark and cool spaces for 3-4 months, at temperatures between 0-4 °C with an air humidity of 80-85%. The transportation stage refers to two major phases. The phase of transporting the fruit from the orchard to the place of storage, where sorting and selection of the fruit can take place, especially of those that are to be stored for a longer period of time. The second phase refers to the transportation of the fruit from the storage place to the retailers [
33,
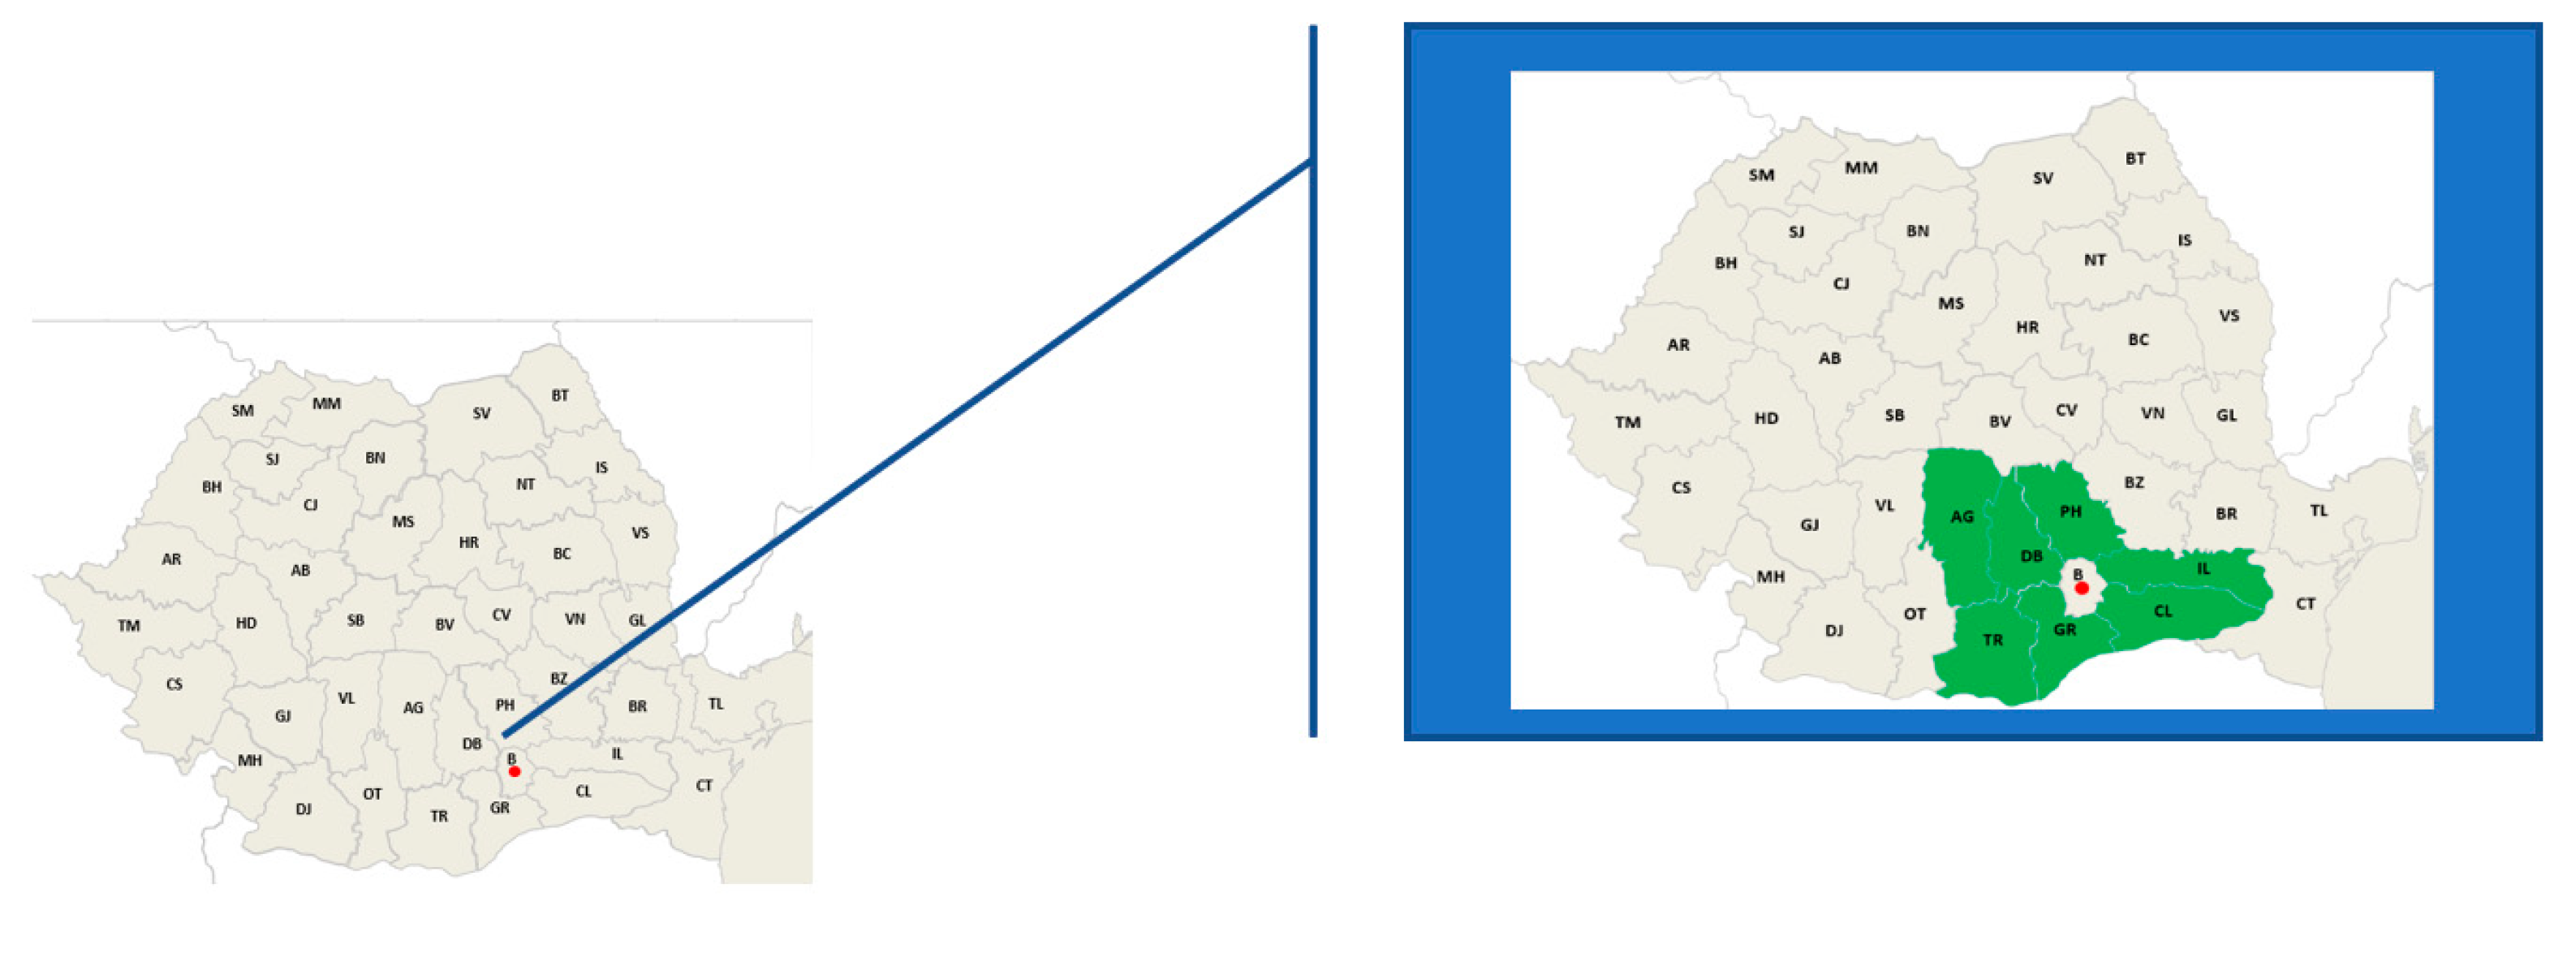
34]. Framing the particular situation of the apple sector in Romania, we have represented in the figure below (
Figure 1) the map with the counties where the highest average apple productions are obtained (kg/tree), 2020. Thus, it can be identified that the South - Souteast part of the country is considered an orchard basin with important productions (Source: own representation based on a paper [
35], made with data from the public databases [
36,
37]).
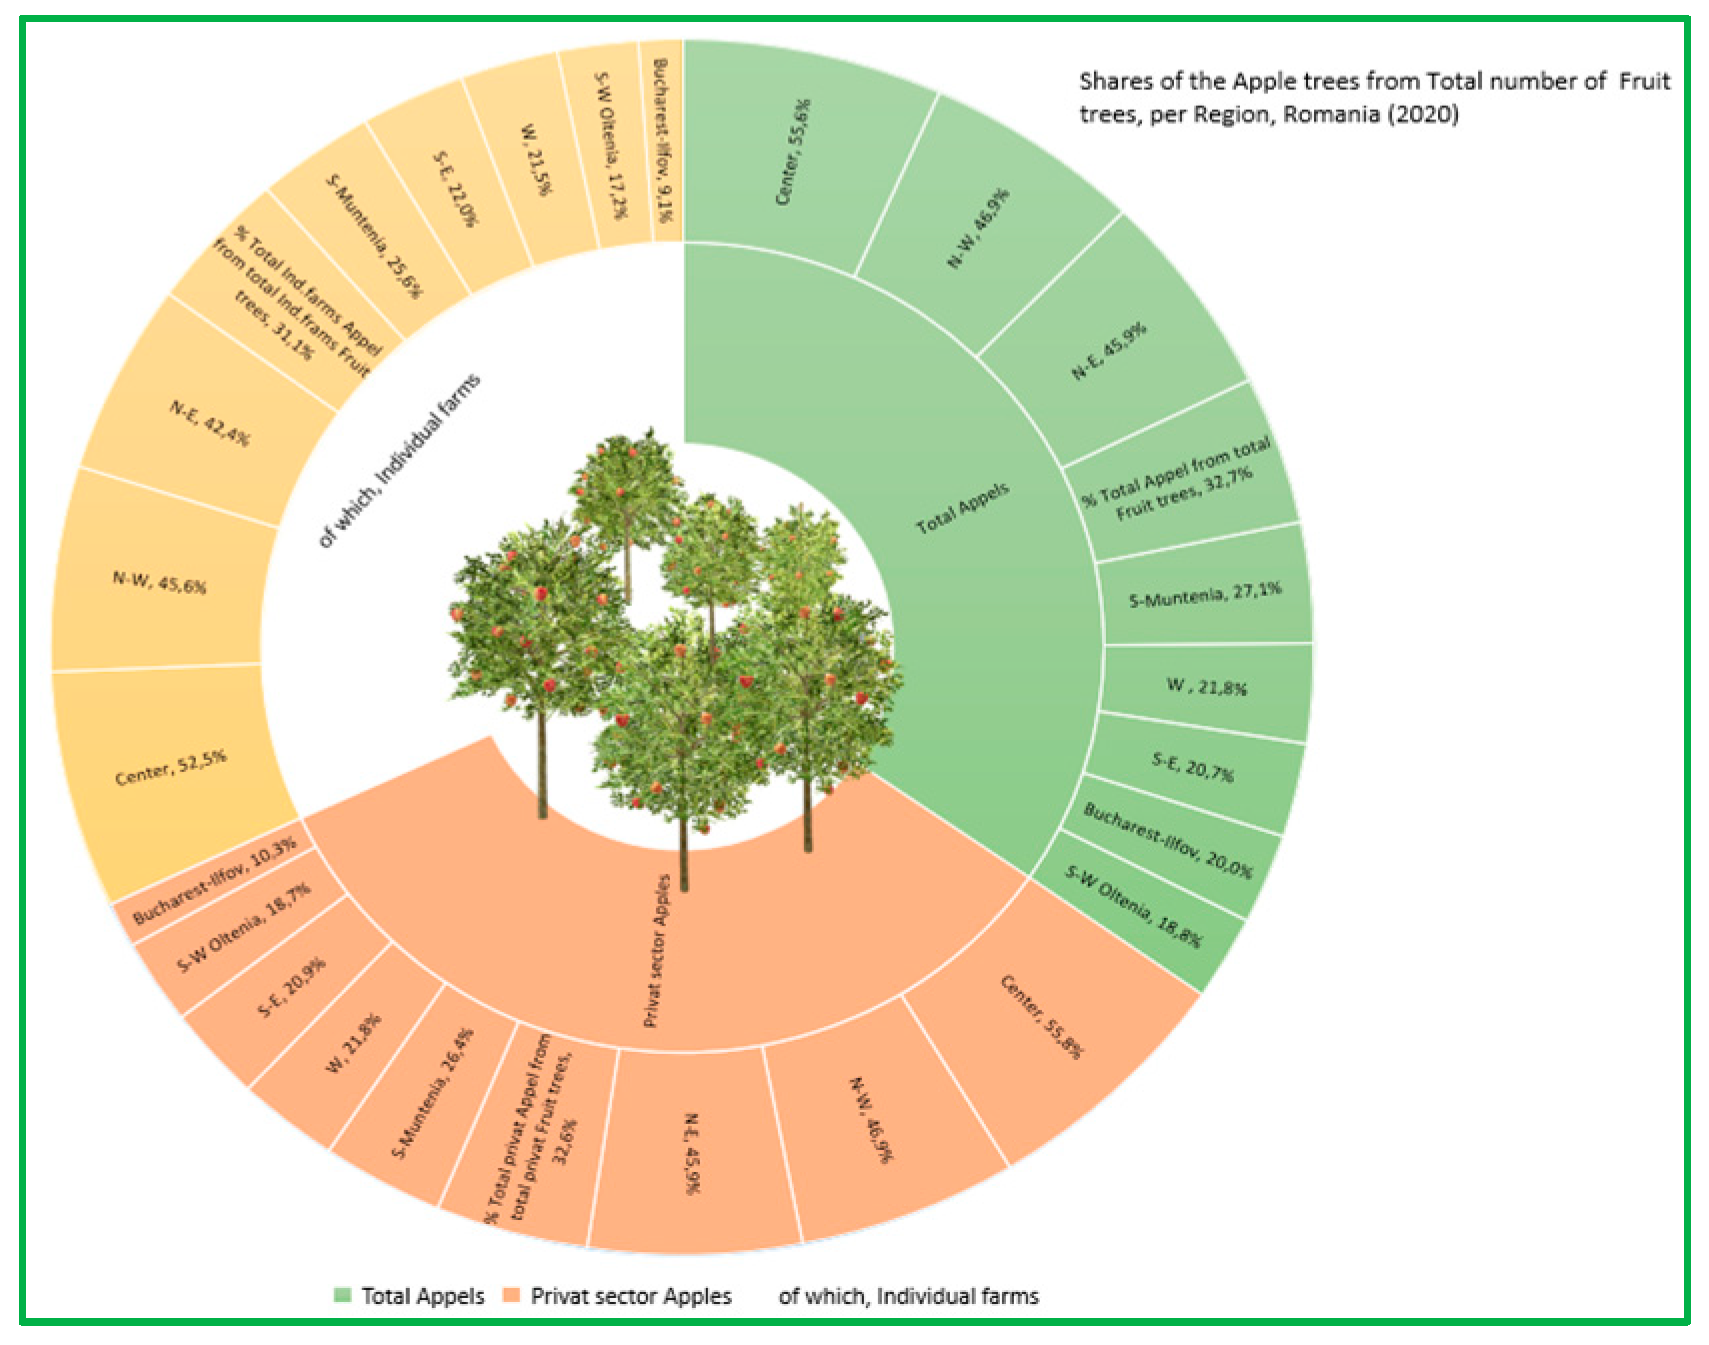
Next, in the figure below (
Figure 2), there is a visual presentation of the orchards potential in Romania, with the share of the number of trees in the 8 regions, in total, in the private sector and in individual farms [
36].
Being a country with important apple productions, reaching about 25-35 kg/apple tree (total production 570 thou tons apples in 2021, [
37]), Romania also records a relatively high consumption, on average about 30-35 kg apple/inhabitant/year.
Thereby, in the figure below (
Figure 3), we have represented the regions in Romania where the largest quantities of apples are bought for consumption [
35,
36,
37]. The following counties: Vrancea, Galați, Buzău, Brăila, Tulcea and Constanța, have been identified as areas where the quantities of apples for consumption recorded the highest values (about 3-4 kg apples/month/person).
2. Materials and methods
2.1. General approach of the methodology
The LCCA (Life Cycle Cost Analyze) addressed in this work, is one of the most used approaches in estimating the costs of a business. It is used to analyze and evaluate the total cost of a process, product or service, starting with the costs of capital resources, acquisition costs, production costs, operation and maintenance costs and finally the disposal costs of the analyzed product. Thus, the main purpose of the LCCA method is to estimate the overall cost of the examined process throughout its life cycle and subsequently to identify an alternative that will ensure the lowest costs, under conditions of optimal quality of the production process. It is recommended that this investigation could be carried out at an early stage, so that cost reduction can be considered and operated productively. The main challenge in a such LCCA analysis is to set out the monetary economic effects of the alternatives available at a specific moment. Through its complex approach, the method thus become a useful mechanism in quantifying sustainability, by considering the economic impact of design, execution, materials and maintenance of the entire product, process or service, and at the same time, identifying the strategies that can lead to the most effective options for the considered alternatives.
2.2. Database used for the LCC analysis
All the data used in this paper for the LCCA analysis come from the experimental field of the Faculty of Horticulture, University of Agricultural Sciences and Veterinary Medicine of Bucharest, Romania. This apple orchard is located in the South part of the country. The figures have been collected by experts, encoded in an Excel file, then explored and examined though several tools of this software.
2.3. Stages and limits of the LCCA method
In the Romanian agribusiness sector, the LCCA method is used quite recently. In our case, the following steps were taken into account in the elaboration of the analysis: data collection and processing (data inventory), establishing the study interval (i.e. the life cycle stages for which the study will be carried out), called system boundary, identification of capital costs and operational costs, the unit of measure for the initial data (e.g. €/ha), the most accurate references for each stage and production process, the establishment of the functional unit of measure, the Functional Unit Cost (FUC, which in the case of our study, is 1 kg of fresh apples), the presentation of the existing options, resulting from the sensitivity analysis and finally, the choice of the option that fit the best of the followed financial objective. The framework of this specific methodology, LCCA, involves passing through several stages, the most important of which are the following:
goal and scope of the study, where the main purpose is stated
life cycle costs inventory, means identifying and measuring the inputs and outputs for the system throughout its life span.
cost impact analysis. This is the stage where data is assessed and converted into relevant information. The impact analysis is performed within the system boundaries.
interpretation. The results from the inventory assessment are discussed. If an analyze of the sensitivity is demanded, then this should be conducted as comparative analysis, on the alternative options upon the hotpoints identified in the system. Ideally, the results could be extended to other products or processes.
In this context, the literature [
38], as well as the requirements and Guidelines for performing LCC Analysis [
39] (e.g. ISO 15686-5/2017 /15663) indicates the following methodological phases, which complement or reframe the above stages: *definition of the identified problems and alternatives, *cost analysis (detailing costs and their estimates), *economic evaluation and updating of future cash flows, *analysis of the break-even point, * identifying high cost contributors, *performing sensitivity analysis, *presenting and comparing alternatives, and of course, *recommending the best solution [
40]. For these reasons, it can be appreciated that the LCCA is a particularly useful tool for decision-making and evaluation of the economic performance of production systems, through the use of specific financial indicators, and furthermore, in our case for verifying the results of the fruit-growing technologies pursued. By providing financial data, several papers underlined the level of indicators in order to support their results and stated that the economic viability of the production models could serve as a complementary tool for indicating the sustainability in the short- and midterm. [
41].
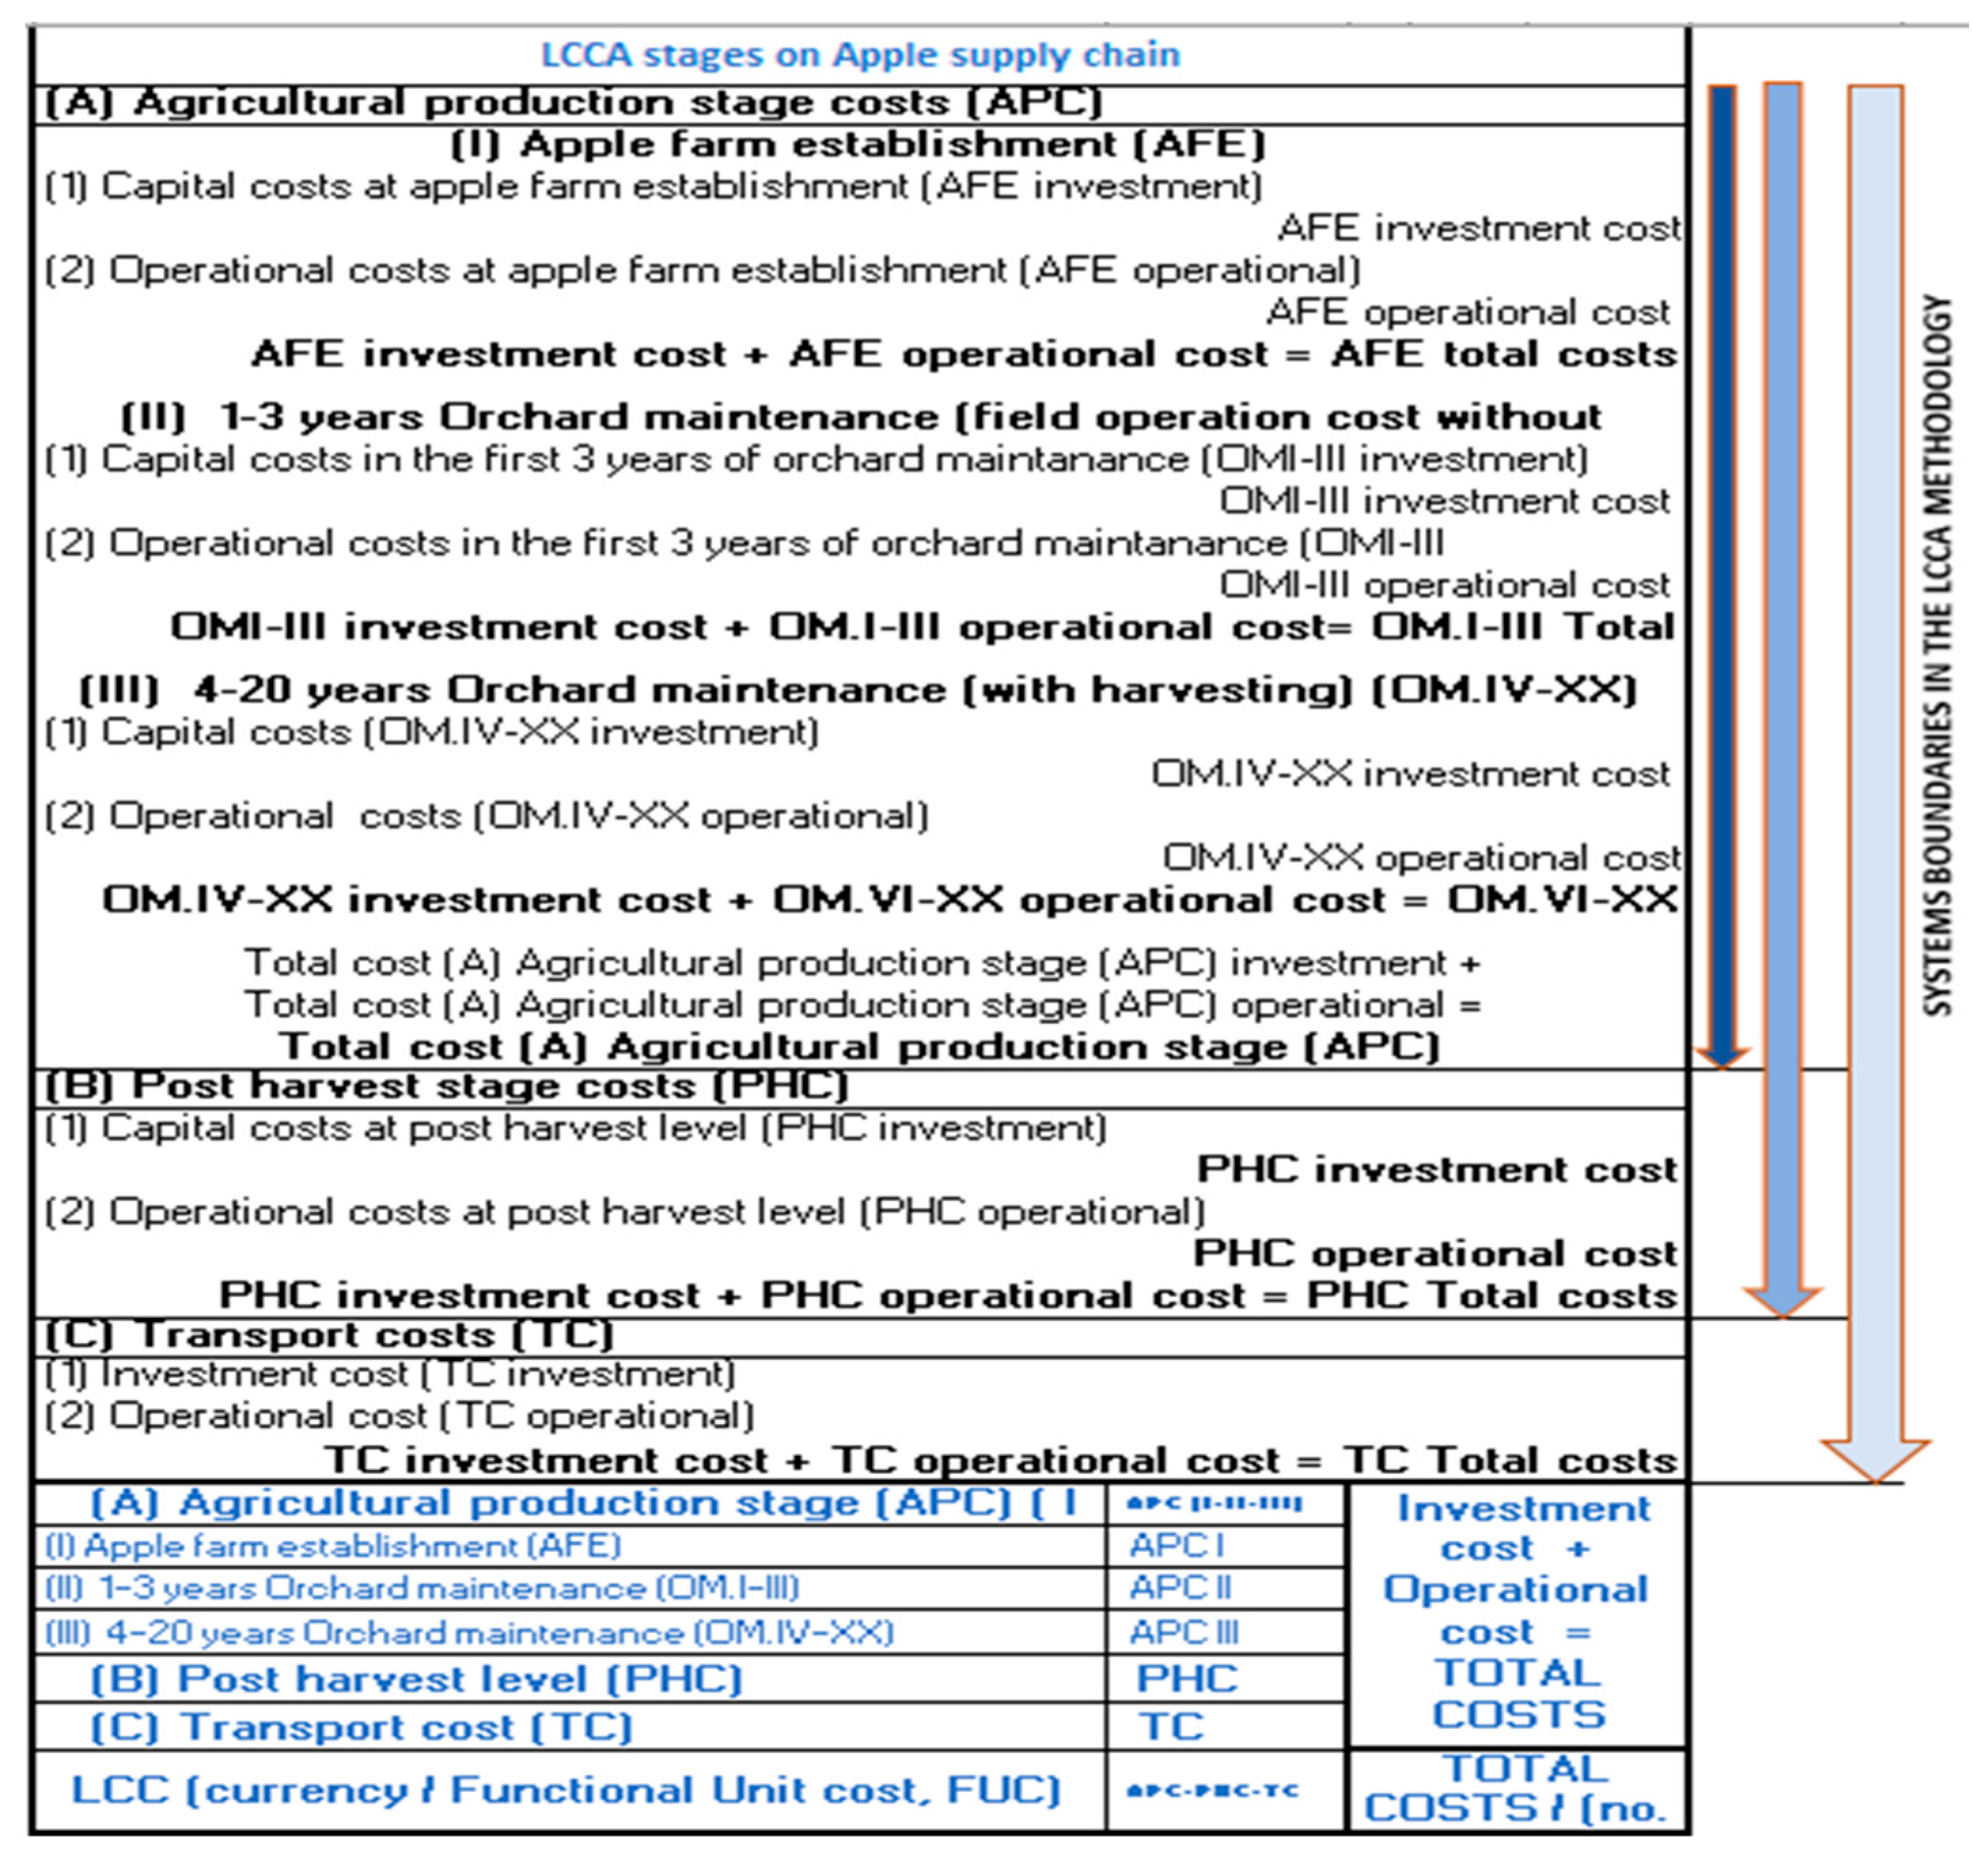
Following the methodological steps, in figure below (
Figure 4), there are presented stages for a life cycle analysis and the boundary system of an apple orchard production system.
As Life-cycle cost procedures are widely used for economic evaluations of processes, the basic idea is to anticipate all future costs, to get a life-cycle cost of a particular process. Repeating the calculations for a range of potentially interesting alternative processes, allowing selection of an optimum design, that shows the least life cycle cost [
42].
The specific literature [
43], indicates formulas for calculating LCC. In this regard, we found the following relationship:
where LCC= the lifetime cost of the product, n= the number of years within the study period, Ct= the relevant costs, including the initial and future costs from which the cash flows that can be obtained in year t are deducted (negative residual value), d= discount rate used to adjust cash flows and bring them to a present value.
This method often requires an additional analysis, in the form of a sensitivity analysis. This is a technique used to determine the influence of major differences in LCCA input parameters on economic outcomes. One of the variants used is for the most important input values to be set to certain limits (lower, upper, average), or to impose a variability with a certain percentage, while all other values input remain constant and then, the change in the results is analyzed. The interest for a sensitivity analysis is that it allows the perception of the economic impact in the overall LCCA results. The specialized literature indicates that the cost sensitivity analysis of this method can be performed using applications such as Microsoft Excel, Lotus or Quattro Pro or dedicated software with interfaces that ensure data entry, their processing and obtaining specific results. [
44]. This is also the case of our article, where the sensitivity analysis consisted in the identification of key points, i.e. those stages or elements in the process that present cost levels or values that can undergo adjustments (e.g. too high costs that will have to be adjusted) and for which simulations will be carried out to optimize the final result, in order to obtain a relevant impact for the pursued economic analysis. Also, different scenarios were run for testing "what if" hypotheses, through the Microsoft Excel tool. For the construction of the different scenarios, we considered lower and upper limits of the capitalization of production on the market (70% pessimistic scenario and 85%, optimistic scenario), then the obtained economic results were analyzed. So far, the aim has been to maintain a level of benefit obtained that would cover the total capital and operating costs of the organic apple orchard, for the entire planned operating period (20 years).
3. Results and discussion
In approaching the LCCA methodology, we started from identifying the objective, recording data, establishing system boundaries, stages and sub-stages of the process and finally, calculating related indicators. Through the sequence of stages, the analysis of the economic viability of the system considered, namely the apple orchard, was followed. Processing of the data and the presentation of the results was carried out by using advanced calculation tools and visual graphic representation, provided by Microsoft Excel.
3.1. Results on the global process
In the
Table 1 below, there were presented the main stages of the process of establishing and operating an organic apple orchard, in the Southern area of Romania. In the first section of the table, the capital and operational cost elements are presented, expressed in euros, over the entire exploitation period, at an average production of 40 tons of apples/ha, thus obtaining a total cost (LCC) of 301,081.23 euros. For these economic results, a series of costs were not considered, among which we mention fixed costs (e.g. amortization, machinery insurance), or indirect production costs such as rents, administrative costs, taxes or subsidies.
In the
Table 2 below, we have a matrix distribution of the results from the typology of costs, in order to be able to identify the weight of each type of cost (capital and operational), for the categories Agricultural production cost, Post-harvest costs and Transport costs, related to the respective Total stage or sub-stage. We can thus, state that operational costs from the production stage represent the vast majority of costs (97.21%), while capital costs from the same production stage represent the smallest share of the total cycle of production and exploitation of the orchard (2.79%). In total, capital or investment costs represented 4.42% of the total global cost, and operational costs represent the difference, 95.58%. From the category of Production costs, the sub-category of orchard maintenance costs, during the production period (years 4 - 20), covered the largest share (52.07% of the total category. The table also showed that, maintaining orchard during the first three years, involves the allocation of 5.84% of the funds of the main category, the production stage. The costs from the Post-Harvest area and from the Transport area represented 23.48%, respectively 5.93% of the Total cost of the exploitation in the respective organic orchard.
The
Table 3 below, revealed the total costs for the three main categories, respectively, 0.2657 euro/FUC (Production stage), 0.0884 euro/FUC (Post-Harvest stage), 0.0223 euro/FUC (Transport stage). Added up all these costs lead to the Total operating cost of the farm, calculated according to the LCCA method, which reached out 0.3674 euro/FUC (1kg fresh apple). The weights of each category, from the total cost, are indicated on the last column.
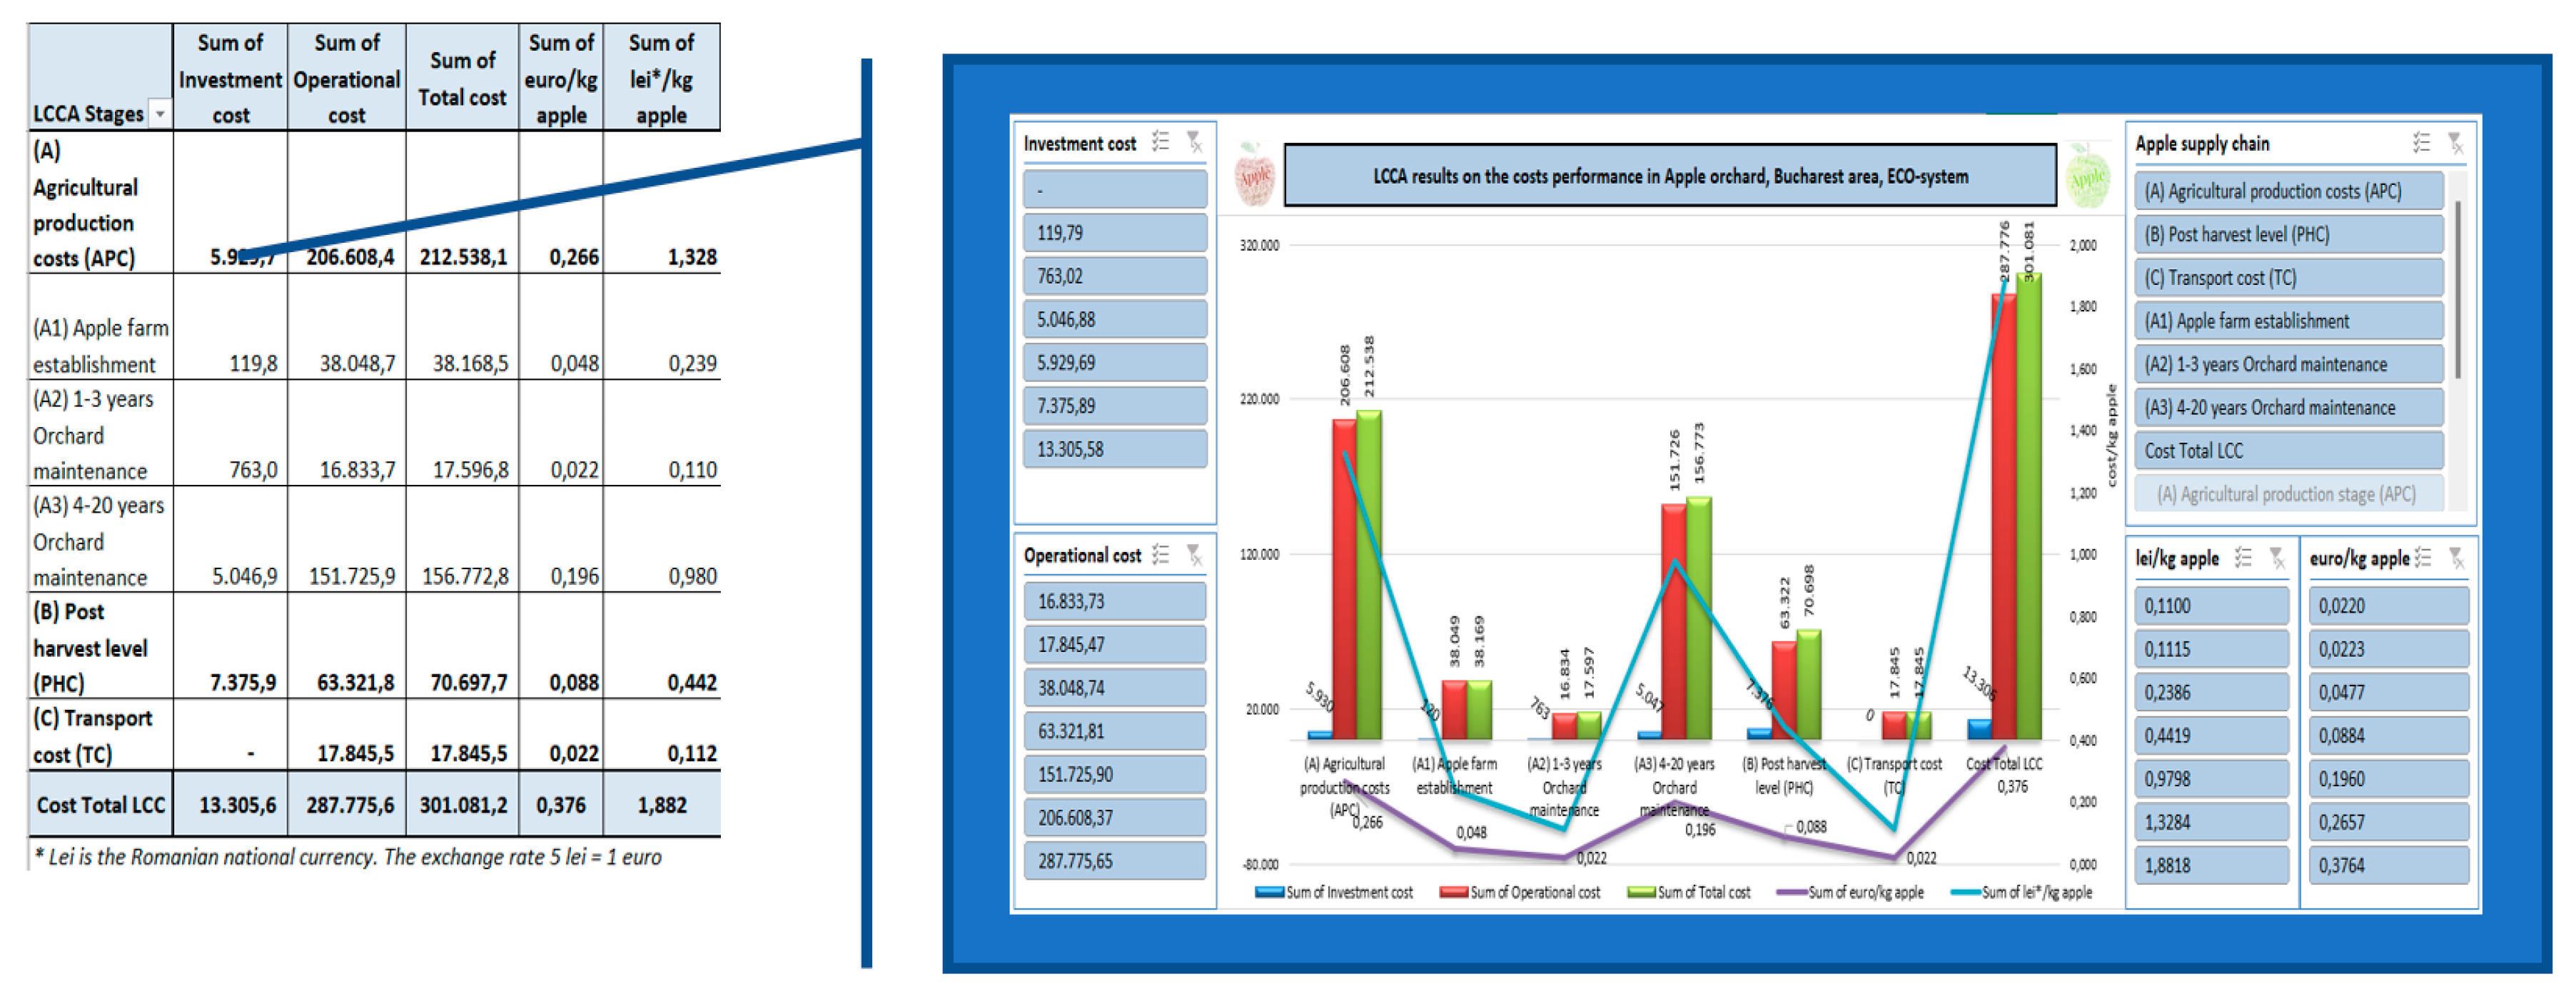
It following in the
Figure 5, the presentation of the results of the LCCA analysis. Data source: own processing based on data from the organic apple orchard, South part of Romania.
Therefore, an extract from a dynamic selection table on the apple supply chain was presented. This presentation allows us to select in the results field any element listed in the production process, for which the investment and capital costs will be indicated, each of them with the initial cost expressed in euros/ha and the processed cost in euros/FUC/ha, on the entire exploitation period of the organic apple orchard.
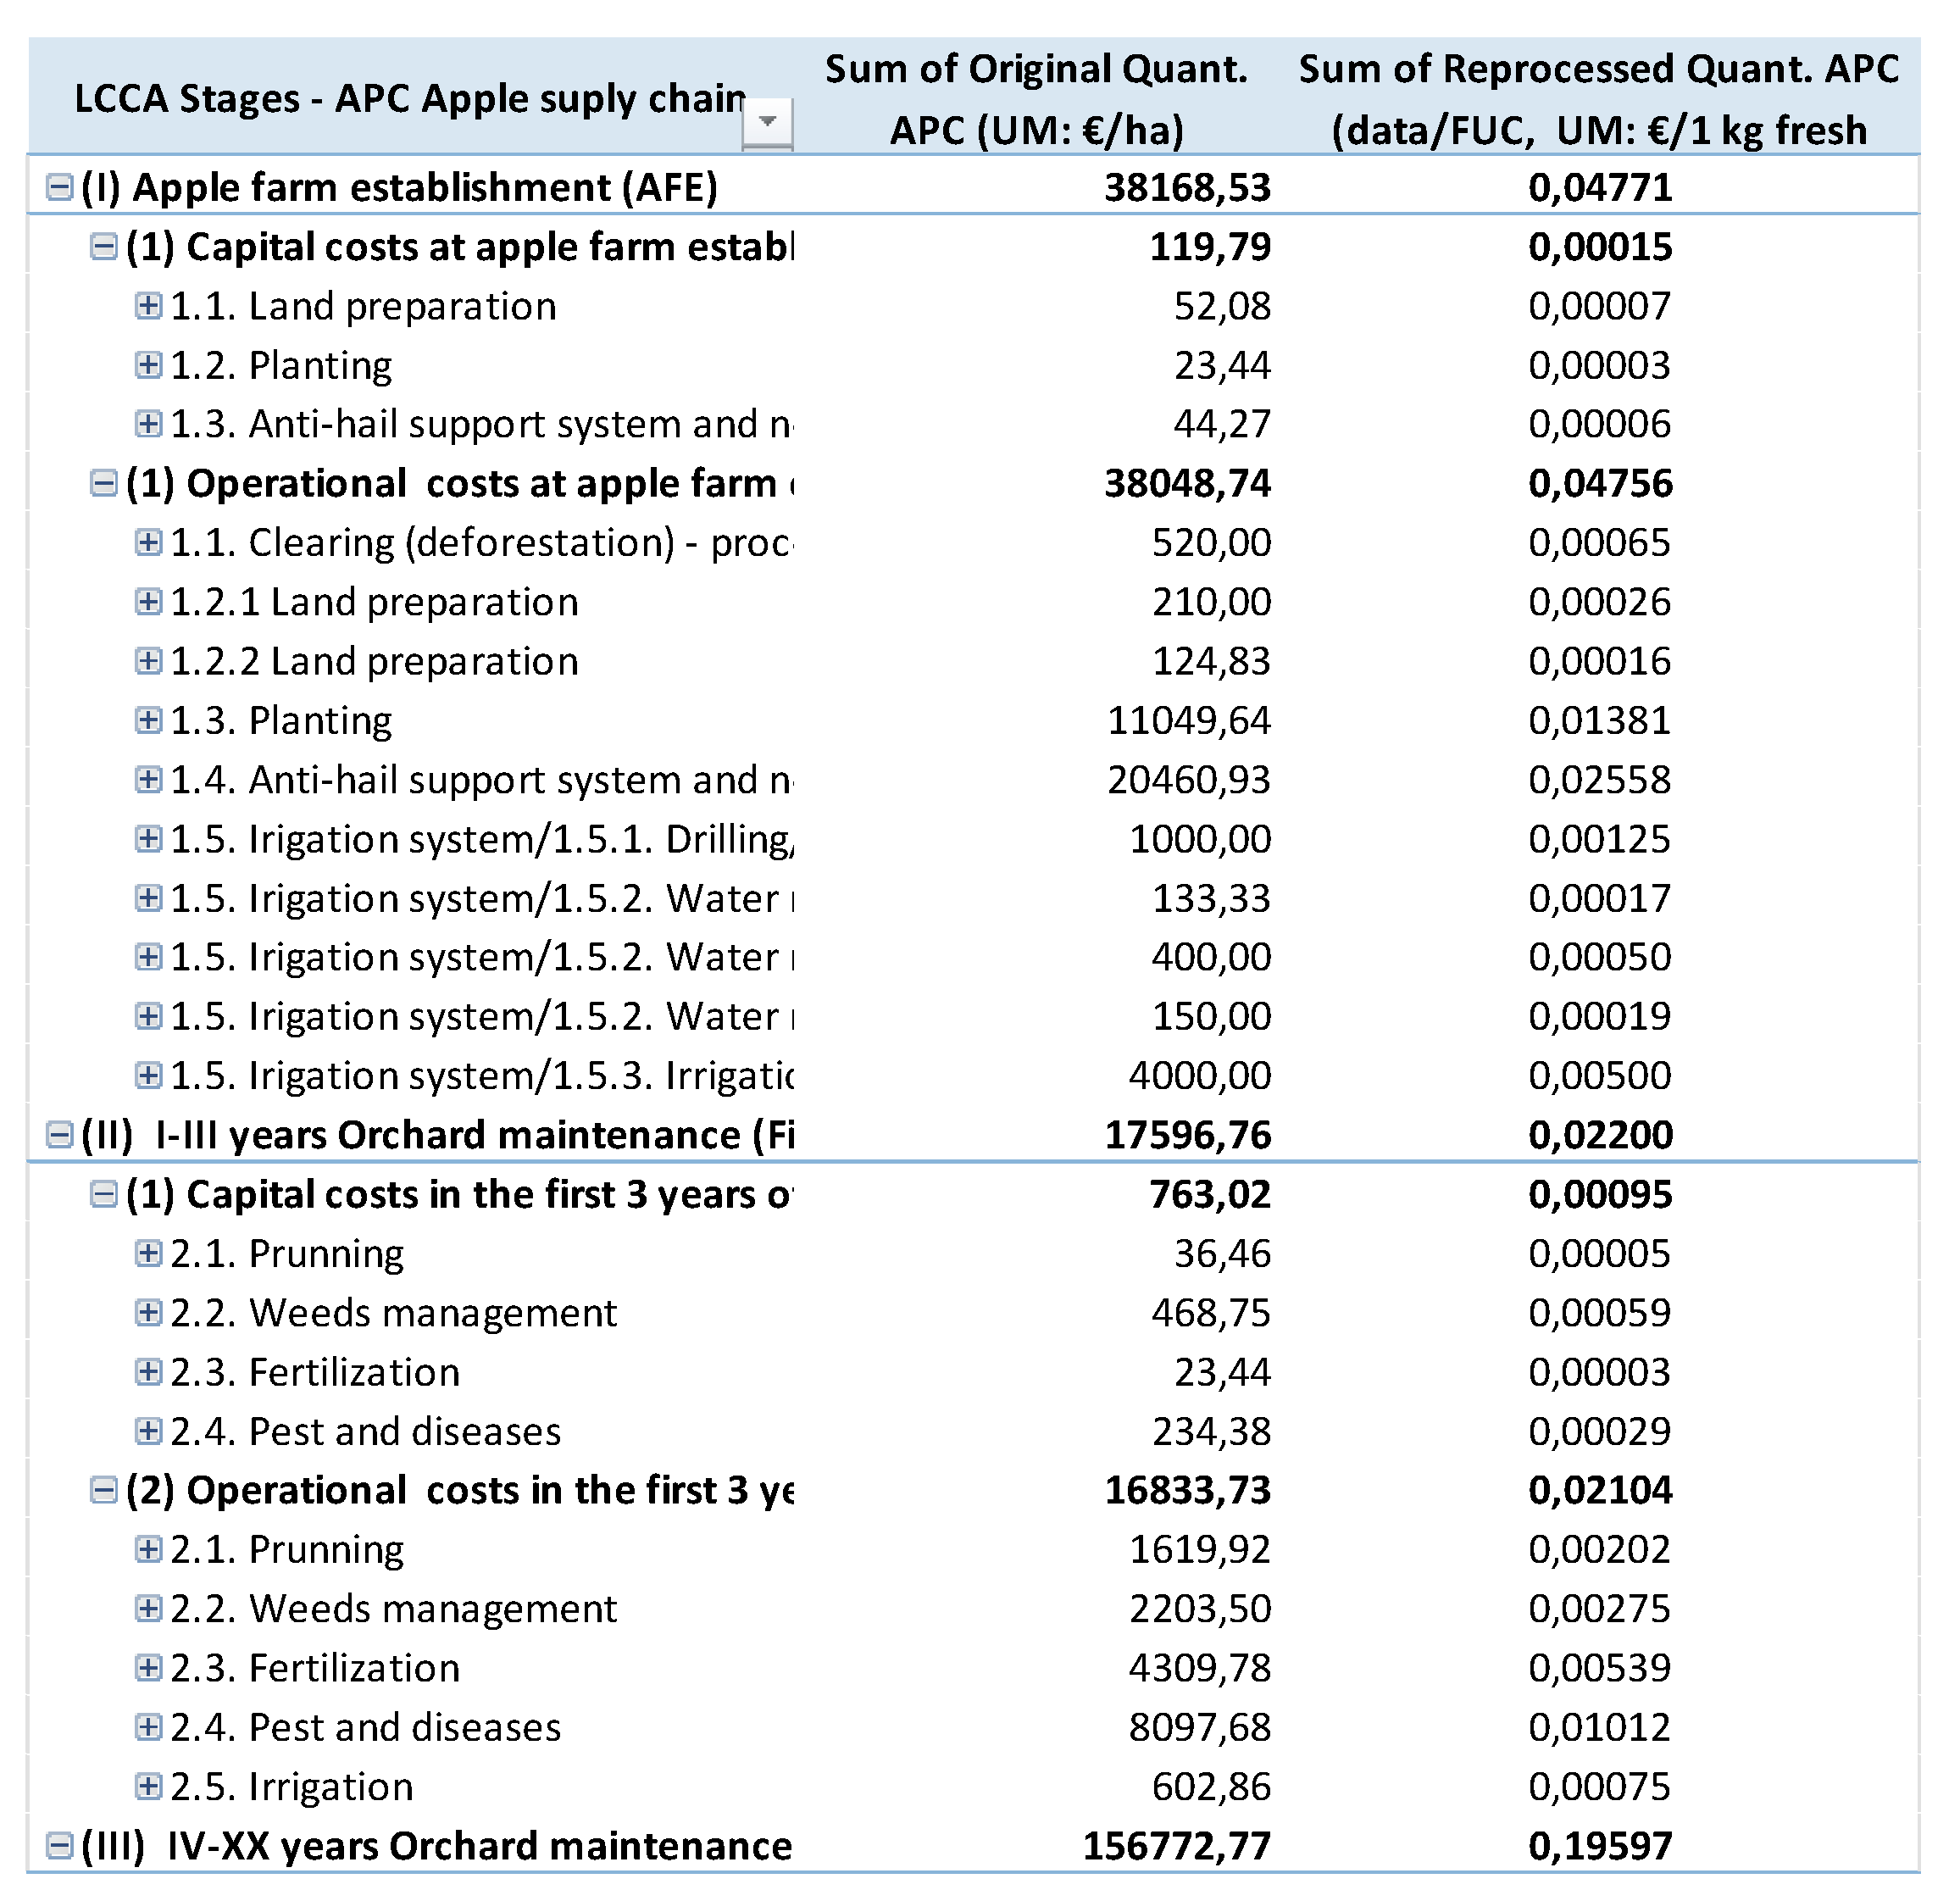
Next, in the figure below, (
Figure 6) some details were exposed regarding different cost elements, from the Production stage, presented in the form of a dynamic selection table allowing to expand or contract the list of recorded costs, expressed in euro/ha/20 years and in euro/FUC/20 years/average yield, respectively.
Based on the building of pivot tables, a dynamic processing of the graphics was obtained, in the form of dashboards, by the help of slices (facility offered by Microsoft Excel), for all the costs (capital and operational) related to each stage, expressed in Lei and in Euros/FUC.
3.1. Particular results on the specific stages of the process
Next, below in the
Figure 7, there are presented graphically the results of data processing from the production stage, to which additional data was added regarding the costs and work execution calendars (autumn and spring schedule), from the global process of establishing and operating the orchard of apple (Source: own processing of information from the Production stage, based on data from the experimental organic apple orchard in Bucharest).
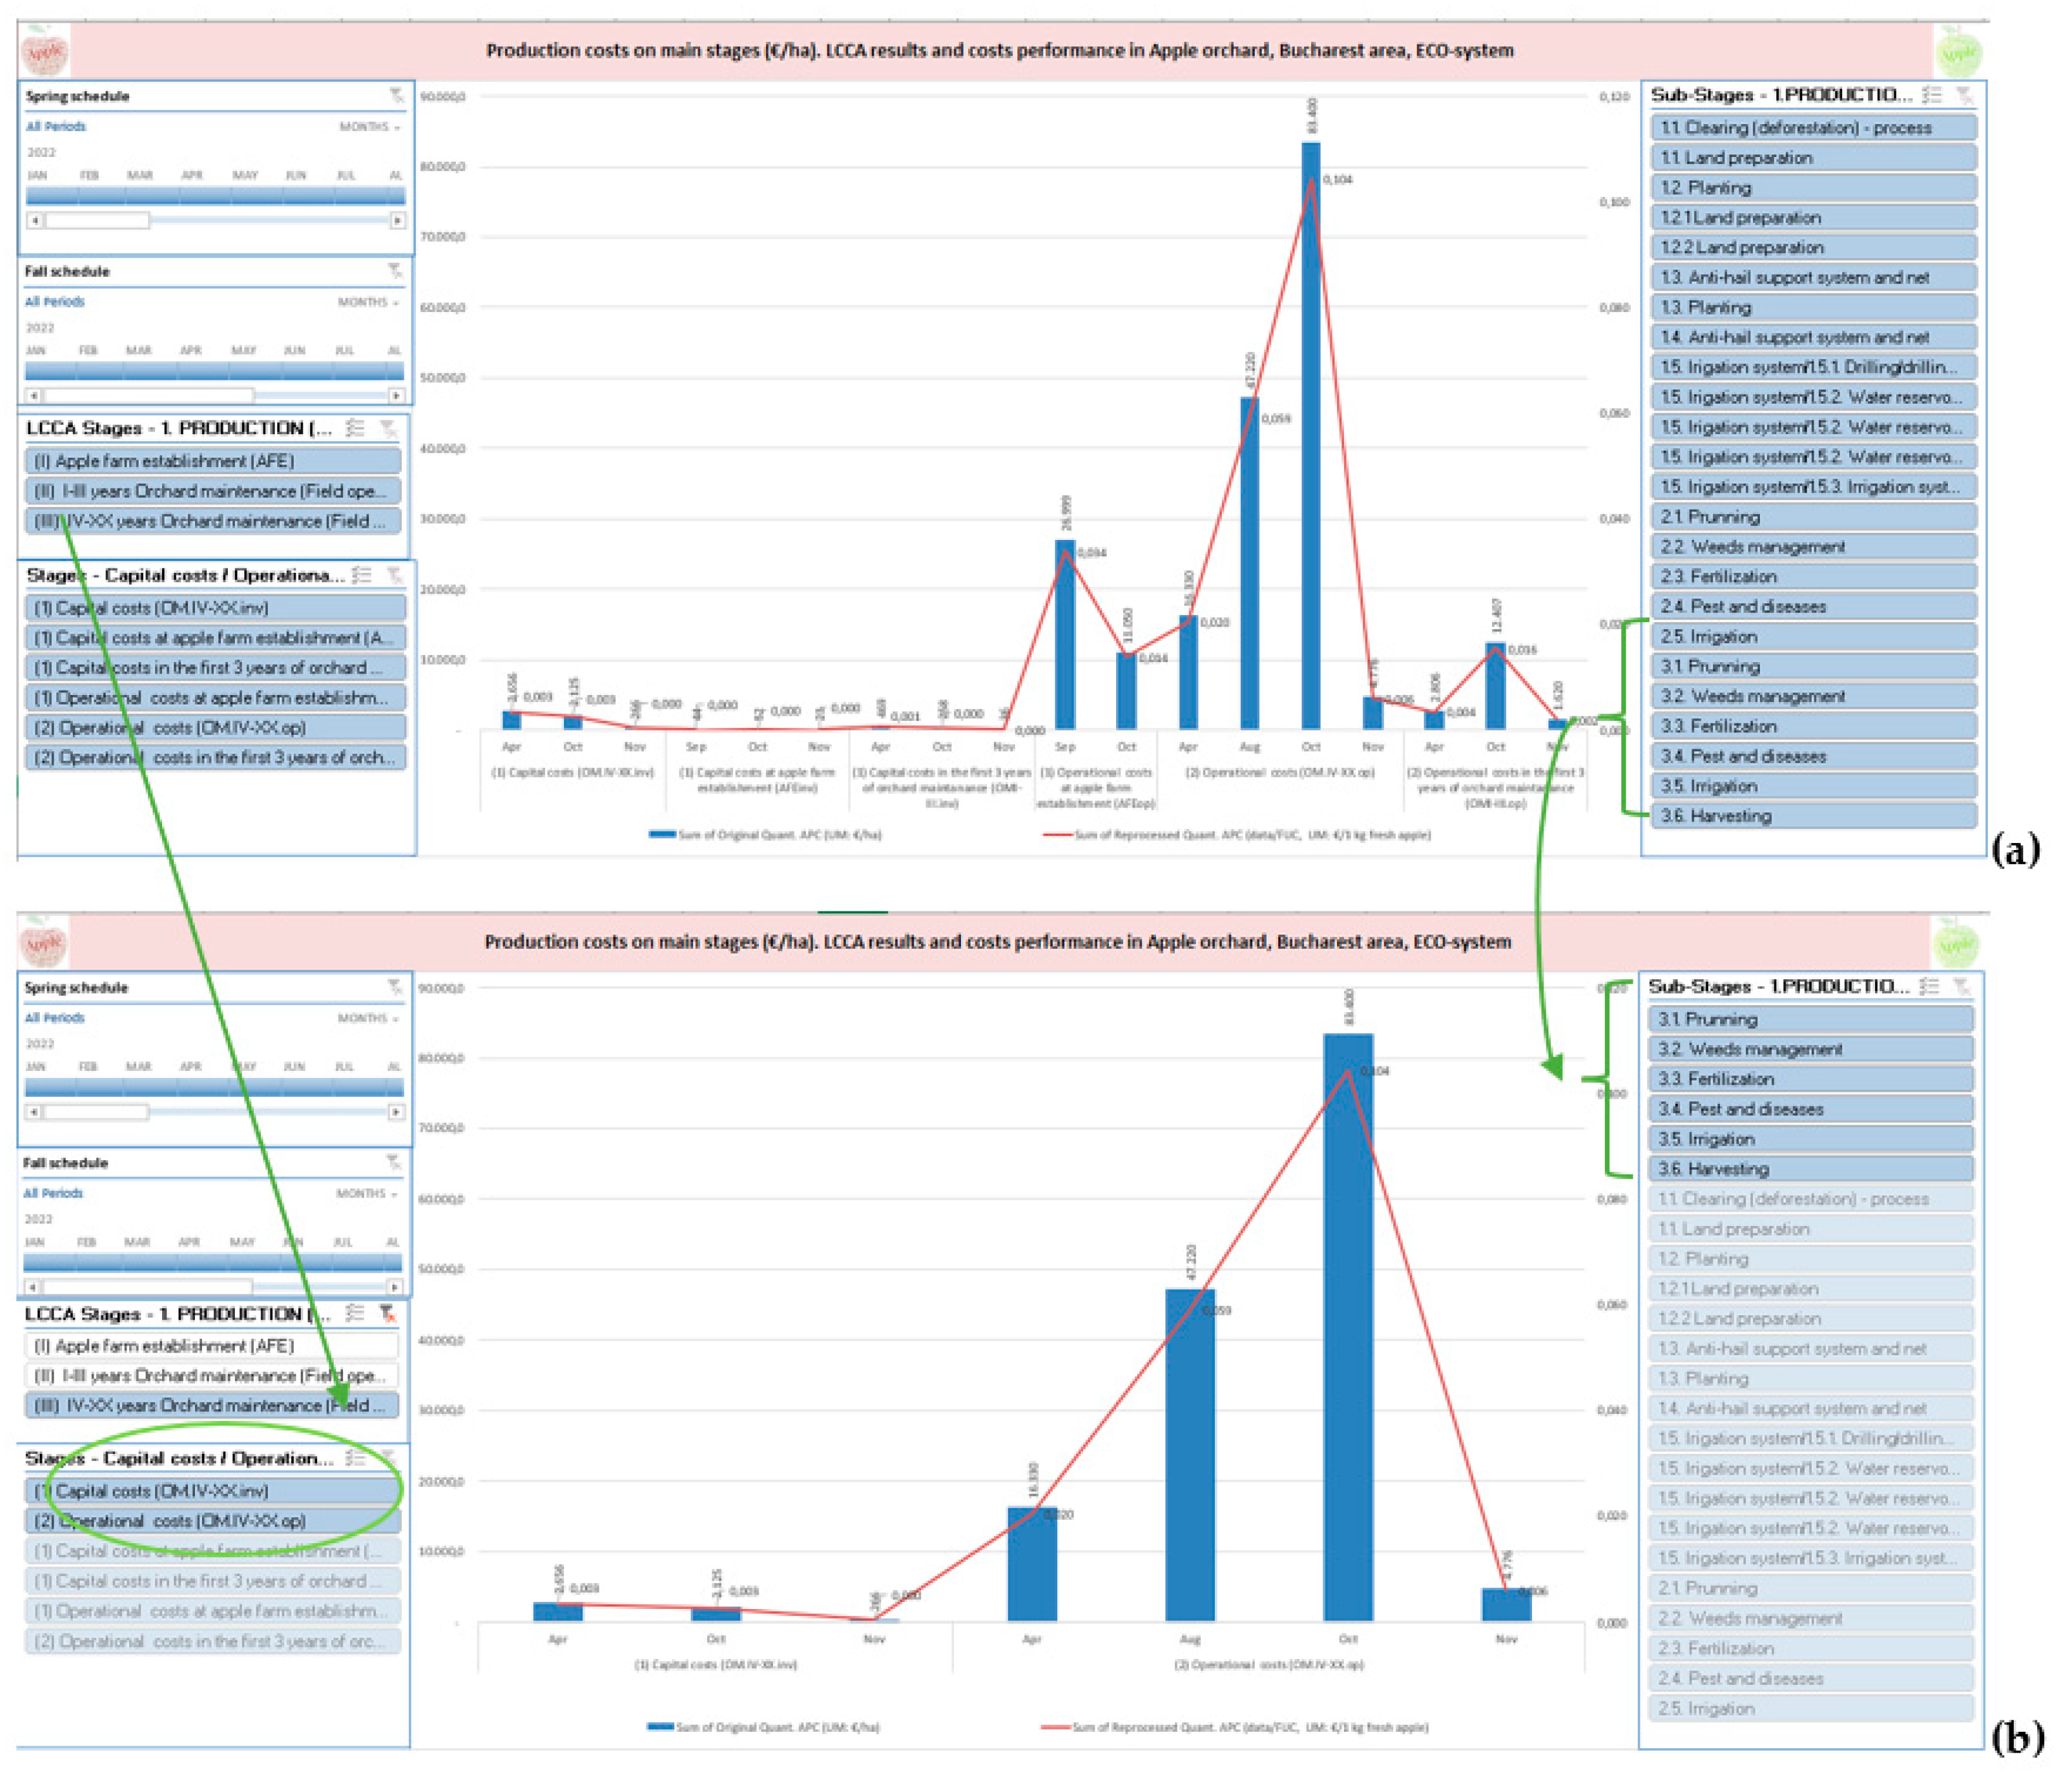
Integrating the fall and spring calendars in the dynamic visual presentation of results, could be done with the timeline Excel tools option. Thus, in the figure below (
Figure 8), it is presented a dashboard in which information can be selectively obtained regarding the costs of the different periods of work performance, within the different stages or substages of the production process in the orchard, as well as data regarding the month in which these works were carried out.
Hence, in the above example, for the Orchard maintenance sub-stage, years 4-20 (the period with harvest), the related capital and operational costs were displayed (section b of the Figure), for both timetables (autumn and spring), namely, 3.1 pruning, 3.2 weeds management, 3.3 fertilization, 3.4 pest and diseases, 3.5 irrigation and 3.6 harvesting. In the same way, it is possible to select any other stage or sub-stage, or any period from the registered calendars, for which the dashboard functionalities will display the related costs (capital and / or operating). As for the production stage, we processed the data from the post-harvest stage of the organic apple orchard. The illustration below (
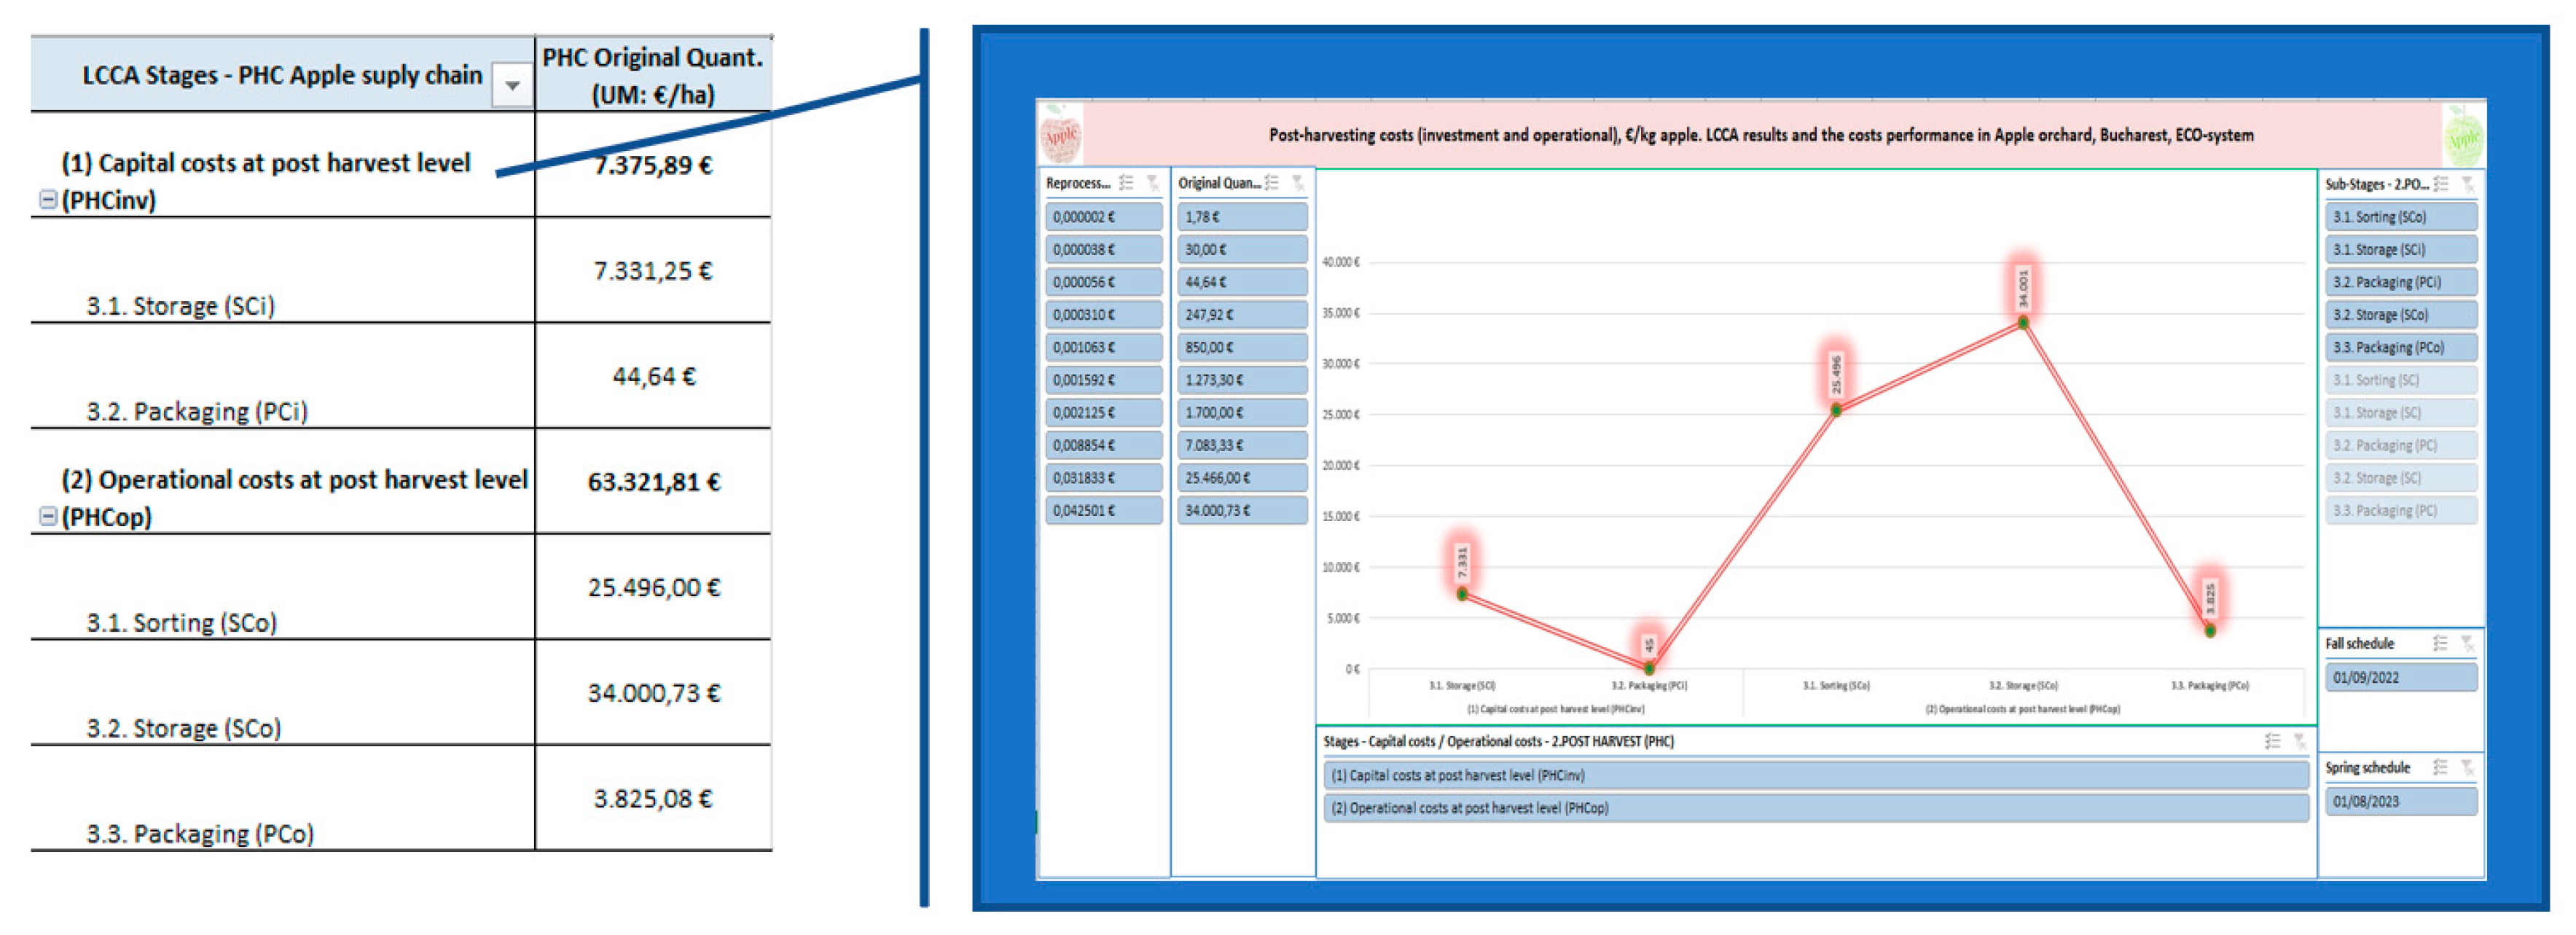
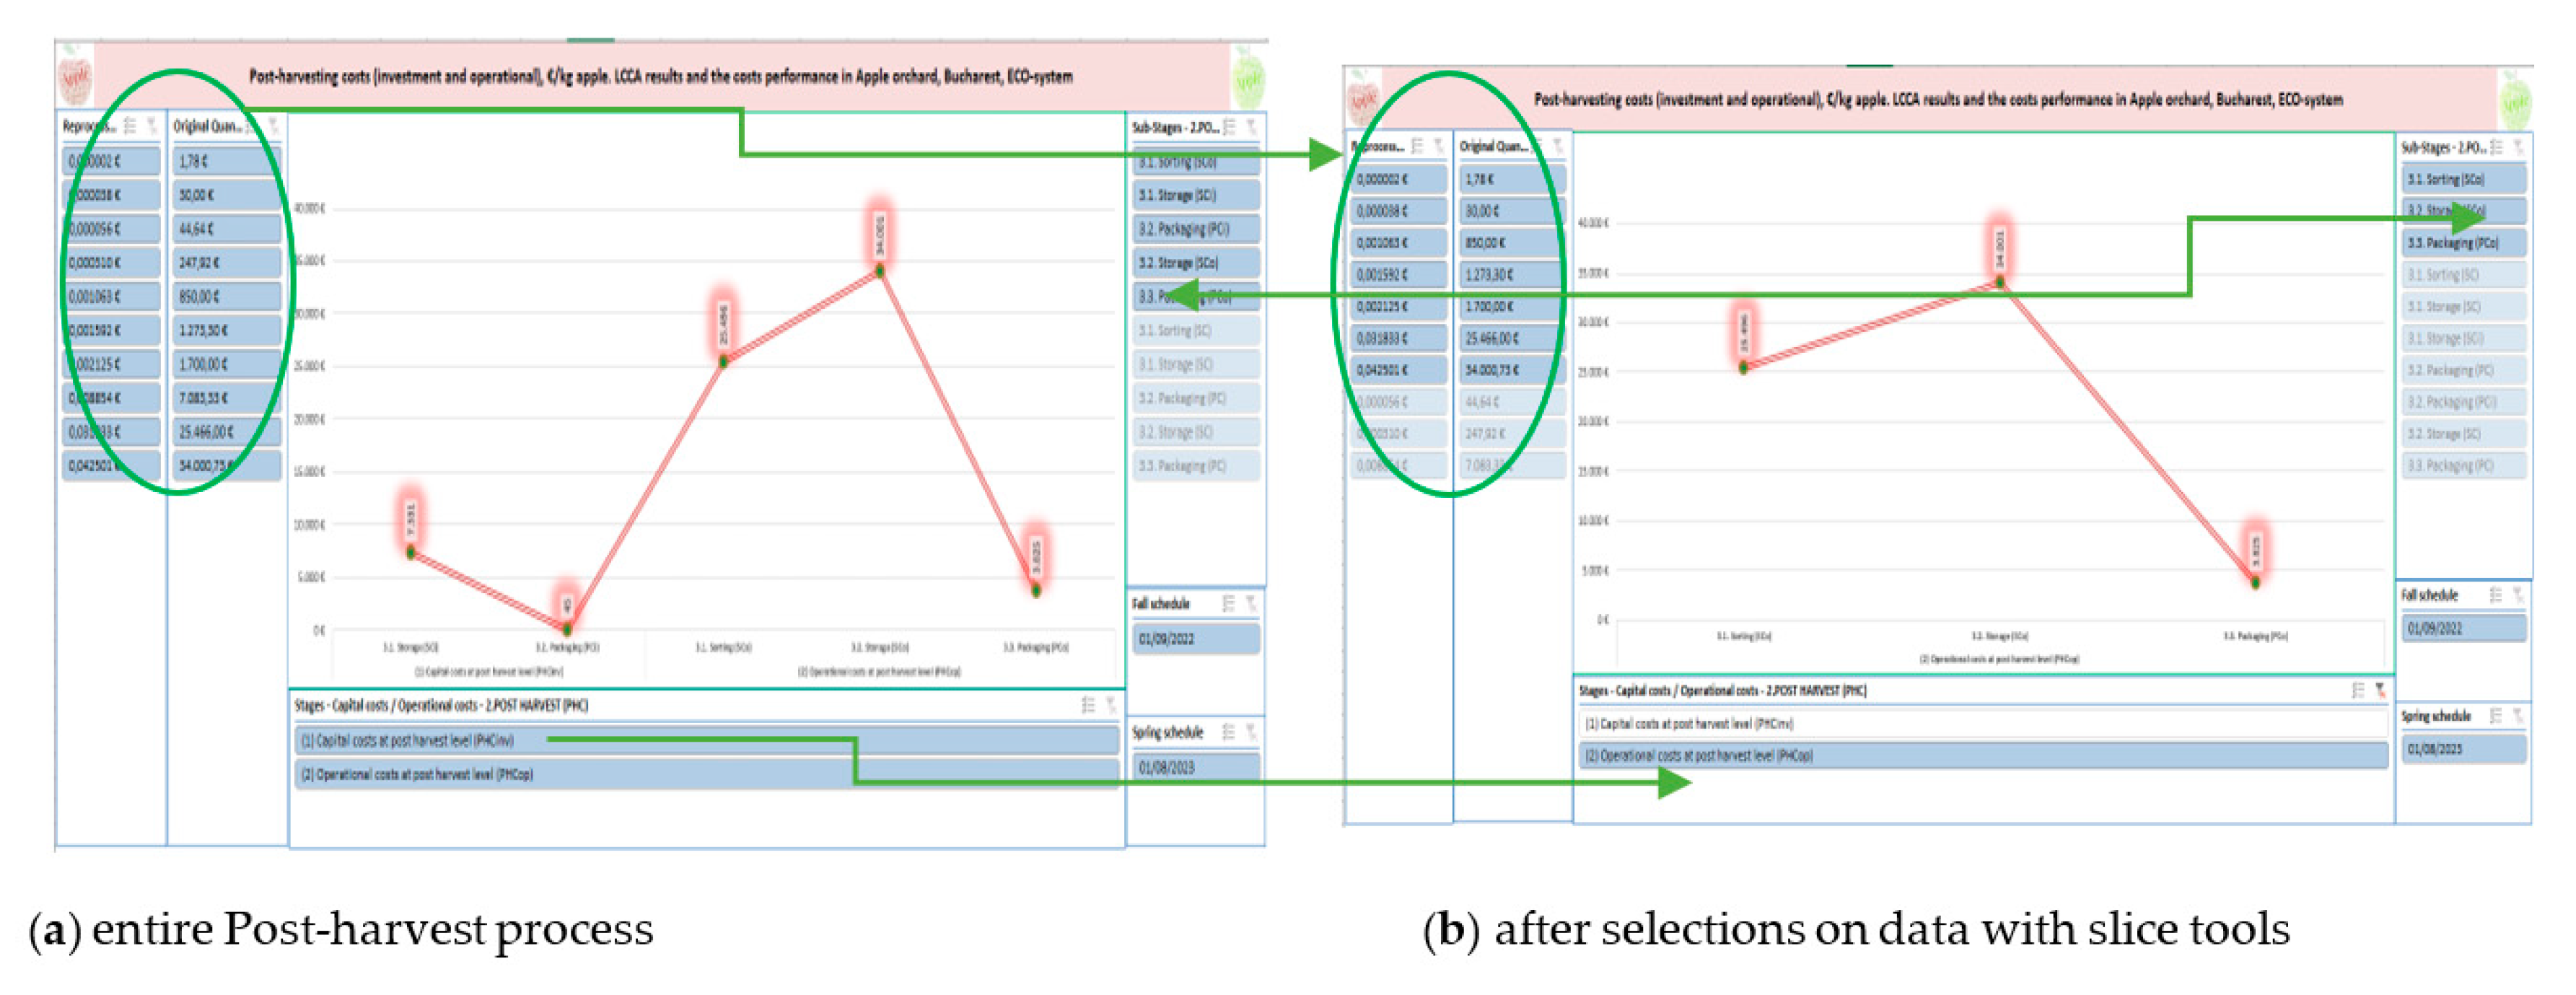
Figure 9) presents the pivot tables and related graphs allowing us to selectively identify the costs of certain sub-stages, on the periods of the attached calendars, or on the cost types (investment or operational).
An illustrative example on the interconnection of the presented results can be found in the two graphs below, which allow us to identify, scale and graphically visualize the level of operational costs in the post-harvest stage.
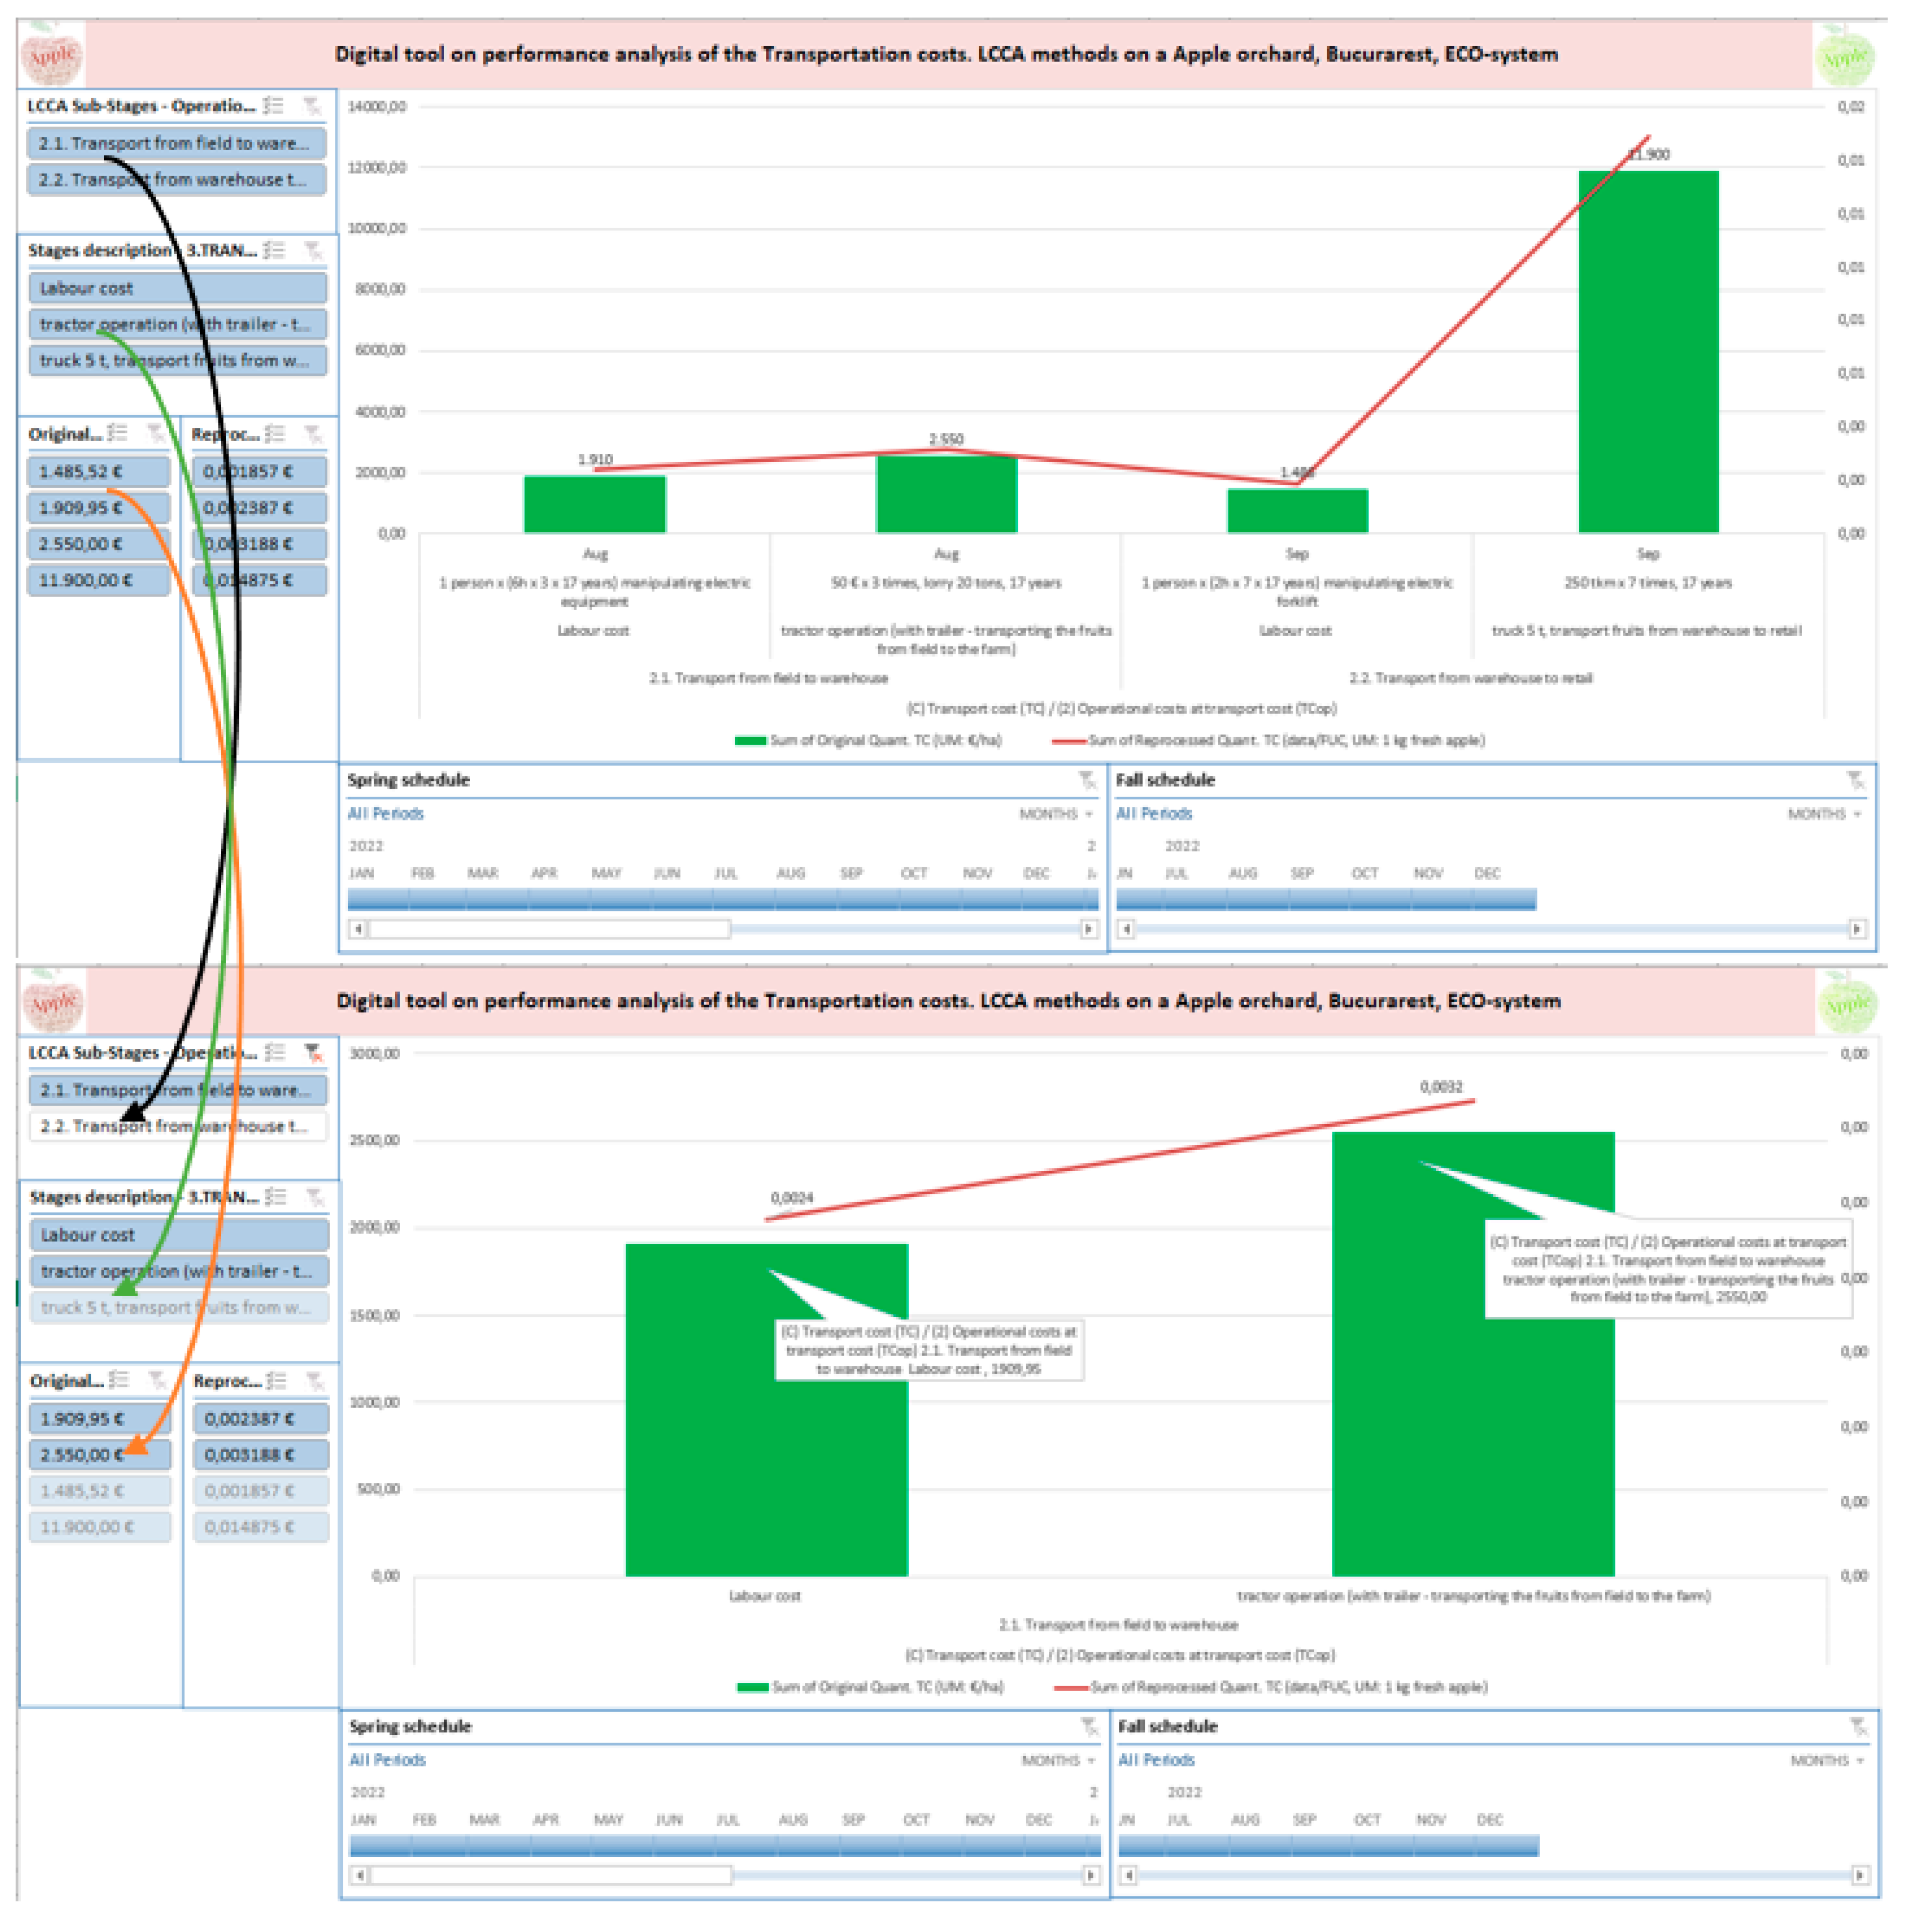
The Transport, which is in our case the last stage of the analyzed process, there was captured in the figures below (
Figure 10), where the dashboard and the selection slices for the sub-stage of transport from the field to the warehouse were figured.
In the figure below (
Figure 11), we detect the results after applying a filter on any element of the dynamic fields. In the second layer of the image, we spotted the scaling and graphical representation of the level in the operational costs for the transport stage from the field to warehouse. Thus, it was pointed out the labor costs and the tractor operation costs.
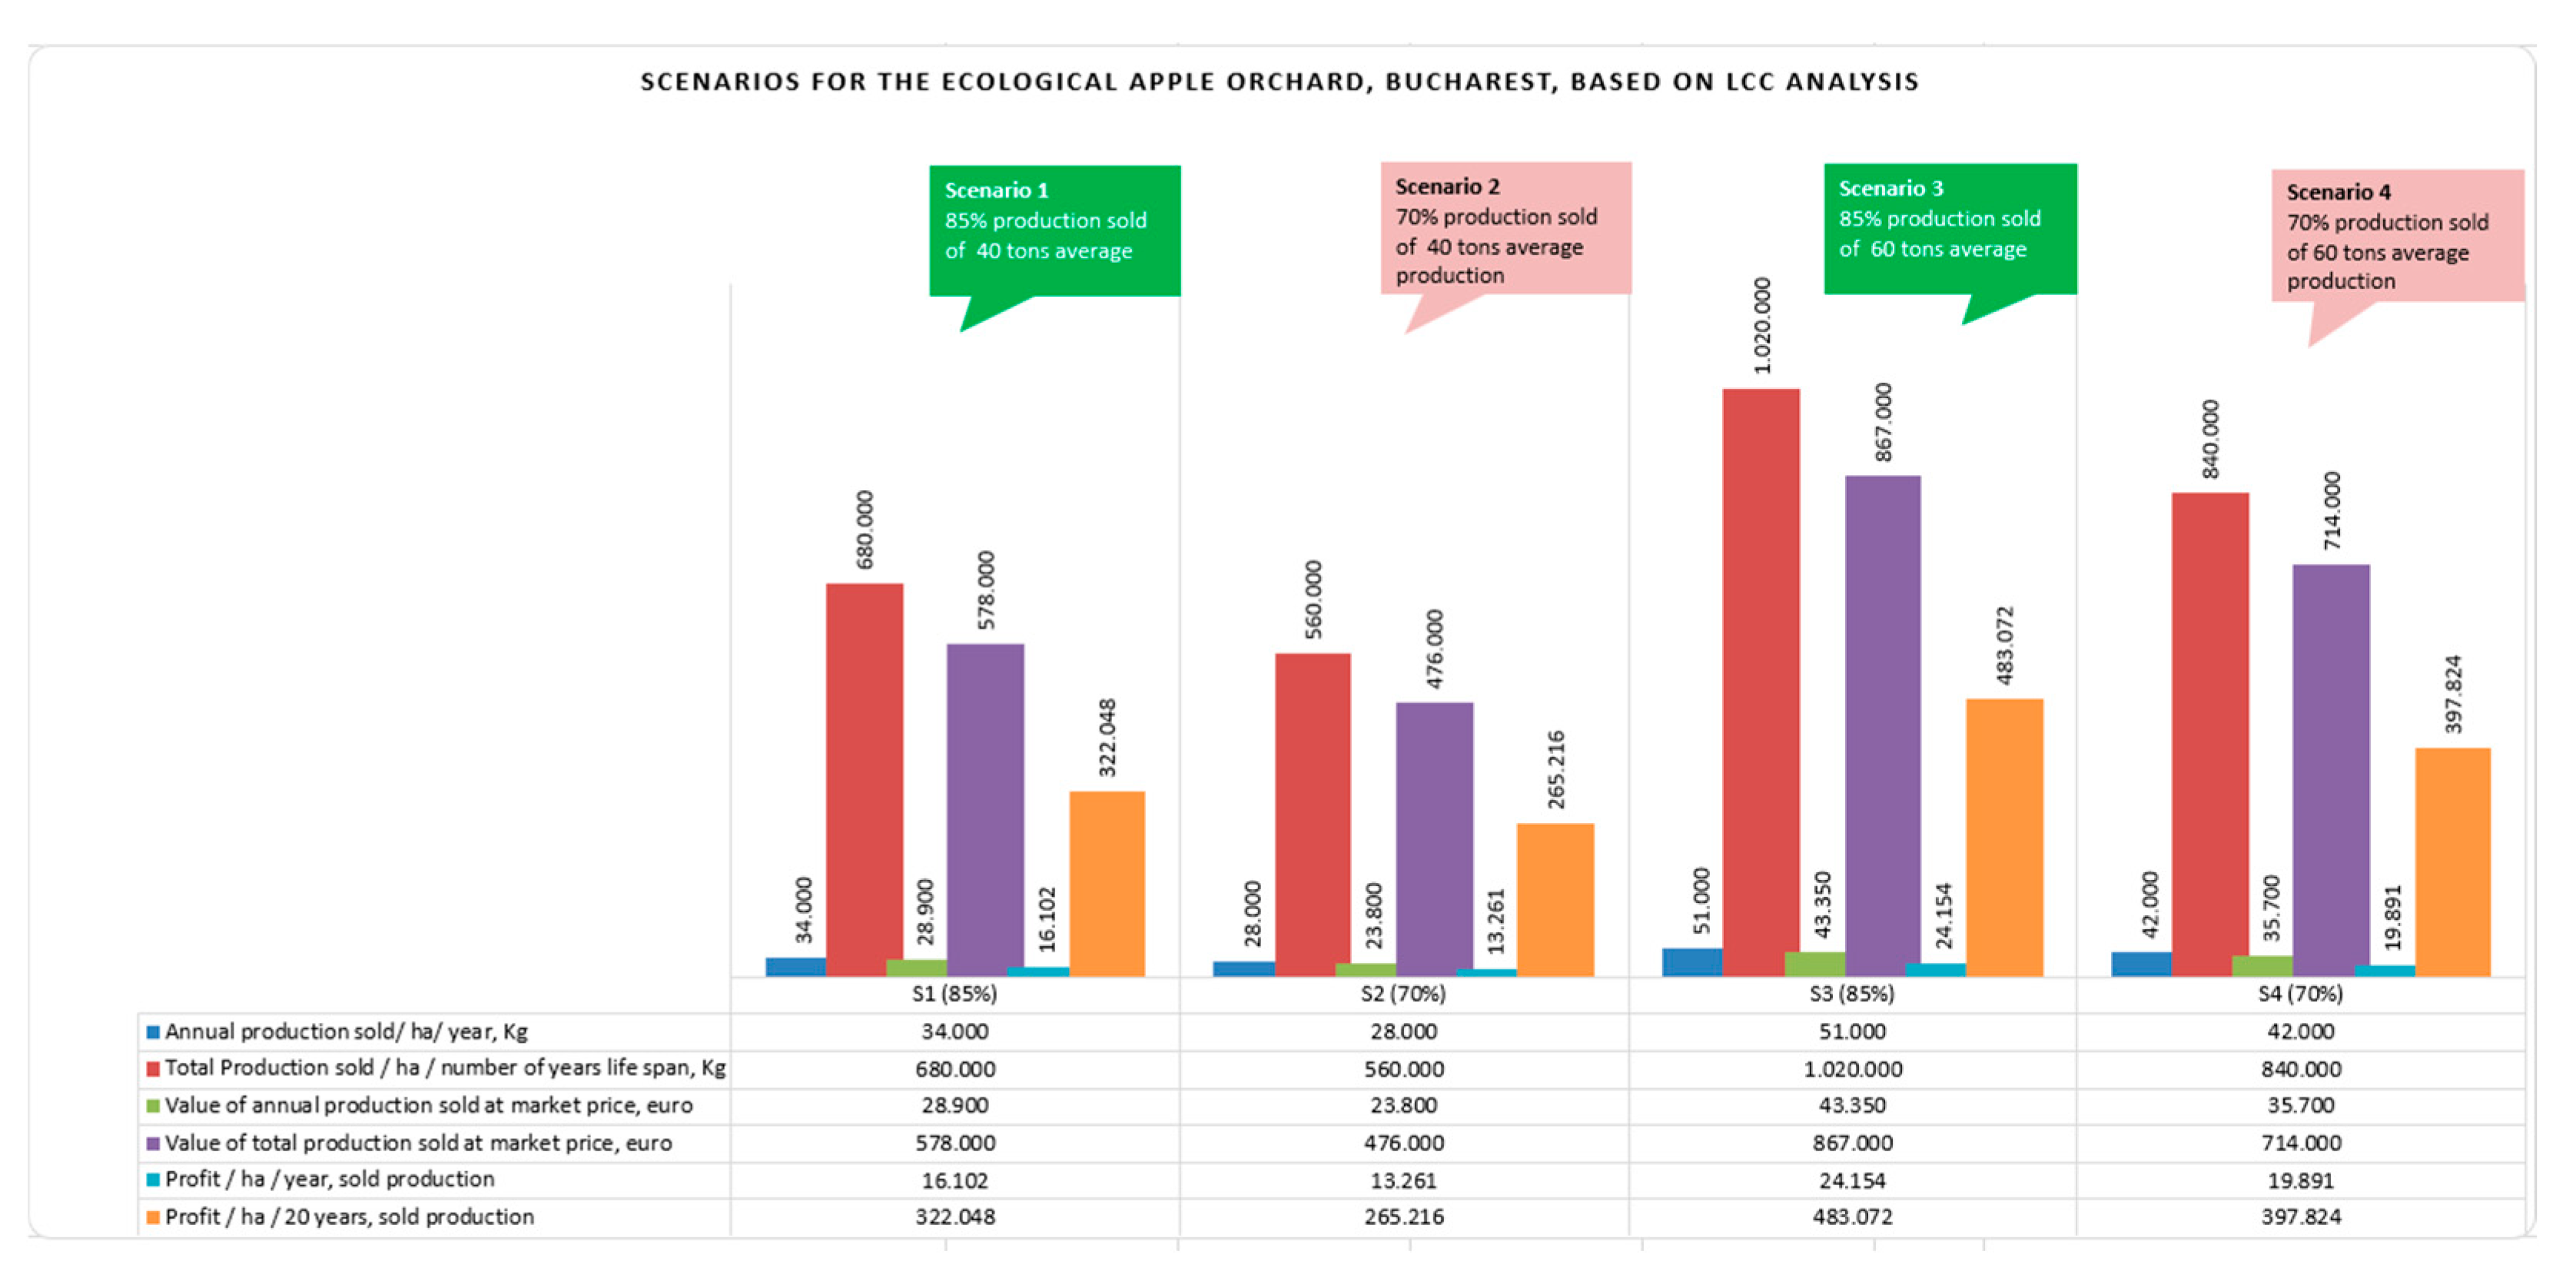
For the sensitivity analysis, we addressed elements regarding the level of capitalization of the production. This value is done by selling fresh apples on the market, for whose, we expressed the following mentions. In this study, we considered a basic scenario, in which 85% of the average yield (40 tons/ha) is used, and through the designed scenarios, we analyzed the economic indicators for a production of 60 tons/ha, in each of these two cases, having the optimistic scenario (capitalization of 85% of the total production) and the pessimistic scenario (capitalization of 70% of the total production). It is considered that the remaining 15% (optimistic scenario), respectively 30% of the production (pessimistic scenario), cannot be sell on the market, this representing, as the case may be, losses, transformation in a derived or alternative product (e.g. apple juice) or could be apples introduced in a composting process, which in the end would represent a re-uses in the orchard exploitation process, as natural compost. Of course, in an exhaustive analysis, the level of capitalization of the production, the capacity and costs related to the storage spaces (which most of the time are quite limited), can be examined in detail and could change the results frame. The table below (
Table 4) illustrate the four scenarios presented above.
Thus, they appear in absolute values, the level of the annual production sold and the profit per hectare, per year and for the entire period of exploitation of the organic apple orchard. The profit counted per hectare, related to the sold production, is a gross profit (i.e. taxes and other charges have not been considered).
The figure below (
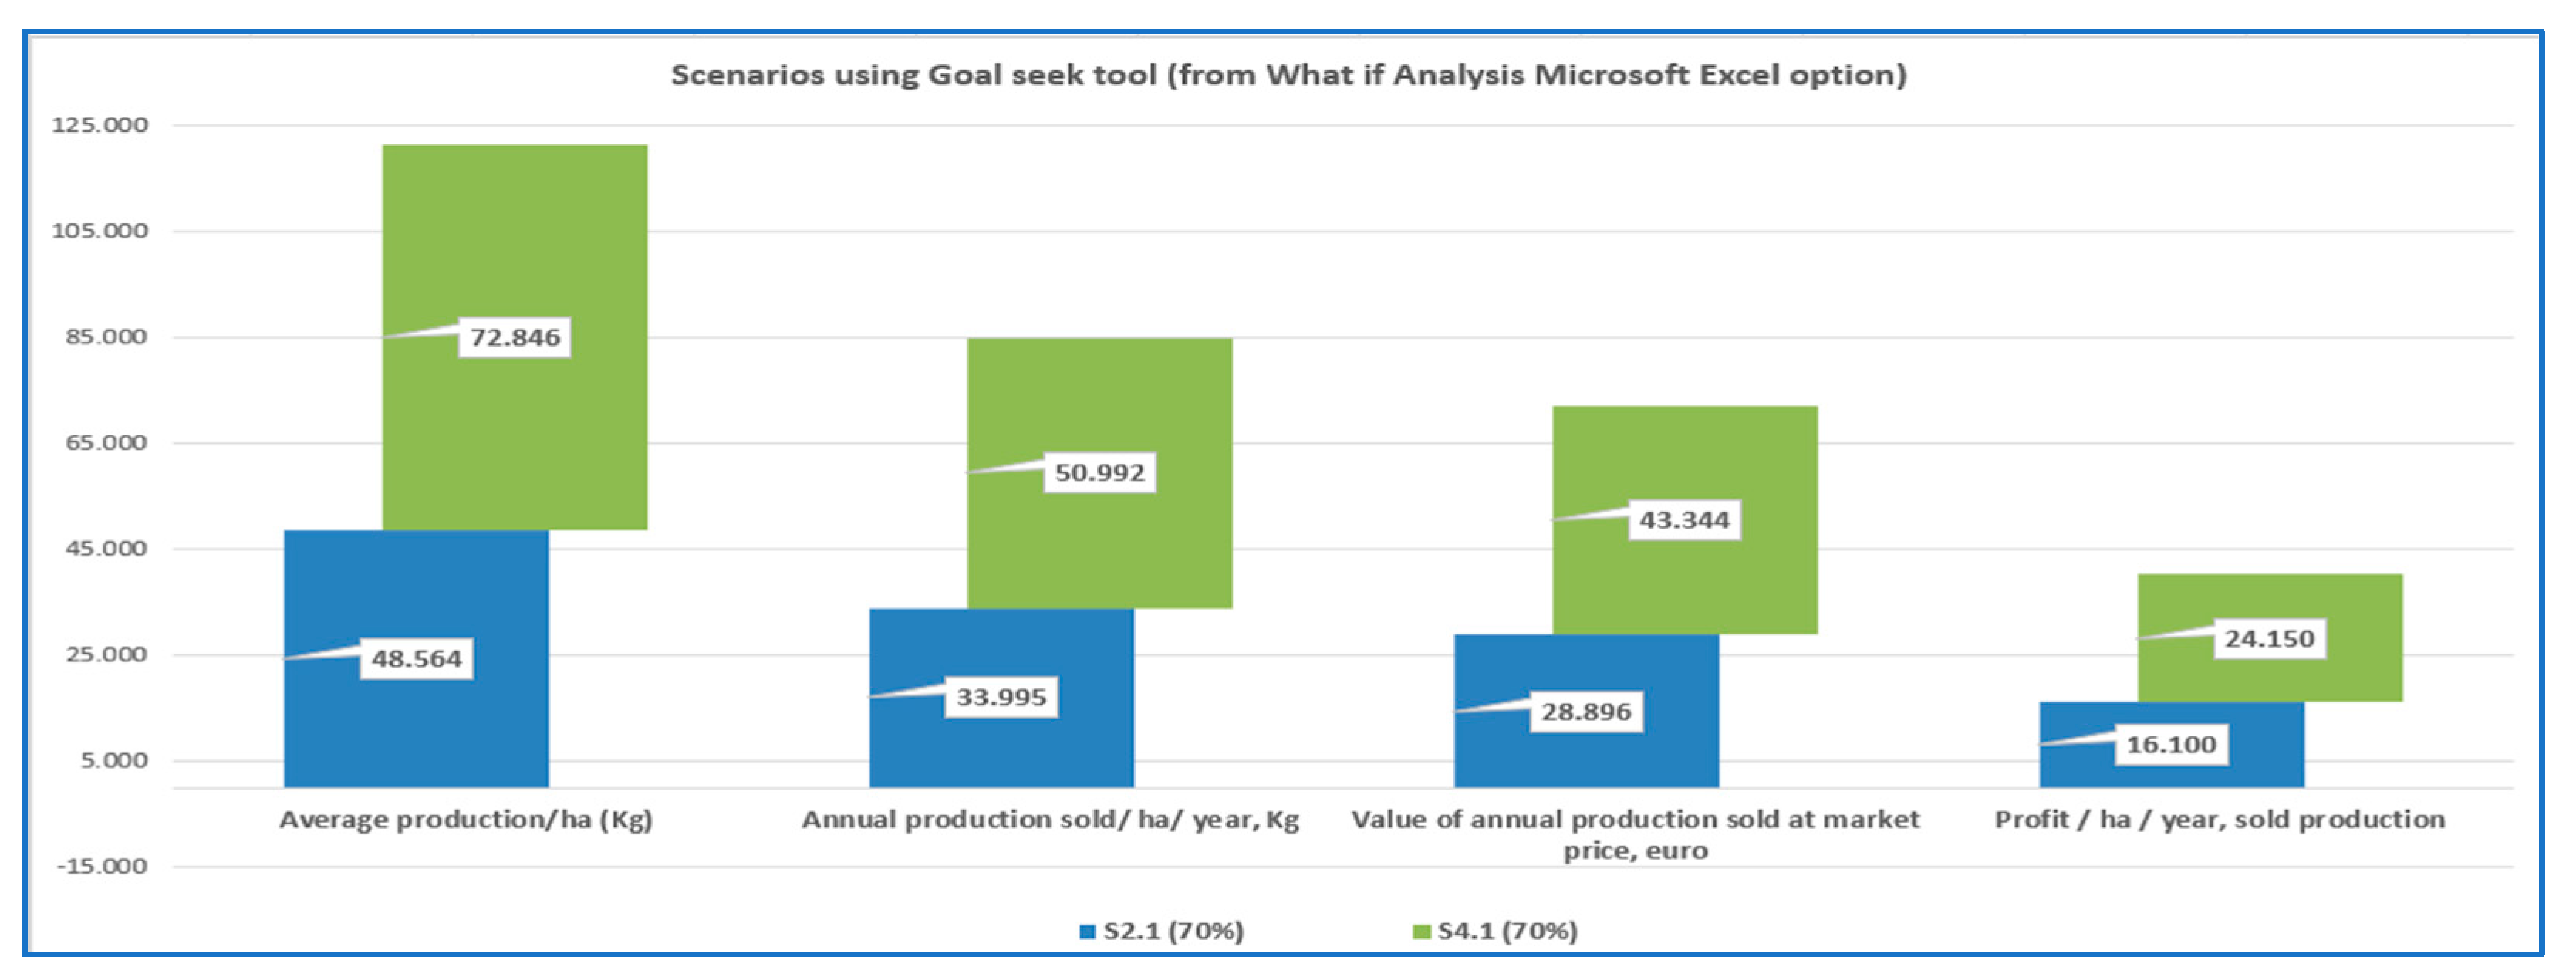
Figure 12) helps us to comparatively identify the 4 scenarios, with different levels of production and with different average returns. Meanwhile, within the sensitivity analysis, we tried to find out what would be the required level of production from the two previously presented pessimistic scenarios (70% share of production capitalization), in order to obtain the same level of the benefit, as in the optimistic scenarios (when it is sold 85% of the production). This was facilitated by Excel Microsoft’s use of the “What if Analysis” section.
The results can be found in the table below (
Table 5), from where it can be easily identified that an average production of 48.5 tons, with a capitalization of 70%, would ensure a profit of 322,000 euros /ha/ 20 years, as in the case of the first scenario, S2.1, where a production of 40 tons would be recorded, with a share of 85% in the sold production. For the second case, S4.1, an annual average production of about 72.8 tons/ha would be needed to achieve a similar profit to the scenario 3, S3, where the production reached out 60 tons and the production was sold at a level of 85%. The graphical representation of the two scenarios, S2.1 and S4.1, was made in the figure below (
Figure 13).
In this figure it can be identified the level of the four economic indicators: Average production, Annual production sold/ha/year, Value of annual production sold at market price and Profit/ha/year, considering a market price of 0.850 euro/1kg of fresh apple.
4. Conclusions
LCCA is a method that allows obtaining reliable results, by the degree of detail of the data needed and by the scope of the lifetime covered for the studied process, while also having the advantage of limiting or extending the reference period and the limits up to which the system is analyzed. The time period considered can be examine from the first step in the establishment of the apple orchard until its termination, at the limit of the period for normal exploitation, depending on the cultivated varieties and the desire to maintain it. In our case, for an apple orchard operated in an organic system, the LCCA analysis was done within a system boundary, starting from the establishment stage of the orchard until the Transportation stage, from field to warehouse and from the warehouse to retail for a 20 years life span of the orchard.
Regarding the three main stages in the farm’s exploitation process, we can state, according to the LCCA analysis, the fact that the predominant costs are the operational ones, especially those in the production stage (97.21%, of the total cost in the main stage). In terms of capital costs, the Post-Harvest stage is the most expensive (10.43%); the lowest allocation of financial resources was made for the plantation establishment costs, while for the Transport stage, we have no capital costs at all, in our case particularly for the orchard, within the boundary system chosen. Even so, the Transport operational costs represent only 5.93% of the total LCC, followed at a very long distance by the Post-Harvest costs, of 23.48% of the total LCC cost.
The highest costs, representing 151726 euros/ha/20 years (52.72% of the total operational costs and 50.4% of the total farm costs/ha/20 years), were recorded in the orchard exploitation stage, in the operational category. At the same time, the scenarios in the sensitivity analysis considered different levels of average production (40 tons and 60 tons respectively) and different degrees of production utilization (85% in the optimistic scenario and 70% in the pessimistic scenario). The hotpoints identified at the establishment and exploitation stage were the costs related to the use of agricultural machinery, certain pesticides and insecticides, the costs of seedlings, anti-hail net, plastic boxes and labor cost. At the post-harvest stage, the most important costs were those related to labor cost and energy consumption, for storage capacity. The transport stage has had important costs with tractor operation and the track for carrying the fruits. The LCC calculated was 0,3764 euro/FUC (1Kg of fresh apple). Taking into consideration a level of 85% of the production sold on the market, for 0,8500 euro/kg (market price), the annual revenue of the farm was evaluated at 28900 euro/ha. The calculated profit/ha/year was 16102 euro, this means that on the hole period of the farm exploitation (20 years), the total profit was approximated at about 322000 euro/ha. Of course, the overall approach in this paper could be improved and we acknowledge that this study should be completed with a deeper analysis on the financial indicators, which will provide more information about the real dimension of the money cashflow, net present value, payback period of the investment etc. However, presenting such a large amount of economic information and extensive results, the LCCA methodology should receive a higher attention from the stakeholders and from the academic research field, especially in order to reduce the environmental burden of food and farming systems.
Author Contributions
Conceptualization, I.M.V., A.C.B., G.F., L.B., F.S. and C.A.M.; methodology, I.M.V., A.C.B., G.F. and L.B.; validation, I.M.V., A.C.B., G.F. and L.B.; formal analysis, I.M.V. and A.C.B.; investigation, I.M.V. and A.C.B.; resources, A.C.B., L.B., F.S. and C.A.M; data curation, I.M.V., A.C.B., F.S. and C.A.M.; writing—original draft preparation, I.M.V. and A.C.B.; writing—review and editing, I.M.V., A.C.B., G.F., L.B., F.S. and C.A.M.; visualization, I.M.V., A.C.B., G.F., L.B., F.S. and C.A.M.; supervision, G.F., L.B., F.S. All authors have read and agreed to the published version of the manuscript.
Funding
This research was funded by USAMV of Bucharest, Romania, grant number 1260/2021. The APC was funded by USAMV of Bucharest, Romania.
Data Availability Statement
Acknowledgments
We would like to address special thanks to Prof. PhD Girma Gebresenbet and Prof. PhD Bosona Techane from Division of Energy and Technology; Automation, Swedish University of Agricultural Sciences, Uppsala, Sweden.
Conflicts of Interest
The authors declare no conflict of interest.
References
- Cerutti, A.K.; Beccaro, G.L.; Bruun, S.; Bosco, S.; Donno, D.; Notarnicola, B.; Bounous, G. Life cycle assessment application in the fruit sector: State of the art and recommendations for environmental declarations of fruit products. Journal of Cleaner Production 2014, 73, 125–135. [Google Scholar] [CrossRef]
- Bosona, T.; Gebresenbet, G.; Dyjakon, A. Implementing life cycle cost analysis methodology for evaluating agricultural pruning-to-energy initiatives. Bioresource Technology Reports 2019, 6, 54–62. [Google Scholar] [CrossRef]
- Vlad, I.M.; Butcaru, A.C.; Bădulescu, L.; Fîntîneru, G.; Certan, I. Review on the Tools Used in the Life Cycle Cost Analysis. Scientific Papers Series Management, Economic Engineering in Agriculture and Rural Development 2022, 22, 807–816. [Google Scholar]
- Butcaru, A.C.; Certan, I.; Cătuneanu, I.L.; Stănică, F.; Bădulescu, L. A Literature Review of Life Cycle Cost Analysis Technique Applied to Fruit Production. Scientific Papers. Series B, Horticulture 2021, LXV. [Google Scholar]
- Vlad, I.M.; Butcaru, A.C.; Fîntîneru, G.; Bădulescu, L.; Stănică, F.; Toma, E. Mapping the Preferences of Apple Consumption in Romania. Horticulturae 2023, 9, 35. [Google Scholar] [CrossRef]
- Dyjakon, A.; den Boer, J.; Gebresenbet, G.; Bosona, T.; Adamczyk, F. Economic analysis of the collection and transportation of pruned branches from orchards for energy production. Drewno 2020, 63. [Google Scholar] [CrossRef]
- Nati, C.; Boschiero, M.; Picchi, G.; Mastrolonardo, G.; Kelderer, M.; Zerbe, S. Energy performance of a new biomass harvester for recovery of orchard wood wastes as alternative to mulching. Renewable Energy 2018, 121–128. [Google Scholar] [CrossRef]
- Frem, M.; Fucilli, V.; Petrontino, A.; Acciani, C.; Bianchi, R.; Bozzo, F. Nursery Plant Production Models under Quarantine Pests’ Outbreak: Assessing the Environmental Implications and Economic Viability. Agronomy 2022, 12, 2964. [Google Scholar] [CrossRef]
- García, G.J.; Castellanos, G.B.; García, G.B. Economic and Environmental Assessment of the Wine Chain in Southeastern Spain. Agronomy 2023, 13, 1478. [Google Scholar] [CrossRef]
- Harris, S.; Tsalidis, G.; Corbera, J.B.; Gallart, J.E.; Tegstedt, F. Application of LCA and LCC in the early stages of wastewater treatment design: A multiple case study of brine effluents. Journal of Cleaner Production 2021, 307, 127–298. [Google Scholar] [CrossRef]
- Scuderi, A.; Timpanaro, G.; Branca, F.; Cammarata, M. Economic and Environmental Sustainability Assessment of an Innovative Organic Broccoli Production Pattern. Agronomy 2023, 13, 624. [Google Scholar] [CrossRef]
- Ramez, S.M.; Verrastro, V.; Cardone, G.; Bteich, M.R.; Favia, M.; Moretti, M.; Roma, R. 2014. Optimization of organic and conventional olive agricultural practices from a Life Cycle Assessment and Life Cycle Costing perspectives. Journal of Cleaner Production 2014, 78–89. [Google Scholar]
- Castellanos, G.B.; García, G.B.; García, G.J. Evaluation of the Sustainability of Vineyards in Semi-Arid Climates: The Case of Southeastern Spain. Agronomy 2022, 12, 3213. [Google Scholar] [CrossRef]
- De Menna, F.; Dietershagen, J.; Loubiere, M.; Vittuari, M. Life cycle costing of food waste: A review of methodological approaches. Waste Management 2018, 73, 1–13. [Google Scholar] [CrossRef]
- Capacity4dev. Circular Economy. Available online: https://capacity4dev.europa.eu/resources/results-indicators/circular-economy_en (accessed on July 2023).
- Whole Building Design Guide. Life-Cycle Cost Analysis, National Institute of Standards and Technology, Fuller S. 2016. Available online: https://www.wbdg.org/resources/life-cycle-cost-analysis-lcca (accessed on July 2023).
- Braniște, N.; Uncheașu, G. Determinator pentru soiuri de mere [Apple cultivars determinator]; Ceres Publishing House Bucharest: Romania, 2011. [Google Scholar]
- Braniște, N.; Budan, S.; Butac, M.; Militaru, M. Soiuri de pomi, arbuști fructiferi și căpșuni create în România [Fruit, shrubs and strawberry cultivars created in Romania]; Paralela 45 Publishing House Bucharest: Romania, 2007. [Google Scholar]
- Stănică, F.; Braniște, N. Ghid pentru pomicultori [Guide for fruit growers]; Ceres Publishing House Bucharest: Romania, 2011. [Google Scholar]
- Hoza, D. Sfaturi practice pentru cultura pomilor [Guide for fruit growing]; Nemira Publishing House Bucharest: Romania, 2003. [Google Scholar]
- Asănică, A.; Hoza, D. Pomologie [Pomology]; Ceres Publishing House Bucharest: Romania, 2013. [Google Scholar]
- Blažek, J.; Hlušičková, I. Orchard performance and fruit quality of 50 apple cultivars grown or tested in commercial orchards of the Czech Republic. Hort. Sci. (Prague) 2007, 34, 96–106. [Google Scholar] [CrossRef]
- Cătuneanu, B.I.; Bădulescu, L.; Dobrin, A.; Stan, A.; Hoza, D. The influence of storage in controlled atmosphere on quality indicators of tree blueberries varieties. Scientific Papers. Series B, Horticulture 2017, LXI, 91–100. [Google Scholar]
- Chira, C.L. Controlul calității fructelor [Fruit quality management]; Ceres Publishing House: Bucharest, Romania, 2008. [Google Scholar]
- Corollaro, M.L.; Aprea, E.; Endrizzi, I.; Betta, E.; Demattè, M.L.; Charles, M.; Bergamaschi, M.; Costa, F.; Biasioli, F.; Grappadelli, L.C.; Gasperi, F. A combined sensory-instrumental tool for apple quality evaluation. Postharvest Biology and Technology 2014, 96, 135–144. [Google Scholar] [CrossRef]
- Delian, E.; Petre, V.; Burzo, I.; Bădulescu, L.; Hoza, D. Total phenols and nutrients composition aspects of some apple cultivars and new studied breeding creations lines grown in Voineşti area – Romania. Romanian Biotechnological Letters 2011, 16, 6722–6729. [Google Scholar]
- Oltenacu, N.; Lascăr, E. Capacity of maintaining the apples quality, in fresh condition-case study. Scientific Papers Series Management, Economic Engineering in Agriculture and Rural Development 2015, 15, 331–335. [Google Scholar]
- Chira, C.L. Tehnici hortiviticole compatibile cu mediul [Environmentally friendly horticultural techniques]; Ceres Publishing House: Bucharest, Romania, 2005. [Google Scholar]
- Ghena, N.; Braniște, N.; Stănică, F. General Pomology; Matrix Rom Publishing House: Bucharest, Romania, 2004. [Google Scholar]
- Moura, C.; Masson, M.; Yamamoto, C. Effect of osmotic dehydration in the apple varieties Gala, Gold and Fuji. Thermal Engineering 2005, 4, 46–49. [Google Scholar]
- Kellerhals, M.; Angstl, J.; Pfammatter, W.; Rapillard, C.; Weibel, F. Portrait des variétés de pommes résistantes à la tavelure. Revue suisse Vitic. Arboric. Hortic. 2004, 36, 29–36. [Google Scholar]
- Ștefan, N.; Glăman, G.; Braniște, N.; Stănică, F.; Duțu, I.; Coman, M. Pomologia României IX, X [Romanian Pomology IX, X]; Ceres Publishing House: Bucharest, Romania, 2018. [Google Scholar]
- Saei, A.; Tustin, D.; Zamani, Z.; Talaie, A.; Hall, A. Cropping effects on the loss of apple fruit firmness during storage: The relationship between texture retention and fruit dry matter concentration. Scientia Horticulturae 2011, 130, 256–265. [Google Scholar] [CrossRef]
- Hampson, C.R.; Quamme, H.A.; Hall, J.W.; MacDonald, R.A.; King, M.C.; Cliff, M.A. Sensory evaluation as a selection tool in apple breeding. Euphytica 2000, 111, 79–90. [Google Scholar] [CrossRef]
- Vlad, I.M.; Butcaru, A.C.; Burcea, M.; Chiurciu, I.; Toma, E.; Stanciu, T. Assessing the Apple Sector in Romania and Insights on the Consumption. Scientific Papers Series Management, Economic Engineering in Agriculture & Rural Development 2022, 22, 795–806. [Google Scholar]
- National Institute of Statistics database. Available online: http://statistici.insse.ro:8077/tempo-online/#/pages/tables/insse-table (accessed on February 2022).
- Eurostat database. Available online: https://ec.europa.eu/eurostat/data/database (accessed on February 2022).
- Cole, R.J.; Sterner, E. Reconciling theory and practice of life-cycle costing. Building Research & Information 2000, 28, 368–375. [Google Scholar] [CrossRef]
- Guidelines and Standards for performing LCC Analysis, ISO 15686-5/2017 /15663.
- Giacomella, L. Techno economic assessment (TEA) and Life Cycle Costing analysis (LCCA): discussing methodological steps and integrability. Master Thesis, Università Degli Studi Di Ferrara, Italy, 2020. [Google Scholar]
- Frem, M.; Fucilli, V.; Petrontino, A.; Acciani, C.; Bianchi, R.; Bozzo, F. Nursery Plant Production Models under Quarantine Pests’ Outbreak: Assessing the Environmental Implications and Economic Viability. Agronomy 2022, 12, 2964. [Google Scholar] [CrossRef]
- Duffie, J.A. Modeling and Simulation of Active Systems in Solar Energy Conversion II, Economic Evaluations, Selected Lectures from the 1980 International Symposium on Solar Energy Utilization, London, Ontario, Canada August 10–24, 1981, Pages 131-154. Available online: https://www.sciencedirect.com/science/article/pii/B9780080253886500246.
- Batca-Dumitru, C.G.; Sahlian, D.N.; Sendroiu, C. Costul ciclului de viață al produselor. CECCAR Business Review 2023, nr. 3, ISSN 2668-8921. Available online: www.ceccarbusinessreview.ro.
- A guide on the basic principles of Life-Cycle Cost Analysis (LCCA) of pavements, 2018. European Concrete Paving Association. Available online: https://www.eupave.eu/resources/publication-a-guide-on-the-basic-principles-of-life-cycle-cost-analysis-lcca-of-pavements.
Figure 1.
The Romanian counties with the highest apple production.
Figure 1.
The Romanian counties with the highest apple production.
Figure 2.
The shares of the number of trees, broken down by the eight counties of Romania and by legal form of the farms.
Figure 2.
The shares of the number of trees, broken down by the eight counties of Romania and by legal form of the farms.
Figure 3.
Areas in Romania with the highest apple consumption.
Figure 3.
Areas in Romania with the highest apple consumption.
Figure 4.
Simplified presentation of the main LCCA stages&sub-stages and the boundary system.
Figure 4.
Simplified presentation of the main LCCA stages&sub-stages and the boundary system.
Figure 5.
LCCA results on the costs performance in organic apple orchard.
Figure 5.
LCCA results on the costs performance in organic apple orchard.
Figure 6.
Dynamic selection tabel, Apple suply chain.
Figure 6.
Dynamic selection tabel, Apple suply chain.
Figure 7.
Data processing on the Production stage in organic apple orchard .
Figure 7.
Data processing on the Production stage in organic apple orchard .
Figure 8.
Dashboard with selection on type costs by slices and timelines. (a) initial data and (b) after the dynamic selection criteria.
Figure 8.
Dashboard with selection on type costs by slices and timelines. (a) initial data and (b) after the dynamic selection criteria.
Figure 9.
Dynamic table and selection dashboard for the Post-Harvest stage.
Figure 9.
Dynamic table and selection dashboard for the Post-Harvest stage.
Figure 10.
Selective processing and visualization of costs from the post-harvest stage.
Figure 10.
Selective processing and visualization of costs from the post-harvest stage.
Figure 11.
Dashboard and selection slices on the Transport stage.
Figure 11.
Dashboard and selection slices on the Transport stage.
Figure 12.
Visual representation of the four scenarios.
Figure 12.
Visual representation of the four scenarios.
Figure 13.
Graphical representation of the four scenarios on the average level of production and the profit.
Figure 13.
Graphical representation of the four scenarios on the average level of production and the profit.
Table 1.
LCC and the level of the capital costs and operational costs, for the three main stages.
Table 1.
LCC and the level of the capital costs and operational costs, for the three main stages.
| Production chain of Apple orchard |
Capital costs (euro) |
Operational Costs (euro) |
Total Costs (euro) |
|
(A) Stage Agricultural production costs (APC) |
5.929,7 |
206.608,4 |
212.538,1 |
| (A1) Apple farm establishment costs (AFE)
|
119,8 |
38.048,7 |
38.168,5 |
(A2) Orchard maintenance costs (first 1-3 years,
without harvesting) (O.M.I-III)
|
763,0 |
16.833,7 |
17.596,8 |
(A3) Orchard maintenance costs (next 4-20 years,
with harvesting) (OM.IV-XX)
|
5.046,9 |
151.725,9 |
156.772,8 |
| (B) Stage Post harvest costs (PHC) |
7.375,9 |
63.321,8 |
70.697,7 |
| (C) Stage Transport costs (TC) |
|
17.845,5 |
17.845,5 |
| LCC (Life cycle cost) |
13.305,6 |
287.775,7 |
301.081,2 |
Table 2.
Shares of the capital and operational costs.
Table 2.
Shares of the capital and operational costs.
| Production chain of Apple orchard |
Capital costs (share from the
Total stage/sub-stage, %) |
Operational costs (share from the Total stage/sub-stage, %) |
Euro/FUC (1 kg apples), share from the Total LCC, % |
| (A) Stage Agricultural production costs (APC) |
2.79% |
97.21% |
70.59% |
| (A1) Apple farm establishment costs (AFE)
|
0.31% |
99.69% |
12.68% |
(A2) Orchard maintenance costs (first 1-3 years,
without harvesting) (O.M.I-III)
|
4.34% |
95.66% |
5.84% |
(A3) Orchard maintenance costs (next 4-20 years,
with harvesting) (OM.IV-XX)
|
3.22% |
96.78% |
52.07% |
| (B) Stage Post harvest costs (PHC) |
10.43% |
89.57% |
23.48% |
| (C) Stage Transport costs (TC) |
0.00% |
100.00% |
5.93% |
| LCC (Life cycle cost) |
4.42% |
95.58% |
100.00% |
Table 3.
LCC and the level of the costs for the three main stages.
Table 3.
LCC and the level of the costs for the three main stages.
| Production chain of Apple orchard |
euro/kg apples |
% Share from the Total cost |
| (A) Stage Agricultural production costs (APC) |
0.2657 |
70.59% |
| (B) Stage Post harvest costs (PHC) |
0.0884 |
23.48% |
| (C) Stage Transport costs (TC) |
0.0223 |
5.93% |
| LCC (Life cycle cost) |
0.3764 |
100.00% |
Table 4.
Four economic scenarios for the Ecological apple orchard in Bucharest, based on LCC Analysis.
Table 4.
Four economic scenarios for the Ecological apple orchard in Bucharest, based on LCC Analysis.
| LCC (euro/1Kg apple) = |
0,3764 |
|
|
|
| LCC (euro/Ha/20 years) = |
301.081 |
|
|
|
| LCC (euro/Ha/year) = |
15.054 |
|
|
|
| Market price euro/1kg apple= |
0,8500 |
|
|
|
| Indicators |
S1 (85%) |
S2 (70%) |
S3 (85%) |
S4 (70%) |
| Average production/ha (Kg) |
40.000 |
40.000 |
60.000 |
60.000 |
| Orchard Life span (years) |
20 |
20 |
20 |
20 |
| Total Production/number of years life span, Kg |
800.000 |
800.000 |
1.200.000 |
1.200.000 |
| Annual production sold/ ha/ year, Kg |
34.000 |
28.000 |
51.000 |
42.000 |
| Total Production sold / ha / number of years life span, Kg |
680.000 |
560.000 |
1.020.000 |
840.000 |
| Value of annual production sold at market price, euro |
28.900 |
23.800 |
43.350 |
35.700 |
| Value of total production sold at market price, euro |
578.000 |
476.000 |
867.000 |
714.000 |
| Profit / ha / year, sold production, euro |
16.102 |
13.261 |
24.154 |
19.891 |
| Profit / ha / 20 years, sold production, euro |
322.048 |
265.216 |
483.072 |
397.824 |
Table 5.
Scenarios on the financial indicators, using “What if Analysis”.
Table 5.
Scenarios on the financial indicators, using “What if Analysis”.
| Indicators |
S2.1 (70%) |
S4.1 (70%) |
| Average production/ha (Kg) |
48.564 |
72.846 |
| Orchard Life span (years) |
20 |
20 |
| Total Production/number of years life span, Kg |
971.284 |
1.456.926 |
| Annual production sold/ ha/ year, Kg |
33.995 |
50.992 |
| Total Production sold / ha / number of years life span, Kg |
679.899 |
1.019.848 |
| Value of annual production sold at market price, euro |
28.896 |
43.344 |
| Value of total production sold at market price, euro |
577.914 |
866.871 |
| Profit / ha / year, sold production, euro |
16.100 |
24.150 |
| Profit / ha / 20 years, sold production, euro |
322.000 |
483.000 |
|
Disclaimer/Publisher’s Note: The statements, opinions and data contained in all publications are solely those of the individual author(s) and contributor(s) and not of MDPI and/or the editor(s). MDPI and/or the editor(s) disclaim responsibility for any injury to people or property resulting from any ideas, methods, instructions or products referred to in the content. |
© 2023 by the authors. Licensee MDPI, Basel, Switzerland. This article is an open access article distributed under the terms and conditions of the Creative Commons Attribution (CC BY) license (http://creativecommons.org/licenses/by/4.0/).
