1. Introduction
Global warming is one of the most paramount challenges facing our planet and its carbon dioxide indicators are experiencing a rapid and concerning rise. [
1]. The construction industry is recognized as a key driver of global warming through its contribution to 42 percent of primary energy consumption and 39 percent of global greenhouse gas (GHG) emissions. [
2,
3]. With the increase in urban population and the stress due to land scarcity, greater number of high-rise buildings is built globally to optimize land use. Denser urban landscapes are also considered as a means to lower urban building energy consumption [
4]. Nevertheless, it is worth noting that high-rise buildings are generally associated with higher energy use and material demands per unit of floor space compared to their low-rise buildings [
5], which in turn leads to projections of elevated overall energy usage and greater emissions of GHG associated with the construction sector.
This work focuses on embodied carbon and other life cycle environmental impacts of high-rise buildings as a largely overlooked research area, particularly when compared with low- and mid-rise buildings. The embodied carbon and environmental impact assessment of high-rise buildings is conducted using the LCA methodology which relies on design and construction data as well as inventory data-intensive approaches. The dominant LCA approaches for such studies include Input-Output (I-O) LCA, process-based environmental LCA, or hybrid methods that take advantage of the strengths of both methods. Additionally, while many of studies [
6,
7,
8] use software tool platforms for inventory data collection and LCA analysis, there are also some [
9,
10,
11] that follow the computation procedures. For example, Gan et al. [
9] estimates major types of greenhouse gas (GHG) emissions by multiplying the material quantities by emission factors and then aggregating the results into global warming potential (GWP) [
9]. The limited availability of the inventory data for the unique context of high-rise construction challenges the current literature on high-rise building LCA. When data is available, the integration of Building Information Modeling (BIM) and LCA methodologies can alleviate the challenge and help inform rigorous LCA studies on buildings. While various studies have underscored this potential [
12,
13], studies that use a comprehensive cradle-to-grave BIM-based tool for environmental sustainability simulation remain limited in number and scope [
14]. Aiming to cover this gap, the present article integrates Revit with Tally [
15], an LCA add-on tool for Autodesk Revit which quantifies the environmental impacts of buildings utilizing the LCA approach based on a comparative digital model of the building.
There is a noticeable pattern in the built environment literature in the past few years to use BIM for LCA [16, 17]. Cavalliere [
18] reviews literature on building LCA and shows 7 out of 28 commercial tools use a BIM model. In addition, researchers have also developed their own workflows to connect an LCA database with a BIM software, for example linking Autodesk Revit [
19] or ArchiCAD [
20] with SimaPro or Excel. In this article, we use a high-rise building constructed with reinforced concrete as the case study to understand its embodied carbon and environmental impacts.
2. Materials and Methods
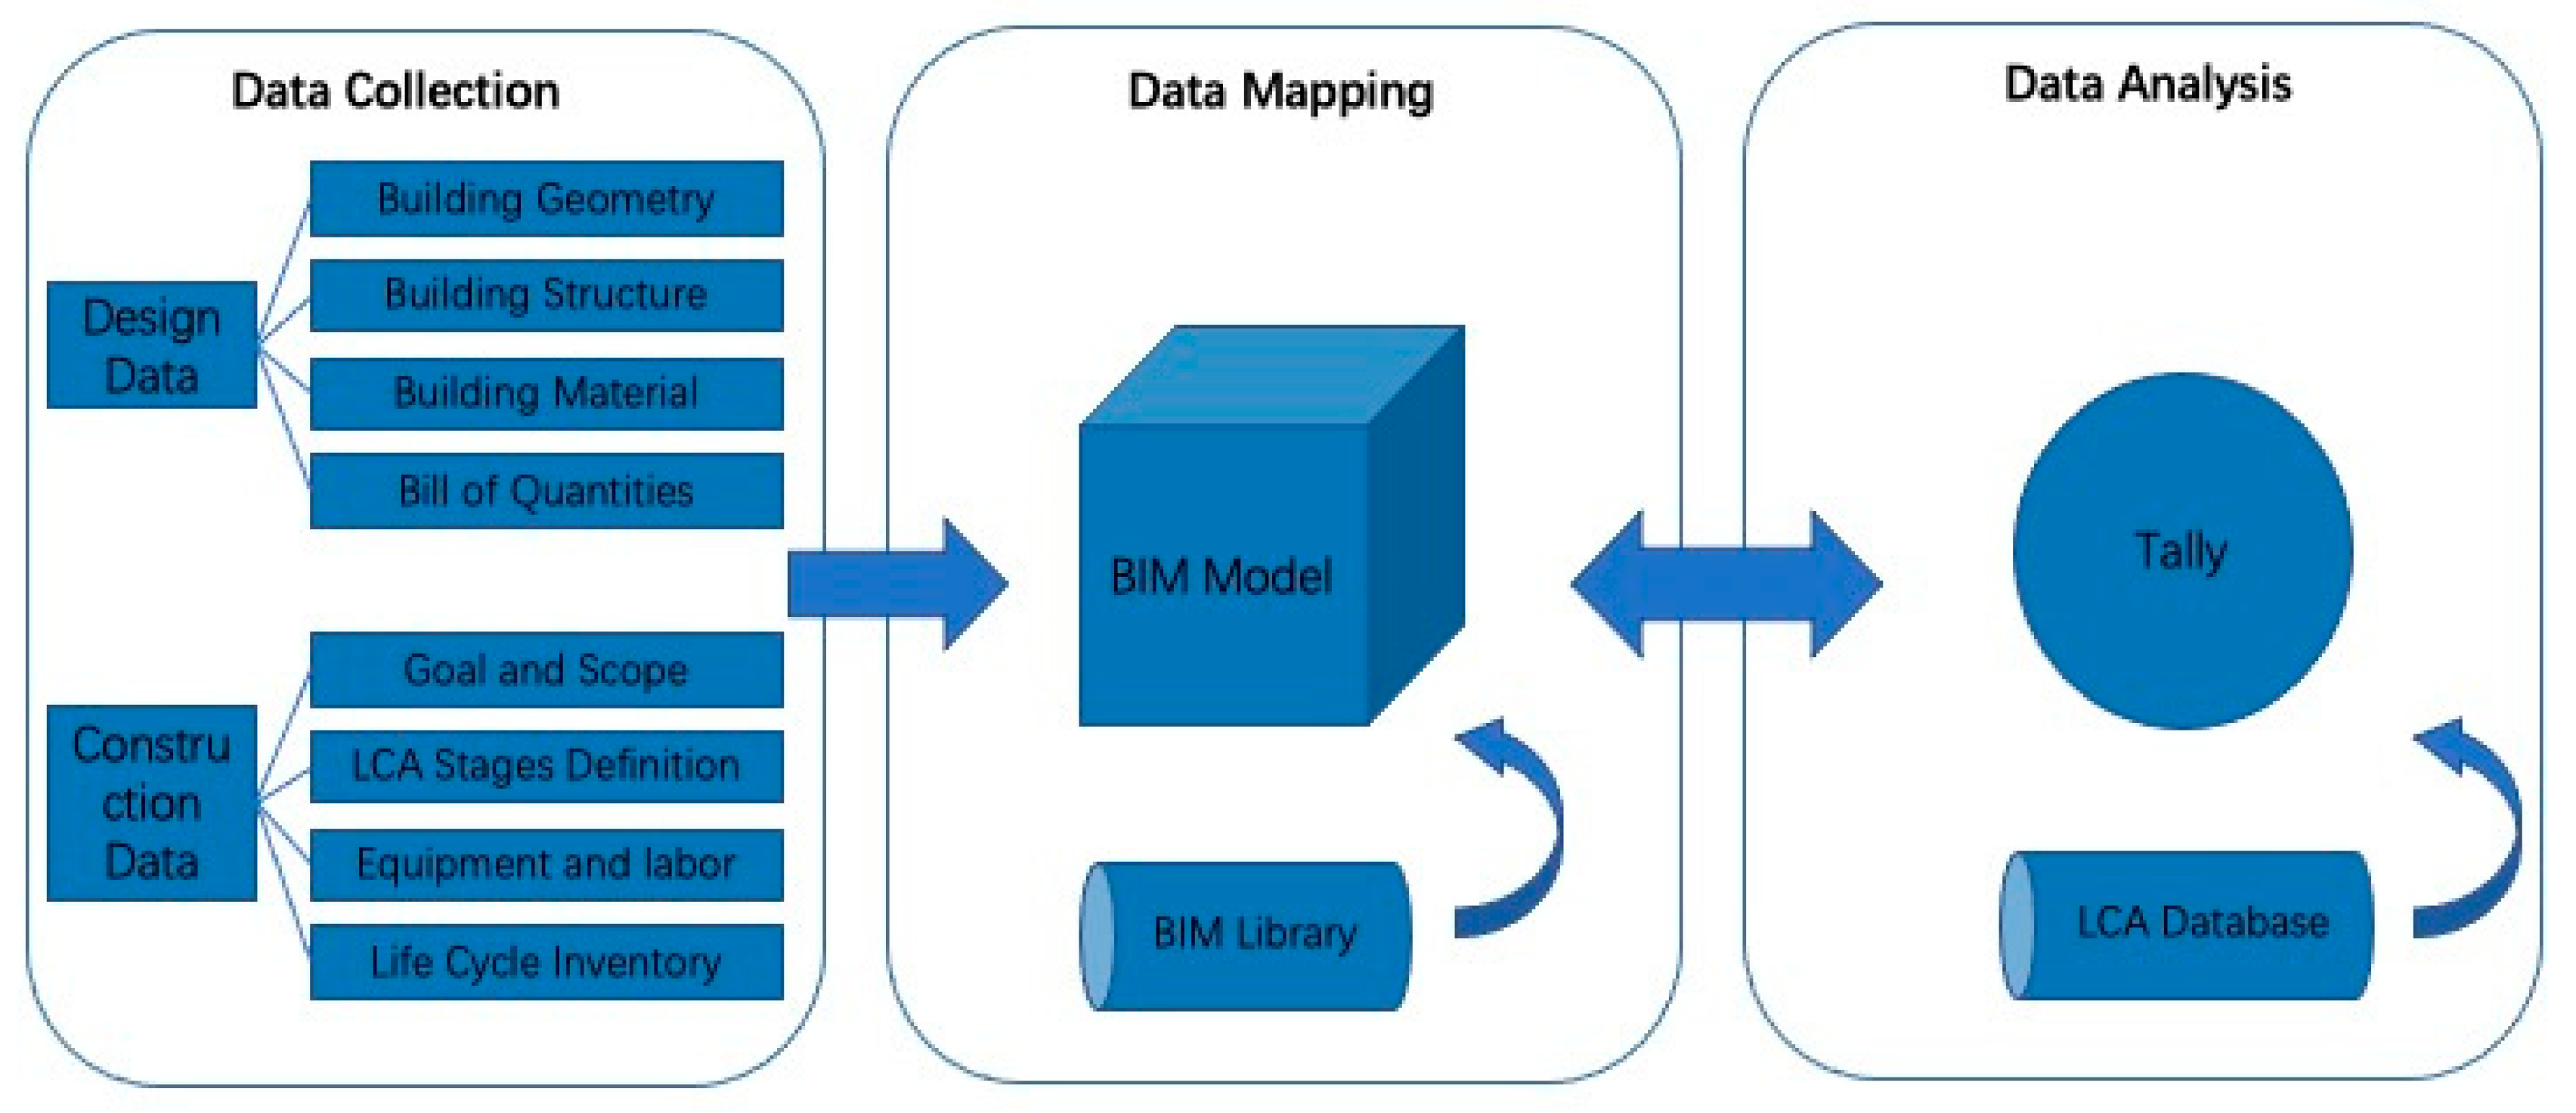
The embodied carbon and environmental impacts of an actual high-rise building case-study is assessed with a focus on building structure for the entire building life span including product stage (A1-3), construction stage (A3-5), end-of-life stage (C), and beyond life stage (D). Use stage is not relevant to the scope of this research because the building structure which is the focus of this research does not require repair, replacement and maintenance during the building’s normal life span. The assessment is conducted through a detailed construction material specification in Tally, with a Bill of Material produced by Revit, that leads to detailed and comprehensive environmental impact results generated by Tally based on the GaBi Database life cycle inventory (LCI) . The Tally is consistent with LCA standards ISO 14040-14044, ISO 21930:2017, ISO 21931:2010, EN 15804:2012, and EN 15978:2011. This framework which creates a seamless integration of embodied carbon assessment within BIM informs the identification of the primary life cycle stage and material contributors to embodied carbon and other life cycle environmental impacts. The proposed framework consists of two fundamental steps: data collection, data mapping, and data analysis (
Figure 1).
2.1. Case-study
The case study assessed in this work is an actual 60-story high-rise office building with a core-outrigger reinforced concrete and steel composite structure located in Chicago, USA. The building stands at a height of 835 feet (255 meters) with a total gross area of 1,475,500 square feet (137,078 square meters). Completed in 2023, the building contains 3 subterranean levels, 58 above-ground stories, a mechanical penthouse level, and a roof level (i.e., leading to 60 above-ground stories). It is important to note that the authors of this article do not deserve any credit for, and did not participate in, any design (architectural, structural, etc.), consultancy, and construction activities in the case-study project.
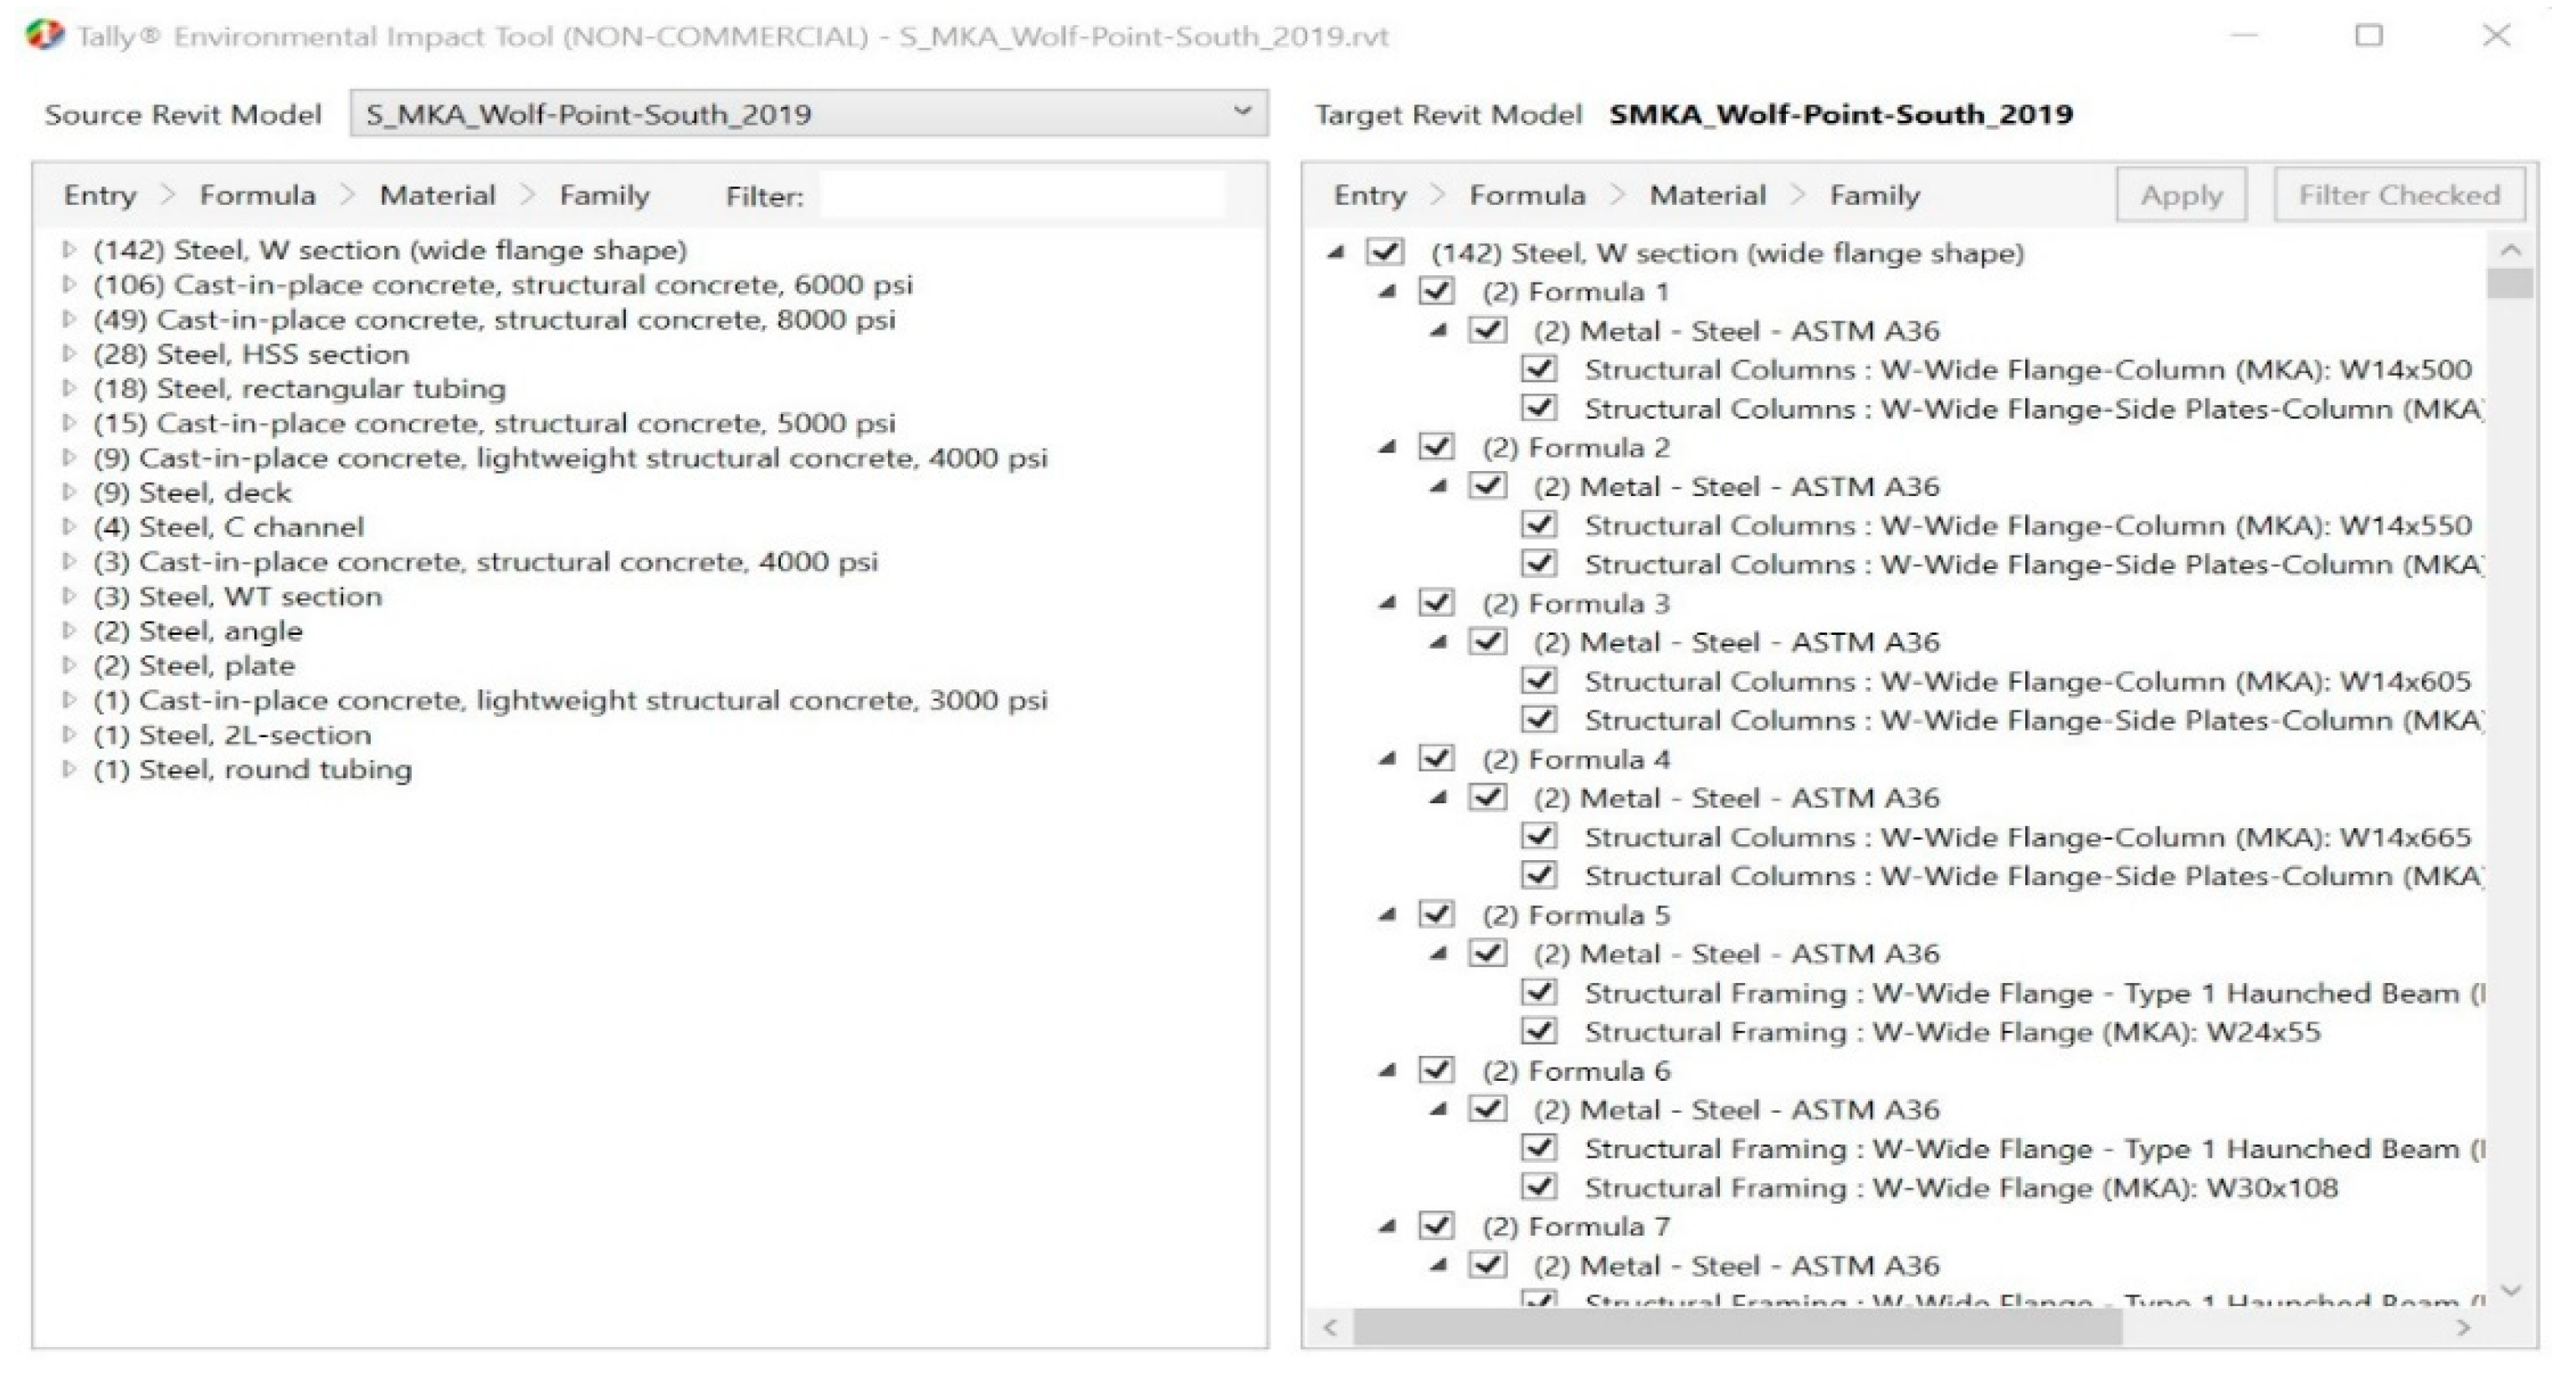
The analysis focused on the building structure only using the Revit model supplied by the structural firm (
Figure 2). Following iterative validations with both architectural and structural designers, involving a review of 2D drawings, 3D models, and product supply contracts, as well as the compilation of certified Environmental Product Declarations (EPDs), the steel and concrete structural components were specified in detail in the Revit digital model (
Figure 2) and Tally LCA model (
Figure 3). The environmental impacts of the building were then estimated in the Tally environment (see Appendix B).
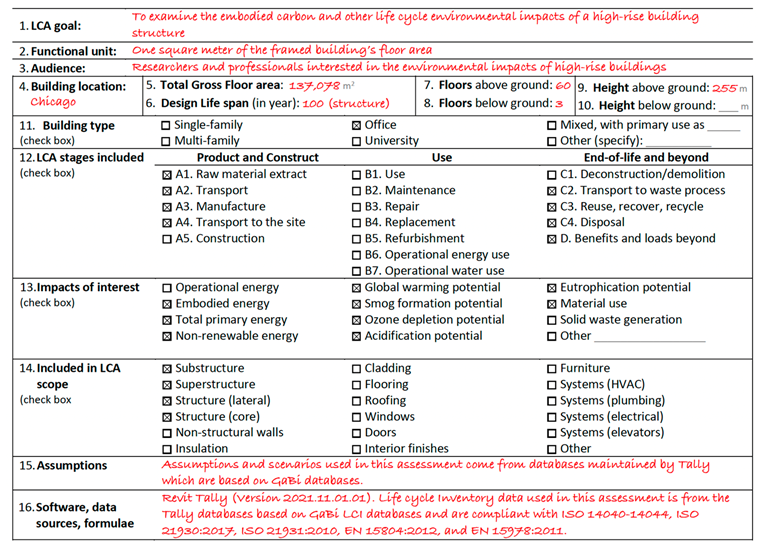
Table 1 provides a summary of case-study information and the LCA assumptions. The scope of this research includes product stage (A1-3), transportation to site (A4), end-of-life (C2-4), and beyond-life loads and benefits (D module). This research does not include use stage
(B) in its scope because the focus of this research is only on the building structure which does not require repair and replacement during the normal life span of 100 years assumed in this study. Additionally, the construction stage (A5) and part of the end-of-life stage that involves deconstruction and demolition (C1) are not included in the scope mainly because Tally does not report these items. While we assumed a life span of 100 years in this study, that is not expected to affect the results.
The structure of the building is divided into three main components: structural floors, frame structures and structural walls. The structural floors contain fireproofing, cementitious, galvanized steel decking, concrete reinforcing steel, 4000 psi structural concrete and 6000 psi structural psi. The frame structures contain cold formed structural steel, fireproofing, cementitious, galvanized steel, hot rolled structural steel, concrete reinforcing steel, 5000 psi structural concrete, 6000 psi structural concrete and 8000 psi structural concrete. The structural walls contain 3000 psi lightweight concrete, 4000 psi lightweight concrete, concrete reinforcing steel and 8000 psi structural concrete. The concrete’s impacts in this analysis are based on Tally’s database of the National Ready-Mix Concrete Association (NRMCA) Industry-wide Environmental Product Declaration.
Table 2 displays concrete types and corresponding quantities in various structural components. Among the concrete structural elements, slabs on steel deck (13,509 cubic meters) and shear walls (9,627 cubic meters) emerge as the most massive constituents within the concrete construction, whereas concrete columns and pier caps are the least massive concrete components.
Table 3 shows the breakdown of steel quantities, revealing that the predominant segment of steel construction involves 50 ksi steel (5,400 tons), while the least substantial portion pertains to rebar used in slabs (600 tons). The total steel framed area in this case study is 1,344,341 ft
2 (124,893 m
2).
3. Results and Discussion
Table 4 and
Figure 4,
Figure 5,
Figure 6,
Figure 7 and
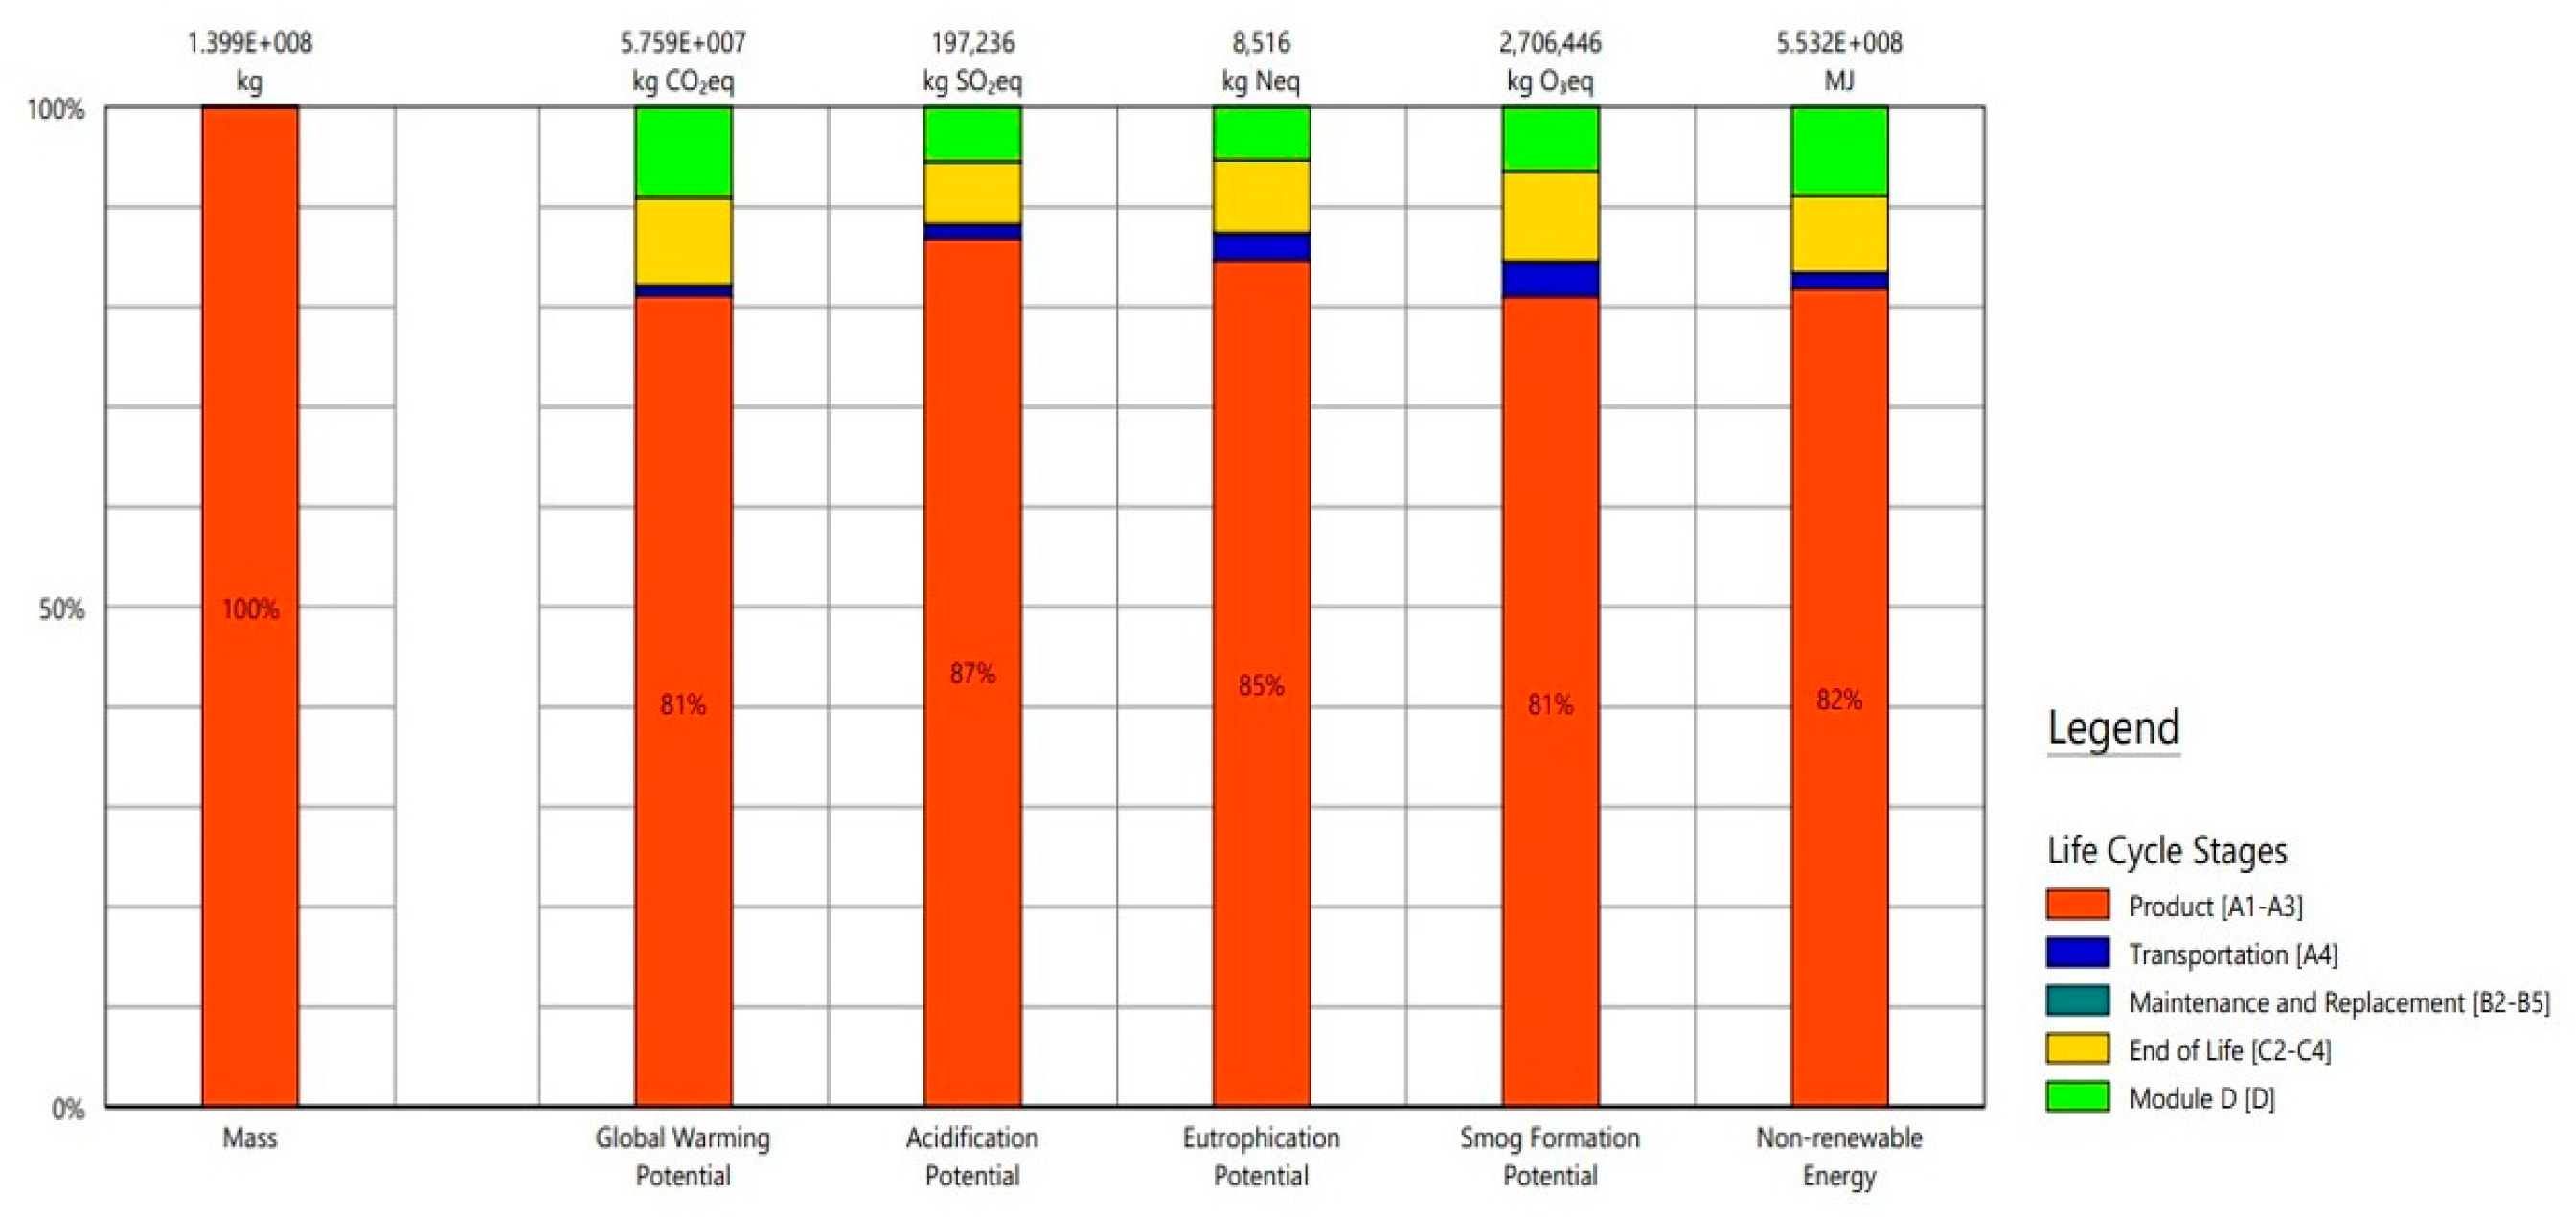
Figure 8 present the environmental impact results of this study in several impact categories including global warming potential, acidification potential, eutrophication potential, smog formation potential, ozone depletion potential, primary energy consumption, non-renewable energy usage, and renewable energy usage. These indicators are also individually presented for the product stage (A1-3), transportation (to construction site) stage (A4), end-of-life stage (C2-4), and module D stage.
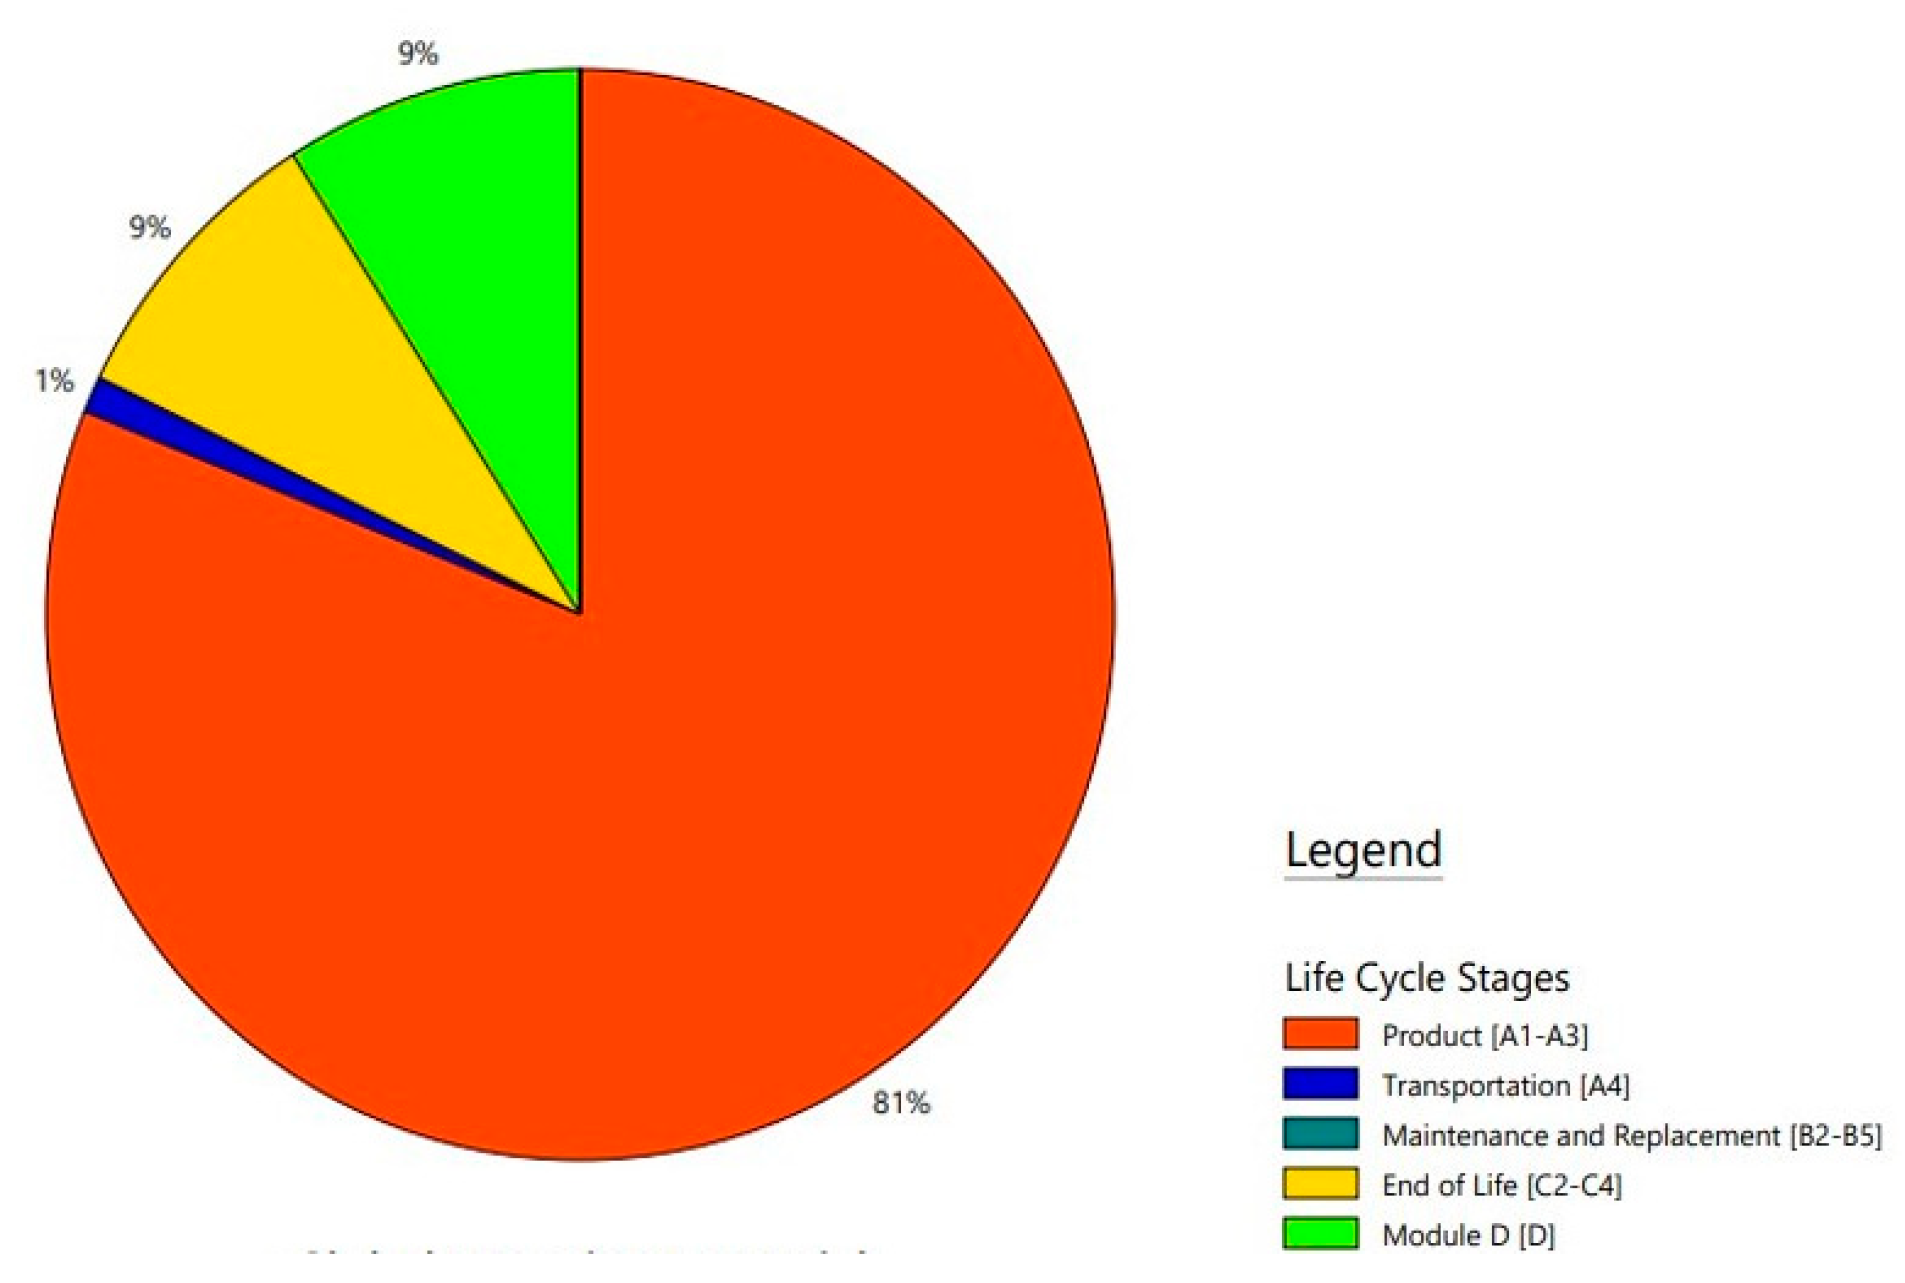
Figure 4 shows varying percentages of contribution to environmental impacts occur across the product, transportation to site, end-of-life, and module D stages. In line with the literature, the product stage (A1-3) is the dominant contributor to the building's embodied carbon (i.e., construction related global warming potential) and other life cycle environmental impacts, with a contribution that ranges from 81% (e.g. to embodied carbon) to about 87% (to acidification potential). The contributions of the end-of-life (C) stage to environmental impacts varies depending on the impact category ranging from about 6% (in case of acidification potential) to 9% (in case of embodied carbon or smog formation potential). A similar pattern is observed in the contribution of the module D. For example, module D contributes 9% to embodied carbon (
Figure 5). Comparatively, the transportation-to-construction site stage plays a relatively minor role in the overall life cycle environmental impacts, with 1% contribution to overall embodied carbon of the case-study.
Figure 6 and
Figure 7 illustrate the percentages of concrete and steel contributions to environmental impacts (global warming potential, acidification potential, eutrophication potential, smog formation potential, and non-renewable energy) across the life cycle stages (
Figure 6) and for overall impacts (
Figure 7).
Figure 6 demonstrates that the embodied carbon (i.e., construction-related global warming potential) of the case-study high-rise structure is largely caused by production (A1-3) of concrete for the construction of the building (55%), production (A1-3) of steel (24%), beyond-life loads (module D) of concrete (9%) and concrete’s end-of-life processes (C2-4; 8%). While these figures on the extent of material contributions varies to some extent across different impacts, life cycle process of concrete and steel production remain the largest contributors to the life cycle environmental impacts of the case-study project. In the case of acidification potential, steel production with a share of 46% exceeds the contribution of concrete production (41%) to this category of environmental impact (
Figure 6). Also, concrete in the product stage (A1-3) contributes 61% to eutrophication potential, 57% to smog formation potential, and 51% to non-renewable energy, while the steel contributes 24% to eutrophication potential, 24% to smog formation potential, and 31% to non-renewable energy.
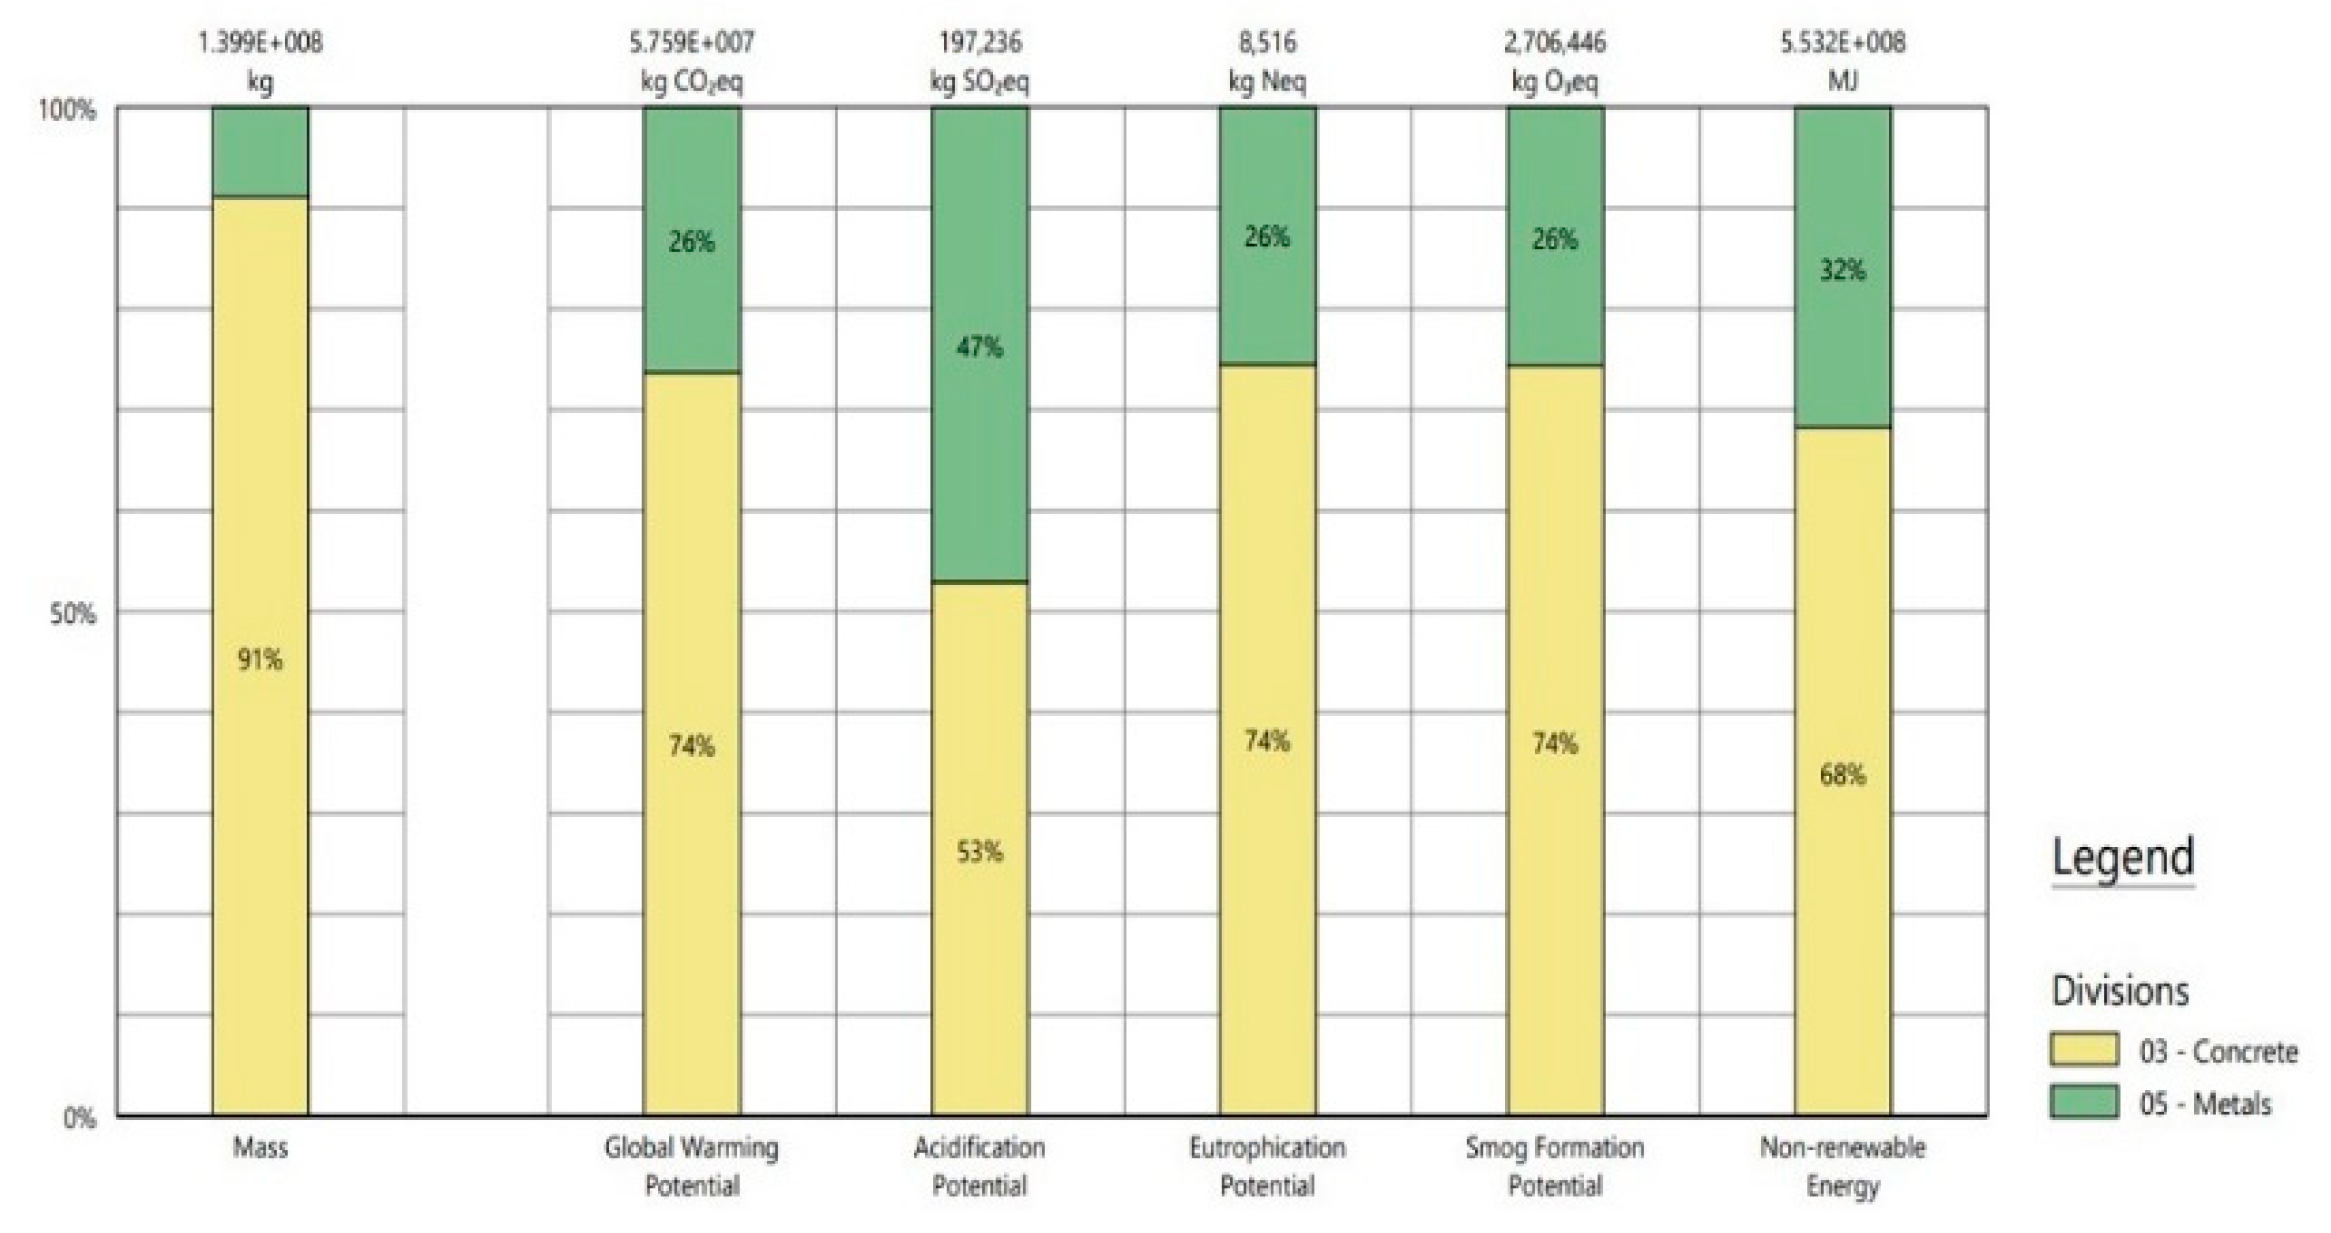
Additionally, concrete with a substantial 91% share (
Table 5) in the total mass of building structure contributes 74% to the overall life cycle embodied carbon of the case-study high-rise structure, with steel having a share of 9% in the total mass and being responsible for 26% of embodied carbon in the building structure. Concrete also contributes 53% to the acidification potential, 74% to eutrophication potential, 74% to smog formation potential, and 68% to non-renewable energy (
Figure 7). In contrast, steel is estimated to contribute 26% to the global warming potential, 47% to acidification potential, 26% to eutrophication potential, 26% to smog formation potential, and 32% to non-renewable energy.
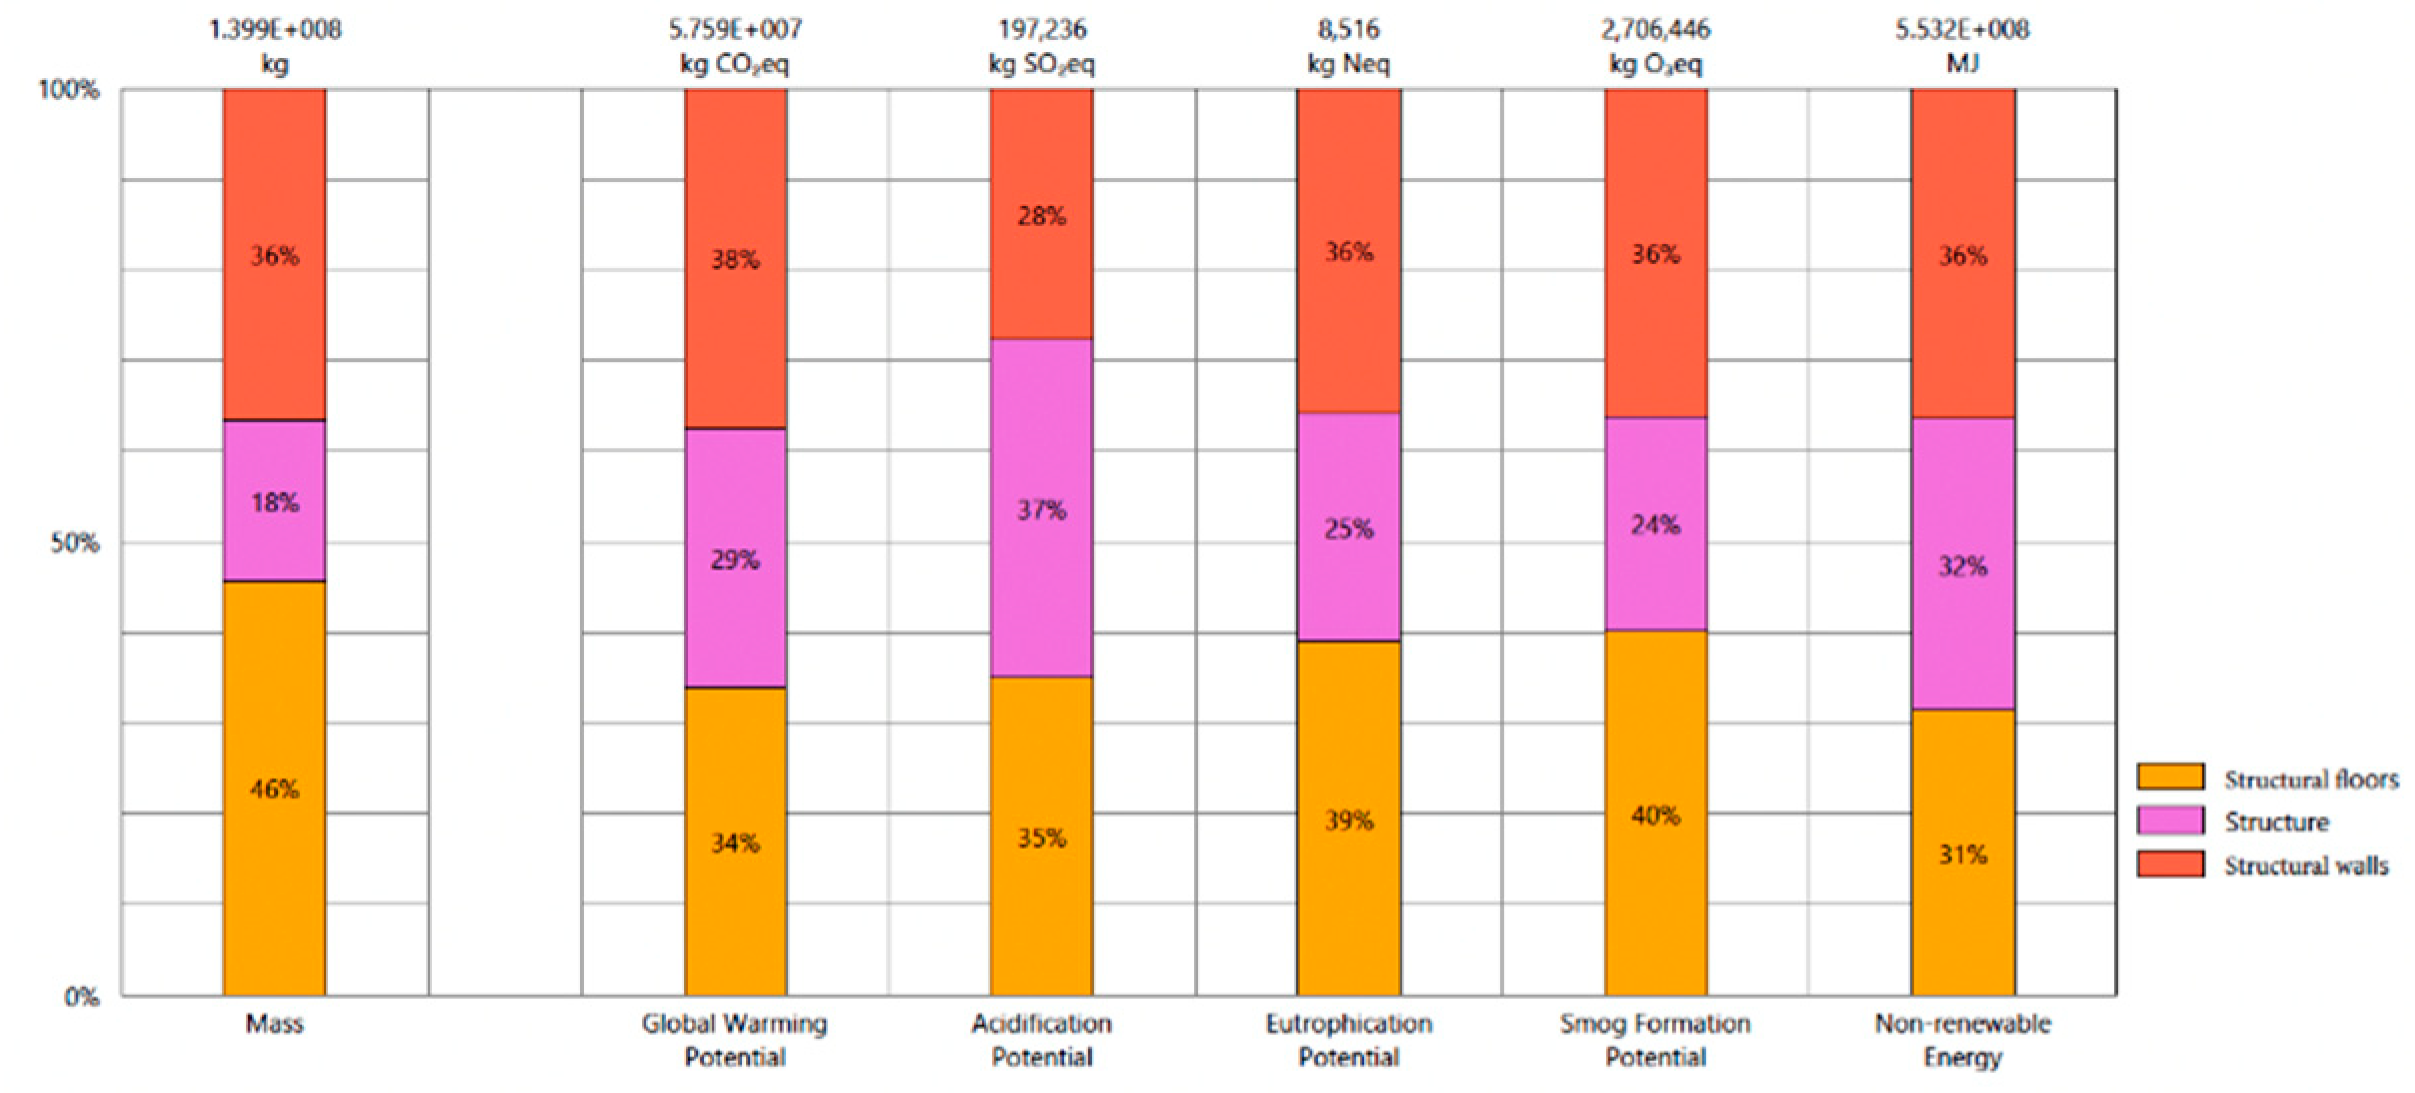
As
Figure 8 illustrates the environmental impacts for different structural components, embodied carbon of the structure is caused by the structural walls (e.g., shear walls) (38%), structural floors (34%) such as slab on grade and slab on steel deck, and the structure (29%) including foundation slab, shafts, concrete beams and columns, steel columns and beams.
As depicted in
Figure 4,
Figure 5 and
Figure 6, the most substantial share of the embodied carbon and environmental impacts in the case-study high rise building is caused by the product stage, and primarily concrete as structural material. The concrete’s 74% contribution to embodied carbon is not surprising as concrete is notorious for its high embodied carbon as it is the second most widely used material on the earth and accounts for 8% of global greenhouse gas emissions due to the extensive amount of fossil fuels and high temperatures needed to make cement as well as the CO2 emitted in the calcination process [
21]. The challenge also lies in the limited recyclability of concrete compared to steel. Strategies such as minimizing cement usage and introducing specialized additives to aggregates not only enhance structural performance but also effectively reduce the associated embodied energy and environmental impacts. The alternatives to concrete for building structure include low-embodied carbon concrete mixtures as well as mass timber which has gained significant interest in the past few years with multiple high-rise timber structures already been constructed. Employing lightweight concrete to decrease the volume of concrete used and optimizing the efficiency of the building's structural system can play a crucial role in curtailing the building's embodied carbon and environmental footprint. A strategic approach also involves the increased adoption of clean energy, reduction of fossil fuel reliance, and enhanced production efficiency during the product stage to substantially mitigate the embodied carbon and environmental impacts of both concrete and steel.
It is important to position the cradle-to-grave LCA results of the case-study in this project within the context of previous studies on the embodied carbon of concrete high-rise buildings or those of alternatives such as high-rise mass timber building as an emerging structural technology. As previously reported, we found an embodied carbon intensity of 382.121 kgCO2-eq/m2 for the A-C stages and 420.101 kgCO2-eq/m2 for the A-D stages. Chang et al. [
22] examined the embodied emissions of an educational high-rise building (19-storey above ground, 2-storey underground) with frame-shear wall and reinforced concrete structure in China and reported the embodied energy and emissions as 6.3 Giga Joules/m2, 794 kgCO2/m2, 2.5 NOX/m2 and 2.1 SO2/m2, respectively. Alotaibi et al. [
23] reported the embodied carbon of a 28-storey high-rise residential building in India as 448 kgCO2/m2 per year based on a 75-year life span, which the researchers show could be reduced to 414 kgCO2/m2 per year by using decarbonization strategies. Gan et al. [
24] examined the embodied carbon of a 60-storey core-outrigger high-rise buildings designed with different structural materials and reported an embodied carbon of 557 kgCO2-eq/m2, 537 kgCO2-eq/m2, 759 kgCO2-eq/m2 for composite, reinforced concrete and steel design alternatives. Relating height, structural system, and embodied carbon, the researchers suggest a height range of 50 to 70 floors for high-rise buildings with core-outrigger structure to yield a low embodied carbon intensity of 530–556 kg CO2-eq/m2. Additionally, the height range for tube-in-tube structures is suggested to be 60 and 90 floors, with an embodied carbon of 540–567 kg CO2-eq/m2. In mega-brace structures, the height range of 60–80 floors, with an embodied carbon of 545–572 kg CO2-eq/m2, is suggested [
24].
Timber buildings are increasingly built at various scales and heights to replace concrete or steel buildings. Liang et al. [
25] investigated a 12-story mixed-use mass timber building in Portland, Oregon constructed with cross-laminated timber (CLT) and glued laminated timber (glulam). The LCA revealed the global warming potential (GWP) of the product stage (modules A1-A3) was 177 kg CO2eq/m2, transportation to site stage (A4) was 8.53 kg CO2eq/m2, end-of-life stage (C2-C4) was 10.3 kg CO2eq/m2, and module D was -364 kg CO2eq/m2. The GWP for stages A-C totaled 195.83 kg CO2eq/m2, compared to 382.12 kg CO2eq/m2 for the reinforced concrete building examined here, i.e., approximately half the impact. Moreover, incorporating module D, the mass timber building has a GWP of -168.17 kg CO2eq/m2 versus 420.1 kg CO2eq for the hybrid concrete-steel building in the study, a substantial reduction in embodied carbon. Wood in mass timber building contributed 22% to its embodied carbon, with the rest caused by other materials in mass timber building structure such as steel, gypsum board, and other materials. In another research, Rabati et al. [
26] compared the life cycle cradle-to-grave embodied carbon of a mass timber high-rise building (13 stories above ground, 5 underground) with its concrete alternative by taking into account substructure, superstructure, façade and finishes, and reported an embodied carbon intensity range of 196 to 590 kgCO2-eq/m2 (with a mean of 417) for a mass timber building, compared with the embodied carbon intensity of 307 to 618 kgCO2-eq/m2 for a similar post-tensioned concrete building (with a mean of 465). Hence, the research concludes that the mass timber building yields 48 kgCO2-eq/m2 reduction in embodied carbon intensity of mass timber buildings, as compared with its concrete counterpart.
It is important to note that caution must be exercised in comparing the embodied carbon intensities reported by different studies as often times there are variations in the scope and system boundaries of the LCA studies.
5. Conclusions
The outcomes of this case study research provide valuable insights for designers and engineers to understand the primary factors contributing to high-rise building structures’ embodied carbon and environmental impacts. BIM-based LCA is essential for understanding and managing embodied carbon and environmental impacts of high-rise building construction. This article demonstrates a BIM-based framework for estimating the embodied carbon and environmental impacts associated with high-rise structures. In this framework, Revit and Tally is used to evaluate the embodied carbon, utilizing material quantities extracted from the BIM authoring tool. Complemented by specialized databases containing transportation and construction data, this framework simplifies the integration of embodied carbon assessment into the BIM-centered design process. This BIM-based LCA framework identifies key contributors to embodied carbon and other environmental impacts across building life cycle stages. Additionally, in comparison with peer LCA tools, the LCA analysis in Revit and Tally offers a balance between user-friendliness and precision. This presents the potential to enhance the LCA process for high-rise buildings during the design phase. This research also highlights the need for strategies to limit the embodied carbon and environmental impacts of high-rise structures by reducing cement usage, incorporating specialized additives into concrete aggregates, and optimization of the building's structural systems.
This research comes with several limitations. The functionality of the BIM-based LCA tool revolves around the availability of data from LCI (Life Cycle Inventory) databases and the quality of data used in this research is subject to GaBi LCI database limitations and assumptions. This research focused on structure and did not include other building elements such as building enclosure. It is important that future research also includes the effects of building enclosure and systems to provide a more comprehensive outline of the high-rise building construction. Furthermore, this research is based on only one case-study. Additionally, while we compared the results of this research with those reported by other studies, this comparison could be approached with caution due to the differences in assumptions and system boundaries across LCA studies. Additional research and rigorous benchmarking studies are needed to provide generalizable conclusions with regard to embodied carbon and environmental impacts of high-rise buildings.
While the framework adopted in this research covers a cradle-to-grave life cycle, the impacts of the operational stage (such as operational energy, operational carbon, or operational water) is not integrated. Future research should particularly include the operational energy in the scope and examine the tradeoffs between operational and embodied emissions. To advance this field, future research should also tailor data collection and assumptions to fit the unique context of tall building construction in issues such as reuse, recycling, construction solid waste, and construction site impacts. Also, while Revit and Tally is an excellent tool for building LCA, the process of manual identification and specification of materials in Tally is still time- and labor-intensive which could be addressed by enhancing the tool's intelligence through incorporating machine learning or artificial intelligence. Finally, the existing studies that integrate BIM- based LCA usually use a model with the relatively high level of development (LOD) of 300 or higher. To provide feedback for designers and inform decision-makers, the LCA results need to be available throughout all design stages, especially in the decisive early design stage [
23] where information is limited and uncertain and decisions are most impactful. Therefore, the industry is in need of more tools that are suitable for early design decision-making process.
Author Contributions
Conceptualization, Lijian Ma; Methodology, Lijian Ma, Rahman Azari, and Mahjoub Elnimeiri; Software, Lijian Ma; Validation, Lijian Ma and Rahman Azari; Formal Analysis, Lijian Ma and Rahman Azari.; Investigation, Lijian Ma; Resources, Lijian Ma and Mahjoub Elnimeiri; Data Curation, Lijian Ma; Writing – Original Draft Preparation, Lijian Ma.; Writing – Review & Editing, Lijian Ma and Rahman Azari.; Visualization, Lijian Ma.; Supervision, Mahjoub Elnimeiri; Project Administration, Mahjoub Elnimeiri; Funding Acquisition, N.A.”
