
Submitted:
08 November 2023
Posted:
08 November 2023
You are already at the latest version
Abstract
The North American Monsoon (NAM) in southern Arizona continues to be a topic of interest to ecologists, climatologists, and citizens as well as the triggers and characteristics of plant growth and reproduction in relation to the onset of the monsoon. In researching the onset of the North American Monsoon (NAM) in south-central Arizona relative to the phenology of Saguaro cactus (Carnegiea gigantea) and other Sonoran Desert species we identified interesting and previously unreported features in the NAM rainfall data. We present preliminary descriptive analyses of (1) monsoon onset as measured by the first day after June 1 with precipitation ≥10 mm (1990-2022), (2) first day of year warming of Sea Surface temperatures (SST) in the Gulf of California to ≥29º C measured across five open-sea blocks (mean 9452 km2), and (3) El Niño Southern Oscillation (ENSO) anomaly with a threshold of +/- 0.5º C for the Oceanic Niño Index (ONI) in the Niño 3.4 region (5ºN-5ºS, 120º-170ºW). Three patterns emerge from our analyses: (1) The day of the year of monsoon onset occurs approximately 12 days earlier in the year from 1990-2022 in south-central Arizona. (2) There appears to be a signal in the rainfall onset data very roughly approximating cycles of ENSO Oceanic Niño Index (ONI) anomalies in Niño region 3.4. (3) Gulf of California sea surface temperature (SST) and monsoon onset data support an expected link between the timing of SST warming and monsoon rainfall onset.
Keywords:
monsoon
; North American Monsoon
; precipitation
; Sonoran Desert
; Gulf of California
; phenology
; climate change
; climatology
; El Niño
; ENSOsea surface temperature
; Sonora
; Arizona
Introduction
As plant ecologists, we are interested in the influence of environmental signals on phenological triggers and how this might affect the viability of the Saguaro cactus (Carnegiea gigantea) and many other Sonoran Desert species. During investigations of the relationships between Saguaro phenology and climate, we found interesting patterns in the timing of monsoon rainfall onset. We also examined the possible relationship between the cycles of the El Niño Southern Oscillation (ENSO) anomaly and sea surface temperatures (SST) in the Gulf of California (GoC).
This is an analysis of phenological event timing in a keystone Sonoran Desert Species, rainfall, and SST data intended to identify possible patterns and relationships between previously unreported features of the North American Monsoon (NAM).
Methods
Monsoon Onset
Several criteria have been developed for detecting monsoon onset for a given year. Brenner (1973) noted several surface measurements to indicate that the northward surge of the seasonal maritime airmass from the Gulf of California to Arizona has begun:
- Drop in temperature
- Rise in dew point
- Wind shift to southerly
- Increase in wind speed
- Rise in sea-level pressure
- Lower visibility (due to haze and blowing dust)
- Increasing low to mid-level cloud cover
Brenner noted that one detects the onset of the monsoon moisture surge by comparing hourly observations of temperature, dew point, and pressure. Meteorologists, especially those associated with the U.S. National Weather Forecasting Offices in Phoenix and Tucson began to rely on dew point temperature criteria (Carleton 1985). Mitchell et al. (2003), in their analysis of Gulf of California (GoC) sea surface temperatures, noted the accepted onset definition: the first consecutive three-day period with daily average dew point of 12.78ºC or greater at the Phoenix NWS Forecast Office and 12.2ºC in Tucson. Zeng and Lu (2004) developed and tested an index with global application based on gridded, 1º x 1º daily precipitable water values.
Fonseca-Hernandez et al. (2021) recently suggested an onset indicator based on local daily precipitation records: the first daily sequence of five consecutive days with average precipitation ≥2 mm/day.
We gathered data from the Pima County, Arizona, ALERT network of remote reporting rain gauges, NWS (Tucson), and several NWS COOP and RAWS stations, most with records from 1990-2023 (Table 1, Figure 1). Of the 33 stations used in the analysis all but three were within a 65 km radius of downtown Tucson. They include representation across 2274 m of elevation from 512 m, at the Organ Pipe Cactus National Monument Headquarters to 2786 m at the summit of Mt. Lemmon, Santa Catalina Mts. We recorded the first annual one-day rainfall events of ≥10 mm after 31 May for each station. We used 10 mm precipitation because it represents the smallest amount that would be biologically relevant to plants of the Sonoran Desert (Bowers & Dimmitt 1994) and it is the smallest amount that the weather stations we used experienced on at least one day almost every summer. In the few occasions that no rainfall ≥10 mm was recorded we used the first highest one-day amount.
We suspected that the monsoon onset, identified each year by our criteria (first day ≥10 mm rainfall), would track at least a few days earlier at higher elevations than at lower elevations. A correction derived for each weather station from a monsoon onset on elevation regression was applied to every DOY monsoon onset; this had little effect on the monsoon onset calculations and was not included in these results.
El Niño Southern Oscillation
An interesting pattern observed in the monsoon onset data seen in the analysis resembles decadal-scale patterns in El Niño Southern Oscillation (ENSO) SSTs (Di Lorenzo et al. 2023). A list of cold and warm SST episodes, calculated by 3-month season was retrieved from the US National Weather Service, Climate Prediction Center, 31 January 2023 https://origin.cpc.ncep.noaa.gov/products/analysis_monitoring/ensostuff/ONI_v5.php. These data represent warm and cold periods based on a threshold of +/- 0.5ºC for the Oceanic Niño Index (ONI, 3 month running mean of ERSST.v5 SST anomalies in the Niño 3.4 region, 5ºN-5ºS, 120º-170ºW). We calculated the annual mean for the five sample blocks for the period 1990-2021.
Gulf of California (GoC) Sea Surface Temperatures (SST)
The timing of the seasonal surge of maritime air masses from the south into Arizona is believed to be enhanced or even triggered by the warming sea surface temperature (SST) in the Gulf of California (GoC). The mechanics of the GoC SST warming and monsoon onset relationship have been the subject of much research over the past three decades (Douglas et al. 1993, Mitchell et al. 2002, Erfani & Mitchell 2014, Fonseca-Hernandez et al. 2021). These models suggest that the thermal inversion overlying the GoC only breaks down once the SST has reached 29º C. The exact geographic extent of the thermal inversion within the Gulf and the geographic extent of warming needed to degrade the inversion are yet to be determined.
We retrieved the Daily Optimum Interpolation Sea Surface Temperature (OISST) from five rectangular sampling blocks of the GoC from the mouth of the Gulf north to the Colorado River delta outflow (Figure 2; Huang et al. 2020; SST, Daily Optimum Interpolation (OI), AVHRR Only, Version 2.1, 0.25°, https://coastwatch.pfeg.noaa.gov/erddap/griddap/ncdcOisst21Agg_LonPM180.html). We averaged daily SST (1990-2022) across five large blocks of open sea spaced from south to north (mean 9452 km2, total 47259 km2) and identified the first day of the first of the year 3-day period in which the temperature reached or exceeded 29º C.
Results
Our investigations of the monsoon onset in south-central Arizona suggest two previously unreported features. First, the monsoon begins almost two weeks earlier in the year now than it did in 1990, and second, the monsoon onset data exhibited a sinusoidal waveform pattern with a period similar to that of ENSO warm/cool variations. A preliminary comparison of the monsoon onset pattern with ENSO and Gulf of California anomalies did not suggest a relationship. The dew point temperature, traditionally relied upon to signal monsoon onset, does not exhibit the same change in onset timing or sinusoidal pattern found in precipitation analysis. Unfortunately, dewpoint temperature data for our study area, over the same time period, are not available anywhere except at the Tucson National Weather Service, Tucson, with sensors located at Tucson International Airport.
Monsoon Onset Timing
Table 2 lists the 33 weather stations and the mean day of year of monsoon onset day of year, monsoon precipitation total, and annual precipitation totals for each station. There is a significant relationship between monsoon precipitation and elevation, as is well-known, and monsoon onset is earlier in the year as elevation increases. Figure 3 and Figure 4 illustrate this with regressions of mean station monsoon precipitation total on day of year of monsoon onset (R2=0.71, p-value=<0.0001) and monsoon precipitation on station elevation (R2=0.8815, p-value=<.0001).
Figure 5 presents a plot of 1,051 monsoon onset day-of-year estimates, GAM (General Additive Model), and linear regression for the 33 weather stations listed in Table 2. The mean monsoon onset at all 33 stations from 1990-2022 was 13 July (std. dev.=19.16, min.=7 June, max.=7 Oct.). The first day, after 1 June, of monsoon rainfall ≥10 mm has recessed 12.032 days from 1990 to 2022 (R2=0.0344, F1,1068=37.5, p-value<0.0001; 1990=22 July, 2022=10 July).
The GAM function displayed in Figure 5 was configured with default basis dimension k=10 (edf=8.801), explaining 20.2% of the deviance with an R2 of 0.195. The crest and trough dates of the wave patterns are presented in Table 3.
A sinusoidal wave pattern in the data is evident in the point visualization and even more obvious in the GAM fit plot (Figure 5). The wave exhibited four crests, three troughs, and a crest-to-crest period of 8.8 years.
It may be noteworthy that the first deep trough in Figure 5, with a nadir on 30 September 1999, is approximately coincident with the onset of the current 21st century western North American megadrought described in the literature (Williams et al. 2022). Fonseca-Hernandez et al. (2021) found that early monsoon onset results in, or is characteristic of, a drier monsoon rainfall season. They speculate that, “…the longer a monsoon onset is delayed the greater amount of convective energy is stored in the boundary layer, being kept there by the thermal inversion over the GoC. Once the surface temperature of the gulf is sufficient to break the inversion, the low-level gulf accumulated moisture is released and becomes available for monsoon precipitation”. As noted previously, they used a monsoon onset definition similar to, but not identical to ours, and derived their rainfall data from gridded interpolation in a large rectangular polygon on the western slopes of the Sierra Madre Occidental several hundred kilometers south of our south-central weather stations.
We obtained the daily average dew point temperatures for the Tucson National Weather Service (TUS, sensors located at Tucson International Airport) for 1973-2022. and applied the monsoon onset criteria discussed above: day of year of 1st day with dew point ≥12.22ºC for 3 consecutive days, (R2=0.0087, p-value=0.6064, n=33). Linear regression was also applied to the number of days from 1 June-30 Sept with dew point ≥12.22ºC, 1990-2022, time series (R2=0.0006. p-value=0.8962, n=33). In addition, we also applied our own monsoon onset criteria to TUS precipitation data from 1990-2022 (this is included in the datasets shown in Table 2 and Figure 5). This too failed to show a significant relationship (R2=0.0066, p-value=0.6536, n=33). Table 4 lists the results of linear regression of monsoon onset on year with all 33 weather stations and highlighting five stations with positive slope concentrated at the lower elevations and stations with a significant p-value concentrated at the higher elevations.
While Fonseca-Hernandez (2021) provide a possible explanation for the relationship between monsoon onset and total monsoon rainfall, it is not known whether or why the onset of the 21st century megadrought might be linked to the date of monsoon onset in any year nor is there an explanation for the sinusoidal wave pattern seen in the monsoon onset data presented here. We suspect that decadal-scale patterns in the Gulf of California and ENSO SST temperature data might provide insights into these questions.
El Niño Southern Oscillation
Gulf of California SST Warming
We averaged the daily sea-surface temperatures in each of the five sampling blocks in the Gulf of California (GoC; Figure 2) from 1990-2022 and then identified the first consecutive 3-day period with average temperatures ≥29º C after 1 June of each year in each box. The results are plotted in Figure 7 with points, the GAM, and a regression line. The GAM plot in Figure 7 shows crests and troughs but is hardly sinusoidal as the GAM plot of monsoon onset in Figure 5. Interestingly, the regression equation for this GoC plot (Y-intercept=1109, slope=-0.4537) was very similar to that of the monsoon onset plot (Y-intercept=934, slope=-0.7675). If there is a relationship, we speculate that it supports the idea noted above that it is GoC warming and the lifting of the boundary layer that allows monsoon moisture to stream northward into the south-central Arizona study area.
Discussion
Our research indicates a recession of approximately 12 days in the timing of monsoon onset, at least as we have defined it, in south-central Arizona from 1990-2022. Are biological entities living in our area affected? It is clearly too early to tell, but whether or not the onset recession is related to anthropogenic climate change, organisms are already under stress. Many species will find physiological and behavioral synchrony with phenological triggers increasingly challenging unless the monsoon onset recession returns to a normal state (the definition of which is currently unknown).
We presume that this change to earlier onset is recent and suspect that it may be short-lived. Creative analyses of interpolated rainfall data looking back to pre-drought times may be useful in this regard. It is tempting to connect the monsoon onset recession to the current 21st century megadrought, and we did suggest that the wave pattern of the monsoon onset coincides with the megadrought onset.
The sinusoidal wave pattern seen in our monsoon onset data does not seem to be related to ENSO anomalies or variations in the timing of warming SSTs in the Gulf of California. However, the GoC is warming to ≥29º C earlier in the year in much the same way that the monsoon onset in south-central Arizona is recessing. This may provide some support for the models reported in the literature that suggest a connection between GoC warming and monsoon onset.
We were, and still are, concerned about the geographic space sampled by the weather stations we chose to include in our primary dataset. We have already noted that monsoon onset is negatively correlated with elevation, whereas total monsoon precipitation is positively correlated with elevation. There are other confounding variables that we did not consider which may also reflect or influence monsoon onset such as slope and elevation, not to mention both latitude and longitude. Fonseca-Hernandez et al. (2021) obtained an average monsoon onset date of 18 June which is within two days of the dates determined by Xu et al. (2004) and Higgins et al. (1999). Our mean combined monsoon onset date, including all 33 stations and all years from 1990 was 13 July, nearly a month later. Their study areas, far to the south of Arizona, are expected to experience an earlier monsoon onset, and, more subtly, none of the areas sampled in those three studies was north, that is, downwind, of the Gulf of California.
It is hoped that future work on the monsoon onset features found in our data will be explained and clarified with greater resolution than we have done here. We look forward to insights into the nature of the sinusoidal wave pattern in the monsoon onset data, clarification of the geospatial characteristics of monsoon onset timing, and we hope that some progress may be made in extending the analysis of monsoon onset substantially before 1990.
Funding
This work was entirely self-funded by the authors. We wish to extend our appreciation to our colleagues and friends who were kind enough to offer their advice and encouragement.
Conflicts of Interest
The authors declare that they have no affiliations with or involvement in any organization or entity with any financial interest in the subject matter or materials discussed in this manuscript.
References
- Bowers J, Dimmitt M 1994 Flowering phenology of six woody plants in the northern Sonoran Desert Bulletin Torrey Bot. Club 121 215-229. [CrossRef]
- Brenner I 1973 A surge of maritime tropical air-Gulf of California to the Southwestern United States 1973 NOAA Tech. Memo. NWS WR88 US Dept. Commerce, Natl. Weather Serv.
- Carleton A 1985 Synoptic And Satellite Aspects Of The Southwestern U.S. Summer ‘Monsoon’ J. Climatol. 5 389-402.
- Huang B, Liu C, Banzon VF, Freeman, E, Graham G, Hankins B, Smith TM, Zhang H-M 2020 NOAA 0.25-degree Daily Optimum Interpolation Sea Surface Temperature (OISST), Version 2.1. NOAA Natl. Ctrs. Environ. Info.
- Di Lorenzo E, Xu T, Zhao Y, Newman M, Capotondi A, Stevenson S, Amaya DJ, Anderson BT, Ding R, Furtado JC, Joh Y, Liguori G, Lou J, Miller AJ, Navarra G, Schneider N, Vimont DJ, Wu S, Zhang H, 2023 Modes and mechanisms of Pacific decadal-scale variability Annu. Rev. Mar. Sci. 15 249-275. [CrossRef]
- Douglas M, Maddox R, Howard K 1993 The Mexican monsoon J Clim. 6 1665-1677. [CrossRef]
- Erfani E, Mitchell D 2014 A partial mechanistic understanding of the North American monsoon J. Geophys. Res. Atmos. 119 096–13. [CrossRef]
- Fonseca-Hernandez M, Turrent C, Mayor Y, Tereschenko I 2021 Using observational and reanalysis data to explore the southern Gulf of California boundary layer during the North American Monsoon onset J. Geophys. Res. Atmos. 126 1-22. [CrossRef]
- Higgins R, Chen Y, Douglas A 1999 Interannual variability of the North American warm season precipitation regime J Clim 12 653–680. [CrossRef]
- Mitchell D, Ivanova D, Rabin R, Brown T, Redmond K 2002 Gulf of California sea surface temperatures and the North American monsoon: Mechanistic implications from observations J. Clim. 15 2261–2281. [CrossRef]
- Mitchell D, Ivanova D, Redmond K 2003 Onset of the 2002 North American Monsoon: Relation to Gulf of California sea surface temperatures 12th Conf. Interactions of the Sea Atmos. 83th AMS Ann. Meeting, Long Beach, Calif., 9–14 Feb.
- Williams A, Cook B, Smerdon J 2022 Rapid intensification of the emerging southwestern North American megadrought in 2020–2021 Nature Clim. Change 12 232-234. [CrossRef]
- Xu J, Gao X, Shuttleworth J, Sorooshian S, Small E 2004 Model climatology of the North American Monsoon onset period during 1980-2001 J. Clim. 17 3892–3906. [CrossRef]
- Zeng X, Lu E 2004 Globally unified monsoon onset and retreat indexes. J. Clim. 17 2241-2248. [CrossRef]
Figure 1.
Map of the locations of the 33 weather stations used in this analysis, Pima and Pinal counties, Arizona.
Figure 1.
Map of the locations of the 33 weather stations used in this analysis, Pima and Pinal counties, Arizona.
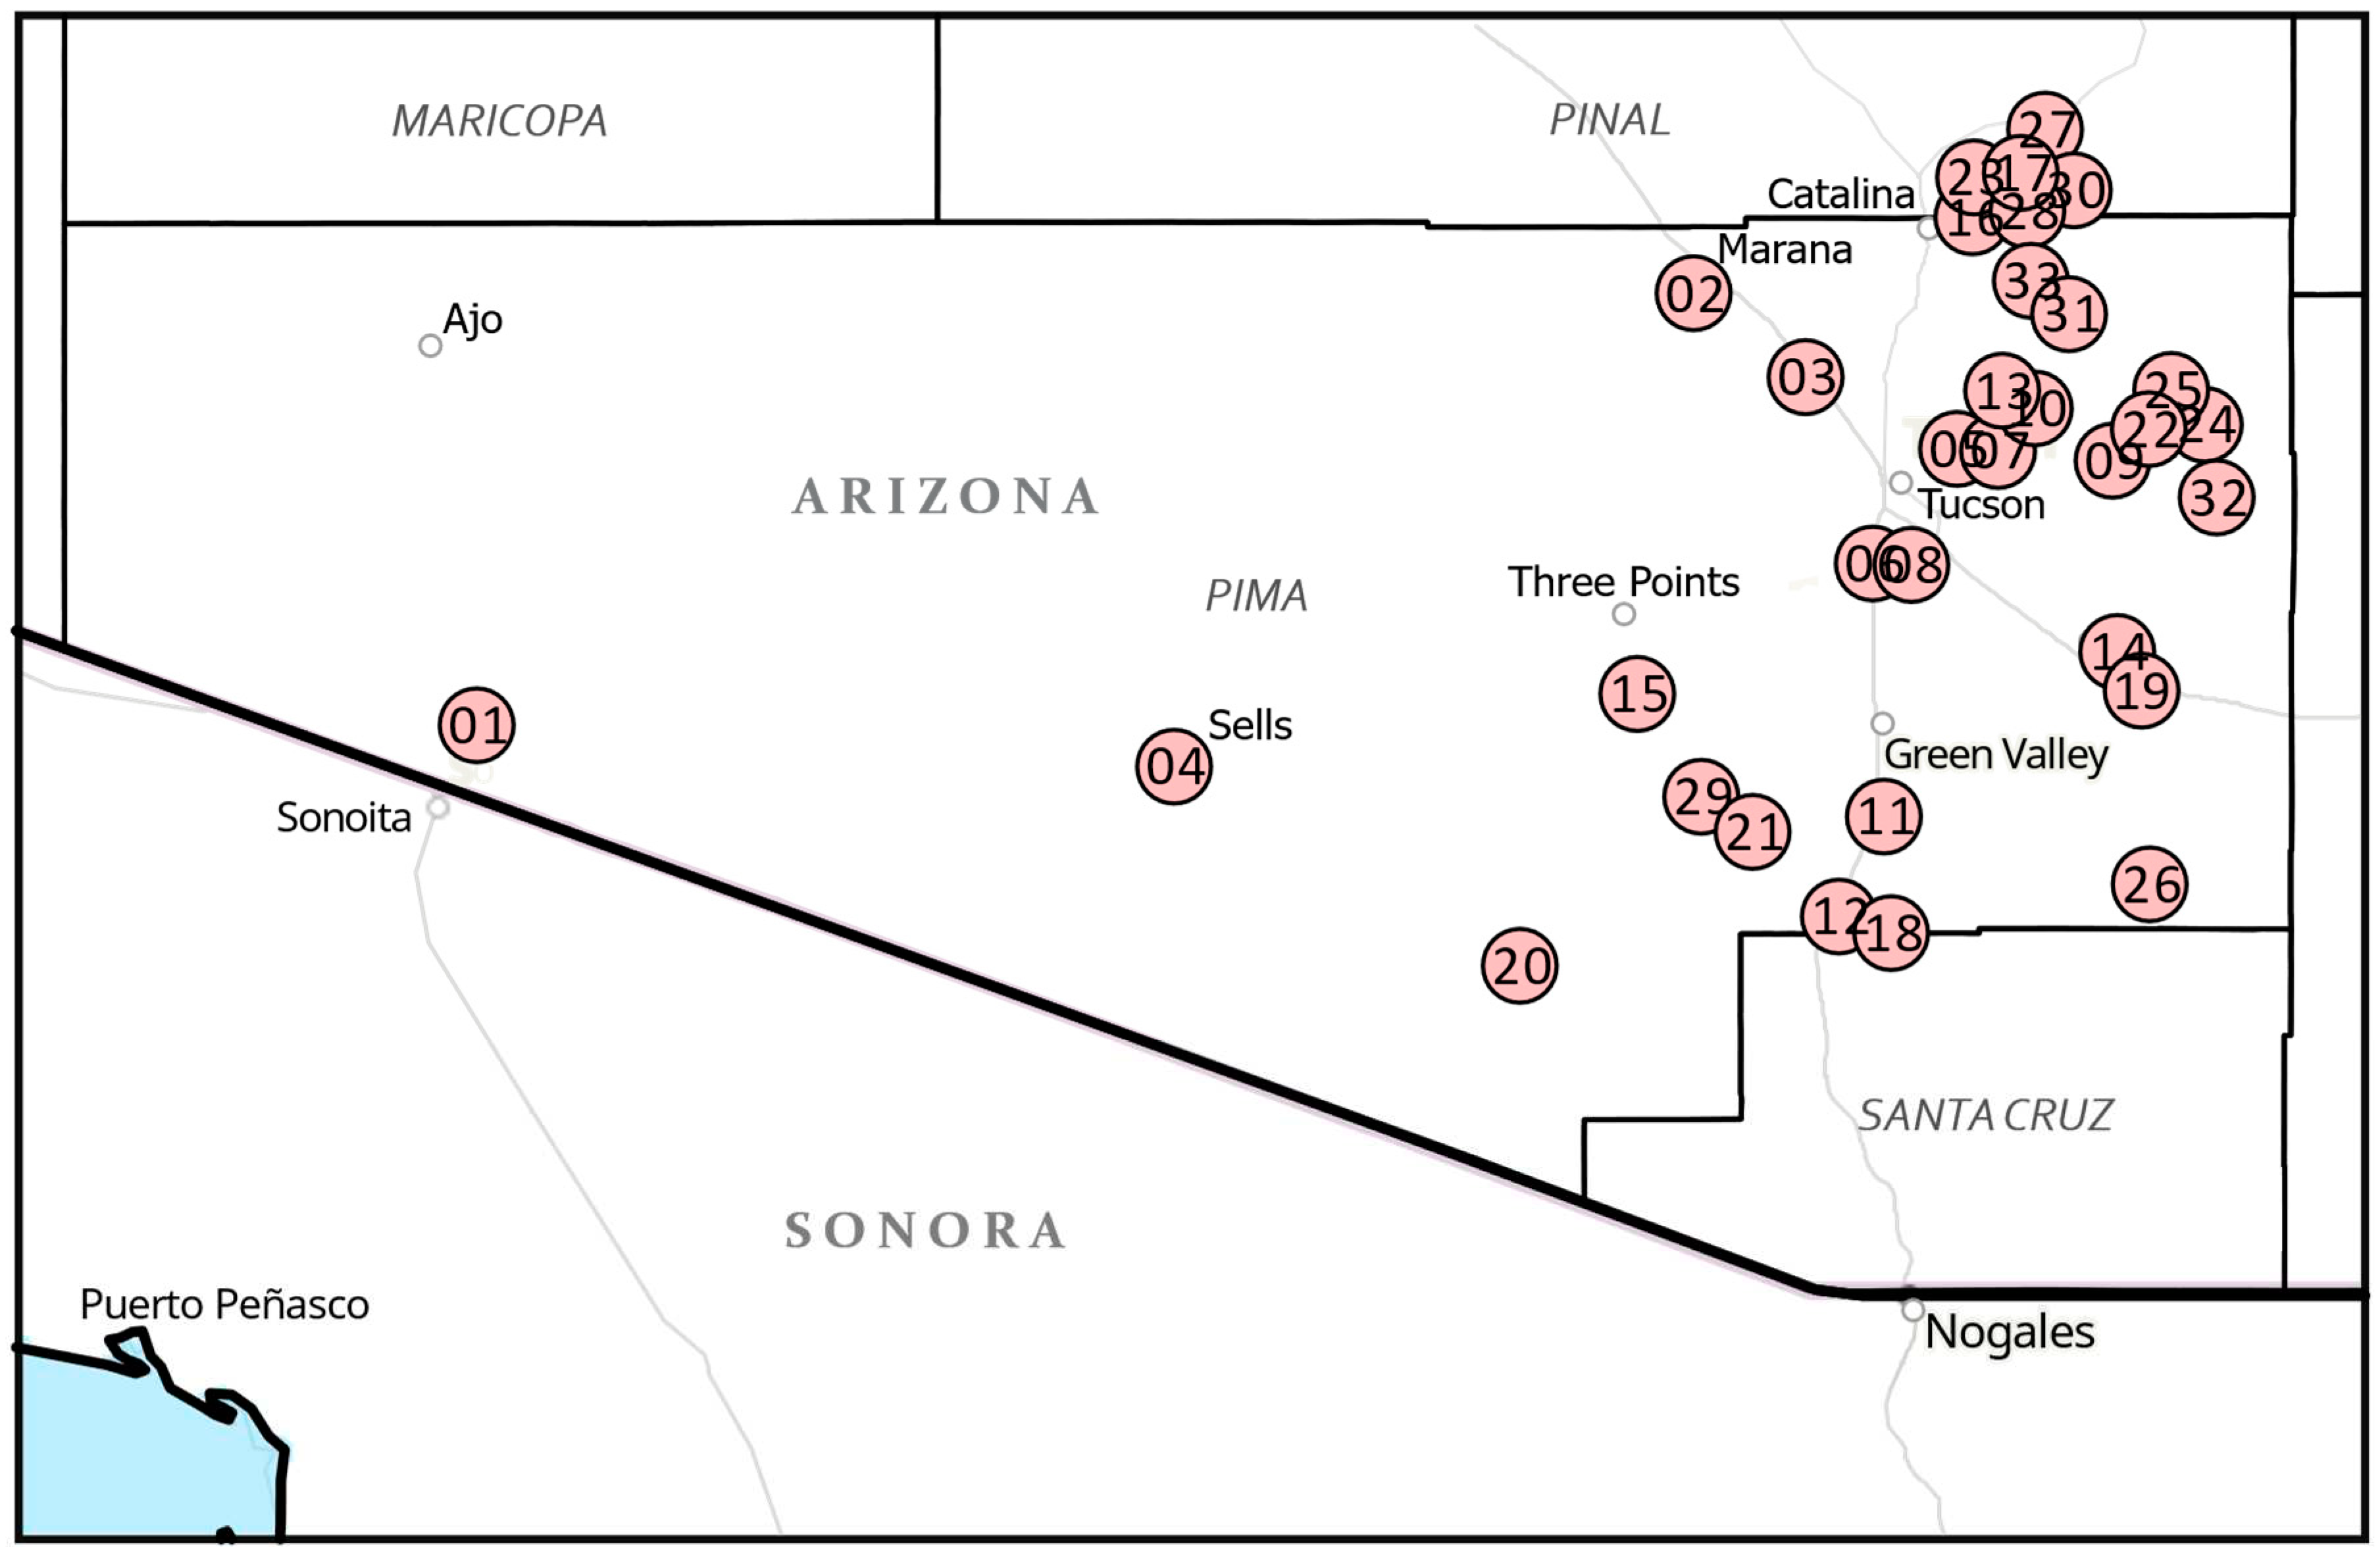
Figure 2.
Distribution of Gulf of California SST sampling blocks.
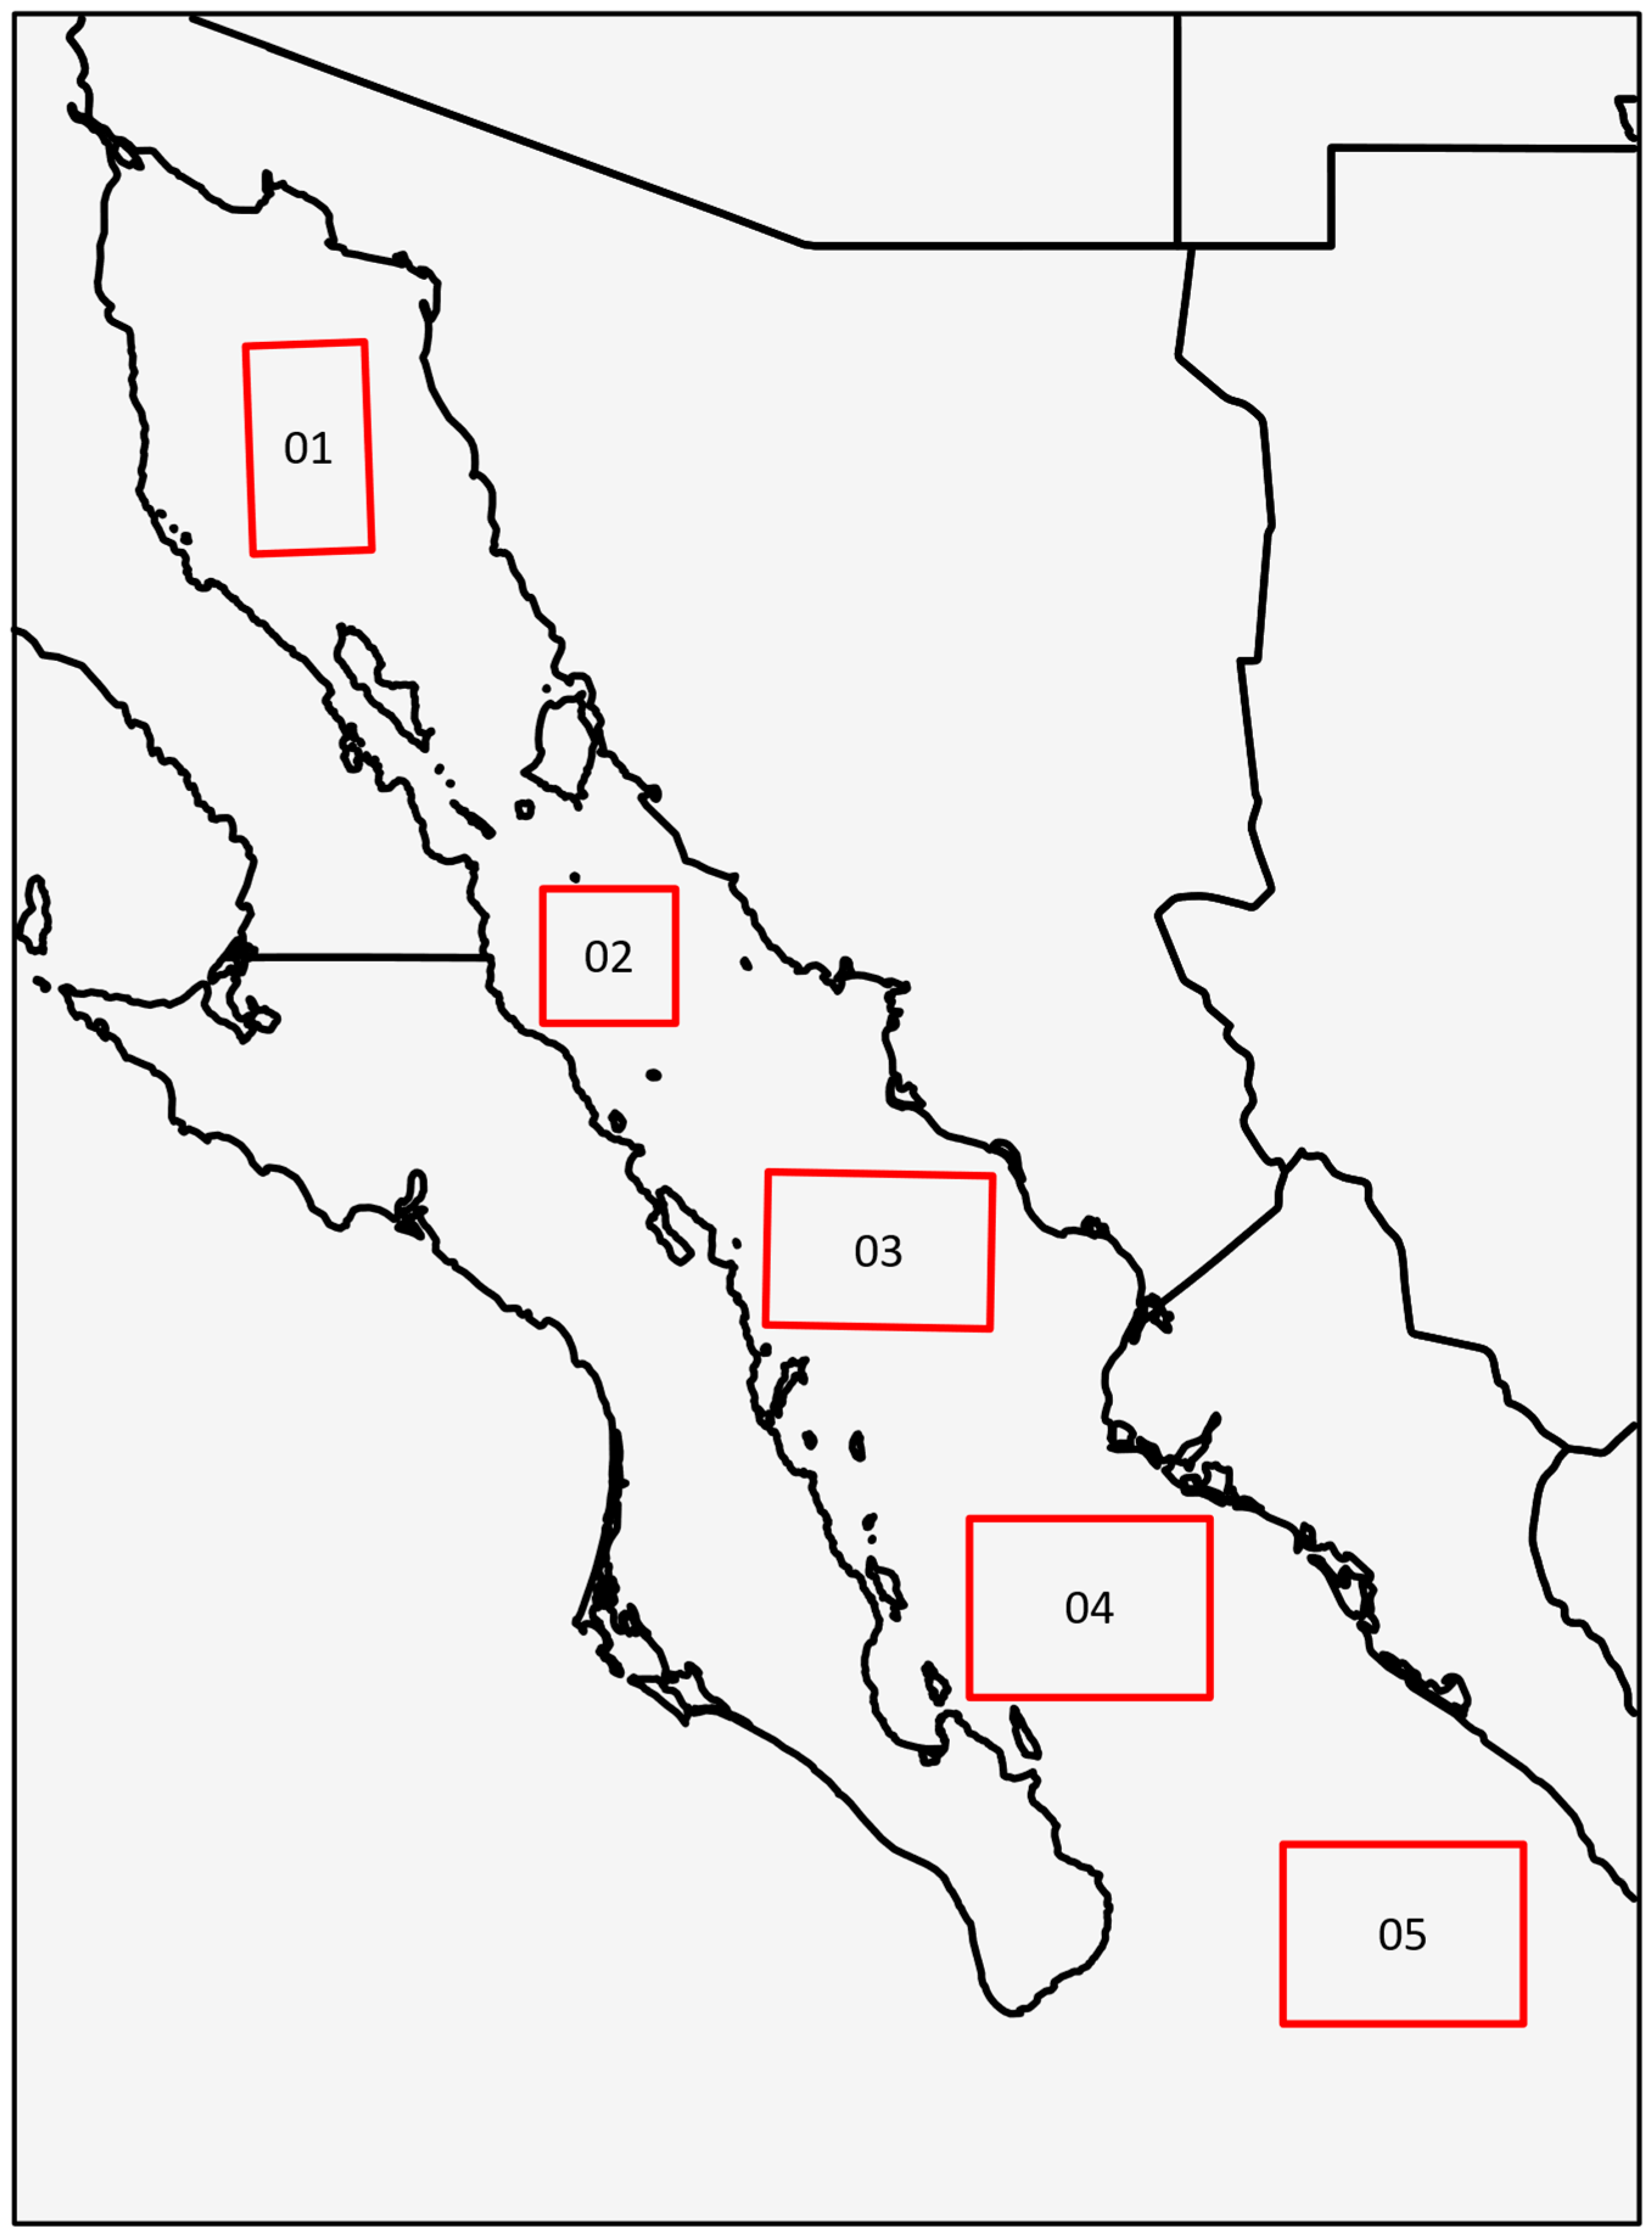
Figure 3.
Regression of Mean monsoon precipitation by station and station elevation (Table 1) on day of year of monsoon onset, 1990-2022. R2=0.6793, p-value=<.0001.
Figure 3.
Regression of Mean monsoon precipitation by station and station elevation (Table 1) on day of year of monsoon onset, 1990-2022. R2=0.6793, p-value=<.0001.
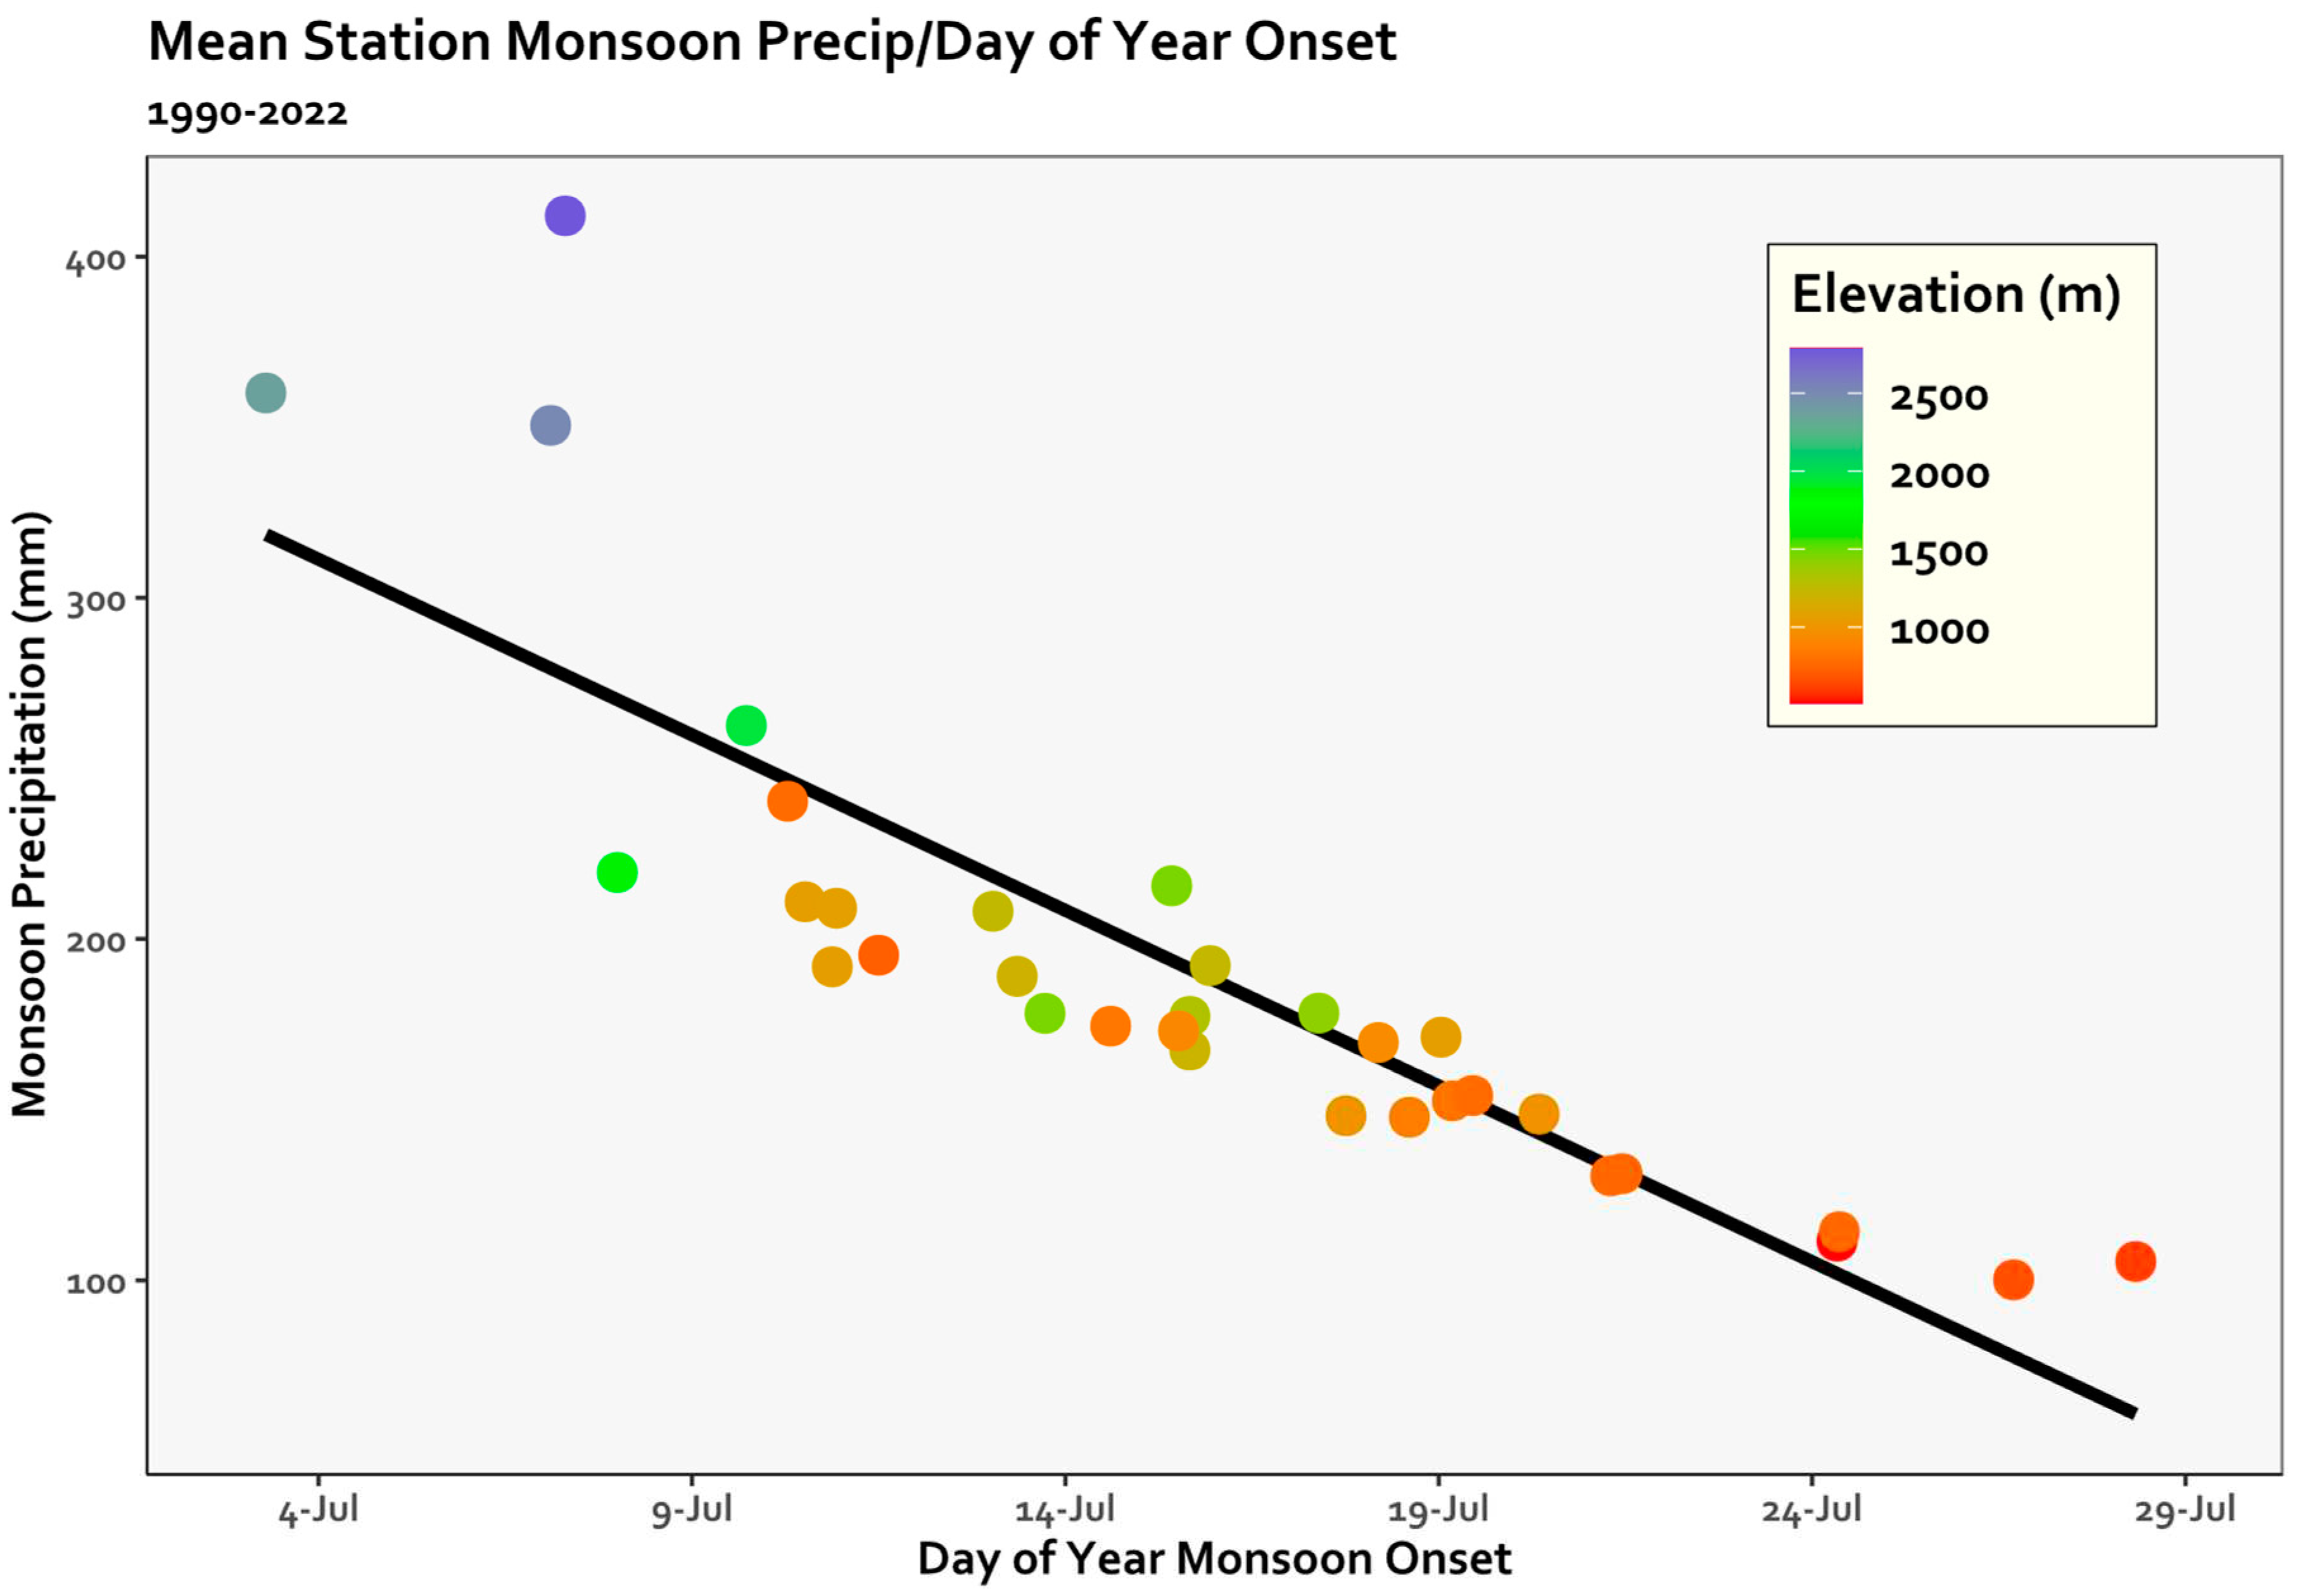
Figure 4.
Regression of Mean monsoon precipitation by station and station day of year of monsoon onset (Table 1) on elevation, 1990-2022. R2=0.8815, p-value=<.0001.
Figure 4.
Regression of Mean monsoon precipitation by station and station day of year of monsoon onset (Table 1) on elevation, 1990-2022. R2=0.8815, p-value=<.0001.
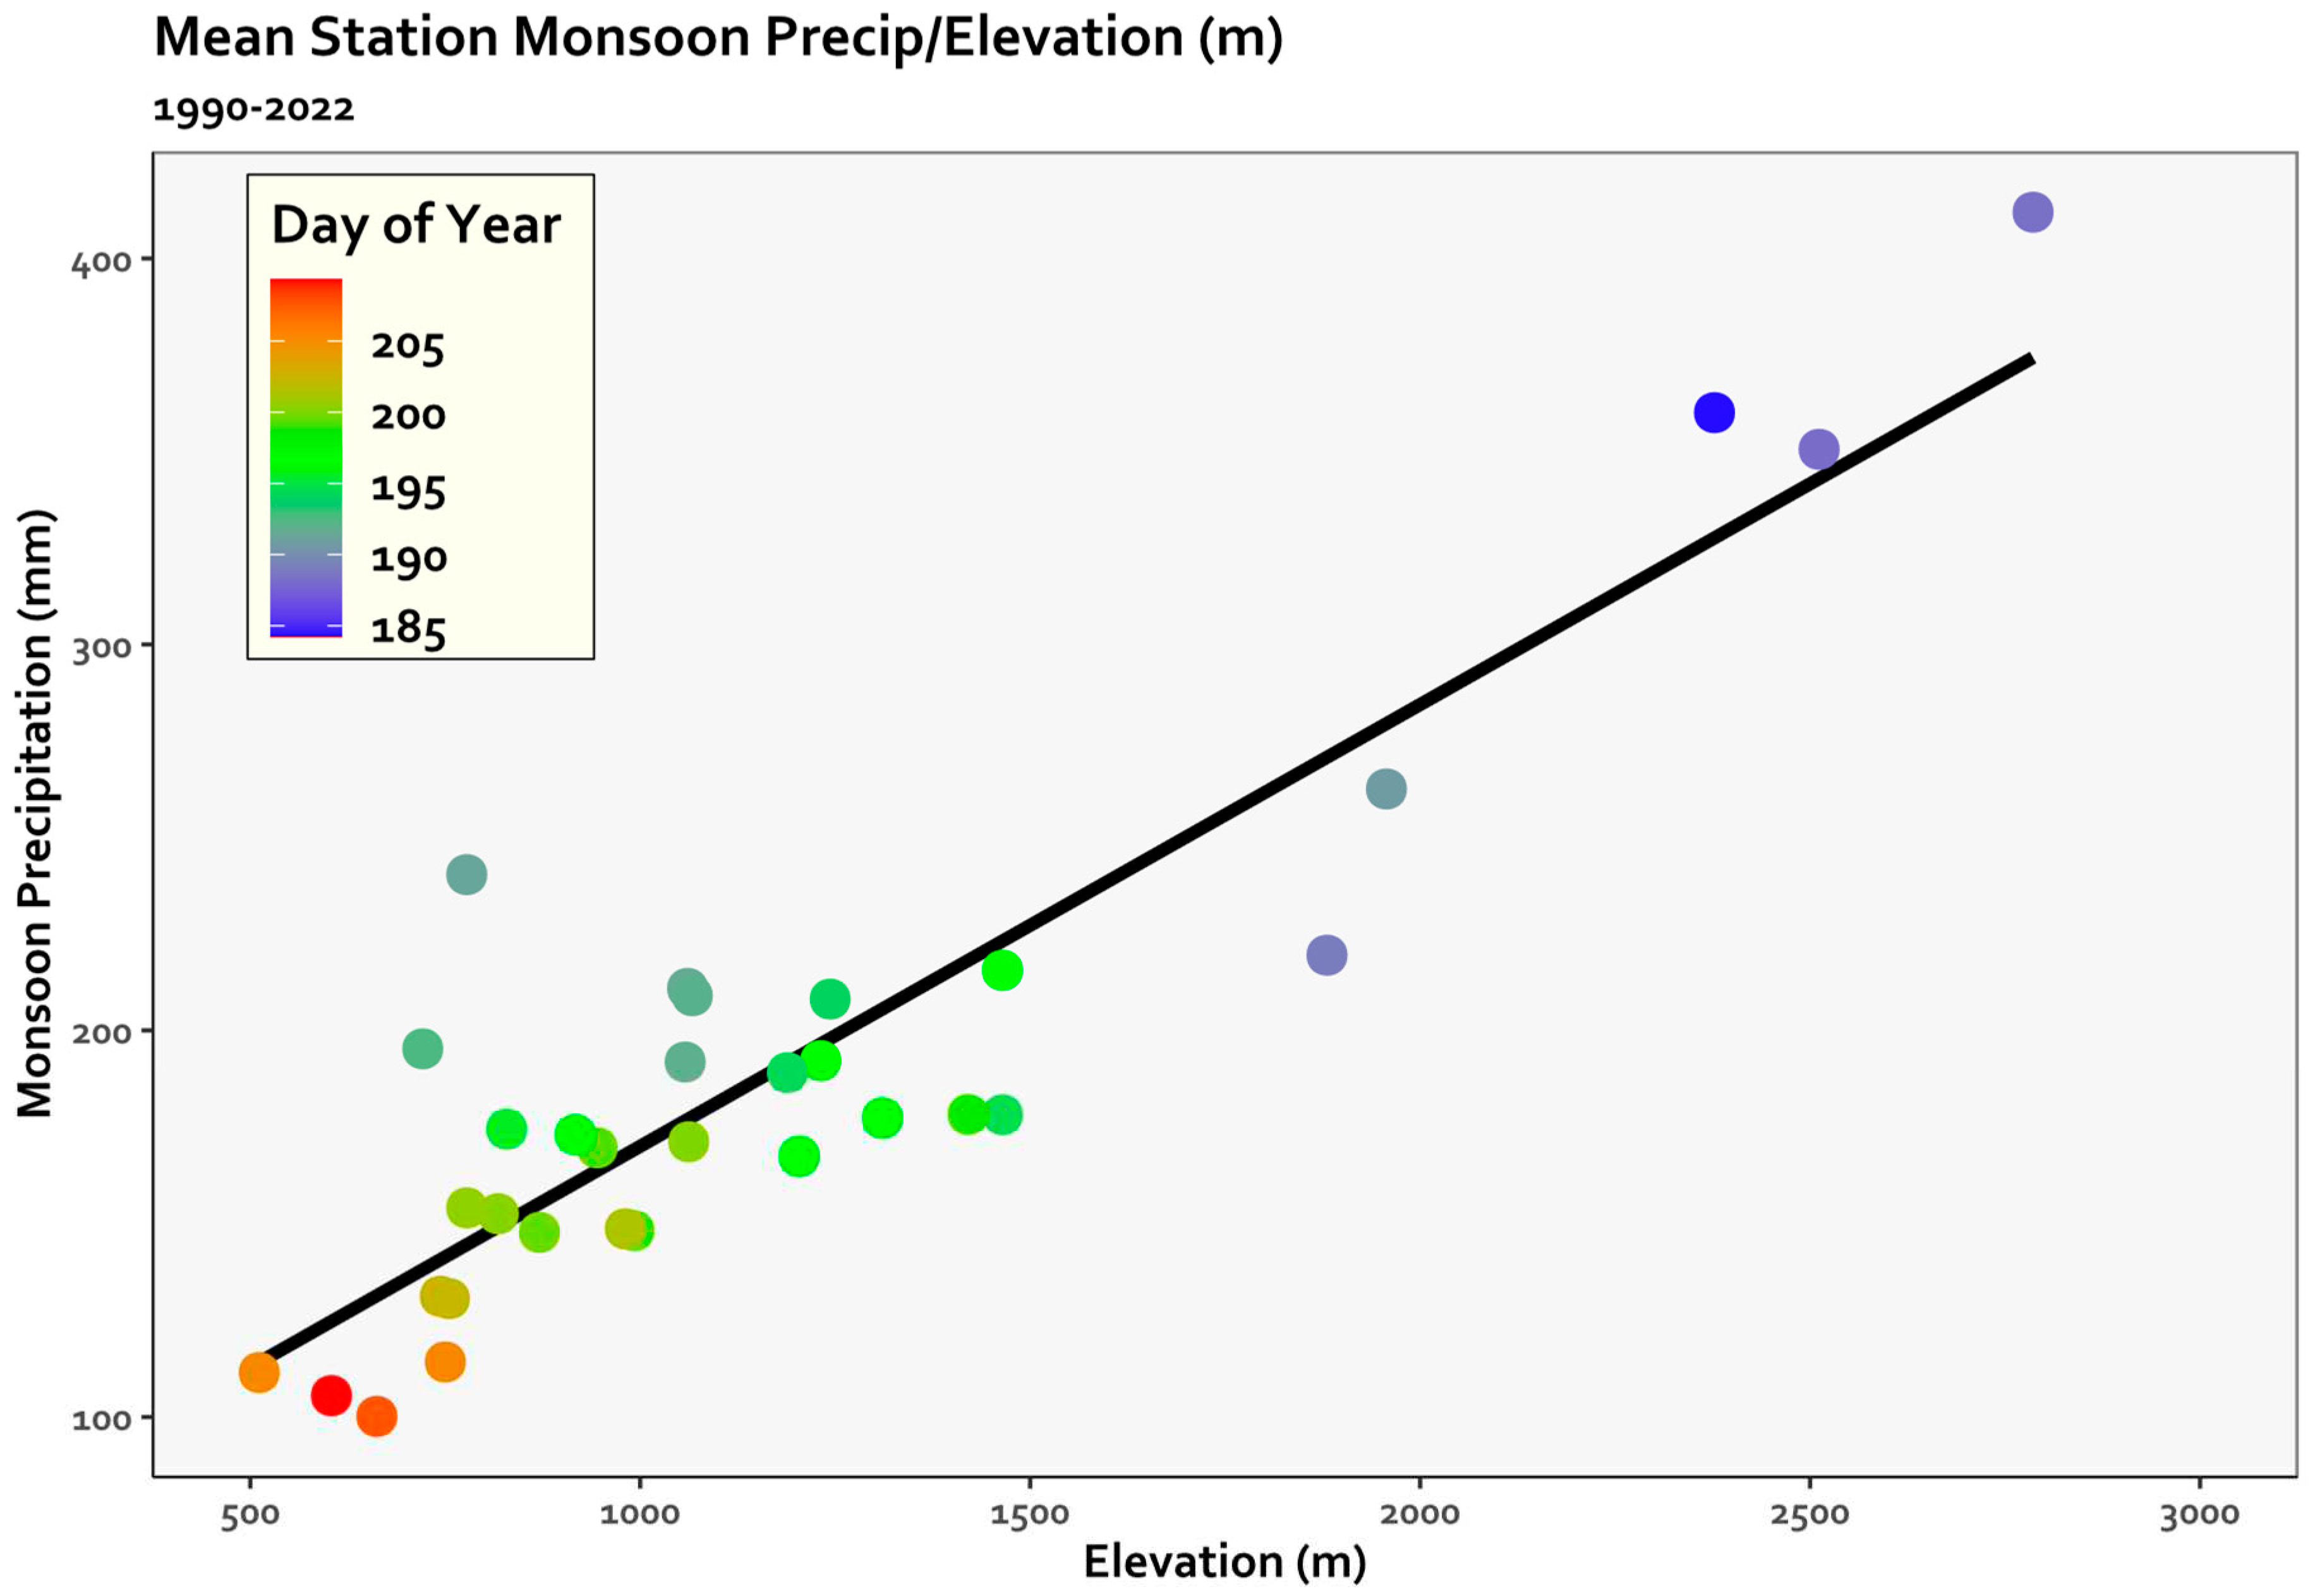
Figure 5.
General Additive Model (GAM) and Linear Model (LM) of monsoon onset time series, 1990-2022, n=1053. GAM: k=10, R2=.195, F=28.97, p-value<0.0001, deviance explained=20.2%. LM: R2=0.0325, F1,1051=35.3, p-value<0.0001. Wave period=8.8 years.
Figure 5.
General Additive Model (GAM) and Linear Model (LM) of monsoon onset time series, 1990-2022, n=1053. GAM: k=10, R2=.195, F=28.97, p-value<0.0001, deviance explained=20.2%. LM: R2=0.0325, F1,1051=35.3, p-value<0.0001. Wave period=8.8 years.
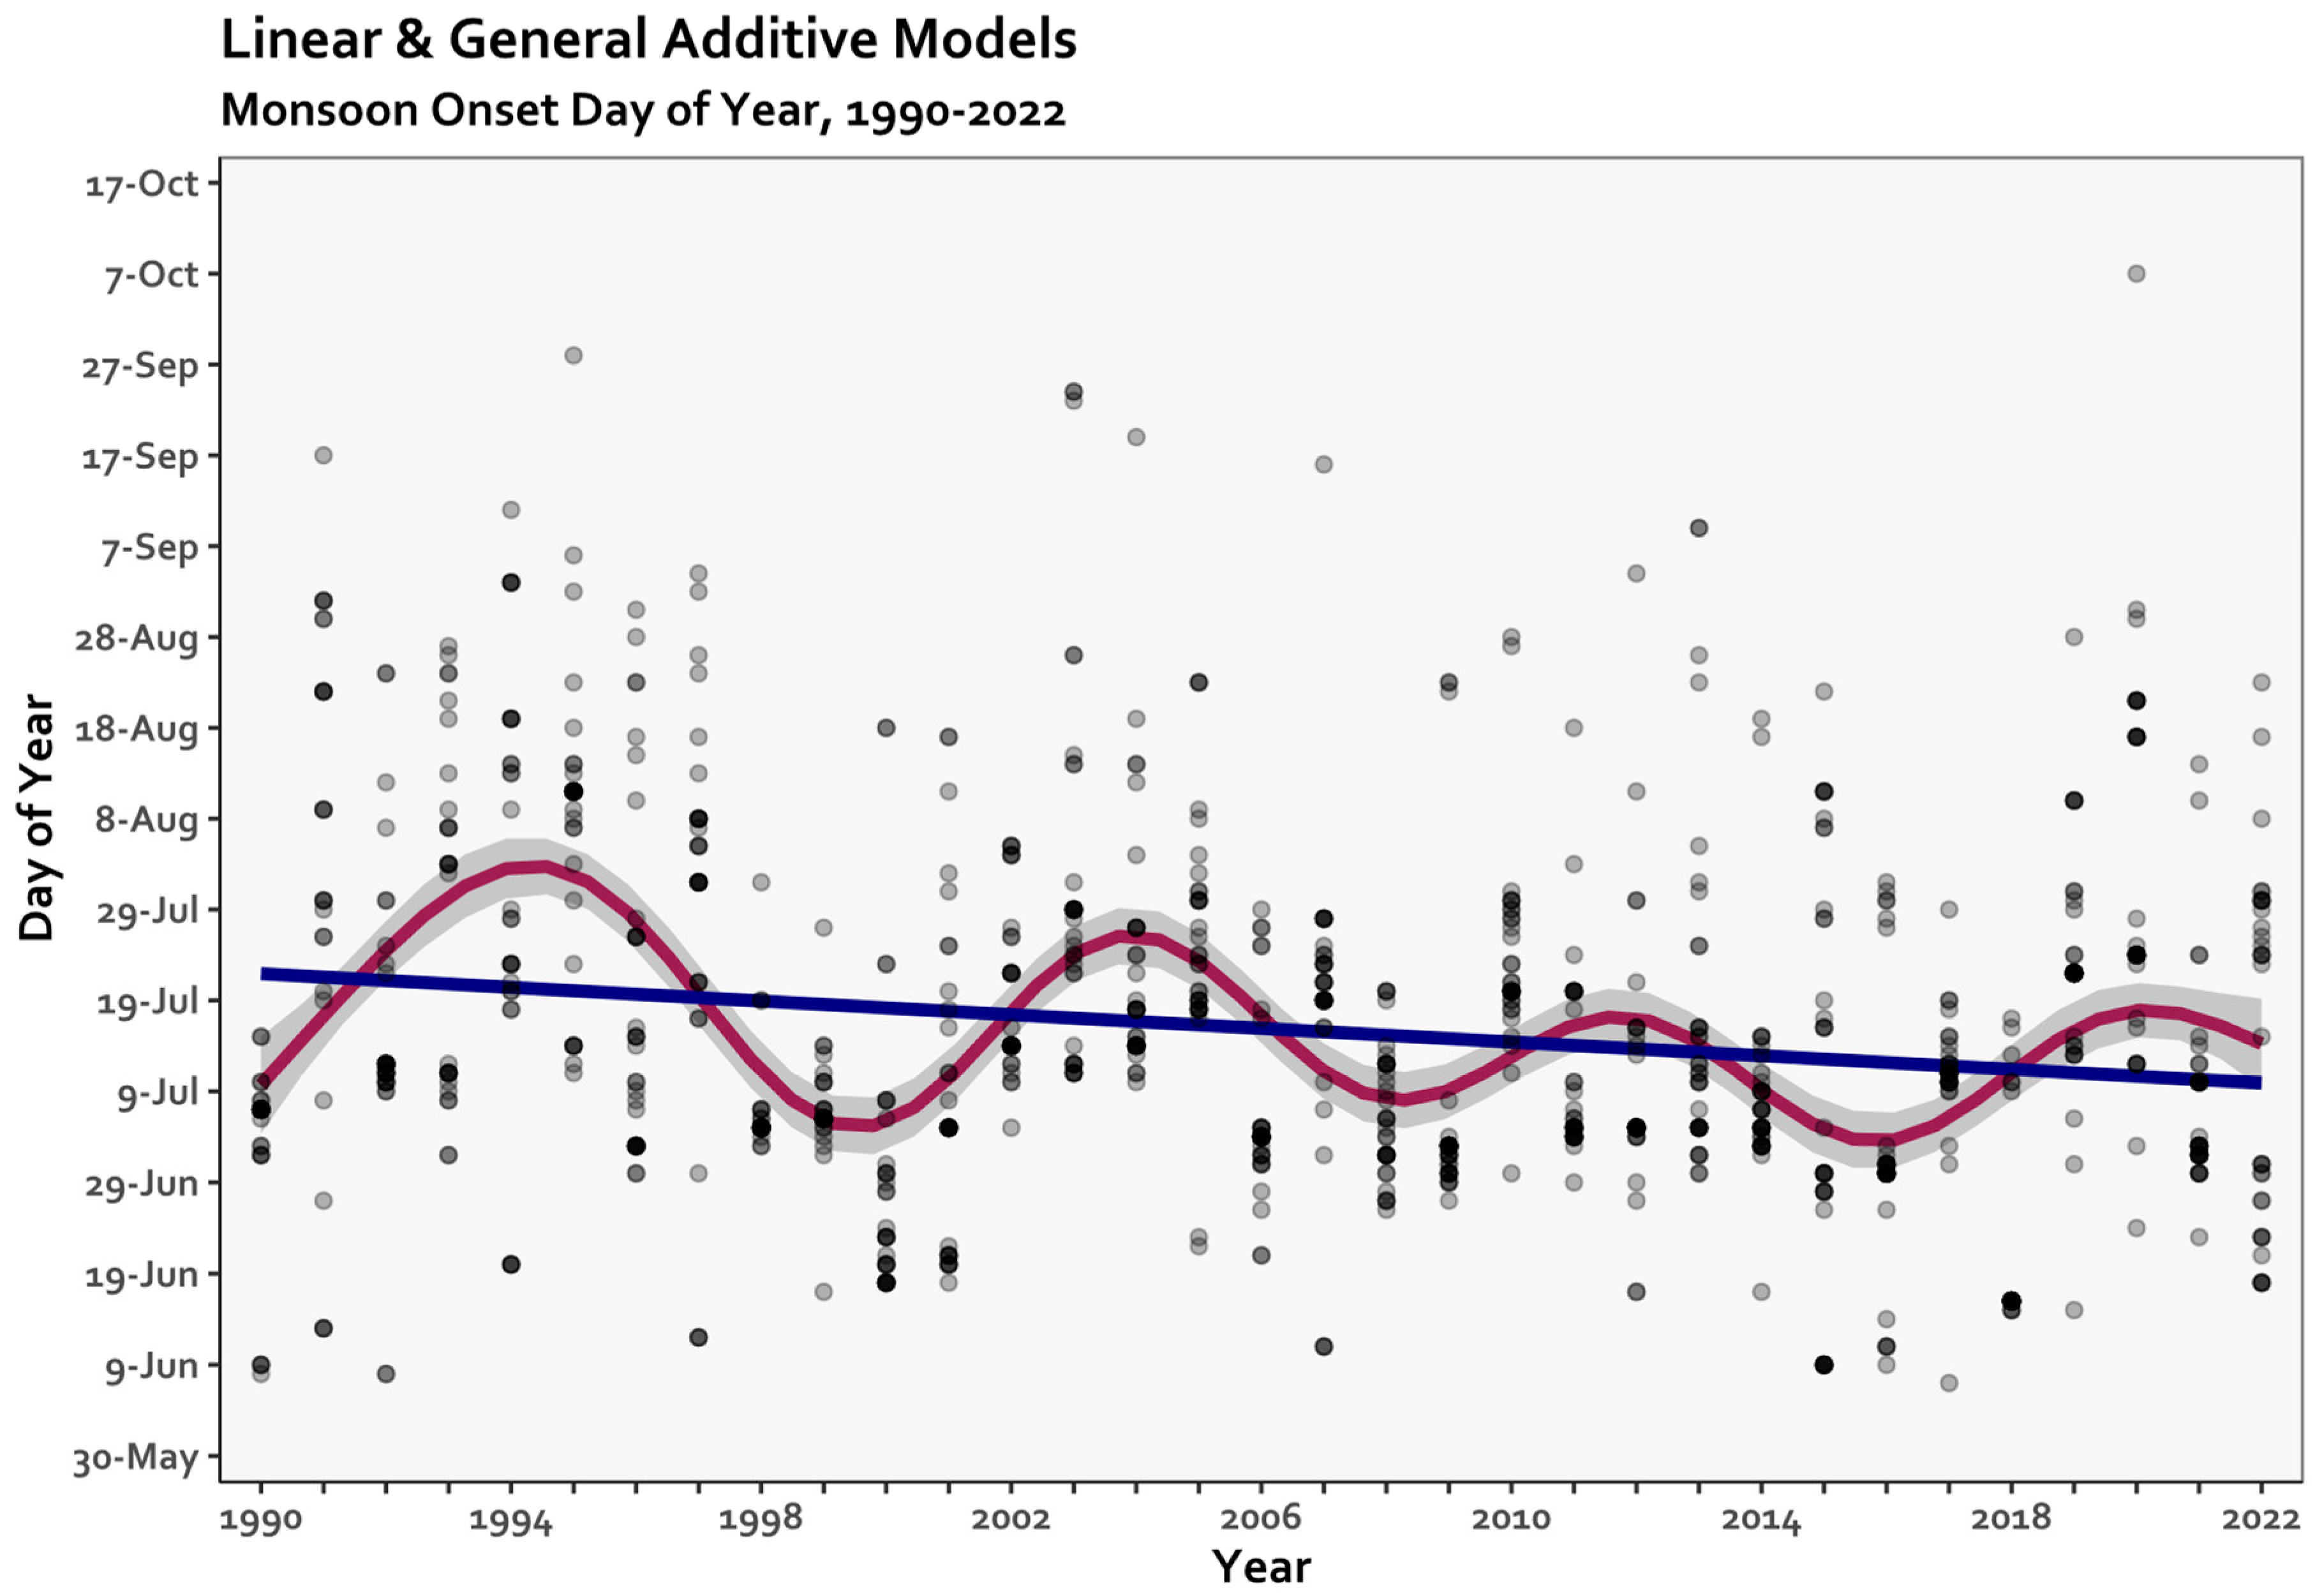
Figure 6.
Monsoon onset GAM and regression from Figure 5 and visualization of ENSO warm periods. Threshold of +/- 0.5oC for the Oceanic Niño Index (ONI) in the Niño 3.4 region (5ºN-5ºS, 120º-170ºW).
Figure 6.
Monsoon onset GAM and regression from Figure 5 and visualization of ENSO warm periods. Threshold of +/- 0.5oC for the Oceanic Niño Index (ONI) in the Niño 3.4 region (5ºN-5ºS, 120º-170ºW).
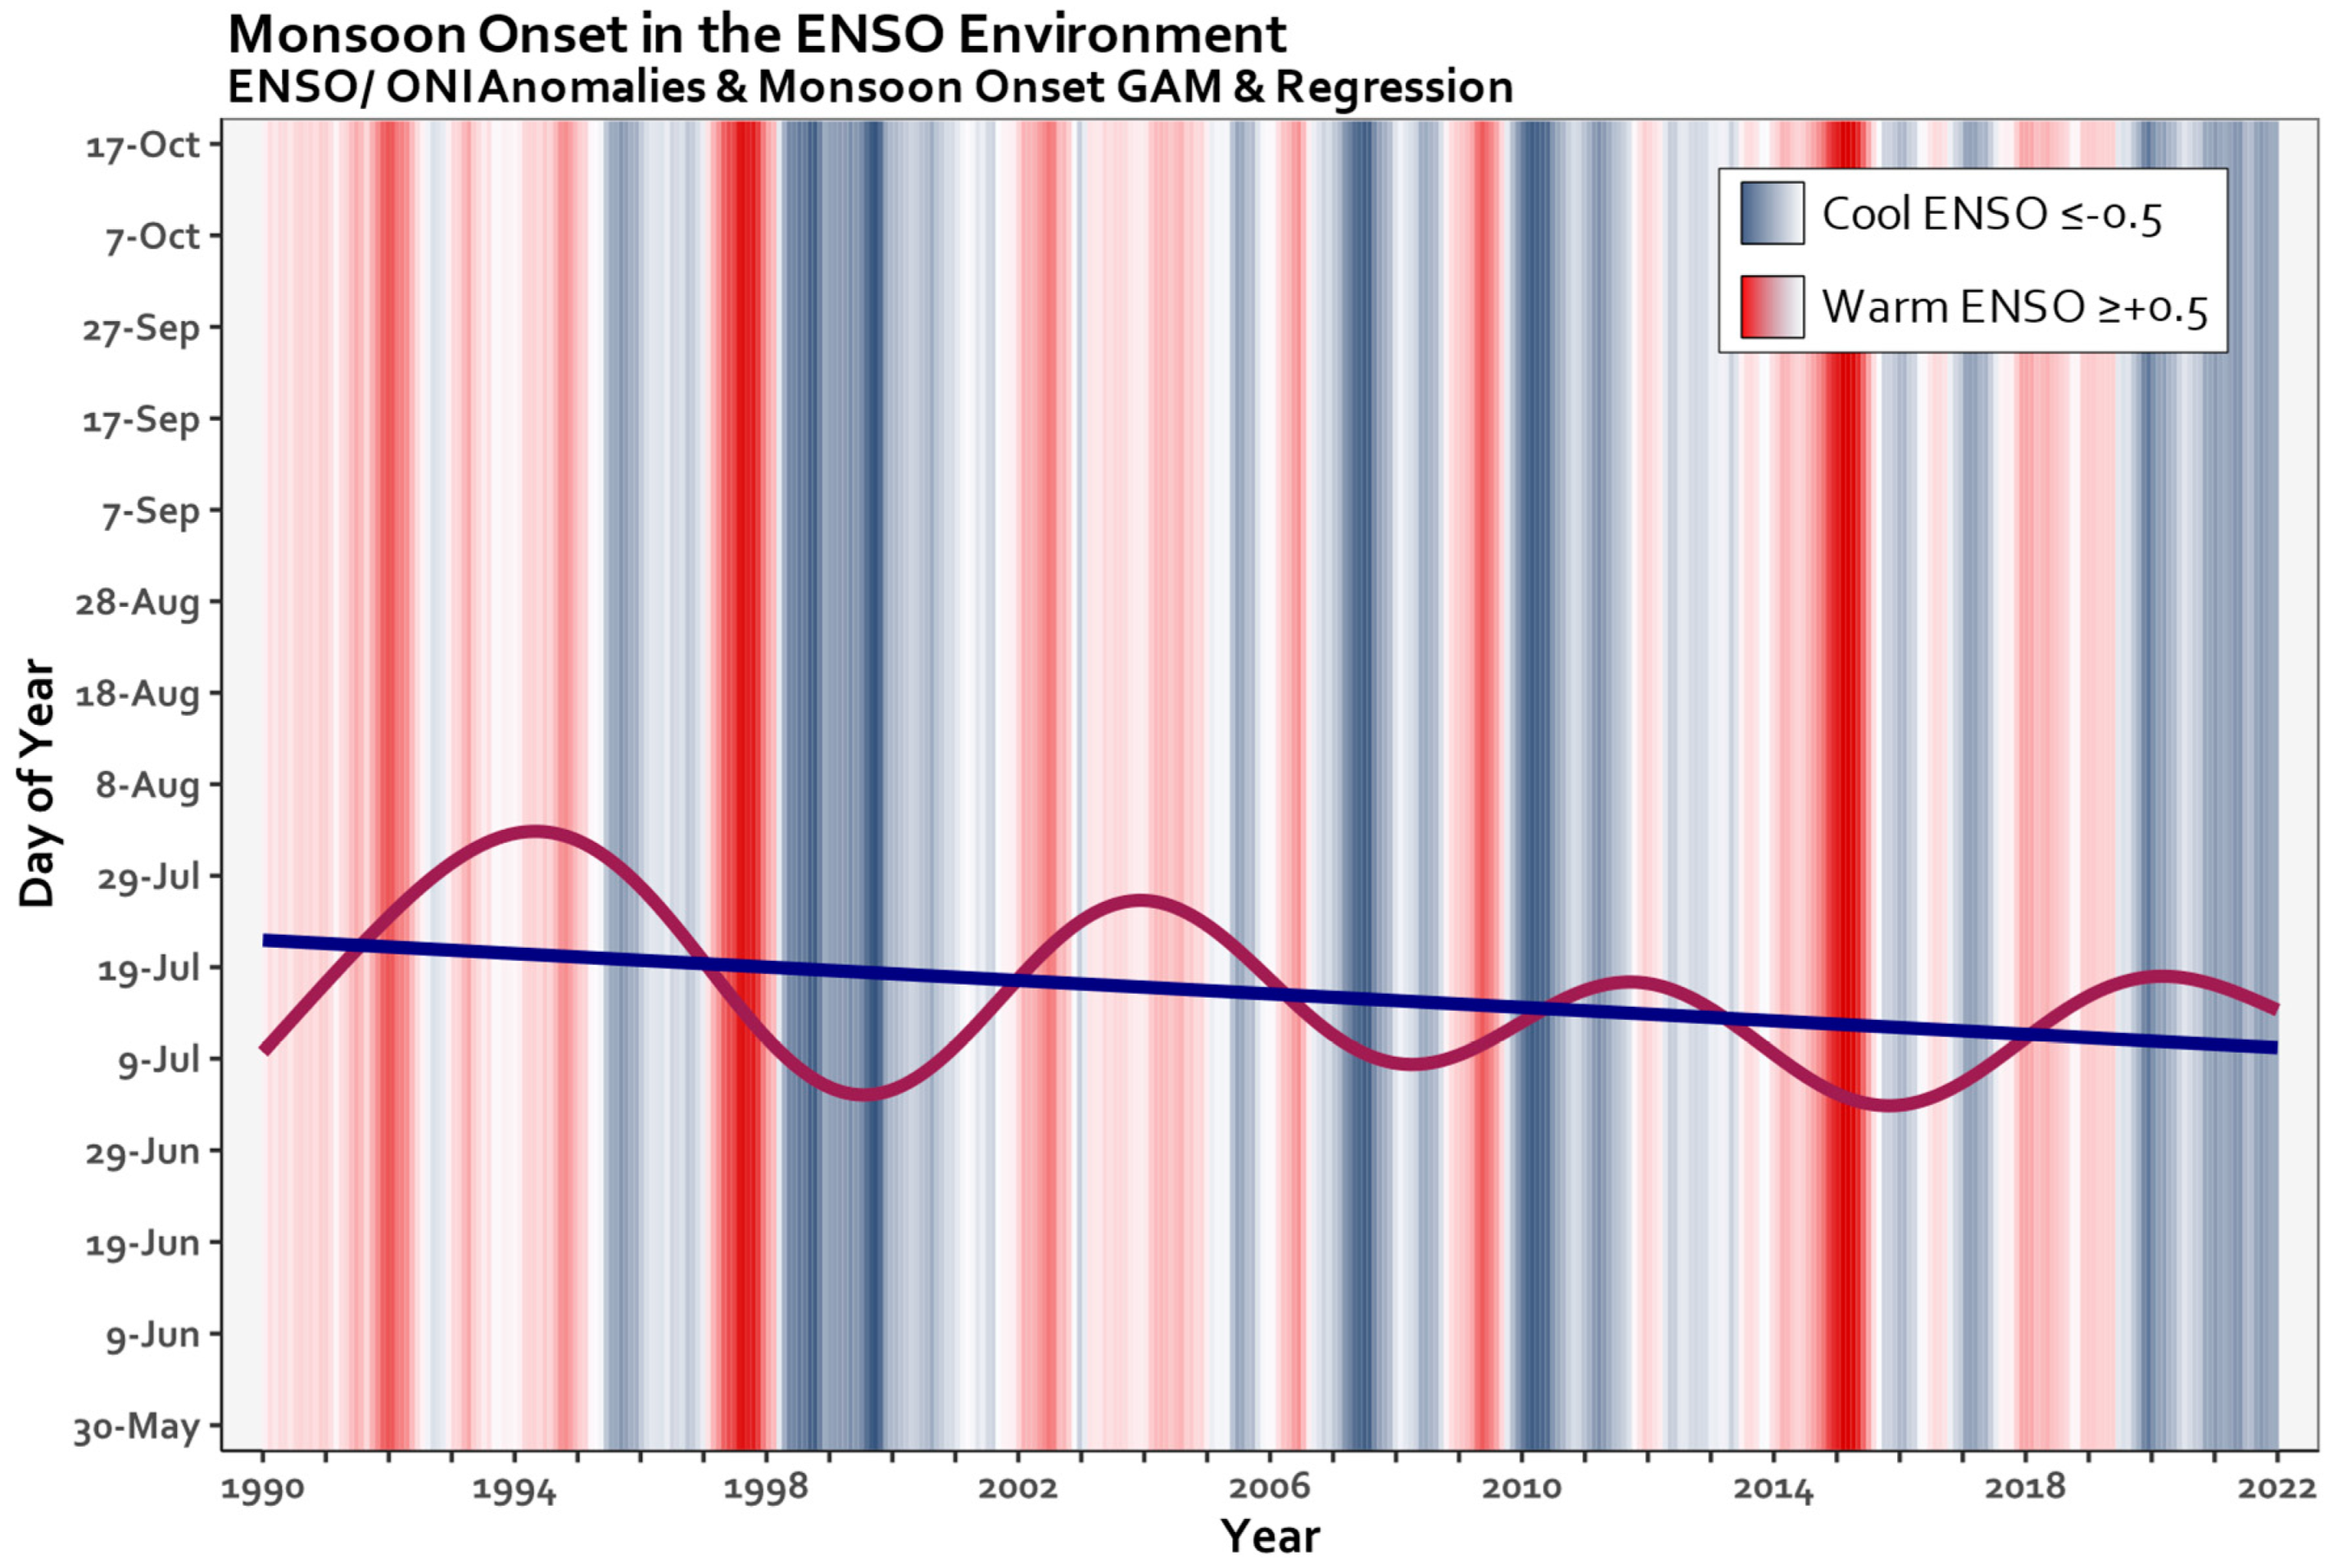
Figure 7.
Gulf of California SST warming to ≥29º C after 1 June in each of the bounding boxes (Figure 2) GAM and regression, 1990-2022, n=165. GAM: k=10, R2=.218, F=6.03, p-value<0.0001, deviance explained=25%. LM: R2=0.08857, F1,163=15.8, p-value=0.0001.
Figure 7.
Gulf of California SST warming to ≥29º C after 1 June in each of the bounding boxes (Figure 2) GAM and regression, 1990-2022, n=165. GAM: k=10, R2=.218, F=6.03, p-value<0.0001, deviance explained=25%. LM: R2=0.08857, F1,163=15.8, p-value=0.0001.
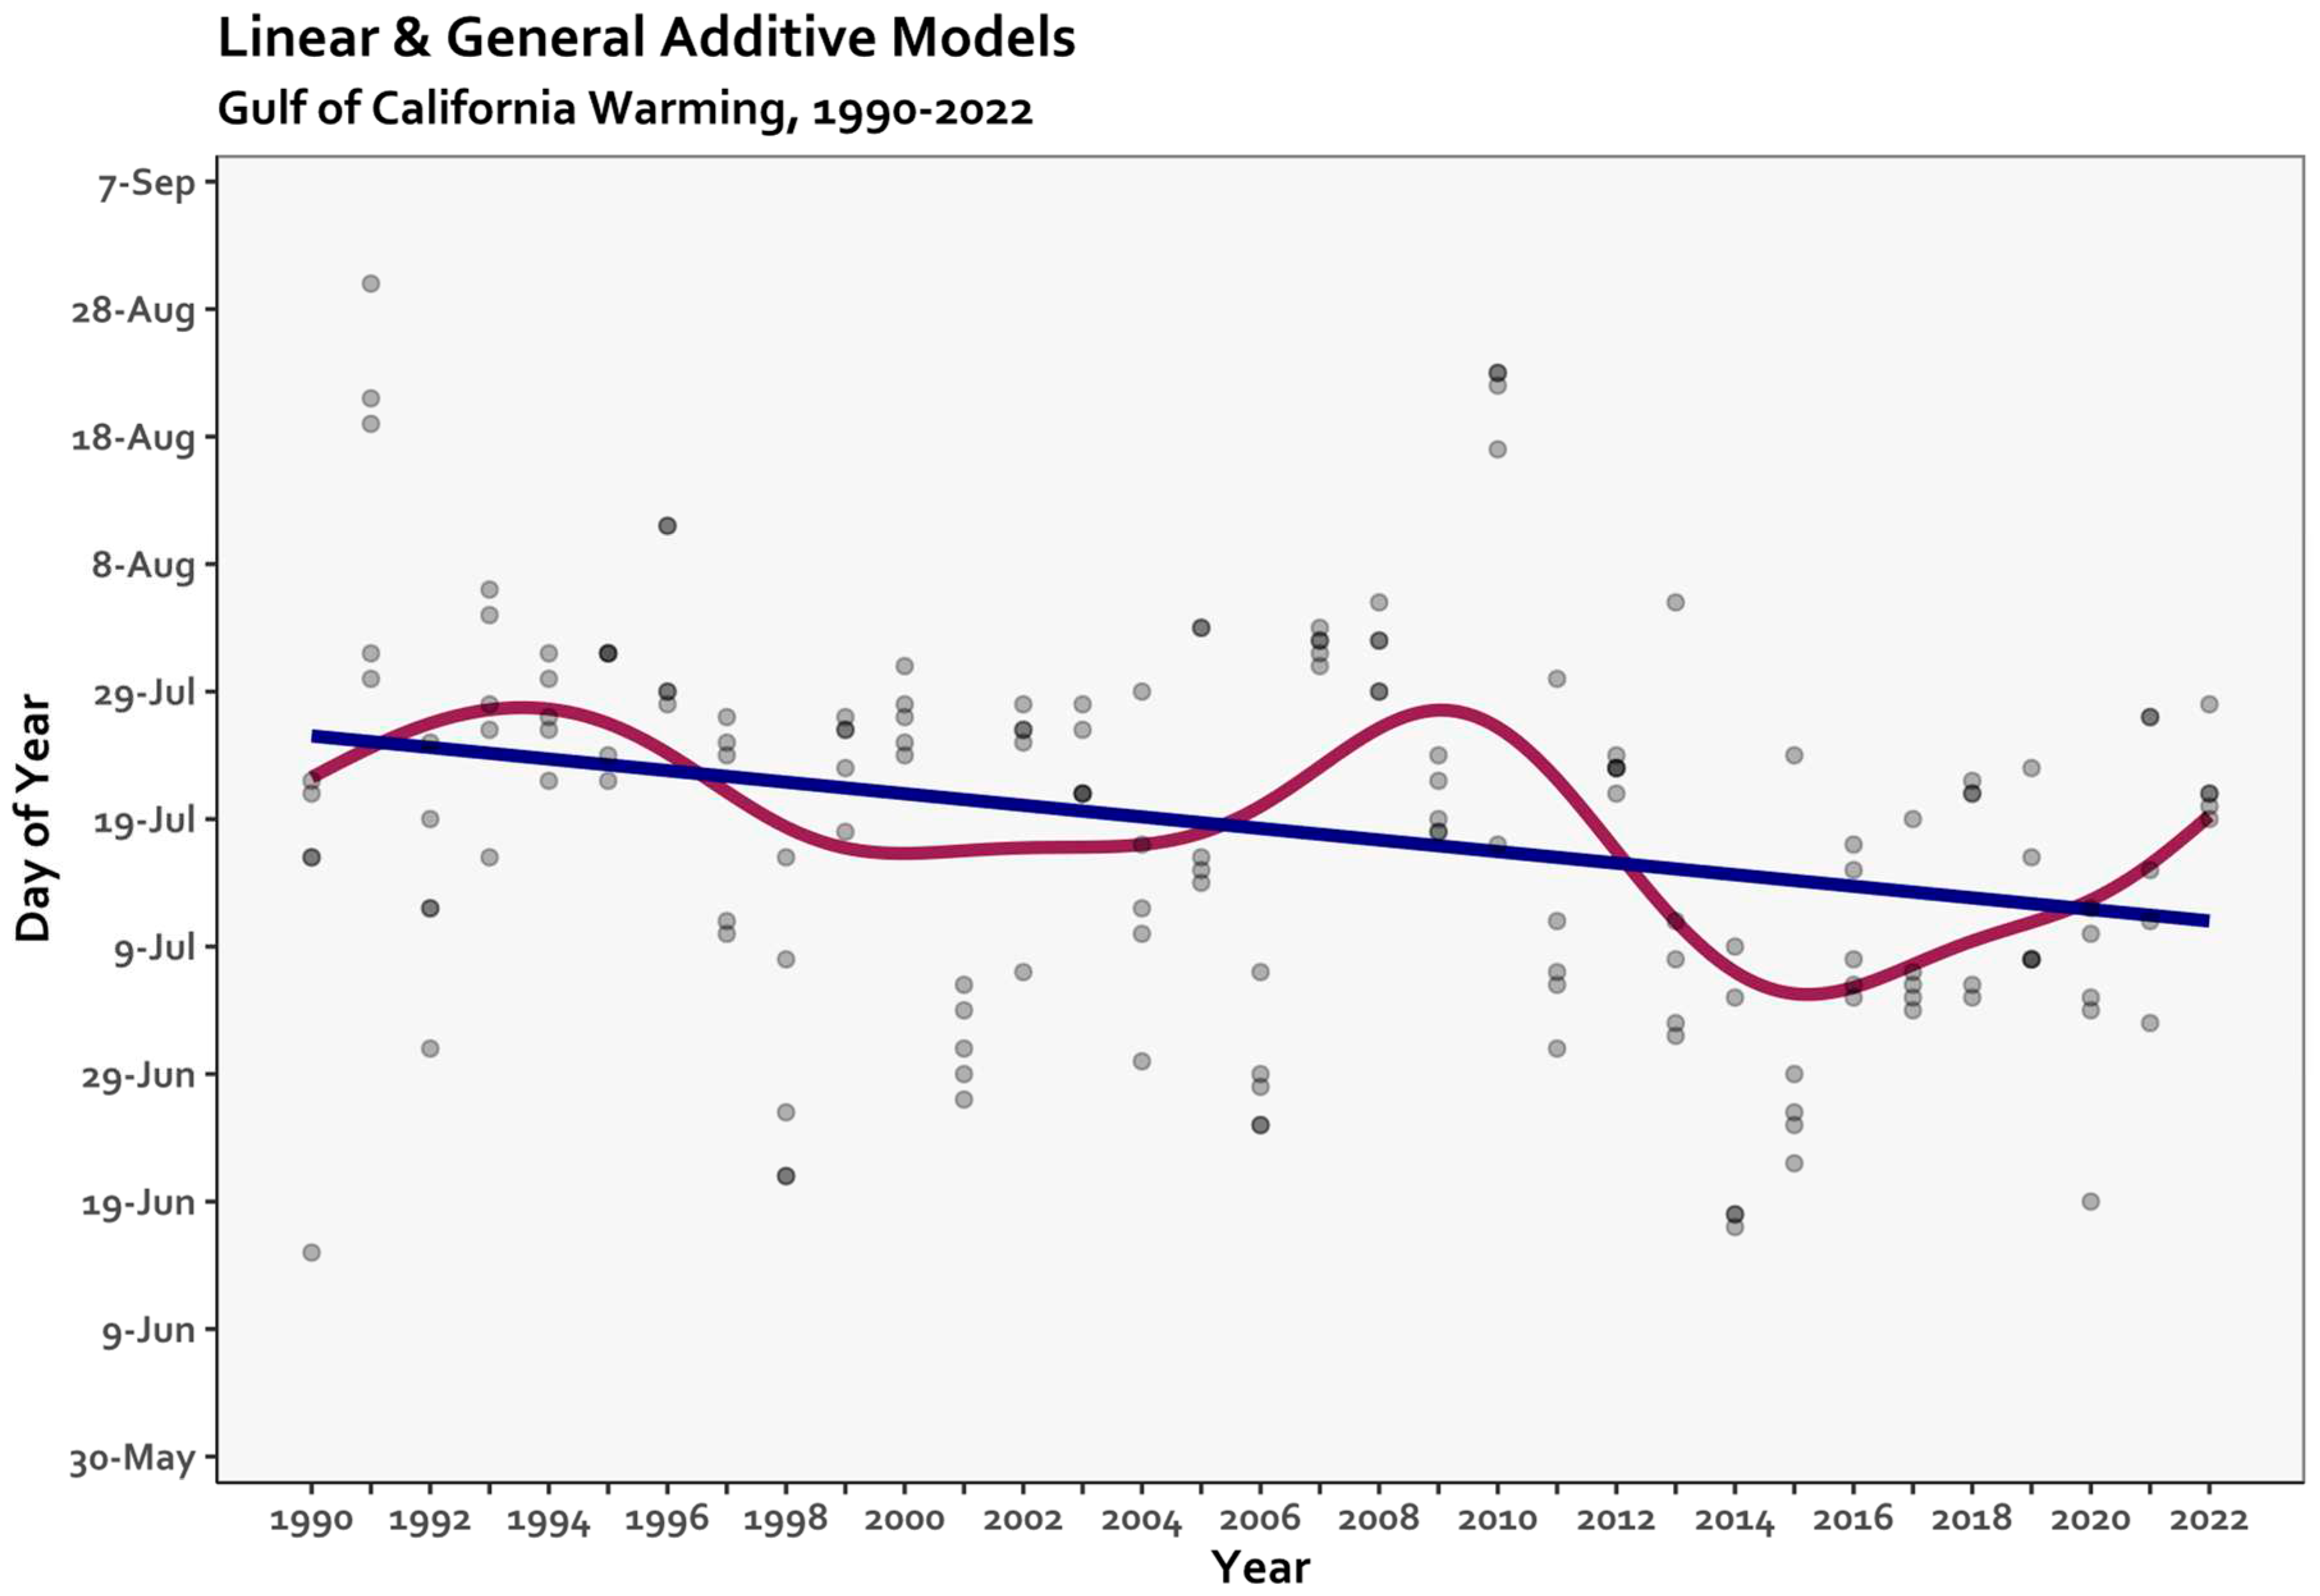

Table 1.
List of 33 weather stations sorted by elevation. Stations were chosen for length of record (preferably 1990-2021) and elevational representation. Any year with >20 missing daily rainfall totals during the June 1-September 30 sample period was omitted. Station record period listed here is that used for this analysis.
| Network | Station ID | Station Name | Period of Record Used | Elev. (m) | Latitude | Longitude | |
| 1 | US Park Service3 | USC00026132 | Organ Pipe Cactus NM | 1990-2001, 2003-2022 | 512 | 31.9555 | -112.8002 |
| 2 | Pima Co. ALERT1 | 6110 | Avra Valley Air Park/Santa Cruz R | 1990-2000, 2002-2022 | 604 | 32.42902 | -111.2251 |
| 3 | Pima Co. ALERT1 | 6020 | Santa Cruz R/Ina Rd | 1990-2000, 2002-2022 | 662 | 32.33725 | -111.0801 |
| 4 | RAWS4 | 021209 | Sells | 2005-2006, 2008-2009, 2011-2022 | 721 | 31.91 | -111.8975 |
| 5 | Pima Co. ALERT1 | 2370 | Alamo Wash/Glenn St | 1990-2008, 2010-2021 | 744 | 32.25871 | -110.8841 |
| 6 | Pima Co. ALERT1 | 6040 | Santa Cruz R/Valencia Rd | 1990-1996, 1998-2021 | 750 | 32.13306 | -110.9931 |
| 7 | Pima Co. ALERT1 | 2120 | Tanque Verde Sabino Bridge | 1990-2000, 2001-2010, 2011-2022 | 755 | 32.26529 | -110.8415 |
| 8 | US Weather Service2 | USW00023160 | Tucson Int'l Airport | 1990-2022 | 778 | 32.13153 | -110.9564 |
| 9 | Pima Co. ALERT1 | 2090 | Tanque Verde Guest Ranch | 1990-2008, 2010-2021 | 829 | 32.2458 | -110.6828 |
| 10 | Pima Co. ALERT1 | 2160 | Sabino Dam | 1990-2022 | 847 | 32.31464 | -110.8109 |
| 11 | Pima Co. ALERT1 | 6050 | Santa Cruz R/Continental Rd | 1990-2021 | 871 | 31.85512 | -110.9788 |
| 12 | Pima Co. ALERT1 | 6060 | Santa Cruz R/Canoa Ranch | 1990-2022 | 917 | 31.7451 | -111.037 |
| 13 | RAWS4 | 021202 | Saguaro | 2002-2022 | 945 | 32.31667 | -110.8133 |
| 14 | Pima Co. ALERT1 | 4250 | Pantano Vail | 1990, 1992-2019, 2022 | 981 | 32.03595 | -110.6768 |
| 15 | Pima Co. ALERT1 | 6410 | Diamond Bell Ranch | 1990-1999, 2001-2022 | 992 | 31.98991 | -111.298 |
| 16 | Pima Co. ALERT1 | 1040 | Dodge Tank | 1990-2020 | 1006 | 32.51192 | -110.8642 |
| 17 | Pima Co. ALERT1 | 1070 | Catalina State Park | 1991-2021 | 1009 | 32.52609 | -110.7948 |
| 18 | Pima Co. ALERT1 | 6350 | Elephant Head | 1990-2022 | 1058 | 31.72684 | -110.9694 |
| 19 | Pima Co. ALERT1 | 4310 | Davidson Canyon | 1990-2022 | 1061 | 31.99358 | -110.6452 |
| 20 | RAWS4 | 021206 | Sasabe | 1992-2022 | 1067 | 31.69083 | -111.45 |
| 21 | Pima Co. ALERT1 | 6320 | Tinaja Ranch | 1990, 1992, 1994-2022 | 1189 | 31.83826 | -111.1487 |
| 22 | Pima Co. ALERT1 | 2080 | Alamo Tank | 1990-2022 | 1204 | 32.28031 | -110.6359 |
| 23 | Pima Co. ALERT1 | 1050 | Cherry Tank | 1990-2021 | 1231 | 32.51808 | -110.837 |
| 24 | Pima Co. ALERT1 | 2030 | Italian Trap | 1990, 1992-2022 | 1244 | 32.28517 | -110.5635 |
| 25 | Pima Co. ALERT1 | 2050 | Ranch Rd | 1990-1993, 1995-2022 | 1311 | 32.30989 | -110.6069 |
| 26 | RAWS4 | 021205 | Empire | 1990-2011, 2013-2016, 2018-2022 | 1417 | 31.78056 | -110.6347 |
| 27 | Pima Co. ALERT1 | 1020 | Oracle R.S. CDO | 1990-2019, 2021 | 1420 | 32.58566 | -110.7859 |
| 28 | Pima Co. ALERT1 | 1060 | Pig Springs | 1990-2022 | 1465 | 32.52609 | -110.7948 |
| 29 | Pima Co. ALERT1 | 6310 | Keystone Peak | 1990-2021 | 1881 | 31.87694 | -111.2152 |
| 30 | Pima Co. ALERT1 | 1030 | Oracle Ridge | 1990-2021 | 1957 | 32.5328 | -110.7563 |
| 31 | Pima Co. ALERT1 | 2150 | White Tail | 1990-1992, 1994-202 | 2490 | 32.41311 | -110.7319 |
| 32 | RAWS4 | 021207 | Rincon | 1995-2022 | 2512 | 32.20556 | -110.5481 |
| 33 | Pima Co. ALERT1 | 1090 | Mount Lemmon | 1990-2022 | 2786 | 32.44264 | -110.7885 |
Table 2.
Average day of monsoon onset, total average monsoon precipitation (1 June – 30 Sept) and total average annual precipitation for 33 weather stations sorted by elevation (as in Table 1) in Pima and Pinal Counties, Arizona, 1990-2022.
Table 2.
Average day of monsoon onset, total average monsoon precipitation (1 June – 30 Sept) and total average annual precipitation for 33 weather stations sorted by elevation (as in Table 1) in Pima and Pinal Counties, Arizona, 1990-2022.
| Station Name | Mean Onset (day of year) |
Monsoon Total (mm) |
Annual Total (mm) | No. Years | Elev. (m) | Latitude | Longitude |
| Organ Pipe Cactus NM | 205.33 | 111.49 | 234.81 | 33 | 512 | 31.956 | -112.800 |
| Avra Valley Air Park - Santa Cruz Basin | 209.18 | 105.51 | 206.68 | 33 | 604 | 32.429 | -111.225 |
| Santa Cruz River at Ina Road | 207.70 | 100.15 | 201.24 | 33 | 662 | 32.337 | -111.080 |
| Sells | 192.50 | 195.23 | 322.60 | 22 | 721 | 31.910 | -111.898 |
| Alamo Wash below Glenn St | 202.45 | 131.23 | 244.69 | 33 | 744 | 32.259 | -110.884 |
| Santa Cruz River at Valencia Road | 205.36 | 114.23 | 208.66 | 33 | 750 | 32.133 | -110.993 |
| Tanque Verde Sabino Bridge | 202.30 | 130.59 | 240.29 | 33 | 755 | 32.265 | -110.842 |
| Tucson Int'l Airport | 200.45 | 154.09 | 273.47 | 33 | 778 | 32.132 | -110.956 |
| Tanque Verde Guest Ranch | 195.61 | 174.43 | 328.58 | 33 | 829 | 32.246 | -110.683 |
| Sabino Dam | 200.18 | 152.55 | 302.59 | 33 | 847 | 32.315 | -110.811 |
| Santa Cruz River at Continental Rd | 199.61 | 147.73 | 243.46 | 33 | 871 | 31.855 | -110.979 |
| Santa Cruz River at Canoa Ranch | 196.52 | 173.03 | 271.15 | 33 | 917 | 31.745 | -111.037 |
| Saguaro | 199.19 | 169.61 | 309.14 | 21 | 945 | 32.317 | -110.813 |
| Pantano Vail | 201.34 | 148.65 | 104.41 | 32 | 981 | 32.036 | -110.677 |
| Diamond Bell | 198.76 | 148.17 | 249.32 | 33 | 992 | 31.990 | -111.298 |
| Dodge Tank | 200.03 | 171.17 | 343.37 | 33 | 1006 | 32.512 | -110.864 |
| Catalina State Park | 194.73 | 178.18 | 348.69 | 33 | 1009 | 32.526 | -110.795 |
| Elephant Head | 191.88 | 191.82 | 306.42 | 33 | 1058 | 31.727 | -110.969 |
| Davidson Canyon | 191.52 | 210.89 | 360.39 | 33 | 1061 | 31.994 | -110.645 |
| Sasabe | 191.94 | 208.99 | 334.04 | 31 | 1067 | 31.691 | -111.450 |
| Tinaja Ranch | 194.35 | 189.03 | 310.90 | 31 | 1189 | 31.838 | -111.149 |
| Alamo Tank | 196.67 | 167.40 | 345.44 | 33 | 1204 | 32.280 | -110.636 |
| Cherry Spring | 196.94 | 192.16 | 379.87 | 33 | 1231 | 32.518 | -110.837 |
| Italian Trap | 194.03 | 208.11 | 393.66 | 32 | 1244 | 32.285 | -110.564 |
| Ranch Road | 196.67 | 177.29 | 360.22 | 33 | 1311 | 32.310 | -110.607 |
| Empire | 191.28 | 240.36 | 359.13 | 32 | 1417 | 31.781 | -110.635 |
| Oracle Ranger Stn at Canada del Oro | 198.39 | 178.23 | 356.17 | 33 | 1420 | 32.586 | -110.786 |
| Pig Springs | 196.42 | 215.57 | 451.81 | 33 | 1465 | 32.526 | -110.795 |
| Keystone Peak | 189.00 | 219.48 | 328.04 | 33 | 1881 | 31.877 | -111.215 |
| Oracle Ridge | 190.73 | 262.55 | 480.58 | 33 | 1957 | 32.533 | -110.756 |
| White Tail | 188.78 | 402.34 | 772.65 | 32 | 2490 | 32.413 | -110.732 |
| Rincon | 188.11 | 350.55 | 574.48 | 28 | 2512 | 32.206 | -110.548 |
| Mountain Lemmon | 188.30 | 411.99 | 809.18 | 33 | 2786 | 32.443 | -110.789 |
Table 3.
Crest-trough pattern in GAM fit (mgcv, predict() function).
| Year | Month-day | Phase |
| 1994 | 28 Jun | Peak |
| 1999 | 30 Sep | Valley |
| 2004 | 9 Feb | Peak |
| 2008 | 4 May | Valley |
| 2011 | 30 Dec | Peak |
| 2015 | 28 Nov | Valley |
| 2020 | 10 Jul | Peak |
| Period = 8.7 years | ||
Table 4.
Results of linear regression monsoon onset on year, for 33 weather stations in Pima and Pinal Cos., Arizona, sorted by elevation. Positive slopes and significant P-values (<0.05) are highlighted.
Table 4.
Results of linear regression monsoon onset on year, for 33 weather stations in Pima and Pinal Cos., Arizona, sorted by elevation. Positive slopes and significant P-values (<0.05) are highlighted.
| Station Name | Elev. (m) | Intercept | Slope | P-value | R2 |
| Organ Pipe Cactus NM | 512 | 724.9356 | -0.2590 | 0.5658 | 0.0108 |
| Avra Valley Air Park - Santa Cruz Basin | 604 | 1365.7159 | -0.5765 | 0.1370 | 0.0699 |
| Santa Cruz River at Ina Road | 662 | 1260.9811 | -0.5251 | 0.1757 | 0.0583 |
| Sells | 721 | -1402.0401 | 0.7930 | 0.0890 | 0.1378 |
| Alamo Wash below Glenn St | 744 | 1206.7955 | -0.5007 | 0.2027 | 0.0518 |
| Santa Cruz River at Valencia Road | 750 | 1581.5329 | -0.6860 | 0.1000 | 0.0849 |
| Tanque Verde Sabino Bridge | 755 | -486.2538 | 0.3432 | 0.3790 | 0.0251 |
| Tucson Int'l Airport | 778 | 553.7841 | -0.1761 | 0.6536 | 0.0066 |
| Tanque Verde Guest Ranch | 829 | 341.0947 | -0.0725 | 0.8162 | 0.0018 |
| Sabino Dam | 847 | 761.3523 | -0.2797 | 0.3317 | 0.0304 |
| Santa Cruz River at Continental Rd | 871 | -183.8939 | 0.1912 | 0.6811 | 0.0055 |
| Santa Cruz River at Canoa Ranch | 917 | 321.2197 | -0.0622 | 0.8656 | 0.0009 |
| Saguaro | 945 | 0.6035 | 0.0987 | 0.8797 | 0.0012 |
| Pantano Vail | 981 | 1960.0453 | -0.8765 | 0.0263 | 0.1540 |
| Diamond Bell | 992 | 81.4280 | 0.0585 | 0.8275 | 0.0016 |
| Dodge Tank | 1006 | 1707.8826 | -0.7517 | 0.0439 | 0.1246 |
| Catalina State Park | 1009 | 881.9432 | -0.3426 | 0.3283 | 0.0308 |
| Elephant Head | 1058 | 1589.1061 | -0.6965 | 0.0038 | 0.2399 |
| Davidson Canyon | 1061 | 1356.0947 | -0.5805 | 0.0811 | 0.0949 |
| Sasabe | 1067 | 1431.7435 | -0.6177 | 0.0521 | 0.1239 |
| Tinaja Ranch | 1189 | -72.4807 | 0.1330 | 0.6373 | 0.0078 |
| Alamo Tank | 1204 | 1731.3371 | -0.7650 | 0.0441 | 0.1244 |
| Cherry Spring | 1231 | 582.4508 | -0.1922 | 0.5592 | 0.0111 |
| Italian Trap | 1244 | 1590.9192 | -0.6962 | 0.0446 | 0.1277 |
| Ranch Road | 1311 | 1615.3485 | -0.7072 | 0.0346 | 0.1362 |
| Empire | 1417 | 496.2033 | -0.1520 | 0.6082 | 0.0089 |
| Oracle Ranger Stn at Canada del Oro | 1420 | 626.8144 | -0.2136 | 0.5863 | 0.0097 |
| Pig Springs | 1465 | 1050.5833 | -0.4258 | 0.1835 | 0.0563 |
| Keystone Peak | 1881 | 591.2727 | -0.2005 | 0.4065 | 0.0223 |
| Oracle Ridge | 1957 | 1396.8750 | -0.6013 | 0.0437 | 0.1249 |
| White Tail | 2490 | 1264.1146 | -0.5359 | 0.0524 | 0.1197 |
| Rincon | 2512 | 755.9179 | -0.2827 | 0.3621 | 0.0320 |
| Mountain Lemmon | 2786 | 1634.4735 | -0.7209 | 0.0322 | 0.1396 |
Disclaimer/Publisher’s Note: The statements, opinions and data contained in all publications are solely those of the individual author(s) and contributor(s) and not of MDPI and/or the editor(s). MDPI and/or the editor(s) disclaim responsibility for any injury to people or property resulting from any ideas, methods, instructions or products referred to in the content. |
© 2023 by the authors. Licensee MDPI, Basel, Switzerland. This article is an open access article distributed under the terms and conditions of the Creative Commons Attribution (CC BY) license (http://creativecommons.org/licenses/by/4.0/).
Copyright: This open access article is published under a Creative Commons CC BY 4.0 license, which permit the free download, distribution, and reuse, provided that the author and preprint are cited in any reuse.


