Preprint
Article

The Effect of Zinc Oxide on DLP Hybrid Composite Manufacturability and Mechanical-Chemical Resistance

Altmetrics

Downloads

117

Views

36

Comments

0

A peer-reviewed article of this preprint also exists.

Submitted:

07 November 2023

Posted:

08 November 2023

You are already at the latest version

Alerts
Abstract
The widespread use of epoxy resin (ER) in industry, owing to its excellent properties, aligns with the global shift toward greener resources and energy-efficient solutions, where utilizing metal oxides in 3D printed polymer parts can offer extended functionalities across various industries. ZnO concentrations in polyurethane acrylate composites impacted adhesion and thickness of DLP samples, with 1 wt.% achieving a thickness of 3.99±0.16 mm, closest to the target thickness of 4 mm, while 0.5 wt.% ZnO samples exhibited the lowest deviation in average thickness (±0.03 mm). Tensile strength in digital light processed (DLP) composites with ZnO remained consistent, ranging from 23.29 MPa (1 wt.%) to 25.93 MPa (0.5 wt.%), with an increase in ZnO concentration causing a reduction in tensile strength to 24.04 MPa and a decrease in the elastic modulus to 2001 MPa at 2 wt.% ZnO. The produced DLP samples, with their good corrosion resistance in alkaline environments, are well-suited for applications as protective coatings on tank walls. Customized DLP techniques can enable their effective use as structural or functional elements, such as in Portland cement concrete walls, floors and ceilings for enhanced durability and performance.
Keywords: 
Subject: Engineering  -   Industrial and Manufacturing Engineering

1. Introduction

Industry widely use epoxy resin (ER) in various production processes due to its high adhesion and ability to fill the entire body space free of air (hollow) bubbles or other types of service affecting defects [1]. Properly produced ER also exhibits excellent electrical [2] and thermal [3] insulating properties. The ER matrix characterizes by the rigid long-chain molecular structure with high thermal stability and mechanical strength [4]. Policy makers, industry and society cause new regulations and demand for hazardous chemicals and high energy consuming manufacturing replacement with greener resources and energy saving solutions [5]. The new and cost-effective ways on how to use manufacturing wastes and recycled materials in new composites is one of the European Union Green Deal and world’s general objectives toward zero emission industries.
Additive manufacturing, commonly known as 3D printing, offers a versatile range of material options. These include well-established materials like Ti-6Al-4V [6], actively researched high entropy alloys [7], and even non-metallic materials such as dense graphite [8]. The utilization of metal oxides in 3D printed polymer parts offers new products with extended functionalities in civil engineering, automotive, maritime, electronics, and many other industries [9,10,11]. Table 1 provides a comprehensive summary of essential data for composite materials used in 3D printing, featuring metal oxides (ZnO, SiO2, and TO2) in conjunction with polymers by using intense pulsed light (IPL), digital light processing (DLP), fused deposition modeling (FDM), fused filament fabrication (FFF), and stereolithography (SLA). It encompasses information on dielectric properties, mechanical strengths, and various parameters for the resulting products.
The combination of ER monomers with prepolymers [21] and photosensitive additives allows rapid liquid photocuring into solid product [22]. SLA and DLP are techniques for building 3D parts of complex shapes with the help of precisely directed and pointed ultraviolet (UV) light or laser beam [22,23] at specific wavelengths [24]. UV cured coatings and printable materials recently have attracted research and industry interest. In adapted working conditions such materials are environmentally safe and curing process requires lower energy consumption, as compared to thermally cured ER analogs [25]. These materials are also known for their low emissions of volatile organic compounds [26]. Ship builders and repairers use UV curable coatings for metal compartments protection against corrosion, chemical damage, and mechanical degradation due to sufficient hardness and flexibility in combination with excellent adhesion to properly grinded surface [27]. Although polyurethane acrylate (PUA) oligomers offer advantages such as high solubility, low melting viscosity, and a three-dimensional structure, UV-cured thin film products based on them tend to demonstrate subpar barrier properties against gases and chemically aggressive liquids, including strong acids, strong bases, and organic solvents. Additionally, they exhibit relatively weak mechanical properties [28,29].
Biomedicine related researchers and manufacturers have applied polyurethanes for decades. Polyurethanes derived products exhibit biocompatibility and biodegradability required for production of medical devices, artificial organs, and scaffolds [30].
PUA is petrochemical product [31] defined as photocurable crosslinking ER. The introduction of double-bonding of acrylates into the molecular chain terminal of polyurethane allows double-crosslinking oligomers reaction with the help of photo initiator [32].
Relatively soft UV-cured ER surfaces exhibit low scratch resistance [33,34]. One of the solutions is to increase the polymer matrix hardness. The incorporation of harder additives (e.g., ZnO with typical Vickers hardness from 2 to 4 GPa) [35] into PUA (with hardness from 0.12 to 0.227 GPa) [36] matrix is the simplest approach. It should be noted that Vickers hardness tests are commonly used for ceramics to assess their resistance to indentation, while Shore hardness tests are preferred for polymers to measure their flexibility and elasticity. Comparing the hardness of polymers and ceramics is complicated due to their inherent differences in material properties; polymers are typically more compliant and deformable, while ceramics are significantly more rigid and brittle, making direct comparisons challenging as hardness values are influenced by the materials’ distinct responses to applied stress and deformation.
Despite the historically performed tuning of polyurethane mechanical properties with different nanoparticles, such as nano clay [37], carbon nanotubes [38], metal oxide, hydroxyapatite, and graphene (including its derivatives) [39,40], the market offers limited number of solid fillers adopted for SLA and DLP needs. Industry commonly used rigid inorganic fillers (e.g., kaolin and silica). The significant increase in surface roughness poses an increased risk of higher sliding and erosive wear rates when relatively large-sized fillers are used at excessively high concentrations [41].
For example, the addition of 10 wt.% basalt scales to polyester resin reduces wear rates by a factor of two. The relationship between mechanical and wear properties is not straightforward, and composites with 50 wt.% basalt powders and polyester resin exhibit the highest wear resistance, reducing wear rates by 4.8 times. Improved bonding between phases or the use of a polyimide matrix is expected to enhance the wear resistance of basalt-polymer composites [42].
In another study, the tribological effects of incorporating aramid, carbon, glass, and basalt fibers into polyimide and polytetrafluoroethylene polymers were examined. Key findings include the influence of fiber additives and MoS2 lubrication on tribological characteristics, the complex relationship between coefficient of friction and wear rate, and the protective effects of transfer films and mechanically mixed layers in reducing wear rates. Particularly, a low content of basalt fibers (0.5 wt.%) exhibited notable wear resistance in various test conditions [43].
The use of ceramic micro and nanoparticles as fillers in monomers allow reducing shrinkage and warping errors in SLA and DLP products [44,45]. However, several SLA and DLP limitations associate with low printing speed, comparatively expensive process, and a relatively limited range of fillers [46].
DLP polymers with inorganic fillers have garnered researchers’ attention due to their improved thermal stability [47], enhanced mechanical strength, reduced vapor permeability [48], and improved optical and electrical properties [49].
Zinc oxide (ZnO) is one of the n-type metal oxides [50] which exhibits excellent radiation resistance, electrical and optical (e.g., absorption at local UV spectrum ranges from around 350 to 362 nm) [51] properties in combination with thermal and chemical stabilities. Industry applies ZnO in production of gas [52] and humidity sensors [53], catalysts [54], and anti-bacterial materials [55]. Different methods are used for industrial production of ZnO with high variety in shape, morphology, and grain sizes [56].
Dispersion of ZnO in PUA oligomers require high energy. Industry and researchers mostly apply in-situ polymerization [57] or blending [58] processes for manufacturing polyurethane-ZnO composites. Manufacturers currently produce liquid PUA oligomers with blended rigid particles. Several researchers have reported the ZnO mechanical stirring and ultrasonic mixing mostly at room temperature. Different approaches have resulted in different required mixing durations and stability of homogeneous dispersions [59,60,61,62]. Unfortunately, the poor compatibility and interfacial interaction between the ZnO particles and liquid PUA oligomers promotes the aggregation and sedimentation of ZnO particles [63].
Conventionally produced PUA exhibits similar corrosion rates in aqueous acidic (5% HCl) and alkaline (5% NaOH) solutions [64]. However, much less corrosion research data is available on additive manufactured PUA products.
The present article reports the trial research results and discussion on possible DLP PUA mechanical properties and chemical durability enhancement with the help of ZnO at maximum applied concentrations. The test results will be useful for successful 3D parts printing made of polymer based-hybrid composites with extended functionality and better mechanical performance.

2. Materials and Methods

2.1. Applied Materials

The producer is not disclosing the exact composition of the ER Anycubic 3D Printing UV Sensitive Resin, Basic, Clear (Anycubic, People’s Republic of China) for some commercial reasons. The available materials safety data sheet for this product indicates the approximate concentrations of polyurethane acrylate (30-60 wt.%, CAS No 82116-59-4, epoxy with solvents); isooctyl acrylate (10-40 wt.%, CAS No 29590-42-9, monomer) and photo initiator (phosphine oxide, 2-5 wt.%). According to the information on producer’s webpage, the liquid form of the ER exhibits density of 1.1 g·cm-3, and viscosity of 552 mPa·s. The photo-cured (at the wavelength of 405±8 nm) [65] translucent ER exhibits solid density of 1.284 g·cm-3, yield tensile strength up to 23.4 MPa, and elongation up to 14.2% [66].
As-received 99.9 wt.% pure nanometer particles containing zinc oxide (ZnO) powder with particle sizes up to 5 µm (Sigma Aldrich, product No 205532, CAS No 1314-13-2) was used as the filler for production of reinforced photo-cured ER samples [67].

2.2. Methods for Samples Manufacturing

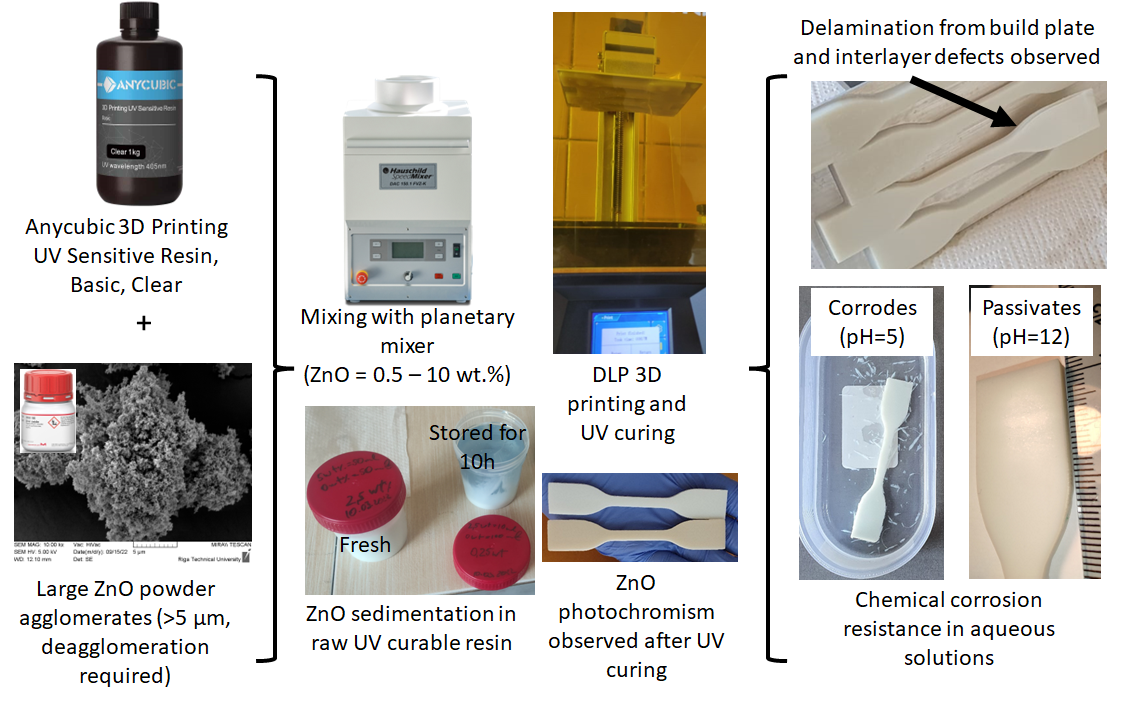
The planetary mixer Hauschild Speed Mixer DAC 150.1 FVZ-K (Hamm, Germany) with rotational speed of 1150 rpm was set for 5 minutes to mix each selected composition with the total weight of 140 g (measured by the laboratory scales KERN EMB-S). The resulting suspension was transported to the printing laboratory and used for DLP within 1 hour after mixing. A 3D printer operator made several trial DLP at different ZnO concentrations to find a reliable printable mixture. Finally, an operator decided to produce suspensions with ZnO concentrations of 0.5, 1, 1.5 and 2 wt.%. Additionally, reference samples were printed without additives and subsequently subjected to tensile tests to determine only tensile strength at fracture.
The 3D model for the test specimen was drawn with the help of the AutoCad software according to the specification for the Type IV described in the standard ASTM D638-14 [68]. The obtained computer aided design (CAD) was virtually sliced with the help of the Photon Workshop V2 1.23 RC8 software, as demonstrated in Table 2.
Settings were chosen for the selected DLP type 3D printer Anycubic Photon Mono (405 nm wavelength, resolution of 1620x2560 pixels and pixel size of 51 µm) with detailed specifications demonstrated on the manufacturer webpage [69]. The bottom exposure time of 60 s provided the build plate-resin and initial resin-resin layers adhesion at the beginning of each 3D printing process. The 3D printer was inserted in the insulated box to reduce temperature fluctuation and to stabilize it at +20 °C.
Produced specimens were removed from the build plate, prewashed in isopropanol (99,8%) and immersed in 5 liters of isopropanol container and washed with the help of the Anycubic Wash&Cure Machine 2.0 for 10 minutes. The obtained specimens were additionally cured with UV light (405 nm wavelength, 40 W power) for 10 minutes inside the same device set in the cure mode. The ZnO containing specimens exhibited the photochromism effect under the applied intensive UV radiation [70].

2.3. Methods for Visual and Mechanical Characterization of Materials and Samples

The granulometric composition of the ZnO powder was measured with the help of the laser analyzer Fritsch Analysette 22 (FRITSCH GmbH, Germany). Surfaces of produced and tested samples were observed with the help of digital microscope Keyence VHX-2000 and scanning electron microscope (SEM) TESCAN VEGA (high vacuum mode was selected) and OLYMPUS SZX10 (Olympus Corporation, Japan). Tensile tests of manufactured specimens were performed with the help of tensile testing machine Zwick/Roell Z150 (ZwickRoell GmbH & Co. KG). The applied loading speed was 5 mm·min-1. The reference specimens (0 wt.%), fixed in the Zwick/Roell Z020 (ZwickRoell GmbH & Co. KG) tensile testing machine, were subjected to the same loading parameters. Dimensions of specimens were measured with the help of the micrometer screw gauge (±0.005 mm).

2.4. Chemical Corrosion Tests

Two different laboratory-scaled chemical corrosion tests were performed to simulate the effect of typical chemically active liquid substances stored in tanker tanks. Produced specimens were immersed in aqueous acetic acid (10%, pH=5) solution and 1M NaOH (pH=12) solution to estimate the specimen’s resistance to acidic and alkaline media, respectively. The universal indicator was used for the measurement of solutions pH. An operator sealed all boxes and left each corrosion test for 7 days at room temperature. Afterward, the samples were extracted from their containers, dried at a constant temperature of 30°C for one hour until they reached a stable mass, and subsequently subjected to measurement. The loss of mass was measured with the help of the scales KERN EMB-S (KERN & SOHN GmbH) before and after the immersion test.

3. Results

3.1. Visual and Mechanical Properties of Materials and Samples

3.1.1. ZnO Powder Granulometric Analysis Result

The simplified result of granulometric analysis shows that the median particle size (D50) in tested ZnO powder is about 177 nm, as demonstrated in Figure 1. The similar particle size distributions (D50=117 nm) result has been represented by Meng, F.; et.al. for the same ZnO powder product [71].
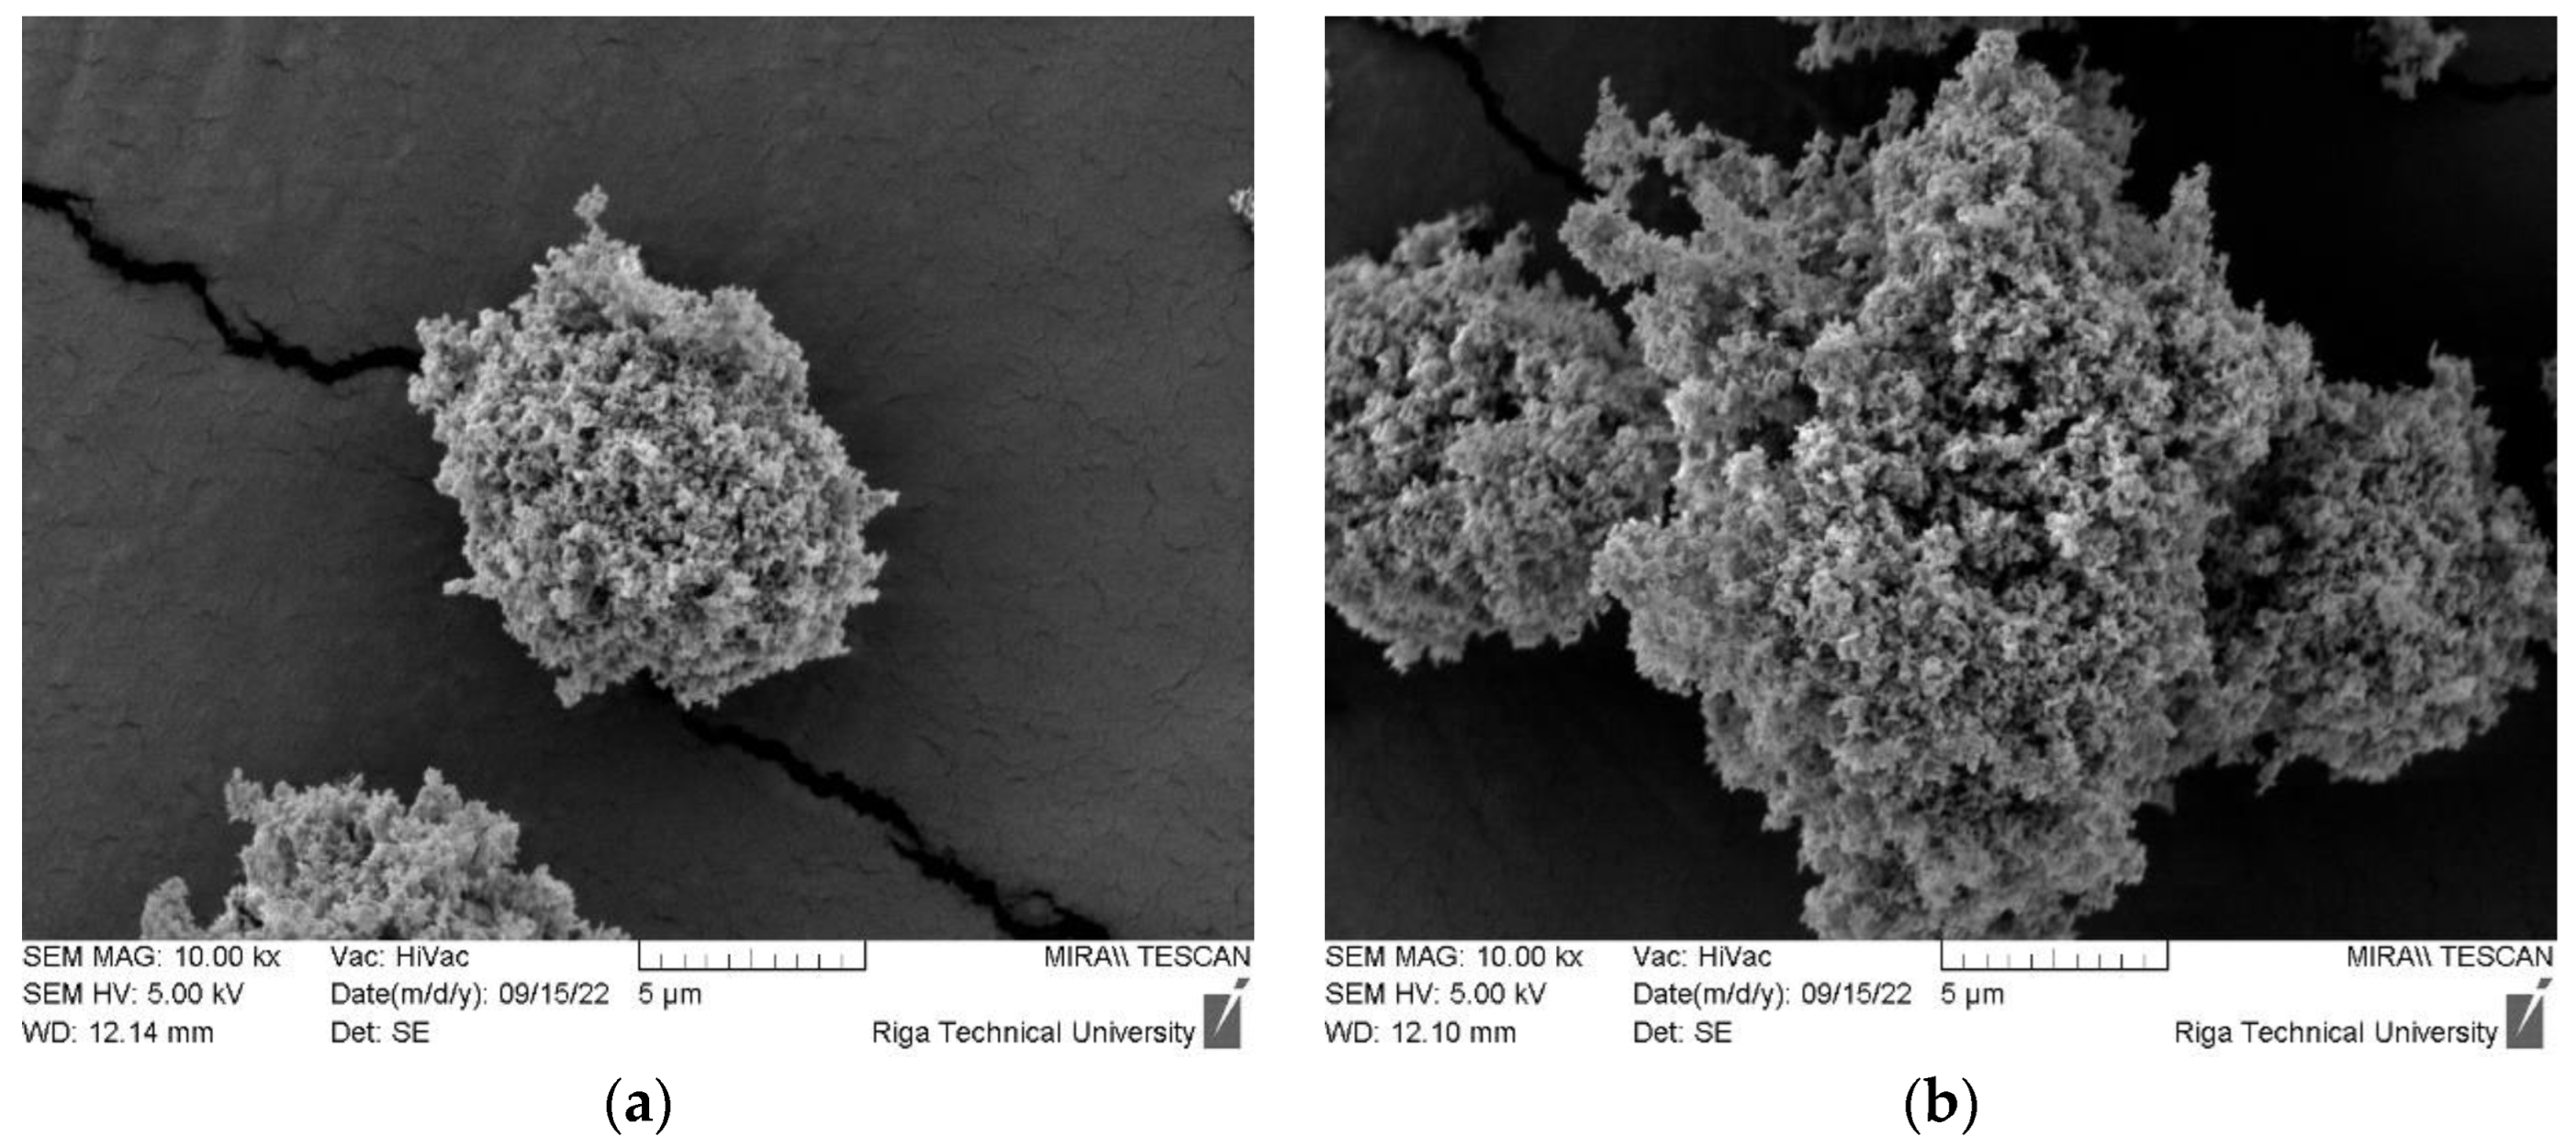
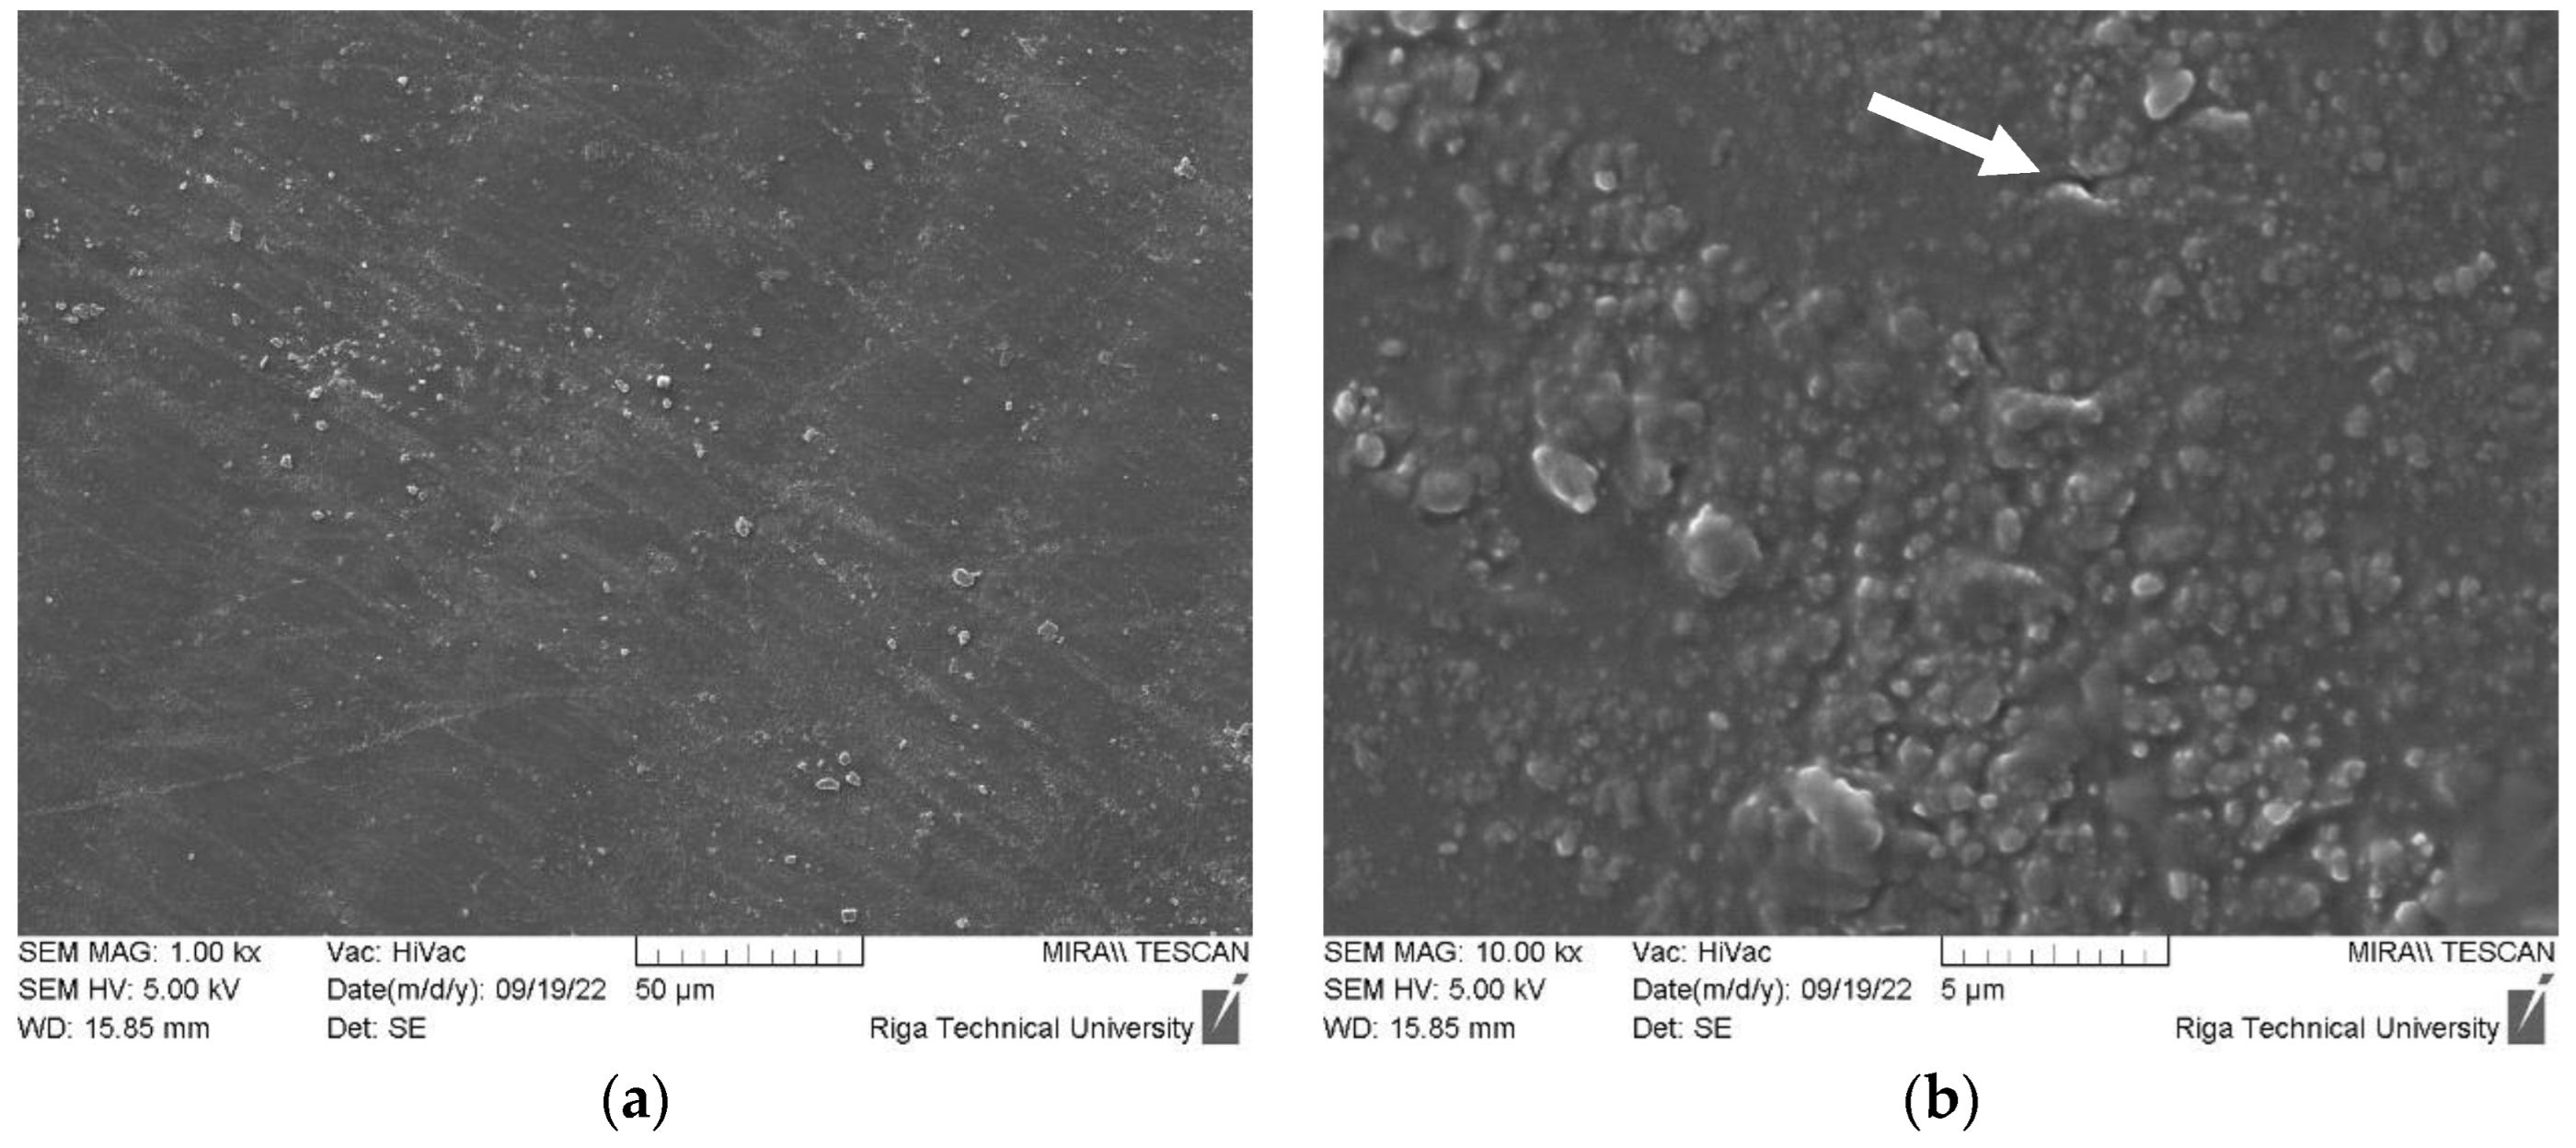
Nevertheless, many particles and their agglomerates with particle sizes above 5000 nm (5 µm) were detected by SEM, as demonstrated in Figure 2a,b. ZnO powder manufacturers recommend employing various deagglomeration methods to achieve target particle sizes for additive manufacturing. These methods, including ultrasonic dispersion, mechanical stirring, or high-shear mixing, can effectively break down agglomerates and ensure the uniform dispersion of particles, ultimately enhancing the quality of the 3D printing feedstock.

3.1.2. Visual Characteristics and Tensile Strength of Manufactured Samples

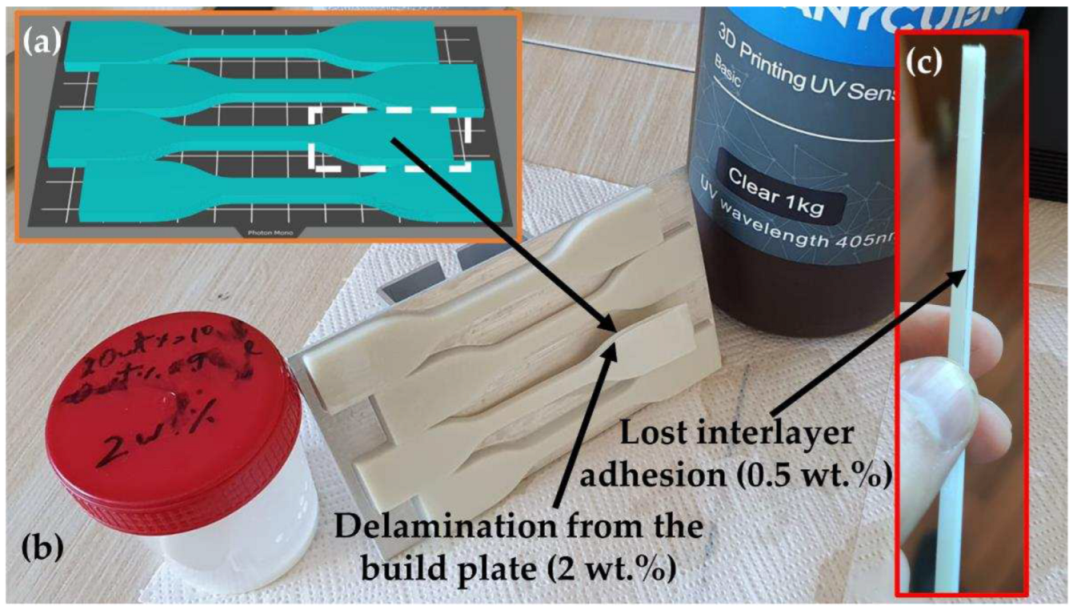
Some of DLP samples sometimes exhibited various defects like partial delamination from the same area on the build plate, as shown in the Figure 3a,b. The origin of this event can be attributed to the slightly lower cured ER adhesion force due to the insufficient surface roughness on the working area of the build plate. Hence, in specific regions, where the adhesion force between the sample and the transparent film surpasses the adhesion between the build plate and the cured sample, or between cured layers, it can significantly impact the overall quality of the DLP specimen. In rare cases, interlayer adhesion problems were observed during first DLP trials with selected target concentrations. An operator reduced the effect by intensive premixing the suspension before pouring in the resin vat. Only best quality DLP samples were taken for further testing.
The sufficiently low ZnO aggregation and sedimentation process in the liquid ER provided good quality solid particle distribution in 3D printed objects. However, the largest objects (or thinnest layers) would require longest duration which may lead to significantly heterogenous cured polymer structure. The use of silane agents could potentially improve the maintenance of high Zn nanoparticle dispersion in the DLP polymer matrix [72,73].
The measurements of thickness and width at the center for each specimen are presented in Table 3. An increase in the concentration of ZnO beyond 0.5 wt.% results in a significant escalation in thickness deviation, ranging from 4.3 times (at 2 wt.%) to a substantial 11.3-fold increase (at 1.5 wt.%). However, the 3D printing of specimens from ER with 1 wt% ZnO leads to thickness values that are closest to the target values, as compared to other specimens. The average values of all specimens show negative deviation from target thickness value (4 mm). Therefore, possible increase in target thickness (or total height along Z axis) should be considered in CAD design to reach closer desired values.
The mean center width values across all samples exhibit a range from 5.93 mm (0 wt.%) to 6.49 mm (1 wt.%). An increase in ZnO concentration above 0.5 wt.% results in a proportional rise in the average deviation in center width, ranging from 1.5 times (1 wt.%) to 5.5 times (2 wt.%). The average values of all ZnO reinforced specimens show positive deviation from target width at the center value (6 mm). Hence, it is advisable to contemplate a potential reduction in the target center width value or a shorter exposure time during CAD design and DLP printing processes. This approach can bring the final 3D printed object closer to the desired specifications, eliminating the need for additional post-printing material removal.
Fluctuations in sizes and printed parts warping (see Figure 3b) are important errors typically caused by the shrinkage of acrylate-based ERs [74]. Updated recommendations and instructions should be formulated in accordance with research findings and practical experience across various manufacturing conditions. The polymer bond formation between polymerizing material and slightly denser photocured solid polymer and cooling after exothermic chemical reaction caused thermal expansion are two main factors causing the DLP product shrinkage. The remaining internal stress promotes the warping effect in combination with adhesion forces to the transparent film during every retraction process [75]. Reduction in errors and improved mechanical properties can be achieved by careful post processing by heating and photocuring of DLP parts [76].
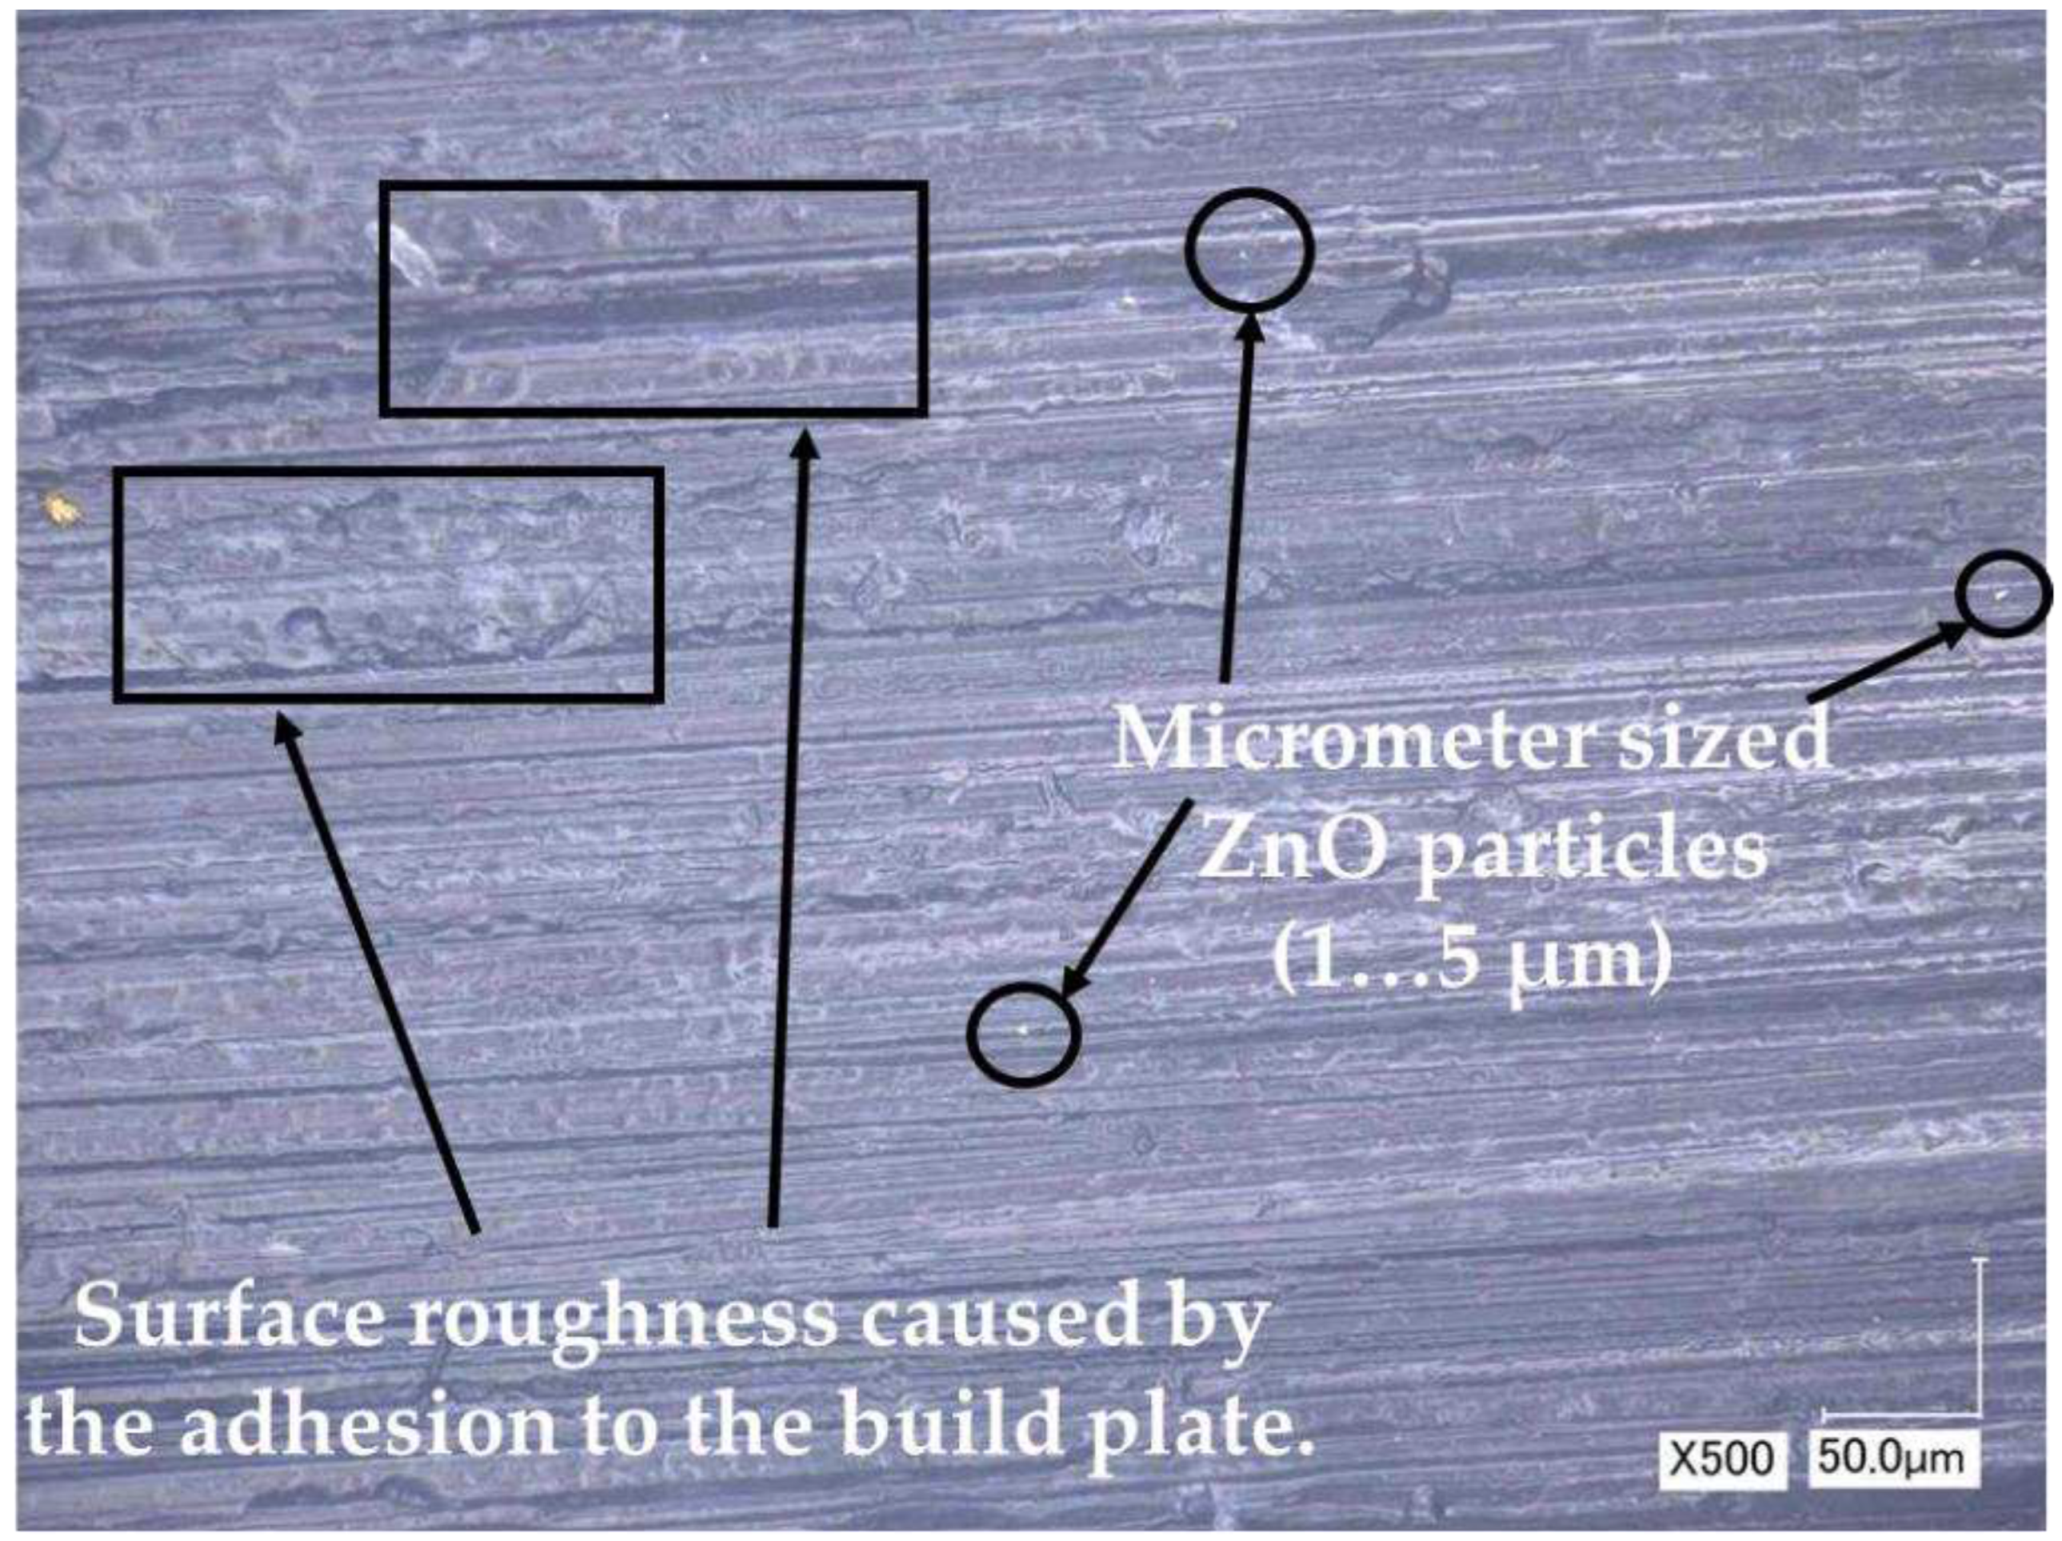
The build plate side of each sample displays the replication of visually observable stripes and defects, as illustrated in Figure 4. These defects are attributed to the presence of several ZnO particles with sizes ranging from 1000 to 5000 nm (from 1 to 5 µm), exhibiting a homogeneous distribution.
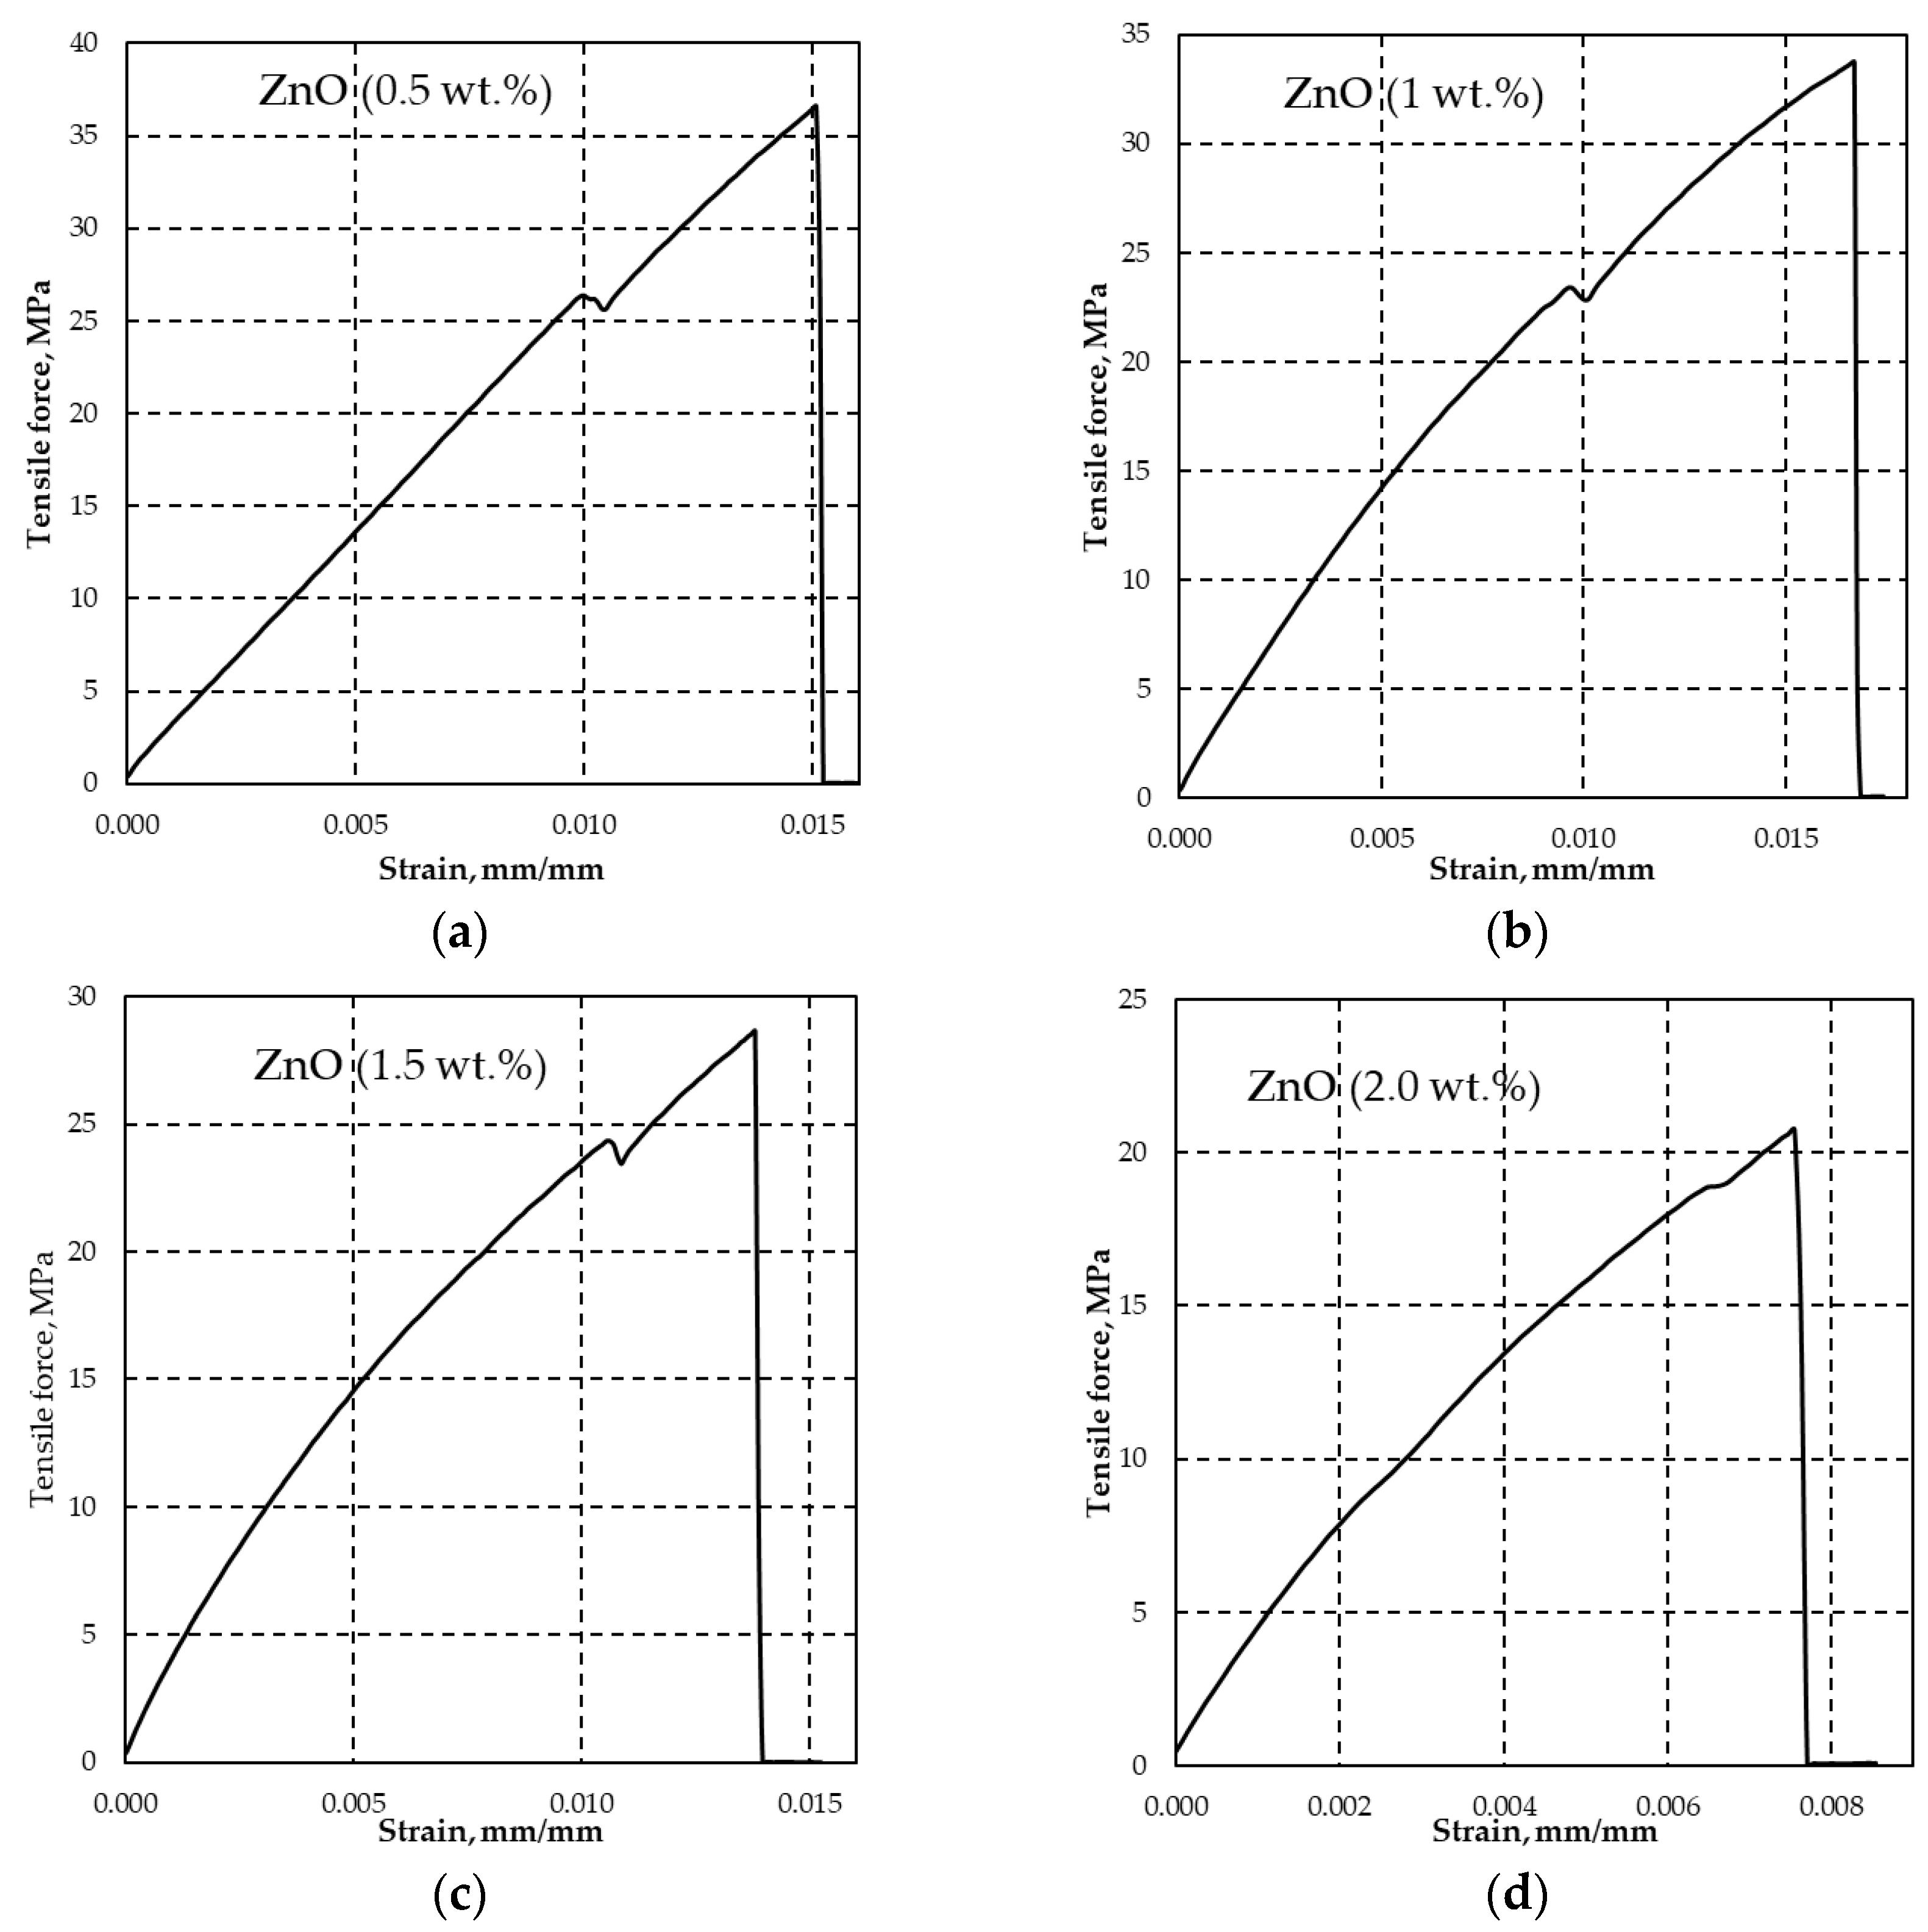
All DLP composites tested with varying ZnO concentrations exhibit comparable tensile strength at yield, ranging from 23.29 MPa (1 wt.%) to 25.93 MPa (0.5 wt.%), with corresponding elongation/deformation values within the range of 0.0089 to 0.011 mm·mm-1, as outlined in Table 4. In contrast, the results of reference samples only provide information on tensile strength at fracture. Notably, it is observed that with higher ZnO concentrations, there is a decrease in tensile strength at fracture. The tensile test measurement curves unequivocally illustrate the increased brittleness of the DLP composite as ZnO concentration is raised, as visually depicted in Figure 5.
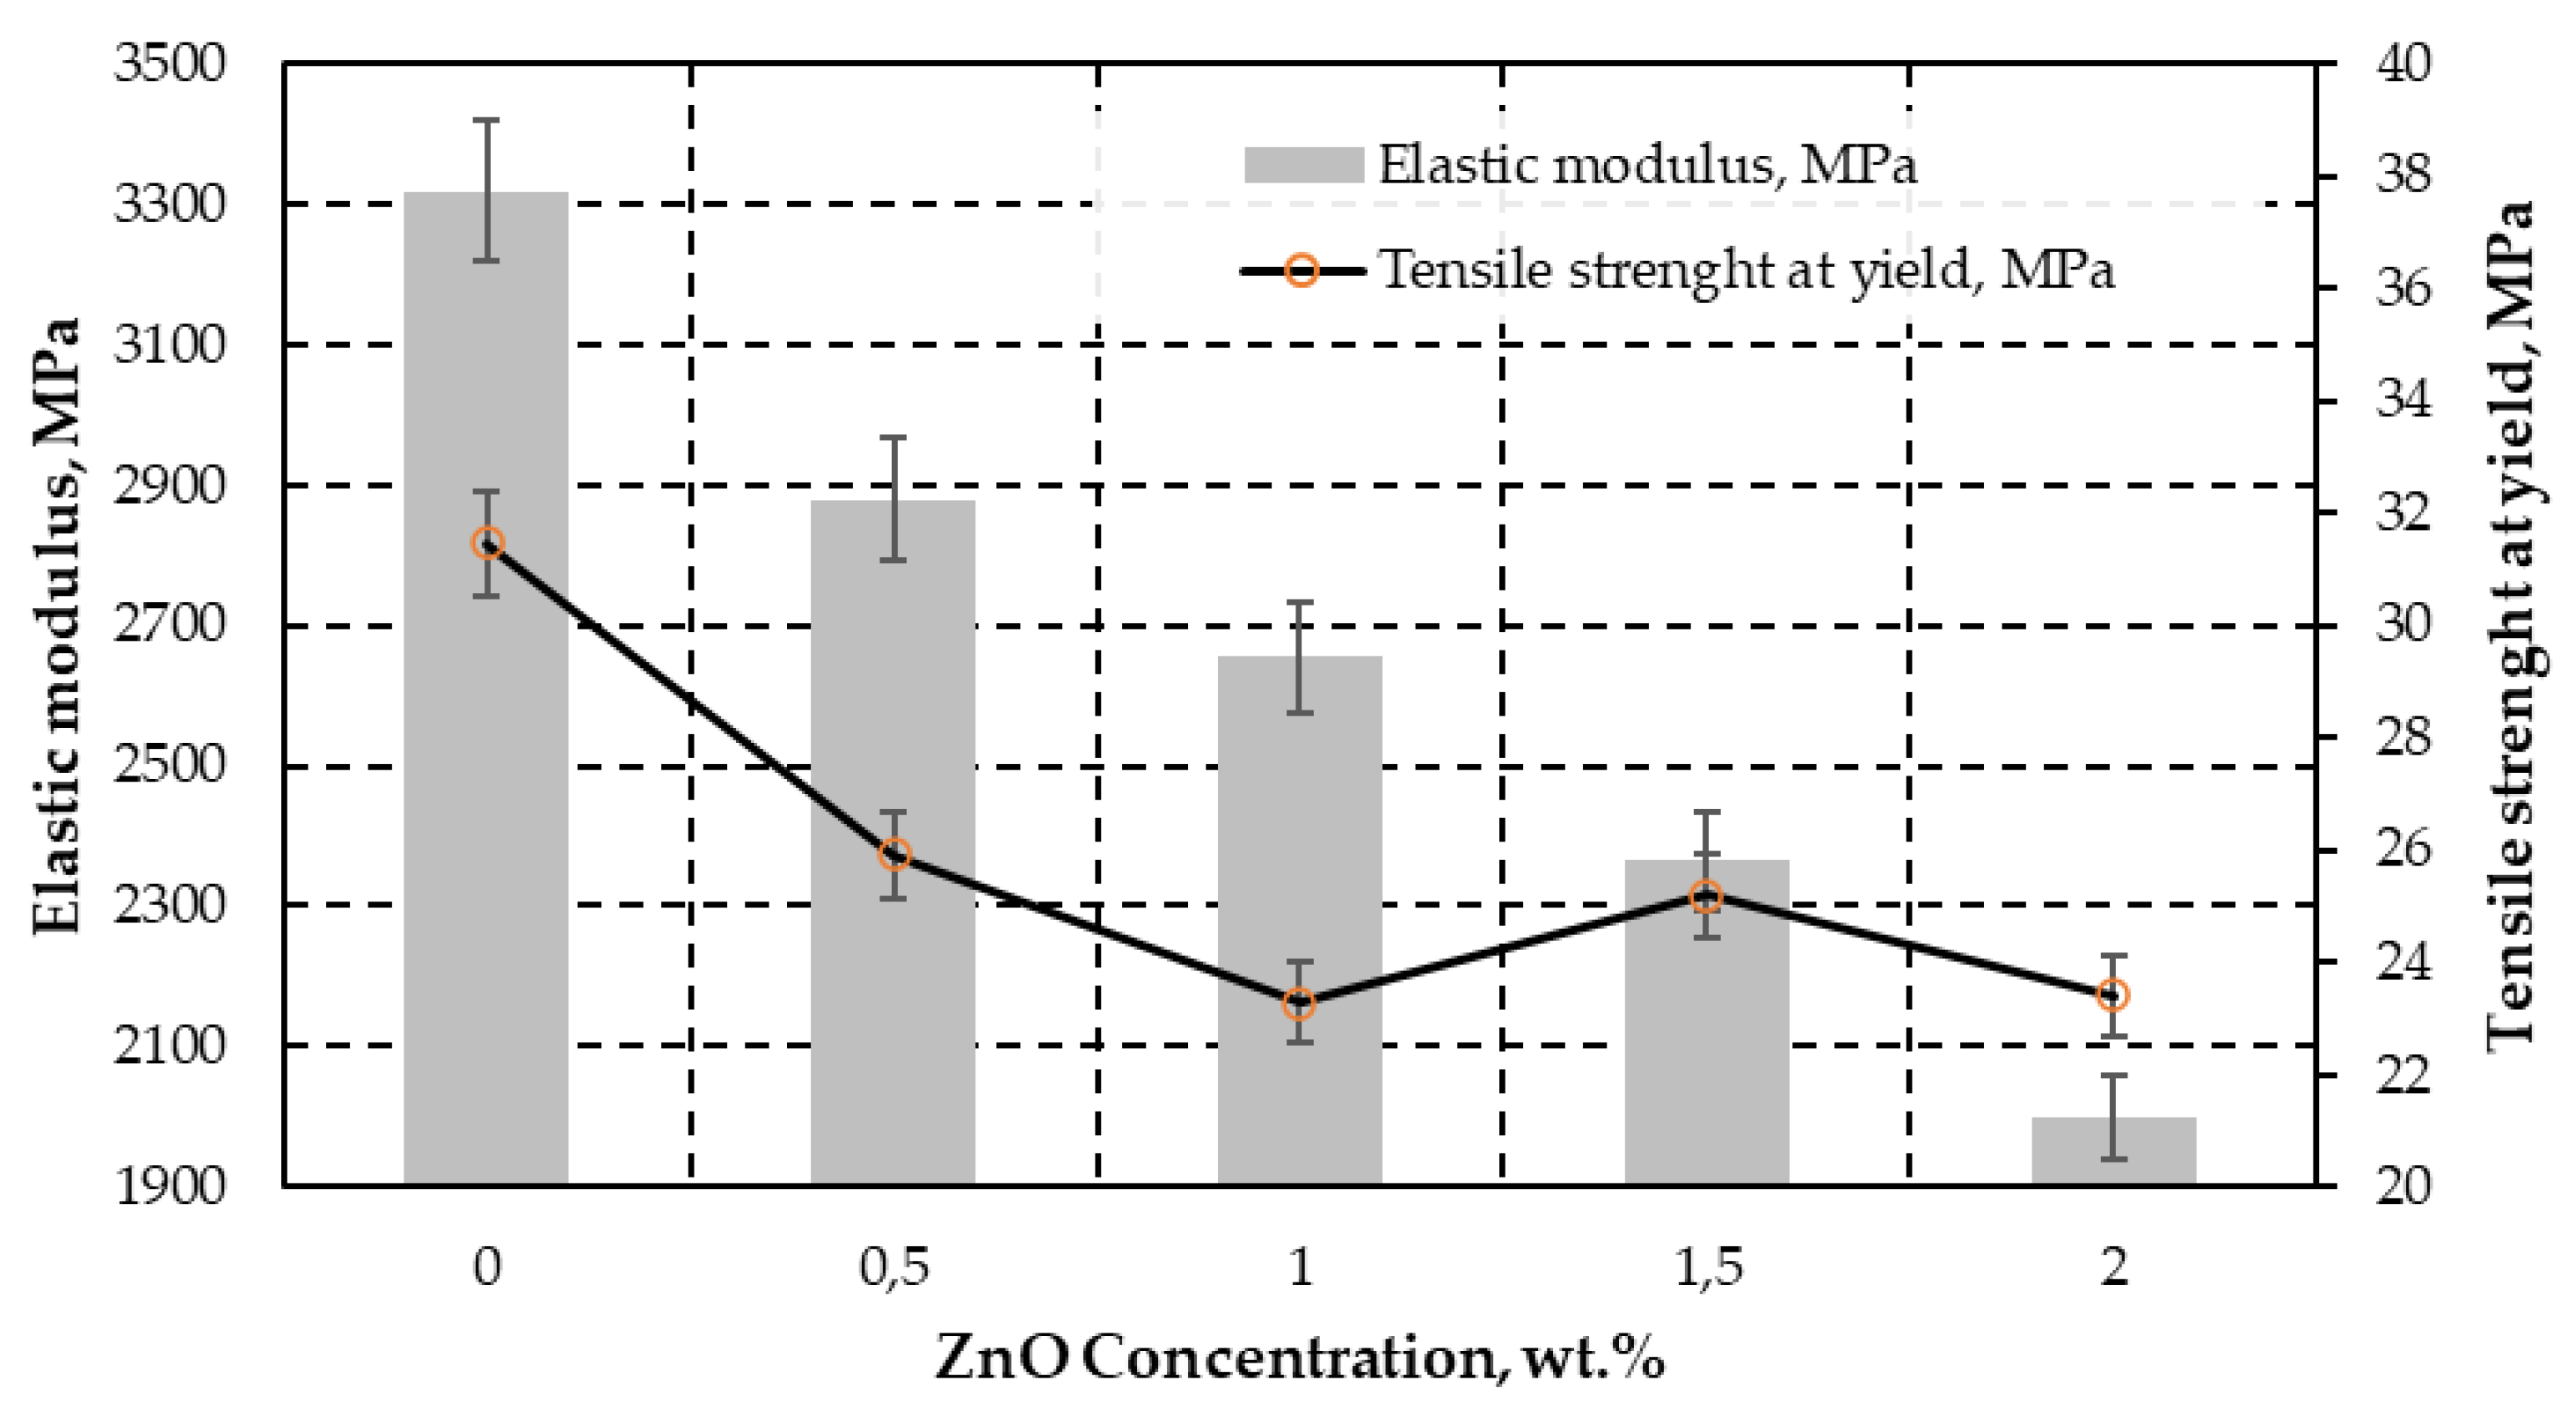
Also, the higher is ZnO concentration the lower is the elastic modulus, as shown in Figure 6. This value experiences a reduction of approximately 1.4 times at 0.5 wt.% (reaching 2880 MPa) and 2 wt.% (decreasing to 2001 MPa).
The shape, size, dispersion, and interfacial interaction between ZnO filler and DLP polymer matrix influence the mechanical properties of the product [48,72,73]. The 1 wt.% of tetrapod shaped ZnO whiskers provide similar tensile strength at break (36 MPa) in thin film PUA matrix [56], as compared to present test result (35.4 MPa). The needle shaped ZnO structure would be interesting alternative due to potential DLP matrix reinforcement in case of avoiding the agglomeration and sedimentation without significant impact on surface roughness [41].

3.1.3. DLP ZnO Composites Corrosion Resistance in Acetic Acid Solution (pH=5)

The ZnO reacts with acetic acid and generates zinc acetate salts according to chemical equation (1):
2CH3COOH + ZnO = Zn(CH3COO)2 + H2O
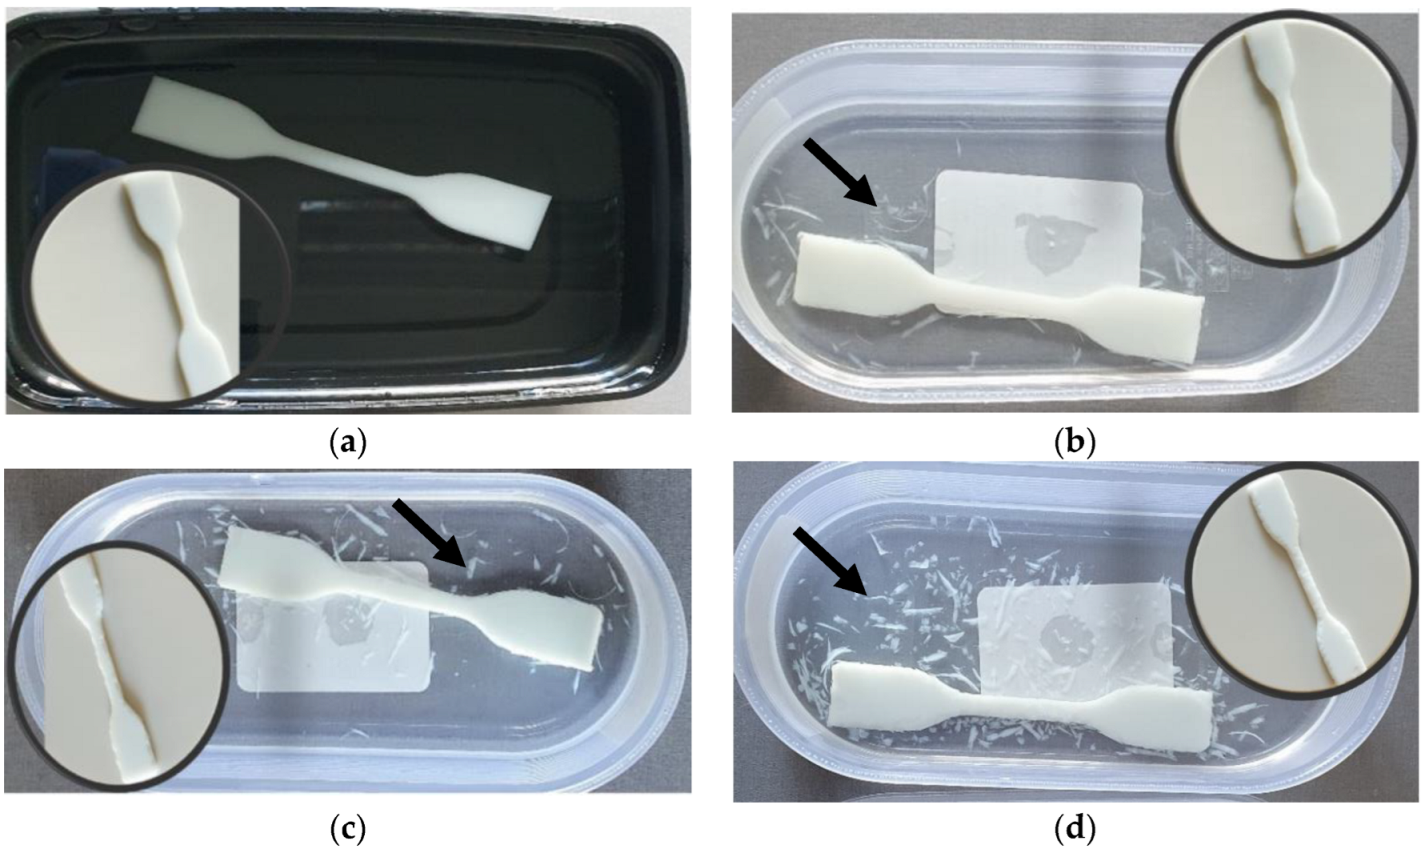
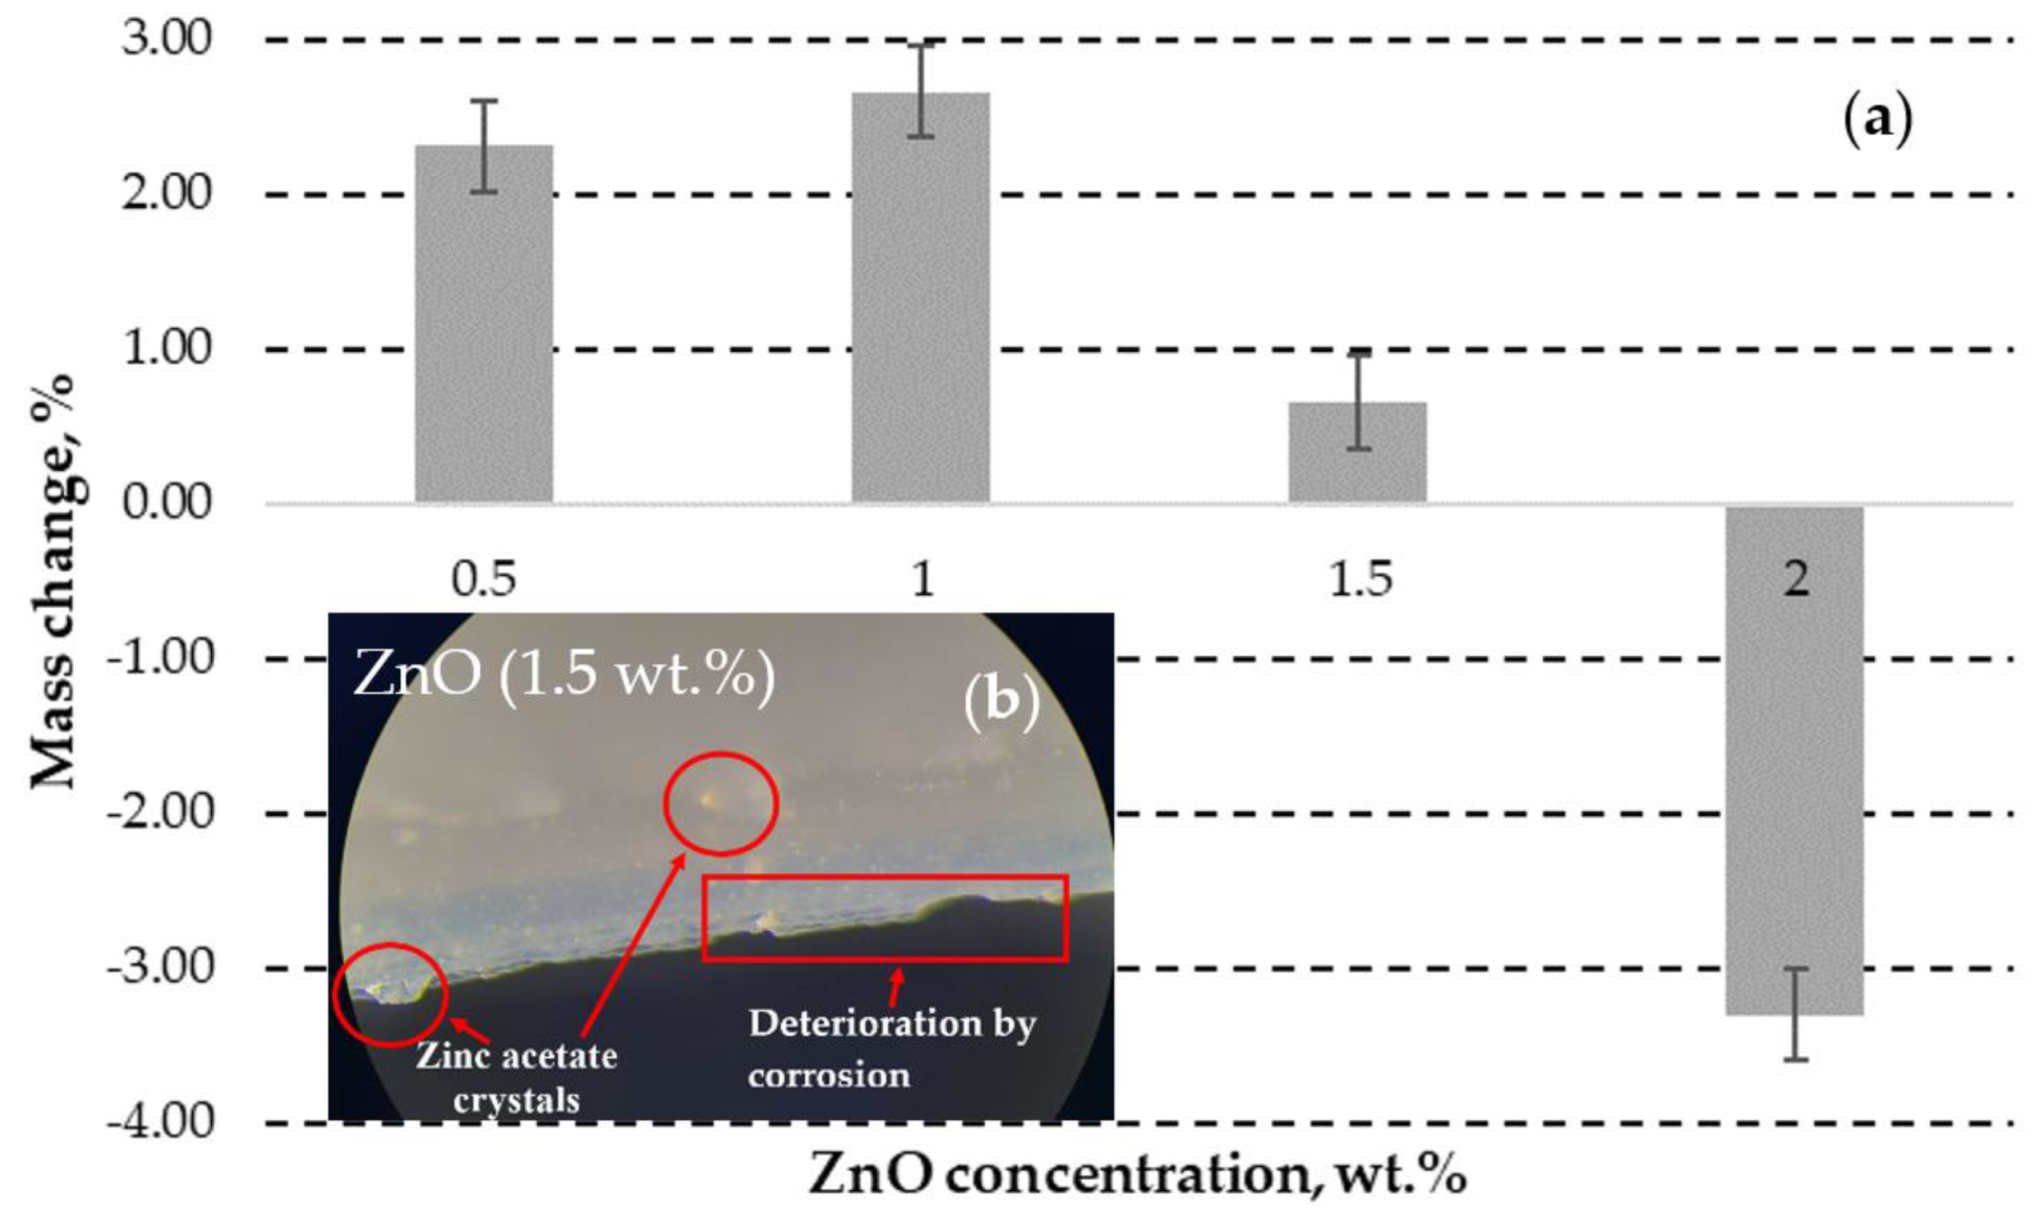
The zinc acetate generated crystal hydrates of Zn(CH3COO)2(H2O)2 in the presence of water [77]. The samples with lowest ZnO concentration (0.5 wt.%) exhibited almost no visually observable deterioration signs after immersion in acetic acid, as shown in Figure 7a. The increase in the weight by 2.31% (see Figure 8a) indicates the embedment of almost all generated corrosion products (zinc acetic crystals) in the pores of plastic composites with 0.5 wt.% ZnO. The corrosion of samples with 1, 1.5 and 2 wt.% ZnO leads to detachment of deteriorated plastic particles from the surfaces of exposed materials, as demonstrated in Figure 7b–d, Figure 8b and Figure 9a,b.
The deterioration of 1 and 1.5 wt.% ZnO containing composites also leads to increase in weight of samples (see Figure 8), swelling reaction products increases the surface roughness and cause the formation of new pores on the surface of DLP products, as demonstrated in Figure 9b. Swelling by reaction products occurs when chemical reactions within a material lead to the formation of new compounds with larger molecular structures, causing the material to expand or increase in volume. Therefore, corrosive solution can access more ZnO particles under the corroded surface. This effect indicates the exposure of higher ZnO particles to reactive environment and embedment in the corroded surface pores. Despite the solubility of 43 g·100 mlwater-1 [78], the zinc acetate preservation occurred due to specimen immersion in the standing aqueous solution. Therefore, corrosion products significantly limited the penetration of the corrosive substance to fresh ZnO sites inside the DLP composites. Additionally, the free water can remain mechanically trapped in the porous structure of the deteriorated DLP composites after removing the samples from aqueous solutions and drying.
However, the operator found the significant loss in weight in case of 2 wt.% ZnO containing sample, as demonstrated in caused by the intensive detachment of deteriorated material, as demonstrated in Figure 7d.

3.1.4. DLP ZnO Composites Corrosion Resistance in Sodium Hydroxide Solution (pH=12)

The ZnO reacts with aqueous sodium hydroxide solution and generates sodium tetrahydroxozincate according to chemical equation (2):
2NaOH + ZnO+H2O = Na2[Zn(OH)4]
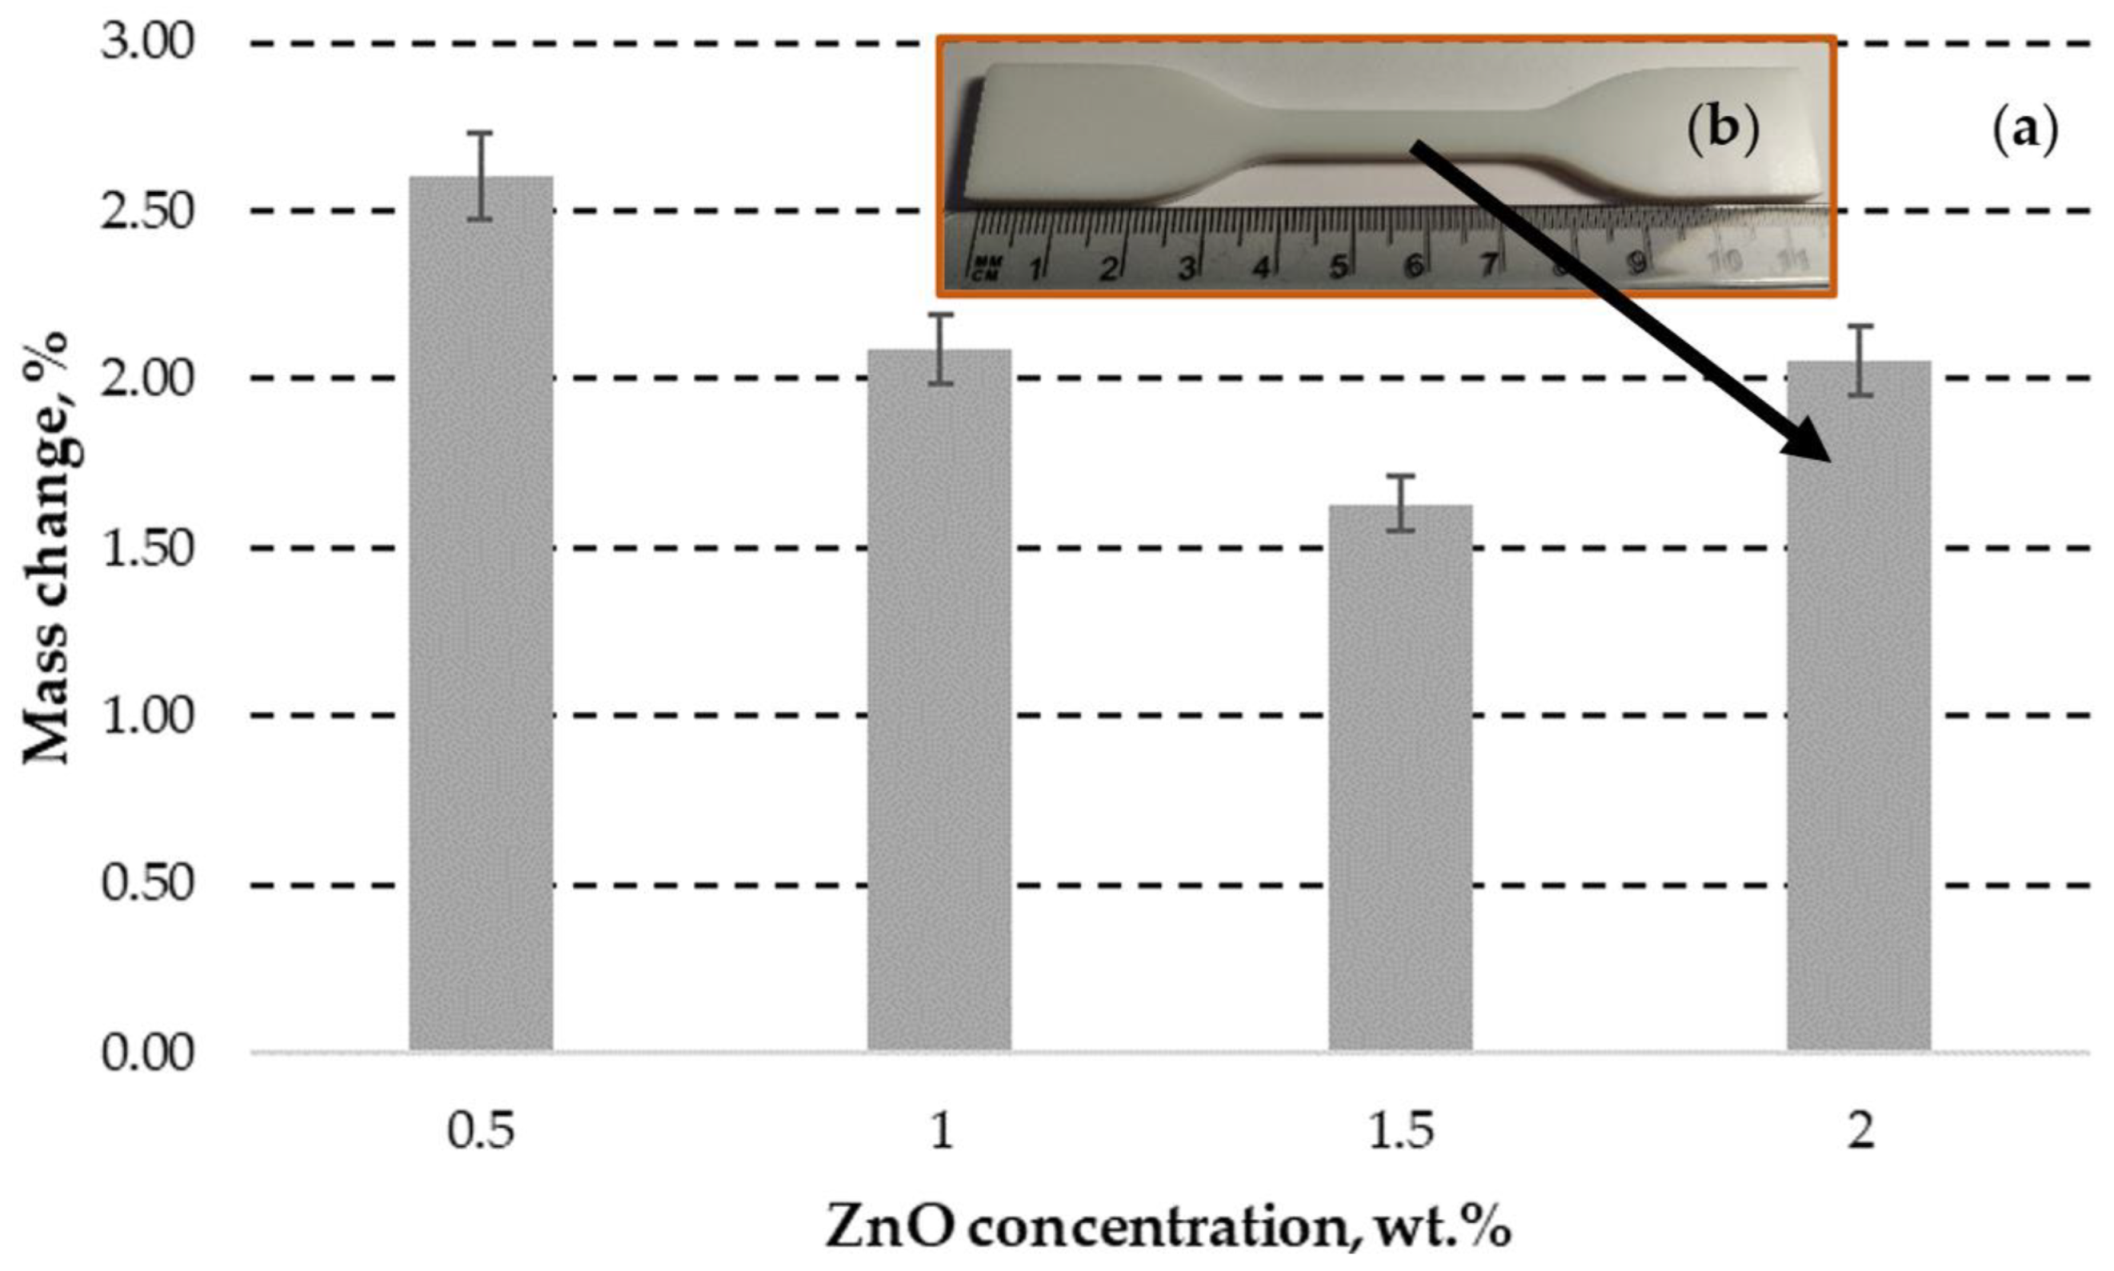
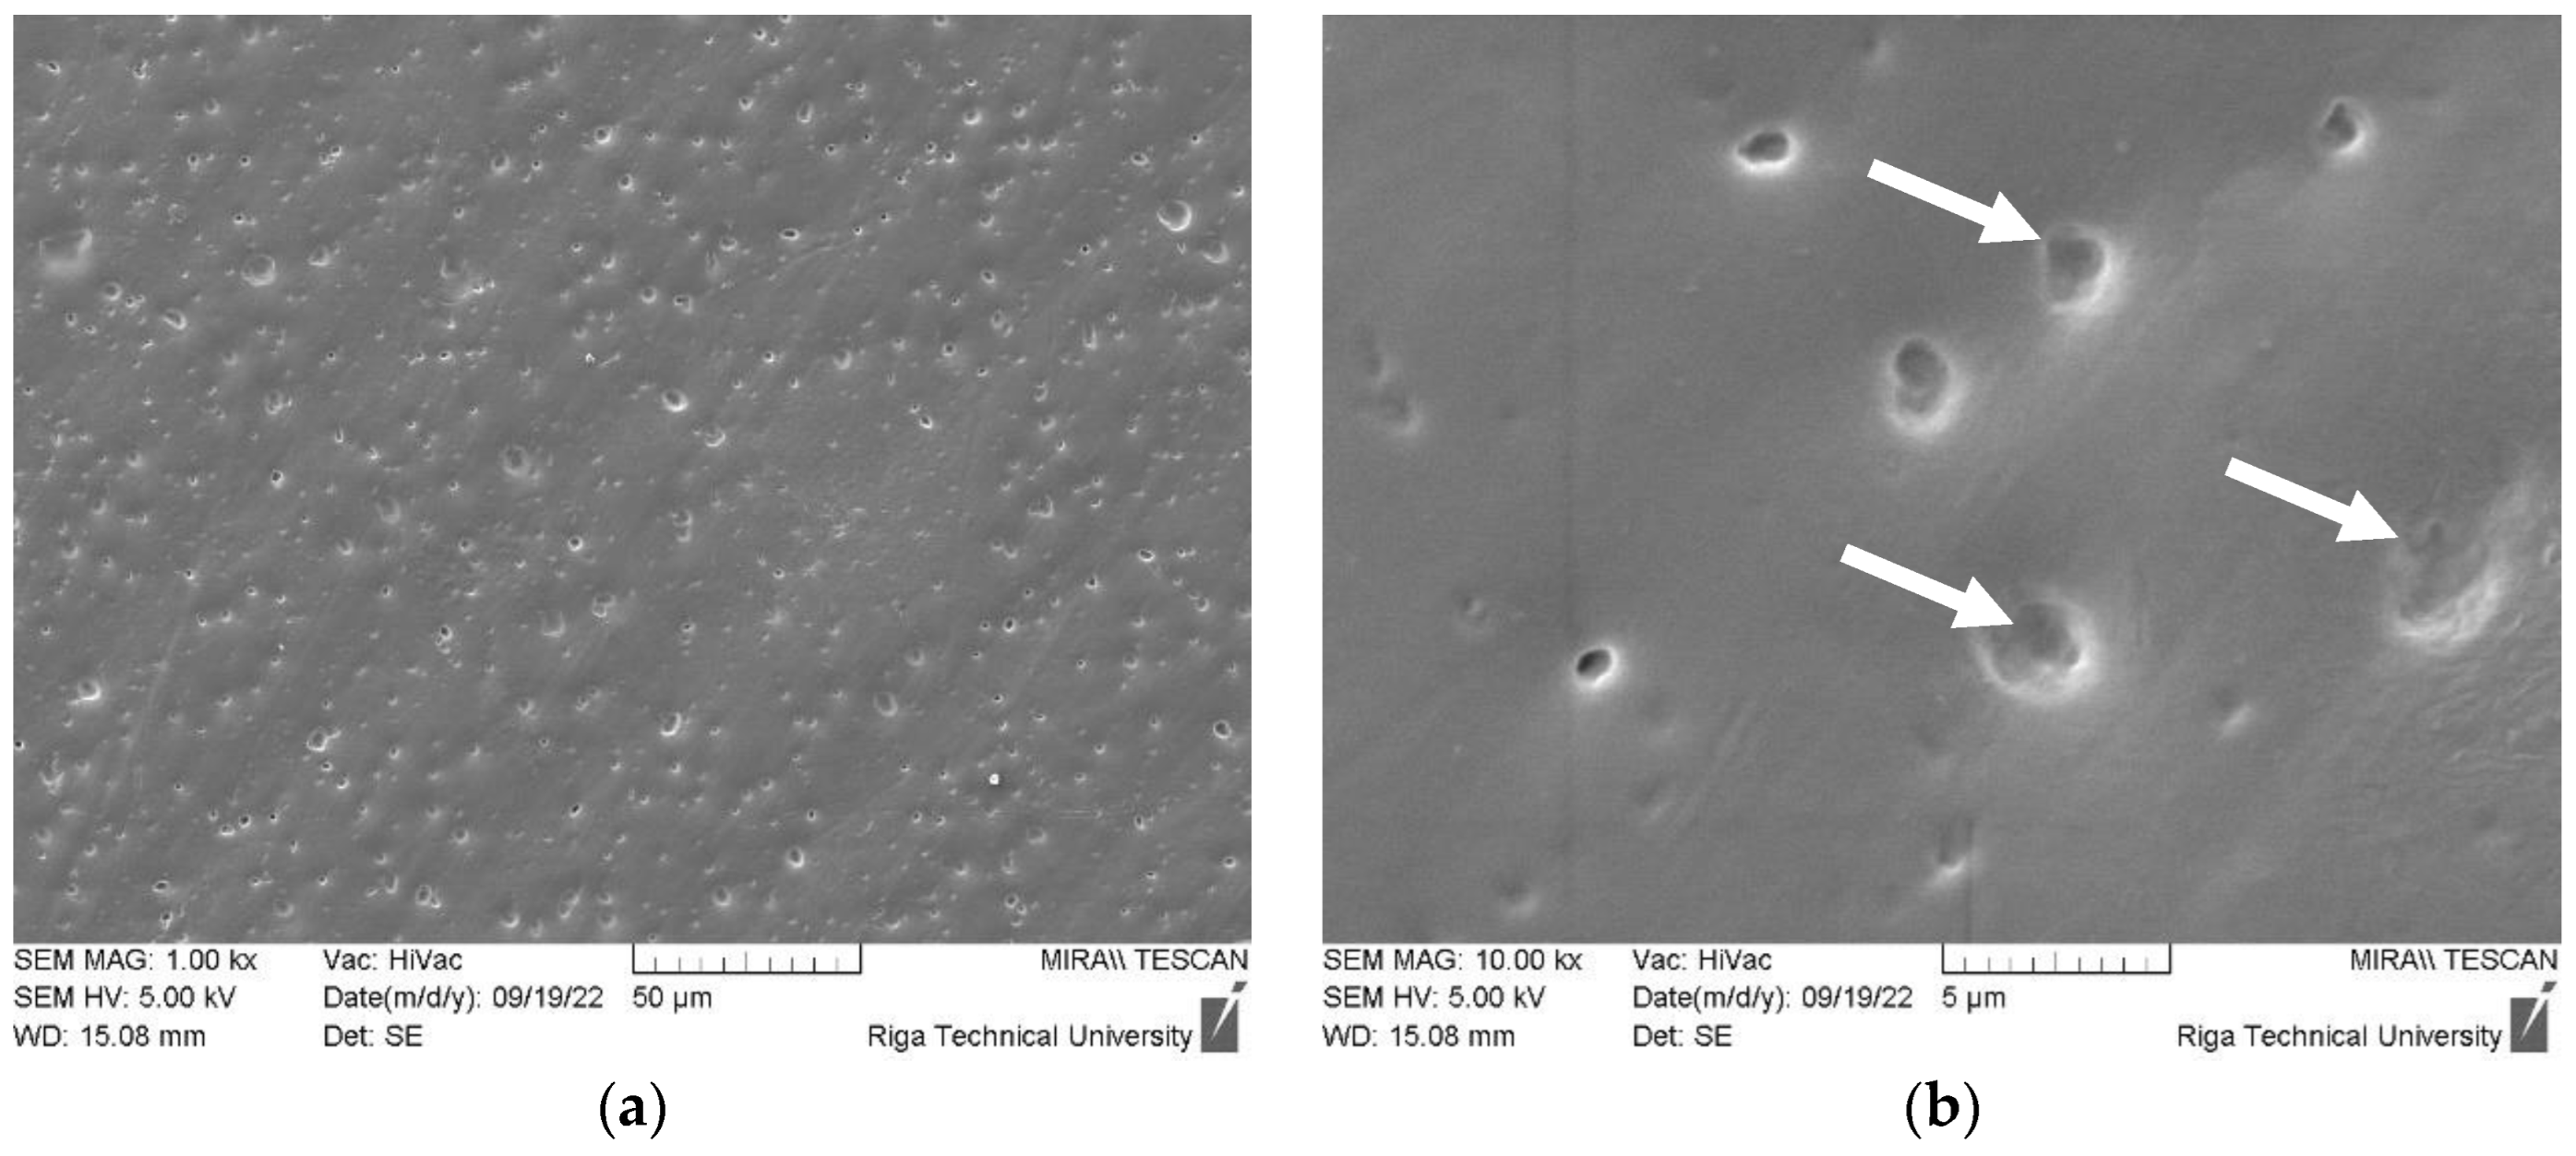
The sodium tetrahydroxozincate also forms crystal hydrates (Na2[Zn(OH)4]·2H2O) in the presence of aqueous solution. The corrosion products and mechanically trapped water inside the defects of DLP printed ZnO composites leads to increase in weight of corroded samples by up to 2.6%, as demonstrated in Figure 10a. Remarkably, that increase in ZnO concentration up to 1 and 1.5 wt.% leads to slightly lower increase in mass change, as compared to 0.5 wt.% specimen. This effect can be attributed to the more efficient block of defects by corrosion products in standing (stagnated) aqueous NaOH solution, as observed by SEM (see Figure 11a,b). Reaction leads to formation of smoother grains as compared to fresh ZnO powder. However, the specimen with 2 wt.% ZnO exhibits similar mass change (2.05%) as compared to the specimen with 1 wt.% ZnO (2.09%). This effect indicates the limit of blocking effect by ZnO at concentrations between 1.5 and 2 wt.% in tested conditions. However, the NaOH and reaction products lead almost no effect on any sample visually observable shape and morphology, as demonstrated in Figure 10b.
The ester groups of acrylic polymer and acrylic styrene copolymer hydrolyses into carboxylate salt of sodium [79]. However, in case of tested PUA composites, the surface of polymer material passivates the chemical corrosion. Further detailed studies are necessary to provide the better understanding of corrosion mechanism.

4. Discussion

The DLP method gets attention due to its operational simplicity and for quickly obtainable outputs. Unfortunately, limited supplementing (raw) materials availability on the market [80] and manufacturing precision (spatially controlled solidification) [81] leads to demand for intensive R&D process to obtain instructions for profitable and reliable materials and methods. These factors contribute to the production speed, product durability, and the miniaturization of objects for DLP printing, particularly for small-scale and highly detailed items [82].
Obtained DLP PUA with ZnO additives provide stable and durable protective solutions for both indoor [83] and outdoor [84] conditions. However, the chemical durability under different corrosive conditions typical for chemical transportation and storage tanks, household chemical containers, and many other exposed compartments should be studied in detail. The demonstrated strong corrosion resistance when subjected to a tested sodium hydroxide solution with a pH of 12 not only expands the potential applications of this composite to include the transportation of alkaline solutions and dry substances but also paves the way for its utilization in groundbreaking construction materials characterized by a high pH. One notable example is the development of innovative building materials, such as a 3D printed concrete composite based on a Portland cement binder [85].
An innovative approach involves hybrid concrete-DLP 3D printers, allowing for the incorporation of electrically responsive (ER) elements during the concrete deposition process. These printers could come in various sizes to accommodate both large-scale tanker tank construction and localized defect repairs. ZnO reinforced ERs can passivate the alkaline corrosion during concrete hardening during curing process and periodical wetting during service period.
The sedimentation of the ZnO powder become observable inside the container about 10 hours after mixing with the planetary mixer, as demonstrated in Figure 12a. The maximum ZnO concentration for the successful 3D printing was preliminarily detected by studying the range of concentrations from 0.5 to 10 wt.% and it was found that materials with content of 2 wt.% or lower are enabling to produce multilayered structure without delamination from the build plate and stronger adhesion to the transparent film, as demonstrated in Figure 12b,c.
The attachment of active ER premixing system would reduce the sedimentation effect on 3D printing performance. Further studies need to test different active mixing techniques.
When ZnO-reinforced polymers exhibit the photochromism effect, it can significantly enhance their aesthetic properties. Photochromic materials, like those containing ZnO nanoparticles, can change color or optical characteristics in response to UV light, as demonstrated in Figure 12d. For example, this effect can be valuable for shielding polymers from excessive UV exposure during the disinfection process of tanker walls.
When using ZnO powder as a filler in DLP photocured resins, it’s essential to consider its ecological impact, including proper disposal and recycling measures to mitigate potential environmental consequences.

5. Conclusions

As-received 99.9 wt.% pure ZnO powder with D50 = 177 nm and maximum particle (including agglomerate) sizes up to about 5 µm were mixed in commercially available polyurethane acrylate, isooctyl acrylate, and phosphine oxide mixture with ZnO concentrations from 0.5 up to 2 wt.% (from 0.5 to 10 wt.%, during preliminary studies). Adhesion weakening to the build plate and next layer (stronger adhesion to transparent film) limits the possibility to increase the ZnO concentration under selected DLP settings. The change in ZnO concentration causes thickness deviations in DLP samples. The 1 wt.% samples achieve closest value of thickness (3.99±0.16 mm) to target thickness value (4 mm), while 0.5 wt.% ZnO containing samples exhibit lowest deviation in average thickness (±0.03 mm).
Nonetheless, the deviation in the width of the DLP product consistently escalates, increasing by a factor of 1.5 to 5.5 times as the concentration rises from 1 wt.% to 2.5 wt.%. This results in an exceeding of the target value of 6 mm in the horizontal plane for all concentrations, with a minimum overage of 0.33±0.02 mm. To address this deviation, it can usually be corrected by simply reducing the exposure time while keeping the initially set conditional parameters intact.
All tested DLP composites with ZnO exhibits similar tensile strength from 23.29 (1 wt.%) up to 25.93 MPa (0.5 wt.%) at similar elongation/deformation values (0.0089 up to 0.0110), however, the increase in ZnO concentration increase brittleness of the product (tensile strength at fracture reduces to 24.04 MPa and elastic modulus reduces to 2001 MPa at ZnO concentration of 2 wt.%).
The increase in ZnO concentration increases the total area for reaction with acetic acid solution and causes visually observable loss of ER material from DLP products from 1 wt.% ZnO. The reaction products (zinc acetate salts) swell and cause formation of new defects under the surface layer. Therefore, use of ZnO reinforced DLP resin is limited to acidic environments.
All samples exhibit good corrosion resistance to applied aqueous sodium hydroxide solution (pH=12). The reaction products (mainly generates sodium tetrahydroxozincate) form on the surface of specimens and passivates further reaction when subjected to standing (stagnating) solution. Reaction products cause smooth surface above the ZnO, therefore reduces the possible friction caused defects. Future studies should include the measurement and reporting of roughness values.
Generally, the produced samples are suitable for application in alkaline environment and can be applied as protective coatings over tank walls or used as structural or functional elements (e.g., in Portland cement concrete walls).

Author Contributions

Conceptualization, J.B., V.T., and A.S.; methodology, J.B.; software, J.B and I.B.; validation, A.S., M.A. and V.A.; formal analysis, V.A., S.G., and V.T.; investigation, V.A., I.B., and V.L.; resources, J.B. and A.S.; data curation, J.B.; writing—original draft preparation, J.B., A.S., S.G., and V.T.; writing—review and editing, M.A., A.R., S.G., and A.S.; visualization, J.B. and V.A.; supervision, J.B.; project administration, A.S. and V.L.; funding acquisition, J.B. and A.S. All authors have read and agreed to the published version of the manuscript.

Funding

This research was funded by the VPP AIPP project Nr. VPP-AIPP-2021/1-0015, “Combined lightweight, high-temperature resistant hybrid composite for combined protection of drones from Direct Energy Weapon,” as well as B57 RTU research funds (ZM-2023/10) and grants from the Estonian Research Council (PRG643 and “DuplexCER” MNHA22040). The article was published with financial support from the Riga Technical University Research Support Fund.

Data Availability Statement

Not applicable.

Acknowledgments

The authors extend their sincere appreciation to the team at the Latvian Maritime Academy of Riga Technical University for their generous provision of access to the DLP printer. We extend special gratitude to Mr. Aleksandrs Girburgers and Mr. Kristaps Rubenis for their invaluable contributions to the laboratory, which played a pivotal role in the success of this research. We also appreciate the editorial support provided by Ms. Lilit Zakoyan.

Conflicts of Interest

The authors declare no conflict of interest.

References

  1. Becker, O.; Simon, G.P. Epoxy Nanocomposites Based on Layered Silicates and Other Nanostructured Fillers. In Polymer Nanocomposites; Elsevier, 2006; pp. 29–56.
  2. Fuchi, Y.; Yoshida, K.; Kozako, M.; Hikita, M.; Kamei, N. Comparison of Electrical Insulation Properties of Hydrocarbon-Based Thermosetting Resin and Epoxy Resin. In Proceedings of the 2016 IEEE Conference on Electrical Insulation and Dielectric Phenomena (CEIDP), IEEE, October 2016; pp. 133–136. [Google Scholar]
  3. Tanaka, T. Dielectric Nanocomposites with Insulating Properties. IEEE Transactions on Dielectrics and Electrical Insulation 2005, 12, 914–928. [Google Scholar] [CrossRef]
  4. García, J.M.; García, F.C.; Serna, F.; de la Peña, J.L. High-Performance Aromatic Polyamides. Prog Polym Sci 2010, 35, 623–686. [Google Scholar] [CrossRef]
  5. Maisonneuve, L.; Lamarzelle, O.; Rix, E.; Grau, E.; Cramail, H. Isocyanate-Free Routes to Polyurethanes and Poly(Hydroxy Urethane)s. Chem Rev 2015, 115, 12407–12439. [Google Scholar] [CrossRef]
  6. Popov, V. V.; Lobanov, M.L.; Stepanov, S.I.; Qi, Y.; Muller-Kamskii, G.; Popova, E.N.; Katz-Demyanetz, A.; Popov, A.A. Texturing and Phase Evolution in Ti-6Al-4V: Effect of Electron Beam Melting Process, Powder Re-Using, and HIP Treatment. Materials 2021, 14, 4473. [Google Scholar] [CrossRef] [PubMed]
  7. Ron, T.; Leon, A.; Popov, V.; Strokin, E.; Eliezer, D.; Shirizly, A.; Aghion, E. Synthesis of Refractory High-Entropy Alloy WTaMoNbV by Powder Bed Fusion Process Using Mixed Elemental Alloying Powder. Materials 2022, 15, 4043. [Google Scholar] [CrossRef] [PubMed]
  8. Popov, V.; Fleisher, A.; Muller-Kamskii, G.; Avraham, S.; Shishkin, A.; Katz-Demyanetz, A.; Travitzky, N.; Yacobi, Y.; Goel, S. Novel Hybrid Method to Additively Manufacture Denser Graphite Structures Using Binder Jetting. Sci Rep 2021, 11, 2438. [Google Scholar] [CrossRef]
  9. Varghese, G.; Moral, M.; Castro-García, M.; López-López, J.J.; Marín-Rueda, J.R.; Yagüe-Alcaraz, V.; Hernández-Afonso, L.; Ruiz-Morales, J.C.; Canales-Vázquez, J. Fabrication and Characterisation of Ceramics via Low-Cost DLP 3D Printing. Boletín de la Sociedad Española de Cerámica y Vidrio 2018, 57, 9–18. [Google Scholar] [CrossRef]
  10. Popov, V.; Koptyug, A.; Radulov, I.; Maccari, F.; Muller, G. Prospects of Additive Manufacturing of Rare-Earth and Non-Rare-Earth Permanent Magnets. Procedia Manuf 2018, 21, 100–108. [Google Scholar] [CrossRef]
  11. Fidan, I.; Huseynov, O.; Ali, M.A.; Alkunte, S.; Rajeshirke, M.; Gupta, A.; Hasanov, S.; Tantawi, K.; Yasa, E.; Yilmaz, O.; et al. Recent Inventions in Additive Manufacturing: Holistic Review. Inventions 2023, 8, 103. [Google Scholar] [CrossRef]
  12. Tubío, C.R.; Guitián, F.; Gil, A. Fabrication of ZnO Periodic Structures by 3D Printing. J Eur Ceram Soc 2016, 36. [Google Scholar] [CrossRef]
  13. Lu, J.; Dong, P.; Zhao, Y.; Zhao, Y.; Zeng, Y. 3D Printing of TPMS Structural ZnO Ceramics with Good Mechanical Properties. Ceram Int 2021, 47. [Google Scholar] [CrossRef]
  14. Waheed, S.; Rodas, M.; Kaur, H.; Kilah, N.L.; Paull, B.; Maya, F. In-Situ Growth of Metal-Organic Frameworks in a Reactive 3D Printable Material. Appl Mater Today 2021, 22. [Google Scholar] [CrossRef]
  15. Tubío, C.R.; Nóvoa, J.A.; Martín, J.; Guitián, F.; Salgueiro, J.R.; Gil, A. Broadband Terahertz ZnO Photonic Crystals Fabricated by 3D Printing. Ceram Int 2019, 45. [Google Scholar] [CrossRef]
  16. Lee, D.K.; Sin, K.S.; Shin, C.; Kim, J.H.; Hwang, K.T.; Kim, U.S.; Nahm, S.; Han, K.S. Fabrication of 3D Structure with Heterogeneous Compositions Using Inkjet Printing Process. Mater Today Commun 2023, 35. [Google Scholar] [CrossRef]
  17. Vidakis, N.; Petousis, M.; Velidakis, E.; Tzounis, L.; Mountakis, N.; Korlos, A.; Fischer-Griffiths, P.E.; Grammatikos, S. On the Mechanical Response of Silicon Dioxide Nanofiller Concentration on Fused Filament Fabrication 3d Printed Isotactic Polypropylene Nanocomposites. Polymers (Basel) 2021, 13. [Google Scholar] [CrossRef]
  18. Zhao, Z.; Zhou, G.; Yang, Z.; Cao, X.; Jia, D.; Zhou, Y. Direct Ink Writing of Continuous SiO2 Fiber Reinforced Wave-Transparent Ceramics. Journal of Advanced Ceramics 2020, 9, 403–412. [Google Scholar] [CrossRef]
  19. Liu, Y.; Chen, J.; Ning, L.; Sun, J.; Liu, L.; Zhao, K. Preparation and Properties of Nano-TiO2-Modified Photosensitive Materials for 3D Printing. E-Polymers 2022, 22, 686–695. [Google Scholar] [CrossRef]
  20. Veselý, P.; Froš, D.; Hudec, T.; Sedláček, J.; Ctibor, P.; Dušek, K. Dielectric Spectroscopy of PETG/TiO2 Composite Intended for 3D Printing. Virtual Phys Prototyp 2023, 18. [Google Scholar] [CrossRef]
  21. Xu, J.; Pang, W.; Shi, W. Synthesis of UV-Curable Organic–Inorganic Hybrid Urethane Acrylates and Properties of Cured Films. Thin Solid Films 2006, 514, 69–75. [Google Scholar] [CrossRef]
  22. Wang, Y.; Gao, M.; Wang, D.; Sun, L.; Webster, T.J. Nanoscale 3D Bioprinting for Osseous Tissue Manufacturing. Int J Nanomedicine 2020, Volume 15, 215–226. [Google Scholar] [CrossRef]
  23. Flowers, J.; Rose, M.A. Stereolithography Grows Experimenters. Technology and Engineering Teacher 2020, 79, 15–18. [Google Scholar]
  24. Fu, J.; Yin, H.; Yu, X.; Xie, C.; Jiang, H.; Jin, Y.; Sheng, F. Combination of 3D Printing Technologies and Compressed Tablets for Preparation of Riboflavin Floating Tablet-in-Device (TiD) Systems. Int J Pharm 2018, 549, 370–379. [Google Scholar] [CrossRef] [PubMed]
  25. Choi, J.-S.; Seo, J.; Khan, S.B.; Jang, E.S.; Han, H. Effect of Acrylic Acid on the Physical Properties of UV-Cured Poly(Urethane Acrylate-Co-Acrylic Acid) Films for Metal Coating. Prog Org Coat 2011, 71, 110–116. [Google Scholar] [CrossRef]
  26. Lü, N.; Lü, X.; Jin, X.; Lü, C. Preparation and Characterization of UV-Curable ZnO/Polymer Nanocomposite Films. Polym Int 2007, 56, 138–143. [Google Scholar] [CrossRef]
  27. Gaidukovs, S.; Medvids, A.; Onufrijevs, P.; Grase, L.; Brunavs, J. Development of UV-Cured Epoxy Resin Based on Marineline. Formulation for Applications as Efficient Repair System of Boat Tanks’ Protective Coating. In In Proceedings of the Baltic Polymer Symposium 2018; Institute of Physics Publishing (IOP): Jurmala, 2018; pp. 12–14. [Google Scholar]
  28. Wang, F.; Hu, J.Q.; Tu, W.P. Study on Microstructure of UV-Curable Polyurethane Acrylate Films. Prog Org Coat 2008, 62, 245–250. [Google Scholar] [CrossRef]
  29. Bao, F.; Shi, W. Synthesis and Properties of Hyperbranched Polyurethane Acrylate Used for UV Curing Coatings. Prog Org Coat 2010, 68, 334–339. [Google Scholar] [CrossRef]
  30. Clauser, J.; Gester, K.; Steinseifer, U.; Sonntag, S.J. Regulating Blood Cell Adhesion via Surface Modification of Polyurethanes. Advances in Polyurethane Biomaterials 2016, 287–318. [Google Scholar] [CrossRef]
  31. Hu, Y.; Zhu, G.; Zhang, J.; Huang, J.; Yu, X.; Shang, Q.; An, R.; Liu, C.; Hu, L.; Zhou, Y. Rubber Seed Oil-Based UV-Curable Polyurethane Acrylate Resins for Digital Light Processing (DLP) 3D Printing. Molecules 2021, 26, 5455. [Google Scholar] [CrossRef] [PubMed]
  32. Chattopadhyay, D.K.; Raju, K.V.S.N. Structural Engineering of Polyurethane Coatings for High Performance Applications. Prog Polym Sci 2007, 32, 352–418. [Google Scholar] [CrossRef]
  33. Nakayama, N.; Hayashi, T. Synthesis of Novel UV-Curable Difunctional Thiourethane Methacrylate and Studies on Organic–Inorganic Nanocomposite Hard Coatings for High Refractive Index Plastic Lenses. Prog Org Coat 2008, 62, 274–284. [Google Scholar] [CrossRef]
  34. Mishra, R.S.; Mishra, A.K.; Raju, K.V.S.N. Synthesis and Property Study of UV-Curable Hyperbranched Polyurethane Acrylate/ZnO Hybrid Coatings. Eur Polym J 2009, 45, 960–966. [Google Scholar] [CrossRef]
  35. Yoshimura, H.N.; Molisani, A.L.; Narita, N.E.; Manholetti, J.L.A.; Cavenaghi, J.M. Mechanical Properties and Microstructure of Zinc Oxide Varistor Ceramics. Materials Science Forum 2006, 530–531, 408–413. [Google Scholar] [CrossRef]
  36. Choi, H.M.; Kwon, S.; Jung, Y.-G.; Cho, Y.T. Comparison of Durability for PUA Type Resin Using Wear and Nano-Indentation Test. Journal of the Korean Society of Manufacturing Process Engineers 2018, 17, 8–15. [Google Scholar] [CrossRef]
  37. Nik Pauzi, N.N.P. ; A. Majid, R.; Dzulkifli, M.H.; Yahya, M.Y. Development of Rigid Bio-Based Polyurethane Foam Reinforced with Nanoclay. Compos B Eng 2014, 67, 521–526. [Google Scholar] [CrossRef]
  38. Madhan Kumar, A.; Mizanur Rahman, M.; Gasem, Z.M. A Promising Nanocomposite from CNTs and Nano-Ceria: Nanostructured Fillers in Polyurethane Coatings for Surface Protection. RSC Adv 2015, 5, 63537–63544. [Google Scholar] [CrossRef]
  39. Zhu, M.; Li, S.; Sun, Q.; Shi, B. Enhanced Mechanical Property, Chemical Resistance and Abrasion Durability of Waterborne Polyurethane Based Coating by Incorporating Highly Dispersed Polyacrylic Acid Modified Graphene Oxide. Prog Org Coat 2022, 170, 106949. [Google Scholar] [CrossRef]
  40. Rahman, M.M. Polyurethane/Zinc Oxide (PU/ZnO) Composite—Synthesis, Protective Property and Application. Polymers (Basel) 2020, 12, 1535. [Google Scholar] [CrossRef] [PubMed]
  41. Fu, J.; Wang, L.; Yu, H.; Haroon, M.; Haq, F.; Shi, W.; Wu, B.; Wang, L. Research Progress of UV-Curable Polyurethane Acrylate-Based Hardening Coatings. Prog Org Coat 2019, 131, 82–99. [Google Scholar] [CrossRef]
  42. Antonov, M.; Kers, J.; Liibert, L.; Shuliak, V.; Smirnov, A.; Bartolomé, J.F. Effect of Basalt Reinforcement Type and Content on the Abrasive Wear Behaviour of Polymer Composites. Key Eng Mater 2016, 674, 181–188. [Google Scholar] [CrossRef]
  43. Kumar, R.; Malaval, B.; Antonov, M.; Zhao, G. Performance of Polyimide and PTFE Based Composites under Sliding, Erosive and High Stress Abrasive Conditions. Tribol Int 2020, 147, 106282. [Google Scholar] [CrossRef]
  44. Mohamed, O.A.; Masood, S.H.; Bhowmik, J.L. Experimental Investigation of Time-Dependent Mechanical Properties of PC-ABS Prototypes Processed by FDM Additive Manufacturing Process. Mater Lett 2017, 193, 58–62. [Google Scholar] [CrossRef]
  45. Eckel, Z.C.; Zhou, C.; Martin, J.H.; Jacobsen, A.J.; Carter, W.B.; Schaedler, T.A. Additive Manufacturing of Polymer-Derived Ceramics. Science (1979) 2016, 351, 58–62. [Google Scholar] [CrossRef]
  46. Melchels, F.P.W.; Feijen, J.; Grijpma, D.W. A Review on Stereolithography and Its Applications in Biomedical Engineering. Biomaterials 2010, 31, 6121–6130. [Google Scholar] [CrossRef]
  47. Azeredo, H.M.C. de Nanocomposites for Food Packaging Applications. Food Research International 2009, 42, 1240–1253. [Google Scholar] [CrossRef]
  48. Duncan, T. v. Applications of Nanotechnology in Food Packaging and Food Safety: Barrier Materials, Antimicrobials and Sensors. J Colloid Interface Sci 2011, 363, 1–24. [Google Scholar] [CrossRef]
  49. Tang, E.; Liu, H.; Sun, L.; Zheng, E.; Cheng, G. Fabrication of Zinc Oxide/Poly(Styrene) Grafted Nanocomposite Latex and Its Dispersion. Eur Polym J 2007, 43, 4210–4218. [Google Scholar] [CrossRef]
  50. Yan, M.F. Zinc Oxide. Concise Encyclopedia of Advanced Ceramic Materials 1991, 523–525. [Google Scholar] [CrossRef]
  51. Song, Z.; Kelf, T.A.; Sanchez, W.H.; Roberts, M.S.; Rička, J.; Frenz, M.; Zvyagin, A. V. Characterization of Optical Properties of ZnO Nanoparticles for Quantitative Imaging of Transdermal Transport. Biomed Opt Express 2011, 2, 3321. [Google Scholar] [CrossRef]
  52. Khabazipour, M.; Anbia, M. Removal of Hydrogen Sulfide from Gas Streams Using Porous Materials: A Review. Ind Eng Chem Res 2019, 58, 22133–22164. [Google Scholar] [CrossRef]
  53. Ates, T.; Tatar, C.; Yakuphanoglu, F. Preparation of Semiconductor ZnO Powders by Sol–Gel Method: Humidity Sensors. Sens Actuators A Phys 2013, 190, 153–160. [Google Scholar] [CrossRef]
  54. Li, K.; de Rancourt de Mimérand, Y.; Jin, X.; Yi, J.; Guo, J. Metal Oxide (ZnO and TiO2) and Fe-Based Metal–Organic-Framework Nanoparticles on 3D-Printed Fractal Polymer Surfaces for Photocatalytic Degradation of Organic Pollutants. ACS Appl Nano Mater 2020, 3, 2830–2845. [Google Scholar] [CrossRef]
  55. Bykkam, S.; Narsingam, S.; Ahmadipour, M.; Dayakar, T.; Venkateswara Rao, K.; Shilpa Chakra, Ch.; Kalakotla, S. Few Layered Graphene Sheet Decorated by ZnO Nanoparticles for Anti-Bacterial Application. Superlattices Microstruct 2015, 83, 776–784. [Google Scholar] [CrossRef]
  56. Kim, D.; Jang, M.; Seo, J.; Nam, K.H.; Han, H.; Khan, S.B. UV-Cured Poly(Urethane Acrylate) Composite Films Containing Surface-Modified Tetrapod ZnO Whiskers. Compos Sci Technol 2013, 75, 84–92. [Google Scholar] [CrossRef]
  57. Siyanbola, T.O.; Sasidhar, · K; Rao, · B V S K; Narayan, R. ; Olaofe, · O; Akintayo, · E T; Raju, · K V S N Development of Functional Polyurethane-ZnO Hybrid Nanocomposite Coatings from Thevetia Peruviana Seed Oil. J Am Oil Chem Soc 2015, 92, 267–275. [Google Scholar] [CrossRef]
  58. Mhd Haniffa, M.A.C.; Ching, Y.C.; Chuah, C.H.; Ching, K.Y.; Liou, N.S. Synergistic Effect of (3-Aminopropyl)Trimethoxysilane Treated ZnO and Corundum Nanoparticles under UV-Irradiation on UV-Cutoff and IR-Absorption Spectra of Acrylic Polyurethane Based Nanocomposite Coating. Polym Degrad Stab 2019, 159, 205–216. [Google Scholar] [CrossRef]
  59. Soares, R.R.; Carone, C.; Einloft, S.; Ligabue, R.; Monteiro, W.F. Synthesis and Characterization of Waterborne Polyurethane/ZnO Composites. Polymer Bulletin 2014, 71, 829–838. [Google Scholar] [CrossRef]
  60. Zhang, J.; Li, Y.; Hu, C.; Huang, W.; Su, L. Anti-Corrosive Properties of Waterborne Polyurethane/Poly(o-Toluidine)-ZnO Coatings in NaCl Solution. https://doi.org/10.1080/01694243.2018.1529881, 2019; 33, 1047–1065. [Google Scholar] [CrossRef]
  61. Siyanbola, T.O.; Sasidhar, K.; Rao, B.V.S.K.; Narayan, R.; Olaofe, O.; Akintayo, E.T.; Raju, K.V.S.N. Development of Functional Polyurethane–ZnO Hybrid Nanocomposite Coatings from Thevetia Peruviana Seed Oil. J Am Oil Chem Soc 2015, 92, 267–275. [Google Scholar] [CrossRef]
  62. Salazar-Bravo, P.; del Angel-López, D.; Torres-Huerta, A.M.; Domínguez-Crespo, M.A.; Palma-Ramírez, D.; Brachetti-Sibaja, S.B.; Ferrel-Álvarez, A.C. Investigation of ZnO/Waterborne Polyurethane Hybrid Coatings for Corrosion Protection of AISI 1018 Carbon Steel Substrates. Metallurgical and Materials Transactions A 2019, 50, 4798–4813. [Google Scholar] [CrossRef]
  63. Posthumus, W.; Magusin, P.C.M.M.; Brokken-Zijp, J.C.M.; Tinnemans, A.H.A.; van der Linde, R. Surface Modification of Oxidic Nanoparticles Using 3-Methacryloxypropyltrimethoxysilane. J Colloid Interface Sci 2004, 269, 109–116. [Google Scholar] [CrossRef]
  64. Mai, N.T.; Anh, B.T.M.; Vuong, N.T. Acid and Alkali Resistance of Acrylic Polyurethane/R-SiO 2 Nanocomposite Coating. Vietnam Journal of Chemistry 2020, 58, 67–73. [Google Scholar] [CrossRef]
  65. Deng, Y.; Li, J.; He, Z.; Hong, J.; Bao, J. Urethane Acrylate-based Photosensitive Resin for Three-dimensional Printing of Stereolithographic Elastomer. J Appl Polym Sci 2020, 137, 49294. [Google Scholar] [CrossRef]
  66. Anycubic Translucent UV Resin. Available online: https://www.anycubic.com/products/clear-uv-resin (accessed on 24 July 2022).
  67. MERCK Zinc Oxide. Available online: https://www.sigmaaldrich.com/LV/en/product/sigald/205532 (accessed on 24 July 2022).
  68. ASTM International ASTM D638 − 14. Standard Test Method for Tensile Properties of Plastics. In Standards and publications; West Conshohocken, 2014; p. 17.
  69. Anycubic ANYCUBIC Photon Mono. Available online: https://www.anycubic.com/products/photon-mono-resin-3d-printer (accessed on 25 July 2022).
  70. Ito, H.; Yoshioka, D.; Hamada, M.; Okamoto, T.; Kobori, Y.; Kobayashi, Y. Photochromism of Colloidal ZnO Nanocrystal Powders under Ambient Conditions. Photochemical & Photobiological Sciences. [CrossRef]
  71. Meng, F.; King, M.D.; Hassan, Y.A.; Ugaz, V.M. Localized Fluorescent Complexation Enables Rapid Monitoring of Airborne Nanoparticles. Environ Sci Nano 2014, 1, 358. [Google Scholar] [CrossRef]
  72. Wang, Y.; Shi, J.; He, Z.B.; Bai, H.W. Preparation and Mechanical Properties of T-ZnOw/PS Composites. Chinese Journal of Polymer Science (English Edition) 2009, 27, 173–181. [Google Scholar] [CrossRef]
  73. Zhou, J.P.; Qiu, K.Q.; Fu, W.L. The Surface Modification of ZnOw and Its Effect on the Mechanical Properties of Filled Polypropylene Composites. 2005, 39, 1931–1941. [Google Scholar] [CrossRef]
  74. Manapat, J.Z.; Mangadlao, J.D.; Tiu, B.D.B.; Tritchler, G.C.; Advincula, R.C. High-Strength Stereolithographic 3D Printed Nanocomposites: Graphene Oxide Metastability. ACS Appl Mater Interfaces 2017, 9, 10085–10093. [Google Scholar] [CrossRef] [PubMed]
  75. Prakash, K.S.; Nancharaih, T.; Rao, V.V.S. Additive Manufacturing Techniques in Manufacturing -An Overview. Mater Today Proc 2018, 5, 3873–3882. [Google Scholar] [CrossRef]
  76. Ngo, T.D.; Kashani, A.; Imbalzano, G.; Nguyen, K.T.Q.; Hui, D. Additive Manufacturing (3D Printing): A Review of Materials, Methods, Applications and Challenges. Compos B Eng 2018, 143, 172–196. [Google Scholar] [CrossRef]
  77. van Niekerk, J.N.; Schoening, F.R.L.; Talbot, J.H. The Crystal Structure of Zinc Acetate Dihydrate, Zn(CH3COO)2.2H2O. Acta Crystallogr 1953, 6, 720–723. [Google Scholar] [CrossRef]
  78. Zinc Acetate Dihydrate. In ACS Reagent Chemicals; American Chemical Society: Washington, DC, 2017.
  79. Vuong, N.T.; Hiep, N.A. The Alkaline Hydrolysis Degradation of a Water-Borne Styrene Acrylic Coating. Vietnam Journal of Chemistry 2016, 54, 249. [Google Scholar]
  80. Chartrain, N.A.; Williams, C.B.; Whittington, A.R. A Review on Fabricating Tissue Scaffolds Using Vat Photopolymerization. Acta Biomater 2018, 74, 90–111. [Google Scholar] [CrossRef]
  81. Bae, J.H.; Won, J.C.; Lim, W. bin; Min, J.G.; Lee, J.H.; Kwon, C.R.; Lee, G.H.; Huh, P. Synthesis and Characteristics of Eco-Friendly 3D Printing Material Based on Waterborne Polyurethane. Polymers 2020, 13, 44. [Google Scholar] [CrossRef]
  82. Bae, J.H.; Won, J.C.; Lim, W. bin; Lee, J.H.; Min, J.G.; Kim, S.W.; Kim, J.H.; Huh, P. Highly Flexible and Photo-Activating Acryl-Polyurethane for 3D Steric Architectures. Polymers 2021, 13, 844. [Google Scholar] [CrossRef] [PubMed]
  83. Nguyen, T.V.; Do, T.V.; Ha, M.H.; Le, H.K.; Le, T.T.; Linh Nguyen, T.N.; Dam, X.T.; Lu, L.T.; Tran, D.L.; Vu, Q.T.; et al. Crosslinking Process, Mechanical and Antibacterial Properties of UV-Curable Acrylate/Fe3O4-Ag Nanocomposite Coating. Prog Org Coat 2020, 139, 105325. [Google Scholar] [CrossRef]
  84. Vuong, N.T.; Linh, N.T. The Accelerated Weathering Aging of a Water-Borne Styrene Acrylic Coating. Vietnam Journal of Chemistry 2016, 54, 139. [Google Scholar]
  85. Voicu, G.; Tiuca, G.A.; Badanoiu, A.I.; Holban, A.M. Nano and Mesoscopic SiO2 and ZnO Powders to Modulate Hydration, Hardening and Antibacterial Properties of Portland Cements. Journal of Building Engineering 2022, 57, 104862. [Google Scholar] [CrossRef]
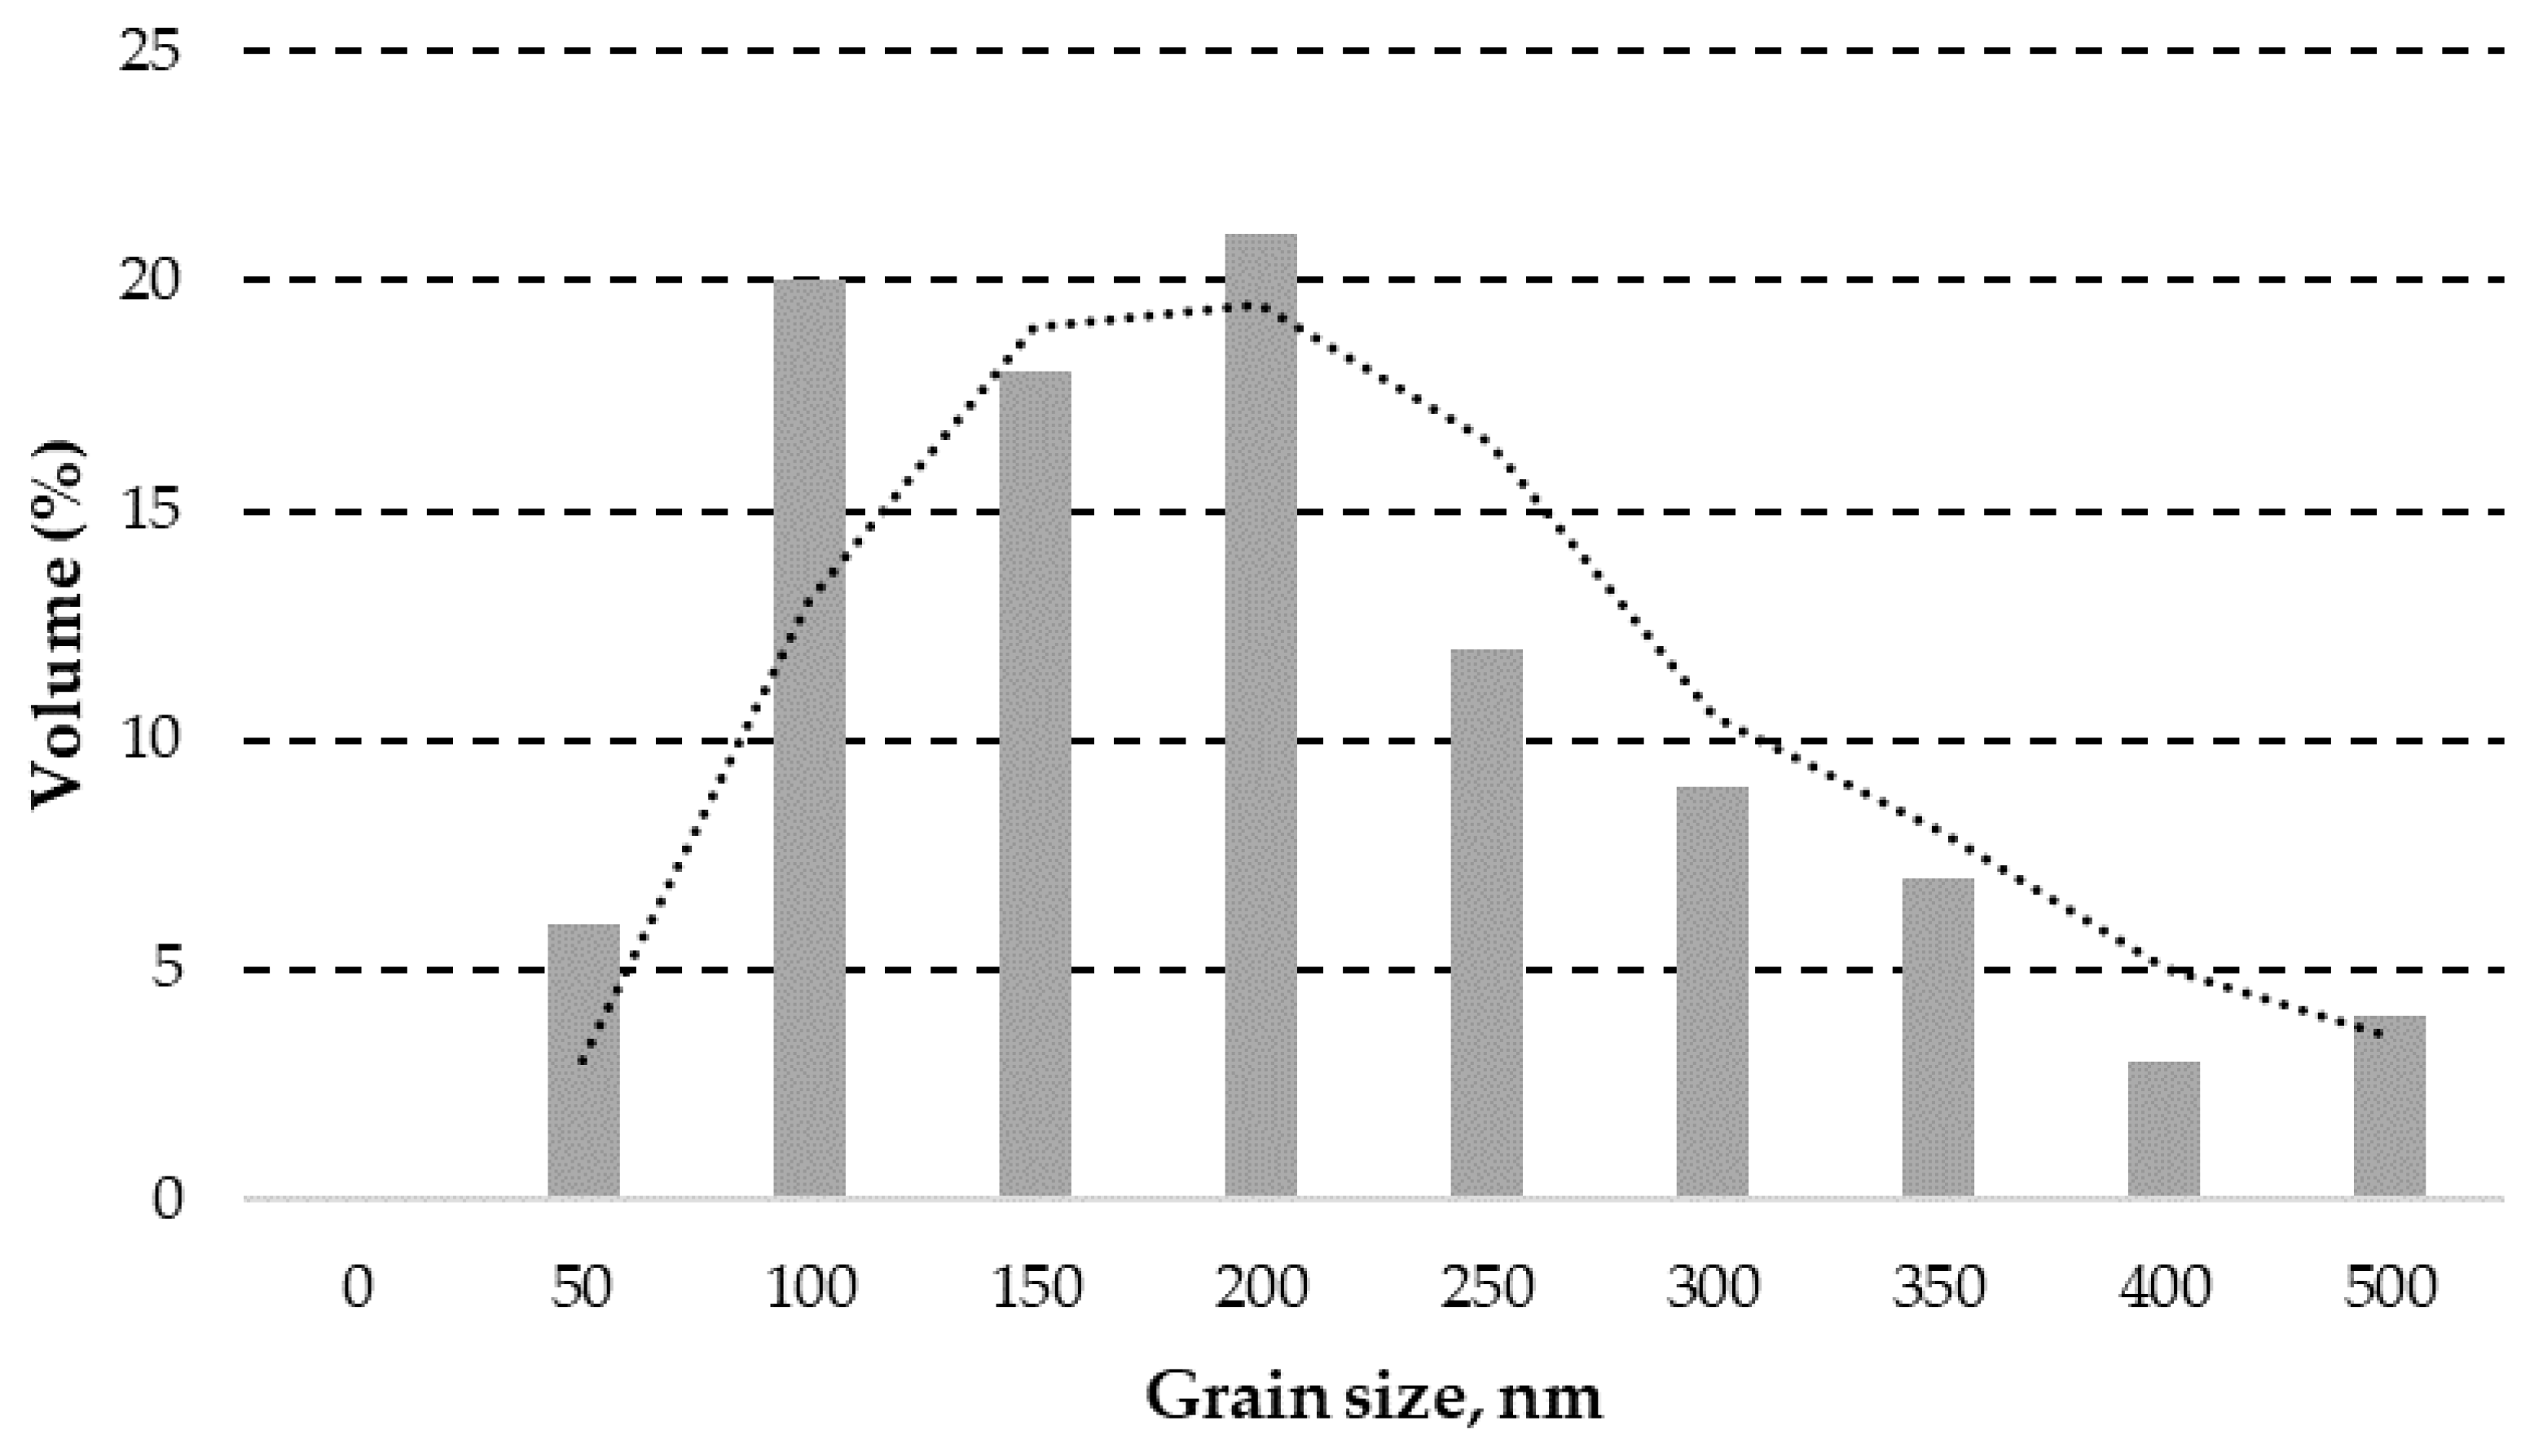
Figure 1. A simplified granulometric analysis of ZnO powder obtained through laser granulometry with two period moving average trendline indicated (dashed line).
Preprints 89941 g001
Figure 2. Detected ZnO particles and agglomerates with particle sizes above 5 µm.
Preprints 89941 g002
Figure 3. The orientation and layout of CAD objects on the build plate with indicated most failing area (a); DLP specimens with defect caused to one of the specimens by the delamination from the build plate (b); and interlayer adhesion defect (c) caused by transparent film surpassing the adhesion between the build plate and the cured sample.
Preprints 89941 g003
Figure 4. The mimicked rough surface caused from the adhesion to the profiled (textured) build plate and micrometer sized ZnO particles (possible agglomerates) observed by the optical microscope on the surface of 0.5 wt.% ZnO containing sample.
Preprints 89941 g004
Figure 5. Examples of effect of ZnO concentrations of 0.5 wt.% (a); 1 wt.% (b); 1.5 wt.% (c); and 2 wt.% (d) on tensile stress at yield and fracture strains. The increase in ZnO concentrations leads to more brittle composite behavior under applied destructive tensile force.
Preprints 89941 g005
Figure 6. The graph displays the correlation between the elastic modulus (E) in megapascals (MPa) on the left Y-axis and the tensile strength at the yield point (σy) in MPa on the right Y-axis. These measurements are analyzed with respect to different ZnO concentrations. Reference sample (0 wt.%) exhibit fracture at yield.
Preprints 89941 g006
Figure 7. Degradation results after 7 days exposure of polymer composites with ZnO concentrations of 0.5 wt.% (a); 1 wt.% (b); 1.5 wt.% (c); and 2 wt.% (d) in acetic acid (pH=5) solution. Black arrows indicate the degradation products caused by ZnO reaction with acetic acid and destruction of polymer structure by the formation of relatively large crystalline salt (zinc acetate) grains.
Preprints 89941 g007
Figure 8. The change of ZnO containing polymer composites mass after exposure in acetic acid for 7 days (a); and optical image (magnification x126) of the corroded 1.5 wt.% sample (b) with indicated corrosion products and deterioration defects. Positive values indicate that the gain in mass by corrosion products is higher than the loss of mass by composite deterioration.
Preprints 89941 g008
Figure 9. Degradation results after 7 days exposure of polymer composites with ZnO concentration of 1 wt.% in acetic acid (pH=5) solution captured by SEM with 1000x (a) and 10 000x (b) resolutions. White arrow indicates the mechanical degradation of cured ER by swelling of ZnO and acetic acid reaction products.
Preprints 89941 g009
Figure 10. The increase in ZnO containing polymer composites mass after exposure in the aqueous 1M NaOH solution (pH = 11) for 7 days (a); and photo of the corroded 2 wt.% ZnO containing sample without significant impact on surface morphology (b).
Preprints 89941 g010
Figure 11. Degradation results after 7 days exposure of polymer composites with ZnO concentration of 2 wt.% in 1M NaOH solution (pH = 11) solution captured by SEM with 1000x (a) and 10 000x (b) resolutions. The reaction leads to the formation of smooth particles with passivation effect.
Preprints 89941 g011
Figure 12. The sedimentation (white colored substance) of the ZnO in raw ER (a); first layer delamination from the build plate (b); DLP failure by too strong first layer adhesion to the transparent film (c); and photochromism effect after high power (40 W) UV curing (d).
Preprints 89941 g012
Table 1. Comprehensive summary of composite materials for 3D printing: metal oxides (ZnO, SiO2, and TO2) containing polymer compositions and properties of products.
No. Filling substance Particle size Loading Additive manufacturing method Properties/applications Ref.
1 ZnO 0.7 µm 44-52 vol% IPL The compressive strength ranges from 5.08 to 11.09 MPa at temperatures of 900 to 1500 °C. [12]
2 ZnO 100 nm 38 wt.% DLP The compressive strength ranges from 1.26 to 6.82 MPa for materials with a Gyroid structure and Schwartz P structure. [13]
3 ZnO <130 nm 10 wt.% FDM New devices are continuously emerging for pertinent applications in fields like environmental science, energy, and catalysis. [14]
4 ZnO Highly concentrated ZnO ink 50 vol% Robotic deposition equipment ZnO optoelectronic devices operate at THz frequencies and can be seamlessly integrated with various optical components like waveguides and resonators. [15]
5 SiO2 100 nm 2 wt.% IPL The applicability of inkjet 3D printing in the electronics industry is promising with ink characteristics like a density of 1.05 g·ml-1 and a viscosity of 9.53 mPa·s, enabling precise and controlled deposition of conductive materials for circuit fabrication. [16]
6 SiO2 5-15 nm 0.5-4 wt.% FFF Tensile strength ranges from 31 to 35 MPa, with a corresponding tensile modulus of elasticity of 138-148 MPa. Additionally, it has a flexural strength of 40-47 MPa and a flexural modulus of elasticity spanning 786-927 MPa. The impact resistance falls within the range of 3.72-4.01 kJ·m-2, and the microhardness measures between 12.44 and 13.34 HV. [17]
7 SiO2 The diameter of the fiber is 6.5 μm.20 nm powder 10 vol% (fiber)3.68-11.76 wt.% powder Direct ink writing The composite material exhibits a dielectric constant of 1.2 and a dielectric loss tangent of 1.5 x 10⁻². Its bending strength ranges from 11.2±1.1 to 14.15±1.3 MPa, while the apparent porosity falls within the range of 24.36% to 24.48%. [18]
8 TiO2 10 nm 0-2.5% SLA The material demonstrates a tensile strength between 17 and 25 MPa, an impact resistance of 17.5 to 25 kJ·m-2, a hardness of 80 HV, and an elongation at break of 8 to 8.5%. [19]
9 TiO2 50–300 µm 10-20% FDM The grain size distribution plays a crucial role in the frequency-dependent variations of the dielectric constant and loss factor in this ceramic composite. These characteristics are essential for its performance in dielectric applications, including its use in capacitors for A/D converters, filtration capacitors, and dielectric resonant antennas. [20]
Table 2. Slice settings for manufacturing specimens with the help of the Anycubic Photon Mono 3D printer. Printing time of one sample was approximately 15 minutes (demonstrated by DLP printer).
Slice setting parameter Value Unit of measure
Layer thickness 50 µm
Normal exposure time 2 s
Off time 0.5 s
Bottom exposure time 40 s
Bottom layers 6 layers
Z axis lift distance (after printing of each layer) 6 mm
Z axis lift speed 5 mm·s-1
Z axis retract speed 6 mm·s-1
Table 3. The effect of ZnO concentrations on average thicknesses and widths at the centers of 3D printed specimens and average deviation from target thickness (4 mm) and target width (6 mm) values. A minimum of five samples were measured for each material.
ZnO concentration
0 wt.% 0.5 wt.% 1 wt.% 1.5 wt.% 2 wt.%
Average thickness, mm
(deviation, mm)
4.01
(±0.07)
3.84
(±0.03)
3.99
(±0.16)
3.72
(±0.34)
3.83
(±0.12)
Average deviation from the target thickness, mm (~0.000) −0.160 −0.003 −0.280 −0.170
Average width at the center, mm
(deviation, mm)
5.93
(±0.03)
6.33
(±0.02)
6.49
(±0.03)
6.42
(±0.07)
6.47
(±0.11)
Average deviation from the target width at the center, mm -0.070 +0.330 +0.490 +0.420 +0.470
Table 4. The average tensile strengths at yield and fracture loads of ZnO containing DLP composites. A minimum of five samples were measured for each material.
Sample
0 wt.% 0.5 wt.% 1 wt.% 1.5 wt.% 2 wt.%
Tensile strength at yield, σy (MPa) - 25.93 (±0.44) 23.29 (±0.18) 25.19 (±1.25) 23.41 (±3.21)
Elongation / deformation at yield, ε (mm·mm-1) - 0.0091
(±0.0014)
0.0089
(±0.0012)
0.0110
(±0.0001)
0.0091
(±0.0036)
Tensile strength at fracture, σUTS (MPa) 43.1 (±4.06) 38.76 (±0.03) 35.40 (±0.03) 29.93 (±0.03) 24.04 (±0.03)
Elongation / deformation at fracture, εUTS (mm·mm-1) - 0.0156
(±0.0001)
0.0172
(±0.0007)
0.0146
(±0.0011)
0.0112
(±0.0051)
Disclaimer/Publisher’s Note: The statements, opinions and data contained in all publications are solely those of the individual author(s) and contributor(s) and not of MDPI and/or the editor(s). MDPI and/or the editor(s) disclaim responsibility for any injury to people or property resulting from any ideas, methods, instructions or products referred to in the content.
Copyright: This open access article is published under a Creative Commons CC BY 4.0 license, which permit the free download, distribution, and reuse, provided that the author and preprint are cited in any reuse.
Prerpints.org logo

Preprints.org is a free preprint server supported by MDPI in Basel, Switzerland.

Subscribe

© 2024 MDPI (Basel, Switzerland) unless otherwise stated