Submitted:
08 November 2023
Posted:
08 November 2023
You are already at the latest version
Abstract
Keywords:
1. Introduction
2. Methodology
2.1. Mathematical formulation
2.2. Numerical Implementation and Error Analysis
3. Results and discussion
3.1. Non-premixed combustion simulation
3.2. Premixed combustion simulation
4. Conclusions
Author Contributions
Funding
Data Availability Statement
Conflicts of Interest
Nomenclature
| Species mass concentration | Chemical species | ||
| Sub-grid coefficient | Filter size | ||
| D | Sandia flame D inlet diameter | Field scalar | |
| Da | Damköhler number | Scalar dissipation rate | |
| hrs | Hours | Chemical source term | |
| H | Bunsen flame F3 inlet diameter | ||
| r | Radial offset | ||
| Re | Reynolds number | ||
| T | Temperature | ||
| xj | The spatial vector | ||
| Y | Species mass fraction | ||
| z | The spatial z-direction vector |
References
- Taamallah, S.; Vogiatzaki, K.; Alzahrani, F.M.; Mokheimer, E.M.; Habib, M.; Ghoniem, A.F. Fuel flexibility, stability and emissions in premixed hydrogen-rich gas turbine combustion: Technology, fundamentals, and numerical simulations. Applied energy 2015, 154, 1020–1047. [Google Scholar] [CrossRef]
- T. Poinsot, D. Veynante, Theoretical and numerical combustion, RT Edwards, Inc.2005.
- Jiang, X.; Luo, K. Combustion-induced buoyancy effects of an axisymmetric reactive plume. Proceedings of the combustion institute 2000, 28, 1989–1995. [Google Scholar] [CrossRef]
- Giacomazzi, E.; Battaglia, V.; Bruno, C. The coupling of turbulence and chemistry in a premixed bluff-body flame as studied by LES. Combustion and Flame 2004, 138, 320–335. [Google Scholar] [CrossRef]
- Popp, S.; Hunger, F.; Hartl, S.; Messig, D.; Coriton, B.; Frank, J.H.; Fuest, F.; Hasse, C. LES flamelet-progress variable modeling and measurements of a turbulent partially-premixed dimethyl ether jet flame. Combustion and Flame 2015, 162, 3016–3029. [Google Scholar] [CrossRef]
- Volpiani, P.S.; Schmitt, T.; Vermorel, O.; Quillatre, P.; Veynante, D. Large eddy simulation of explosion deflagrating flames using a dynamic wrinkling formulation. Combustion and Flame 2017, 186, 17–31. [Google Scholar] [CrossRef]
- Sacomano Filho, F.L.; Kuenne, G.; Chrigui, M.; Sadiki, A.; Janicka, J. A consistent Artificially Thickened Flame approach for spray combustion using LES and the FGM chemistry reduction method: Validation in Lean Partially Pre-vaporized flames. Combustion and Flame 2017, 184, 68–89. [Google Scholar] [CrossRef]
- Malalasekera, W.; Ranga-Dinesh, K.; Ibrahim, S.S.; Masri, A.R. LES of recirculation and vortex breakdown in swirling flames. Combustion Science and Technology 2008, 180, 809–832. [Google Scholar] [CrossRef]
- Gallot-Lavallée, S.; Jones, W.; Marquis, A. Large Eddy Simulation of an ethanol spray flame under MILD combustion with the stochastic fields method. Proceedings of the Combustion Institute 2017, 36, 2577–2584. [Google Scholar] [CrossRef]
- Navarro-Martinez, S.; Kronenburg, A. Flame stabilization mechanisms in lifted flames. Flow, Turbulence and Combustion 2011, 87, 377–406. [Google Scholar] [CrossRef]
- Farrace, D.; Chung, K.; Pandurangi, S.S.; Wright, Y.M.; Boulouchos, K.; Swaminathan, N. Unstructured LES-CMC modelling of turbulent premixed bluff body flames close to blow-off. Proceedings of the Combustion Institute 2017, 36, 1977–1985. [Google Scholar] [CrossRef]
- D.B. Spalding. Development of the eddy-break-up model of turbulent combustion. In: editor^editors. Symposium (International) on Combustion; 1977: Elsevier. p. 1657-1663.
- Ertesvåg, I.S.; Magnussen, B.F. The eddy dissipation turbulence energy cascade model. Combustion science and technology 2000, 159, 213–235. [Google Scholar] [CrossRef]
- Gicquel, L.Y.; Staffelbach, G.; Poinsot, T. Large eddy simulations of gaseous flames in gas turbine combustion chambers. Progress in Energy and Combustion Science 2012, 38, 782–817. [Google Scholar] [CrossRef]
- Pitsch, H. Large-eddy simulation of turbulent combustion. Annu. Rev. Fluid Mech. 2006, 38, 453–482. [Google Scholar] [CrossRef]
- Janicka, J.; Sadiki, A. Large eddy simulation of turbulent combustion systems. Proceedings of the Combustion Institute 2005, 30, 537–547. [Google Scholar] [CrossRef]
- Villasenor, R.; Chen, J.-Y.; Pitz, R. Modeling ideally expanded supersonic turbulent jet flows with nonpremixed H2-air combustion. AIAA journal 1992, 30, 395–402. [Google Scholar] [CrossRef]
- F. Nieuwstadt, J. Meeder, Large-eddy simulation of air pollution dispersion: a review, New tools in turbulence modelling, Springer1997, pp. 265-280.
- Chow, F.K.; Street, R.L.; Xue, M.; Ferziger, J.H. Explicit filtering and reconstruction turbulence modeling for large-eddy simulation of neutral boundary layer flow. Journal of the Atmospheric Sciences 2005, 62, 2058–2077. [Google Scholar] [CrossRef]
- F.V. Katopodes, R. Street, J. Ferziger. Subfilter-scale scalar transport for large-eddy simulation. In: editor^editors. 14th Symposium on Boundary Layers and Turbulence; 2000: American Meteorologic Society Aspen (CO). p. 472-475.
- F.V. Katopodes, R.L. Street, J.H. Ferziger, A theory for the subfilter-scale model in large-eddy simulation, Environmental Fluid Mechanics Laboratory Tech. Rep, (2000) K1.
- Domingo, P.; Vervisch, L. Large Eddy Simulation of premixed turbulent combustion using approximate deconvolution and explicit flame filtering. Proceedings of the Combustion Institute 2015, 35, 1349–1357. [Google Scholar] [CrossRef]
- Domingo, P.; Vervisch, L. DNS and approximate deconvolution as a tool to analyse one-dimensional filtered flame sub-grid scale modelling. Combustion and Flame 2017, 177, 109–122. [Google Scholar] [CrossRef]
- W. Zeng, K. Vogiatzaki, S. Navarro-Martinez, K.H. Luo, Modelling of Sub-Grid Scale Reaction Rate Based on a Novel Series Model: Application to a Premixed Bluff-Body Stabilised Flame, Combustion Science and Technology, (2019) 1-16.
- Sjunnesson, A.; Nelsson, C.; Max, E. LDA measurements of velocities and turbulence in a bluff body stabilized flame. Laser Anemometry 1991, 3, 83–90. [Google Scholar]
- Chen, Y.-C.; Peters, N.; Schneemann, G.; Wruck, N.; Renz, U.; Mansour, M.S. The detailed flame structure of highly stretched turbulent premixed methane-air flames. Combustion and flame 1996, 107, 223–IN222. [Google Scholar] [CrossRef]
- Schneider, C.; Dreizler, A.; Janicka, J.; Hassel, E. Flow field measurements of stable and locally extinguishing hydrocarbon-fuelled jet flames. Combustion and Flame 2003, 135, 185–190. [Google Scholar] [CrossRef]
- Fureby, C.; Tabor, G.; Weller, H.; Gosman, A. A comparative study of subgrid scale models in homogeneous isotropic turbulence. Physics of fluids 1997, 9, 1416–1429. [Google Scholar] [CrossRef]
- Knudsen, E.; Richardson, E.; Doran, E.; Pitsch, H.; Chen, J. Modeling scalar dissipation and scalar variance in large eddy simulation: Algebraic and transport equation closures. Physics of Fluids 2012, 24, 055103. [Google Scholar] [CrossRef]
- Navarro-Martinez, S.; Kronenburg, A. LES-CMC simulations of a turbulent bluff-body flame. Proceedings of the Combustion Institute 2007, 31, 1721–1728. [Google Scholar] [CrossRef]
- Branley, N.; Jones, W. Large eddy simulation of a turbulent non-premixed flame. Combustion and Flame 2001, 127, 1914–1934. [Google Scholar] [CrossRef]
- Weller, H.G.; Tabor, G.; Jasak, H.; Fureby, C. A tensorial approach to computational continuum mechanics using object-oriented techniques. Computers in physics 1998, 12, 620–631. [Google Scholar] [CrossRef]
- Masri, A.; Dibble, R.; Barlow, R. The structure of turbulent nonpremixed flames revealed by Raman-Rayleigh-LIF measurements. Progress in Energy and Combustion Science 1996, 22, 307–362. [Google Scholar] [CrossRef]
- R. Barlow, J. Frank. Effects of turbulence on species mass fractions in methane/air jet flames. In: editor^editors. Symposium (International) on Combustion; 1998: Elsevier. p. 1087-1095.
- Elbahloul, S.; Rigopoulos, S. Rate-Controlled Constrained Equilibrium (RCCE) simulations of turbulent partially premixed flames (Sandia D/E/F) and comparison with detailed chemistry. Combustion and Flame 2015, 162, 2256–2271. [Google Scholar] [CrossRef]
- Jones, W.; Prasad, V. Large Eddy Simulation of the Sandia Flame Series (D–F) using the Eulerian stochastic field method. Combustion and Flame 2010, 157, 1621–1636. [Google Scholar] [CrossRef]
- S.B. Pope, Turbulent flows, IOP Publishing2001.
- Kornev, N.; Hassel, E. Method of random spots for generation of synthetic inhomogeneous turbulent fields with prescribed autocorrelation functions. Communications in numerical methods in engineering 2007, 23, 35–43. [Google Scholar] [CrossRef]
- Kornev, N.; Hassel, E. Synthesis of homogeneous anisotropic divergence-free turbulent fields with prescribed second-order statistics by vortex dipoles. Physics of Fluids 2007, 19, 068101. [Google Scholar] [CrossRef]
- N. Kornev, H. Kröger, J. Turnow, E. Hassel. Synthesis of artificial turbulent fields with prescribed second-order statistics using the random-spot method. In: editor^editors. PAMM: Proceedings in Applied Mathematics and Mechanics; 2007: Wiley Online Library. p. 2100047-2100048.
- Zettervall, N.; Nordin-Bates, K.; Nilsson, E.; Fureby, C. Large Eddy Simulation of a premixed bluff body stabilized flame using global and skeletal reaction mechanisms. Combustion and Flame 2017, 179, 1–22. [Google Scholar] [CrossRef]
- Jones, W.; Lindstedt, R. Global reaction schemes for hydrocarbon combustion. Combustion and flame 1988, 73, 233–249. [Google Scholar] [CrossRef]
- Mustata, R.; Valiño, L.; Jiménez, C.; Jones, W.; Bondi, S. A probability density function Eulerian Monte Carlo field method for large eddy simulations: application to a turbulent piloted methane/air diffusion flame (Sandia D). Combustion and Flame 2006, 145, 88–104. [Google Scholar] [CrossRef]
- Jaravel, T.; Riber, E.; Cuenot, B.; Pepiot, P. Prediction of flame structure and pollutant formation of Sandia flame D using Large Eddy Simulation with direct integration of chemical kinetics. Combustion and Flame 2018, 188, 180–198. [Google Scholar] [CrossRef]
- Zhao, W. Large-eddy simulation of piloted diffusion flames using multi-environment probability density function models. Proceedings of the Combustion Institute 2017, 36, 1705–1712. [Google Scholar] [CrossRef]
- Vreman, A.; Albrecht, B.; Van Oijen, J.; De Goey, L.; Bastiaans, R. Premixed and nonpremixed generated manifolds in large-eddy simulation of Sandia flame D and F. Combustion and Flame 2008, 153, 394–416. [Google Scholar] [CrossRef]
- Vreman, A.; Van Oijen, J.; De Goey, L.; Bastiaans, R. Subgrid scale modeling in large-eddy simulation of turbulent combustion using premixed flamelet chemistry. Flow, Turbulence and Combustion 2009, 82, 511–535. [Google Scholar] [CrossRef]
- Ihme, M.; Pitsch, H. Prediction of extinction and reignition in nonpremixed turbulent flames using a flamelet/progress variable model: 2. Application in LES of Sandia flames D and E. Combustion and flame 2008, 155, 90–107. [Google Scholar] [CrossRef]
- Ihme, M.; Pitsch, H. Modeling of radiation and nitric oxide formation in turbulent nonpremixed flames using a flamelet/progress variable formulation. Physics of Fluids 2008, 20, 055110. [Google Scholar] [CrossRef]
- Raman, V.; Pitsch, H. A consistent LES/filtered-density function formulation for the simulation of turbulent flames with detailed chemistry. Proceedings of the Combustion Institute 2007, 31, 1711–1719. [Google Scholar] [CrossRef]
- Garmory, A.; Mastorakos, E. Capturing localised extinction in Sandia Flame F with LES–CMC. Proceedings of the Combustion Institute 2011, 33, 1673–1680. [Google Scholar] [CrossRef]
- Ge, Y.; Cleary, M.; Klimenko, A. Sparse-Lagrangian FDF simulations of Sandia Flame E with density coupling. Proceedings of the Combustion Institute 2011, 33, 1401–1409. [Google Scholar] [CrossRef]
- Ge, Y.; Cleary, M.; Klimenko, A. A comparative study of Sandia flame series (D–F) using sparse-Lagrangian MMC modelling. Proceedings of the Combustion Institute 2013, 34, 1325–1332. [Google Scholar] [CrossRef]
- Cleary, M.; Klimenko, A.; Janicka, J.; Pfitzner, M. A sparse-Lagrangian multiple mapping conditioning model for turbulent diffusion flames. Proceedings of the Combustion Institute 2009, 32, 1499–1507. [Google Scholar] [CrossRef]
- Lysenko, D.A.; Ertesvåg, I.S.; Rian, K.E. Numerical simulations of the sandia flame d using the eddy dissipation concept. Flow, turbulence and combustion 2014, 93, 665–687. [Google Scholar] [CrossRef]
- Pitsch, H.; Steiner, H. Large-eddy simulation of a turbulent piloted methane/air diffusion flame (Sandia flame D). Physics of fluids 2000, 12, 2541–2554. [Google Scholar] [CrossRef]
- Sheikhi, M.; Drozda, T.; Givi, P.; Jaberi, F.; Pope, S. Large eddy simulation of a turbulent nonpremixed piloted methane jet flame (Sandia Flame D). Proceedings of the Combustion Institute 2005, 30, 549–556. [Google Scholar] [CrossRef]
- Navarro-Martinez, S.; Kronenburg, A.; Di Mare, F. Conditional moment closure for large eddy simulations. Flow, Turbulence and Combustion 2005, 75, 245–274. [Google Scholar] [CrossRef]
- Roomina, M.; Bilger, R. Conditional moment closure (CMC) predictions of a turbulent methane-air jet flame. Combustion and Flame 2001, 125, 1176–1195. [Google Scholar] [CrossRef]
- Dodoulas, I.; Navarro-Martinez, S. Large eddy simulation of premixed turbulent flames using the probability density function approach. Flow, turbulence and combustion 2013, 90, 645–678. [Google Scholar] [CrossRef]
- Pitsch, H.; De Lageneste, L.D. Large-eddy simulation of premixed turbulent combustion using a level-set approach. Proceedings of the Combustion Institute 2002, 29, 2001–2008. [Google Scholar] [CrossRef]
- L.D. de Lageneste, H. Pitsch, A level-set approach to large eddy simulation of premixed turbulent combustion, CTR Annual Research Briefs, (2000).
- Knudsen, E.; Pitsch, H. A dynamic model for the turbulent burning velocity for large eddy simulation of premixed combustion. Combustion and flame 2008, 154, 740–760. [Google Scholar] [CrossRef]
- De, A.; Acharya, S. Large eddy simulation of a premixed Bunsen flame using a modified thickened-flame model at two Reynolds number. Combustion Science and Technology 2009, 181, 1231–1272. [Google Scholar] [CrossRef]
- De, A.; Acharya, S. Large eddy simulation of premixed combustion with a thickened-flame approach. Journal of Engineering for Gas Turbines and Power 2009, 131, 061501. [Google Scholar] [CrossRef]
- Langella, I.; Swaminathan, N.; Gao, Y.; Chakraborty, N. Assessment of dynamic closure for premixed combustion large eddy simulation. Combustion Theory and Modelling 2015, 19, 628–656. [Google Scholar] [CrossRef]
- Langella, I.; Swaminathan, N.; Gao, Y.; Chakraborty, N. Large eddy simulation of premixed combustion: Sensitivity to subgrid scale velocity modeling. Combustion Science and Technology 2017, 189, 43–78. [Google Scholar] [CrossRef]
- Langella, I.; Swaminathan, N. Unstrained and strained flamelets for LES of premixed combustion. Combustion Theory and Modelling 2016, 20, 410–440. [Google Scholar] [CrossRef]
- Wang, G.; Boileau, M.; Veynante, D. Implementation of a dynamic thickened flame model for large eddy simulations of turbulent premixed combustion. Combustion and Flame 2011, 158, 2199–2213. [Google Scholar] [CrossRef]
- Lindstedt, R.; Vaos, E. Transported PDF modeling of high-Reynolds-number premixed turbulent flames. Combustion and Flame 2006, 145, 495–511. [Google Scholar] [CrossRef]
- Stöllinger, M.; Heinz, S. PDF modeling and simulation of premixed turbulent combustion. Monte Carlo Methods and Applications 2008, 14, 343–377. [Google Scholar] [CrossRef]
- Schneider, E.; Sadiki, A.; Janicka, J. Modeling and 3D-simulation of the kinetic effects in the post-flame region of turbulent premixed flames based on the G-equation approach. Flow, turbulence and combustion 2005, 75, 191. [Google Scholar] [CrossRef]
- Lindstedt, R.; Milosavljevic, V.; Persson, M. Turbulent burning velocity predictions using transported PDF methods. Proceedings of the Combustion Institute 2011, 33, 1277–1284. [Google Scholar] [CrossRef]
- Knudsen, E.; Pitsch, H. Modeling partially premixed combustion behavior in multiphase LES. Combustion and Flame 2015, 162, 159–180. [Google Scholar] [CrossRef]
- Kolla, H.; Swaminathan, N. Strained flamelets for turbulent premixed flames II: Laboratory flame results. Combustion and Flame 2010, 157, 1274–1289. [Google Scholar] [CrossRef]
- Ihme, M.; Shunn, L.; Zhang, J. Regularization of reaction progress variable for application to flamelet-based combustion models. Journal of Computational Physics 2012, 231, 7715–7721. [Google Scholar] [CrossRef]
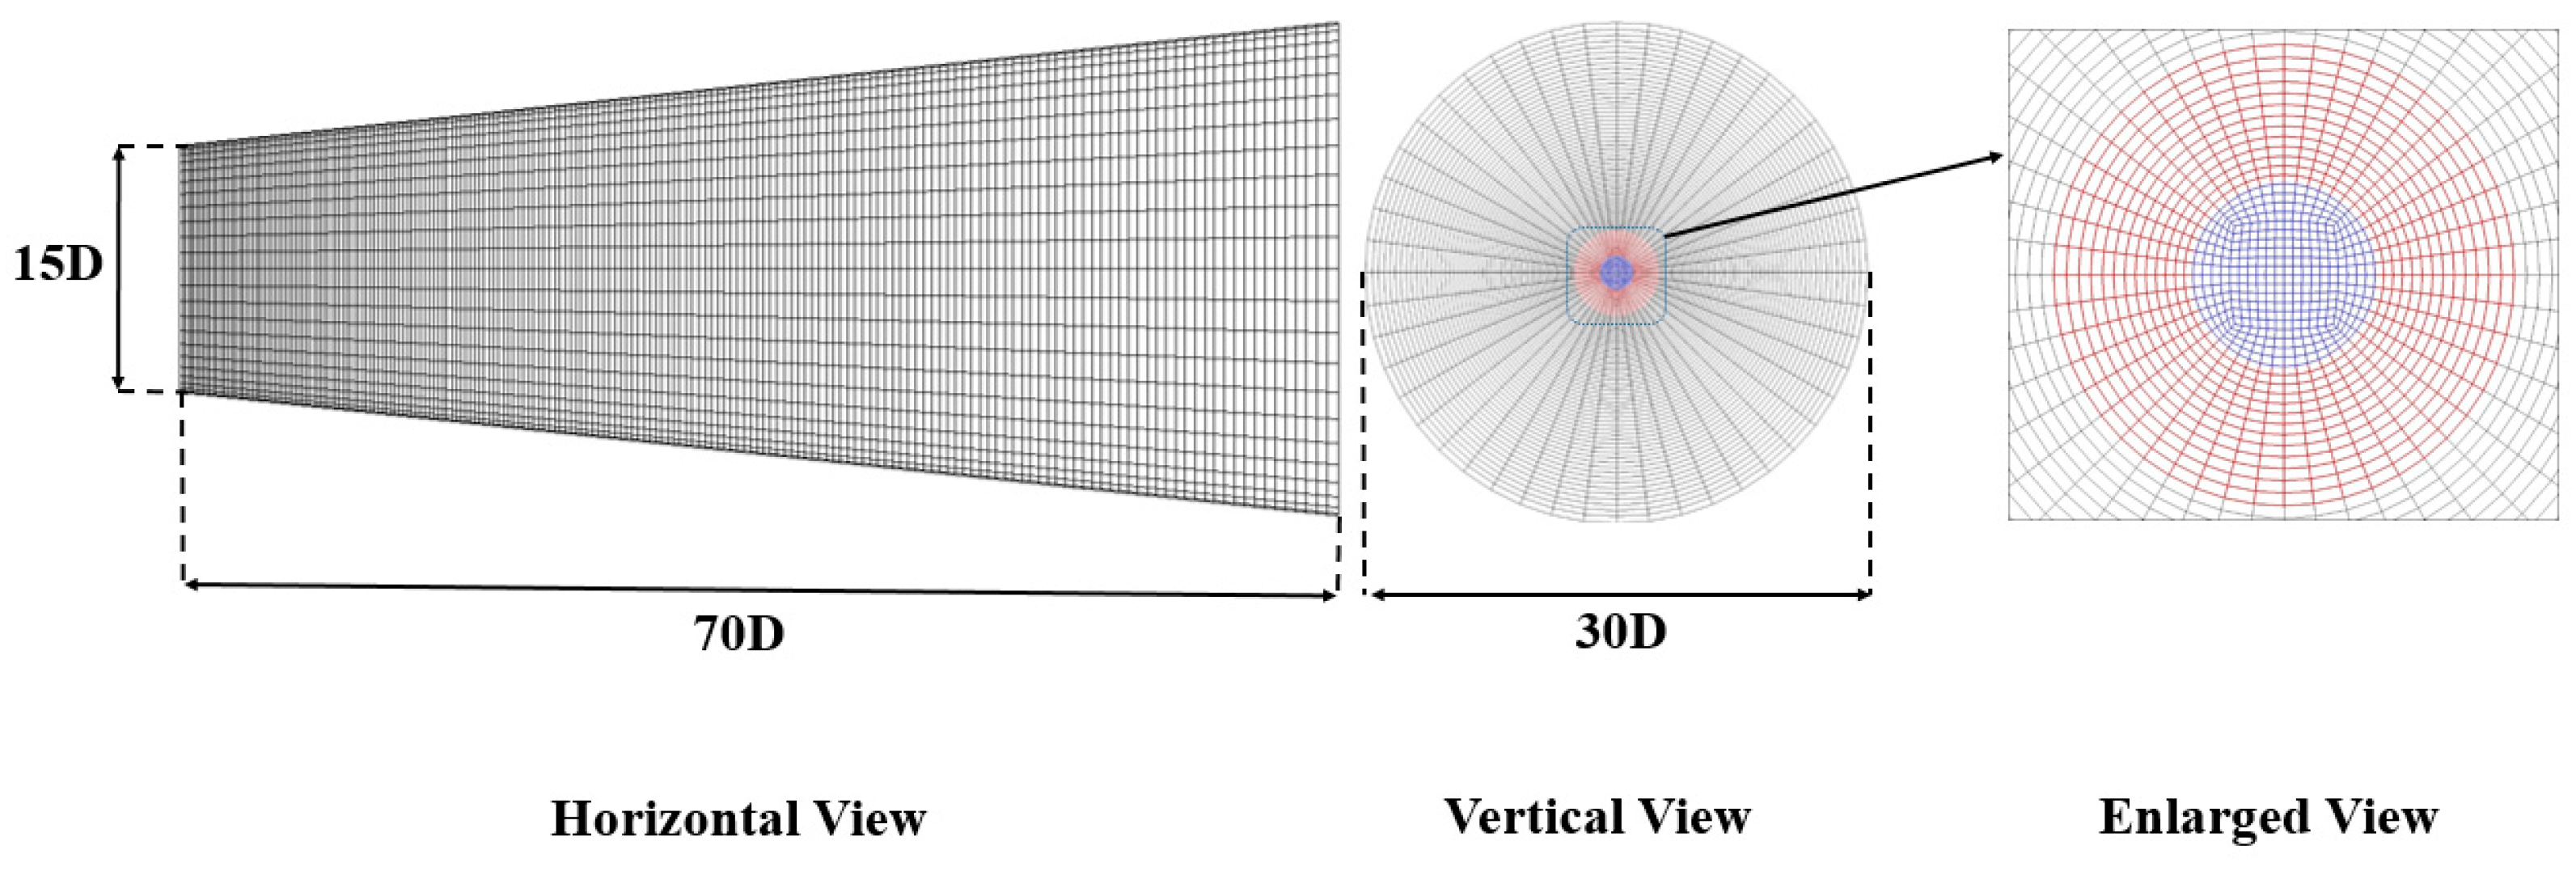
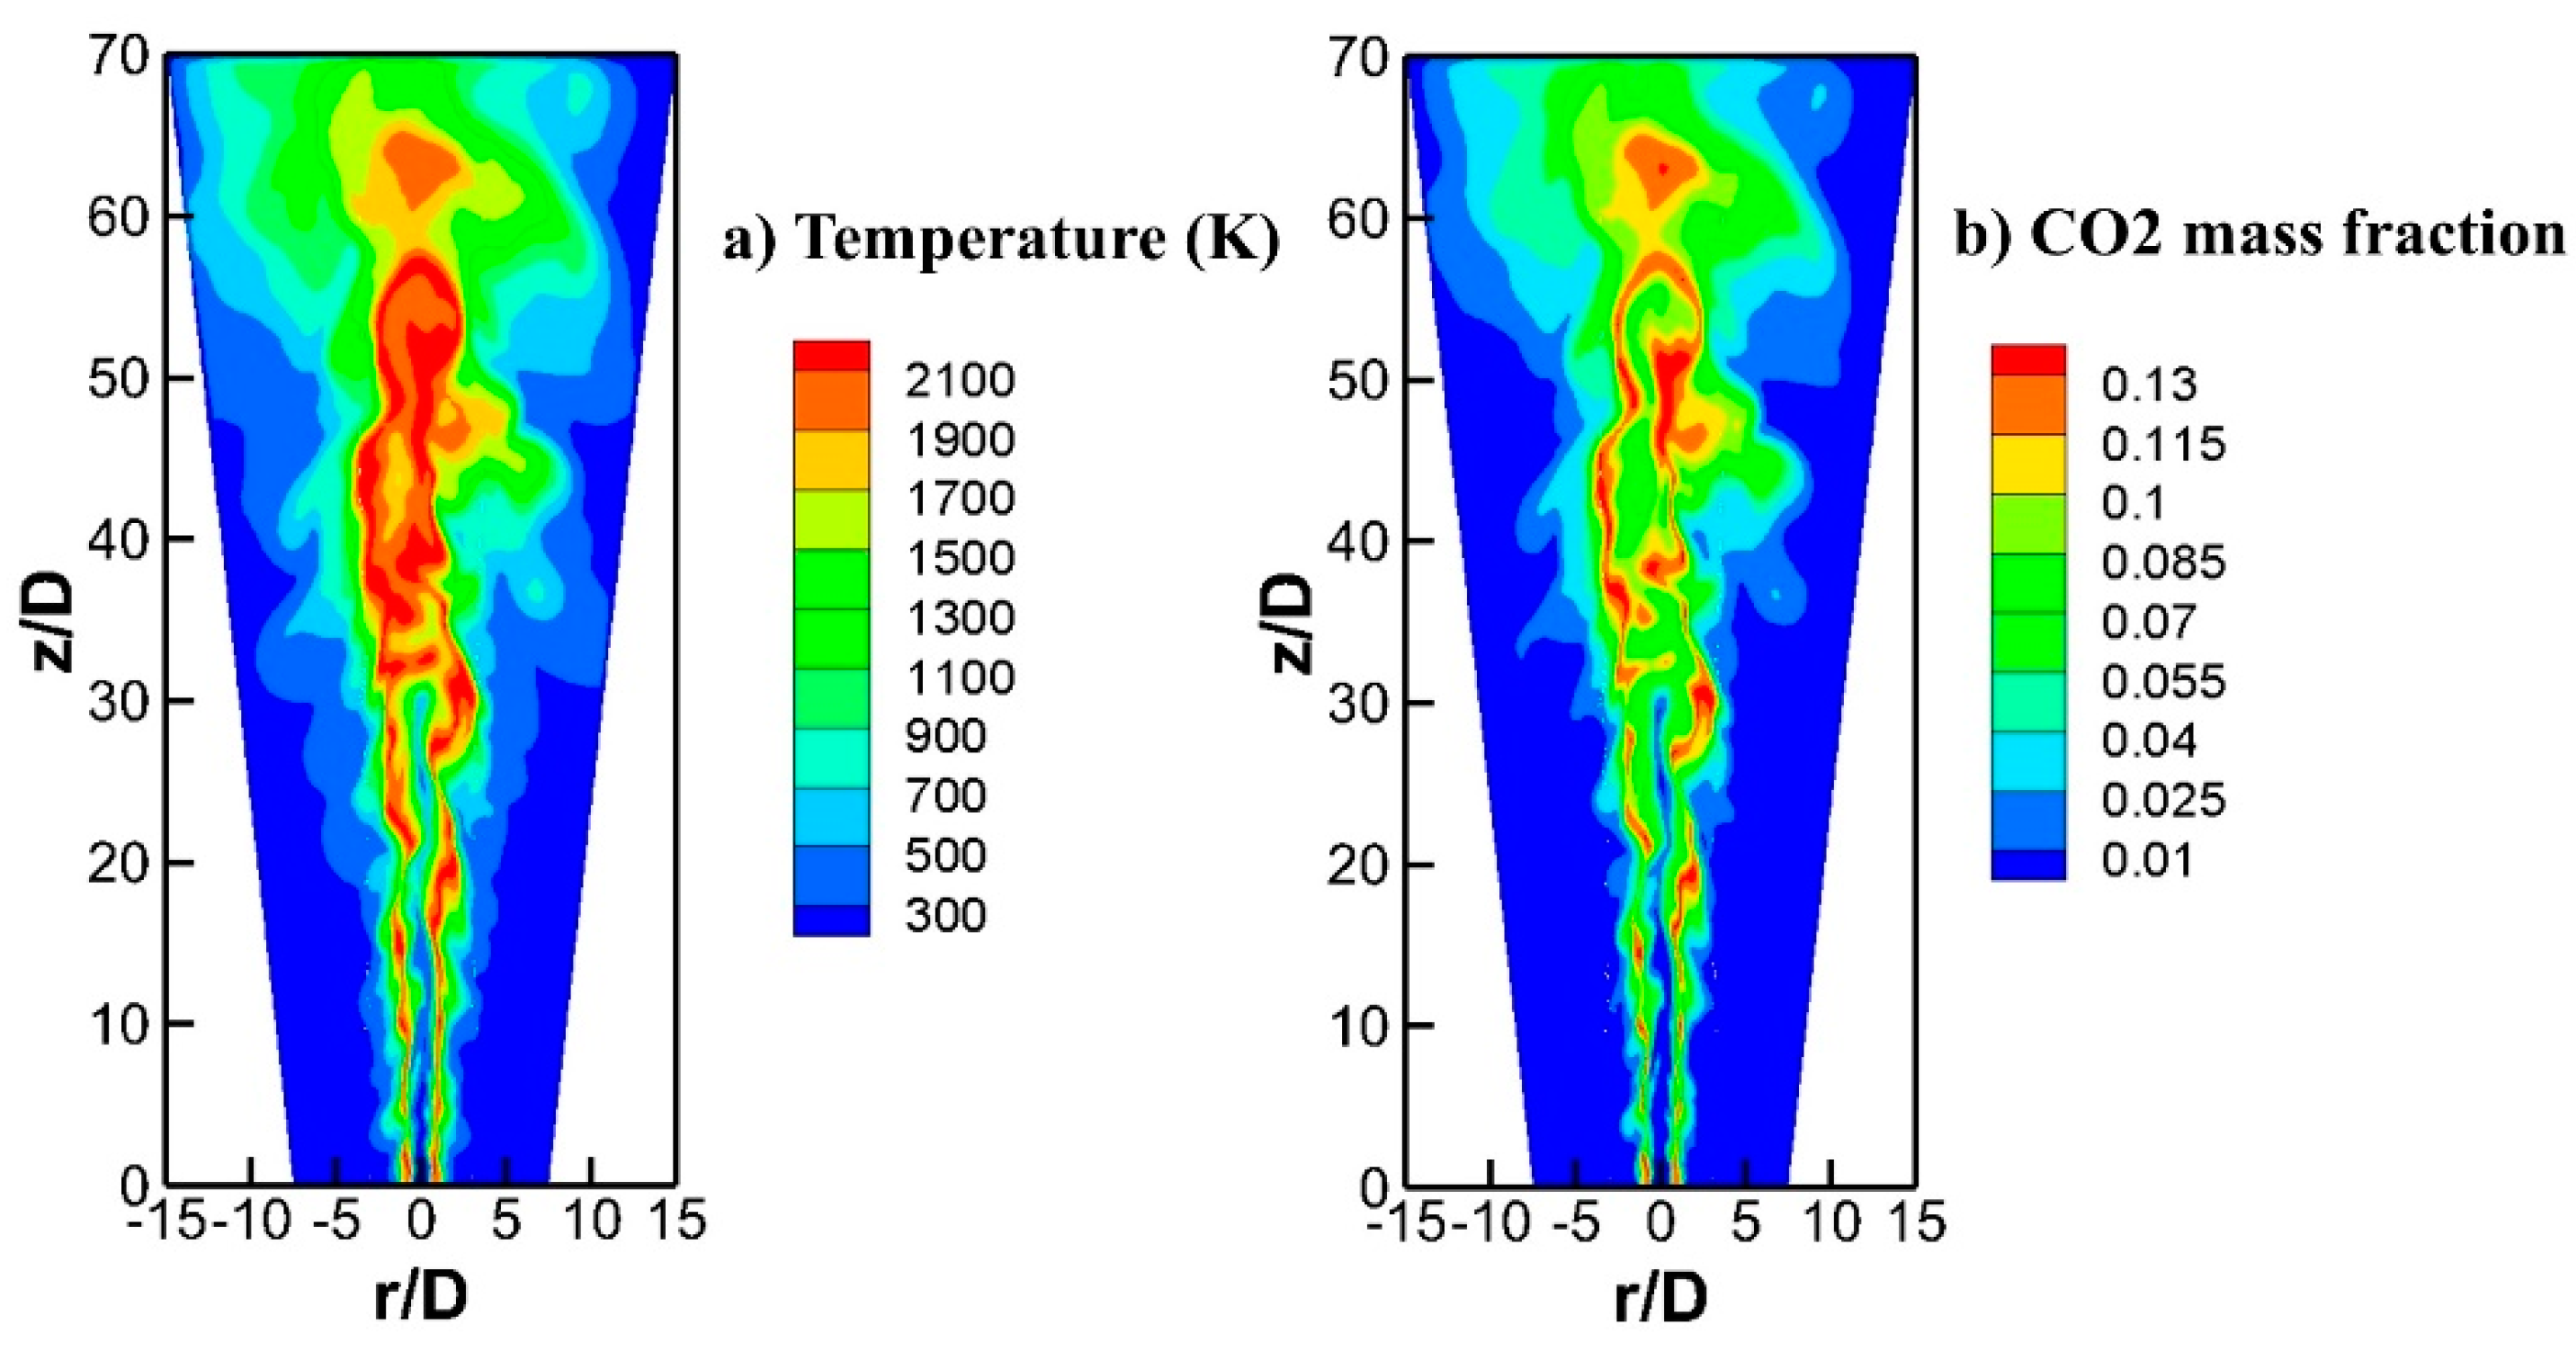
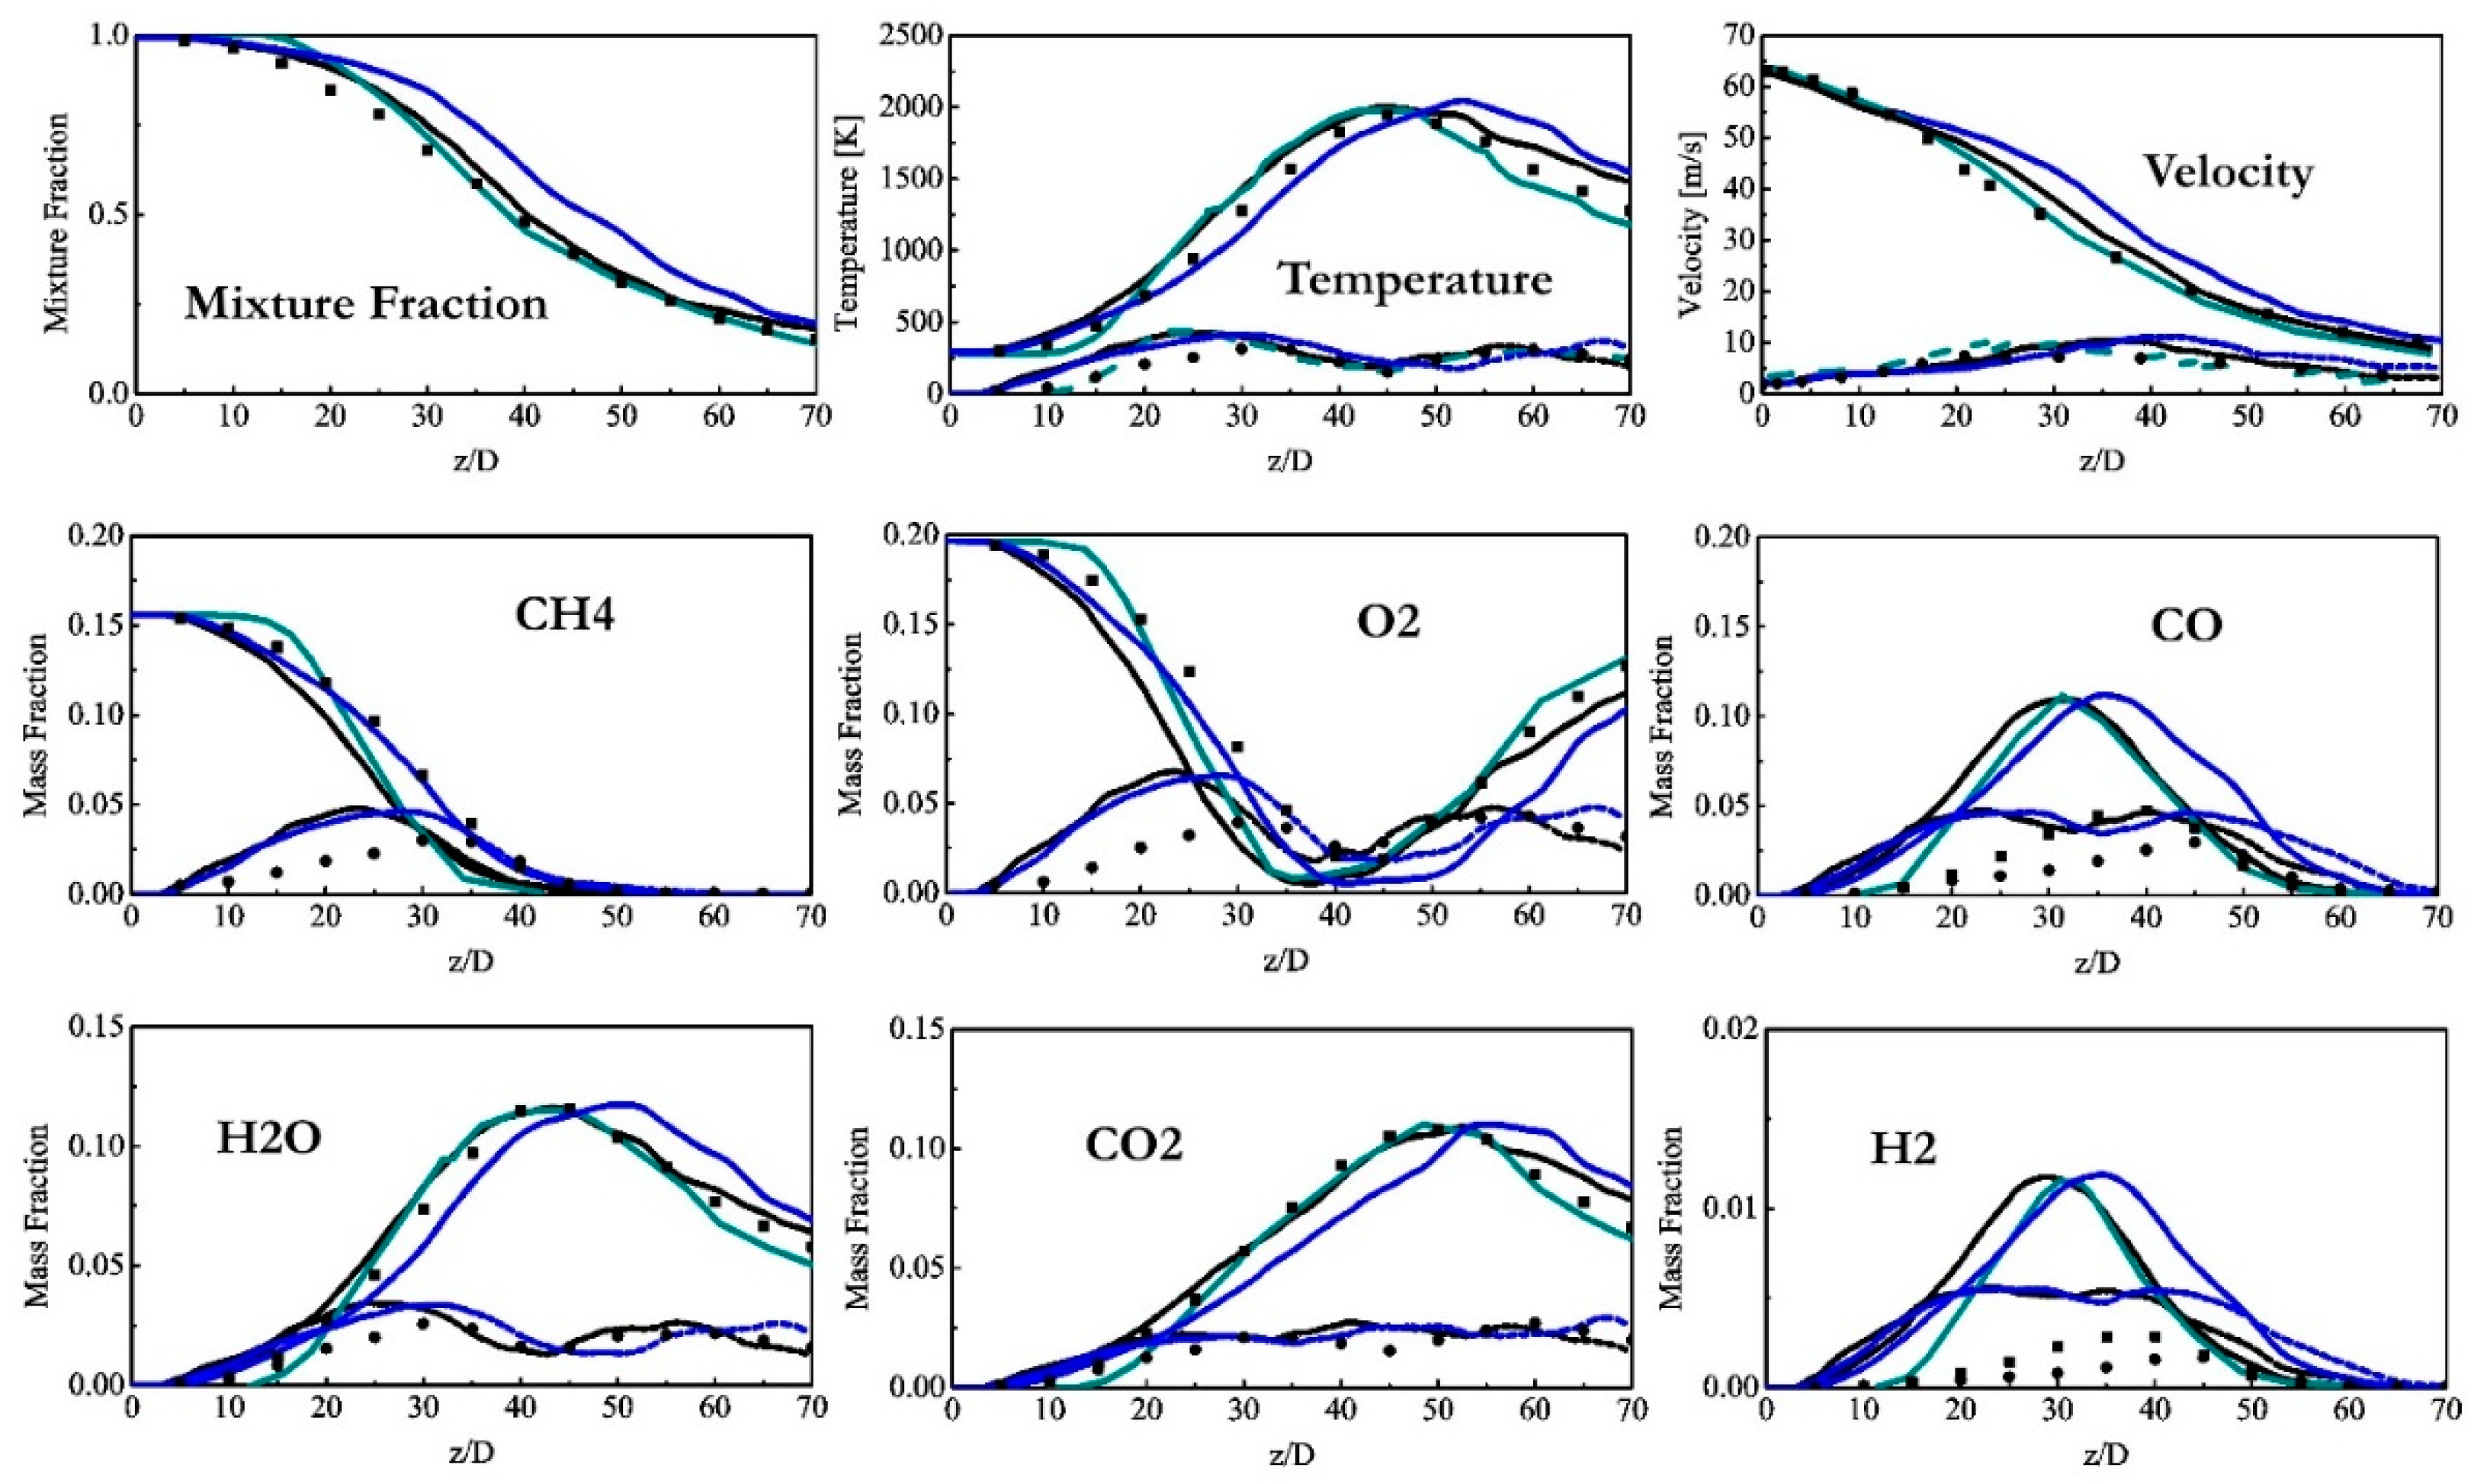
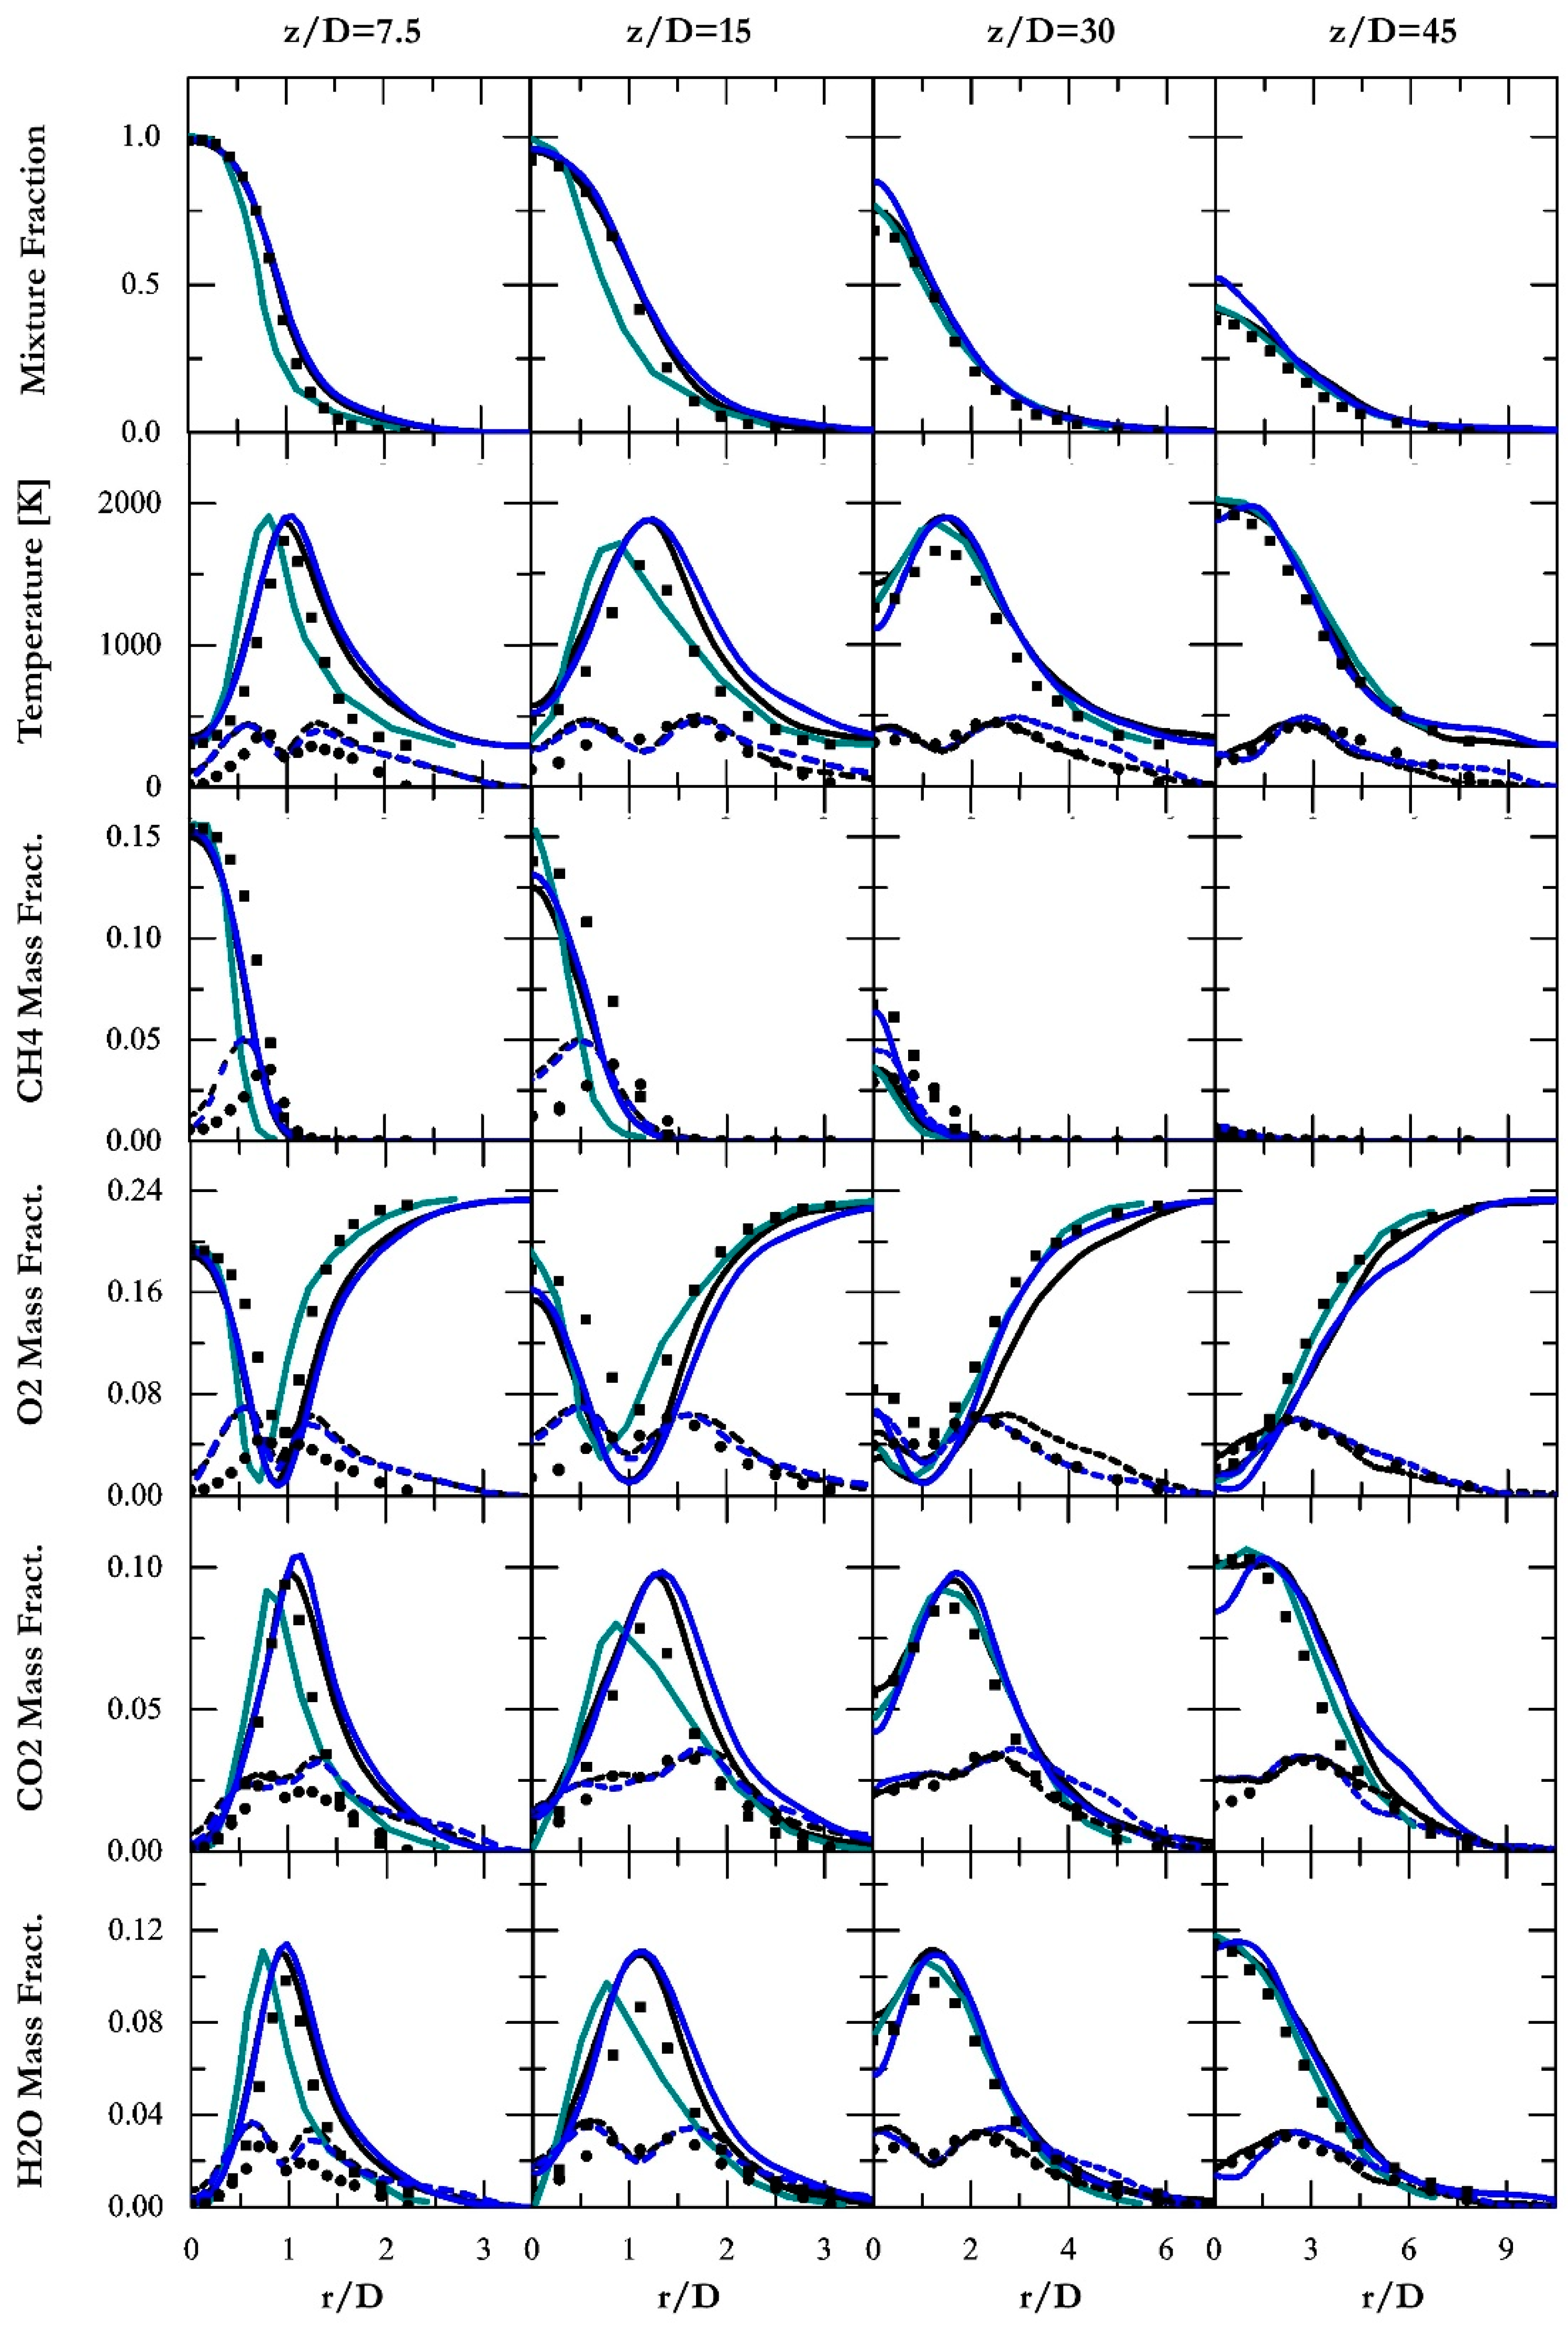

| Research | Turbulent SGS closures | Turbulent reacting LES closures | Simulation domain | Grid resolution | Chemistry mechanism |
|---|---|---|---|---|---|
| Current study | Dynamic Eddy viscosity model | Series model | (15~30D) × 2π× 70D | Fine: 71 × 48 × 210 + 12 × 12 × 210 Coarse: 52 × 36 × 139+ 9 × 9 × 139 (Polar coordinates + o-grid) | Jones- Lindstedt 4-step mechanism |
| [43] | Eddy viscosity model | Eulerian stochastic field method | 40D× 40D× 84D | 68 × 68 × 106 (Cartesian coordinates) | Jones- Lindstedt 4-step mechanism |
| [44] | SIGMA eddy viscosity model | Direct integration of reduced chemical kinetics | 40D× 40D× 138D | 375 million tetrahedral elements (unstructured meshes) | GRI 2.0 and 3.0 |
| [45] | Dynamic Smagorinsky | Multi-environment PDF model | (8~44D) × 2π× 80D | 101 × 64 × 197 (cylindrical coordinates) | Reduced GRI 3.0 |
| [46,47] | Eddy-viscosity model |
Presumed β-pdf and Thickened flame approach |
40D× 40D× 150D | 128 × 128 × 320 (Cartesian coordinates) | GRI 3.0 |
| [48,49] | Dynamic Smagorinsky | Extended flamelet/progress variable model | 26.5D× 2π × 80D | 160× 64× 256 (cylindrical coordinates) | GRI 2.11 |
| [36] | Smagorinsky | Eulerian stochastic field method | 20D× 20D× 50D | 81 × 81 × 160 (Cartesian coordinates) | Augmented reduced Mechanism of GRI3.0 |
| [50] | Dynamic Smagorinsky | Lagrangian filtered-density approach | 20D× 2π × 80D | 256 × 128 × 32 (cylindrical coordinates) | GRI-2.11 |
| [51] | Dynamic Smagorinsky | Conditional Moment Closure | 20D× 20D× 80D | 1.3M nodes (CMC grids) | ARM2 chemistry |
| [52,53,54] | Dynamic Smagorinksy | Hybrid Eulerian LES/sparse-Lagrangian MMC model | 35D× 2π × 35D | 512 × 55 × 32 (cylindrical coordinates) | GRI-3.0 |
| [55] | One equation eddy viscosity | Eddy Dissipation Concept | 21D× 2π × 73D | 240 × 60 × 90 (cylindrical coordinates) | GRI3.0 and Single Step mechanism |
| [56] | Smagorinsky | Lagrangian Flamelet Model | 15D× 2π × 80D | 110× 48× 192 (cylindrical coordinates) | GRI 2.11 |
| [57] | Modified kinetic energy viscosity model | Flamelet model | 15D× 15D× 80D | 101 × 101 × 91 (Cartesian coordinates) | GRI 2.11 |
| [58] | Smagorinsky | Conditional Moment Closure | 8D× 8D× 80D | 96 × 96 × 320 (Cartesian coordinates) | Detailed mechanism by Meyer |
| Research | Turbulent SGS closures | Turbulent reacting LES closures | Simulation domain | Grid resolution | Chemistry mechanism |
|---|---|---|---|---|---|
| Current | Dynamic eddy viscosity model | Series model | 12H× 2π× 30H | Fine: 69 × 48 × 200 +12 × 12 × 200 Coarse: 49 × 36 × 134+9 × 9 × 134 (Polar coordinates +o-grid) |
Jones and Lindstedt 4-step mechanism |
| [22,23] | Vreman model | Artificially thickened flame | 8H×8H×16H | 194 × 194 × 306 (Cartesian coordinates) | GRI 3.0 |
| [61,62] | Smagorinsky | G-field | 4H×4H×20H | 64×64 × 296 (Cartesian coordinates) | GRI-MECH 2.11 |
| [63] | Germano model | G-field and dynamic propagation model | 6H×6H×30H | 117 × 64 × 323 (cylindrical coordinates) | |
| [60] | Smagorinsky | Eulerian stochastic fields | 5H×5H×15H | 56 × 36 × 112 (Cartesian coordinates) | ARM for NO |
| [64,65] | Dynamic Smagorinsky | Artificially thickened flame | 4H×2π ×20H | 94× 64× 300 (cylindrical coordinates) | A 2-step mechanism |
| [66,67,68] | Smagorinsky | Dynamic modelling and Assumed PDF | 20H×20H×40H | 1.5 minion cells (Cartesian coordinates) | Augmented reduced of GRI3.0 |
| [69] | Dynamic Smagorinsky | Dynamic thickened flame | 40H×40H×120H | Unstructured meshes | A single-step mechanism |
| [6] | Smagorinsky | Dynamic thickened flame model | 40H×40H×120H | Unstructured meshes | A 2-step mechanism |
| [70] | Second momentclosures | Transported pdf | 4H×4H×12.5H (at least) | Lagrangian particle grids | Lindstedt reduced mechanism |
| [71] | Linear stress model | Pdf method | 6.5H×20H | 70 ×220 (2D simulation) | Drm22 |
| [72] | Smagorinsky | G-equation | 6H×6H×45H | 345,000 cells (cylindrical coordinates) | Schmidt mechanism |
Disclaimer/Publisher’s Note: The statements, opinions and data contained in all publications are solely those of the individual author(s) and contributor(s) and not of MDPI and/or the editor(s). MDPI and/or the editor(s) disclaim responsibility for any injury to people or property resulting from any ideas, methods, instructions or products referred to in the content. |
© 2023 by the authors. Licensee MDPI, Basel, Switzerland. This article is an open access article distributed under the terms and conditions of the Creative Commons Attribution (CC BY) license (https://creativecommons.org/licenses/by/4.0/).


