1. Introduction
With the gradual depletion of near-surface resources, deep underground mining has become a strategic development direction. Currently, underground coal mining has entered below a thousand meters, and the frequency and intensity of disasters in deep and complex geological environments have risen significantly, posing challenges to the safe exploitation of underground resources [
1]. Underground coal gasification (UCG) is a technology for controlled coal combustion located in underground reservoirs [
2], which dramatically improves the utilization of coal resources. During underground gasification of deep coal, the surrounding rock in the combustion cavity is exposed to a high-temperature environment, and this high-temperature effect may lead to damage and instability of the rock structure, which in turn affects the underground mining of coal [
3]. In addition, in nuclear waste disposal projects [
4], excavation of tunnels, geothermal energy recovery [
5], and reinforcement and restoration projects after rock fire [
6], the stability of the rock after high temperature is crucial.
Currently, the physical and mechanical properties of rocks under the action of high temperature mainly focus on the elastic wave velocity, mass loss, elastic modulus, compressive strength, peak strain, porosity, permeability [
7,
8,
9,
10]. Meng [
11] found that the permeability, initial mercury injection, porosity, and fractal dimension of the pore structure of sandstone increased with the increase in temperature, which was relatively slow before 500℃ and increased rapidly after exceeding 500℃. Alneasan [
12] investigated the effect of temperature on the fracture characteristics of granite under three loading modes and found that the fracture behavior was temperature-dependent and could be changed from brittle to ductile. Wang [
13] investigated the anisotropic mechanical behavior of oil shale from room temperature to 600°C using a real-time high-temperature test system.
The acoustic emission (AE) technique is a method for detecting defects such as microcracks within rocks under stress and has been widely used for testing rock samples [
14]. Rocks rapidly release elastic energy during crack expansion or deformation, generating transient pulses of elastic waves as AE events [
15]. Du [
16] obtained the influence laws on the strength properties and AE characteristics of rocks by analyzing the mineral composition and mineral grain size of rocks. Gao [
17] investigated the acoustic emission activity of sandstone under perturbed stress paths and explored the relationship between acoustic emission parameters and fractal dimensions for the spatial and temporal distribution of acoustic emission activity during rock damage. Wang [
18] conducted cyclic loading tests on granite and monitored the thermal damage evolution of the rock during the warming and cooling process in real-time by a specially designed acoustic emission testing system, and established a thermal damage evolution model considering both the warming and cooling processes and the numerical results are in good agreement with the experimental results.
While grasping the changing pattern of such physico-mechanical properties, it is also necessary to explain this pattern through microscopic mechanisms. Currently, the commonly used means are scanning electron microscopy (SEM) [
19], X-ray diffraction (XRD) [
20], and computed tomography (CT) [
21]. Tripathi [
22] explored the effect of high temperature on the microstructure, mineralogy, and physico-mechanical properties of the Barakar sandstone, which is one of the largest underground coal mine fire zones in the world, using scanning electron microscopy (SEM) and electron microprobe microanalysis. Based on the experimental results, the effect of temperature on the sandstone was categorized into three temperature zones. Using SEM and XRD, Sirdesai [
23] found that the compound effect of the creation of new cracks and pores and the chemical change of the mineral composition under the action of high temperatures led to the reduction of the strength of the rock. The chemical change of mineral composition is an important factor affecting the physical and mechanical properties of rocks, and for example, quartz transforms from α-quartz to β-quartz at 573°C, and then β-quartz to γ-quartz when the temperature reaches 870°C [
24]. Kaolinite will undergo a dehydroxylation reaction at 480-600°C, changing into the meta kaolinite phase, and at about 850-1000°C, the meta kaolinite phase transforms into the Al-Si spinel phase [
25].
In this paper, the effects of different temperatures (20-1200°C) on the physical properties (color, mass, volume, density, and elastic wave velocity) and mechanical properties (uniaxial compressive strength, peak strain, and modulus of elasticity) of sandstones are mainly investigated by using an acoustic emission testing system to analyze the damage information during uniaxial compression, and SEM investigates the changes in the microstructure. On this basis, the effect produced by the heating rate on the mechanical properties of sandstone is further discussed. Compared with the existing studies, the research on the micro-mechanism of sandstone thermal damage in this paper is more systematic, and the response characteristics of the macro-phenomenon and micro-mechanism are more in-depth.
2. Materials and Methodology
2.1. Test specimen
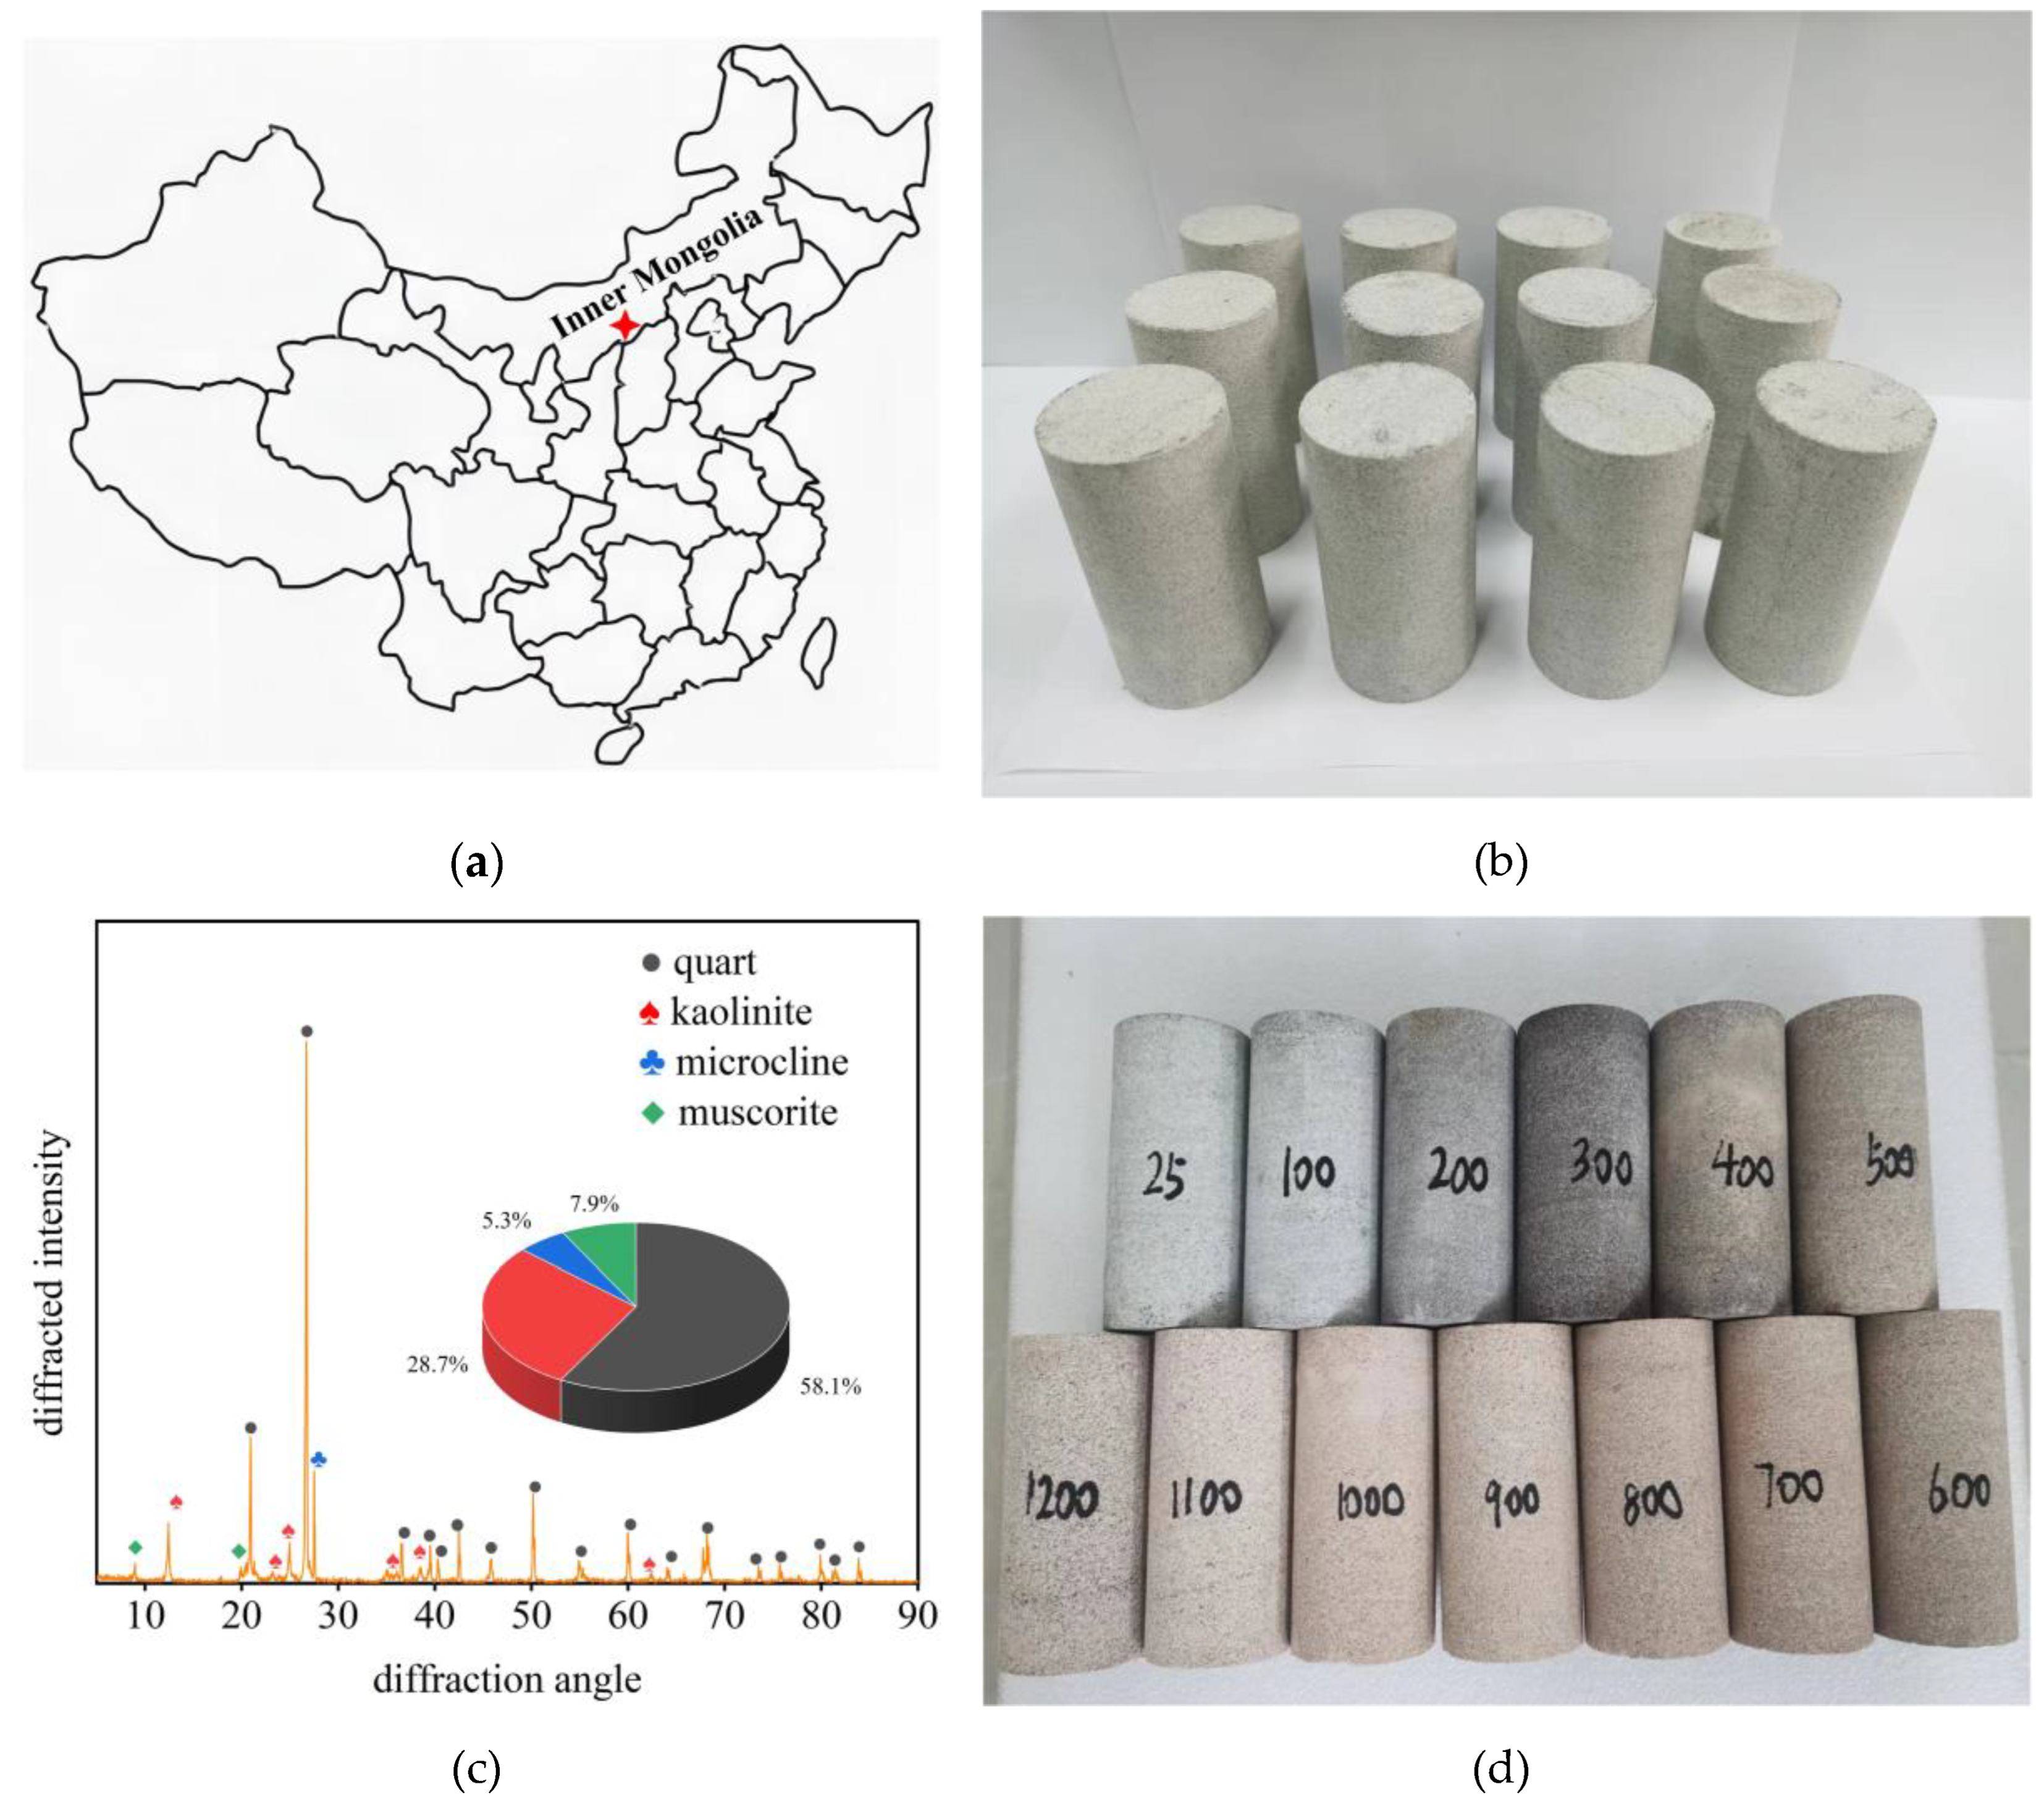
The sandstone used in this test was taken from Tangjiahui mining area, Ordos City, Inner Mongolia Autonomous Region. The X-ray diffraction results show that its main mineral components are quartz, kaolinite, microcline, and muscovite, accounting for 58.1%, 28.7%, 7.9%, and 5.3%, respectively. In order to reduce the test dispersion, all the samples were taken from the same whole rock, whose average density was 2.485g/cm3 at room temperature, and the elastic wave velocity was between 2.2-2.3km/s. According to the recommended method of the International Society for Rock Mechanics (ISRM), the sandstone was prepared as a standard cylindrical specimen with a size of ∅50 mm × 100 mm, and the sample was ground and polished to ensure the sample flatness (<0.05 mm) and parallelism (<0.02 mm), and the test is shown in
Figure 1.
2.2. Testing Equipment
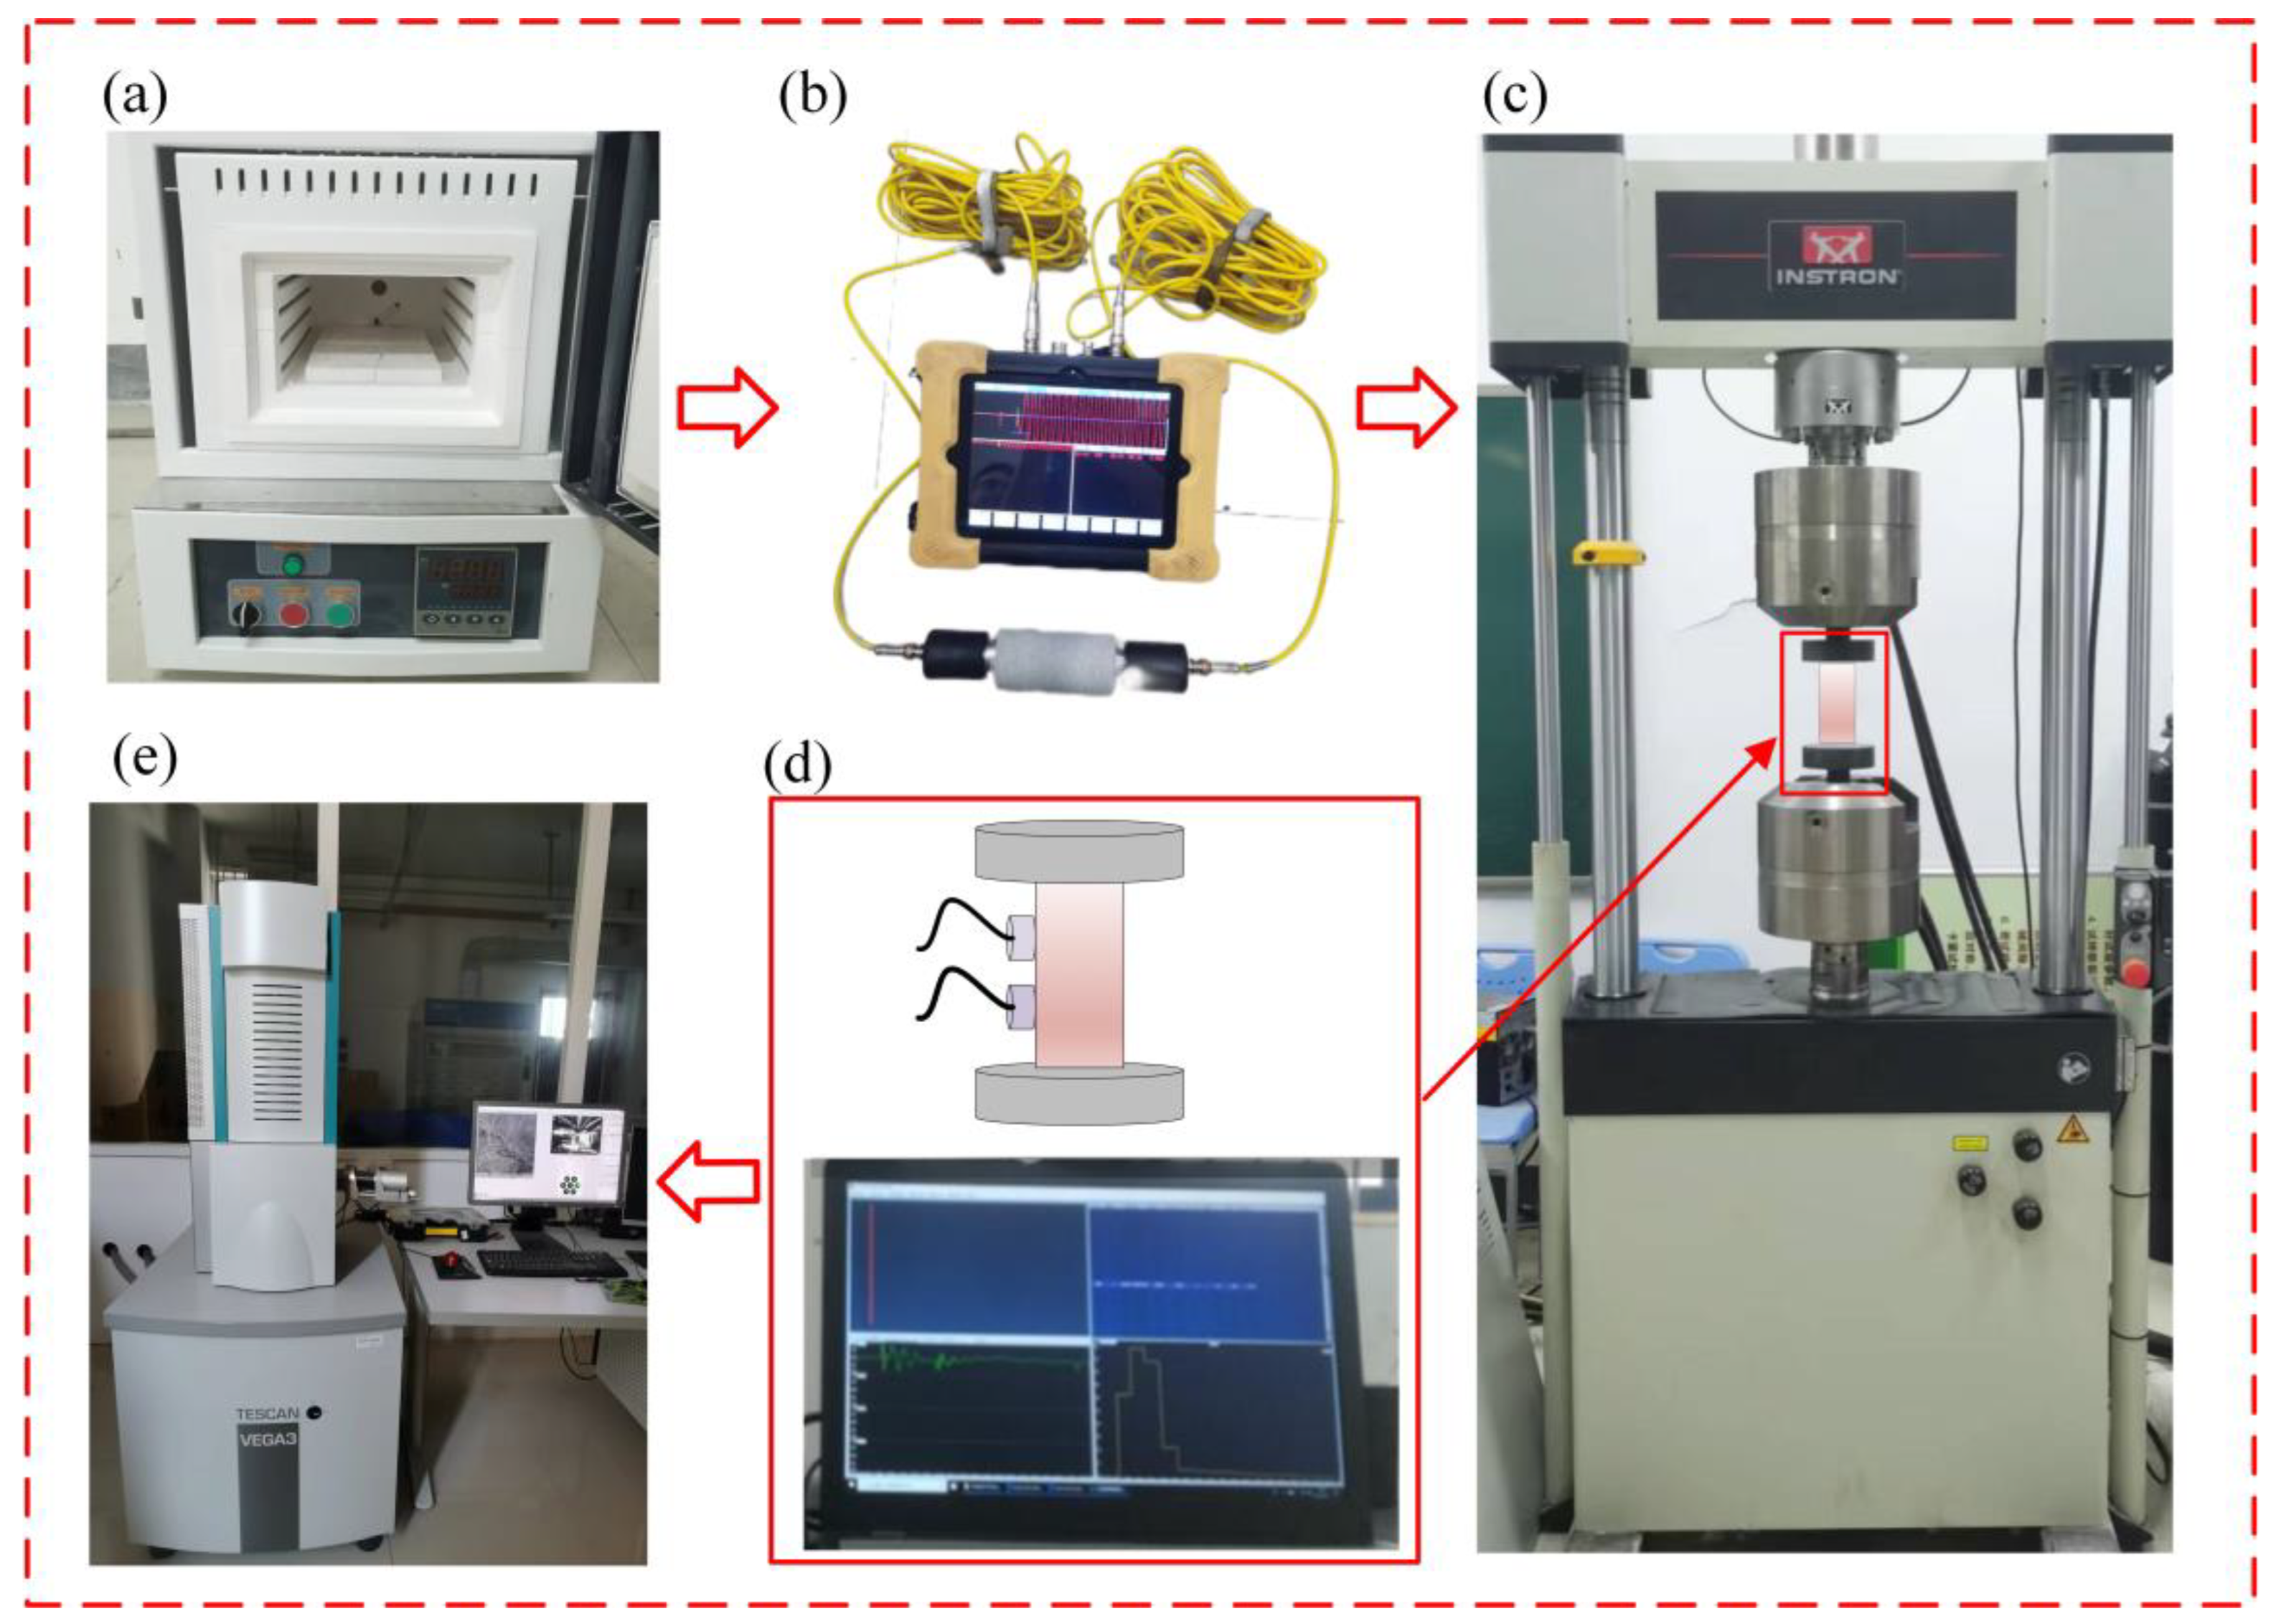
The sandstone specimen was heated by a high-temperature chamber furnace with a chamber size of 200×300×200 mm, a maximum temperature of 1200°C and a temperature control accuracy of ±1°C. Determination of elastic wave velocity of the specimen by ultrasonic wave velocity tester. The uniaxial loading system adopts INSTRON 8802 fatigue tester. At the same time, the acoustic emission data of the specimen is collected by the DS5-8B acoustic emission monitoring system, a piezoelectric ceramic transducer, and adopts the double probe acquisition method to ensure complete data collection. The changes in micro-morphology after high temperature were analyzed by TESCAN-VEGA3 scanning electron microscope. The whole test system is shown in
Figure 2.
2.3. Test Method
After the sandstone specimens were prepared, the specimens' diameter, height, mass, and elastic wave velocity before and after heating were measured using vernier calipers, electronic scales, and wave velocity meters. According to 100 ℃, 200℃, ......, 1200 ℃ sandstone specimens for group heating, each group of five samples, the heating rate of 10 ℃ / min, heating to the specified temperature to maintain a constant temperature for two hours after the natural cooling and cooling down, adding a group of room temperature (20 ℃) specimens a total of 13 temperature gradients, numbered C0, C1, ......, C12, respectively. In order to study the effect of heating rate on the mechanical properties of sandstone, the rock samples were heated up to 1200°C according to four heating rates of 5°C/min, 10°C/min, 20°C/min, and 30°C/min, and each group of the same five samples was kept at a constant temperature for two hours, and then naturally cooled down and cooled down, which were numbered as V5, V10, V20, and V30, respectively. The two sets of samples numbered C12 and V10 were warmed similarly, so the same sample data is used in the following. The uniaxial compression test was conducted in a displacement-controlled manner with a loading rate of 0.5 mm/min, and the acoustic emission characteristics of the damage process were monitored at the same time of loading. In order to minimize the noise of the environment, the preamplifier and the threshold of the acoustic emission system were set to 40 dB and 100 dB, respectively.
3. Test Result
3.1. Physical Property Change
Physical properties such as color, mass, volume, density, and elastic wave velocity of sandstone change after experiencing high temperatures.
Figure 1(d) shows the color change of sandstone after experiencing different temperatures. At room temperature, the sandstone is off-white, and at 100-200°C, the color is similar to room temperature, and the change is not apparent. A significant darkening of the color was observed between 300-600°C due to the combustion of organic matter. When the temperature increased to 700°C, the color changed to reddish brown, presumably because the sandstone contains hematite reduced to iron at high temperatures. However, according to the XRD results in
Figure 1(c), no hematite material was found at room temperature, probably because its small content of diffraction peaks is not obvious.
The mass, volume, density and elastic wave velocity of sandstone before and after high temperature were measured one by one, and four change rate indexes were defined: mass loss rate, volume expansion rate, density reduction rate and elastic wave velocity reduction rate. Specifically defined as follows:
In the equation: 、、、are the mass loss rate, volume expansion rate, density reduction rate and wave speed reduction rate of sandstone before and after high temperature, respectively; 、、、 are the mass, volume, density and elastic wave speed of sandstone before high temperature; 、、、 are the mass, volume, density and elastic wave speed of sandstone after high temperature.
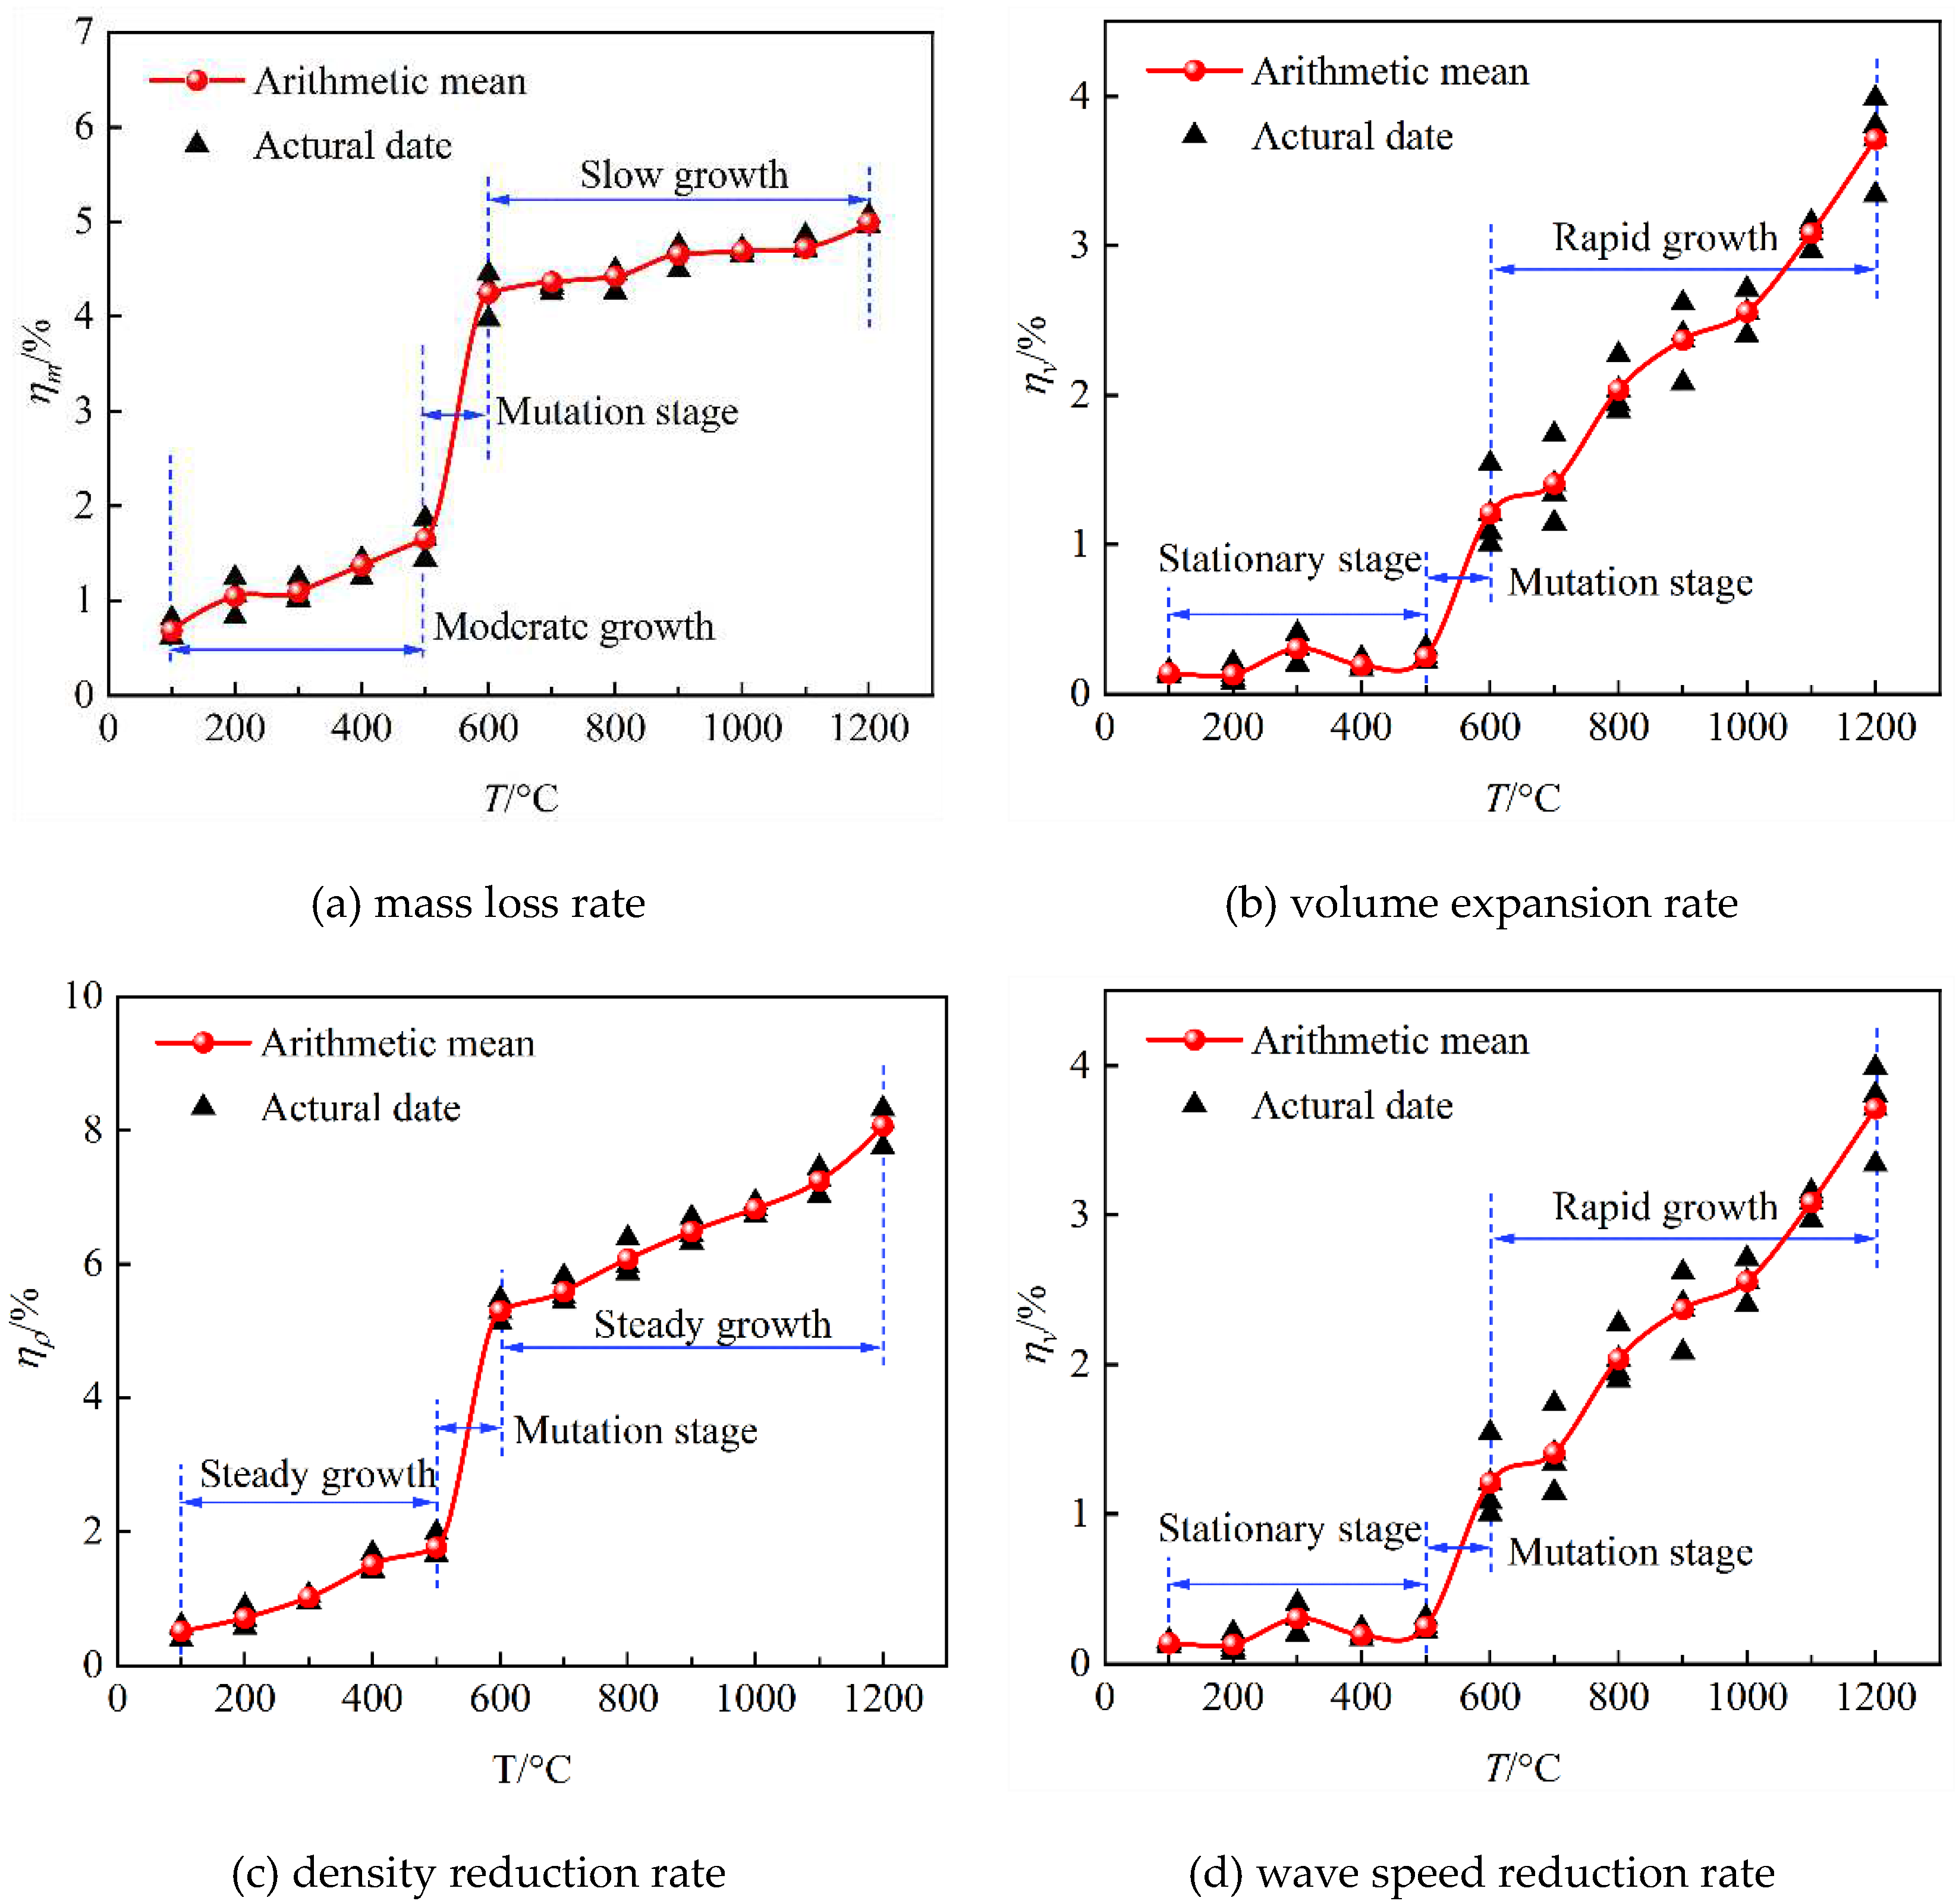
Figure 3 shows the variation of physical properties of sandstone at different temperatures.
Figure 3(a) reflects the variation of mass loss rate with temperature, which increases with increasing temperature. Before 500°C, the mass loss rate grows steadily, and the average value of mass loss rate is between 0.68% and 1.65%. The mass loss rate increases rapidly at 500-600°C, from 1.65% to 4.24%, an increase of 156.6%. After the heat treatment temperature of 600°C, the mass loss rate lies between 4.24%-4.99%, and the growth rate slows down.
Figure 3(b) reflects the change of volume expansion rate with temperature, and the change of volume expansion rate is not obvious before 500°C.The volume of sandstone expanded rapidly from 500-600°C, from 0.25% to 1.21%, and the volume expansion rate increased rapidly after 700°C, and the volume expansion rate under heat treatment at 1200°C reached 3.71%. Figure.3(c) shows the variation of density reduction rate of sandstone with temperature, which is similar to the trend of
Figure 3(a).
Figure 3(d) shows the variation of wave velocity reduction rate with temperature, the wave velocity reduction rate increases from 4.34% to 13.18% before 500 ℃, and the wave velocity reduction rate between 500 and 600 ℃ is 39.05% at 600 ℃, which is 196.28% compared with that at 500 ℃, and the wave velocity reduction rate increases to 62.21% at 1200 ℃.
It is summarized that the law of change of physical properties of sandstone with temperature is found to be mainly divided into three stages:
Stage Ⅰ (100-500℃): In this stage, the mass is steadily reduced due to the escape of water inside the sandstone [
26]; the internal primary pores are contracted, the volume expansion is not obvious, and the density is reduced; the elastic wave velocity is slowly reduced.
Stage II (500-600℃): This stage is the mutation stage. The main component of sandstone is quartz, which undergoes a phase change at 573℃, from - quart to - quart, with rapid expansion in volume, and accompanied by the combustion of organic matter and decomposition of carbonate, which is the main reason for the sudden change of sandstone mass, volume, density, and longitudinal and transversal wave speeds at this stage.
Stage III (600-1200°C). As the temperature rises the decomposition of white muscovite and kaolinite becomes more serious, the melting of the sandstone matrix and other reasons lead to a continued decrease in mass at this stage; uneven expansion of the mineral particles, the formation and expansion of microcracks, and accelerated expansion of the volume; and a rapid decrease in the elastic wave velocity.
3.2. Uniaxial Compression Test
3.2.1. Uniaxial compression full stress-strain curve
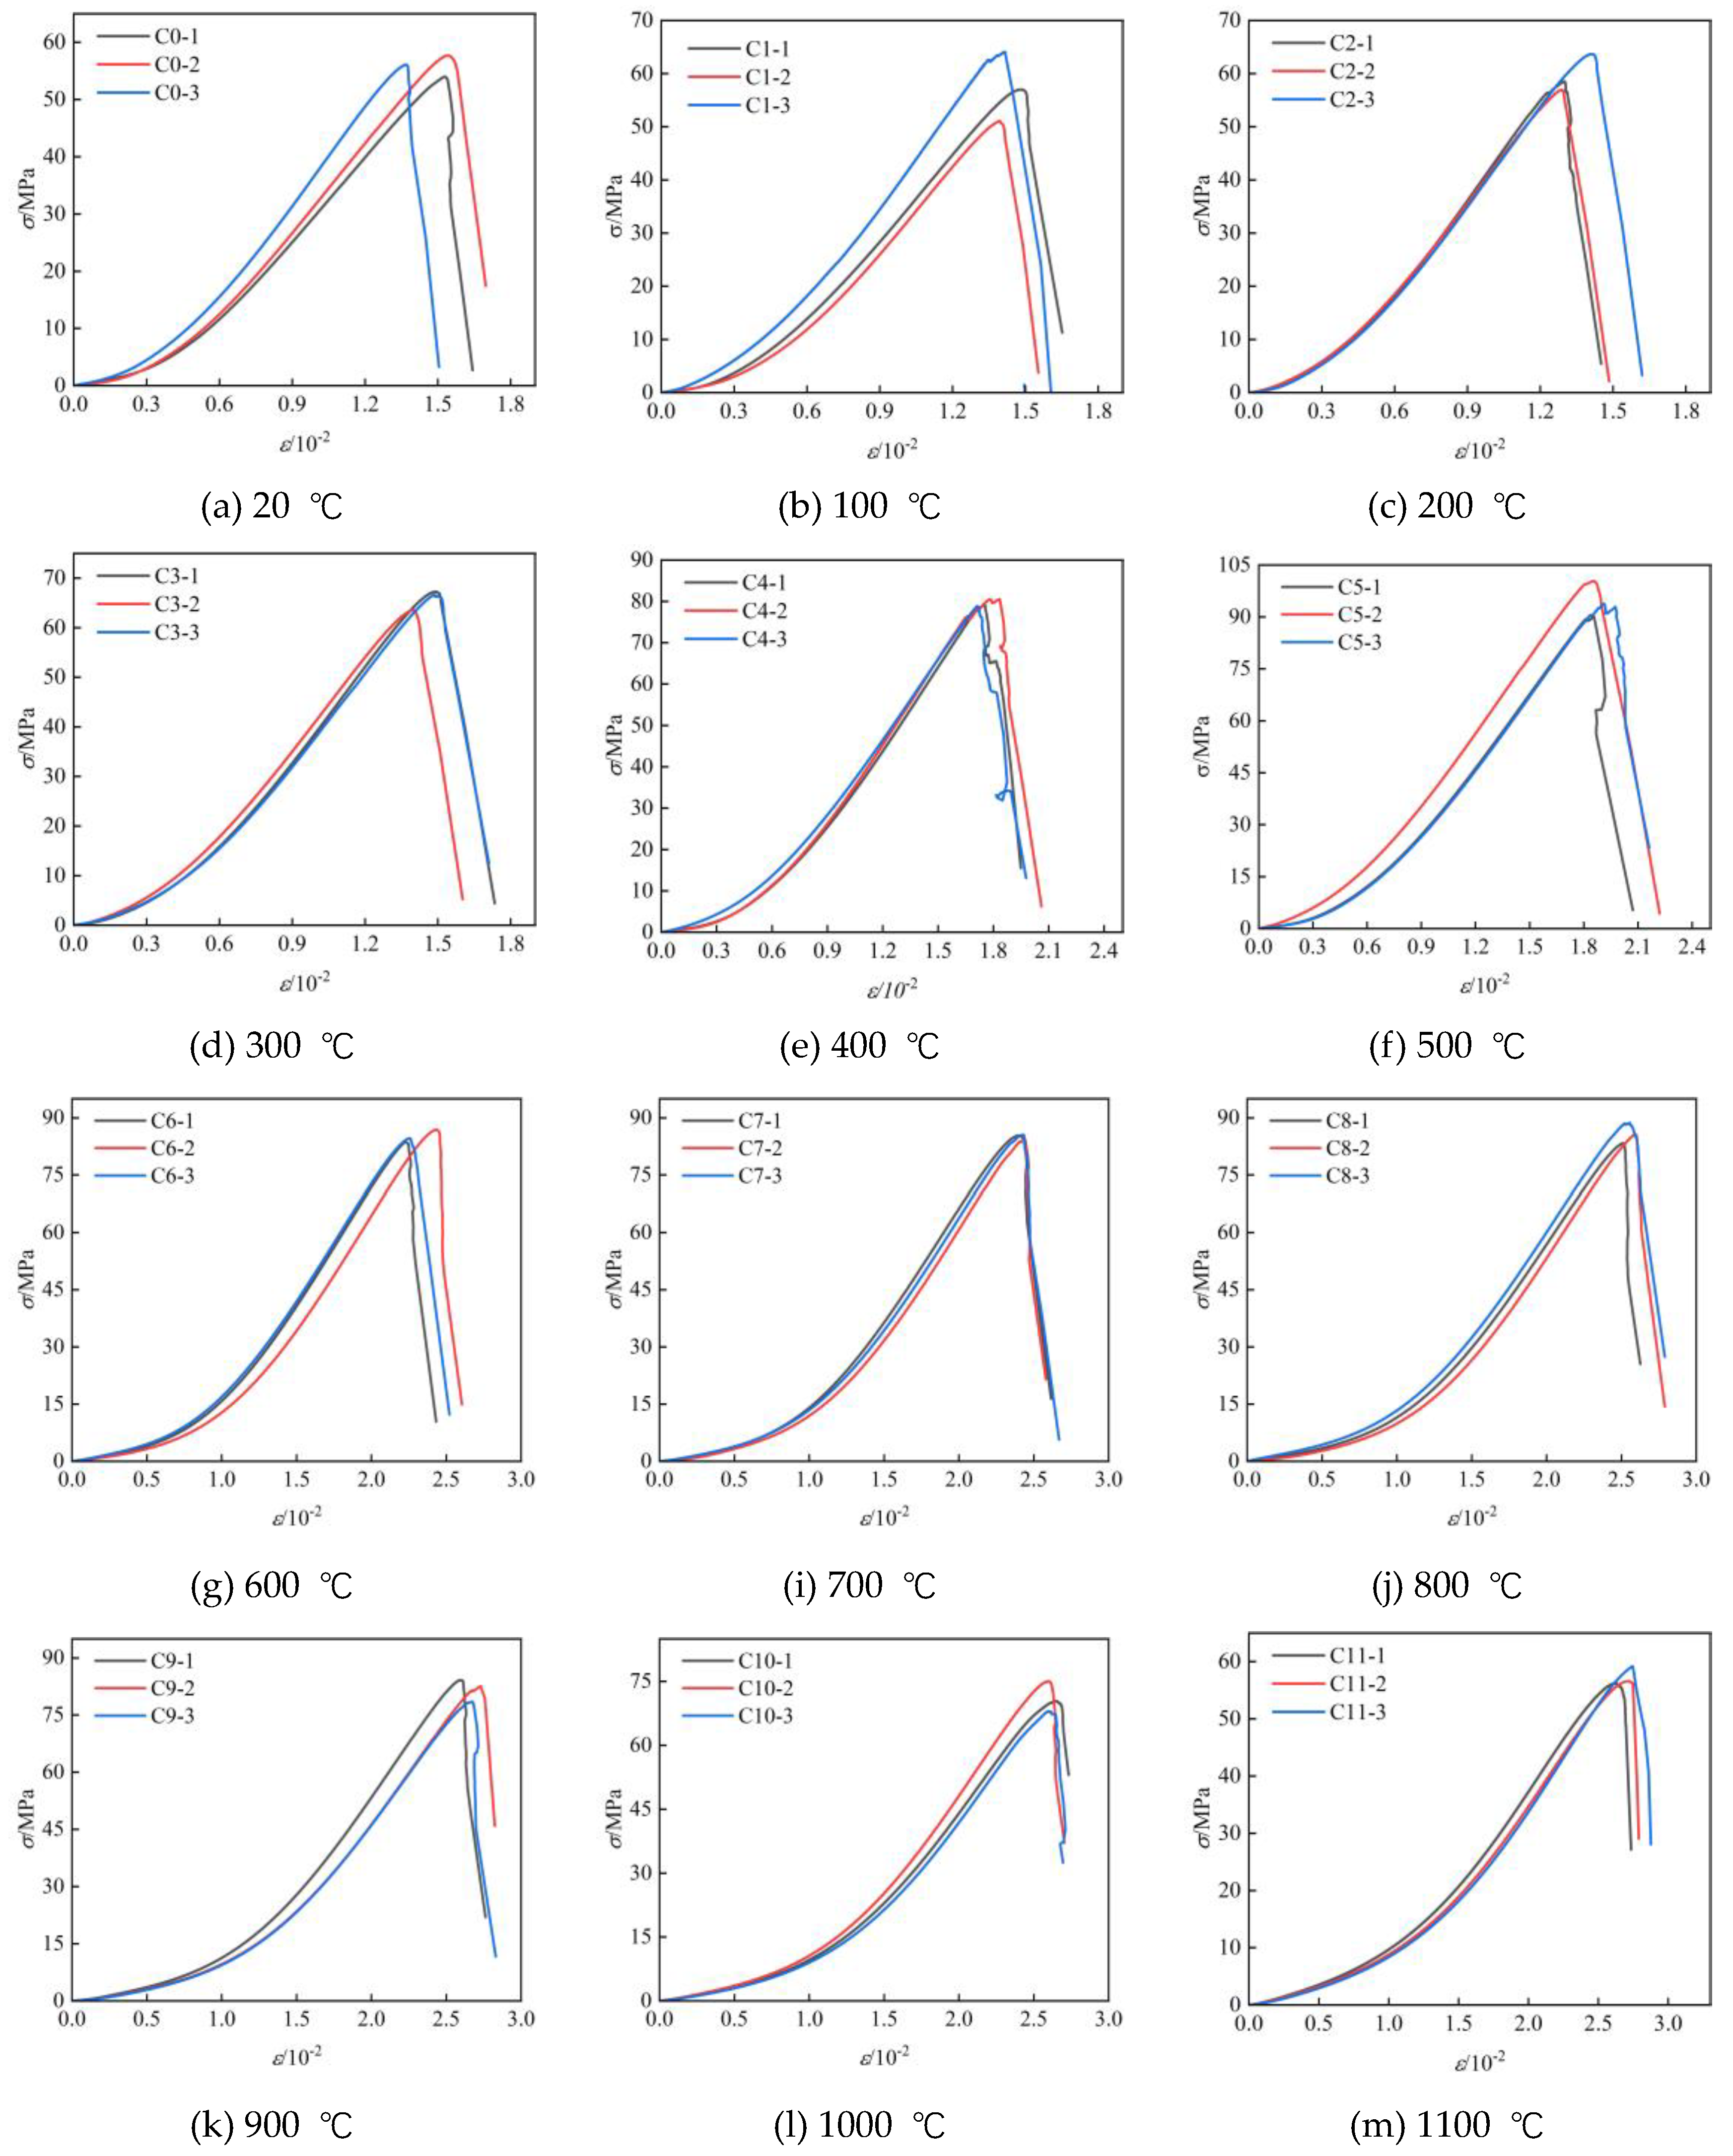
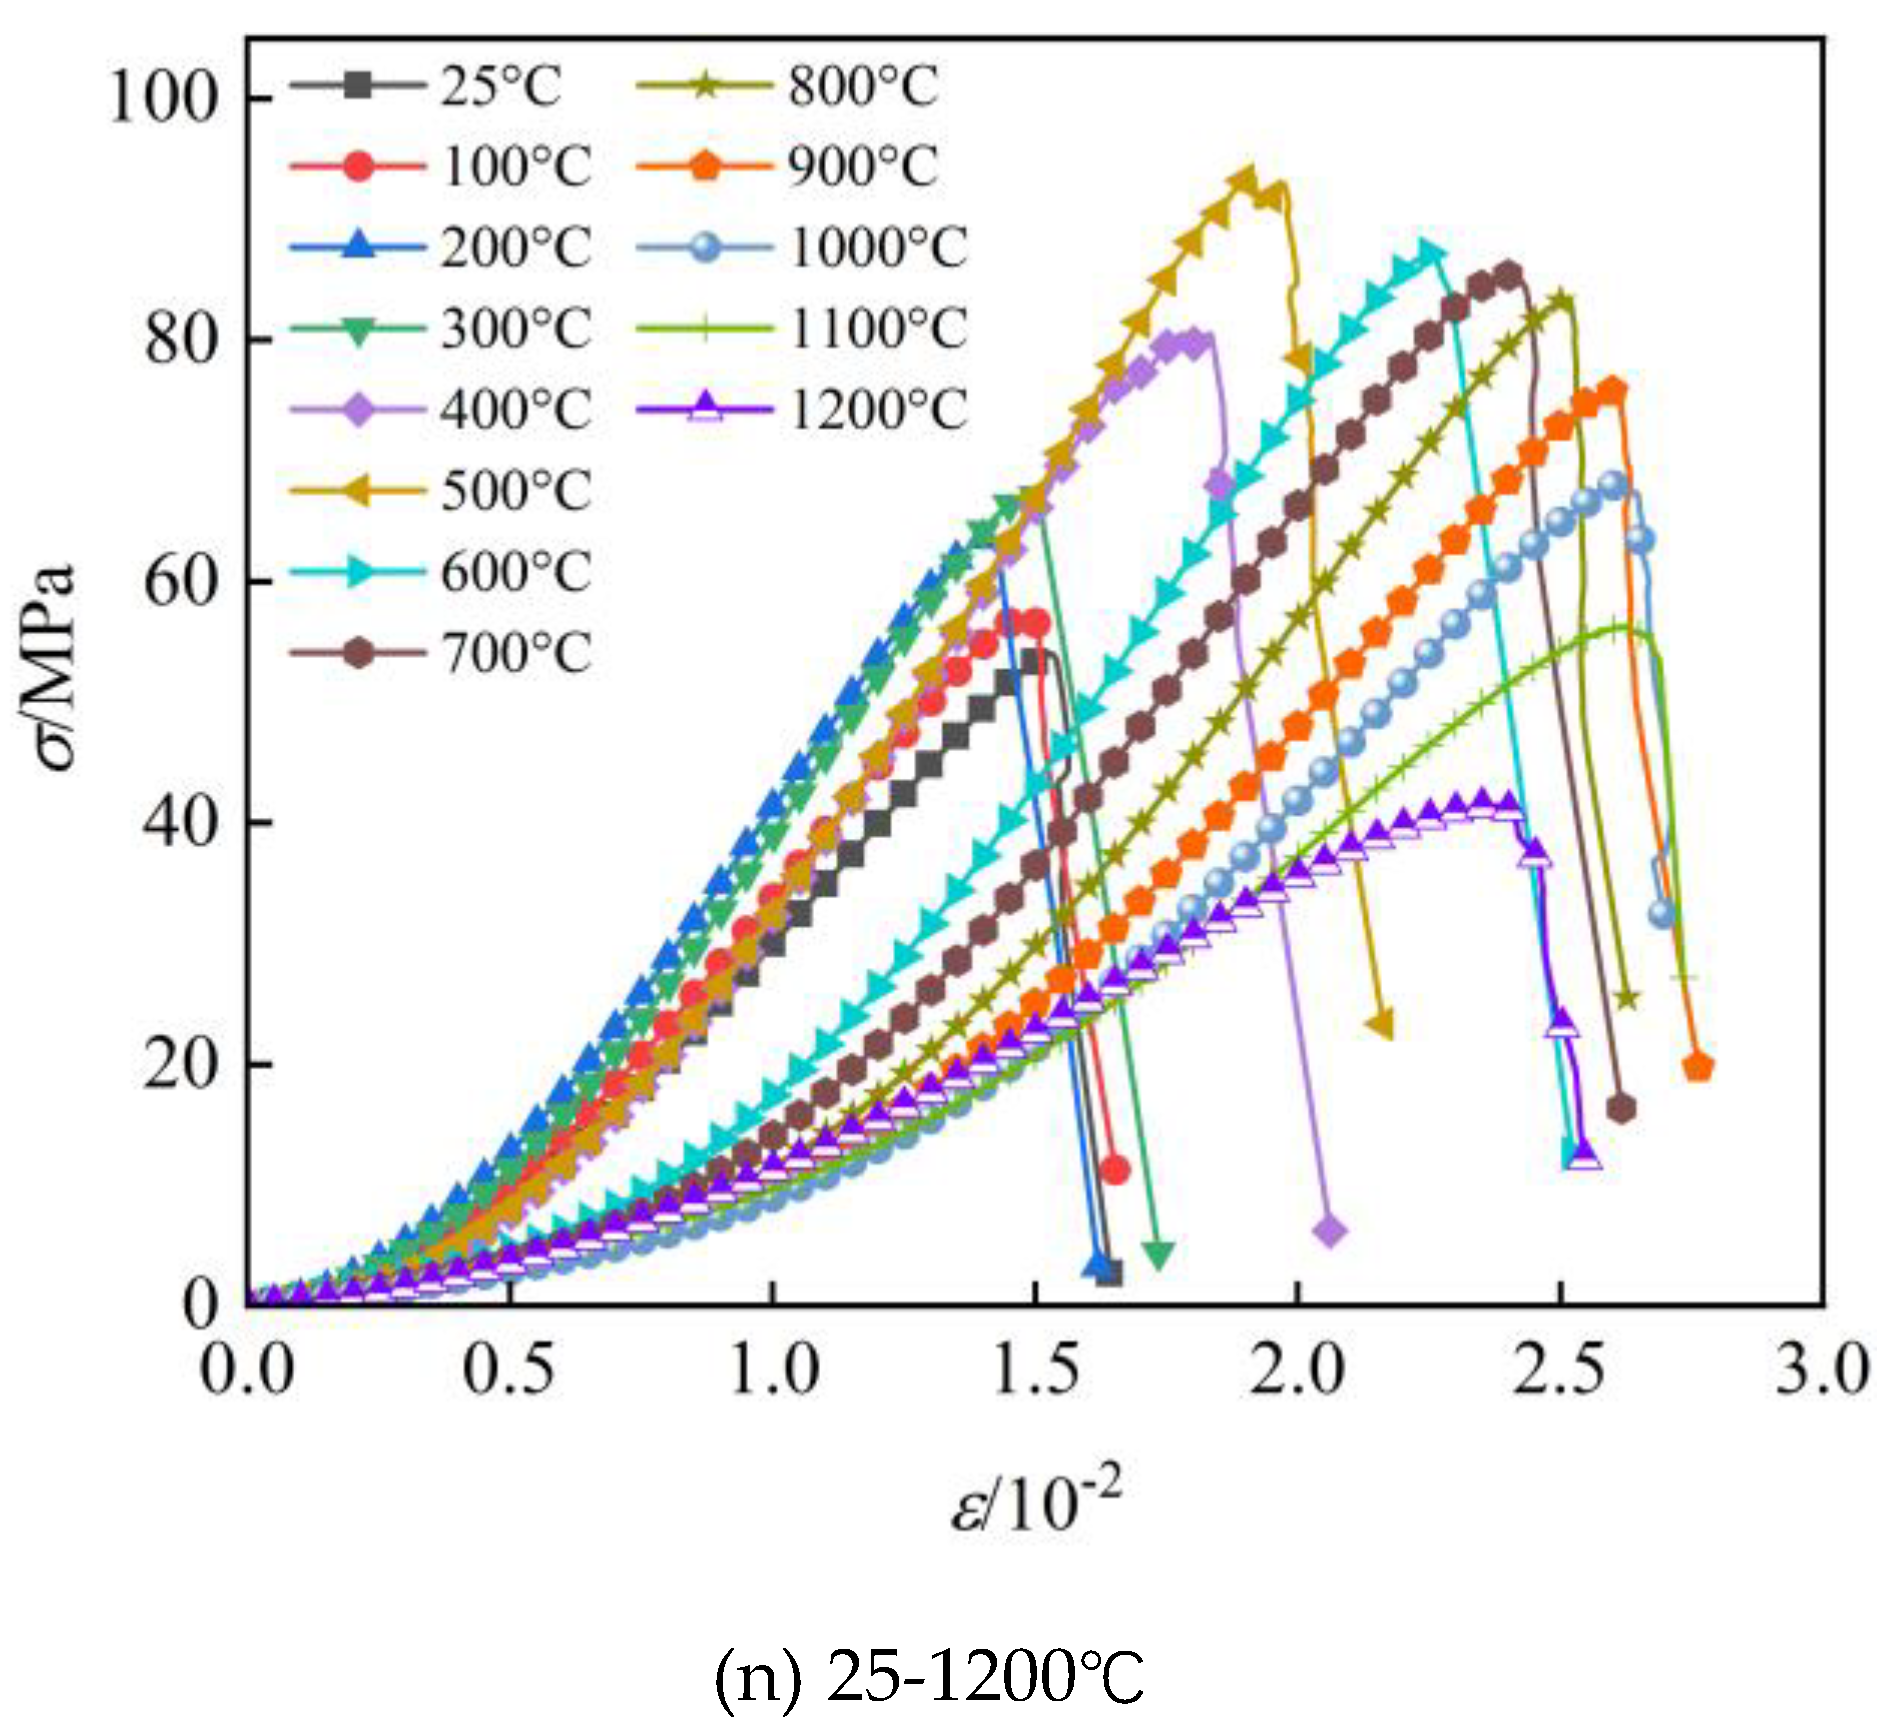
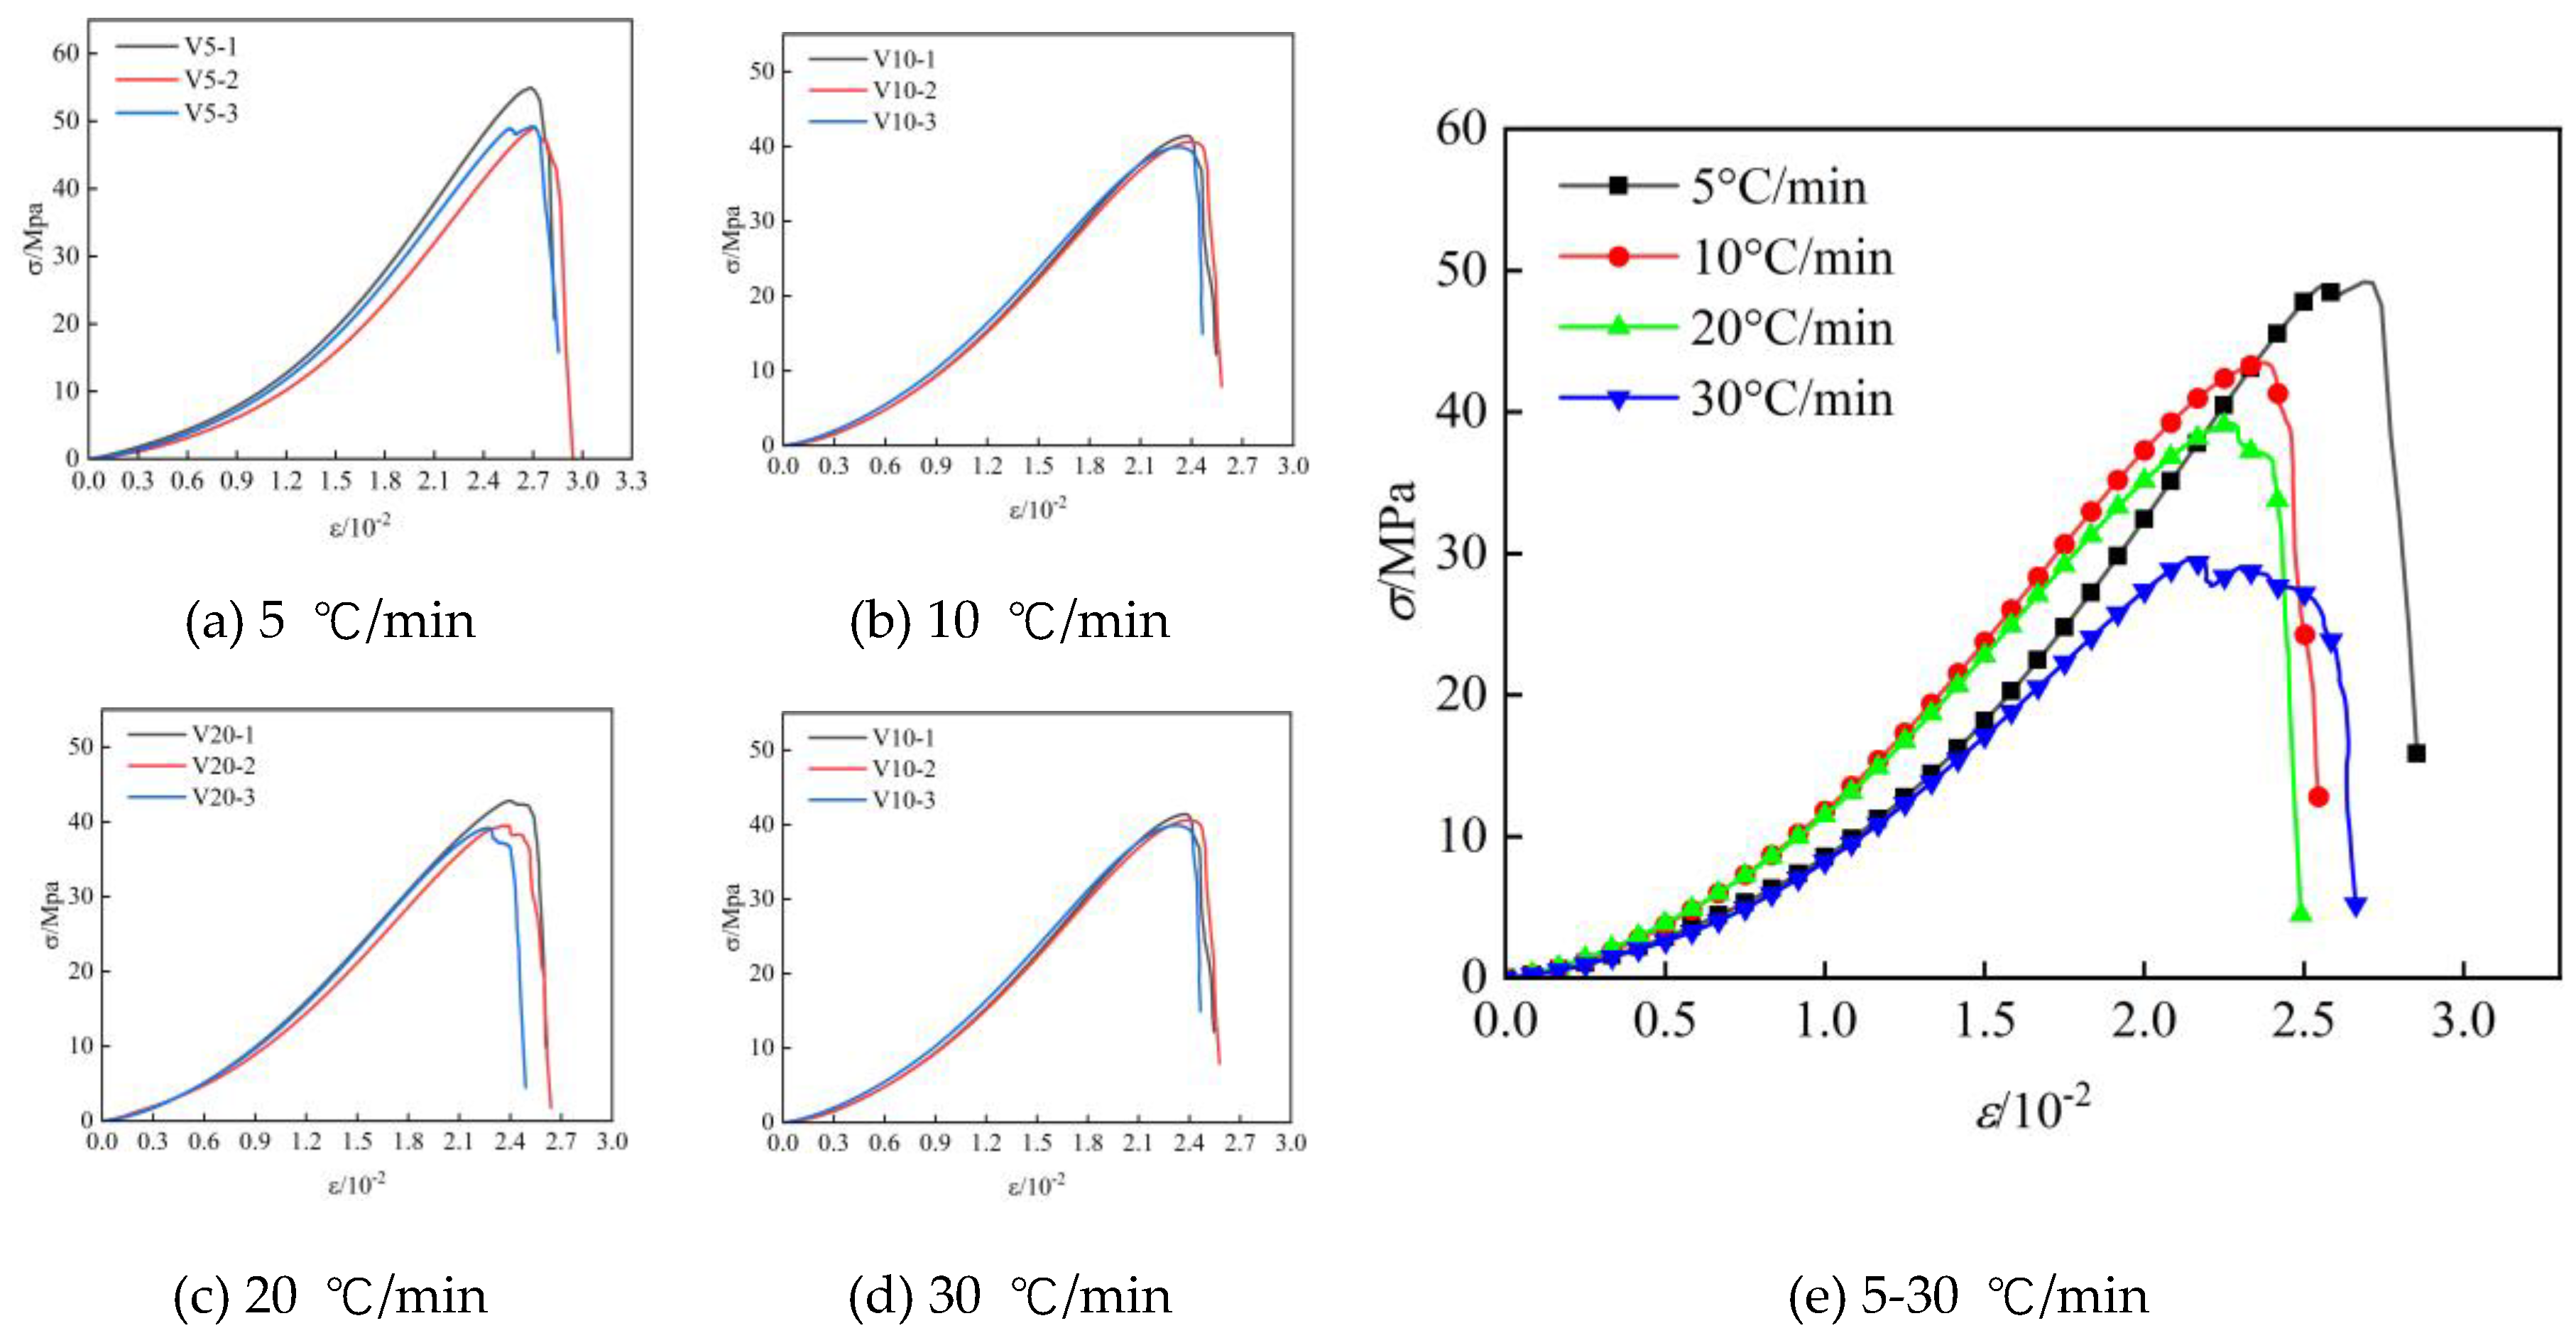
Figure 4 and
Figure 5 show the full stress-strain curves of uniaxial compression tests at different temperatures and different heating rates, respectively. In order to ensure the accuracy of the data to reduce the dispersion, the experimental curves with the largest and smallest peak stresses have been removed, and the mechanical parameters of sandstone at different temperatures have been obtained by averaging the data of stress-strain curves, which are shown in
Table 1 and
Table 2.
From the figure, it can be seen that the stress-strain curve during uniaxial compression can be divided into four stages: compaction, elasticity, plastic deformation and failure. First is the compaction stage, the curve is up-concave, in which the microcrack inside the rock are gradually closed under the external load. The second is the approximate linear elasticity stage, where the stress-strain curve is approximated as an oblique straight line. At this stage, the external force is not enough to produce new cracks or force the original cracks to undergo extension evolution, and the microscopic defects inside the rock do not change much, so the slope of this straight line segment is taken as the average elastic modulus E of the rock. Subsequently, there is a plastic deformation stage, in which the stress-strain curve bends downward, the stress increase is small, the axial strain increases rapidly, and the microcracks begin to expand unsteadily. Finally, the destruction stage, the sandstone specimen is rapidly destroyed, and accompanied by a loud sound into the burst destruction. Different temperatures in the sandstone uniaxial compression process stress-strain curve characteristics are different, sandstone at 500 ℃ before the brittle damage is dominated, at 500 ℃ -600 ℃ sandstone began to be brittle to the ductile transition, compaction stage time increased significantly. At the same temperature of 1200℃ the stress-strain curve shifted downward with the increase of heating rate.
3.2.2. Variation law of peak stress
According to the data in
Table 1 and
Table 2, the variation patterns of peak stress
, modulus of elasticity
E, and peak strain
of sandstone were investigated at different temperatures and heating rates. From
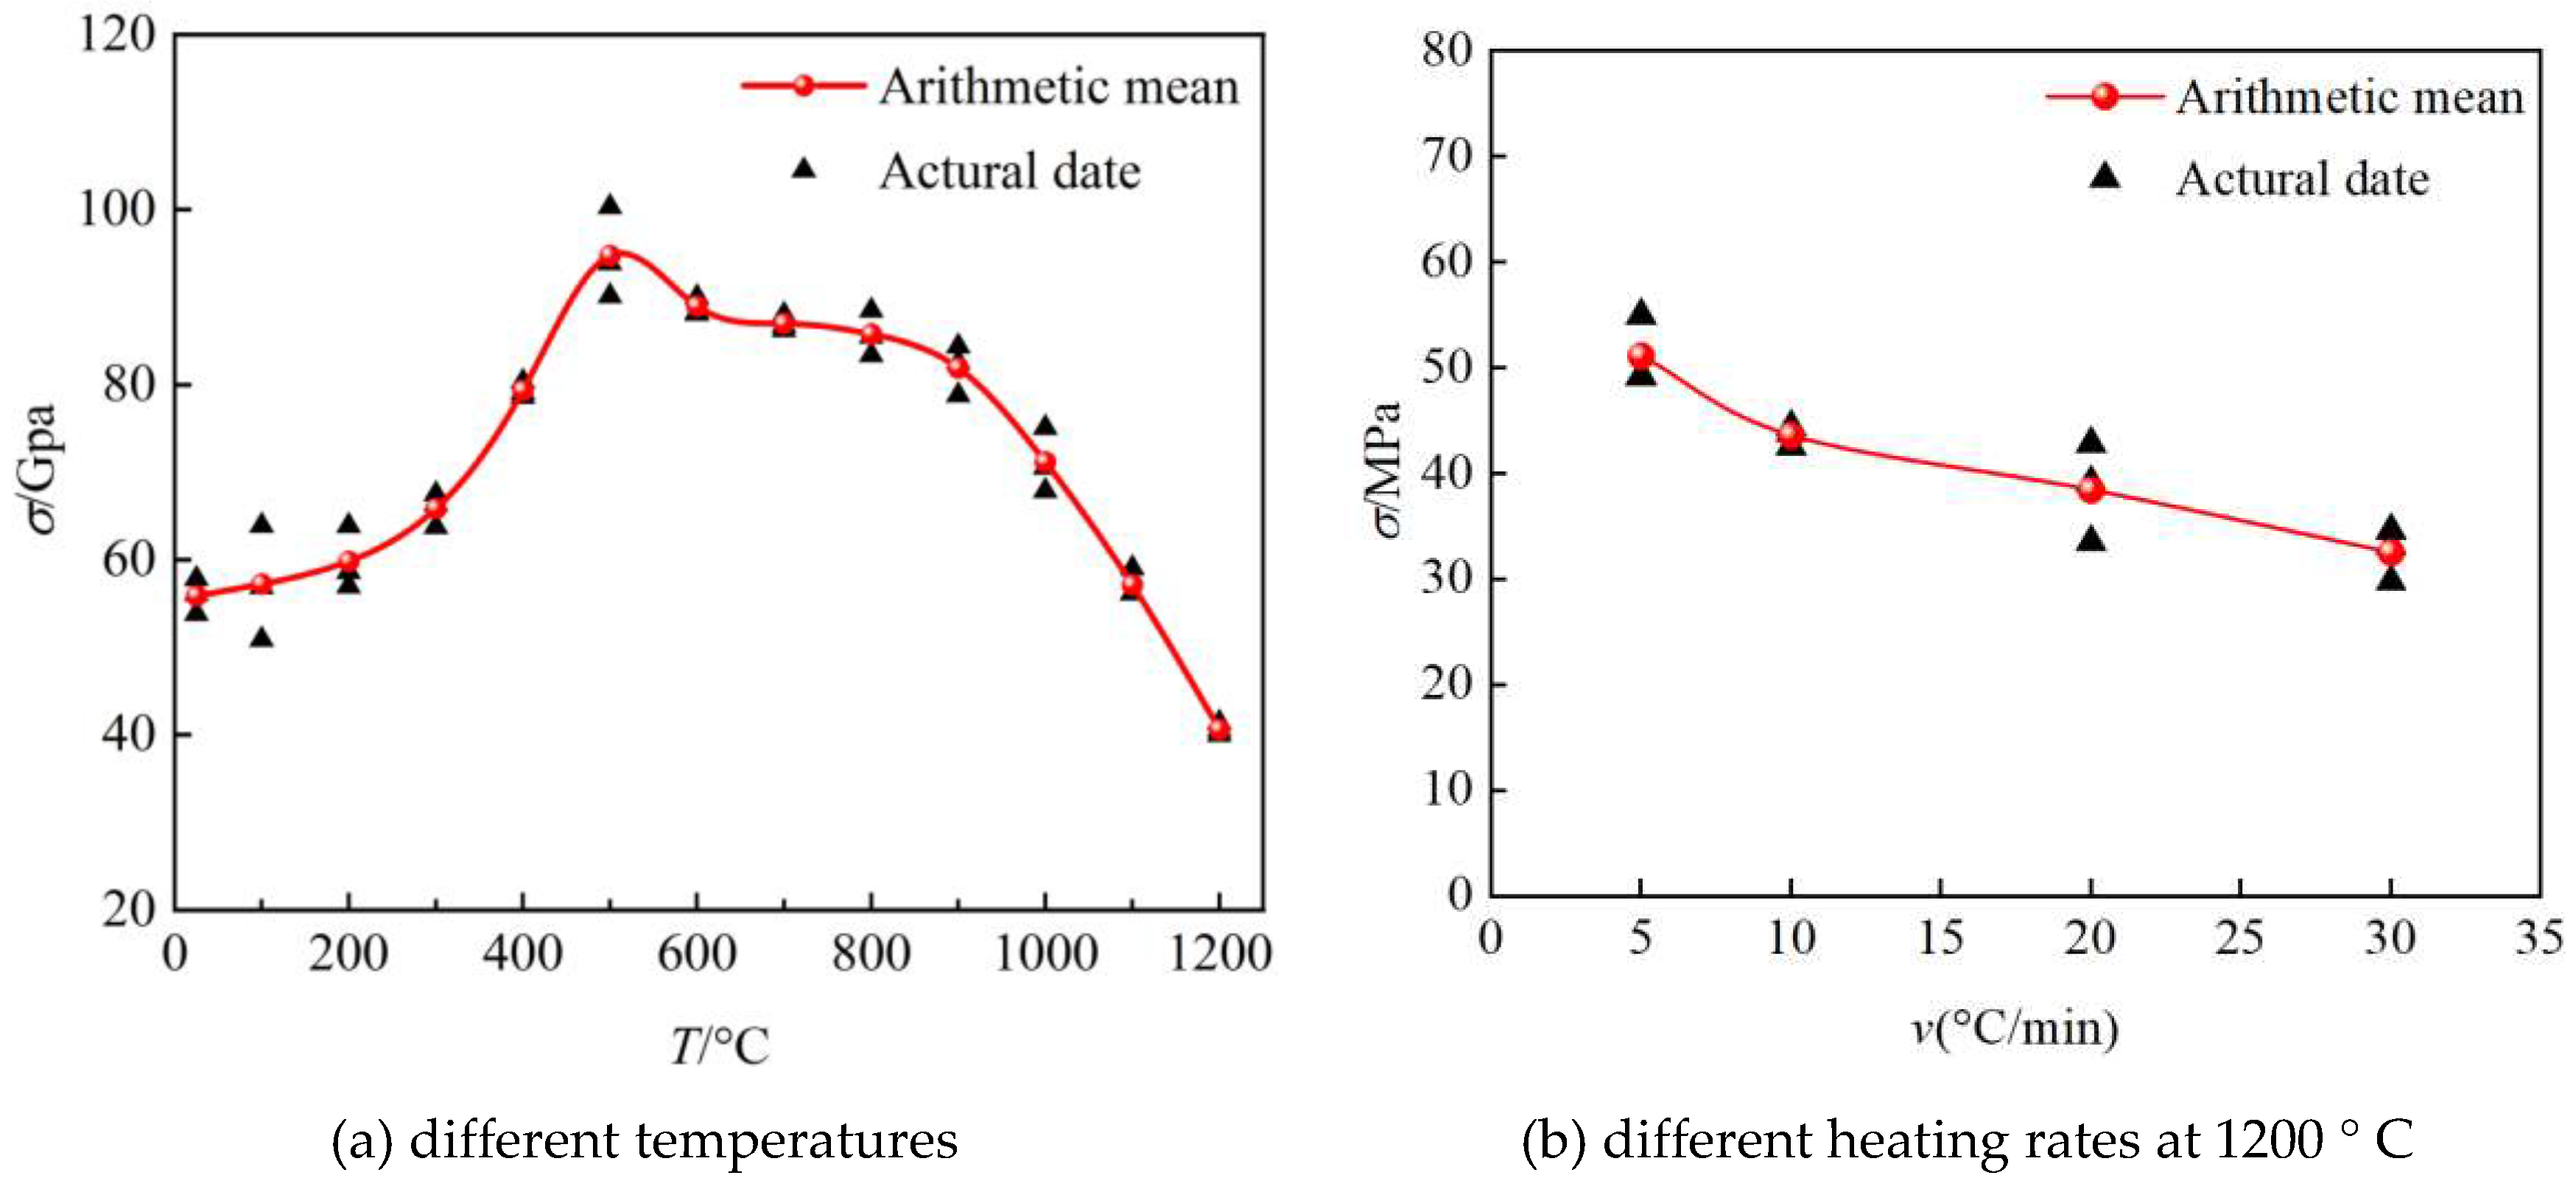
Figure 6(a), it can be seen that the peak stress of sandstone firstly increases and then decreases with temperature, and the peak stress is the largest at 500°C. This trend is the same as the conclusion drawn by Hajpál [
27]. However, the threshold temperatures are different, and this temperature-dependent feature is due to the difference in the mineral composition of the rock. From room temperature to 500°C, the peak stress increased from 55.91 MPa at room temperature to 94.76 MPa at 500°C, an increase of 38.85 MPa or 69.48%. As the temperature continues to increase, the peak stress of the sandstone begins to decrease, and the peak stress at 1200°C is 40.66 MPa, a decrease of 54.1 MPa, or 57.09%, compared with that at 500°C. It is worth noting that the temperature between 100°C and 1100°C promotes the compressive strength of sandstone relative to room temperature, and 1200°C has a deteriorating effect on the compressive strength of sandstone.
Figure 6(b) shows the effect of heating rate on the peak stress of sandstone at 1200°C. As the heating rate increases, the peak stress decreases, indicating that thermal shock decreases the compressive strength of sandstone. When the heating rate is 5°C/min, the peak stress is 51.14 MPa, and the peak stress is 32.54 MPa until the heating rate is 30°C/min, which is a decrease of 17.6 MPa, or 34.41%, and the average compressive strength of sandstone decreases by 0.704 MPa for every 1°C/min increase in the heating rate.
3.2.3. Variation law of elastic modulus
The average elastic modulus
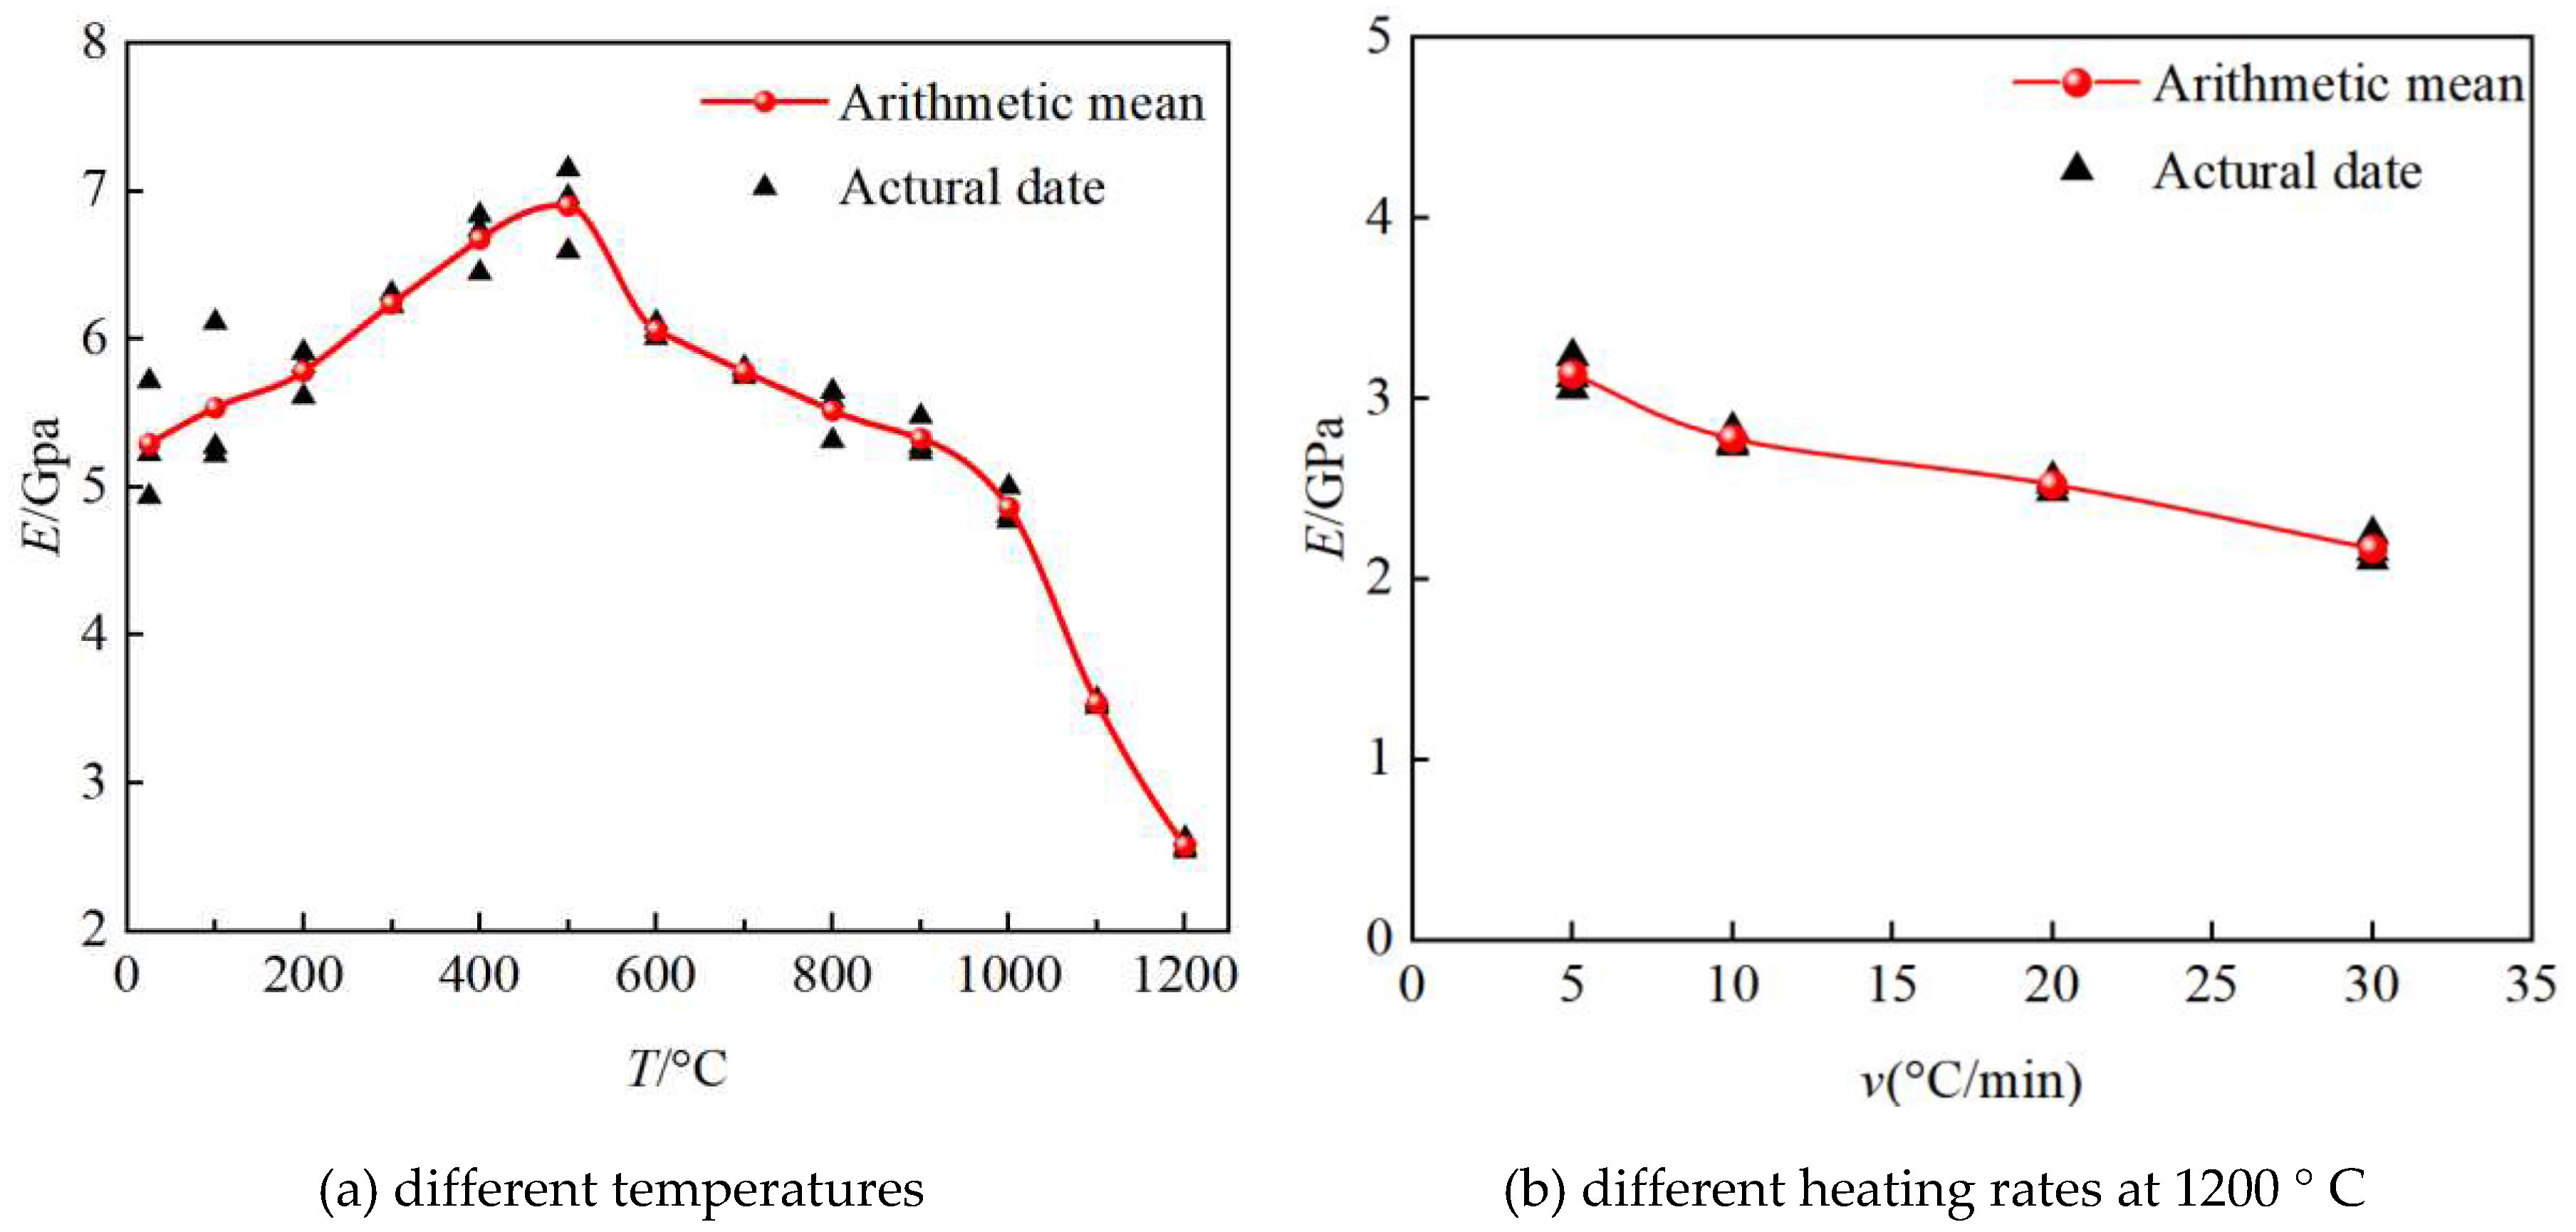
E of the sandstone was calculated by taking the approximate straight line segment before the peak stress of the full stress-strain curve of the rock sample, and the variation rule of the average elastic modulus of the sandstone with temperature is given in
Figure 7(a). Before 500°C, the elastic modulus increases approximately linearly with temperature, from 5.29 GPa at 25°C to 6.90 GPa at 500°C, an increase of 30.43%. Thereafter, the modulus of elasticity decreases with increasing temperature, with the fastest decrease from 1000°C to 1200°C. The modulus of elasticity at 1200°C is 2.57 GPa, which is 62.7% lower than that at 500°C.
Figure 7(b) shows the variation rule of elastic modulus
E with heating rate at 1200°C, similar to the trend of peak stress, with the increase of heating rate, the elastic modulus is approximately linear decrease. The elastic modulus is 3.13 GPa at 5°C/min, and 2.16 GPa at 30°C/min, which is 0.97 GPa lower than the previous year, a decrease of 31.29%.
3.2.4. Variation law of peak strain
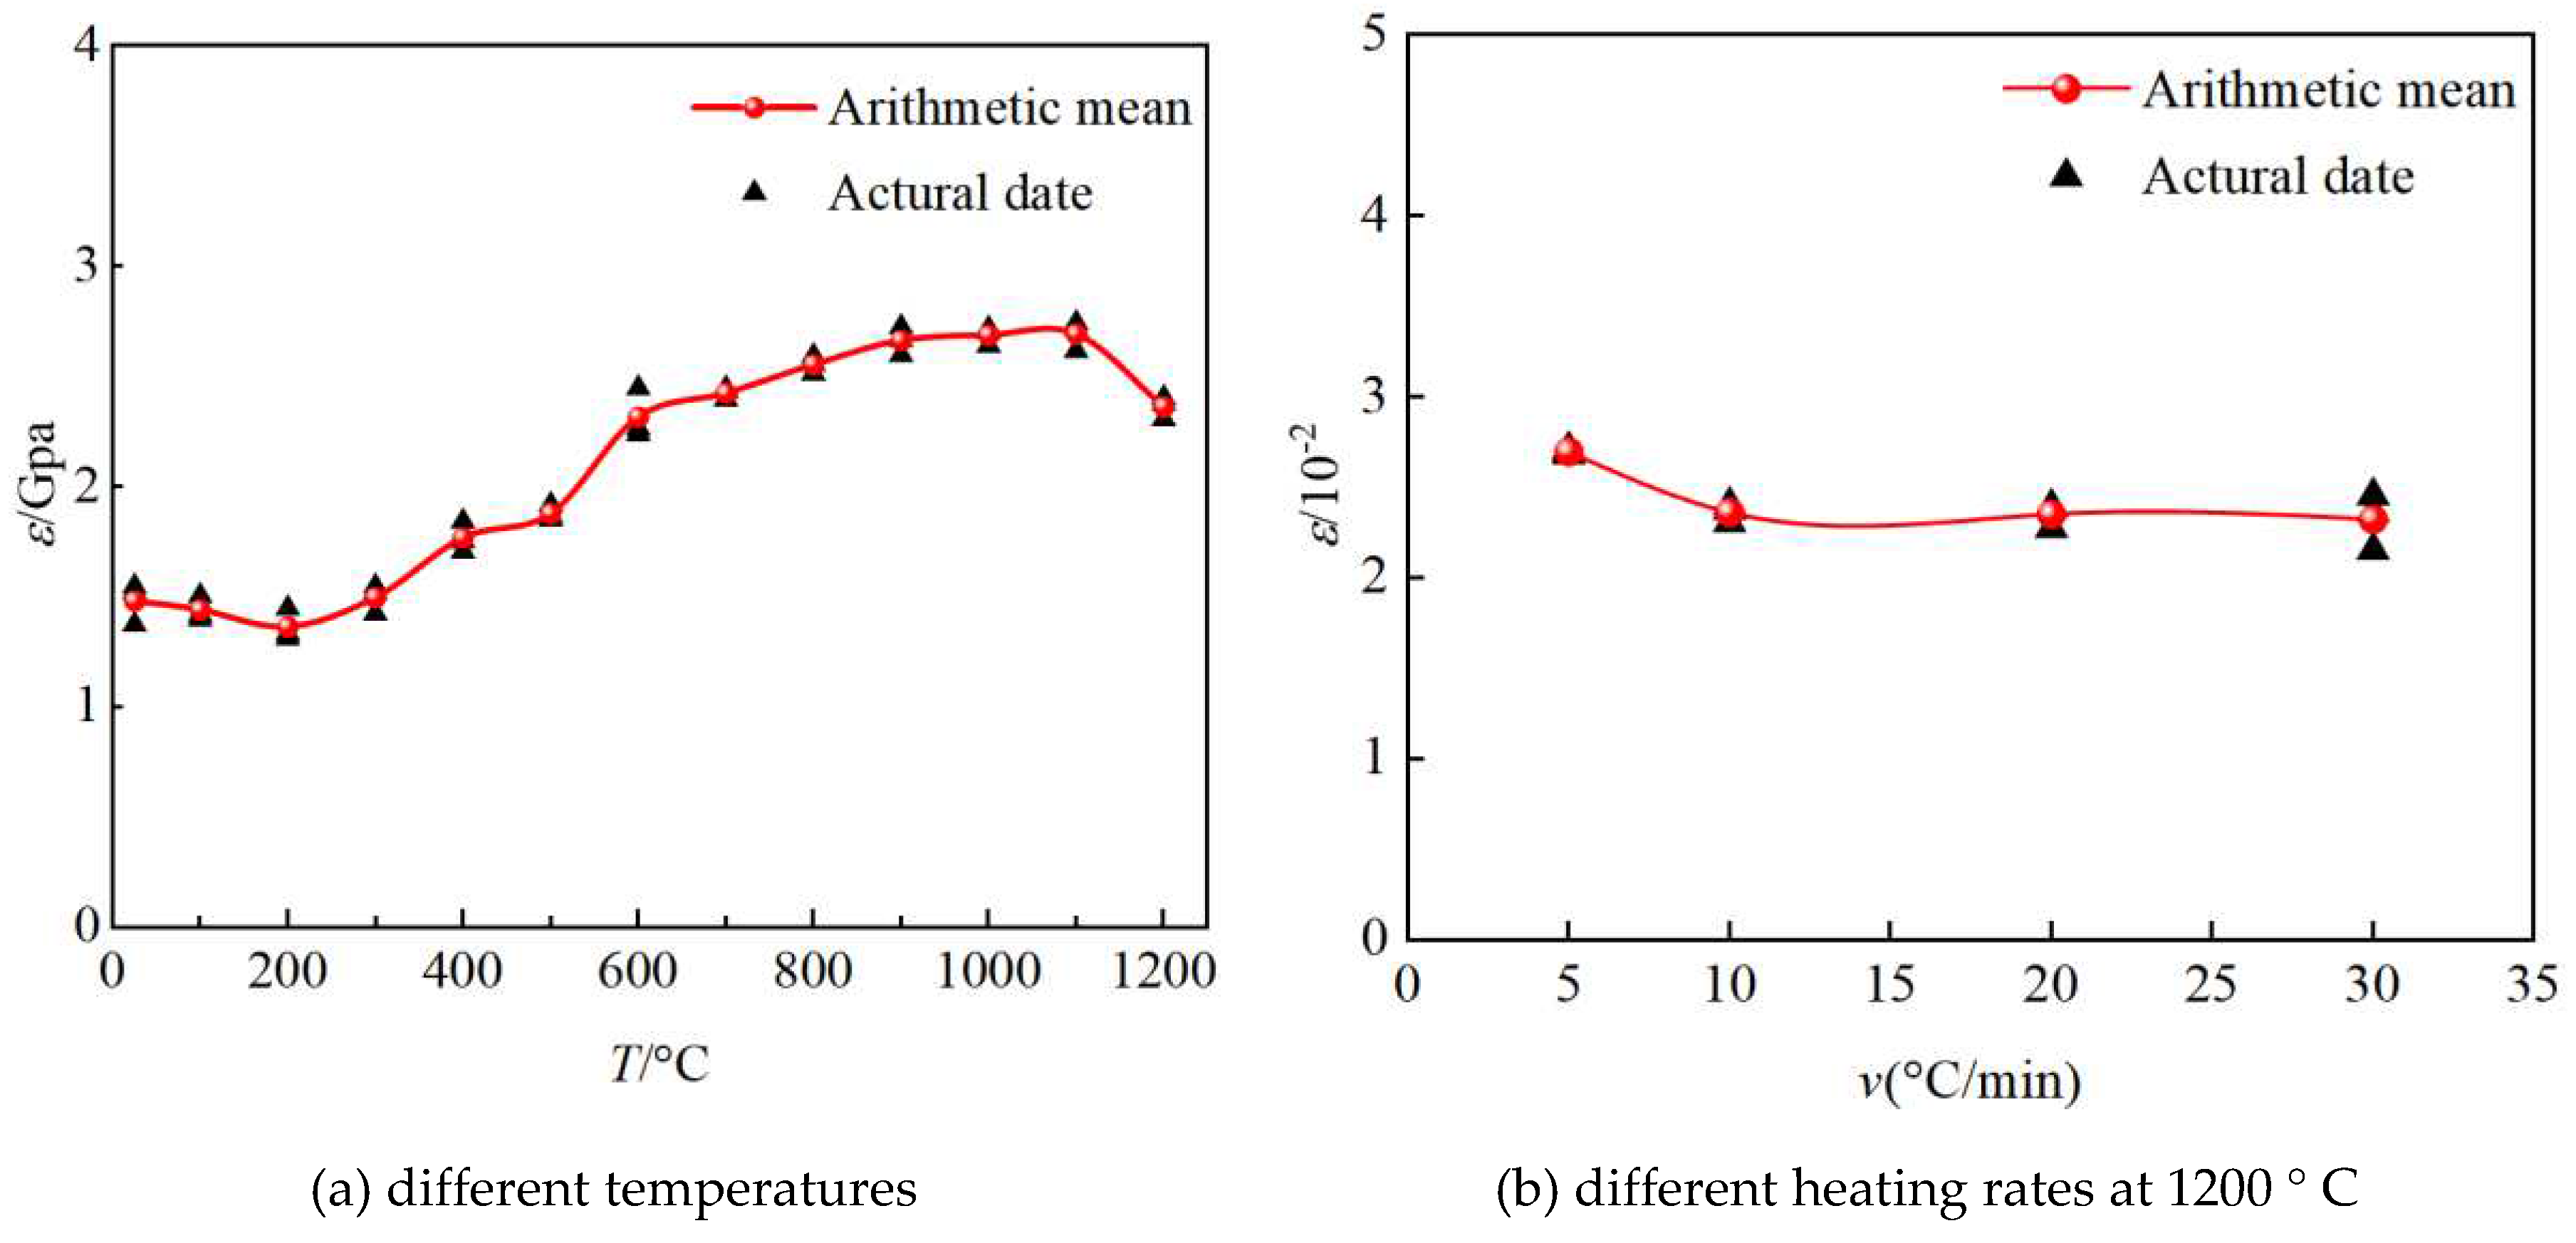
Figure 8(a) shows the variation rule of peak strain
with temperature. With the increase of temperature, the peak strain shows a general trend of decreasing and then increasing, and the sandstone changes from brittle to ductile. The peak strain is 1.47×10
-2 at 25°C and 1.36×10
-2 at 200°C, a decrease of 7.48%, which is due to the closure of microcracks and increase of brittleness of sandstone at elevated temperature. Between 200°C and 1100°C, the peak strain increases continuously, and the peak strain at 1100°C is 2.69×10
-2, a rise of 97.79%. When the temperature continues to increase to 1200°C, the peak strain decreases again to 2.36×10
-2, which is due to the fact that the sandstone has been highly deteriorated at this temperature, and the ability to resist damage is greatly reduced.
Figure 8(b) shows the effect of warming rate on the peak strain
of sandstone. The peak strain was 2.69×10
-2 at the heating rate of 5°C/min. The peak strains were 2.36×10
-2, 2.35×10
-2, and 2.32×10
-2 at the heating rates of 10°C/min, 20°C/min, and 30°C/min, respectively, with a fluctuation of not more than 2%, but compared to 5°C/min, the peak strains were decreased by 12.26%, 12.63%, and 13.75%, respectively. It indicates that the rate of warming has little effect on the peak strain, and the temperature is the main influencing factor.
3.2.5. Macroscopic failure model
Rock is a non-homogeneous brittle material with internal discontinuities and inherent defects, and its fracture morphology is more complex and diverse after being affected by high temperature. From the destruction of this test sample, it is mainly divided into four kinds of destruction forms: single slope shear failure, X-shaped slope shear failure, splitting failure, and conical failure. According to
Figure 9, the damage of sandstone at high temperature can be divided into four stages. In the first stage (25°C-300°C), the damage of sandstone is mainly in the form of single slope shear failure and X-shaped slope shear failure. In this stage, the rock is more brittle, and the main part of the specimen does not have a large crack. Stage II (400°C-600°C) and Stage III (700°C-900°C) are more complex, with shear failure and splitting failure, increased bulkiness of the rock samples, small transverse microcracks around the rupture surface, and a rougher rupture surface. The difference is that stage II is dominated by shear failure, while stage III is dominated by splitting failure. Stage Ⅳ (1000-1200°C) the bearing capacity of sandstone is rapidly reduced, the damage state is serious, the specimen is conical failure, the fracture surface due to friction produces a large number of powdery particles
4. Study on Acoustic Emission Characteristics
Rock in the load deformation and destruction process will produce acoustic emission information, these information can be expressed through the form of acoustic signals, when the acoustic signals generated by the internal damage of the rock break through the specific intensity and frequency thresholds, can be detected by the acoustic emission monitoring instrument. Every time the acoustic signal is detected, a ringer count is performed, and the more ringer counts there are, the more acoustic signals are generated by the internal damage of the rock. In this paper, the ringer count N is used to analyze the acoustic emission characteristics of sandstone undergoing high temperature in the deformation and destruction process of uniaxial compression, and Nmax and denote the maximum value of the ringer counts and the cumulative ringer counts, respectively.
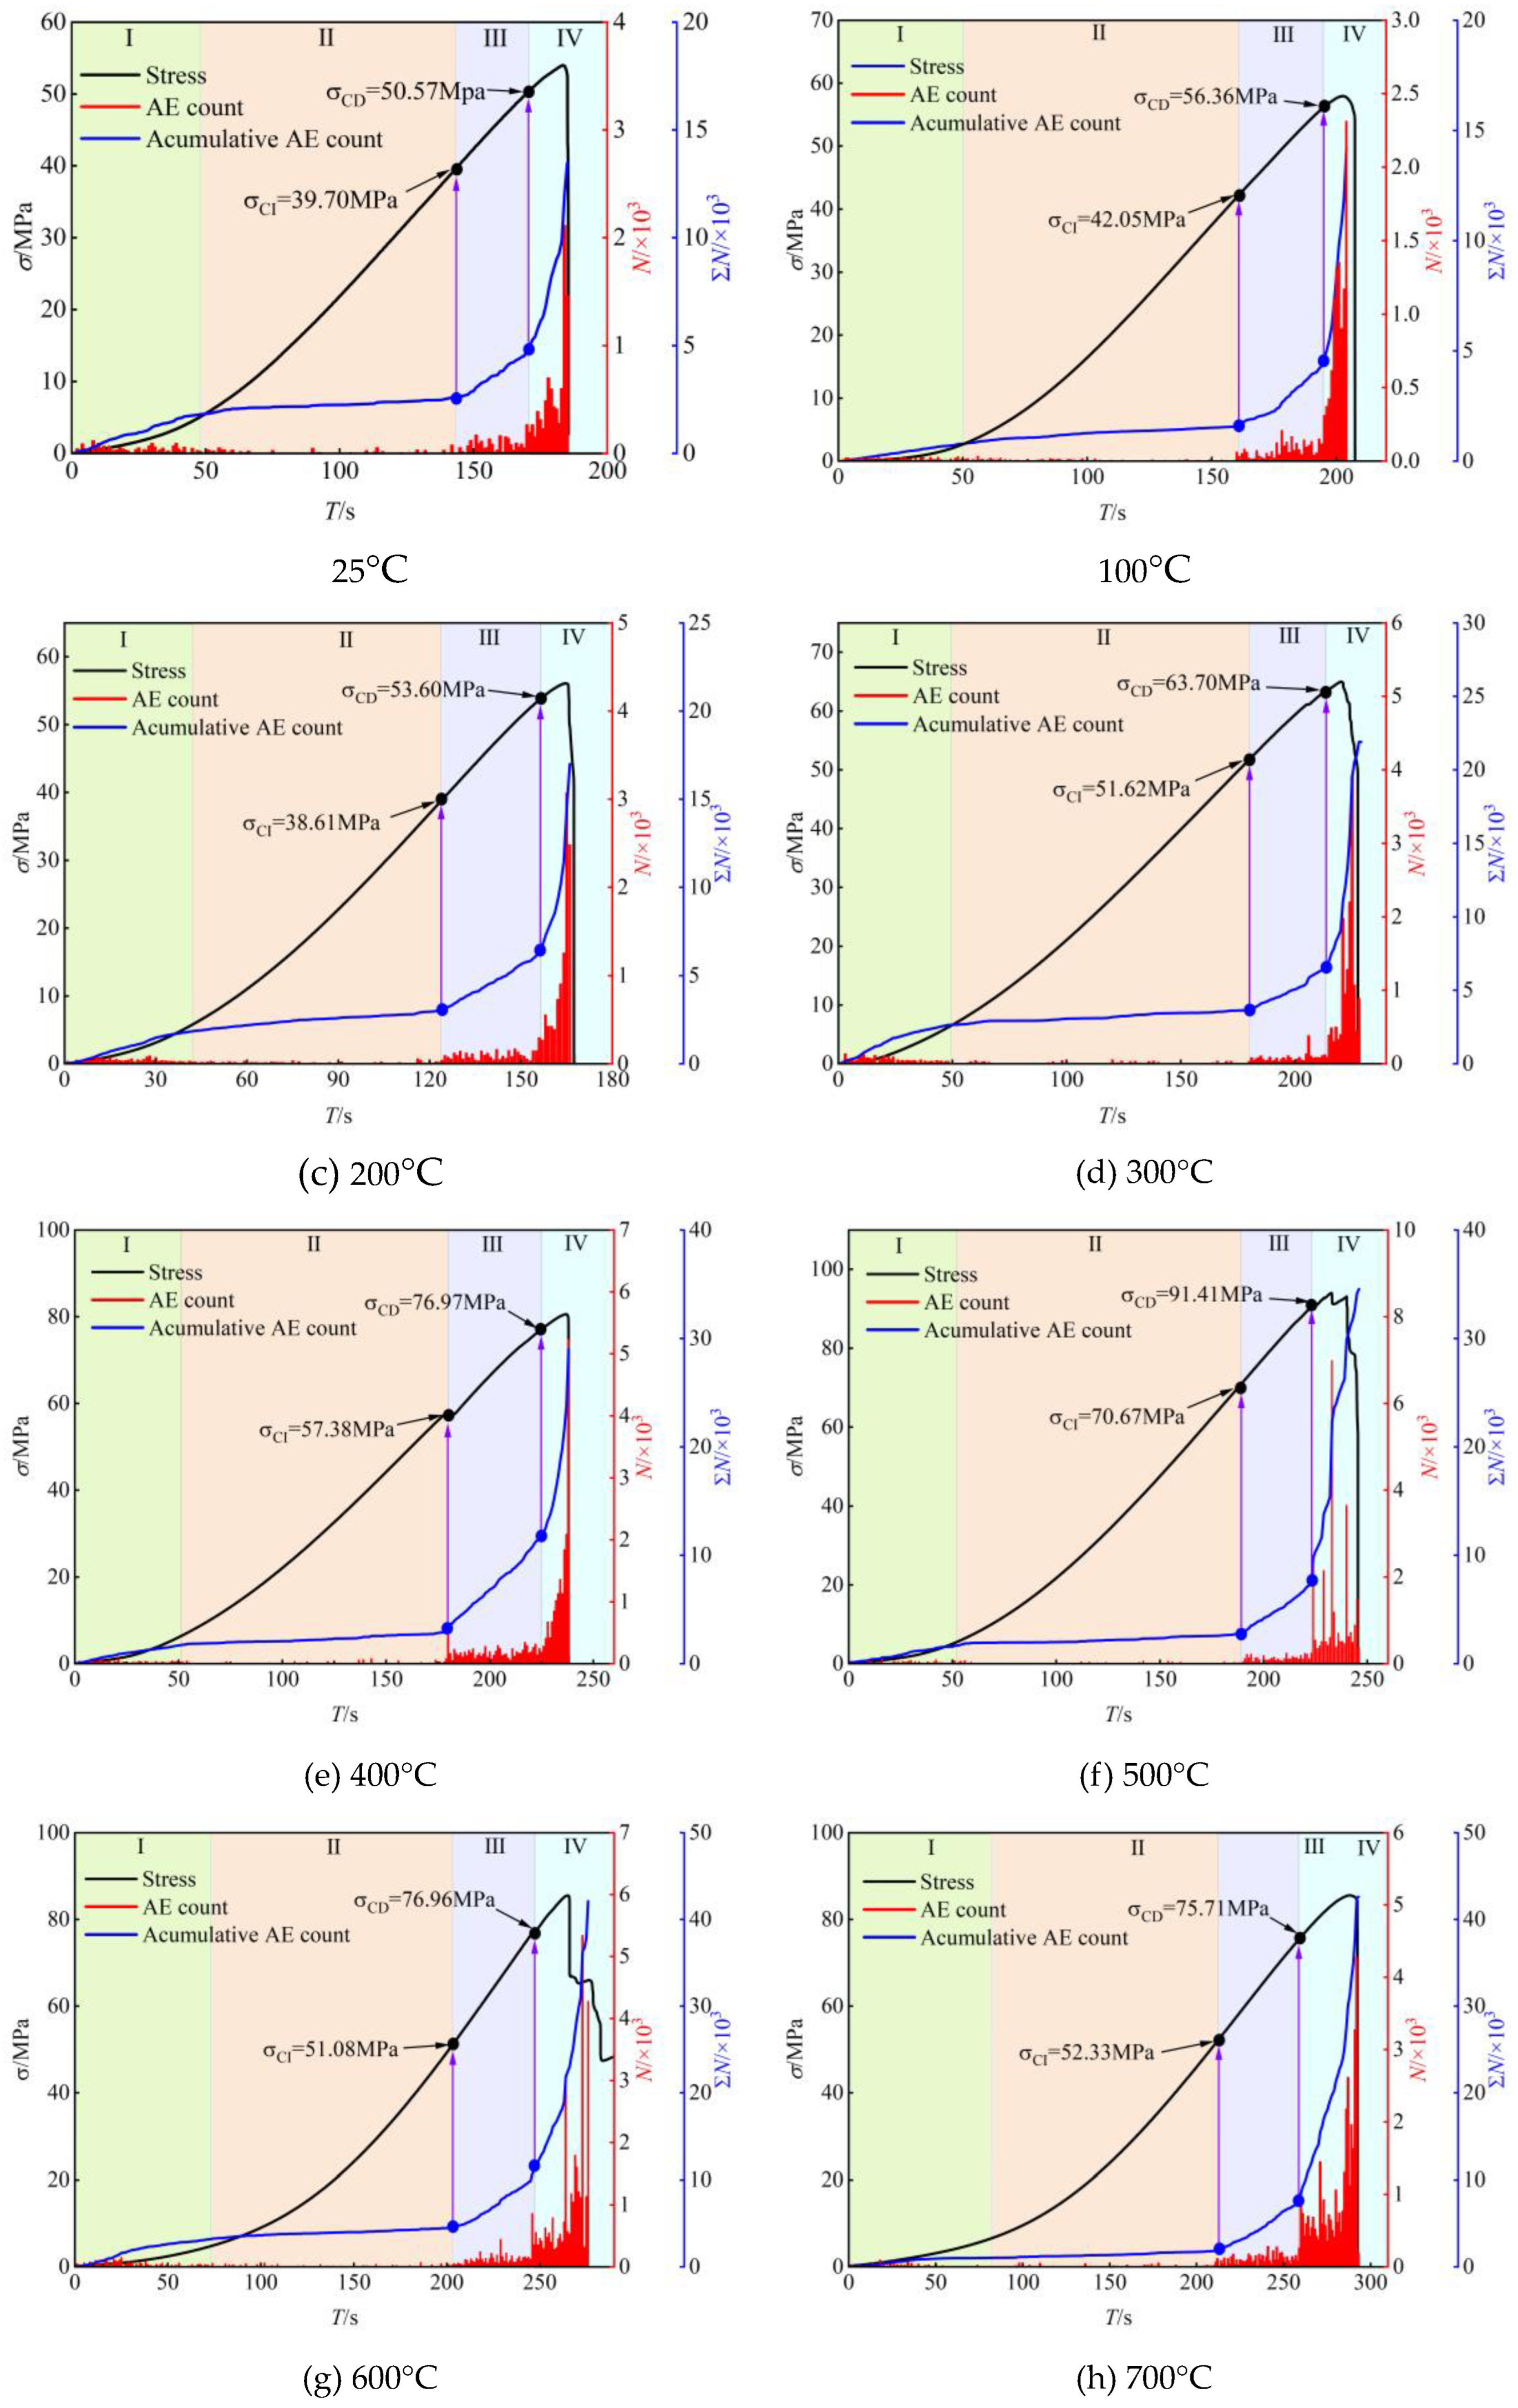
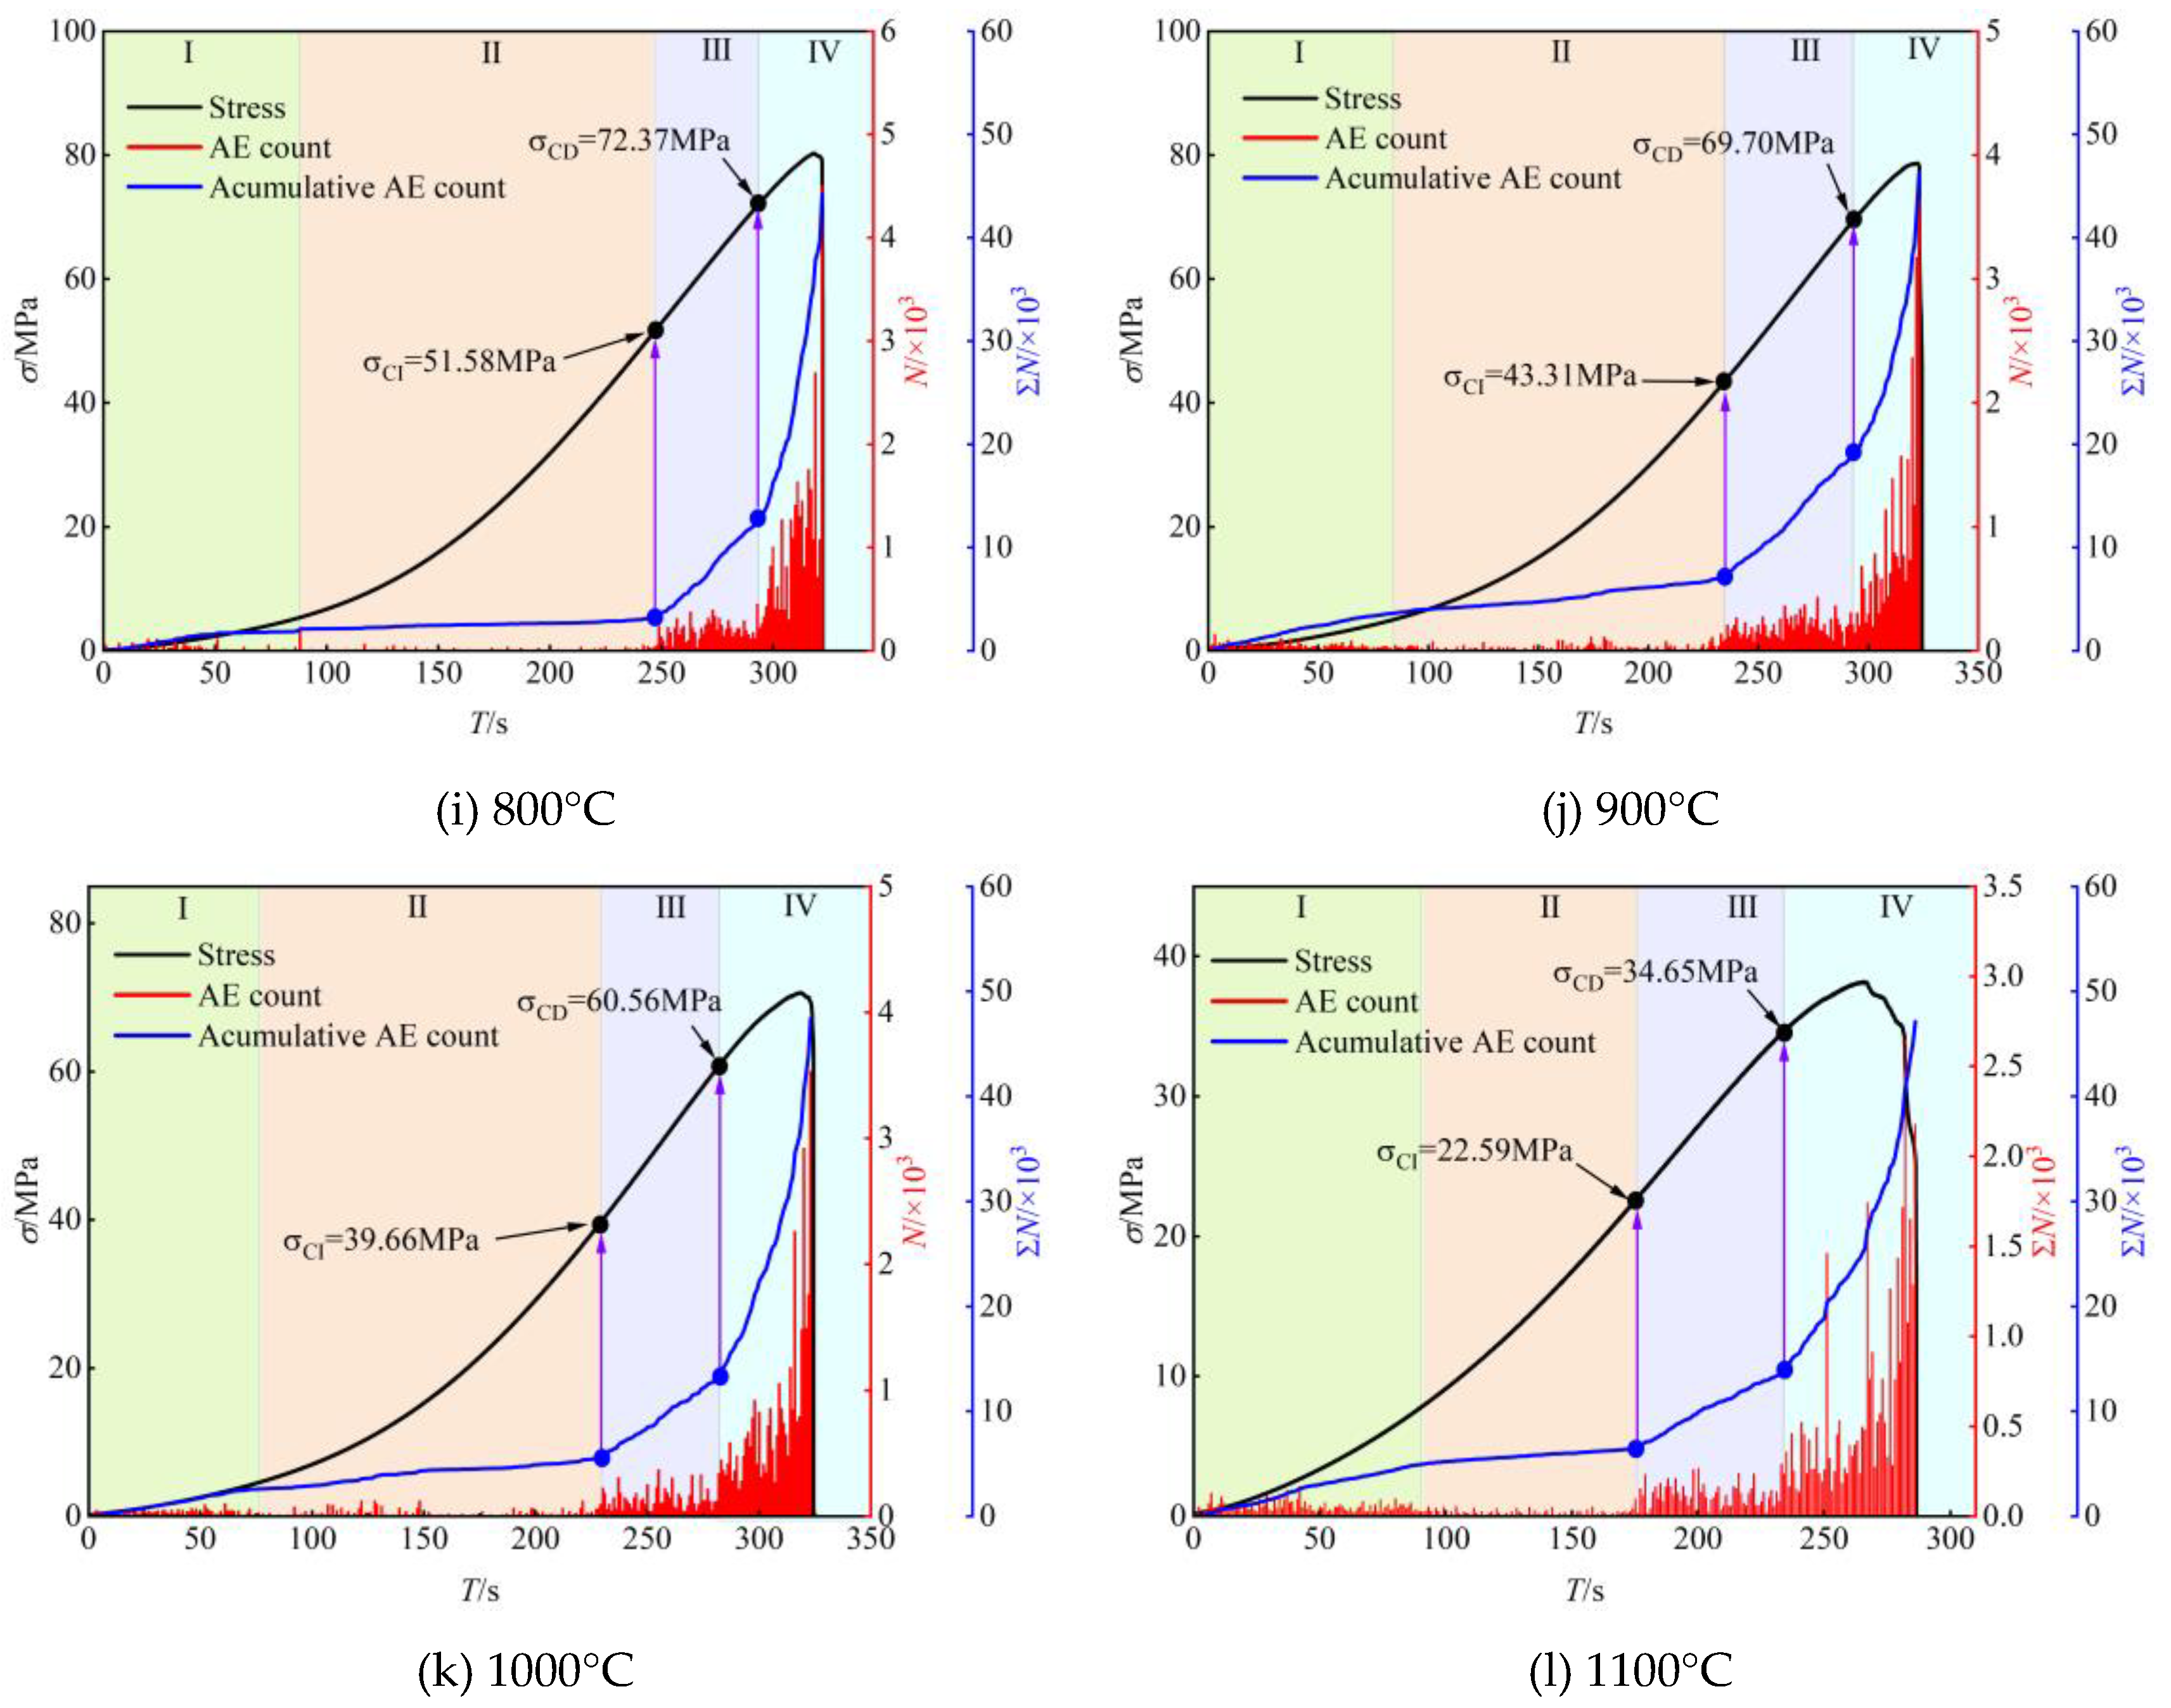
Figure 10 and
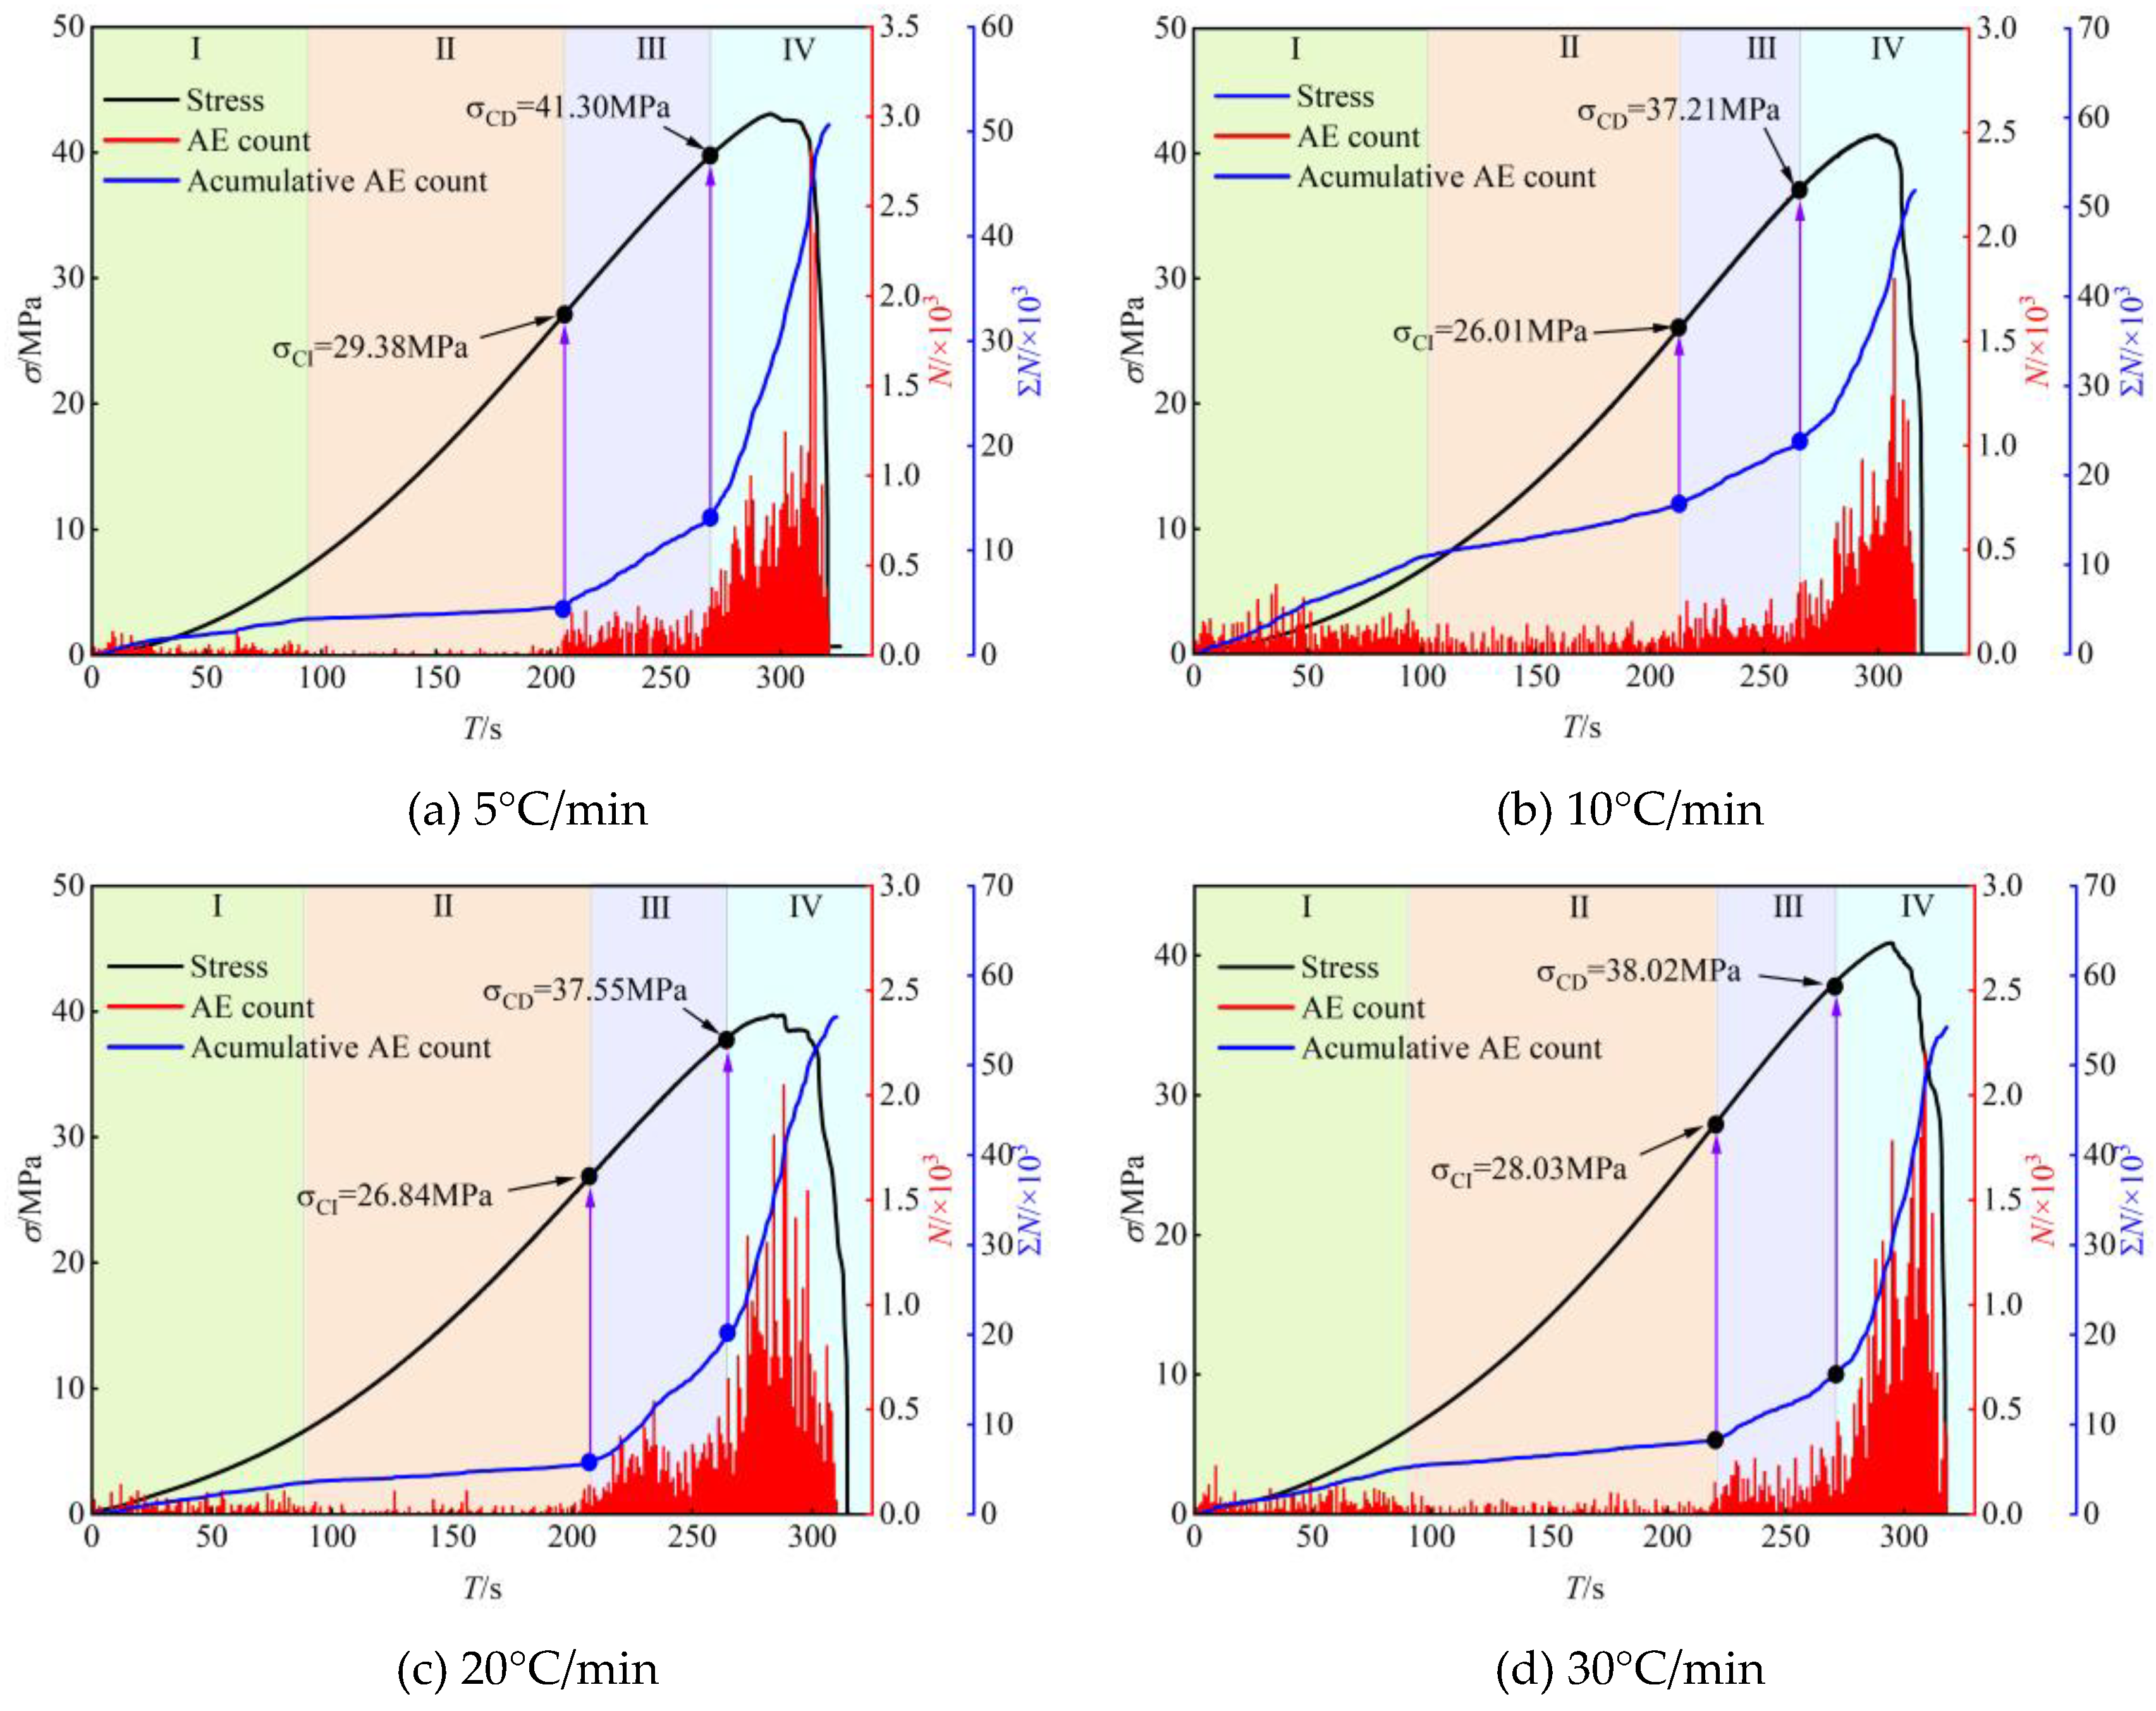
Figure 11 give the ringer counting characteristics during the uniaxial compressive deformation damage process of sandstone after experiencing different high temperatures and at different warming rates, respectively; limited to space, only one typical rock sample characteristic is given for each temperature and warming rate.
From the figure, it can be seen that the variation of ringer counts is roughly divided into four stages, stage I corresponds to the compression-density stage of the stress-strain curve, at this time, the rock samples in the lower stress under the role of some of the original microcracks within the closure of the acoustic emission events will be low. Stage Ⅱ corresponds to the approximate elastic deformation stage, where the micro-defects of the rock samples do not change much and are not enough to form new micro-cracks, and the rock mainly accumulates elastic energy at this stage, with fewer acoustic emission events, and the cumulative ring count curve basically grows linearly and slowly. Stages Ⅰ and Ⅱ can be regarded as a quiet period with few acoustic emission events. As the load continues to increase into stage Ⅲ, the low amplitude growth period, the internal microcracks of the rock samples are gradually generated and expanded, the acoustic emission events begin to tend to be active, the ringing counts increase significantly, and the slope of the cumulative ringing count curve begins to increase. In stage Ⅳ, the internal newborn microcracks penetrate each other and start to change from stable to unstable expansion, the ringing counts increase rapidly, and the slope of the cumulative ringing count curve increases significantly, and this stage is a period of high growth. The closer to the peak stress the rock releases more energy, the more obvious the acoustic emission counts. By observing the change rule of AE ringing counts to predict the damage of sandstone to a certain extent, this can theoretically provide timely disaster warning for underground engineering projects.
4.1. Variation Law of Ringing Count
As can be seen from
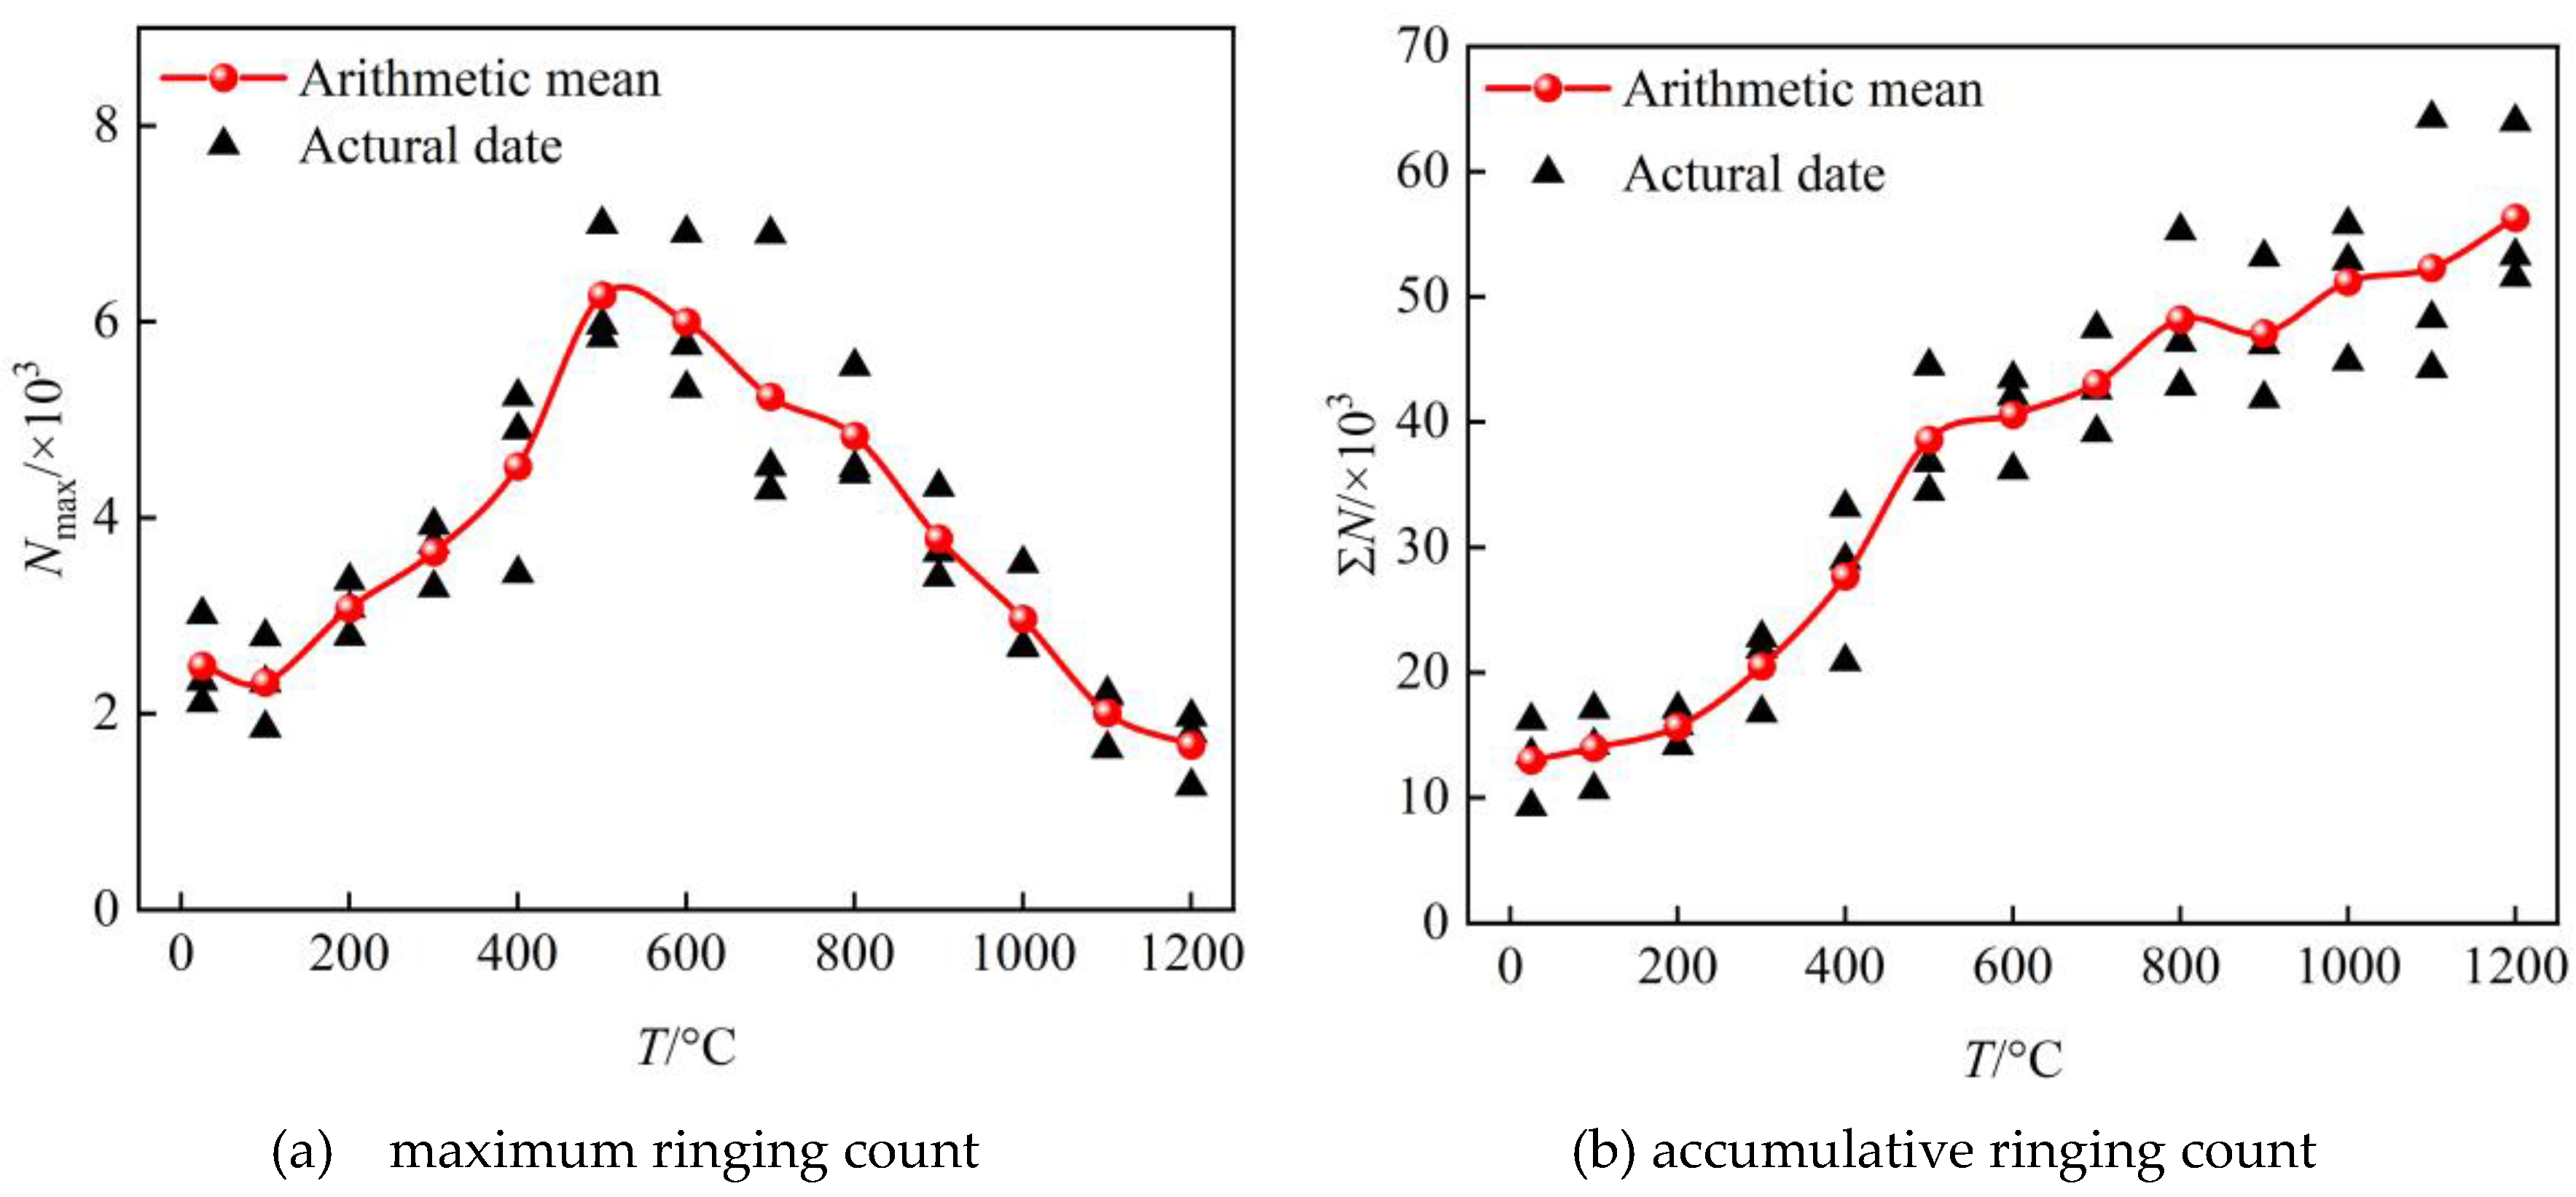
Figure 12, the maximum value of ringing count
Nmax increases and then decreases with increasing temperature, and the cumulative ringing count
increases continuously with increasing temperature. The maximum and cumulative ringing counts at room temperature were 2.48×10
3 and 13.25×10
3, respectively. With the continuous volatilization of water and contraction of primary pores at elevated temperatures, the brittleness and compressive strength of the sandstone were enhanced, the maximum ringing counts continued to increase, and reached a peak at 500°C, and the cumulative ringing counts also increased continuously in this temperature range. At 500°C, the maximum ringing count and cumulative ringing count were 6.27×10
3 and 38.68×10
3, respectively, an increase of 152.82% and 191.92% compared to room temperature. When the temperature is 600°C, the acoustic emission signal of sandstone is more frequent, due to the sandstone at this high temperature has formed damage, part of the work done by the external force is dissipated by the rock particles along the micro-defective surface of the shear movement, the release of the elastic energy decreases resulting in the acoustic emission ringing counts of the intensity of the reduction, and with the increase in temperature thermal damage in the increasing, the maximum ringing counts at 1200°C is 1.68 × 10
3, a decrease of 73% compared to 500°C. As the ductility of sandstone is enhanced by high temperature, the thermal damage increases the microcracks inside the rock, and although the maximum intensity of the acoustic emission signal decreases, it occurs more frequently, and the distribution area of acoustic emission activity band is widened near the peak, which makes the cumulative ringing counts increase with the temperature, and the maximum ringing counts at 1200°C is 56.36 × 10
3, which is a 45.71% increase compared with 500°C. The maximum ringing counts at 1200°C is 1.68 × 10
3, which is a 73.21% decrease compared with that at 500°C.
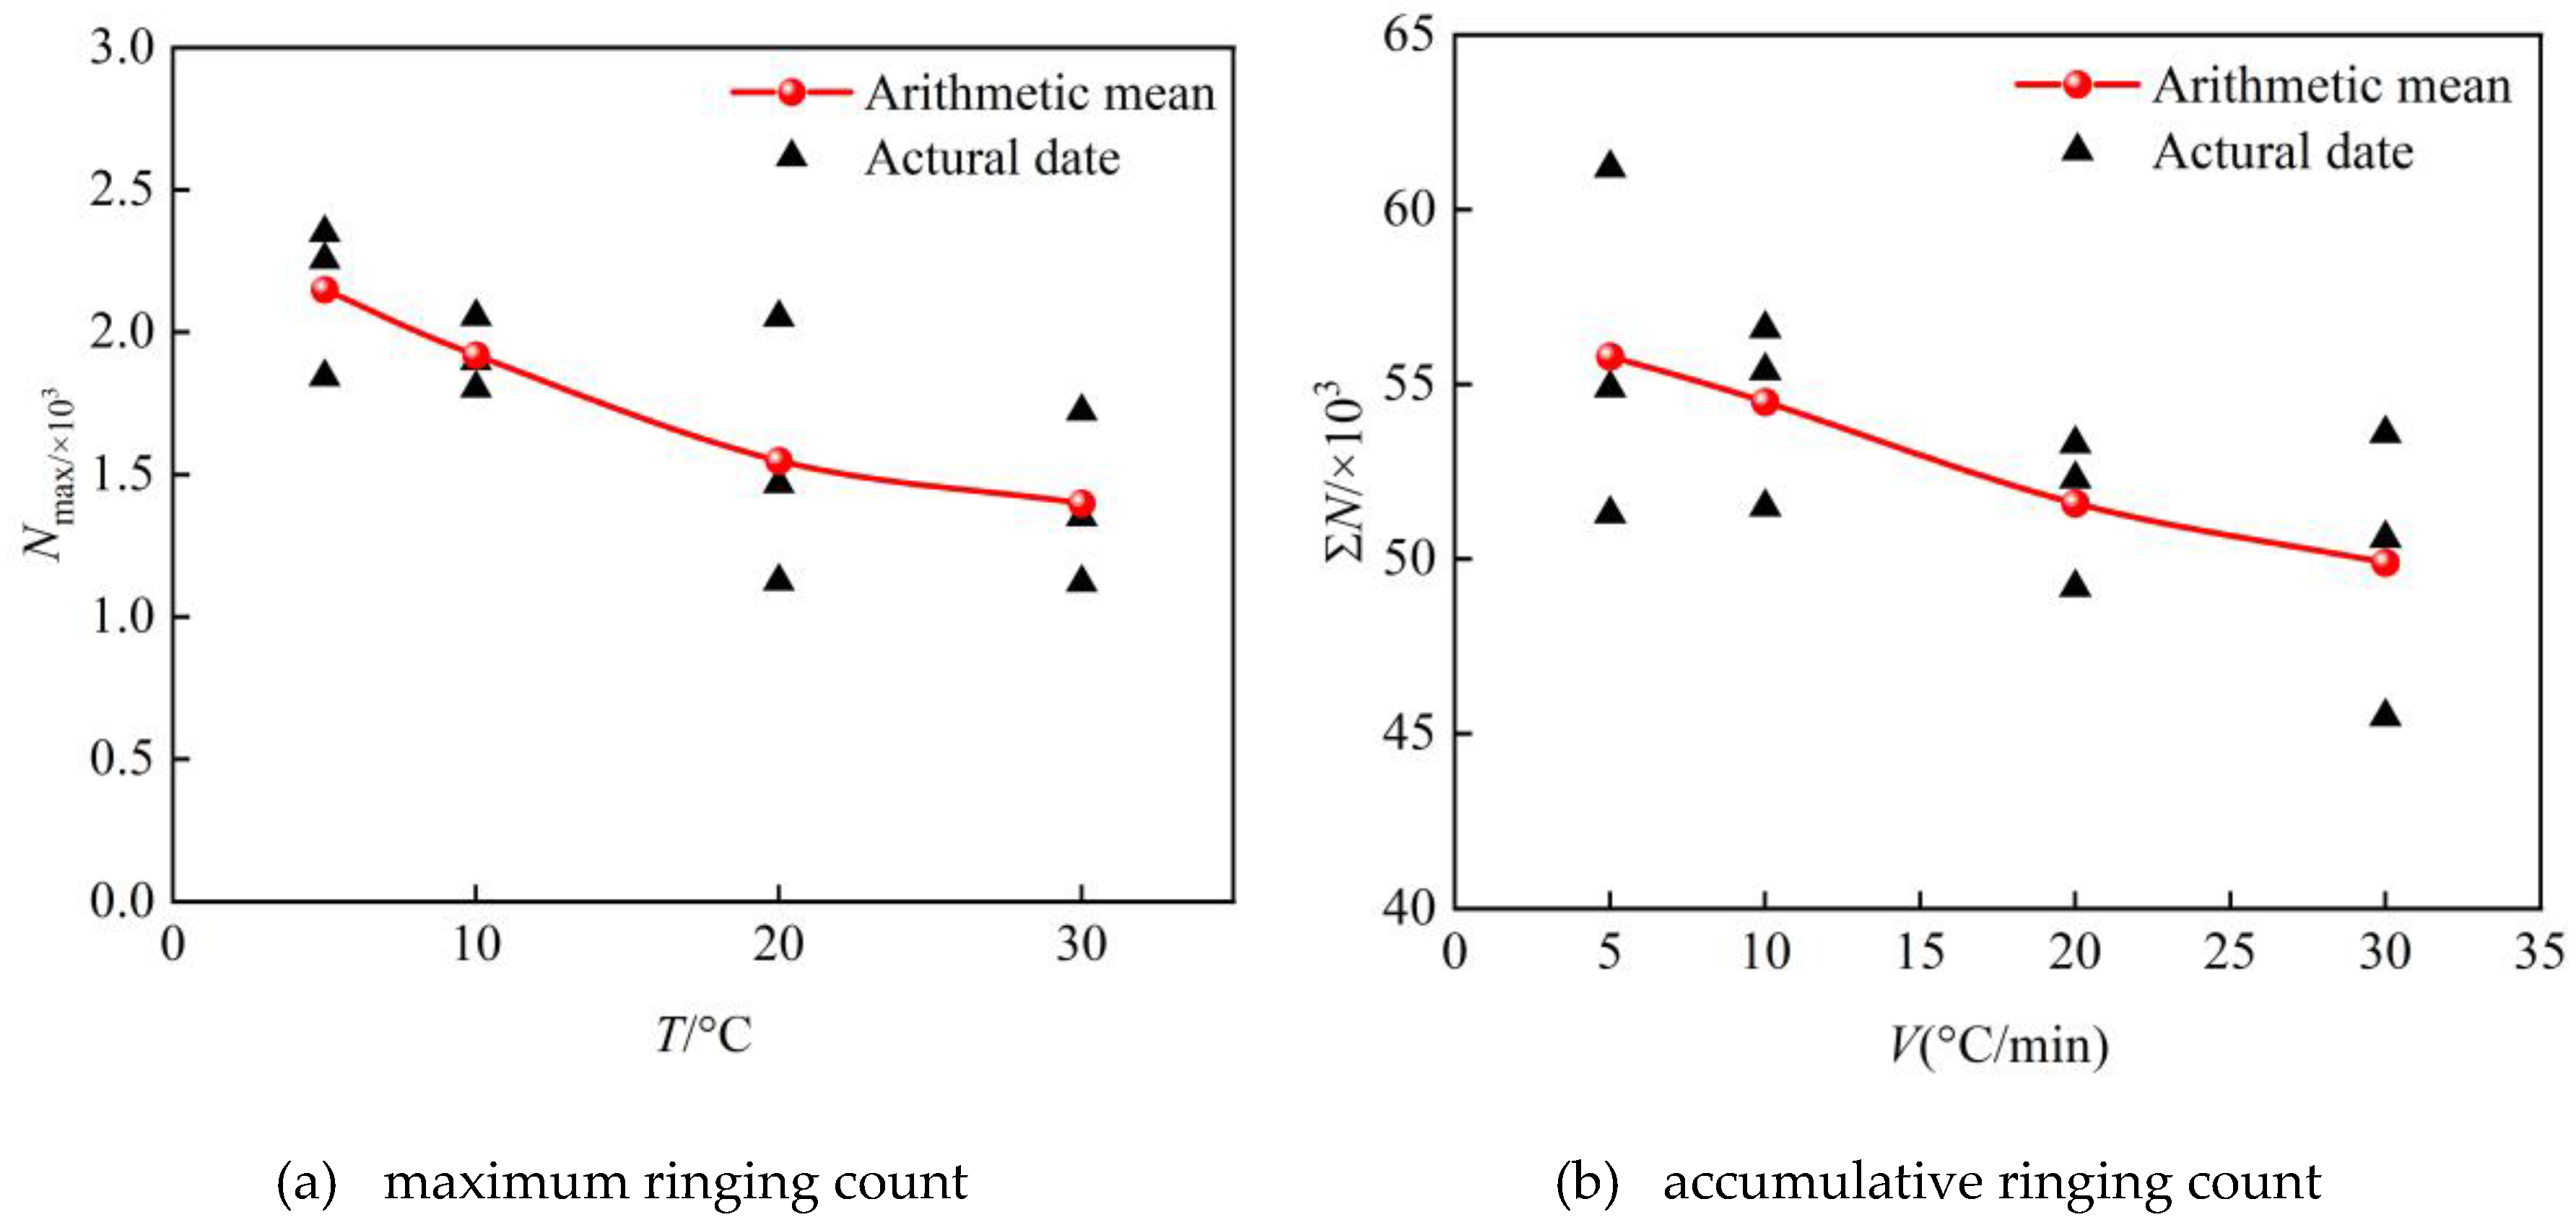
Under the influence of higher heating rate, the expansion of cracks and crystals in sandstone is more intense, and the rock damage is more serious. From
Figure 13, the maximum ringing counts show a decreasing trend with the increase of heating rate, and the decrease of the overall ringing counts also leads to the decrease of the cumulative ringing counts with the increase of temperature, because the heating rate does not have a significant effect on the activity range of acoustic emission at the same temperature. At 5°C/min, the maximum and cumulative ringing counts were 1.85×10
3 and 55.82×10
3, and at 30°C/min, the maximum and cumulative ringing counts were 1.39×10
3 and 49.97×10
3, which were 24.8% and 10.48% lower than the same period of the previous year, respectively.
4.2. Variation Law of Stress Threshold
In the research on the determination of crack initiation threshold stress
and damage threshold stress
using acoustic emission technology, scholars have given different methods. Wang [
28] pointed out that the stress when the first tensile crack appeared in the rock sample was the crack initiation stress. It has been shown that crack initiation and damage stress thresholds can be effectively determined by using the mutation points of the cumulative AE counts curve, where the stress at the point of the first mutation can be taken as the crack initiation stress, and the stress at the point where the slope of the cumulative curve of the AE parameter has increased dramatically can be taken as the crack damage stress threshold [
29].
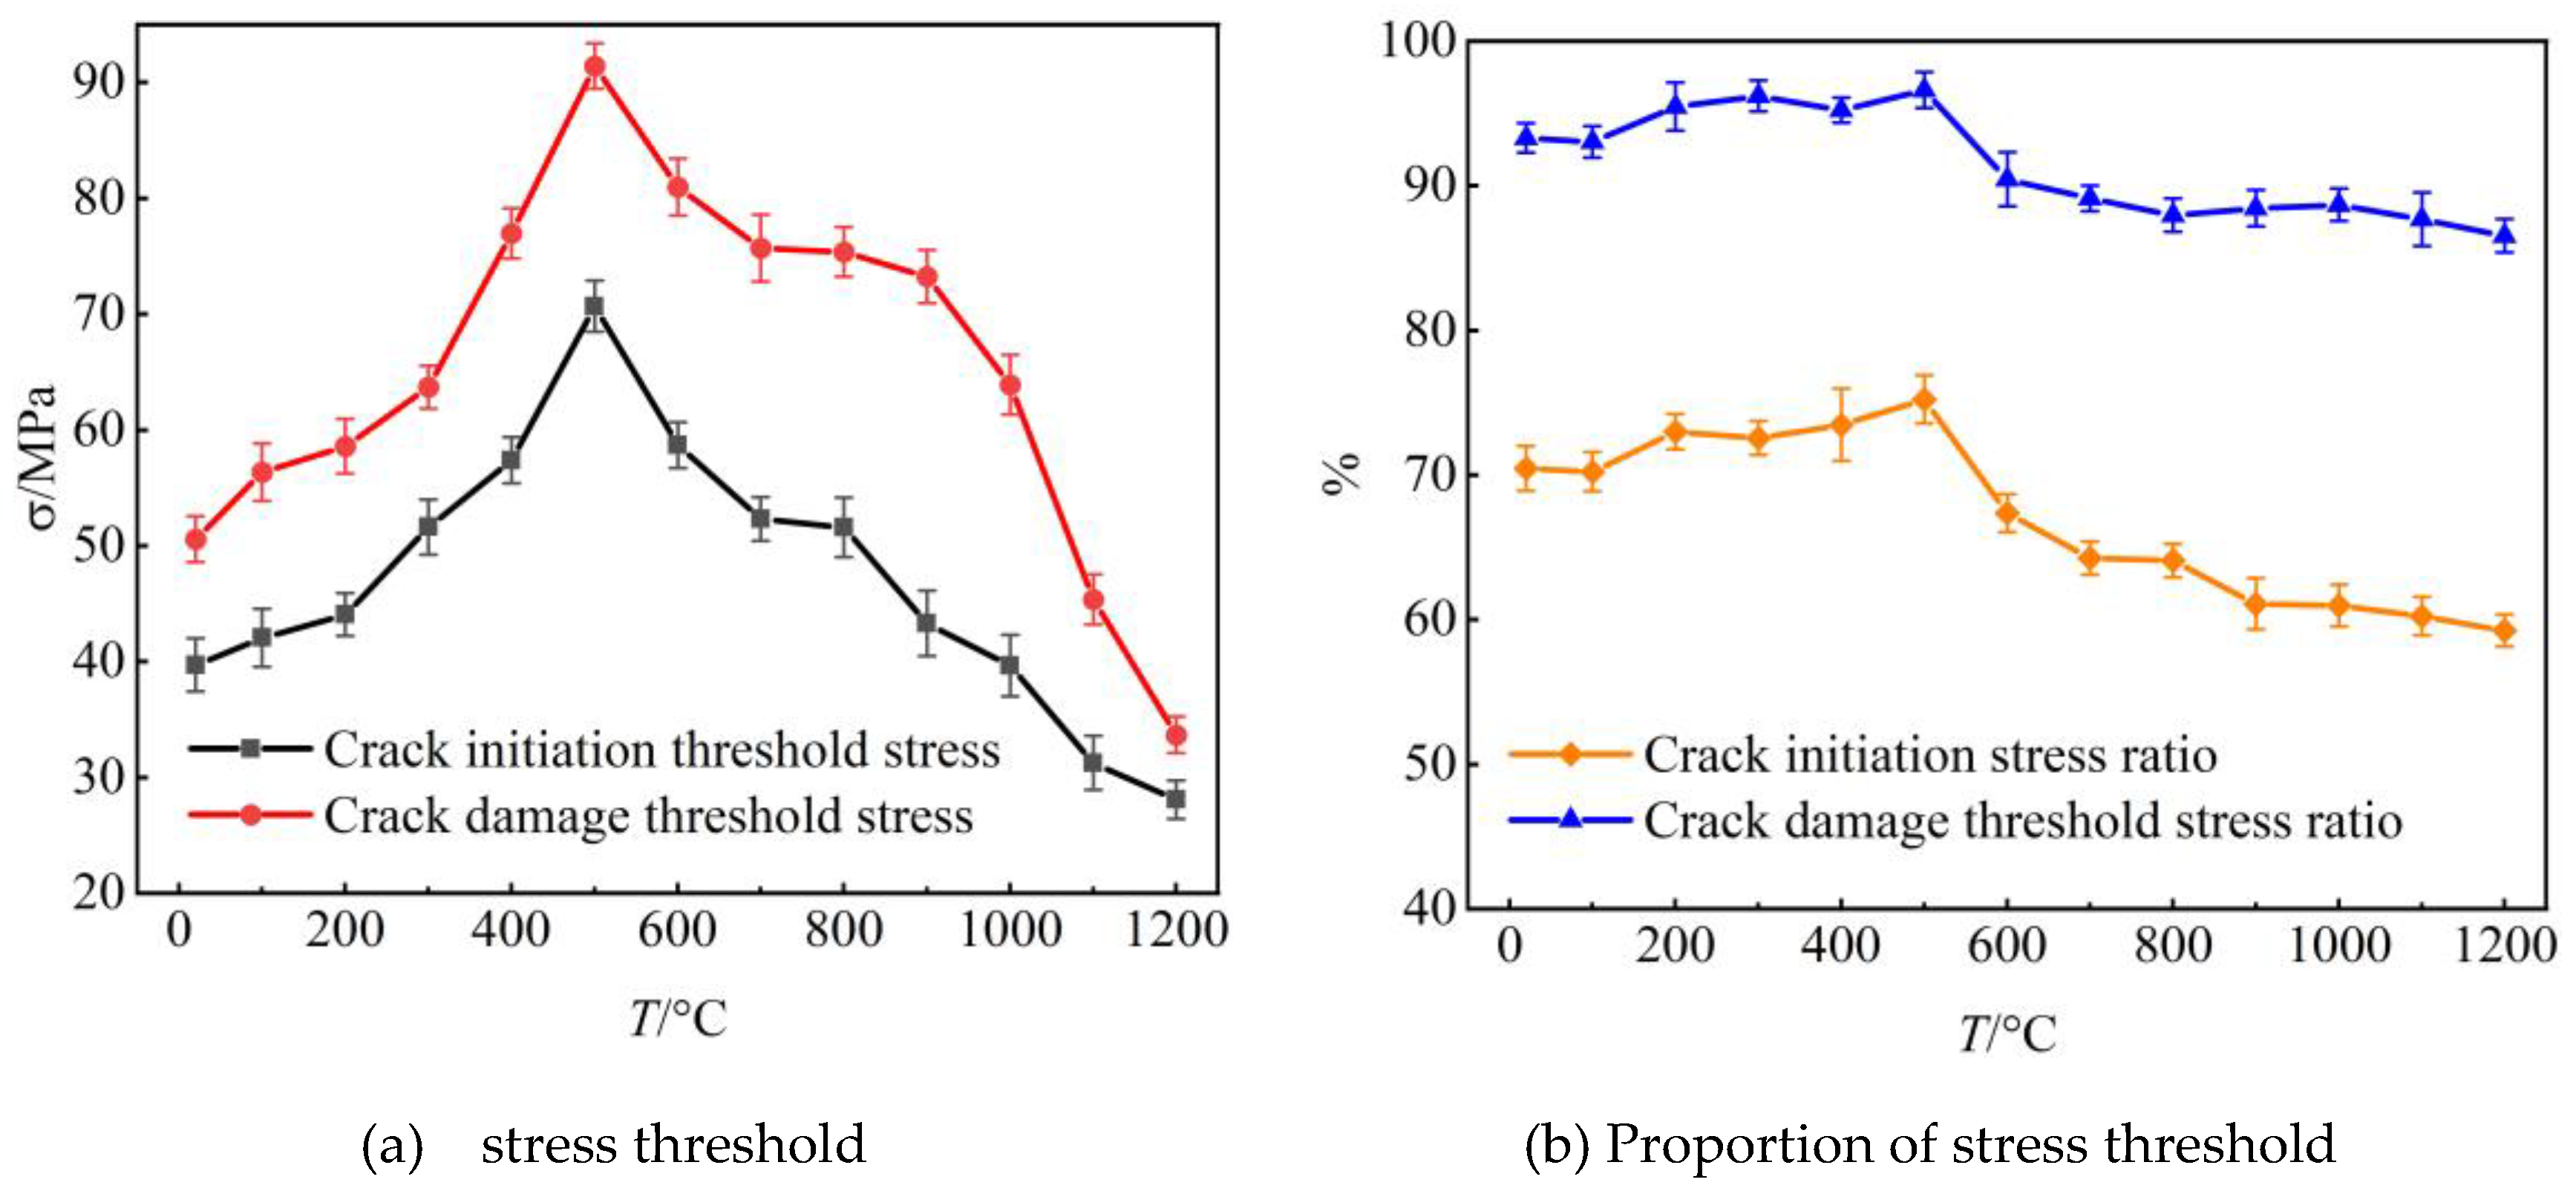
As can be seen from
Figure 14(a), with the increase of temperature, the crack initiation and damage threshold both show the trend of rising first and then decreasing, which is consistent with the characteristics of the change of peak stress with temperature. When the temperature increases from room temperature to 500°C, the crack initiation threshold increases from 39.72 MPa to 70.67 MPa, with an increase of 69.36%, and the damage threshold increases from 50.57 MPa to 91.41 MPa, with an increase of 80.75%, and the crack initiation and damage thresholds reach the maximum at 500°C. After this temperature to 1200°C, the crack initiation and damage thresholds began to decrease continuously, and the crack initiation threshold at 1200°C was 28.09 MPa, and the damage threshold was 33.68 MPa, which were 60.25% and 63.15% lower than that of 500°C. The above analysis shows that the temperature has an important effect on the crack initiation and damage thresholds, and has a high correlation with the strength of sandstone.
According to
Figure 14(b), the crack initiation threshold is about 58%-76% of the peak stress and the damage threshold is about 86%-96% of the peak stress at room temperature up to 1200°C, and the ratio shows a certain trend of change depending on the temperature. Before 500°C, the percentage of crack initiation threshold and the percentage of damage threshold changed less, but generally showed an increasing trend, the percentage of crack initiation threshold and the percentage of damage threshold increased from 70.46% and 93.31% to 75.23% and 96.61%, which indicated that the brittleness of the sandstone was enhanced to a certain extent in this temperature range, and the crack initiation threshold and damage threshold were closer to the peak stress. At 600°C, the percentage of crack initiation threshold and damage threshold decreased to 67.38% and 90.44% respectively, indicating that the physical and chemical properties of the rock in the temperature range of 500-600°C have been greatly altered to produce certain damage. As the temperature continues to drop to 1200°C, the percentage of crack initiation thresholds and damage thresholds show a decreasing trend, and the percentages of crack initiation thresholds and damage thresholds at 1200°C are 59.26% and 89.54%, respectively, which indicates that the thermal damage will make the rock cracking damage at a lower stress level.
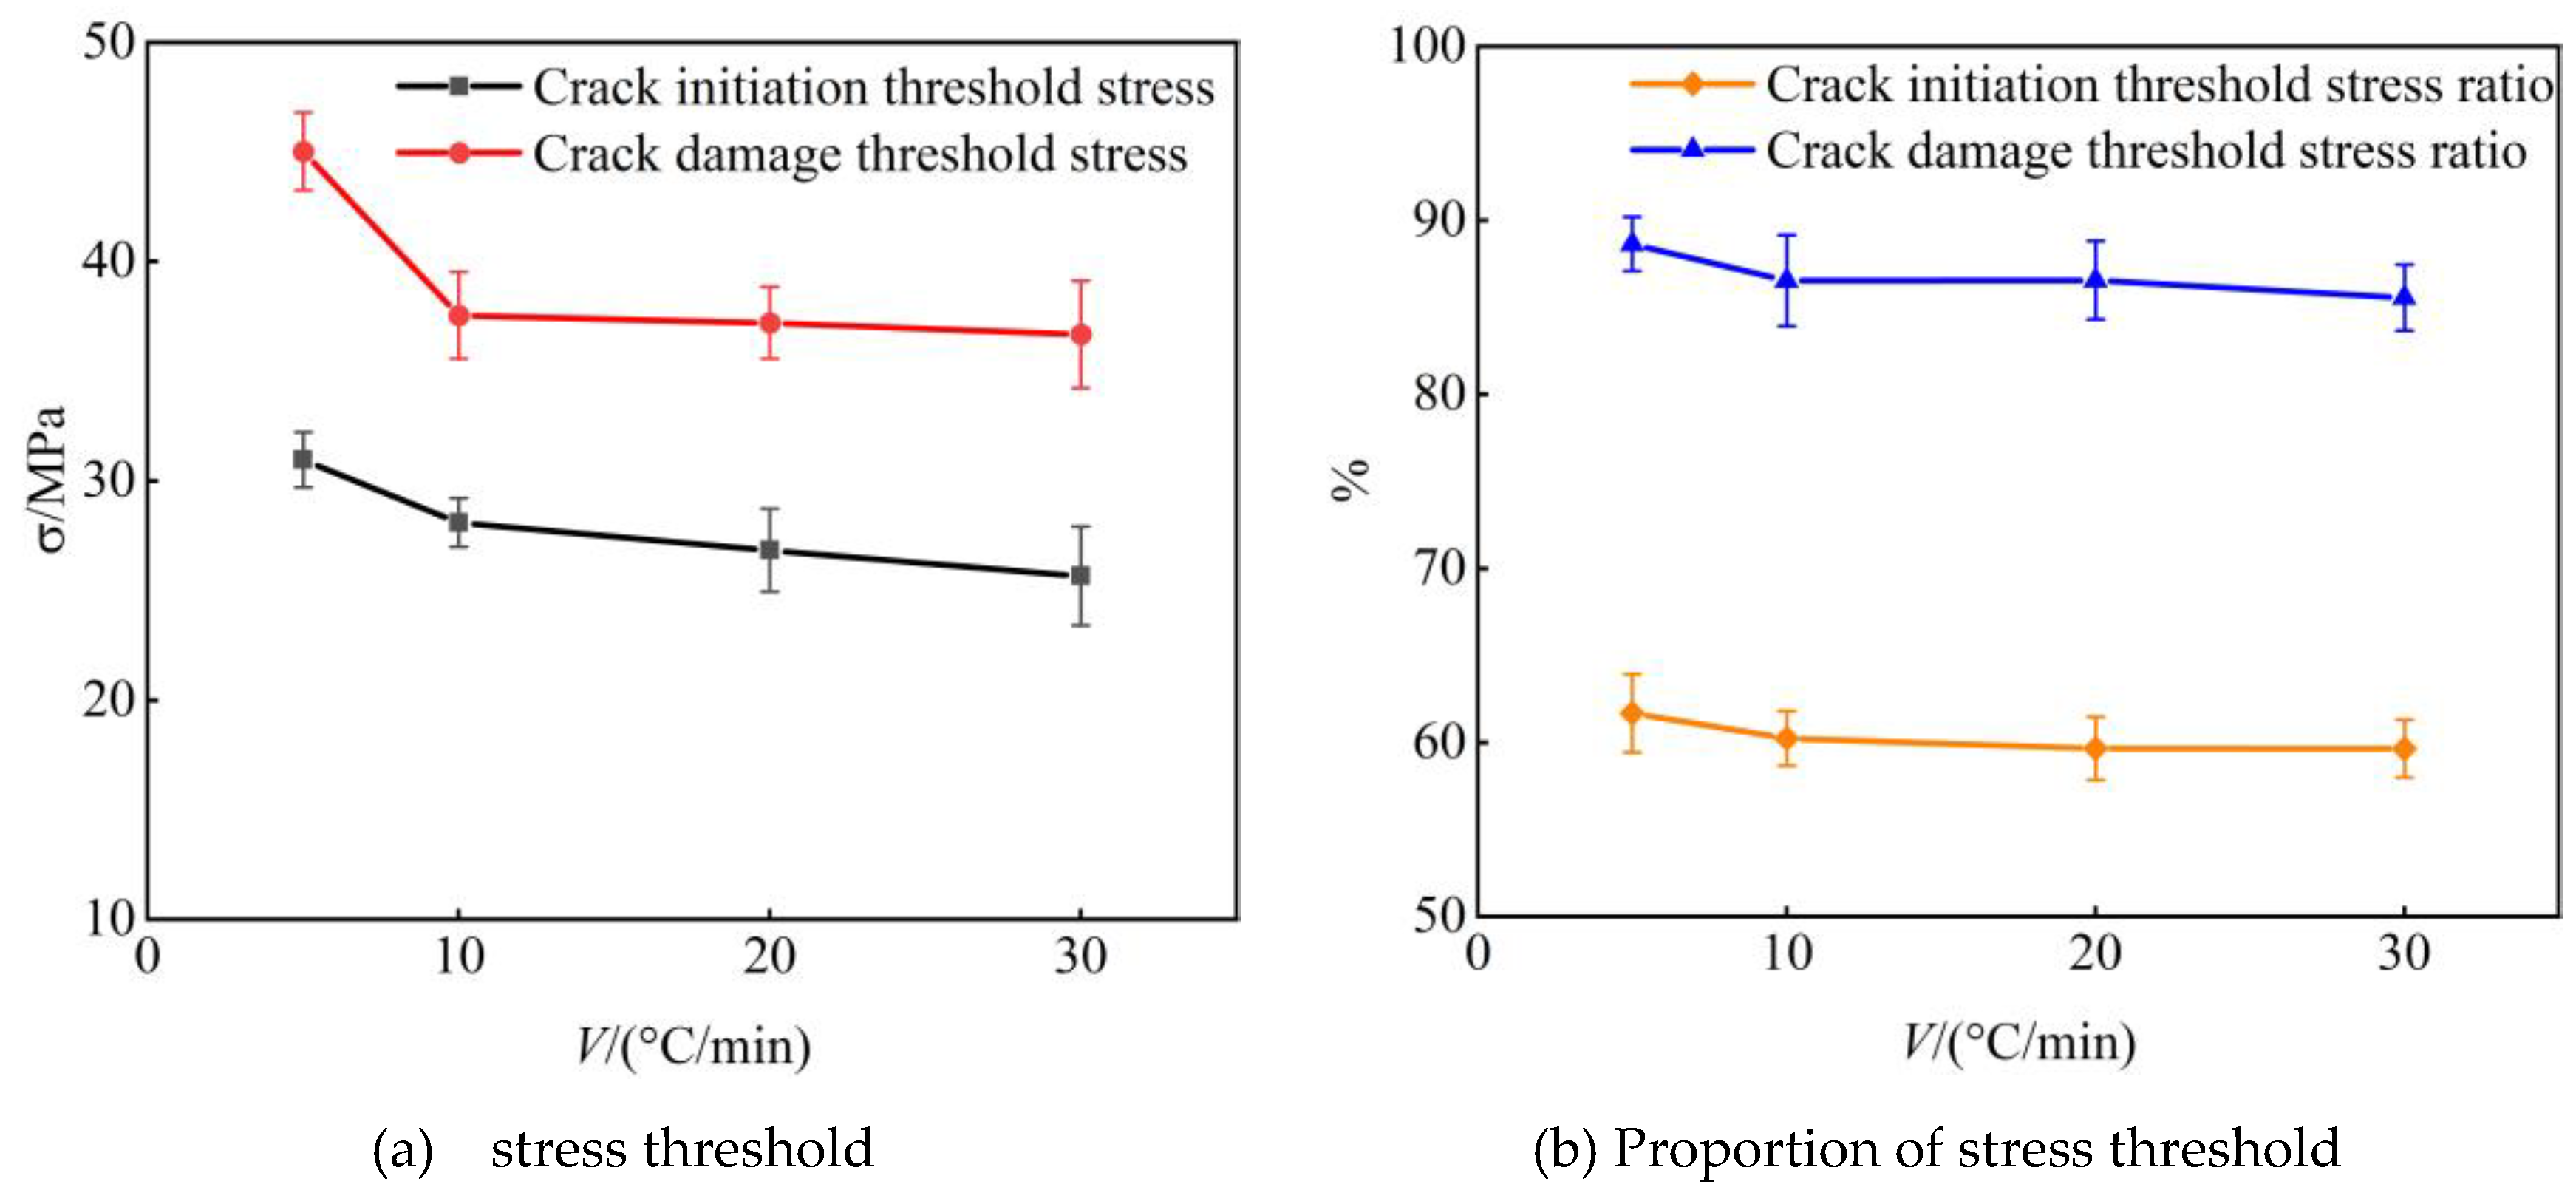
The heating rate also influences the crack initiation threshold and damage threshold and their percentage. From
Figure 15(a), the crack initiation threshold and damage threshold are 30.96 MPa and 45.52 MPa at 5°C/min, and 25.66 MPa and 36.68 MPa at 30°C/min, which show a decreasing trend with the heating rate, and this trend is also very much correlated with the change of the peak stress by the heating rate. According to
Figure 15(b), the crack initiation threshold and damage threshold ratio is not significantly influenced by the heating rate and are more affected by the temperature.
5. Discussion
The mechanical properties of sandstone at high temperatures and different heating rates at high temperatures were analyzed by uniaxial compression test, and the temperature effect and strain rate effect of sandstone pore structure characteristics were clarified by acoustic emission test, and finally the temperature effect of micro-morphological characteristics of sandstone fracture surfaces was analyzed by electron microscope scanning test, which ultimately revealed the damage rupture mechanism of sandstone under the action of high temperatures.
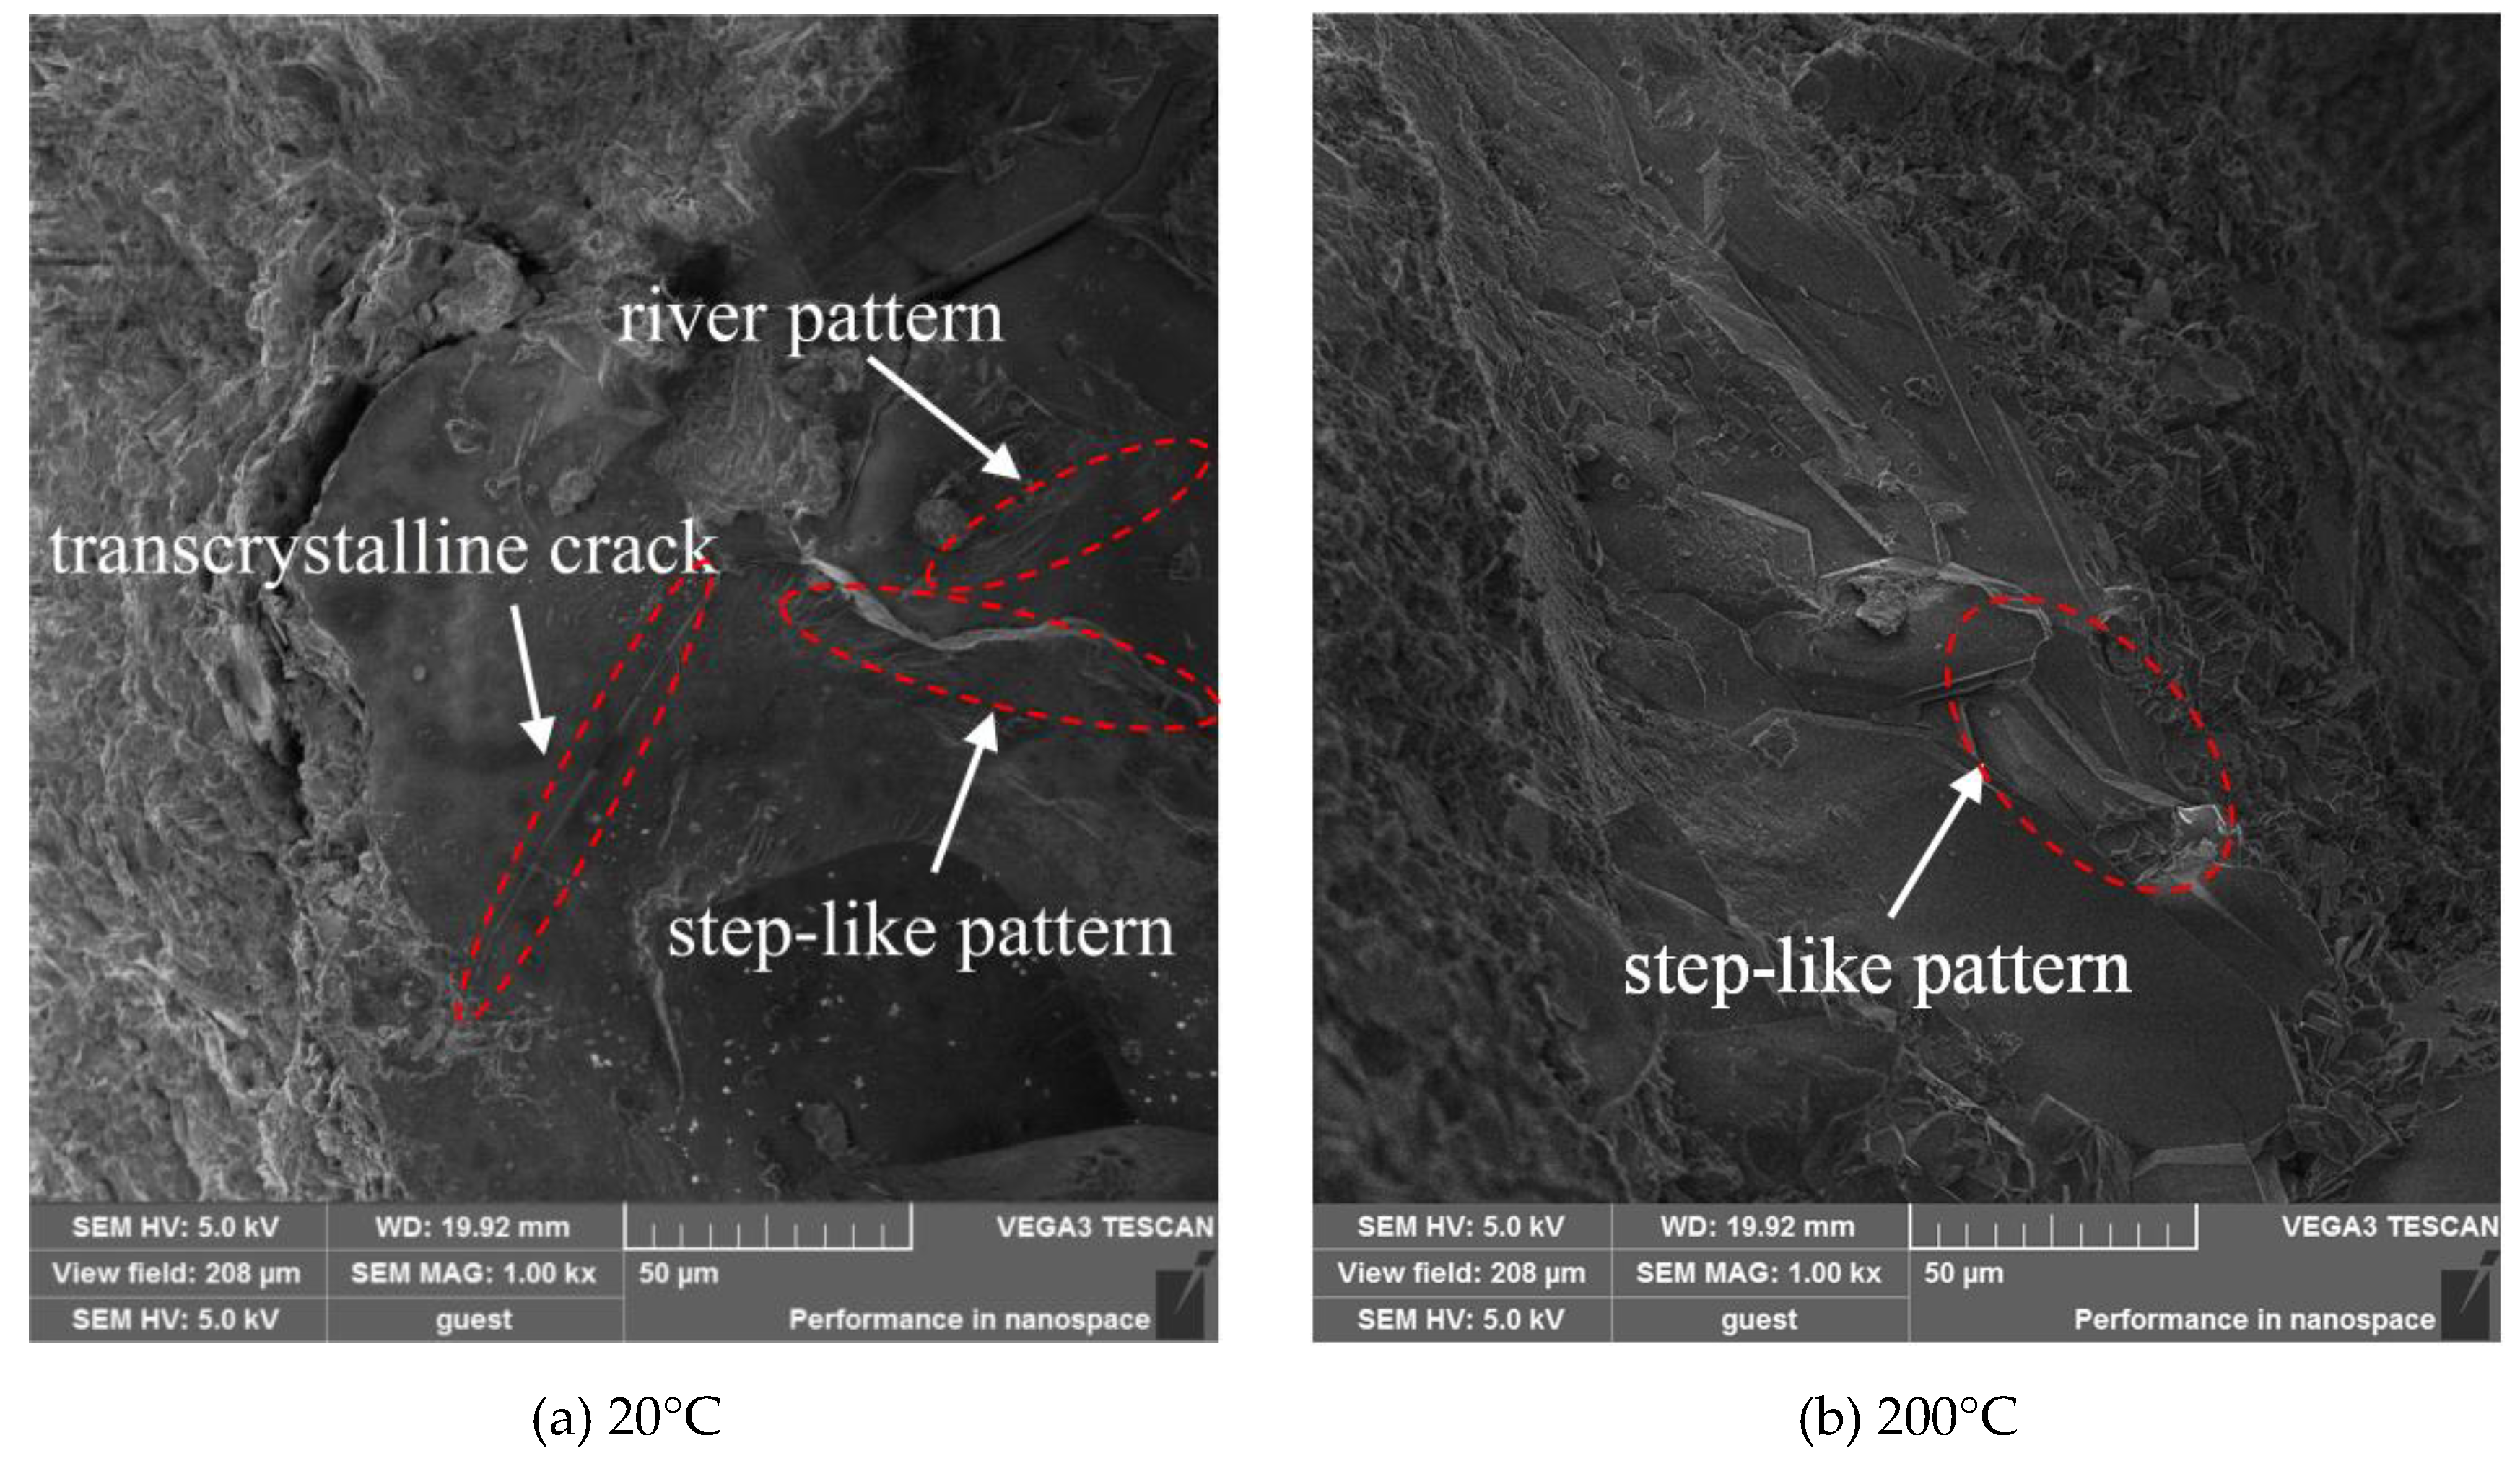
According to
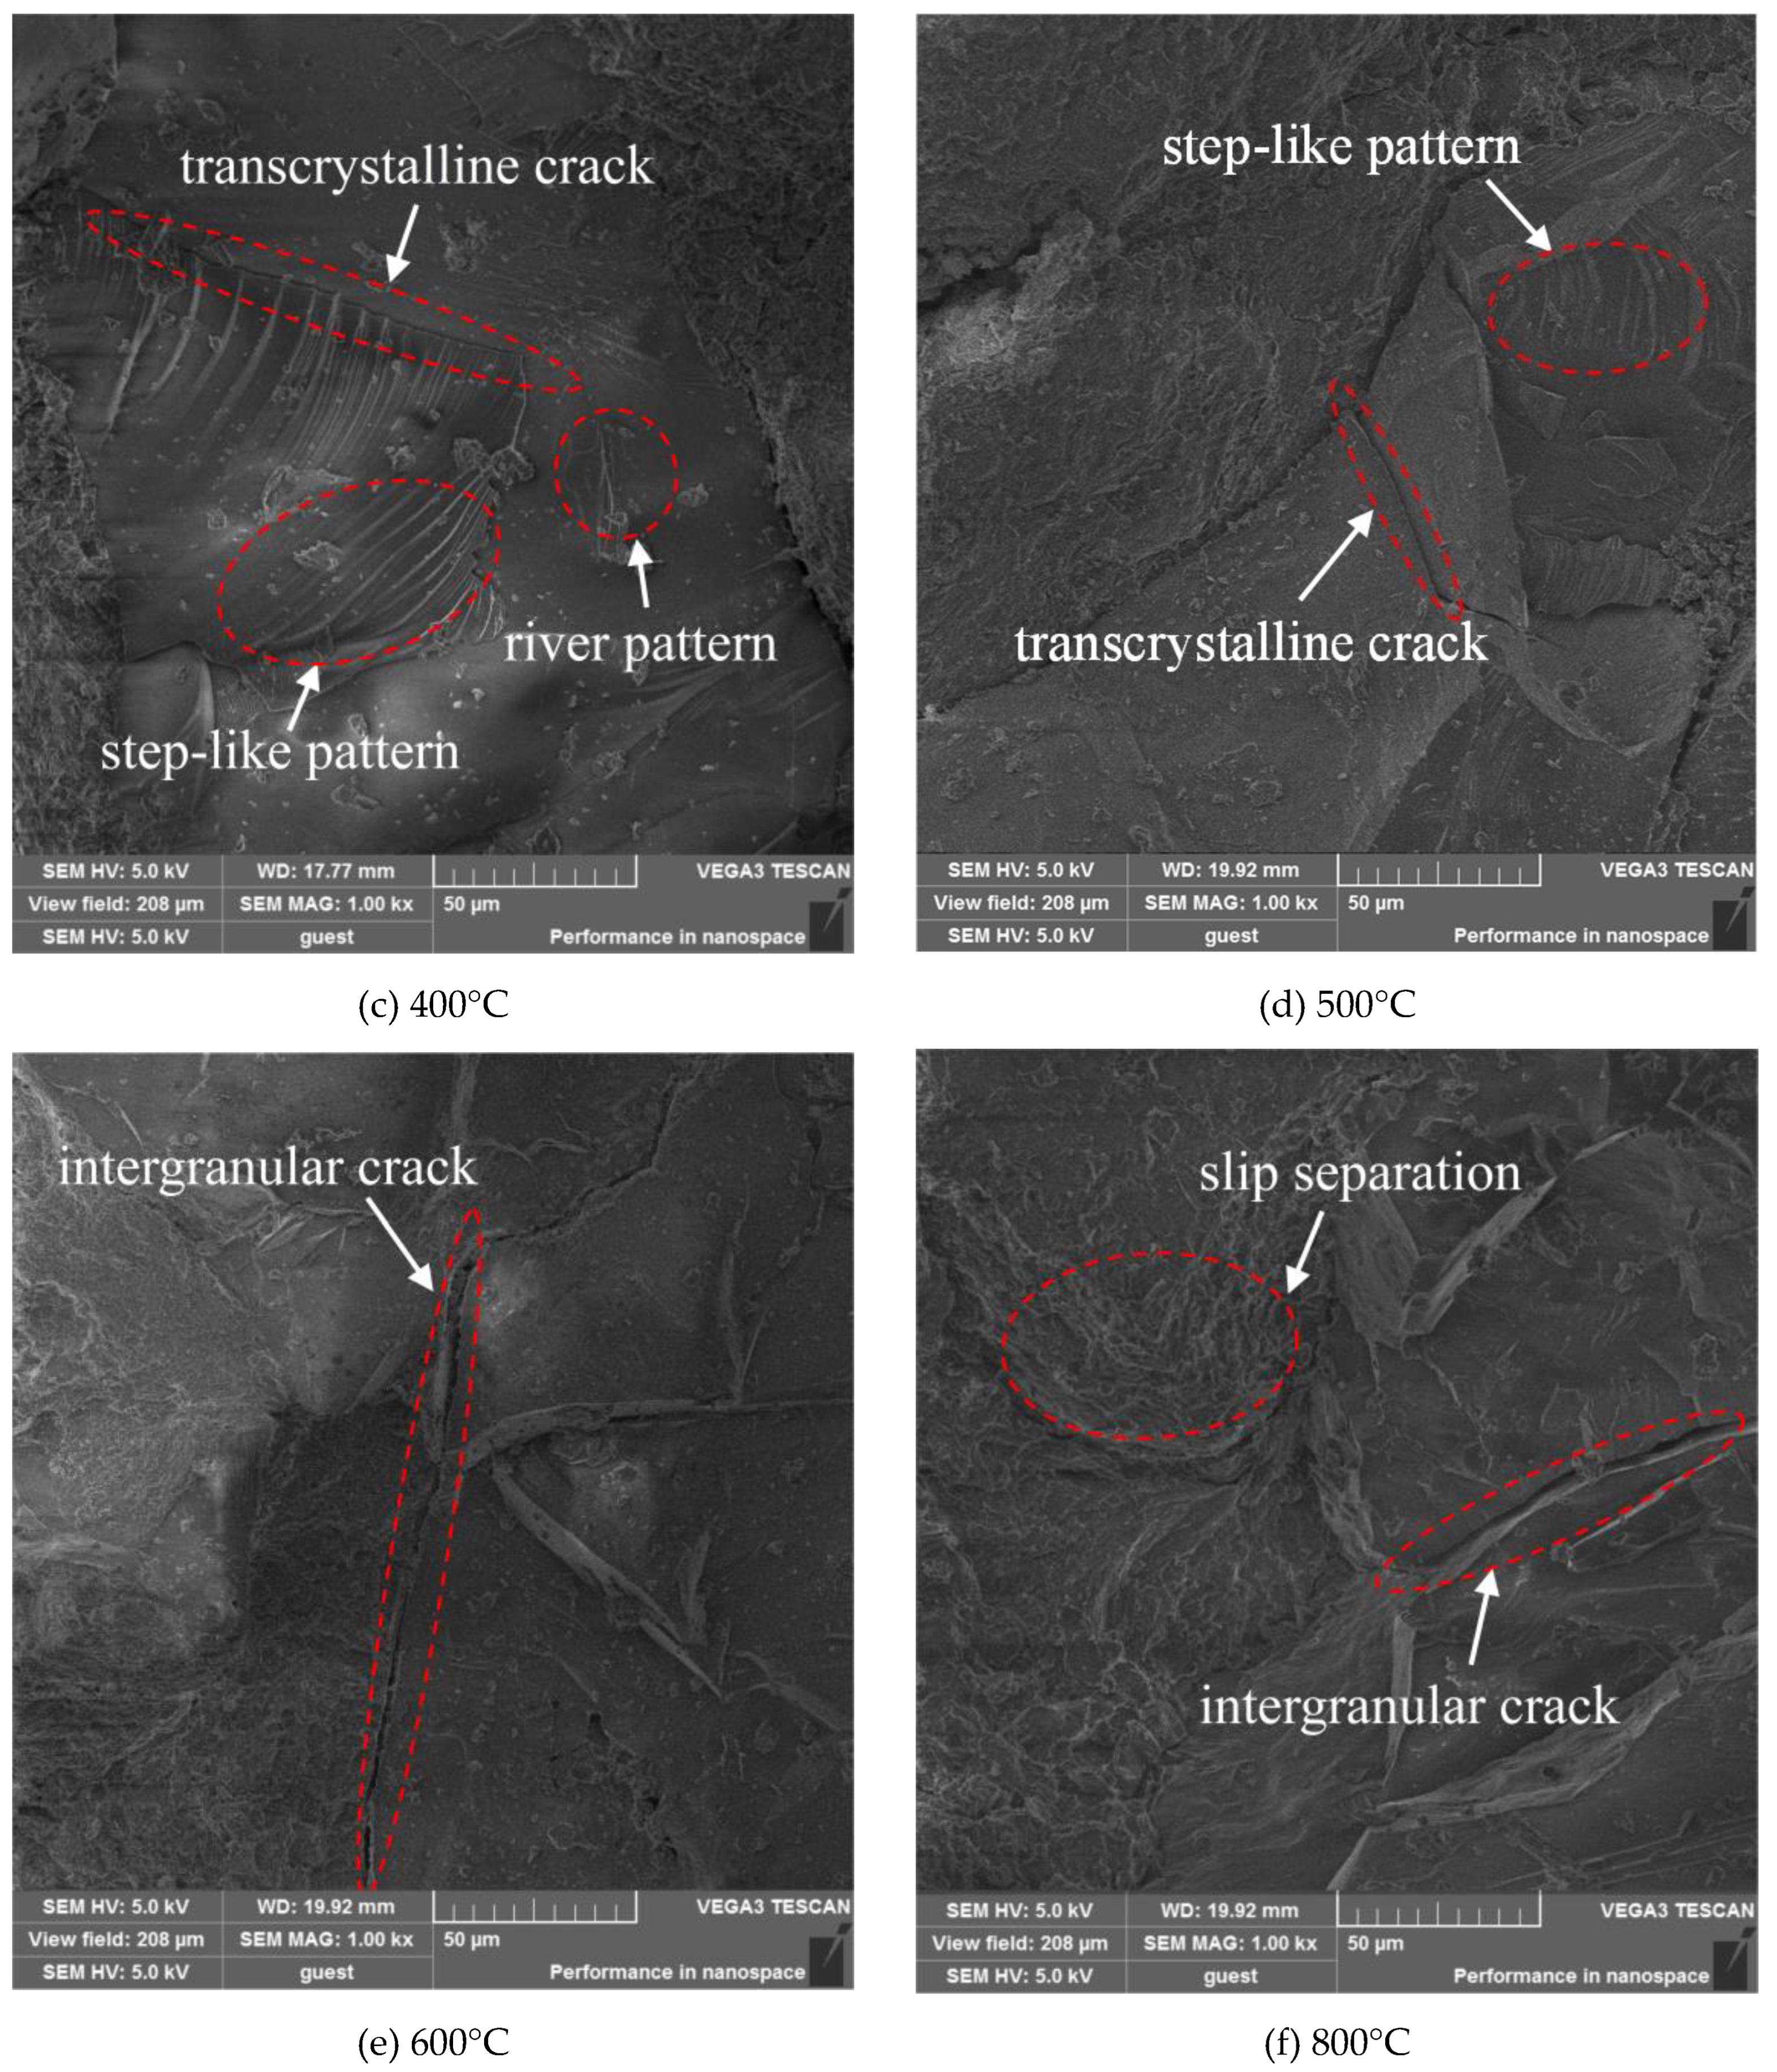
Figure 16, pores and cavities already exist in the sandstone microstructure at room temperature. With the increase in temperature before 500°C, the rock matrix and crystal particles are more tightly cemented, and the thermal expansion of mineral particles leads to the closure of primary fissures, the degree of densification is increased, and the relative ratio of pores and cavities is significantly reduced compared with that at room temperature. At the same time, along with the evaporation of water, the brittleness of sandstone is enhanced, which also leads to the increase of peak stress and modulus of elasticity of sandstone with the increase of temperature, and the peak strain is not obvious with the change of temperature. From the fracture morphology, the fracture surface is mainly dominated by step-like patterns, river patterns and transcrystalline cracks, which are typical brittle fracture patterns, and it can be concluded that the fracture surface of the sandstone at 500°C shows significant brittle fracture.
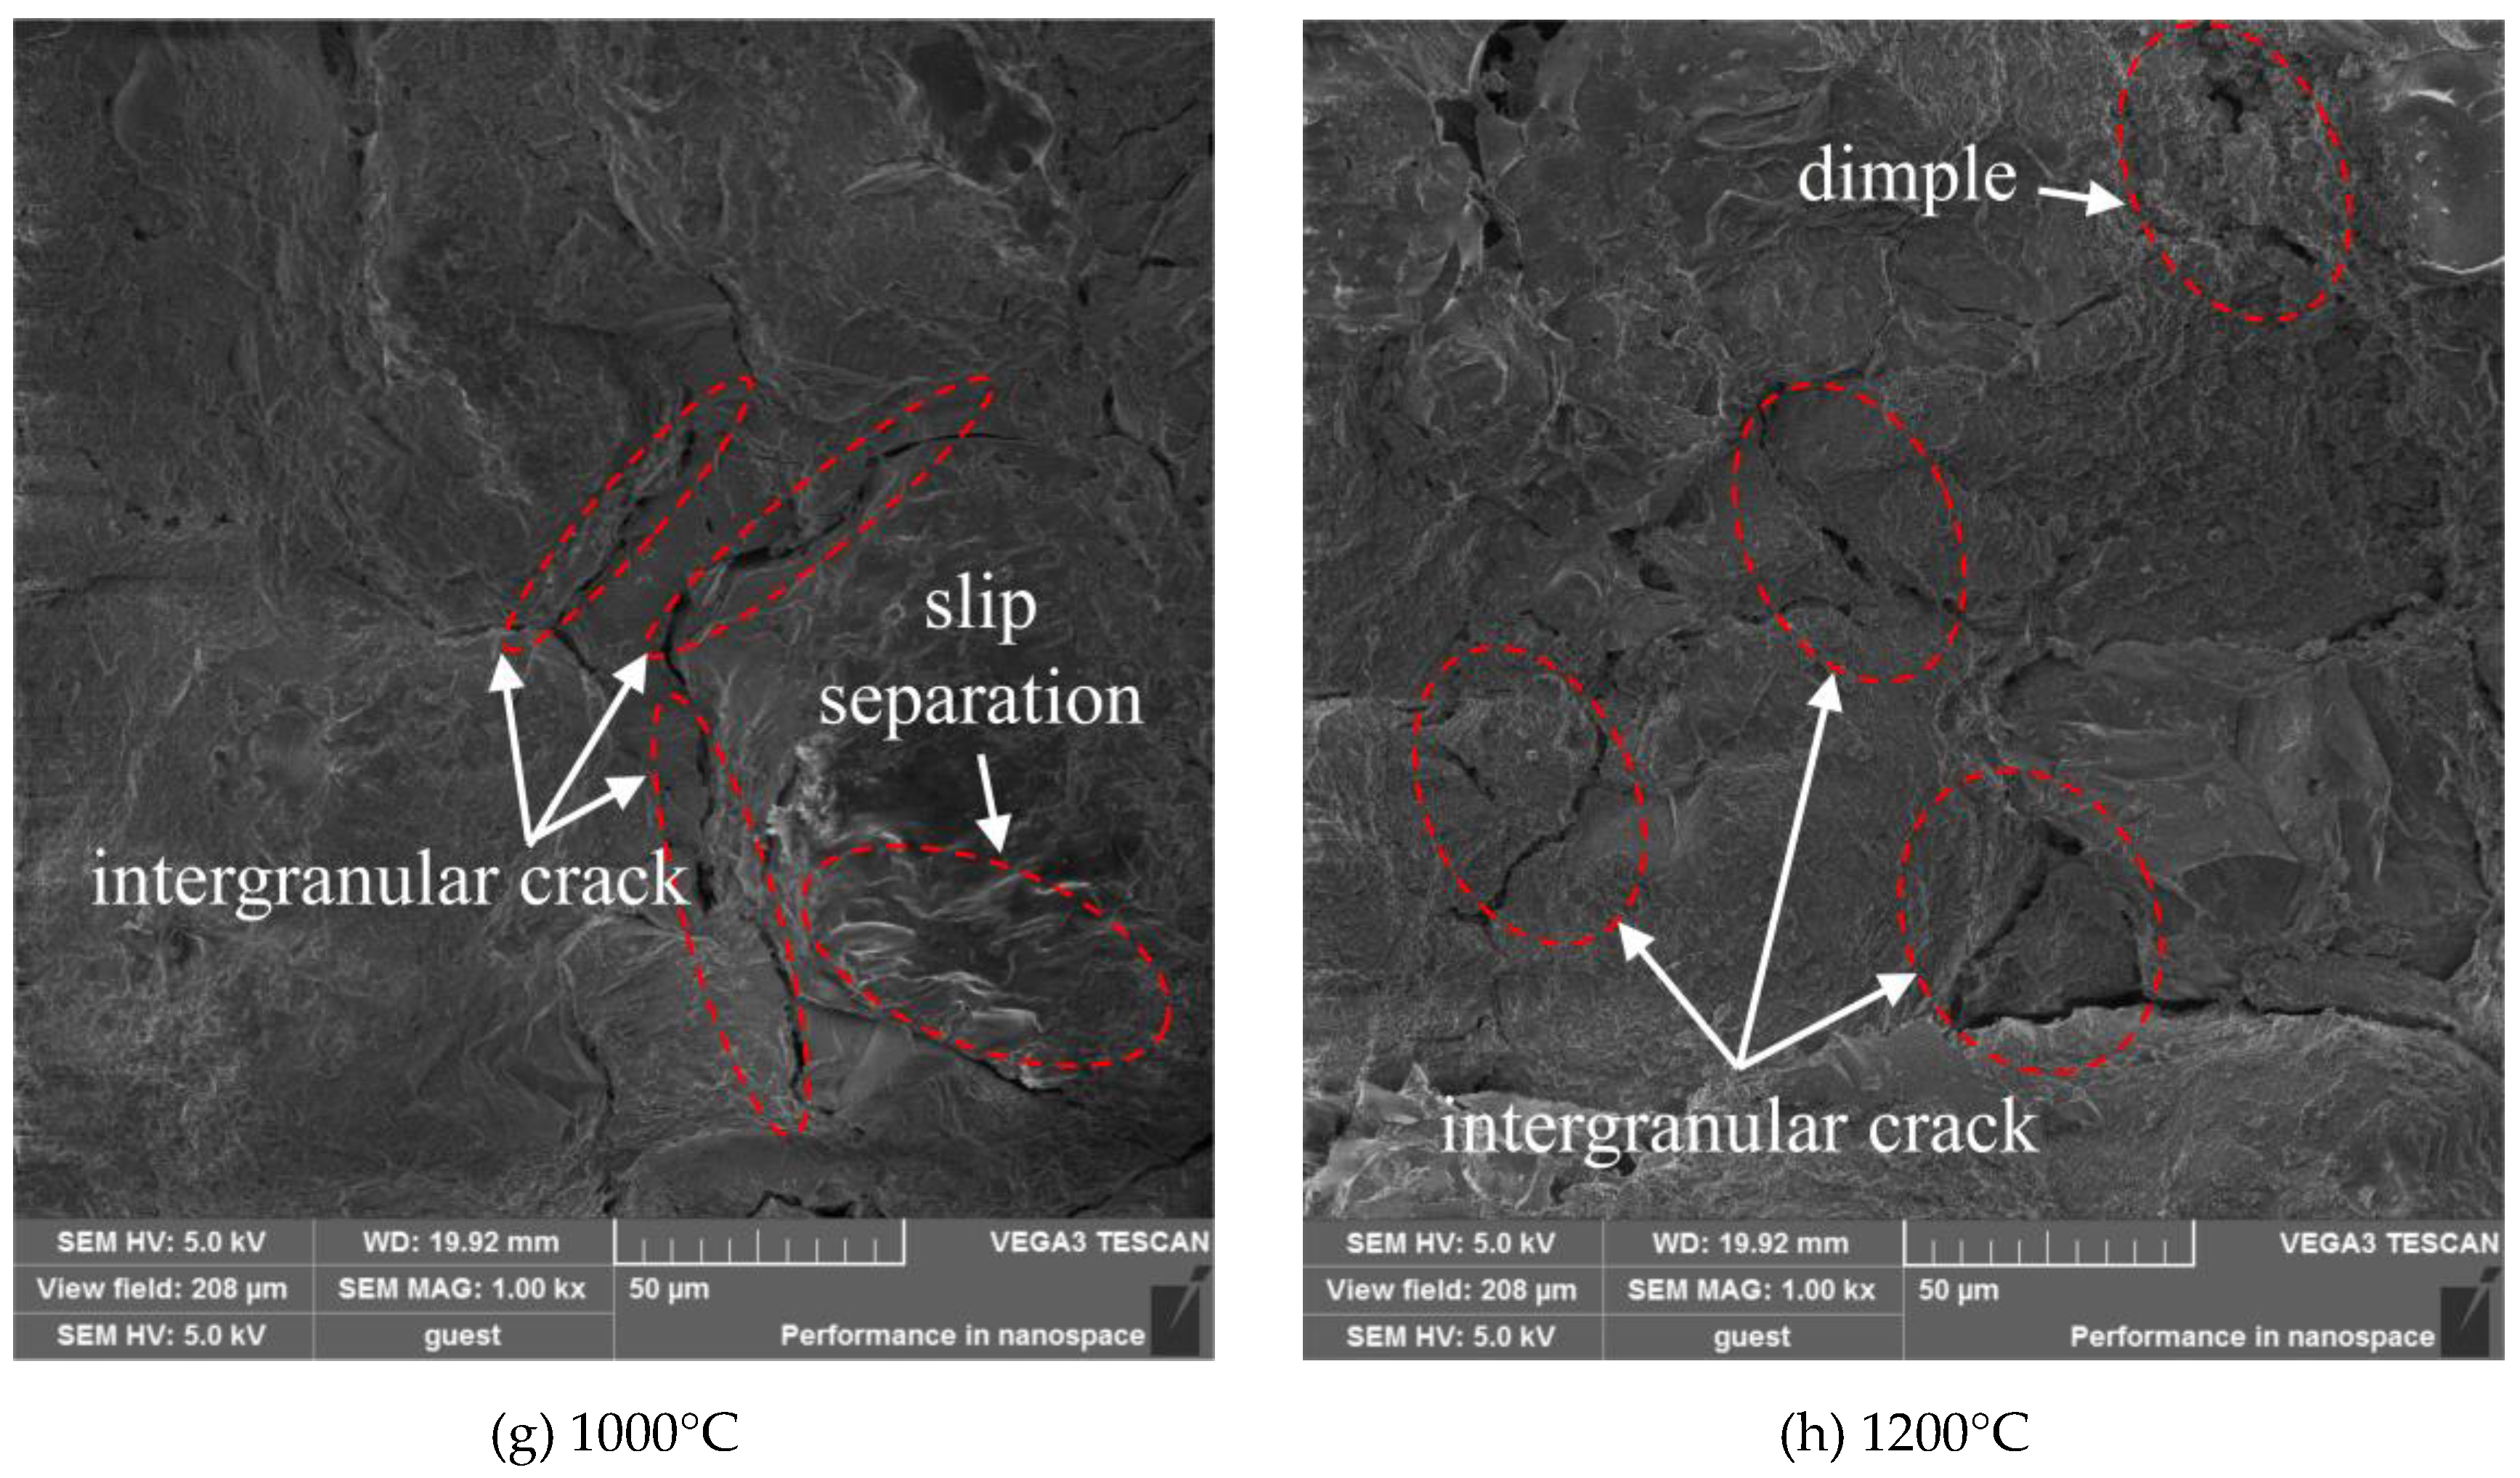
At 600℃, thermal damage starts to occur in the sandstone structure, which is manifested by the sprouting of cracks and cavities in the crystal grains and matrix on the microscopic level, and the gradual deterioration of the mechanical strength on the macroscopic level. At 1000℃, the matrix of sandstone is no longer continuous and intact, but is in a loose structure with a large number of microcracks, and there are a large number of thermal cracks on the crystal grains of sandstone, which results in the structure of the grain structure no longer being intact and generating a large number of fine particles and debris. The result is that the structural grain structure is no longer intact and many fine particles and debris are produced. The microcracks extend through each other, leading to a rapid decrease in the rock's load-bearing capacity, which also explains the increase in the decrease in peak stress and elastic modulus after 1000°C in
Figure 6(a) and
Figure 7(a). Compared with the brittle fracture mode, more plastic deformation occurs on the fracture surface where ductile fracture occurs, and the fracture surface is not as flat and smooth as the brittle fracture, but a rougher fracture portion occurs. Comprehensive analysis of the fracture surface of sandstone after 600 ℃ ductile fracture morphology, mainly in the dimple, slip separation and intergranular cracks, which is also a typical ductile fracture morphology, indicating that the fracture mode is ductile fracture. From the fracture surface morphology, the brittle-ductile transition temperature of sandstone occurs between 500-600℃, which is consistent with the previous conclusion.
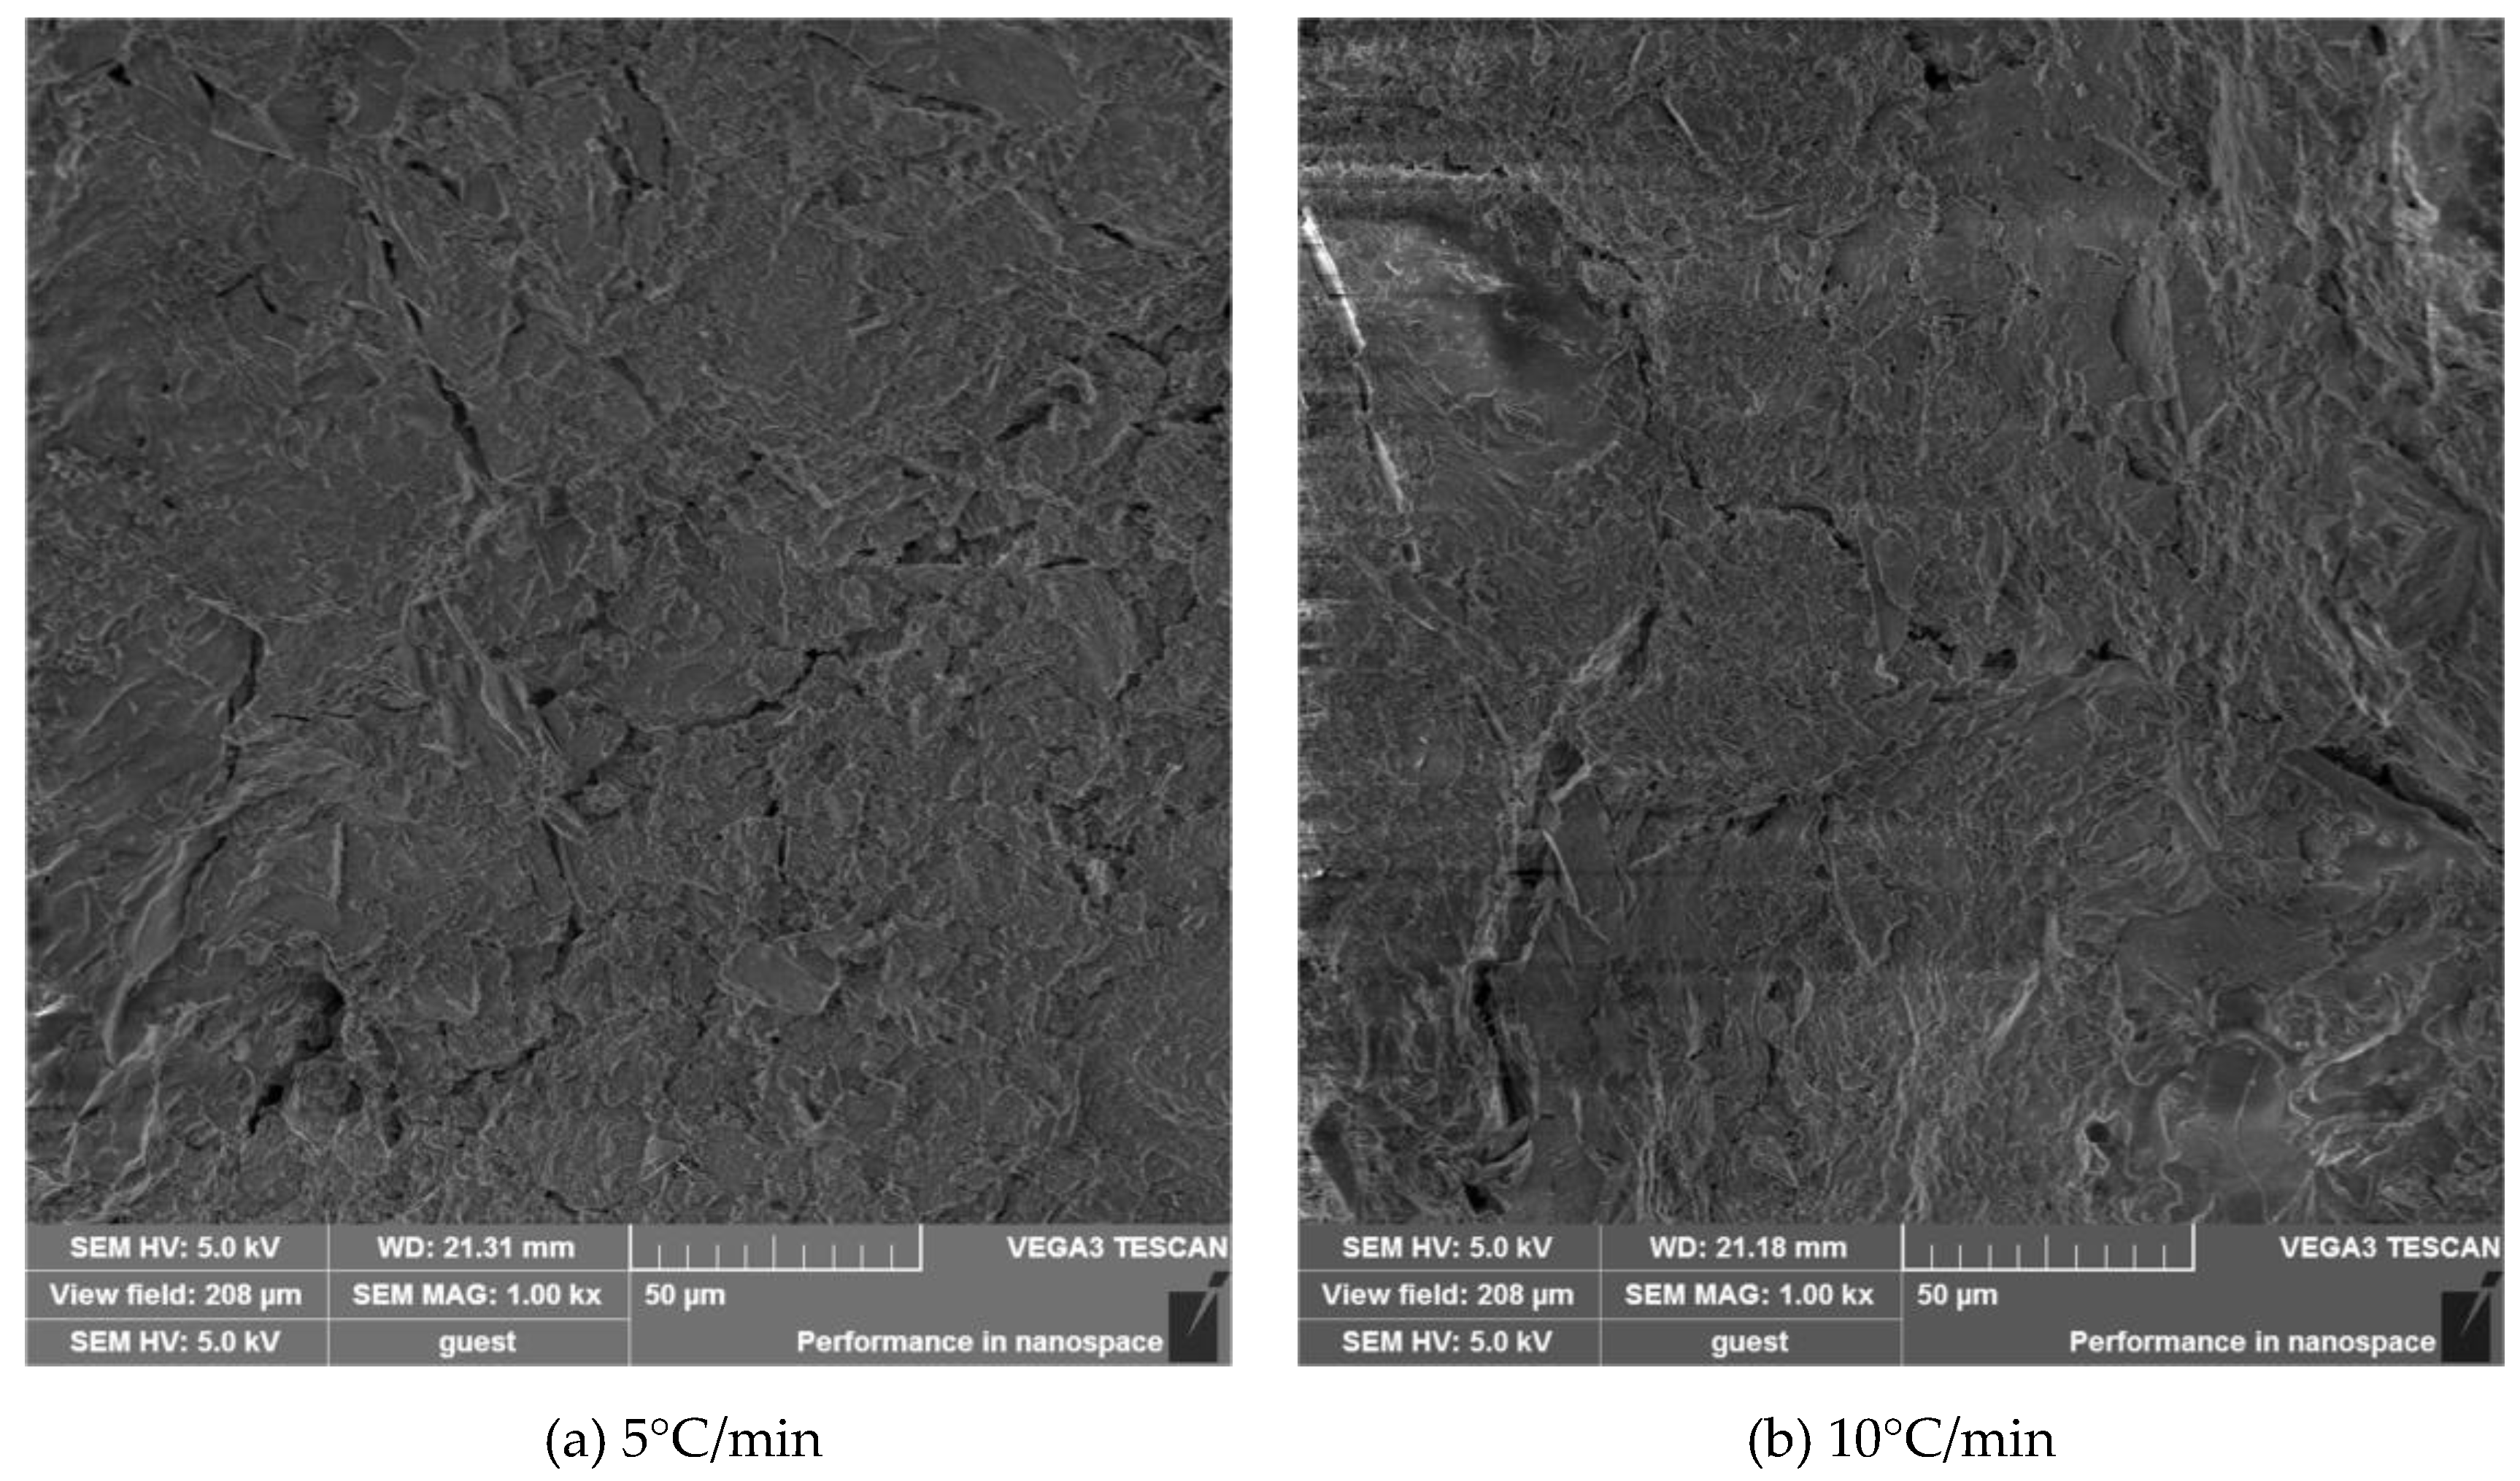
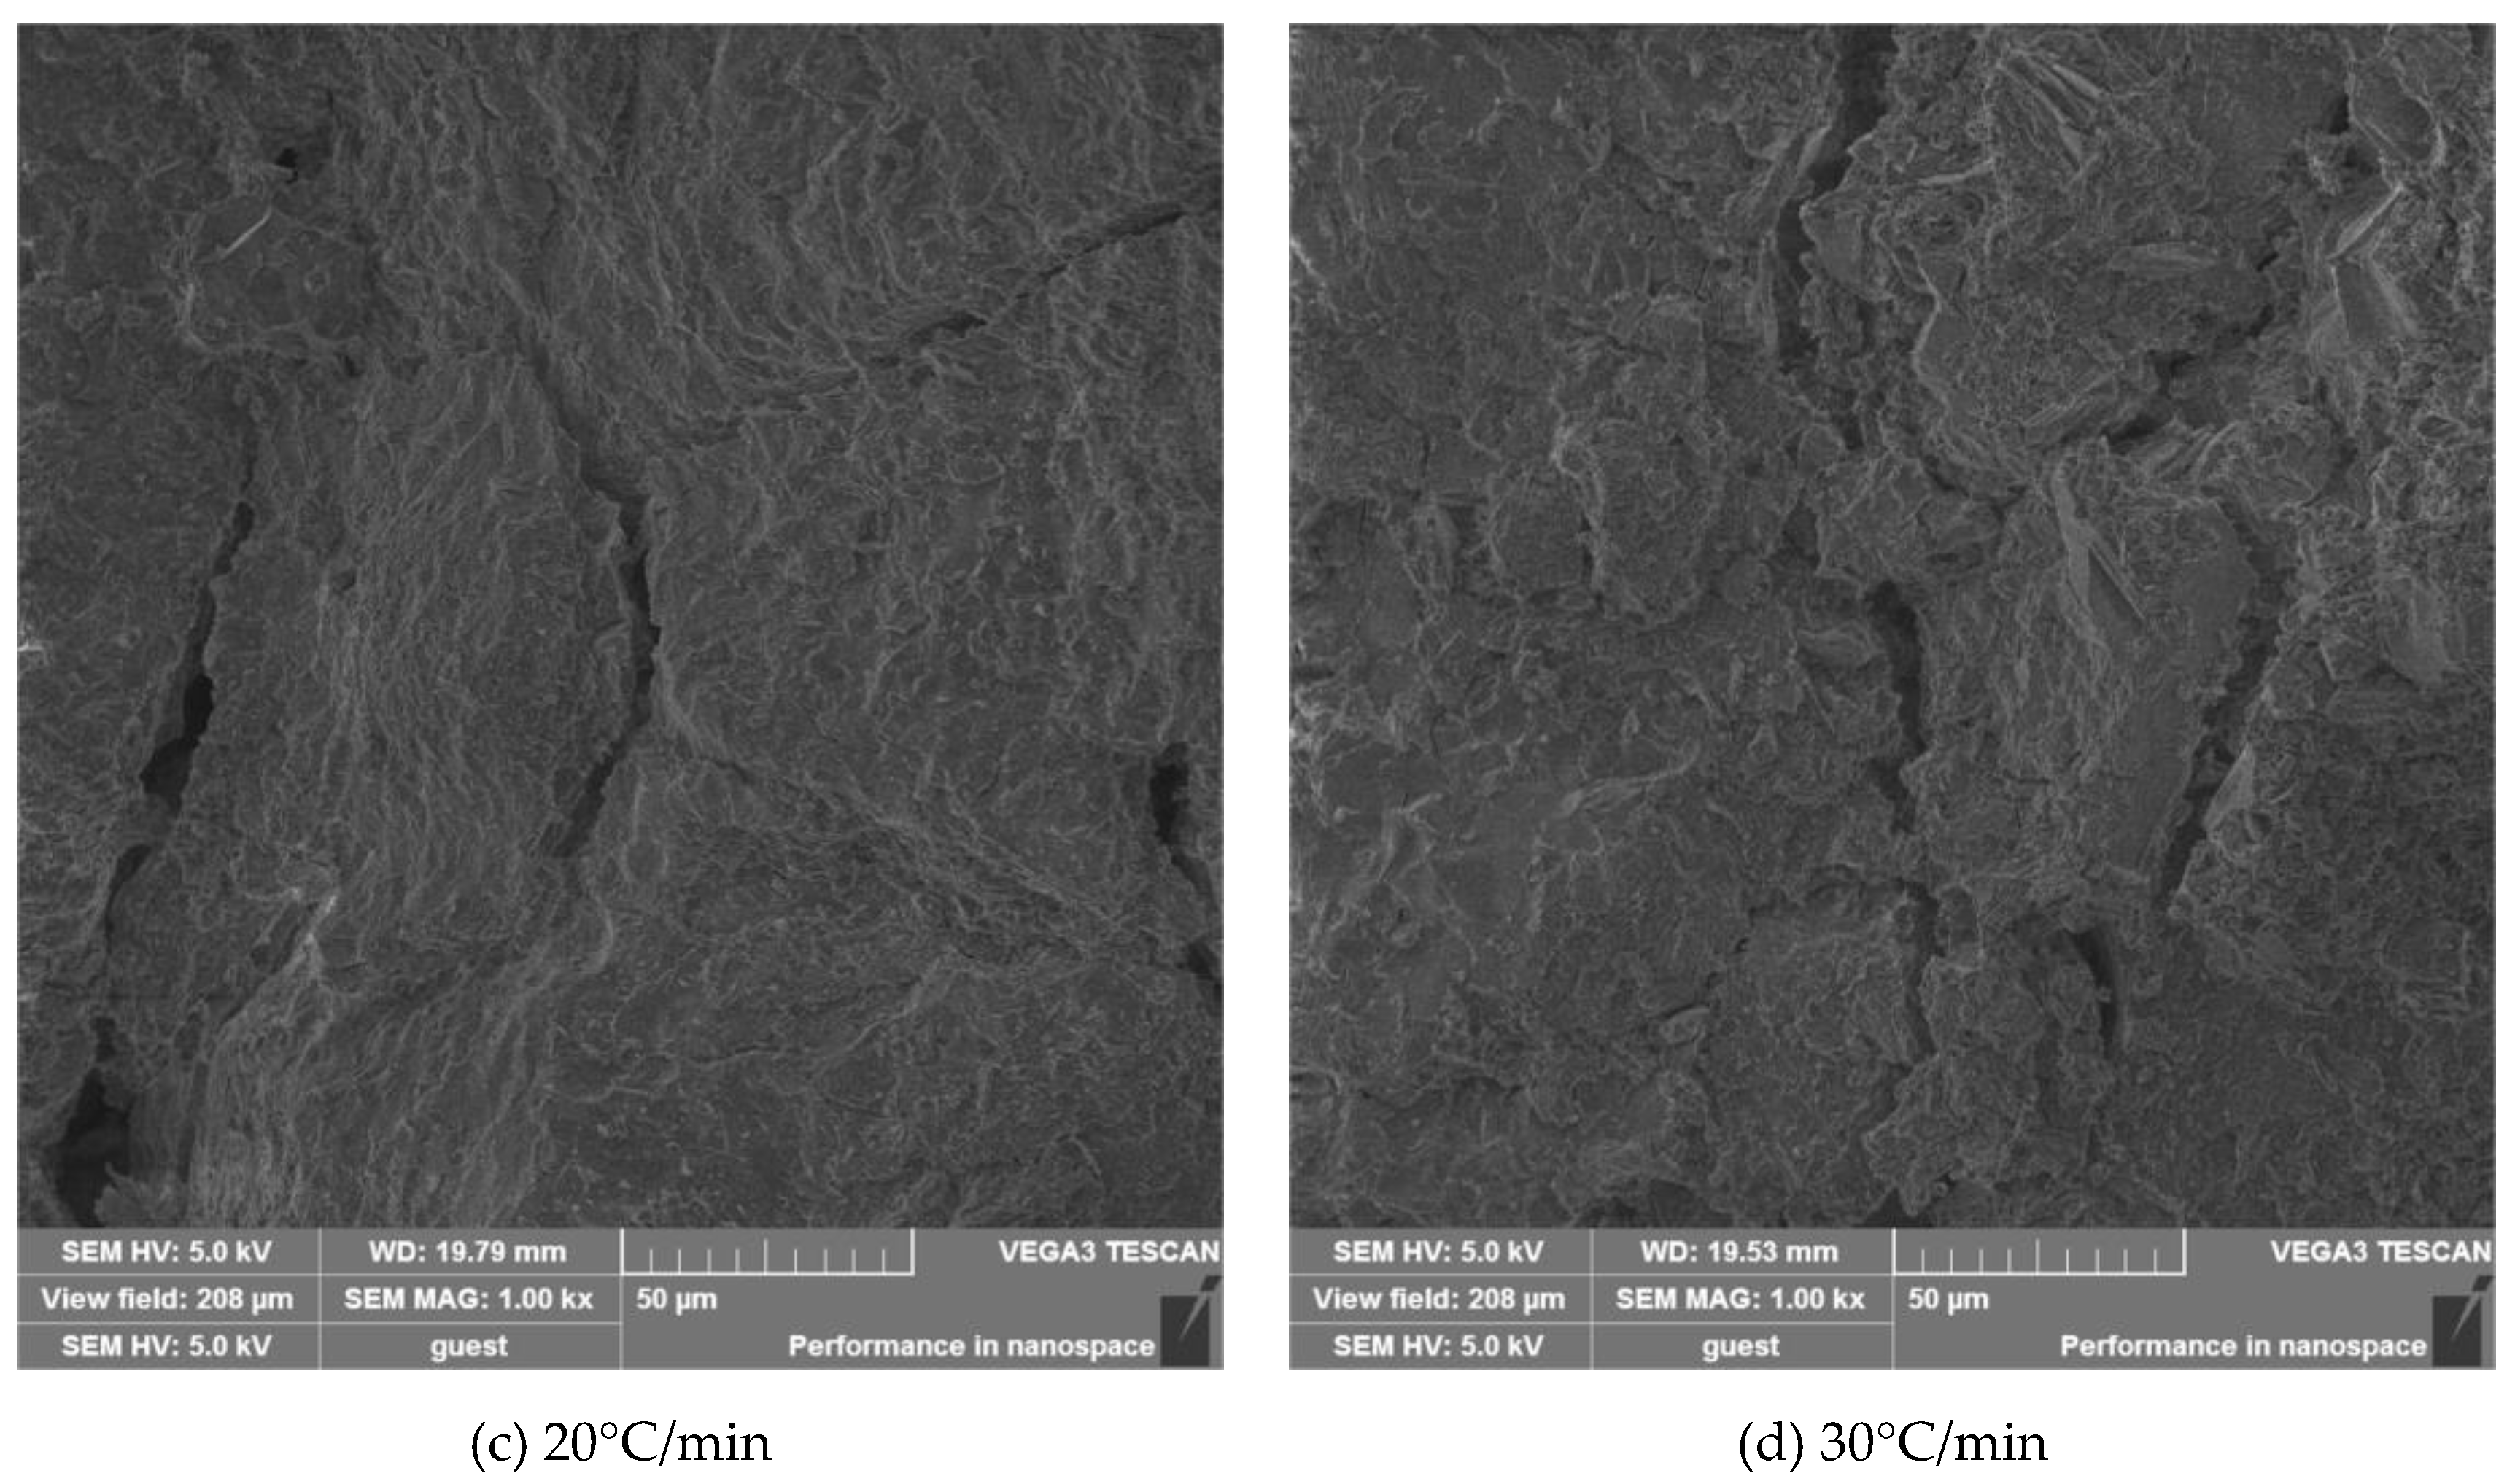
From
Figure 17, a large number of cracks and pores already existed in the sandstone at 1200°C, but with the increase of heating rate, the thermal damage and thermal rupture were more serious, which was manifested by the increase of surface roughness of the samples, and the obvious increase of crack width, length and pore size, which led to the decrease of mechanical properties of the sandstone with the increase of heating rate. At 5°C/min and 10°C/min, the microscopic morphology is close to each other, when the heating rate is relatively low, resulting in an increase in heating time, the mineral particles decomposed into smaller particles, resulting in a flatter cross-section. When the heating rate is 20°C/min and 30°C/min, the internal changes of the rock samples are drastic, and larger cracks and pores are produced under the strong thermal shock.
6. Conclusions
In order to study the macroscopic and microscopic properties of sandstone at high temperatures, 13 groups of rock samples at 20-1200°C and 4 groups of rock samples at the target temperature of 1200°C with the heating rate of 5°C/min, 10°C/min, 20°C/min and 30°C/min were tested by using a high-temperature chamber furnace and a mechanical testing machine, to study the changes in the physical and mechanical properties of sandstone at different temperatures and heating rates, and analyze the mechanism of its damage evolution by acoustic emission technology and scanning electron microscopy, and the following conclusions were mainly drawn:
(1) As the temperature rises, sandstone physical properties appear in the phenomenon of mass reduction, volume expansion, density reduction, wave velocity reduction, the most apparent changes in 500-600°C. The peak stress and modulus of elasticity of sandstone showed a tendency of increasing and then decreasing with temperature, with 500°C as the threshold temperature, which was 69.48% and 30.43% higher than that of room temperature, and the peak strain showed a tendency of increasing with temperature, and slightly decreased at 200°C and 1200°C. The modulus of elasticity and peak stress showed a decreasing trend with the increase in temperature rate, and the peak strain did not change significantly.
(2) The pattern of maximum ringing counts of sandstone is the same as that of its strength, and the maximum ringing counts increase and then decrease with the increase of temperature and increase with the increase of warming rate. The aggravation of thermal damage makes the AE counts more frequent, and the cumulative ringing counts show an upward trend with the increase of both temperature and heating rate. The cracking threshold and damage threshold stresses and their ratios are highly correlated with the peak strength, and both of them show a specific decreasing trend with the increase of temperature, which indicates that the high-temperature treatment will cause the sandstone to crack prematurely.
(3) In the macroscopic and microscopic view, before 500℃, the thermal expansion within the sandstone internal crystals gradually closes the pores and cracks within the sandstone, improving the densification of the sandstone and improving the mechanical properties. The macroscopic damage mode is dominated by shear damage, and the fracture morphology is mainly characterized by brittle morphology. After 600°C, the large amount of development of voids and cracks makes the structural integrity of sandstone deteriorate continuously, and the mechanical properties gradually decrease. The macroscopic damage mode is dominated by cleavage damage, and the fracture surface is characterized by ductile morphology. This brittle-ductile transition occurs between 500-600℃. By analyzing the changes in micro-morphology under different heating rates at 1200°C, the crack length and pore size increase with the increase in heating rate under thermal solid shock.
Author Contributions
Conceptualization, Lianying Zhang; methodology, Yadong Zheng; validation, Xiaoqian Guo and Peng Wu.; formal analysis, Ming Li; data curation, Fuqiang Zhu; writing—original draft preparation, Lianying Zhang and Yadong Zheng; writing—review and editing, Lianying Zhang and Yadong Zheng; visualization, Peng Wu; funding acquisition, Lianying Zhang and Ming Li. All authors have read and agreed to the published version of the manuscript.
Funding
This research was funded by the National Natural Science Foundation of China (52074240, 52274140, and 51974296), the State Key Laboratory for GeoMechanics and Deep Underground Engineering, China University of Mining and Technology(SKLGDUEK2212), the Excellent Science and Technology Innovation Team of Jiangsu Province (Engineering Structural Safety under Complex Environ-mental), the sixth phase of Jiangsu Province "333 talents" training support special - card neck technology research.
Institutional Review Board Statement
Not applicable.
Informed Consent Statement
Not applicable.
Data Availability Statement
Not applicable.
Acknowledgments
This research was funded by the National Natural Science Foundation of China (52074240, 52274140, and 51974296 ), the State Key Laboratory for GeoMechanics and Deep Underground Engineering, China University of Mining & Technology(SKLGDUEK2212), the Excellent Science and Technology Innovation Team of Jiangsu Province (Engineering Structural Safety under Complex Environ-mental), the sixth phase of Jiangsu Province "333 talents" training support special - card neck technology research. Thank you for the equipment support provided by Xuzhou University of Technology.
Conflicts of Interest
The authors declare no conflict of interest.
References
- Khadse, A., Qayyumi, M., Mahajani, S. & Aghalayam, P. Underground coal gasification: A new clean coal utilization technique for India. Energy 32, 2061–2071 (2007). [CrossRef]
- Xin, M., LinLi, ChaoLiu, WeitaoXu, MinXie, JunHan, LiminAn. Change of sandstone microstructure and mineral transformation nearby UCG channel. Fuel Process. Technol. 211, (2021).
- Róg, L. Vitrinite reflectance as a measure of the range of influence of the temperature of a georeactor on rock mass during underground coal gasification. Fuel 224, 94–100 (2018). [CrossRef]
- Chen, Y. et al. Experimental characterization and micromechanical modeling of damage-induced permeability variation in Beishan granite. Int. J. Rock Mech. Min. Sci. 71, 64–76 (2014). [CrossRef]
- Horseman, S. T. & McEwen, T. J. Thermal constraints on disposal of heat-emitting waste in argillaceous rocks. Eng. Geol. 41, 5–16 (1996). [CrossRef]
- Bi, J., Liu, P. & Gan, F. Effects of the cooling treatment on the dynamic behavior of ordinary concrete exposed to high temperatures. Constr. Build. Mater. 248, 118688 (2020). [CrossRef]
- Li, M., Wang, D. & Shao, Z. Experimental study on changes of pore structure and mechanical properties of sandstone after high-temperature treatment using nuclear magnetic resonance. Engineering Geology 275, 105739 (2020). [CrossRef]
- Yang, S.-Q., Huang, Y.-H., Tian, W.-L., Yin, P.-F. & Jing, H.-W. Effect of High Temperature on Deformation Failure Behavior of Granite Specimen Containing a Single Fissure Under Uniaxial Compression. Rock Mech. Rock Eng. 52, 2087–2107 (2019). [CrossRef]
- Shen, Y.-J., Zhang, Y.-L., Gao, F., Yang, G.-S. & Lai, X.-P. Influence of Temperature on the Microstructure Deterioration of Sandstone. ENERGIES 11, 1753 (2018). [CrossRef]
- Yavuz, H., Demirdag, S. & Caran, S. Thermal effect on the physical properties of carbonate rocks. Int. J. Rock Mech. Min. Sci. 47, 94–103 (2010). [CrossRef]
- Meng, T. et al. Evolution of permeability and microscopic pore structure of sandstone and its weakening mechanism under coupled thermo-hydro-mechanical environment subjected to real-time high temperature. Eng. Geol. 280, 105955 (2021). [CrossRef]
- Alneasan, M. & Alzo’ubi, A. K. Temperature Effect on the Fracture Behavior of Granite Under Three Loading Modes (I, I/II, and II). Rock Mech. Rock Eng. 56, 2197–2211 (2023). [CrossRef]
- Wang, G., Yang, D., Liu, S., Fu, M. & Wang, L. Experimental Study on the Anisotropic Mechanical Properties of Oil Shales Under Real-Time High-Temperature Conditions. Rock Mech. Rock Eng. 54, 6565–6583 (2021). [CrossRef]
- Lockner, D. The role of acoustic emission in the study of rock fracture. Int. J. Rock Mech. Min. 30, 883–899 (1993). [CrossRef]
- Geng, J., Sun, Q., Zhang, Y., Cao, L. & Zhang, W. Studying the dynamic damage failure of concrete based on acoustic emission. Construction and Building Materials 149, 9–16 (2017). [CrossRef]
- Du, K., Sun, Y., Zhou, J., Khandelwal, M. & Gong, F. Mineral Composition and Grain Size Effects on the Fracture and Acoustic Emission (AE) Characteristics of Rocks Under Compressive and Tensile Stress. Rock Mech. Rock Eng. 55, 6445–6474 (2022). [CrossRef]
- Gao, Y. et al. The Acoustic Emission Behavior and Its Fractal Characteristics of the Sandstone Under the Disturbance Stress Paths. Rock Mech. Rock Eng. 56, 5487–5511 (2023). [CrossRef]
- Wang, Z., Zhou, G. & Ge, X. Experimental study on damage characteristics of Beishan granite under single loading and multiple loading with AE techniques. Sci. Rep. 13, 8767 (2023). [CrossRef]
- Zuo, J., Xie, H. & Zhou, H. Investigation of meso-failure behavior of rock under thermal-mechanical coupled effects based on high temperature SEM. Science China Physics, Mechanics and Astronomy 55, 1855–1862 (2012). [CrossRef]
- Perez-Rodriguez, J. L., Duran, A. & Perez-Maqueda, L. A. Thermal study of unaltered and altered dolomitic rock samples from ancient monuments: The case of Villarcayo de Merindad de Castilla la Vieja (Burgos, Spain). J. Therm. Anal. Calorim. 104, 467–474 (2011). [CrossRef]
- Mahanta, B., Vishal, V., Ranjith, P. G. & Singh, T. N. An insight into pore-network models of high-temperature heat-treated sandstones using computed tomography. J. Nat. Gas Sci. Eng. 77, 103227 (2020). [CrossRef]
- Tripathi, A. et al. Effects of Elevated Temperatures on the Microstructural, Physico-Mechanical and Elastic Properties of Barakar Sandstone: A Study from One of the World’s Largest Underground Coalmine Fire Region, Jharia, India. Rock Mech. Rock Eng. 54, 1293–1314 (2021).
- Sirdesai, N. N., Singh, T. N. & Pathegama Gamage, R. Thermal alterations in the poro-mechanical characteristic of an Indian sandstone – A comparative study. Eng. Geol. 226, 208–220 (2017). [CrossRef]
- Hajpal, M. & Torok, A. Mineralogical and colour changes of quartz sandstones by heat. ENVIRONMENTAL GEOLOGY 46, 311–322 (2004). [CrossRef]
- Zhang, W., Sun, Q., Zhu, Y. & Guo, W. Experimental study on response characteristics of micro–macroscopic performance of red sandstone after high-temperature treatment. J. Therm. Anal. Calorim. 136, (2018). [CrossRef]
- Sun, Q. et al. Thermal properties of sandstone after treatment at high temperature. Int. J. Rock Mech. Min. Sci. 85, 60–66 (2016). [CrossRef]
- P. g., R., Viete, D. R., Chen, B. J. & Perera, M. S. A. Transformation plasticity and the effect of temperature on the mechanical behaviour of Hawkesbury sandstone at atmospheric pressure. Eng. Geol. 151, 120–127 (2012). [CrossRef]
- Wang, X., Wen, Z., Jiang, Y. & Huang, H. Experimental Study on Mechanical and Acoustic Emission Characteristics of Rock-Like Material Under Non-uniformly Distributed Loads. Rock Mech Rock Eng 51, 729–745 (2018).
- Eberhardt, E., Stead, D. & Stimpson, B. Quantifying progressive pre-peak brittle fracture damage in rock during uniaxial compression. International Journal of Rock Mechanics and Mining Sciences 36, 361–380 (1999). [CrossRef]
Figure 1.
Test samples (a) Map of sampling locations (b) Specimen (c) Mineral composition of the specimen (d) Specimen after high temperature.
Figure 1.
Test samples (a) Map of sampling locations (b) Specimen (c) Mineral composition of the specimen (d) Specimen after high temperature.
Figure 2.
testing equipment: (a) High temperature box furnace, (b) Wave velocity measuring instrument, (c) Instron testing machine, (d) AE Monitoring System, (e)Scanning electron microscope.
Figure 2.
testing equipment: (a) High temperature box furnace, (b) Wave velocity measuring instrument, (c) Instron testing machine, (d) AE Monitoring System, (e)Scanning electron microscope.
Figure 3.
The variation of physical properties with temperature.
Figure 3.
The variation of physical properties with temperature.
Figure 4.
Total stress-strain curves at different temperatures.
Figure 4.
Total stress-strain curves at different temperatures.
Figure 5.
Total stress-strain curves at different heating rates at 1200 ° C.
Figure 5.
Total stress-strain curves at different heating rates at 1200 ° C.
Figure 6.
The peak stress varies with temperature and heating rate.
Figure 6.
The peak stress varies with temperature and heating rate.
Figure 7.
The elastic modulus varies with temperature and heating rate.
Figure 7.
The elastic modulus varies with temperature and heating rate.
Figure 8.
The peak strain varies with temperature and heating rate.
Figure 8.
The peak strain varies with temperature and heating rate.
Figure 9.
Macroscopic failure modes of sandstone at different temperatures.
Figure 9.
Macroscopic failure modes of sandstone at different temperatures.
Figure 10.
The variation law of acoustic emission characteristics at different temperatures.
Figure 10.
The variation law of acoustic emission characteristics at different temperatures.
Figure 11.
The variation law of acoustic emission characteristics at different heating rates at 1200 °C.
Figure 11.
The variation law of acoustic emission characteristics at different heating rates at 1200 °C.
Figure 12.
The change rule of ringing count at different temperatures.
Figure 12.
The change rule of ringing count at different temperatures.
Figure 13.
The change rule of ringing count at different heating rates.
Figure 13.
The change rule of ringing count at different heating rates.
Figure 14.
The variation law of stress threshold and proportion with temperature.
Figure 14.
The variation law of stress threshold and proportion with temperature.
Figure 15.
The variation law of stress threshold and proportion with heating rate at 1200 ° C.
Figure 15.
The variation law of stress threshold and proportion with heating rate at 1200 ° C.
Figure 16.
micro-morphology changes at different temperatures.
Figure 16.
micro-morphology changes at different temperatures.
Figure 17.
Micro-morphology changes at different heating rates.
Figure 17.
Micro-morphology changes at different heating rates.
Table 1.
Mechanical parameters at different temperatures.
Table 1.
Mechanical parameters at different temperatures.
| T/℃ |
/MPa |
E/GPa |
/10-2
|
Nmax/103
|
/103
|
/MPa |
/MPa |
| 25 |
55.91 |
5.29 |
1.47 |
2.48 |
13.25 |
39.72 |
50.57 |
| 100 |
57.24 |
5.53 |
1.43 |
2.32 |
14.66 |
42.05 |
56.36 |
| 200 |
59.83 |
5.78 |
1.36 |
3.07 |
15.71 |
44.06 |
58.60 |
| 300 |
65.88 |
6.23 |
1.49 |
3.65 |
20.53 |
51.62 |
63.71 |
| 400 |
79.36 |
6.66 |
1.76 |
4.52 |
27.72 |
57.38 |
76.97 |
| 500 |
94.76 |
6.90 |
1.87 |
6.27 |
38.68 |
70.67 |
91.41 |
| 600 |
89.03 |
6.05 |
2.31 |
5.99 |
40.67 |
58.69 |
80.96 |
| 700 |
87.12 |
5.77 |
2.42 |
5.23 |
43.19 |
52.33 |
75.71 |
| 800 |
85.59 |
5.51 |
2.55 |
4.83 |
48.25 |
51.58 |
75.36 |
| 900 |
81.91 |
5.32 |
2.66 |
3.78 |
47.14 |
43.31 |
73.24 |
| 1000 |
71.18 |
4.86 |
2.68 |
2.96 |
51.22 |
39.66 |
63.95 |
| 1100 |
58.15 |
3.54 |
2.69 |
2.01 |
52.31 |
31.26 |
45.36 |
| 1200 |
40.66 |
2.57 |
2.36 |
1.68 |
56.36 |
28.09 |
33.68 |
Table 2.
Mechanical parameters at different heating rates.
Table 2.
Mechanical parameters at different heating rates.
| V(℃/min) |
/MPa |
E/GPa |
/10-2
|
Nmax/103
|
/103
|
/MPa |
/MPa |
| 5 |
51.14 |
3.13 |
2.69 |
1.85 |
55.82 |
30.96 |
45.02 |
| 10 |
40.66 |
2.57 |
2.36 |
1.68 |
54.51 |
28.09 |
37.55 |
| 20 |
38.46 |
2.52 |
2.35 |
1.54 |
51.66 |
26.84 |
37.21 |
| 30 |
32.54 |
2.16 |
2.32 |
1.39 |
49.97 |
25.66 |
36.68 |
|
Disclaimer/Publisher’s Note: The statements, opinions and data contained in all publications are solely those of the individual author(s) and contributor(s) and not of MDPI and/or the editor(s). MDPI and/or the editor(s) disclaim responsibility for any injury to people or property resulting from any ideas, methods, instructions or products referred to in the content. |
© 2023 by the authors. Licensee MDPI, Basel, Switzerland. This article is an open access article distributed under the terms and conditions of the Creative Commons Attribution (CC BY) license (http://creativecommons.org/licenses/by/4.0/).
