1. Introduction
Additive Manufacturing (AM) is a process of joining material layer-by-layer, which allows a large freedom in material arrangement symmetry, while decreasing the dependence on manufacturing tools [
1]. Among the processes that fall within the definition of AM is the fused filament fabrication or FFF [
2]. FFF, also known as Fused Deposition Modelling (FDM), is a widely used additive manufacturing technology that operates by layering and melting thermoplastic filament materials to create three-dimensional objects [
3]. In this process, a computer-controlled extrusion nozzle deposits the molten material layer by layer onto a build platform, with each layer fusing to the previous one as it cools and solidifies [
4]. FFF is favoured for its versatility, accessibility, and affordability, making it a popular choice for desktop 3D printers especially for processing polymeric materials such as PLA (polylactic acid) and ABS (Acrylonitrile butadiene styrene) [
5,
6,
7]. It is used in a wide range of applications, from rapid prototyping [
8] and custom part production [
9] to active materials [
10], enabling complex designs to be processed with precision and efficiency [
11]. The simplicity and adaptability of FFF have contributed to its prominence in the field of additive manufacturing, allowing a large spectrum of materials to be considered as feedstock materials from monophasic materials such as copolyester [
12], polyurethane [
13], acrylonitrile styrene acrylate (ASA) [
14] to composite materials such as PLA-flax [
15], PLA-hemp [
16], PLA-wood [
17].
FFF become a popular way for processing thermoplastics by exploiting their ability to shift from glassy to rubbery state [
18]. Laydown and rapid solidification process defines the thermal cycling throughout the part building process [
19].
However, the fused filament process generates two dimensional discontinuities in the space, which has the consequence of creating a dependence of the properties of the printed parts on the direction of testing [
20]. Geometrical effects such as the symmetry in the filament arrangement are among the factors that prevails for controlling the mechanical behaviour of printed parts [
21]. Because of the influence of the material discontinuities especially the process-generated porosities [
22], in comparison to injection moulding, a strong trend for considering high-value feed stock materials has been considered for improving the performance of 3D printed materials using FFF. Polyamide and its composites are one of these technical filaments that received much attention [
23]. Sgrulletti et al. studied the correlation between the printing conditions on polyamide 6 mechanical performance using a monitoring. The study demonstrated that the bed temperature has a great influence on the mechanical properties of the printed polyamide 6. Arigbabowo et al. [
24] studied the FFF printability of polyamide 6 nanographene composite. The study concluded on a negative effect of nanographene platelets reinforcement on the elongation at break, toughness and improvement of stiffness and tensile strength. Belei et al. [
25] considered FFF of short carbon Fibre-reinforced polyamide. The authors showed that the reinforcing effect resulted in limited plasticity. They also observed a strong correlation between the mechanical performance and the printing conditions including layer height, and printing bed temperature.
In the present study, we focus on several printing parameters such as the printing temperature, the part orientation and the filament arrangement of polyamide-based material on the tensile performance. Among the considered printing conditions, both the part orientation and the printing angle affect the filament arrangement symmetry with respect to the loading direction. For instance, an in-plane arrangement with a printing angle of 0° generates layups of -45°/+45°. These in-plane layups are shifted to other configurations such as -30°/+60° when the printing angle is modified to 15°. In addition, the out-of-plane arrangement creates also a different material structuring in the building direction allowing anisotropy of mechanical behaviour to develop. In this study, part orientation and printing angles are considered as main parameters related to the symmetry of filament arrangement in the three-dimensional space. These are expected to significantly influence the deformation mechanisms and the overall tensile behaviour.
2. Experimental layout
The feedstock material considered in this study is a commercial polyamide-based (PLDA) filament of 1.75 mm in diameter and a density of 1.12 g/cm
3 from Polymaker company under the tradename polyamide CoPA. The filament is mainly composed of nylon 6 and nylon 66. The recommended printing settings are as follows: printing temperature between 250 °C and 270 °C, printing speed in the range 30 – 50 mm/s, bed temperature between 25 °C and 50 °C. The main physical properties of the feedstock material are given in
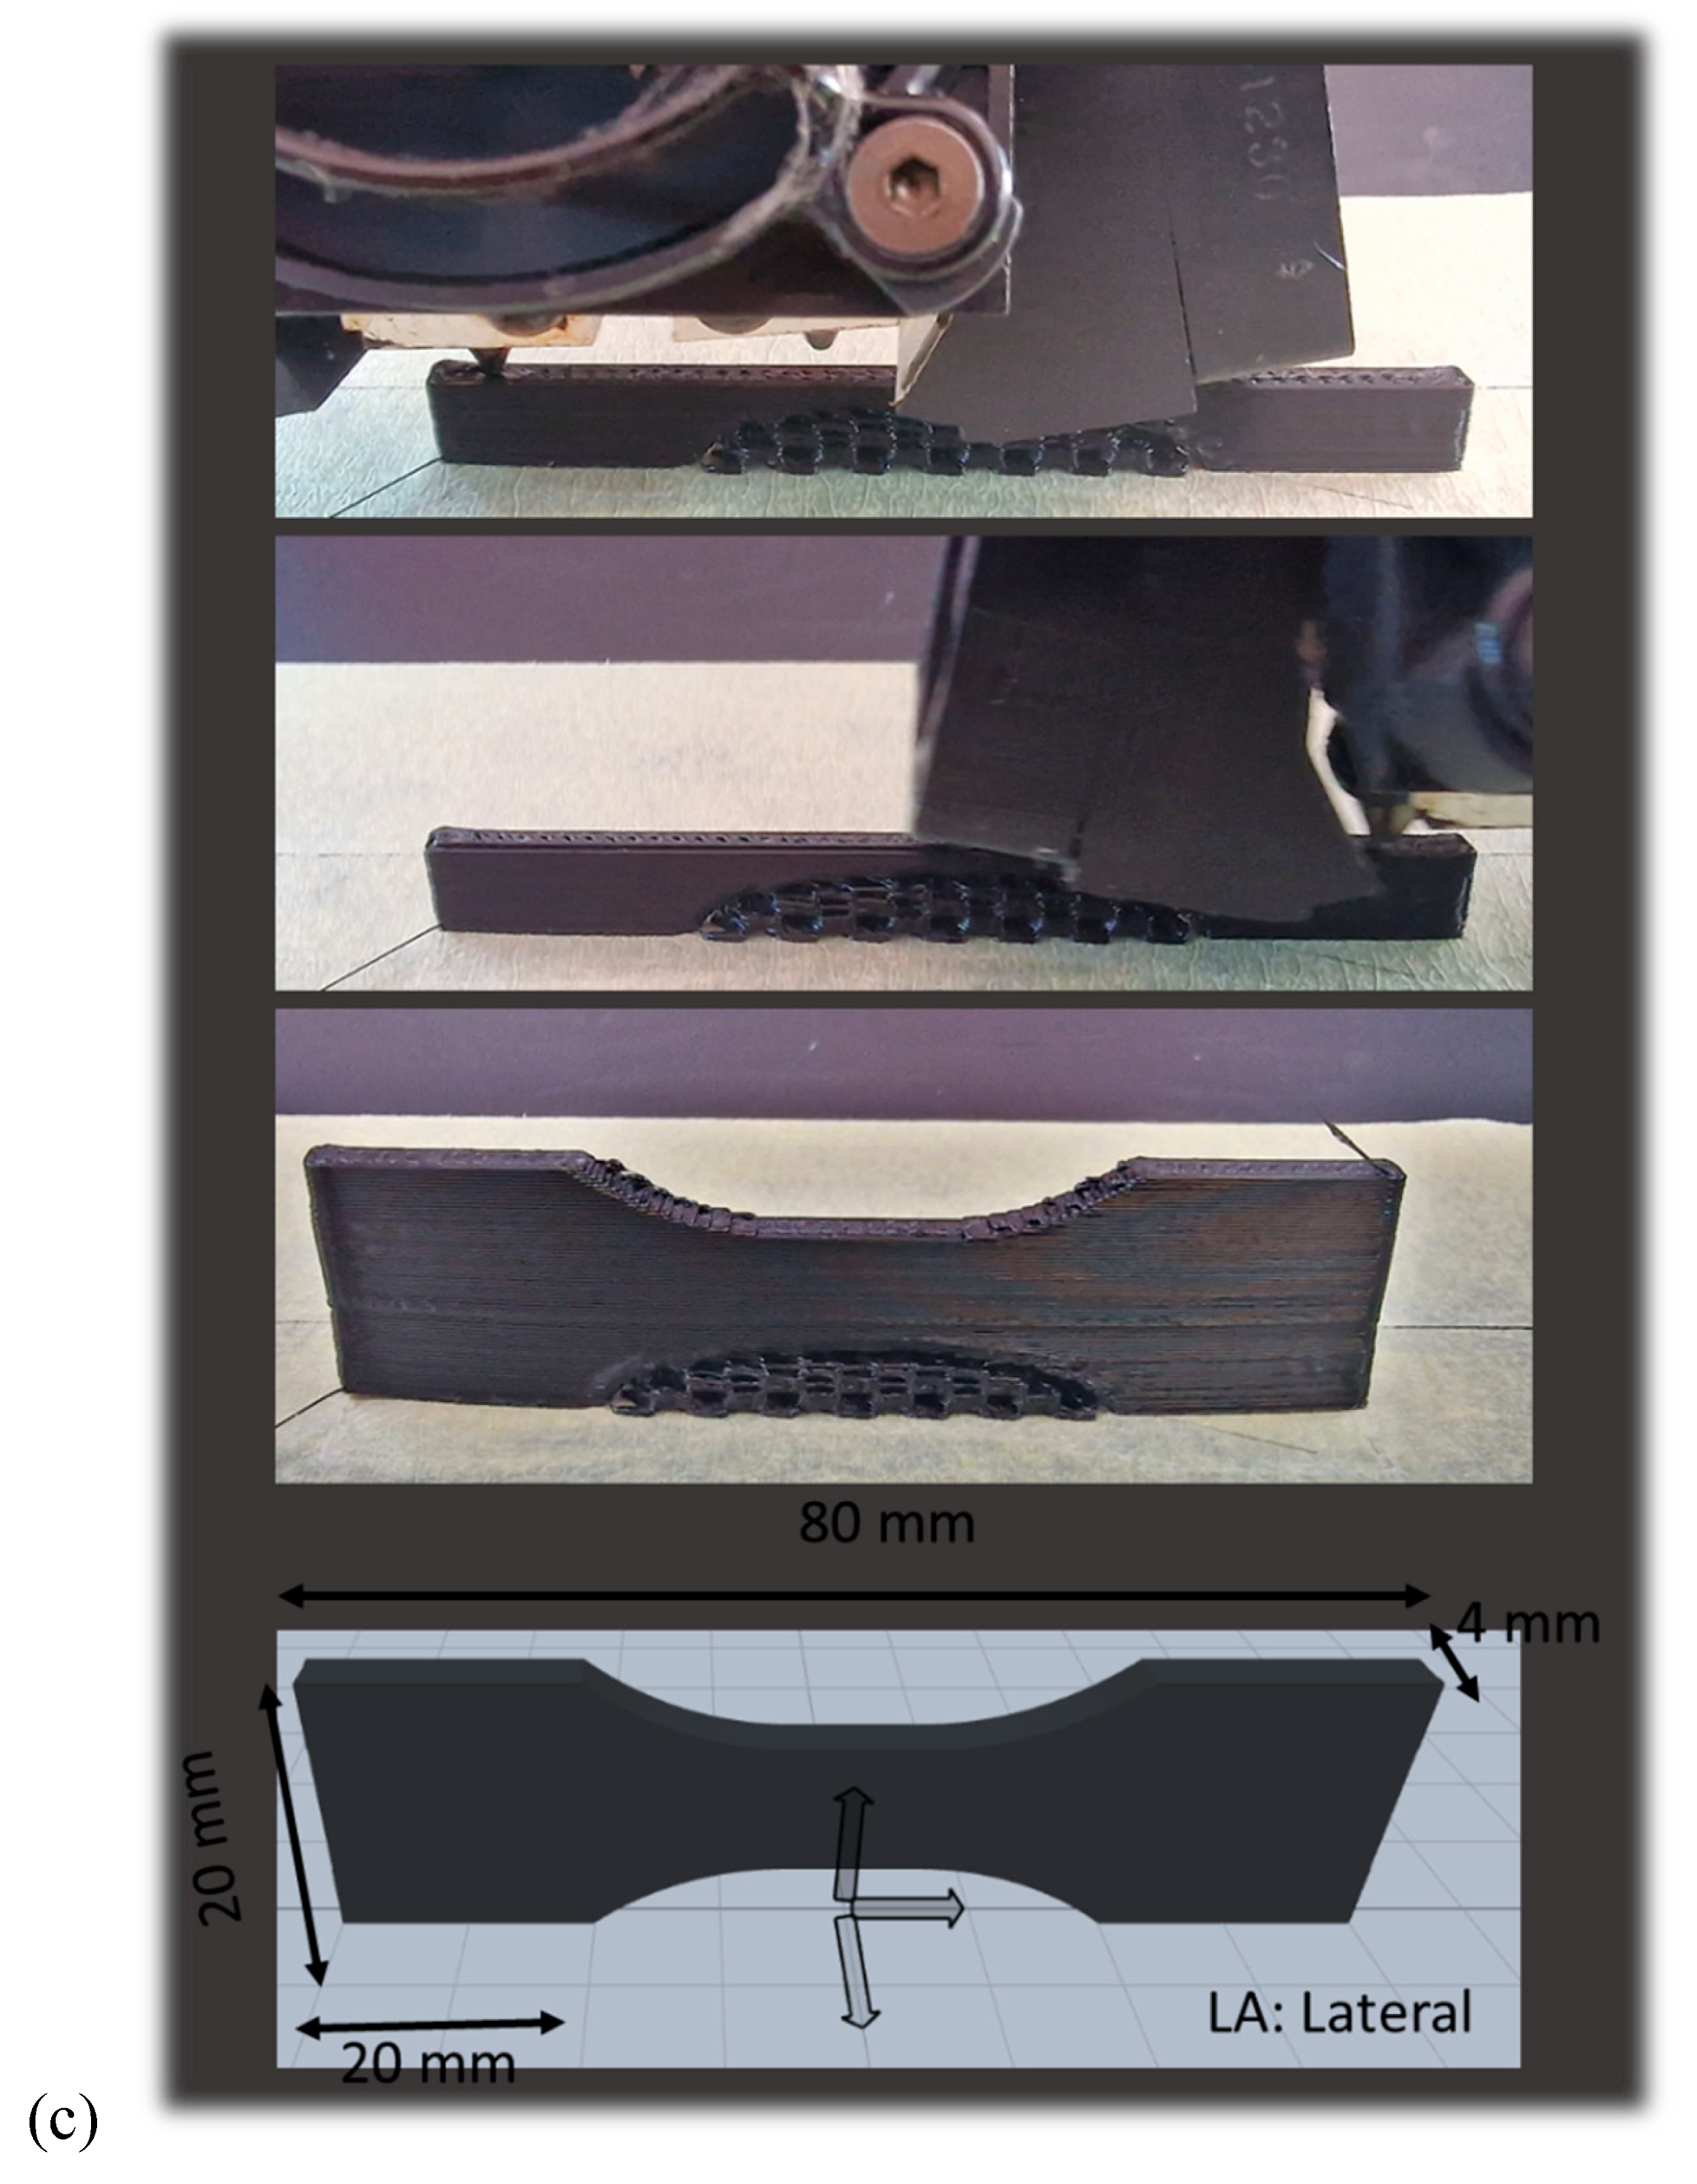
Table 1. Dogbone geometries are printed with the typical dimensions 80 × 20 × 4 mm
3, where the gauge width and length are 10 mm and 20 mm, respectively.
The printing process is conducted using Raise3D Pro2 Plus. The reference printing parameters are shown in
Table 2. Three main parameters are varied: printing temperature Tp (250°C, 260°C, 270°C, 280°C), part orientation φ (vertical, horizontal, lateral), and printing angle θ (0°, 15°, 30°, 45°). The symmetry in filament arrangement is tuned in the in-plane direction using the printing angle while the part orientation influences the material structuring in the building direction.
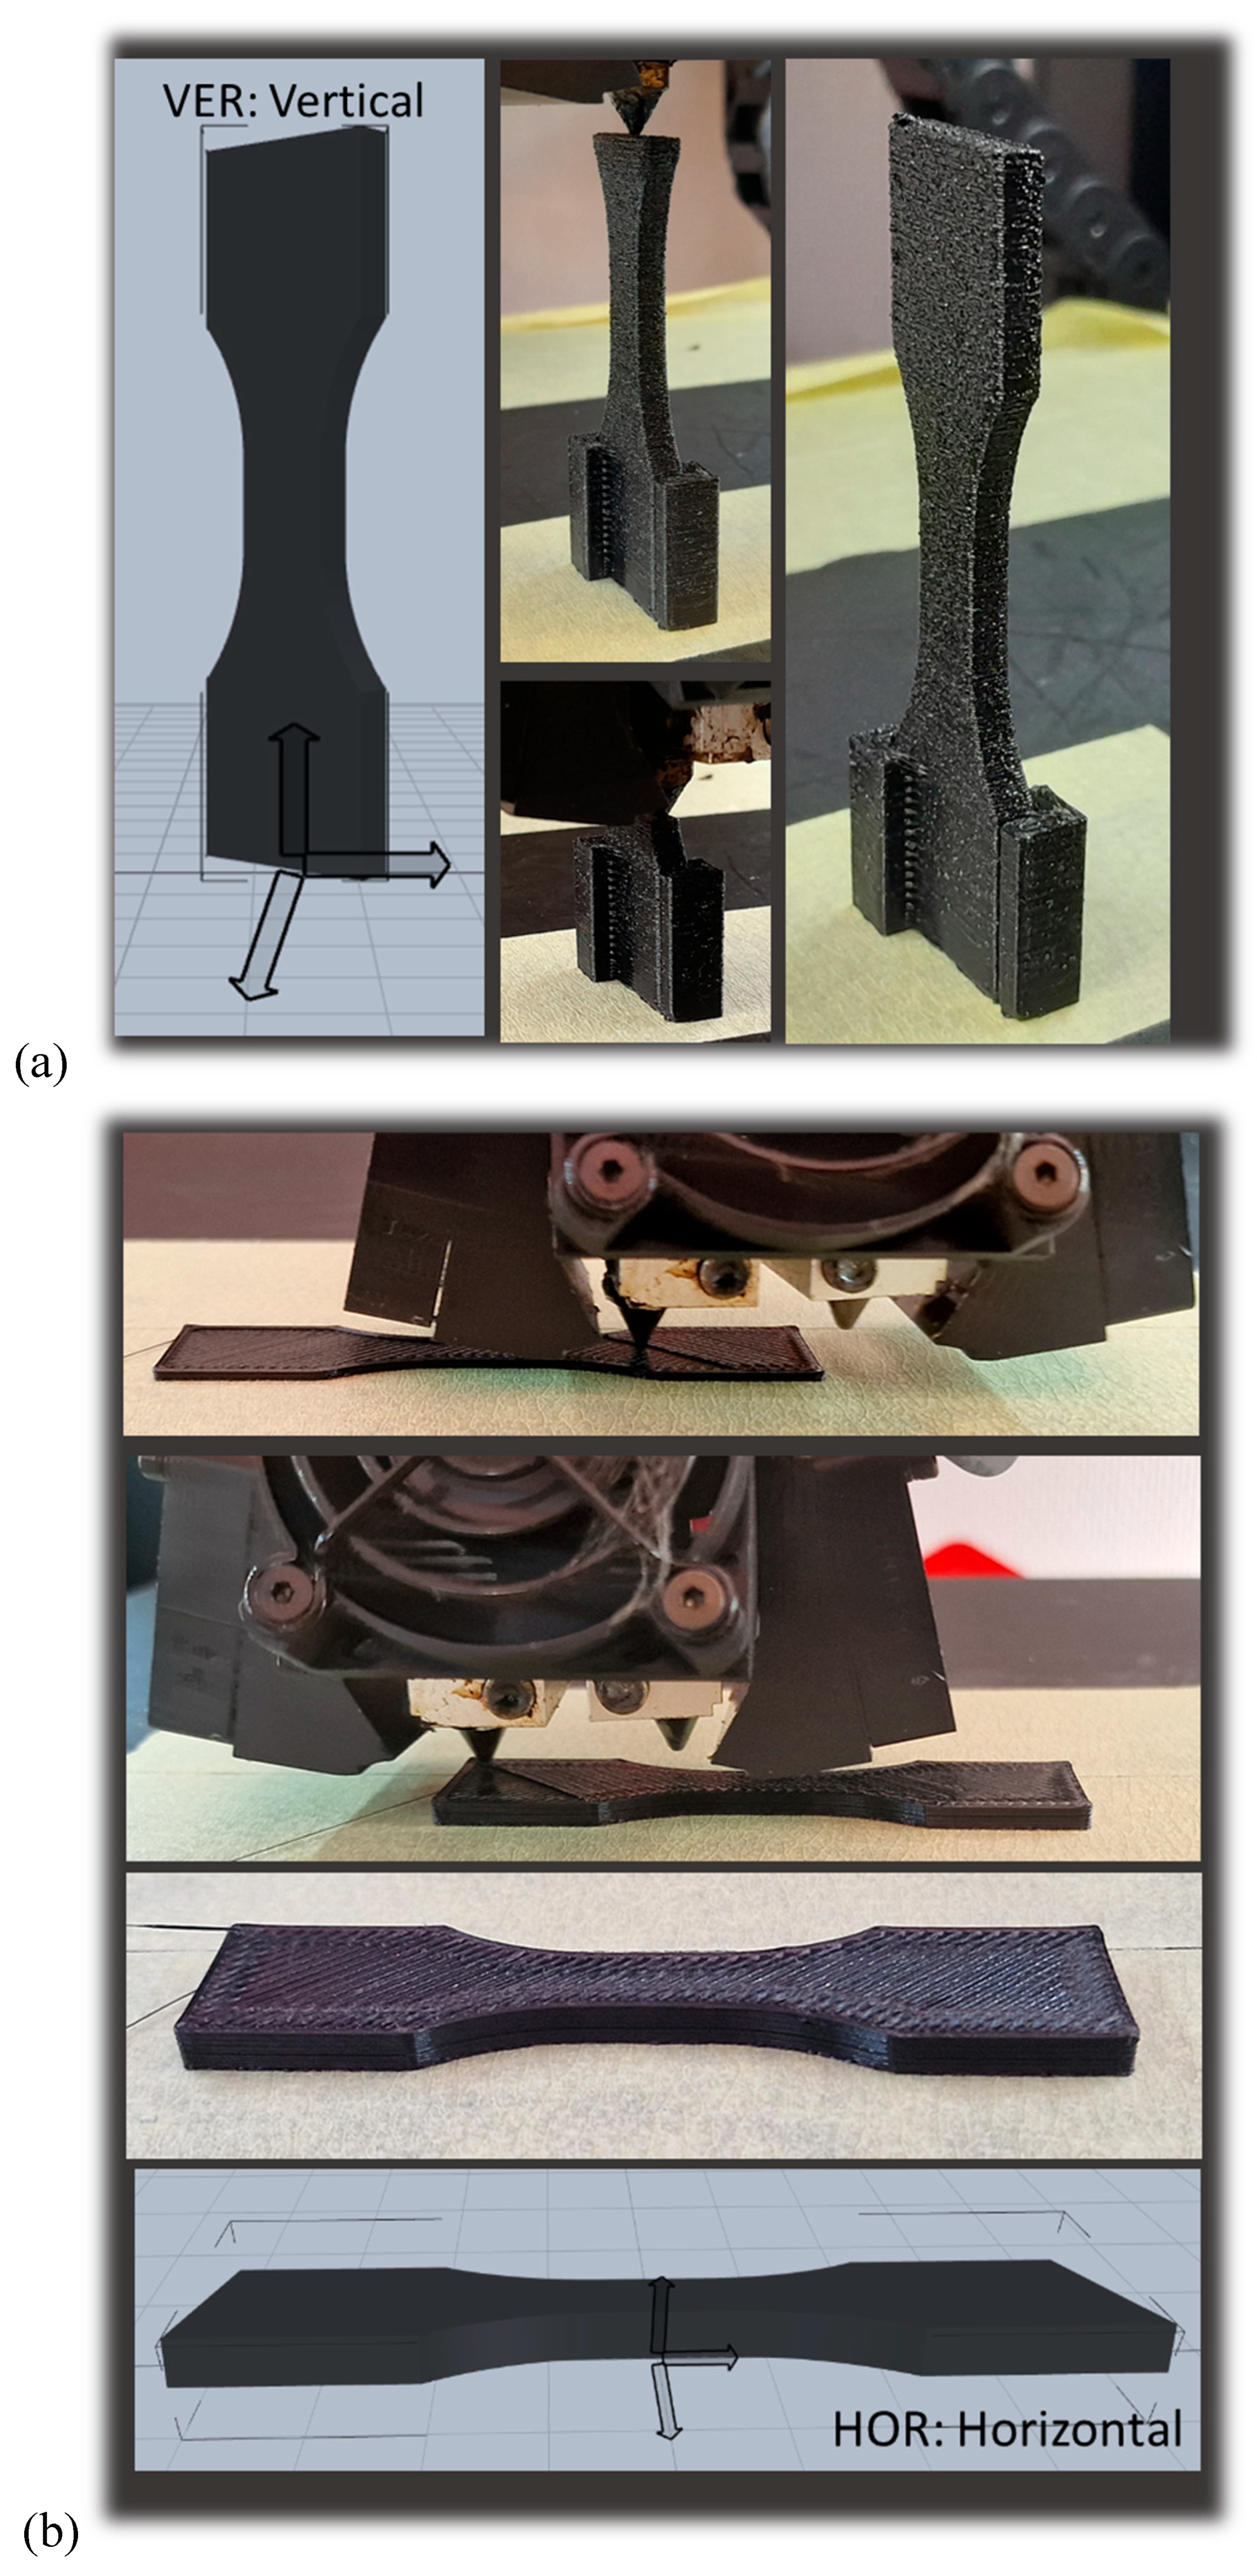
Figure 1 shows the part printing configuration for all considered orientations. The filament arrangement corresponds for the last parameter to filament symmetrical layups of (-45°/+45°, -30°/+60°, -15°/+75°, 0°/90°, respectively.
For both vertical and lateral orientations, the presence of support material is required. This is performed using the same material with infill rates as large as 30 %. The printing duration for all samples is around 15 min.
The composition of the as-received filaments is analysed using mid-infrared spectroscopy. The Thermo Nicolet IS50 spectrometer (Thermo Scientific, Courtaboeuf, France) serves this purpose. The spectra are acquired according to the reflexion mode between 4000 and 400 cm-1 at 16 cm-1 where the Smart iTX - ATR diamond accessory is used. The infrared spectra are the combination of 200 scans, which are processed using OMNIC 9.2.41 software. All spectra in the 4000-460 cm-1 region are processed by finding the baseline, normalised according to the unit vector and average spectra are computed using 5 replicates. The OPUS 7.5 software (Bruker Optics, France) is used for all processing steps. The spectra are identified from a comparison with as-built spectra from OPUS library. The main components of the PLDA feedstock material are identified according to this technique.
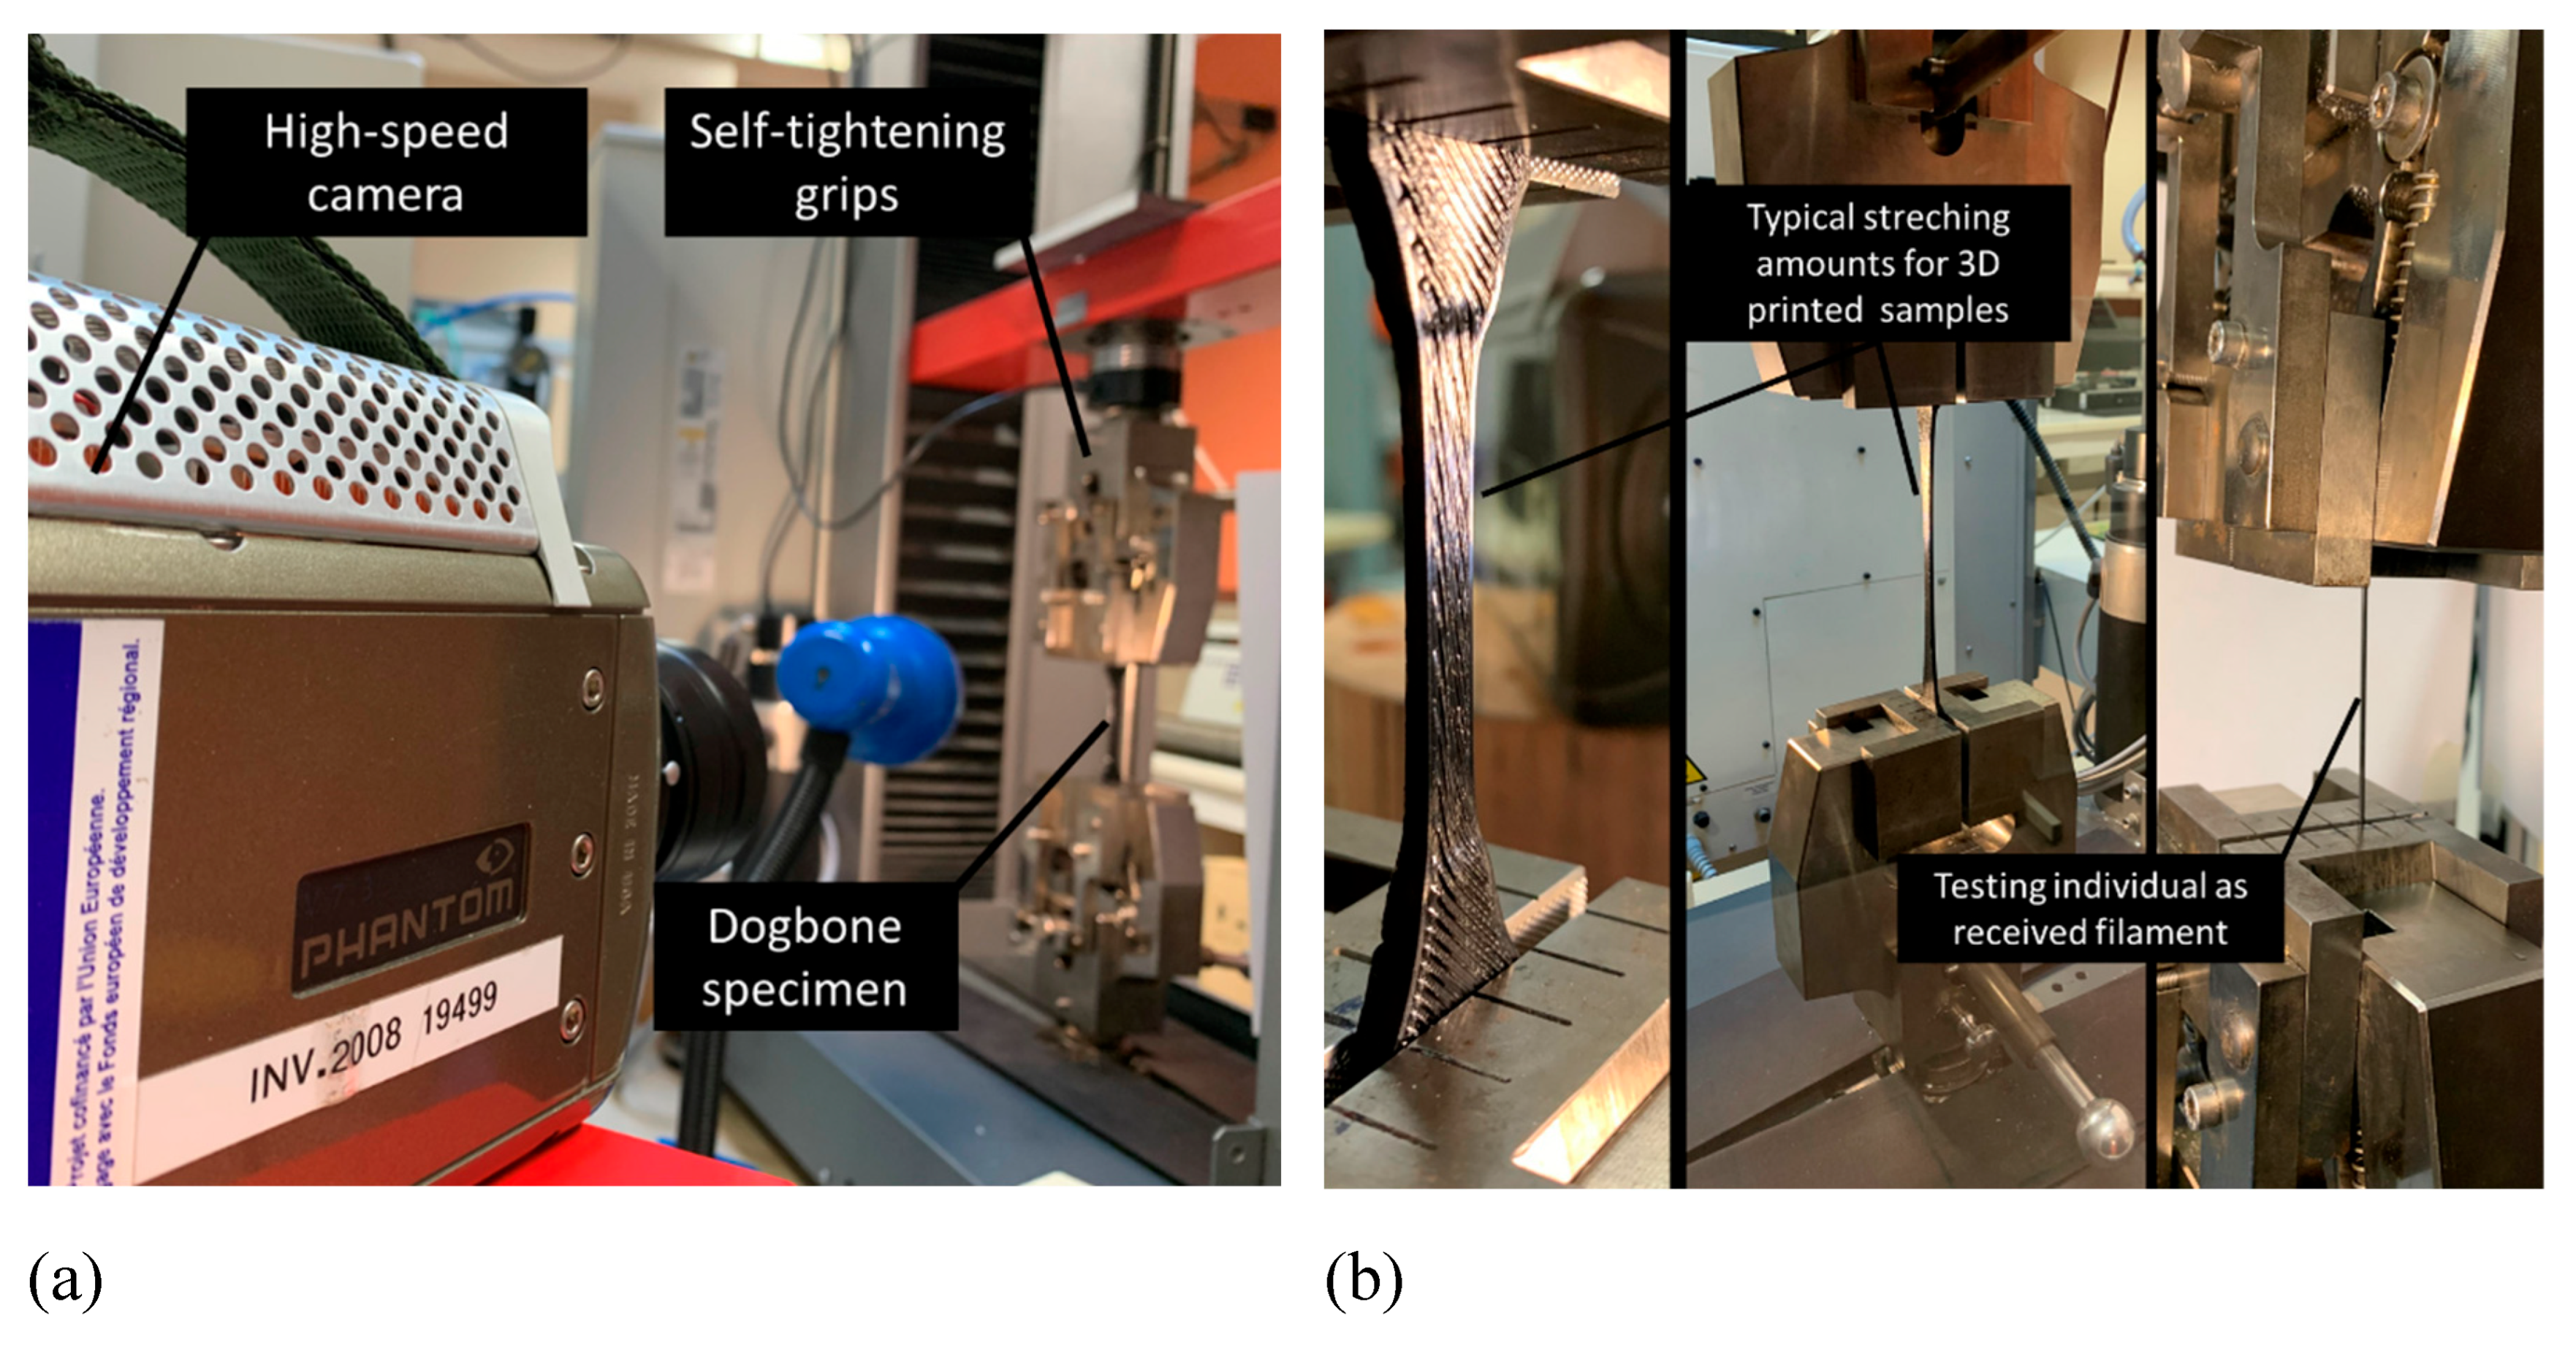
Uniaxial tensile experiments are conducted using a 10kN universal machine from Zwick Roell Group (Ulm, Germany) under a displacement rate of 10 mm/min up to the rupture limit of the specimen (
Figure 2). Both wire and printed structures are tested. Four replicates per condition are used to ensure a reliable measurement. The deformed specimens are monitored using a high-speed camera (Phantom V7.3, Photonline, Marly Le Roi, 78-France) under various frame sizes and rates.
Figure 2 shows typical testing configurations for various printing conditions. Force - displacement data are converted to into engineering stress and strain curves, allowing for the engineering quantities such as Young’s modulus,
), yield stress
, tensile strength
, ultimate stress
, and elongation at break
to be extracted. All these parameters are related to the printing conditions (θ, φ, Tp).
Microstructure of printed structure as well as the fracture patterns are characterised using Scanning Electron Microscopy (SEM) to check the extent of material symmetry modification. Prior observation, all samples were coated with a carbon layer about 50nm thick, using a Balzers CED30 evaporator. Images were taken with a JEOL JSM 5800LV microscope operating at 10KV. The secondary electron detector was used for magnifications ranging from 23× to 170× and pixel sizes from 1.56 to 11µm.
4. Results and discussion
4.1. Intrinsic properties of as-received PLDA filament
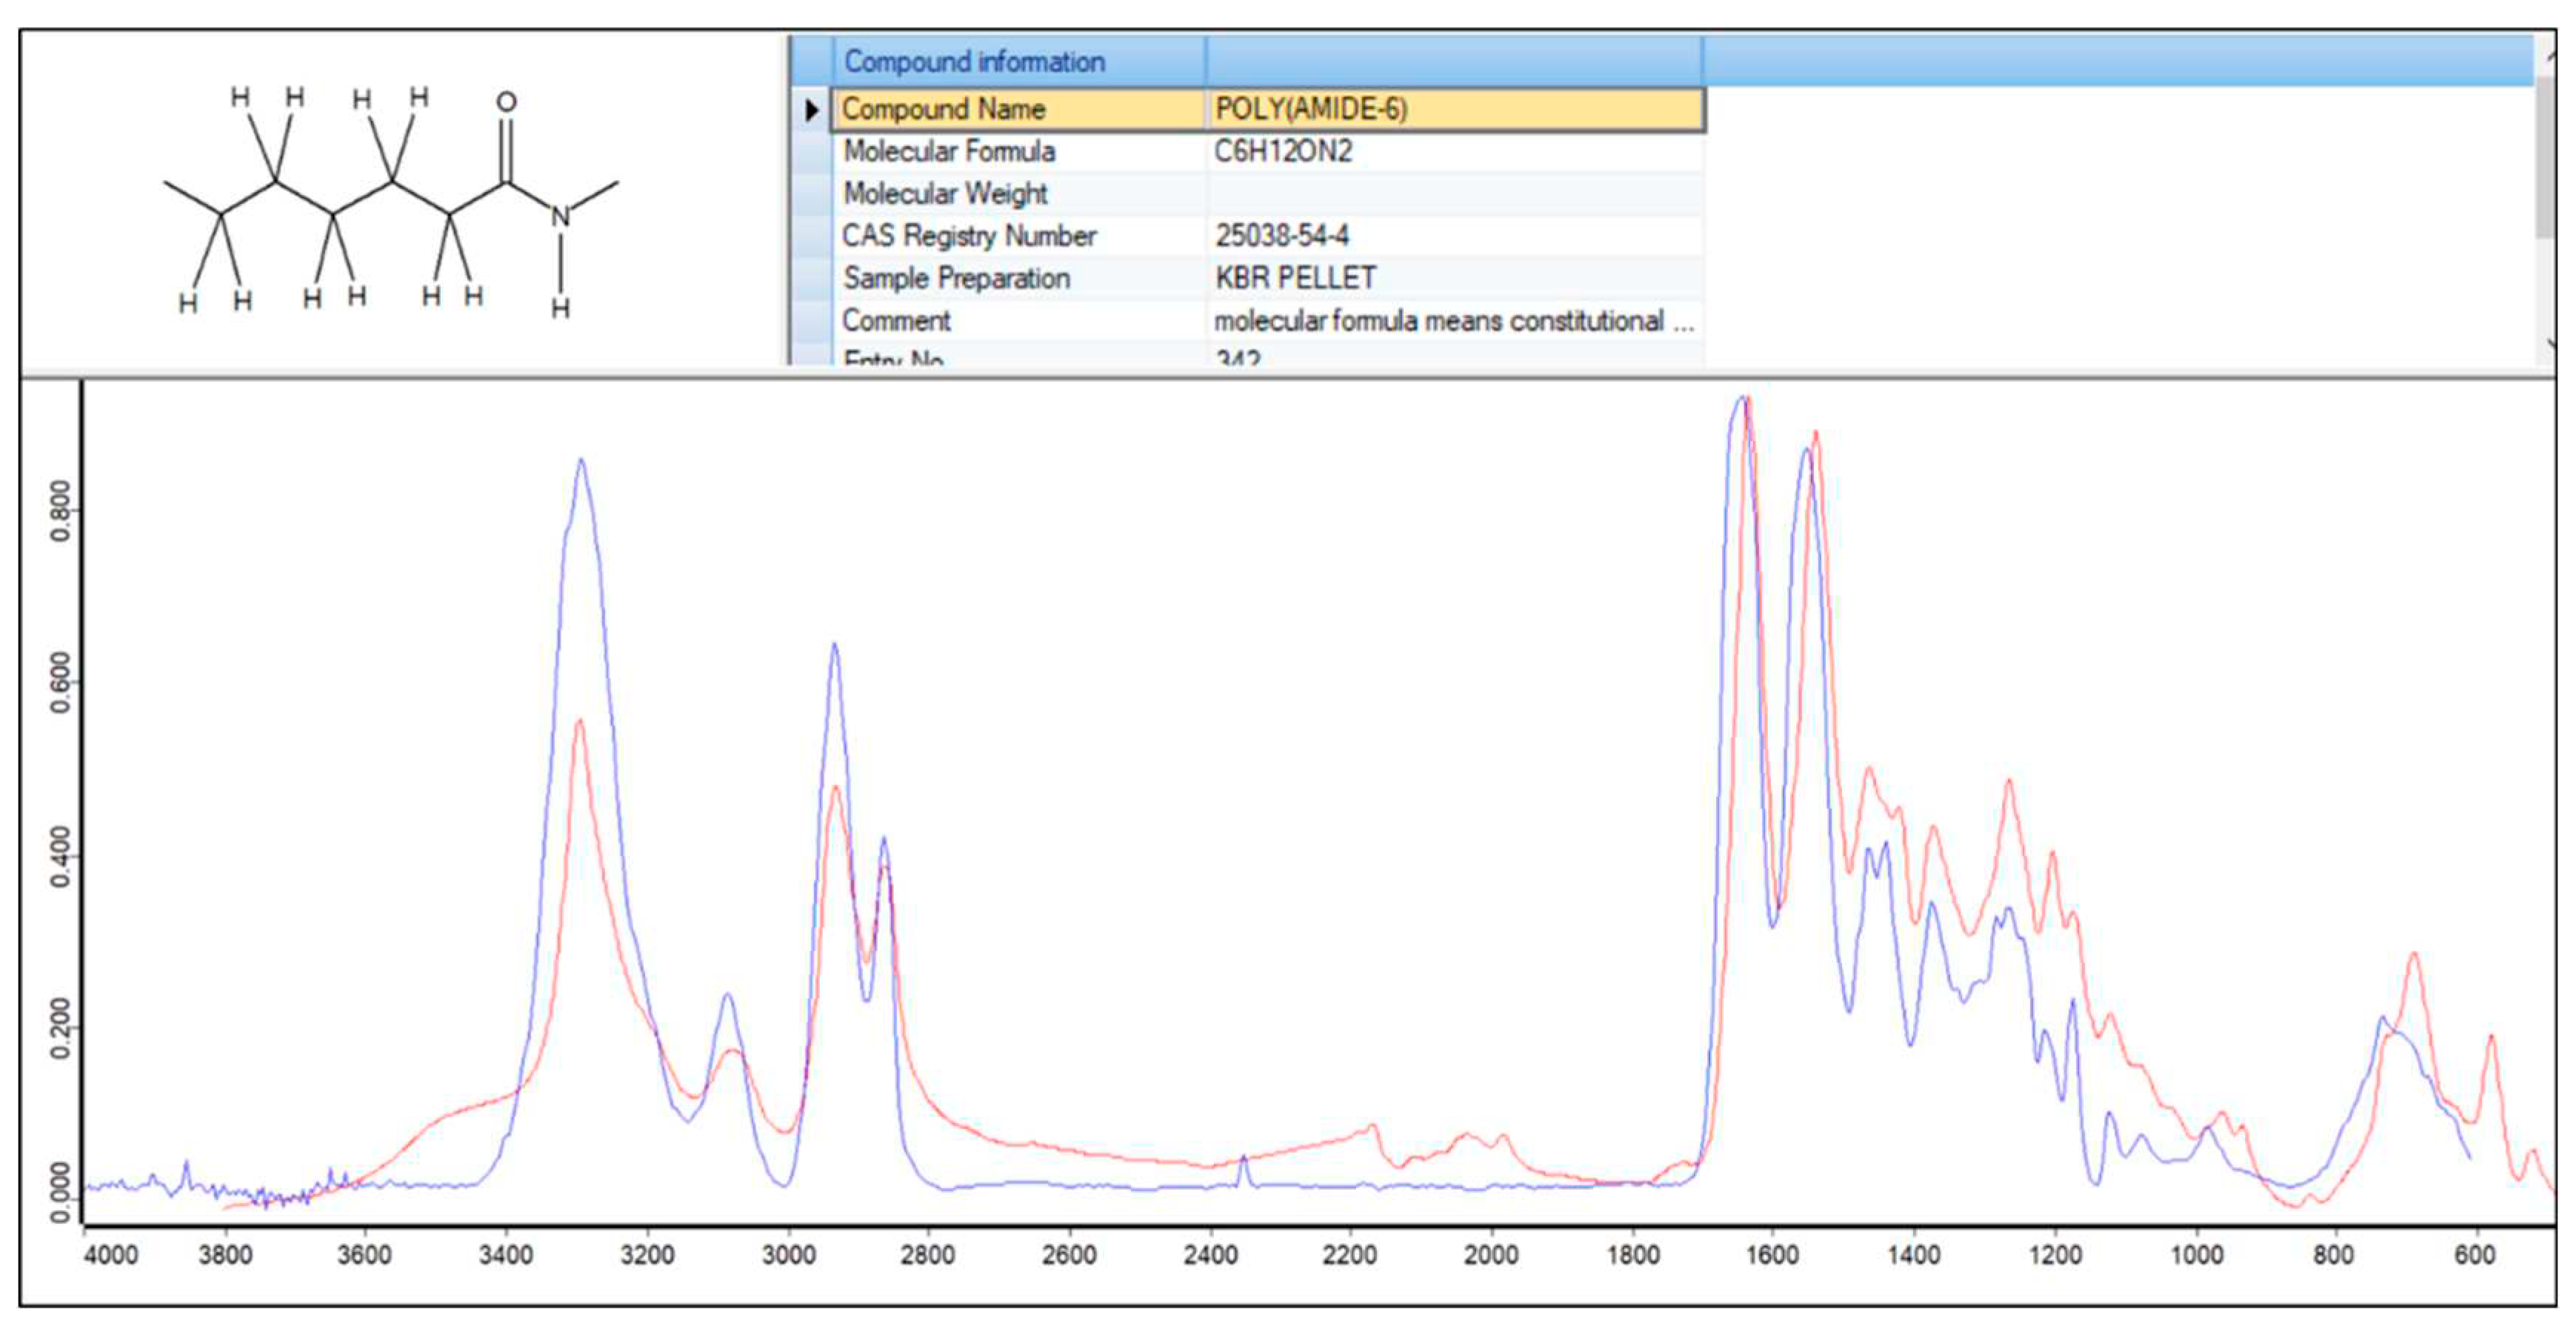
Figure 3 shows a typical FTIR-ATR spectrum of studied PLDA filament. The spectrum is compared to a typical polyamide material. The main component present in the filament is polyamide 6 compound. The infrared assignment characteristic of this compound is the N-H amide stretching in the 3100-3500 cm
-1 domain, the CH
2 stretching band at 2860 and 2930 cm
-1, the Amide I, C=O band at 1630 cm
-1, the Amid II, N-H vibration at 1535 cm
-1 and the C-H deformation band at 1460 and 1370 cm
-1. Associated peak at 730 cm
-1 is according to the out of plane C-H bending.
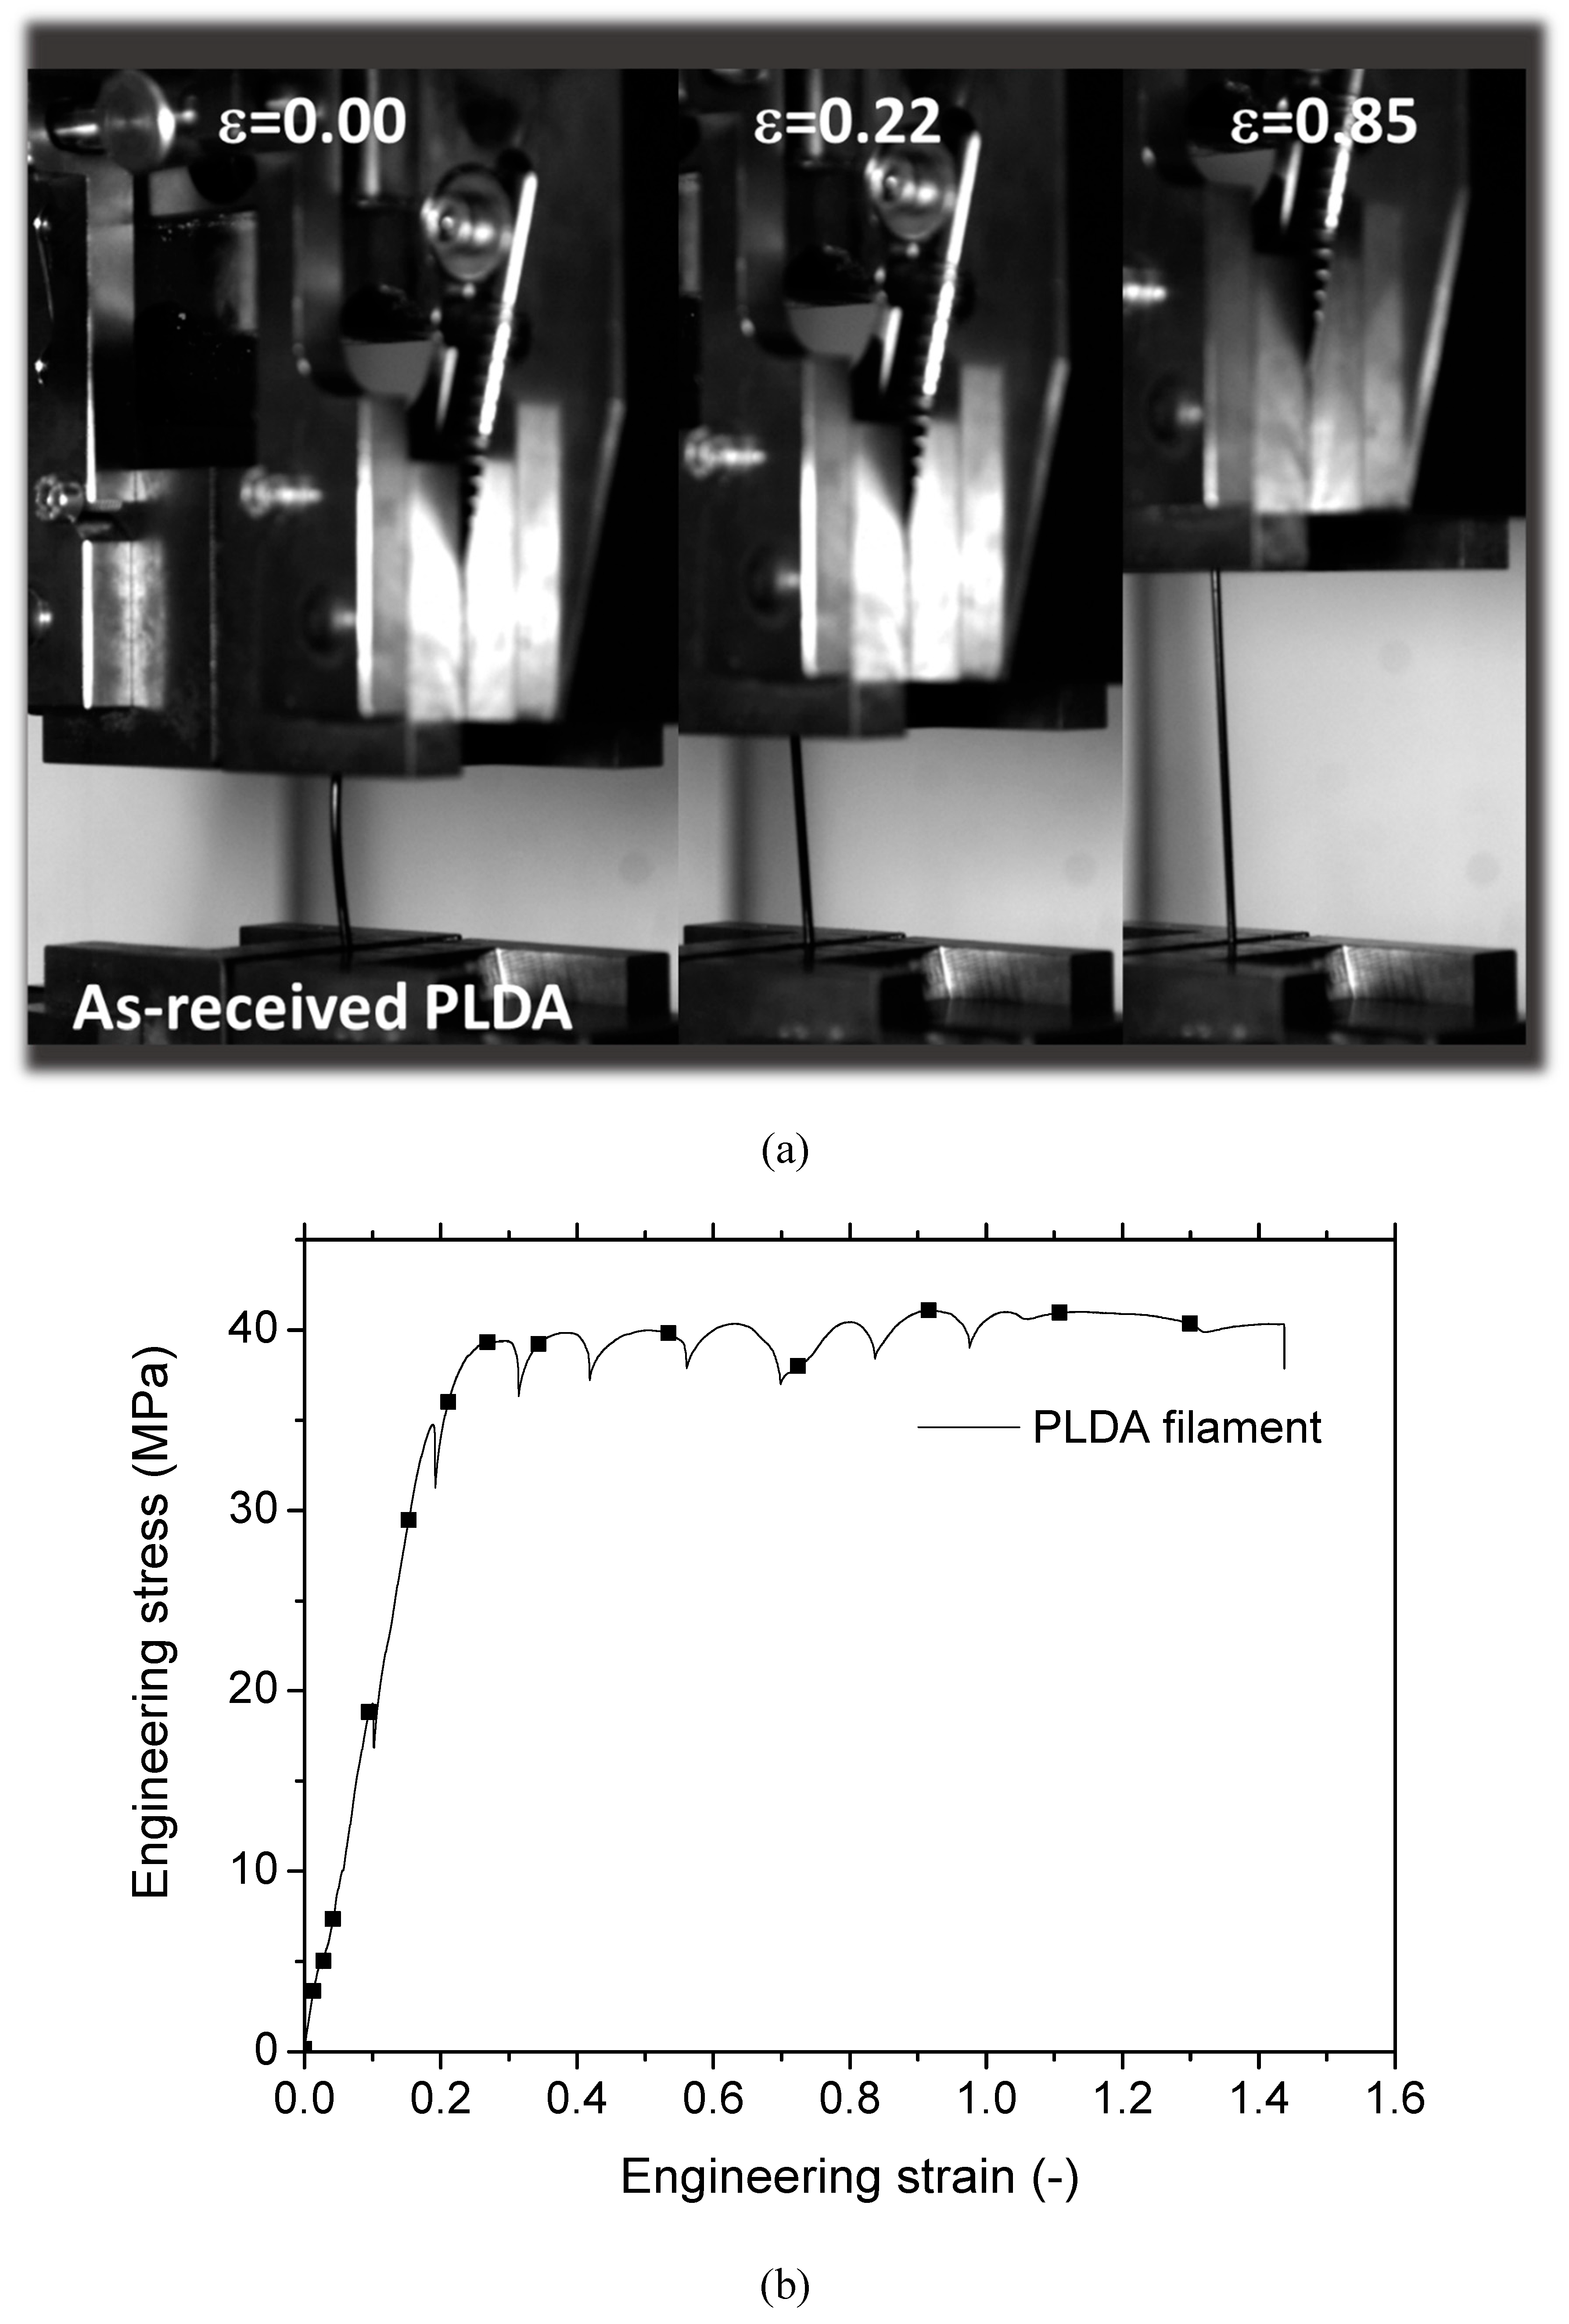
Figure 4 shows optical images extracted from camera recording at three particular load levels
for loading of as-received PLDA wire. The sample exhibits a typical tensile response of a synthetic polymer material with a considerable stretching capability before breaking (
Figure 4a). The examination of the tensile response shows a linear stage up to 20% of engineering strain followed by a quasi-perfect plasticity stage and a notable elongation at break allowing an elongation of 1.4 times its original length. A jagged behaviour is also observed, which corresponds to irregularities or fluctuations in the stress-strain curve. These can be attributed to microstructural changes occurring unevenly or intermittently during loading.
Table 3 summarises the main engineering constants. Besides a low stiffness that can be attributed to the low load rate and high sensitivity of PLDA to strain rate, the yield stress (
σY) represents roughly 85% of the tensile strength (
σM). There is no significant difference between the tensile strength and the ultimate stress (
σR ≈ σM). Furthermore, the elongation at break demonstrates significant variability, necessitating the use of a range of values to represent it rather than relying solely on an average and standard deviation.
4.2. Tensile behaviour of 3D printed PLDA
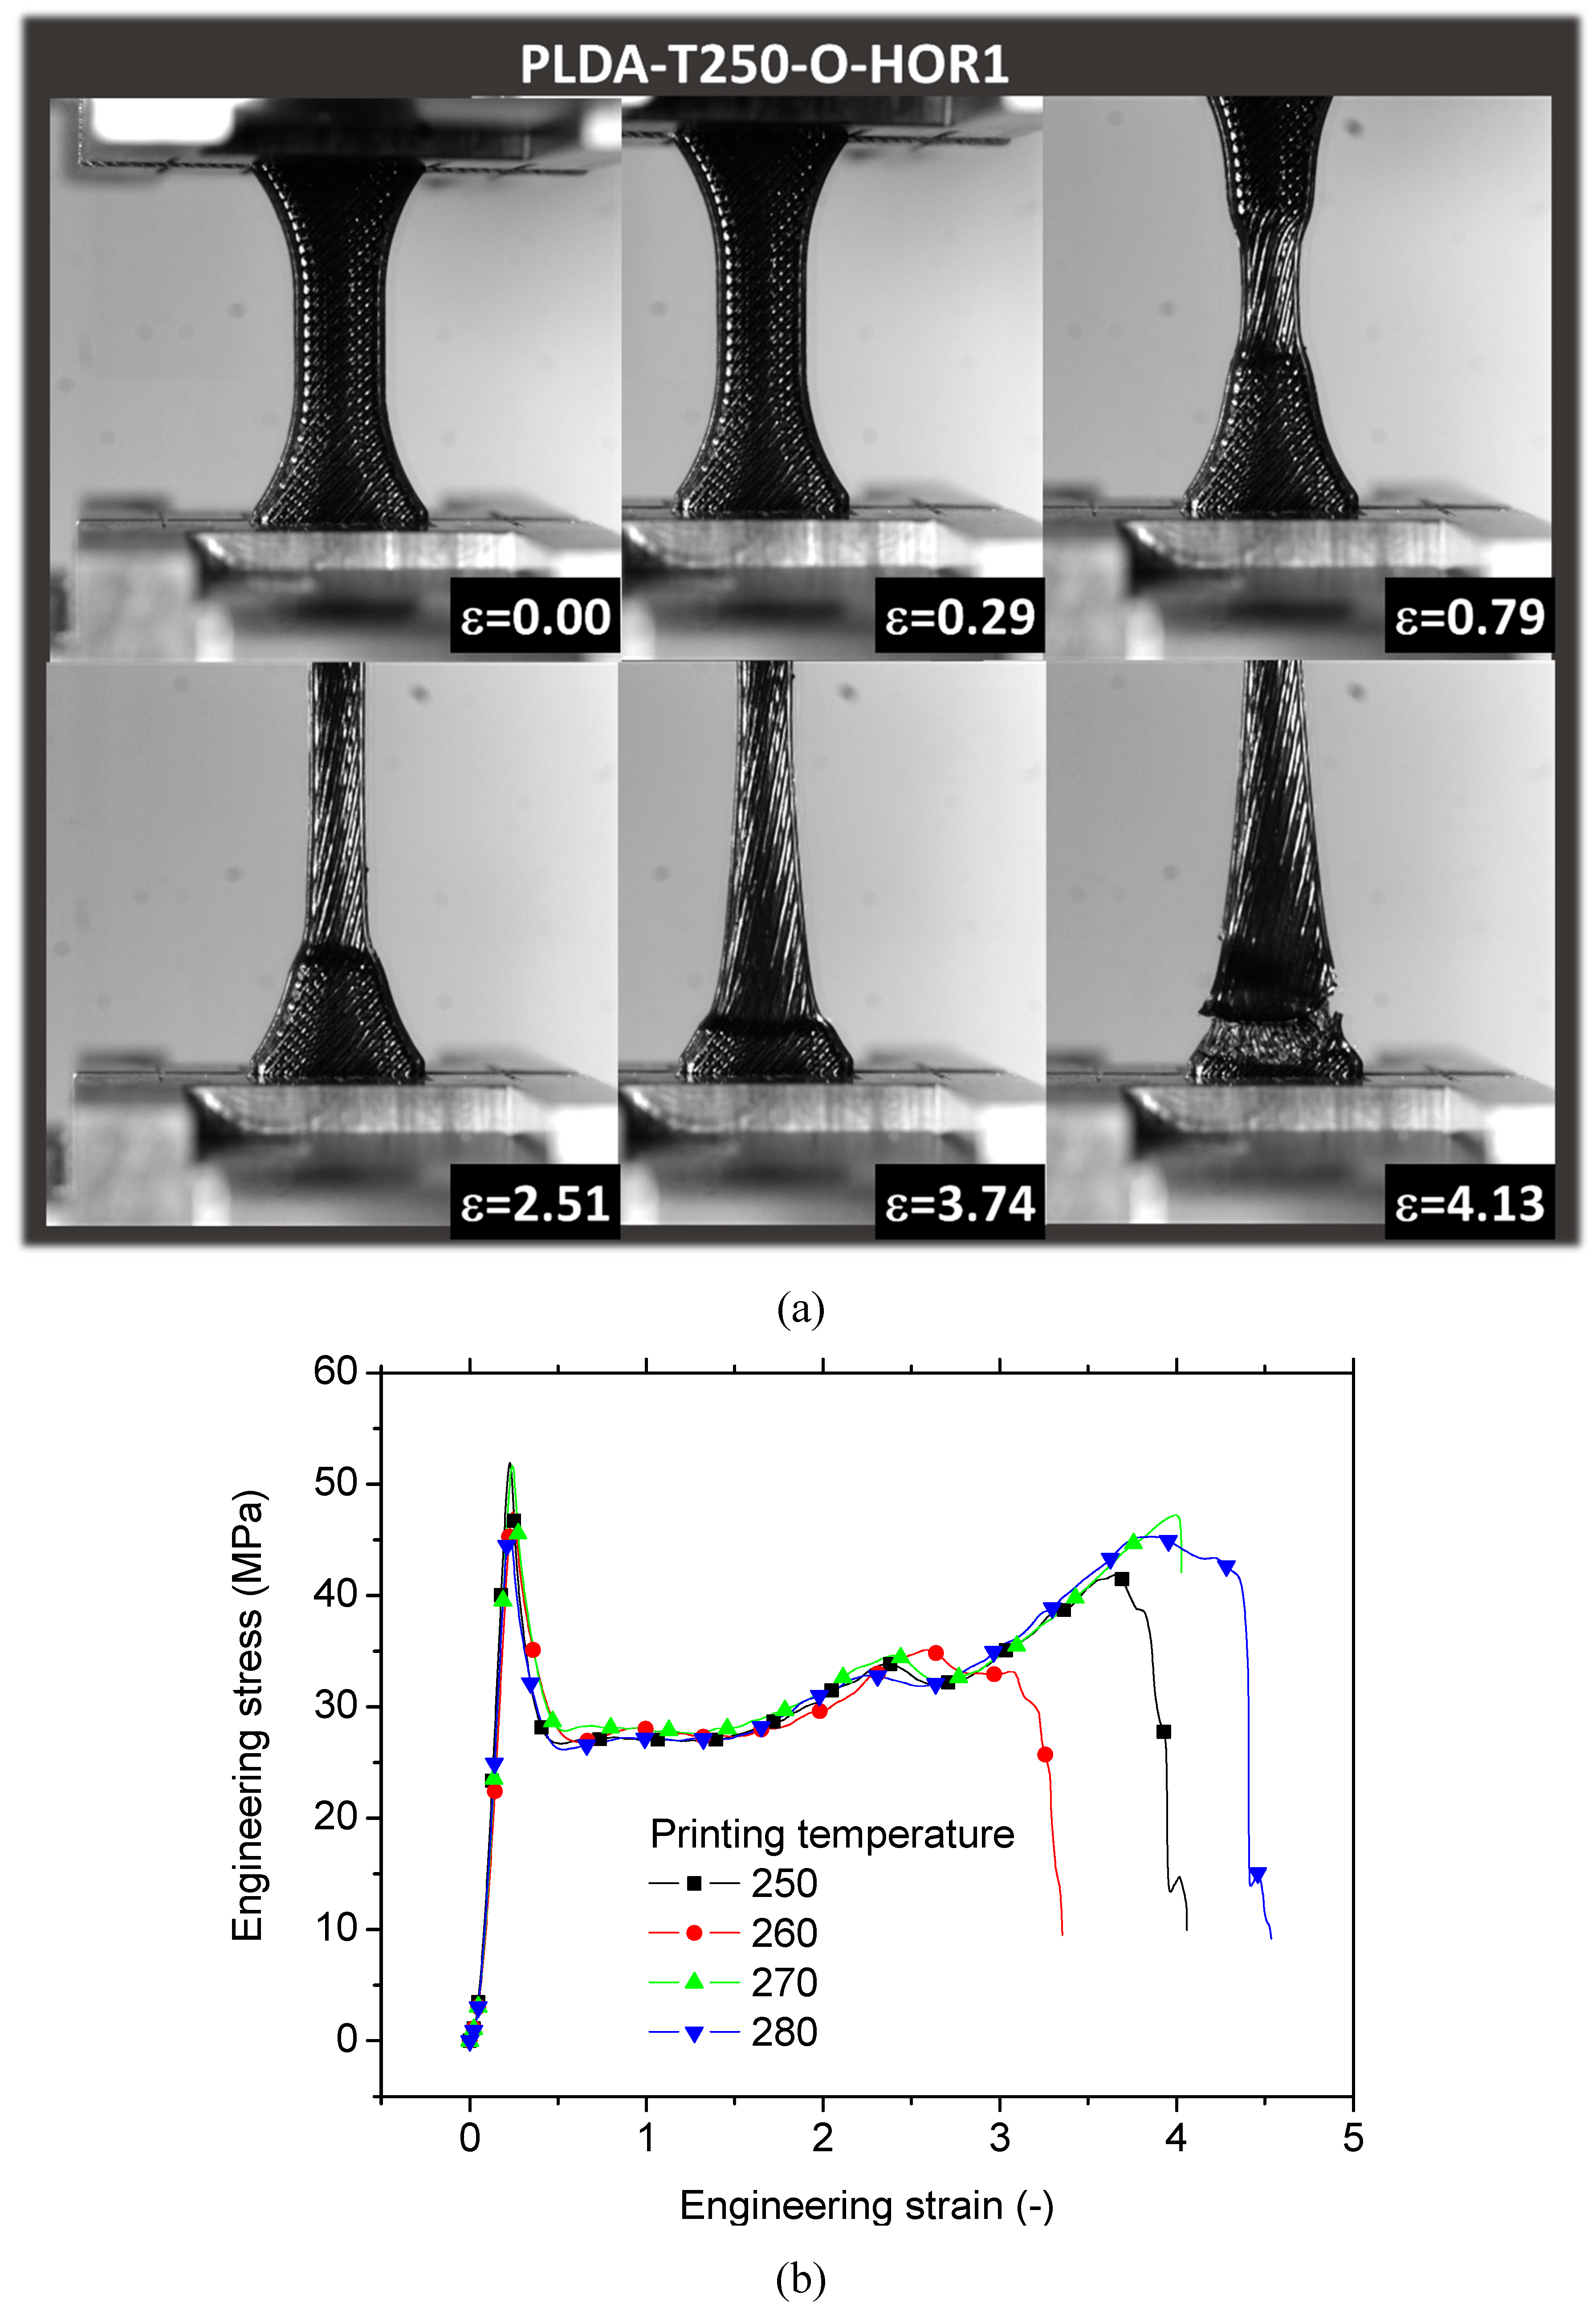
Figure 5 shows the equivalent tensile response of printed PLDA as a function of the printing temperature for a fixed orientation corresponding to horizontal printing configuration (i.e. building direction aligned with specimen thickness).
Figure 5a shows the main stages of deformation that a typical specimen processed with a printing temperature of 250°C and a layup of -45°/+45°. Homogeneous extension of the specimen is observed up to the first 30% of increase in length with a symmetrical behaviour along the few percent of material extension. A second stage corresponding to the necking formation at the centre of the specimen follows as shown at the engineering strain (ε) level of 0.79 (
Figure 5a). This stage corresponds to a first break in symmetry as filaments in the central part are more subject to load transfer. The expansion of such region towards the grip occurs (ε = 2.51) up to a point where failure is reached (ε = 4.13). This scenario is more or less the same for the other printing conditions, which is further examined through the tensile response in
Figure 5b. No major differences are observed between the printing conditions within the printing temperature interval of 250° - 280°C. The homogeneous extension refers here to the first linear part of the tensile curve. A sudden drop in the stress from the tensile strength level occurs as a result of the necking and a large plasticity stage follows. The rupture occurs after an increase in the stress materialised by the alignment of the filaments in the loading direction and a stress localisation. This stage restores partially the symmetry in the filament arrangement in the loading direction. This is referred to as a strain stiffening behaviour. There is no direct correlation between the stages mentioned above and the printing temperature.
Table 3 further enforces this statement. With the exception of the printing temperature 250 °C, there a slight increase of Young’s modulus by 15% and a large reduction of elongation at break by 76% are depicted when the printing temperature increases from 260°C to 280°C. No other tendencies for yield stress, tensile strength, and rupture stress are observed.
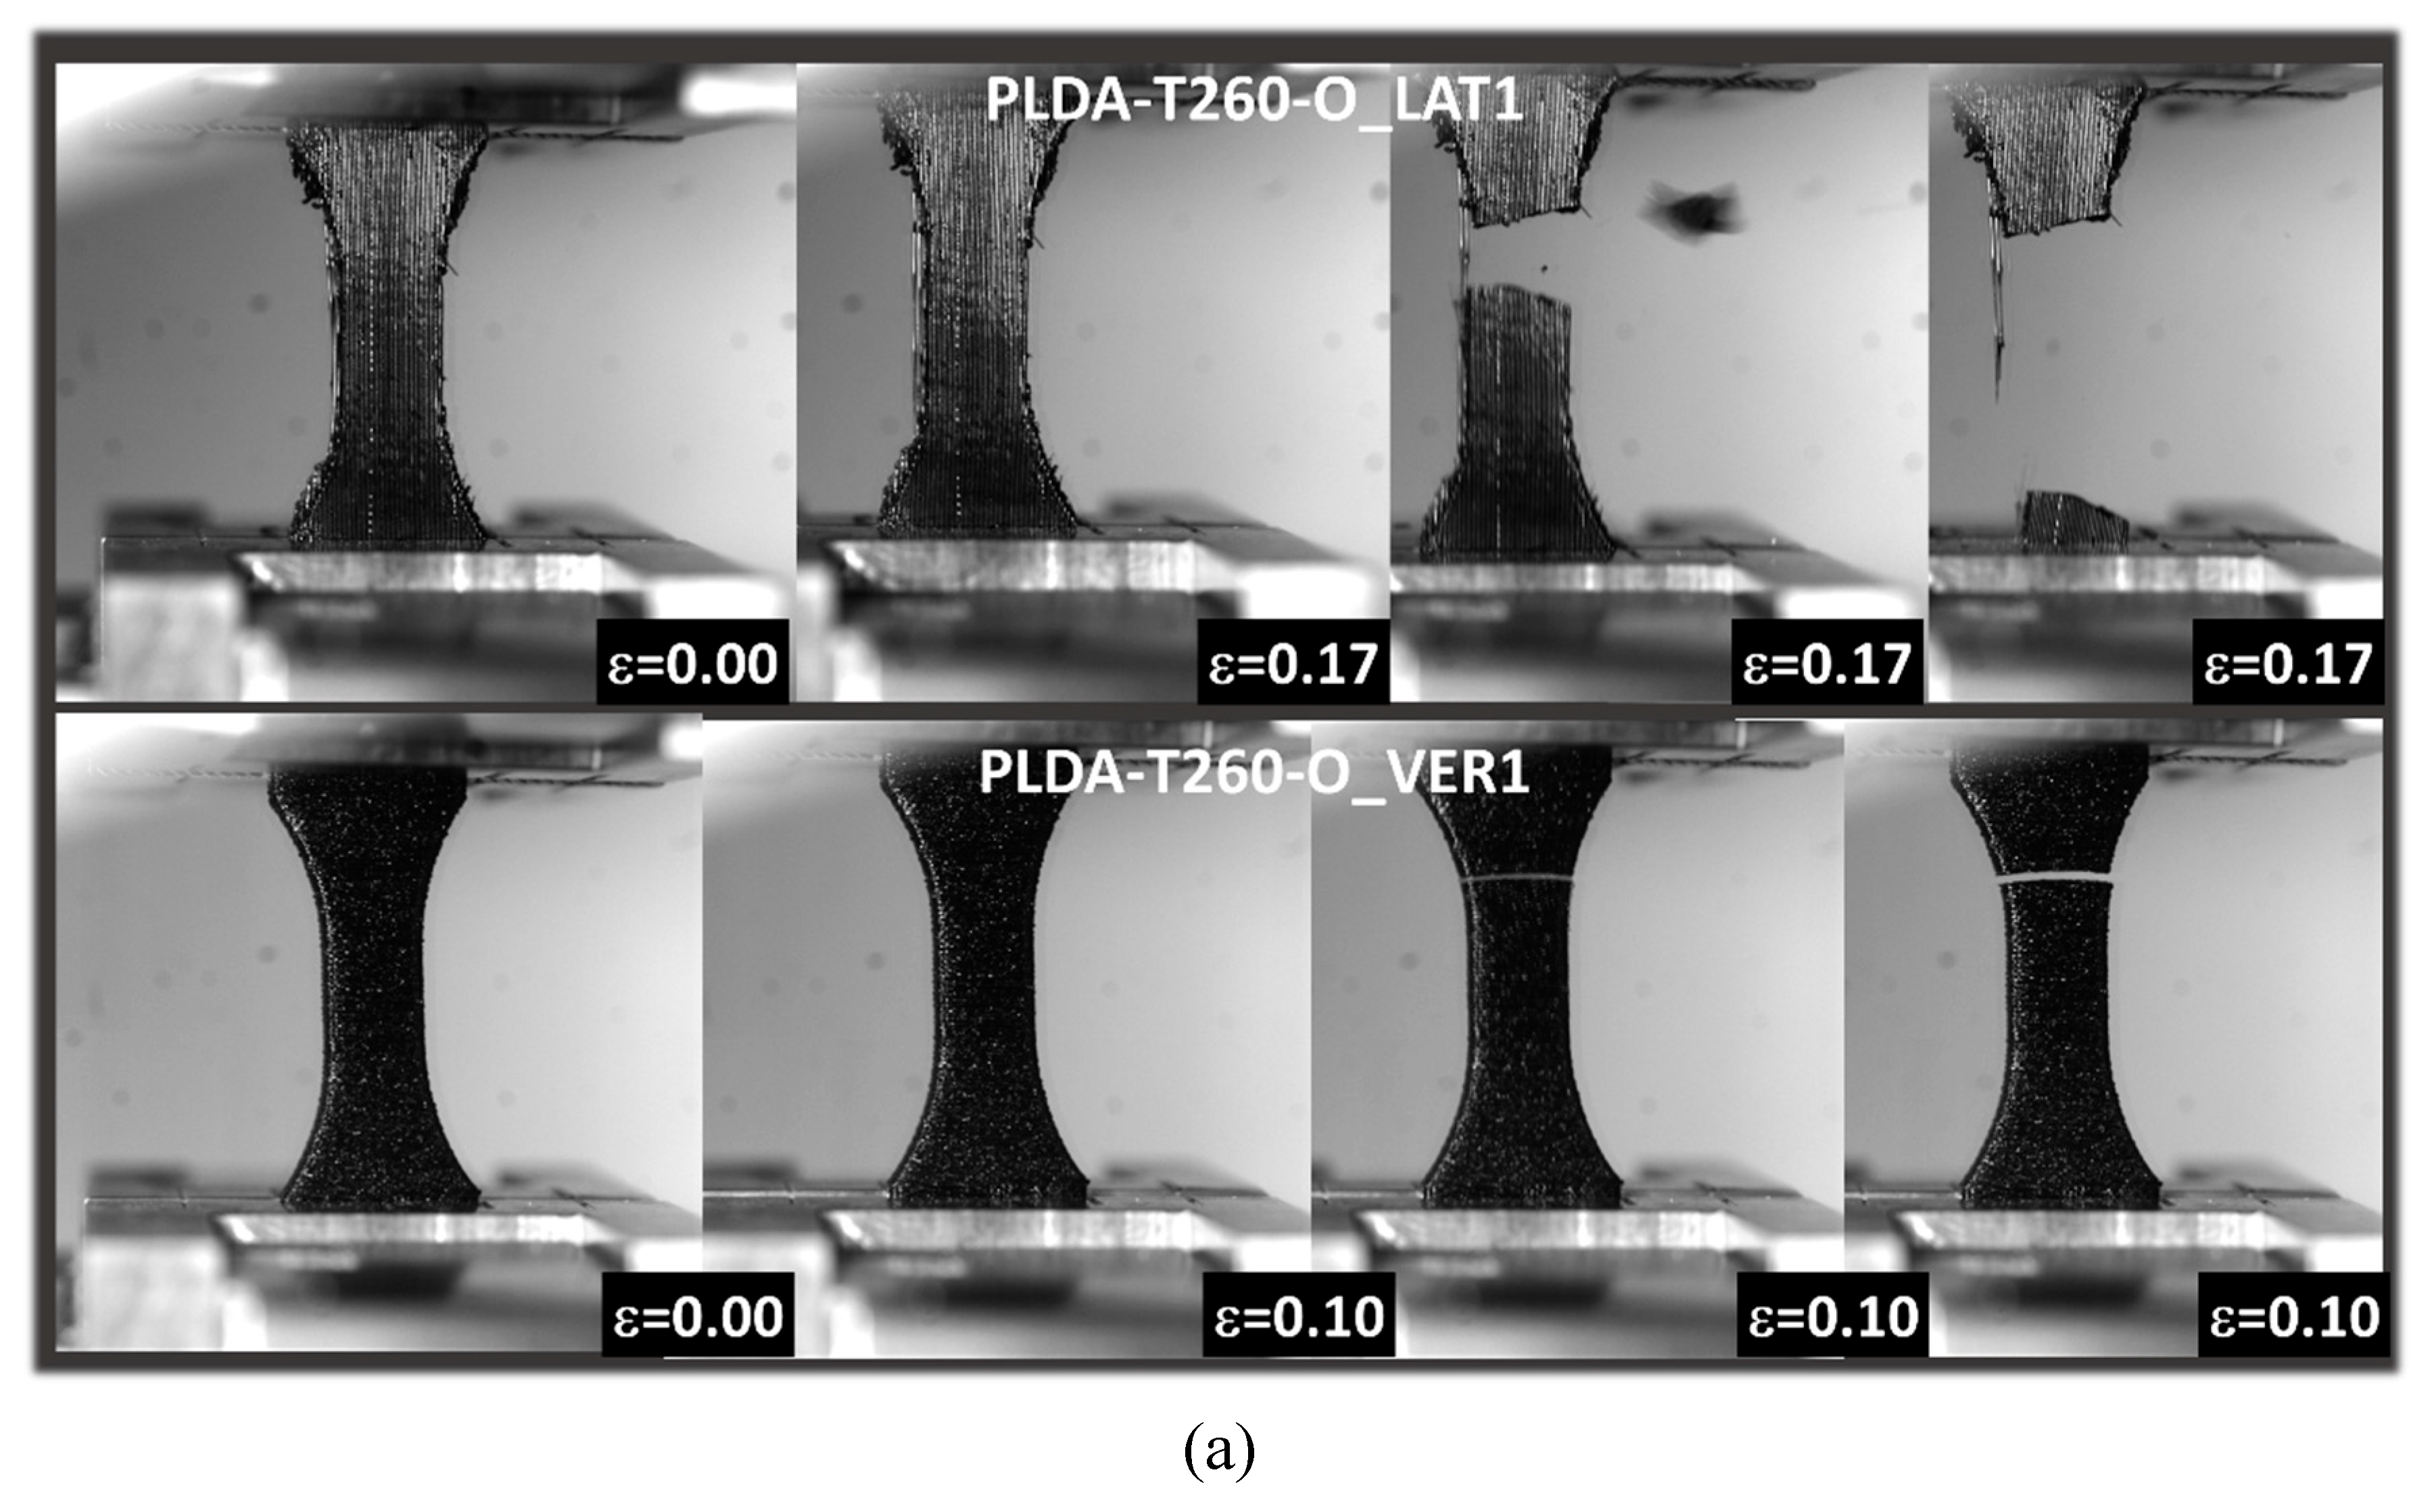
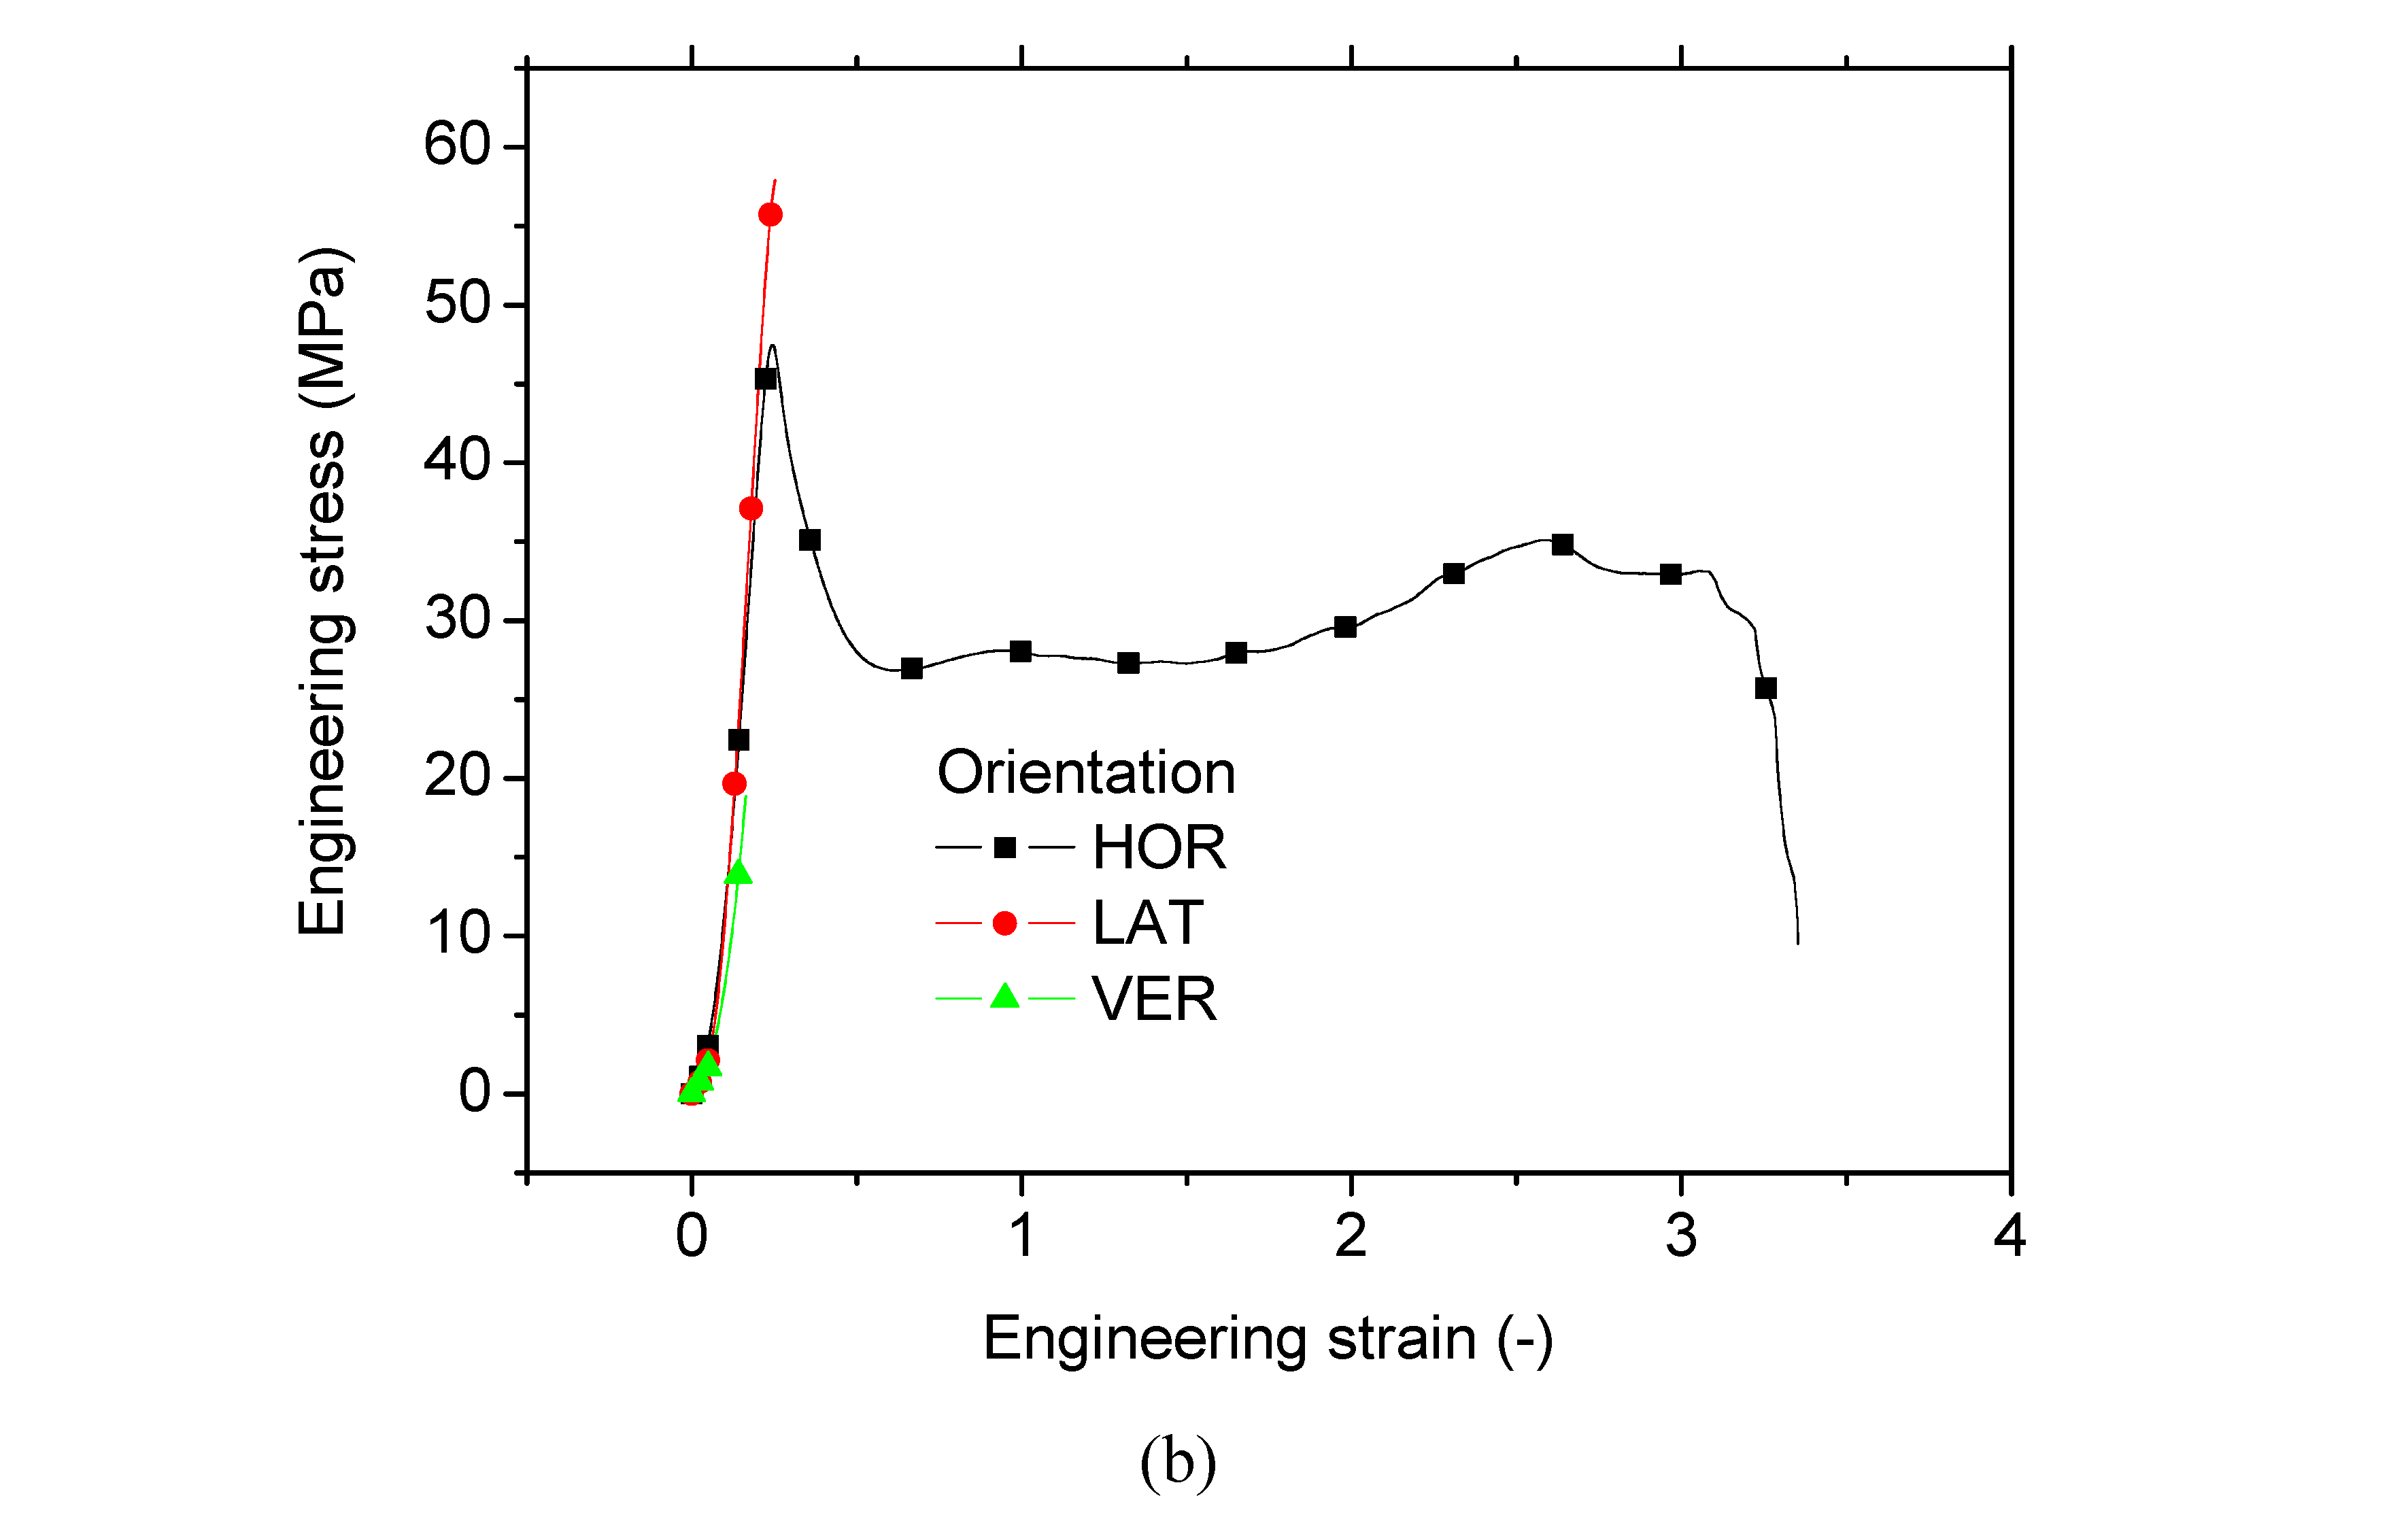
Figure 6 shows the effect of the part orientation on the tensile performance of PLDA printed samples for a fixed printing temperature of 260°C. Deformed samples corresponding to vertical and lateral orientations are shown in
Figure 6a. These can be fairly compared to the horizontal configuration shown in
Figure 5a. A quasi-brittle failure is observed for both vertical and lateral orientations with a limited stretching compared to the horizontal configuration. There is significant modification in the in-plane filament symmetry for the case of vertical orientation because of the small extension prior to rupture. However, a larger extension is depicted for the case of lateral orientation compared to the vertical one. Lateral orientation triggers a rupture in symmetry through the necking behaviour followed by a tendency to restore a symmetry in the loading direction by filament realignment. Tensile response of all configurations is shown in
Figure 6b where all layups are fixed to +45°/-45° as well as the printing temperature to 260°C. A clear distinction between the trend exhibited by the horizontal orientation (HOR) compared to the vertical (VER) and lateral (LAT) orientations. Even if a higher reached stress levels are achieved by the lateral orientation, the same quasi-brittle behaviour is observed for VER and LAT. Extracted engineering constants in
Table 3 demonstrate the low ranking of VER for both Young’s modulus and tensile strength compared to the remaining conditions. At a consistent printing temperature of 260°C, the stiffness of specimens printed vertically is 76% in comparison to the horizontal orientation and 57% when compared to the lateral orientation. The lateral configuration is thus more suitable for improving the stiffness of the printed PLDA. The same observation also holds for the tensile strength, which is the highest for the lateral orientation. It ranks as 118% and 252% compared to the horizontal and vertical orientations, respectively. A severe reduction in the elongation at break is observed for the vertical and lateral orientation, which ranks only as 5% of the elongation at break for the horizontal orientation.
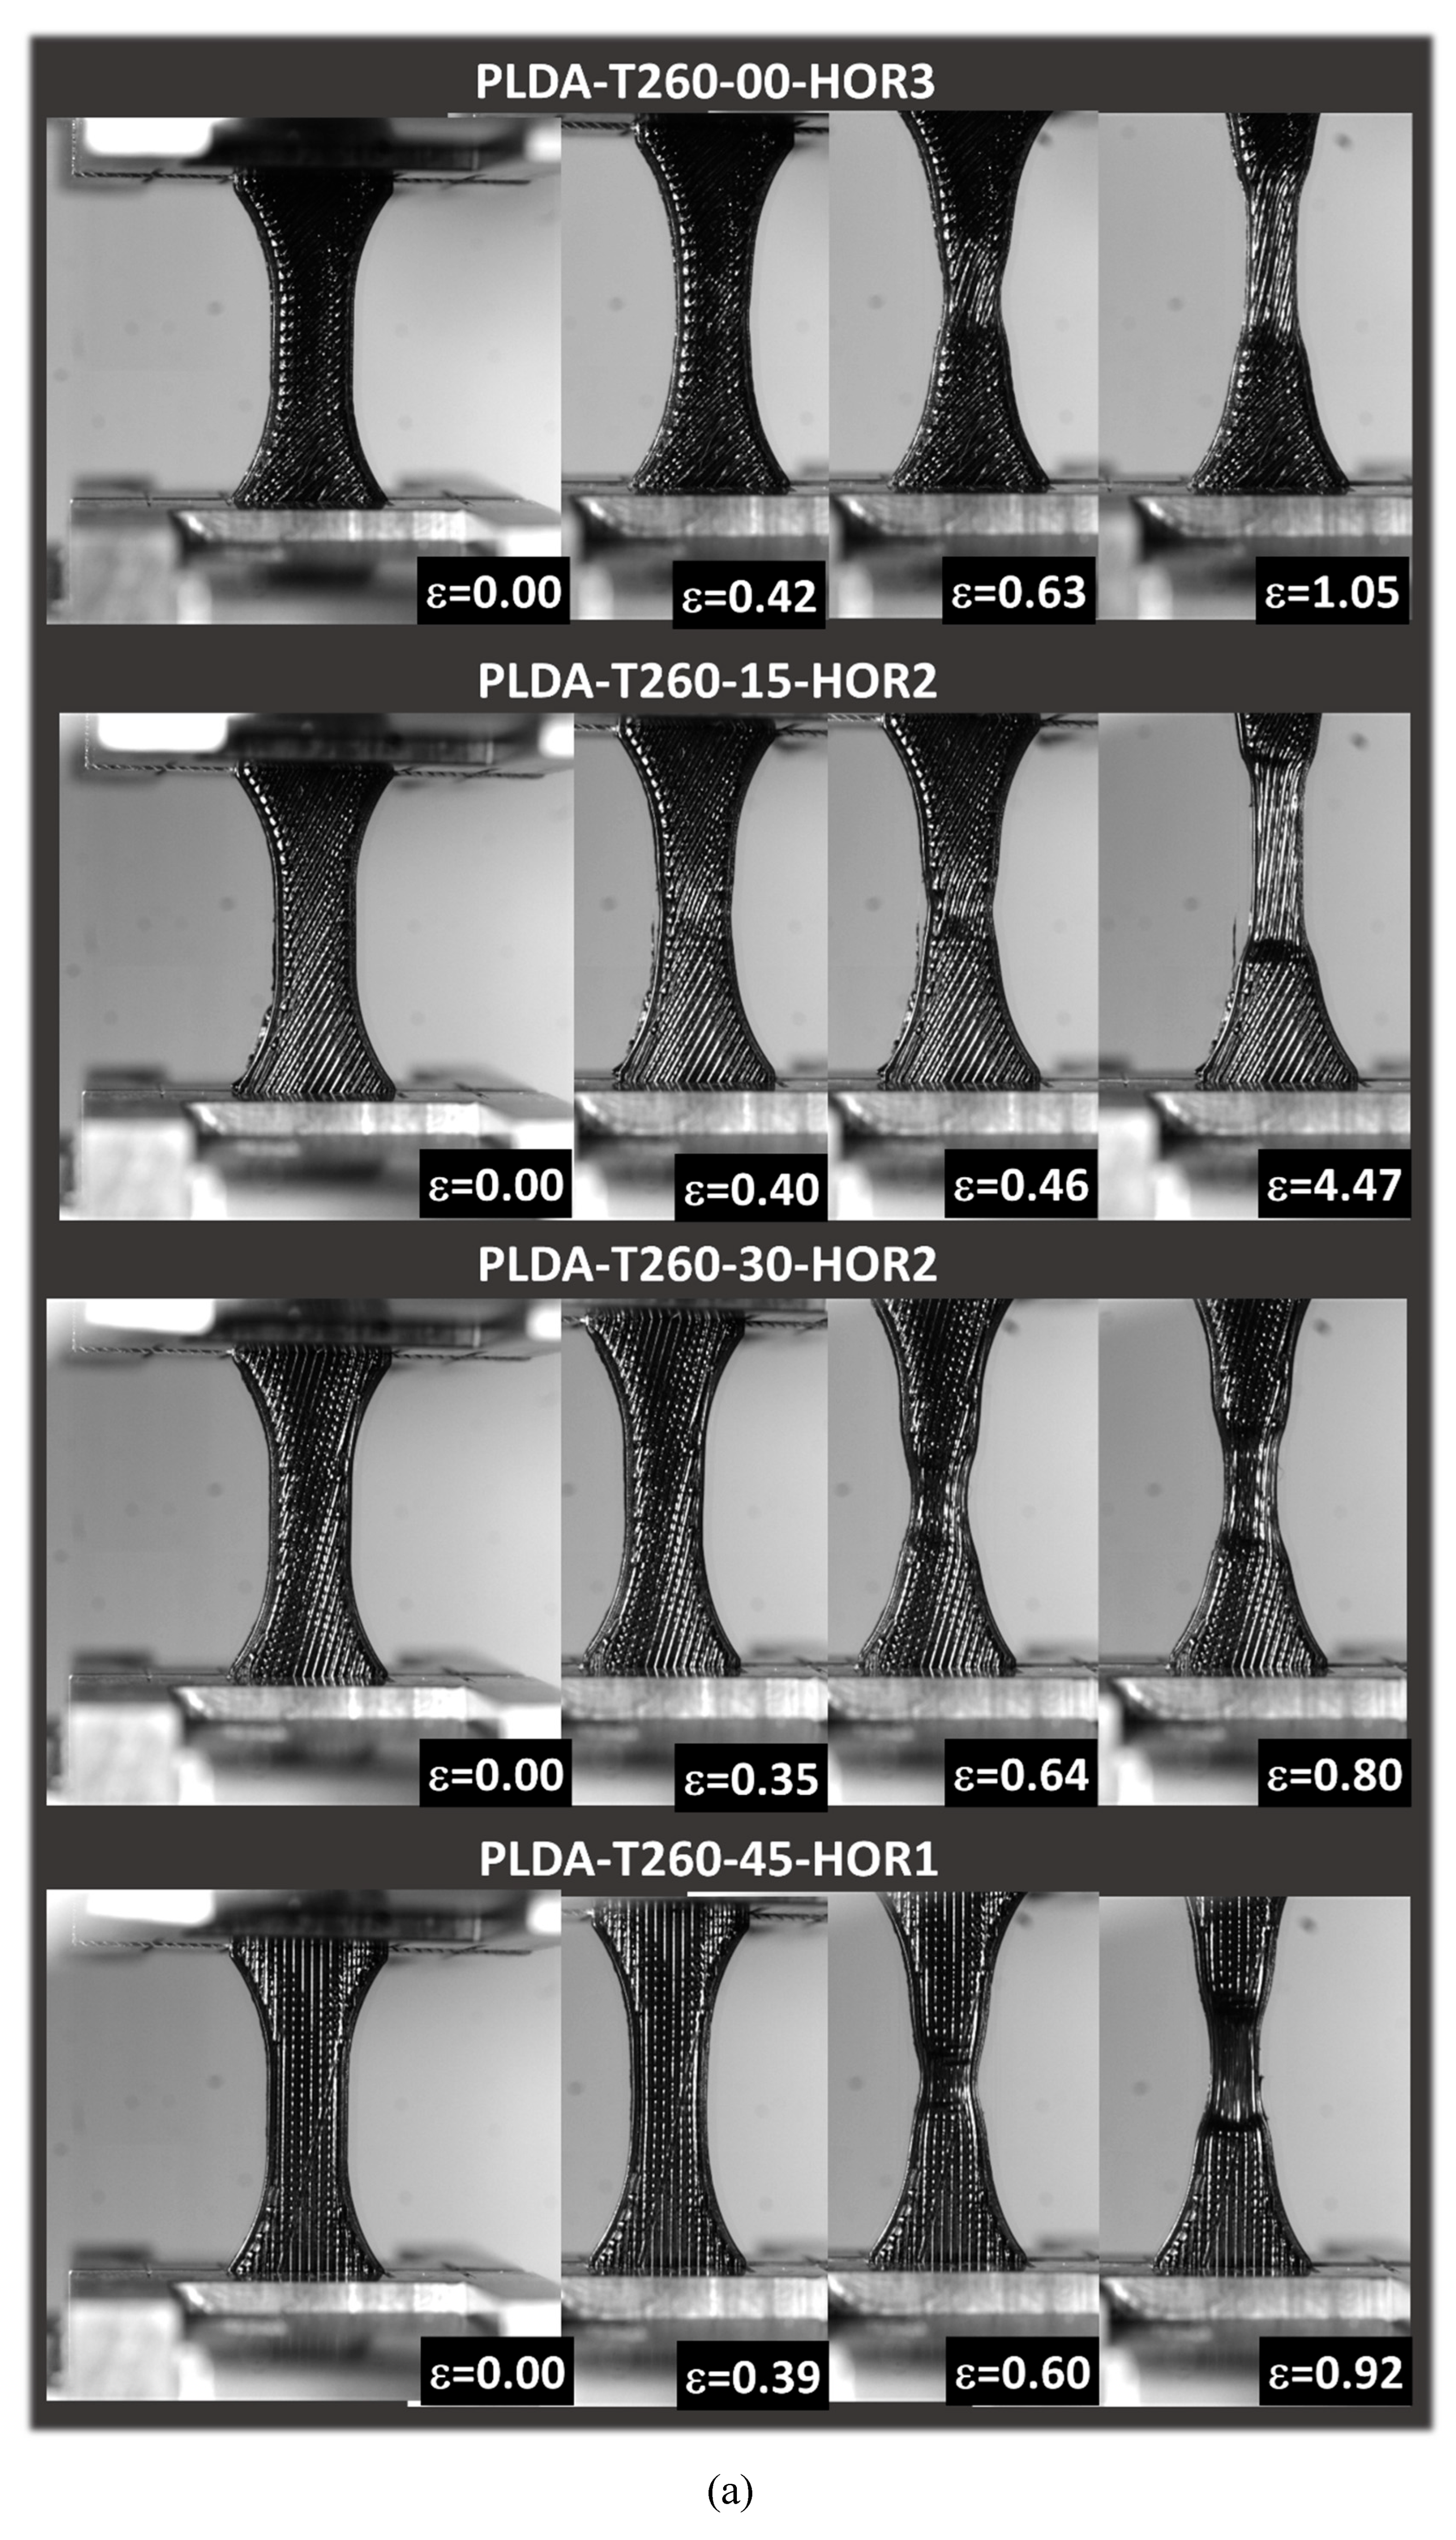
Figure 7a shows the deformed samples corresponding to printing angles ranging from 0° to 45°.
Large filament stretching is a common feature for all printing angles prior rupture. Such stretching is associated in symmetry break due to localised straining. In addition, filament realignment is the main driving mechanism, which allows the printed structure to withstand the tensile loading by modifying the symmetry of filament in-plane arrangement. The intensity of the filament realignment depends on the printing angle.
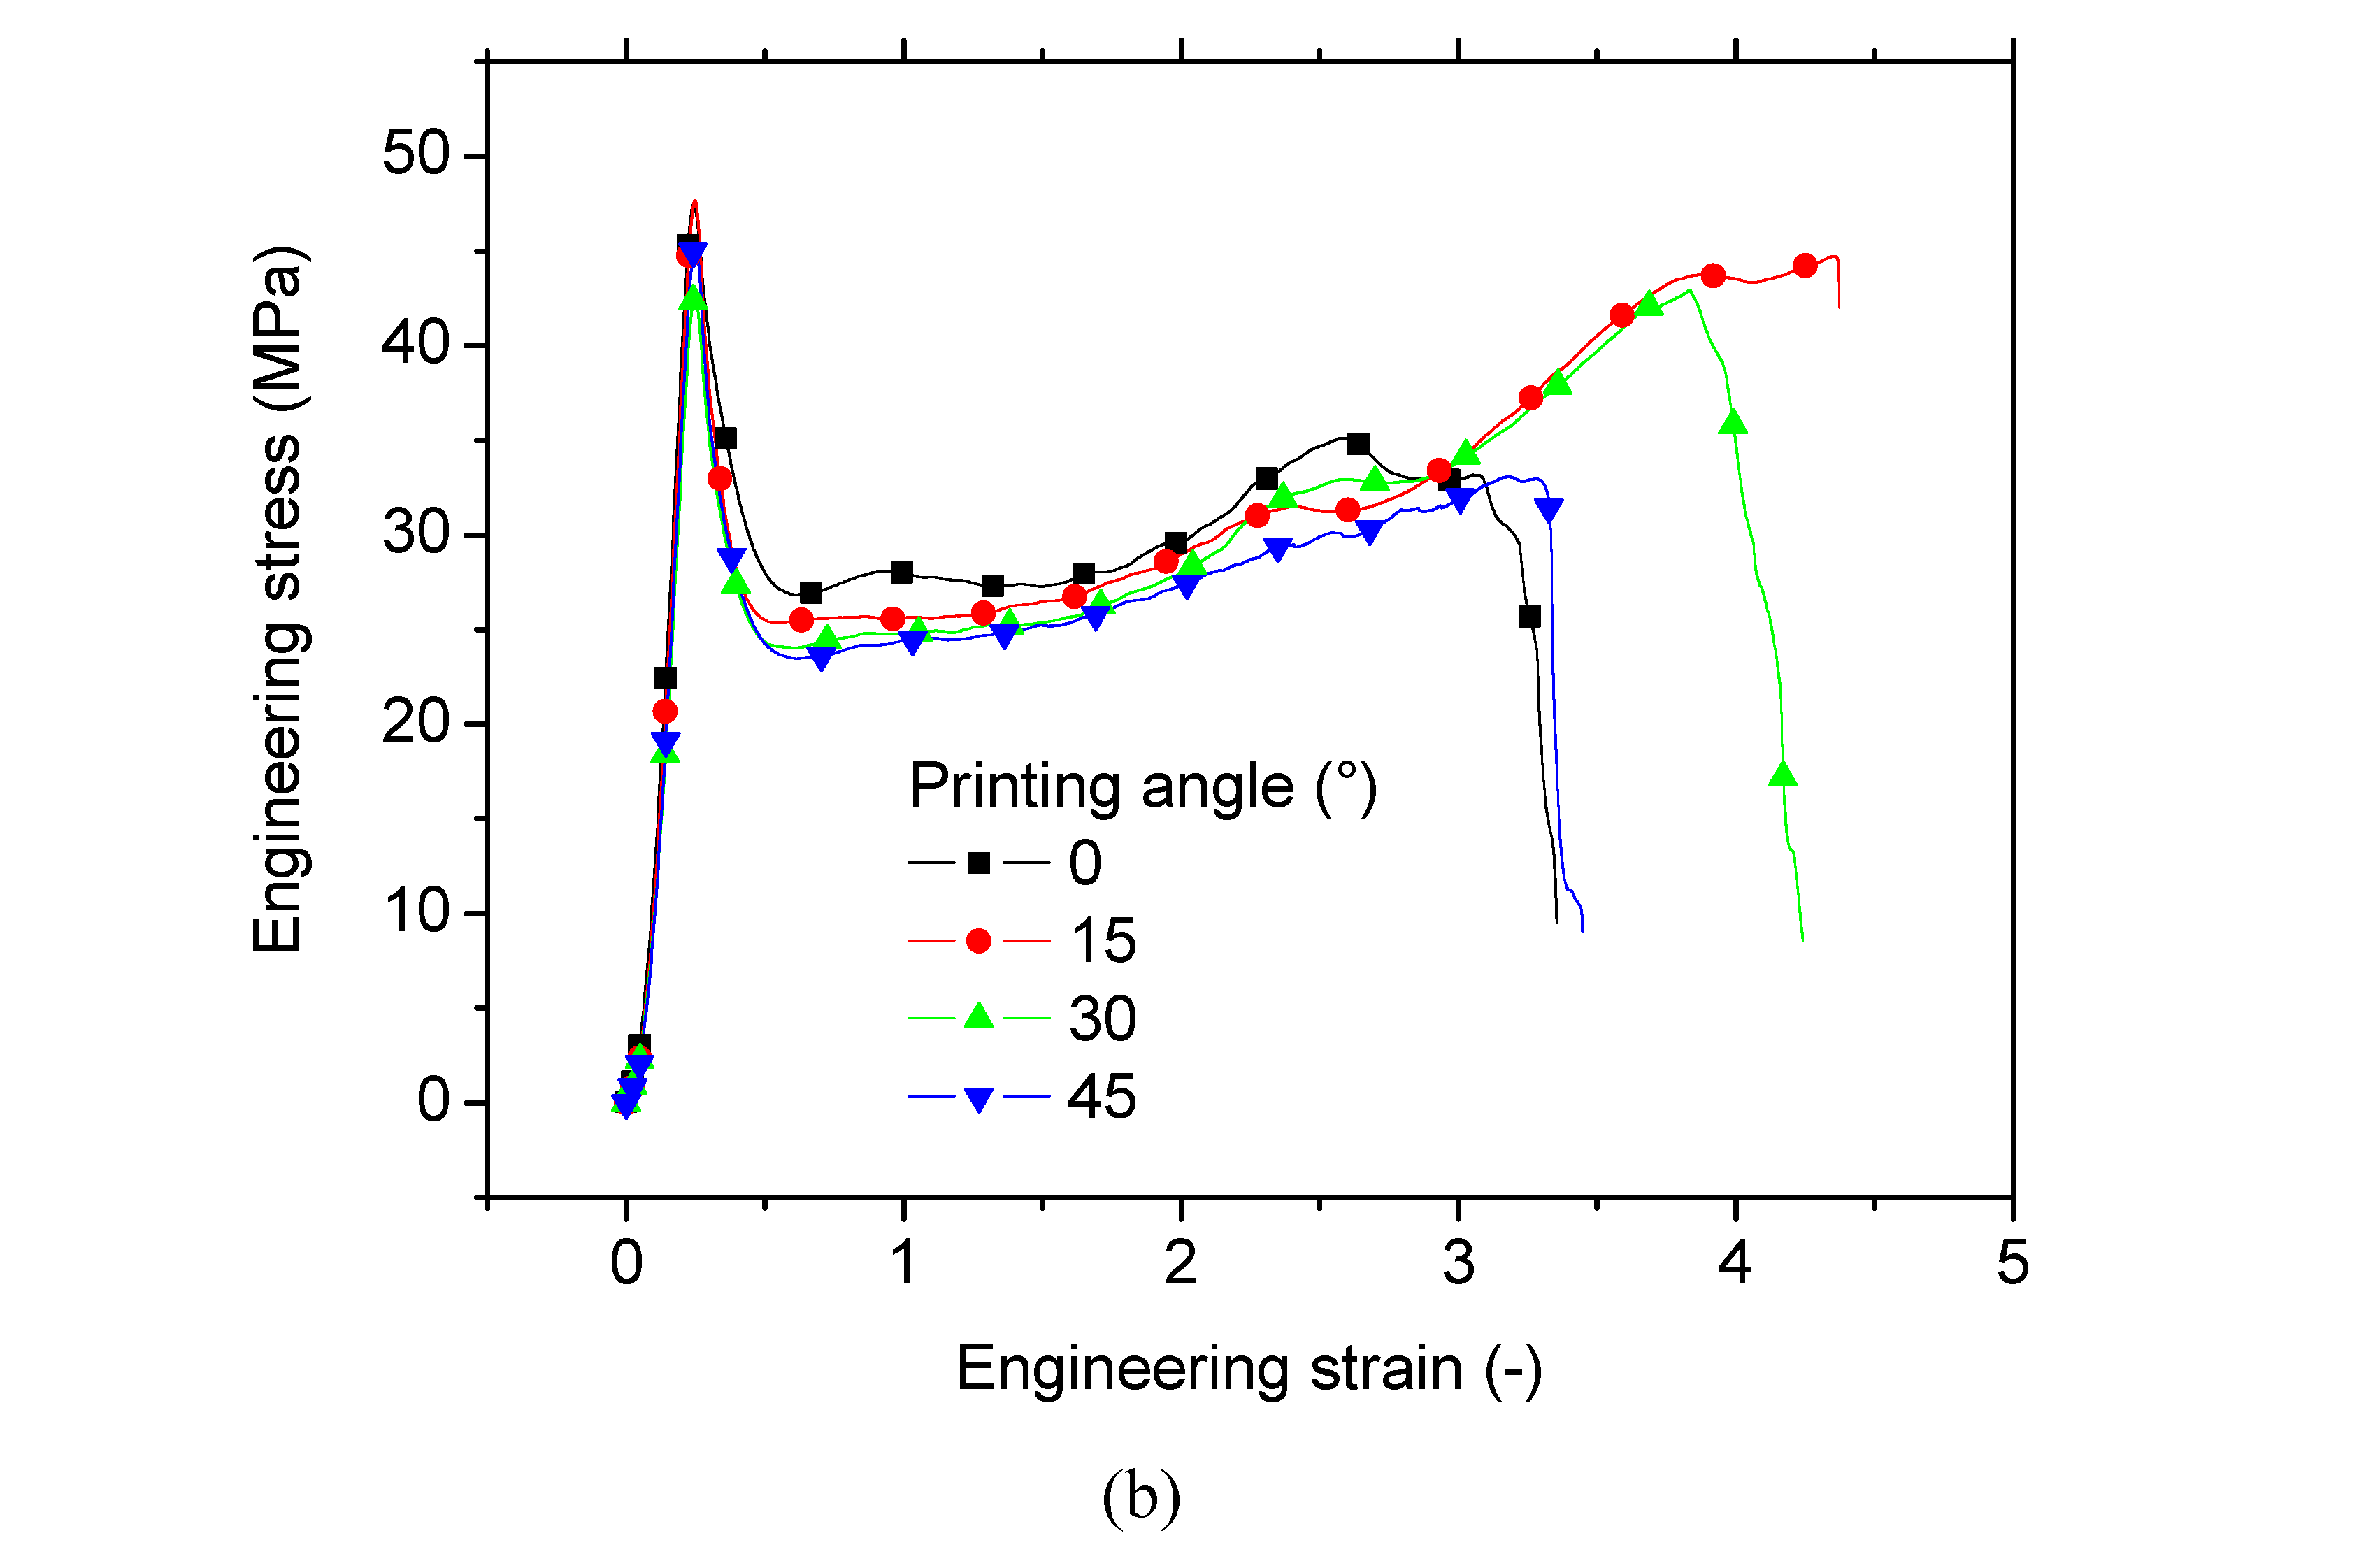
Figure 7b depicts the tensile response for all studied printing angles. Even if the shape of the tensile response is the same for all conditions, printing angles 15° and 30° exhibit slightly the largest elongation at breaks due to the mechanism of filament alignment upon loading. This realignment is also responsible for improving the symmetry of the material, allowing the steady increase of the stress after the first stress peak. Regarding the quantified effect of printing angle on the tensile performance (
Table 3), there is no general trend besides the improvement of the stiffness when the specimens are printed using a printing angle larger than 0°. Although this improvement represents 7%, the standard deviation obtained for Young’s moduli data reflects a minor effect. Also, there is a slight increase of the tensile strength and yield stress of about 4%, and increase of elongation at break by 36%.
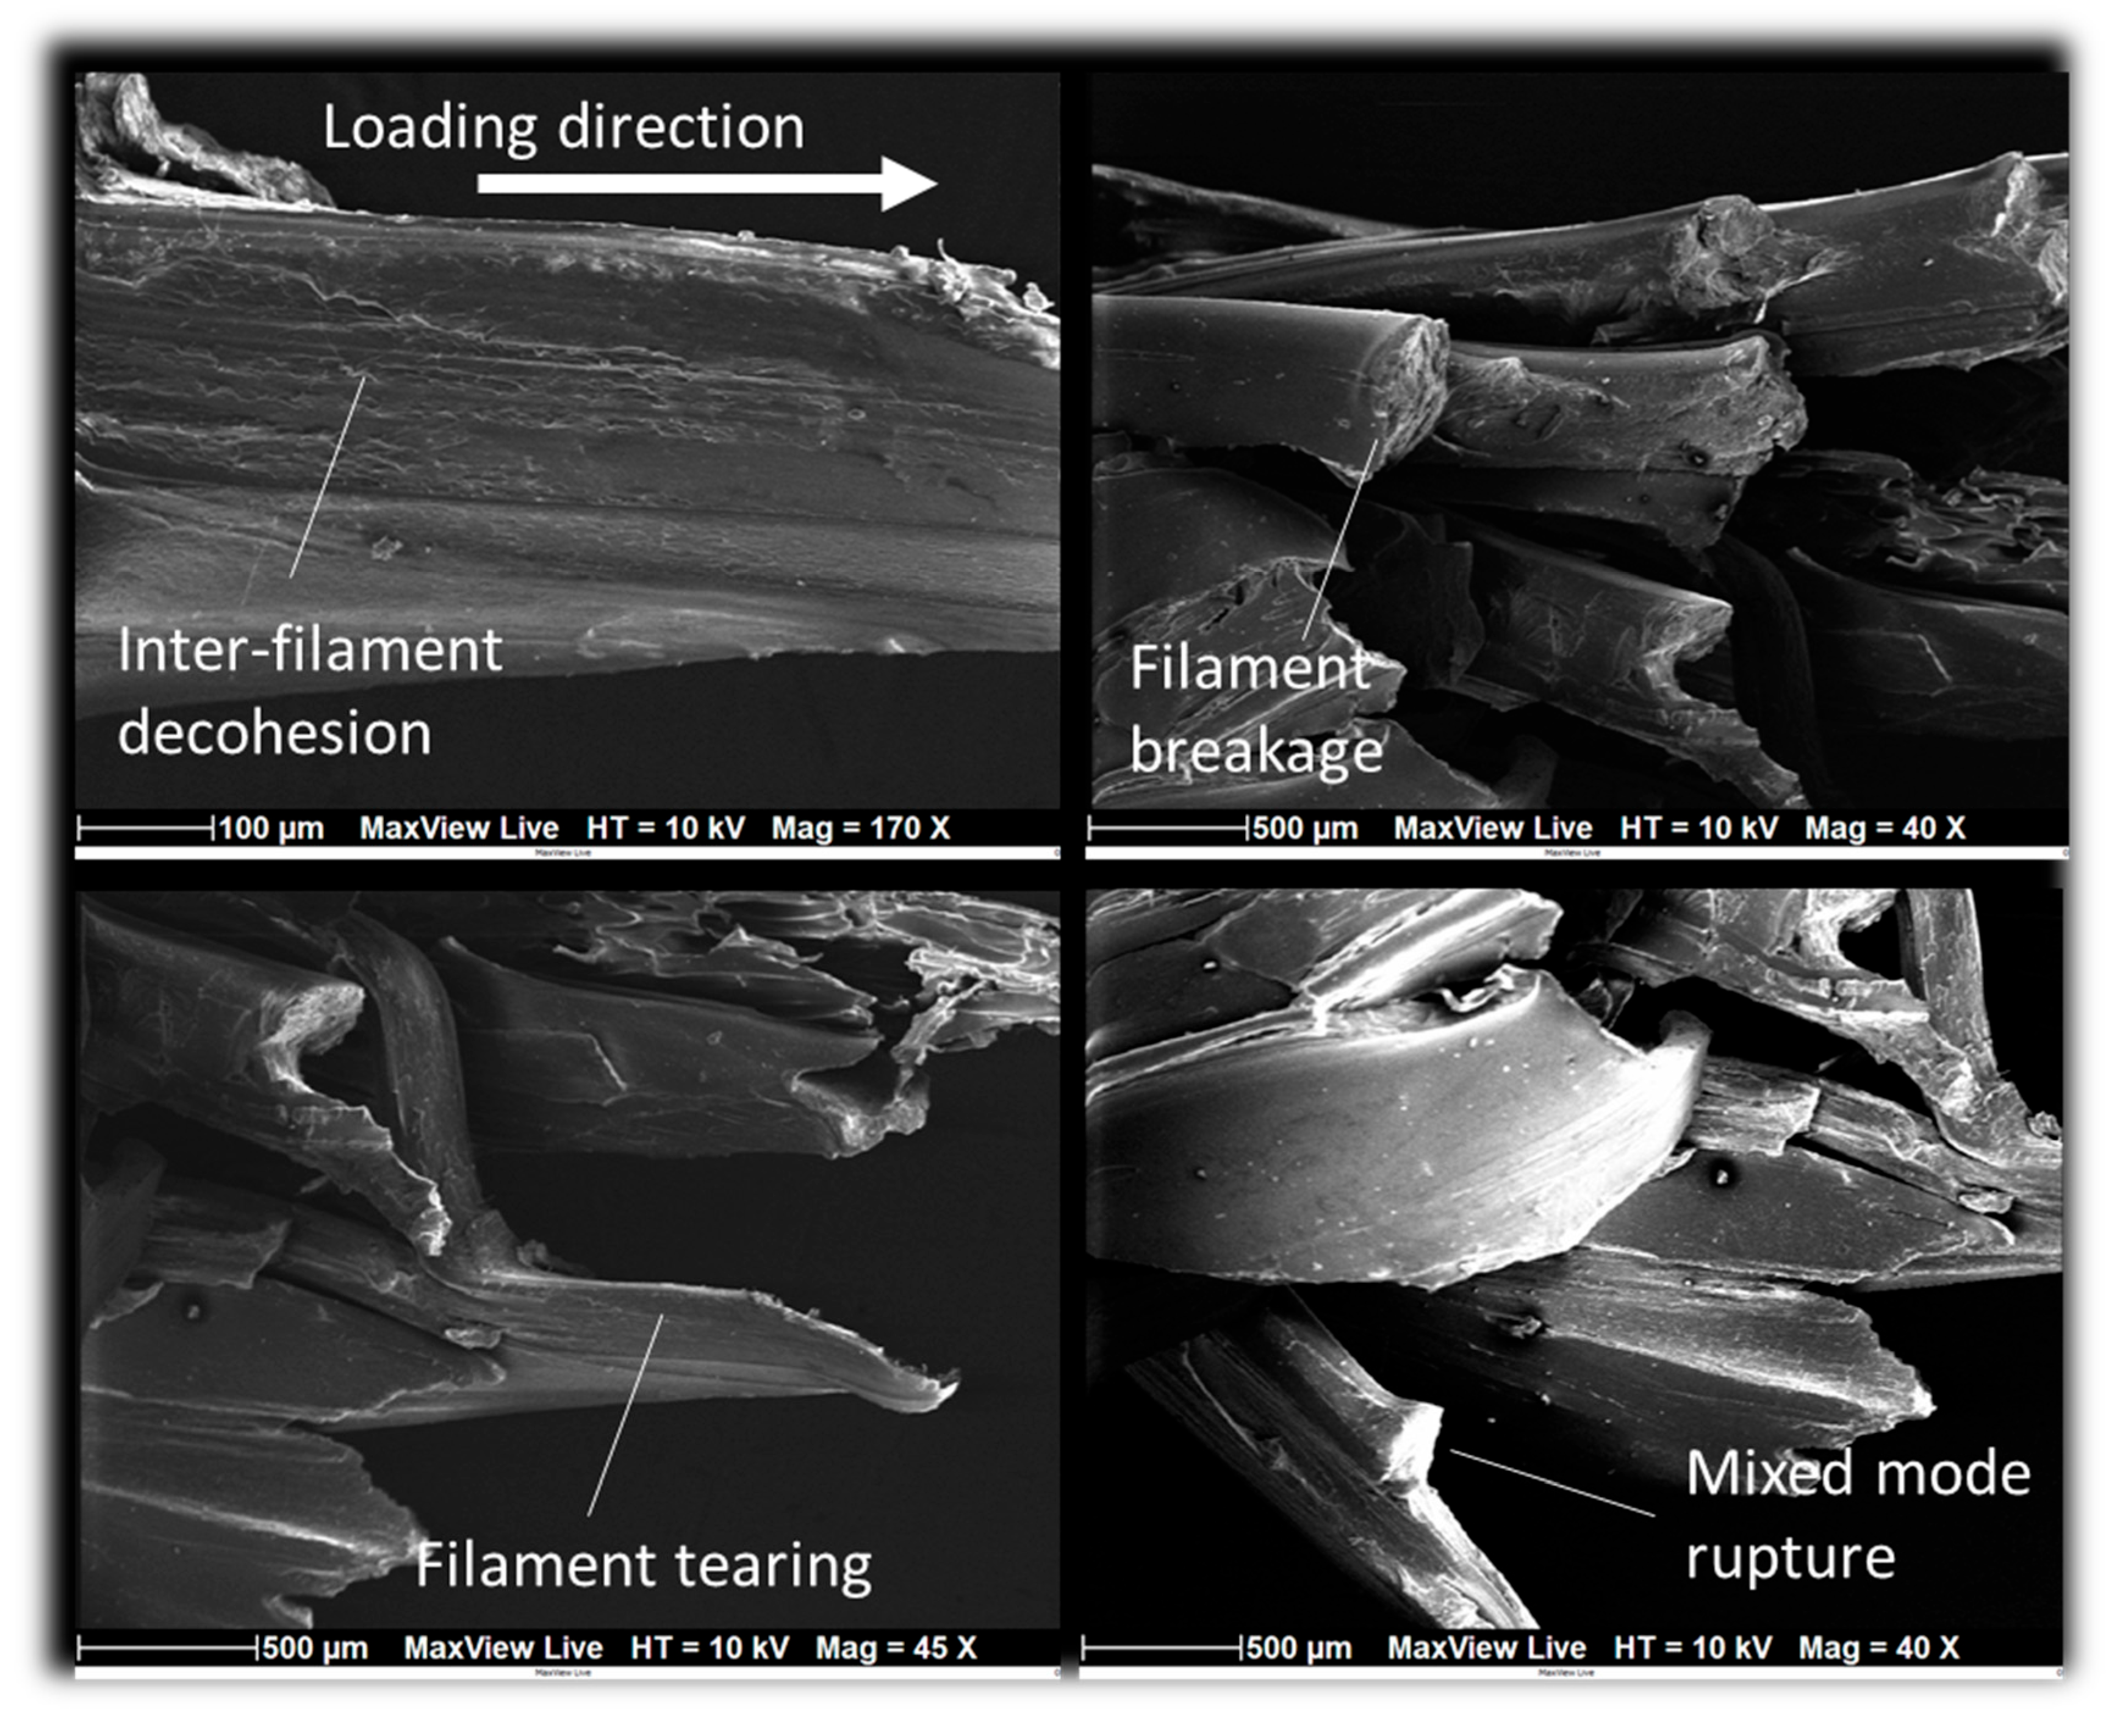
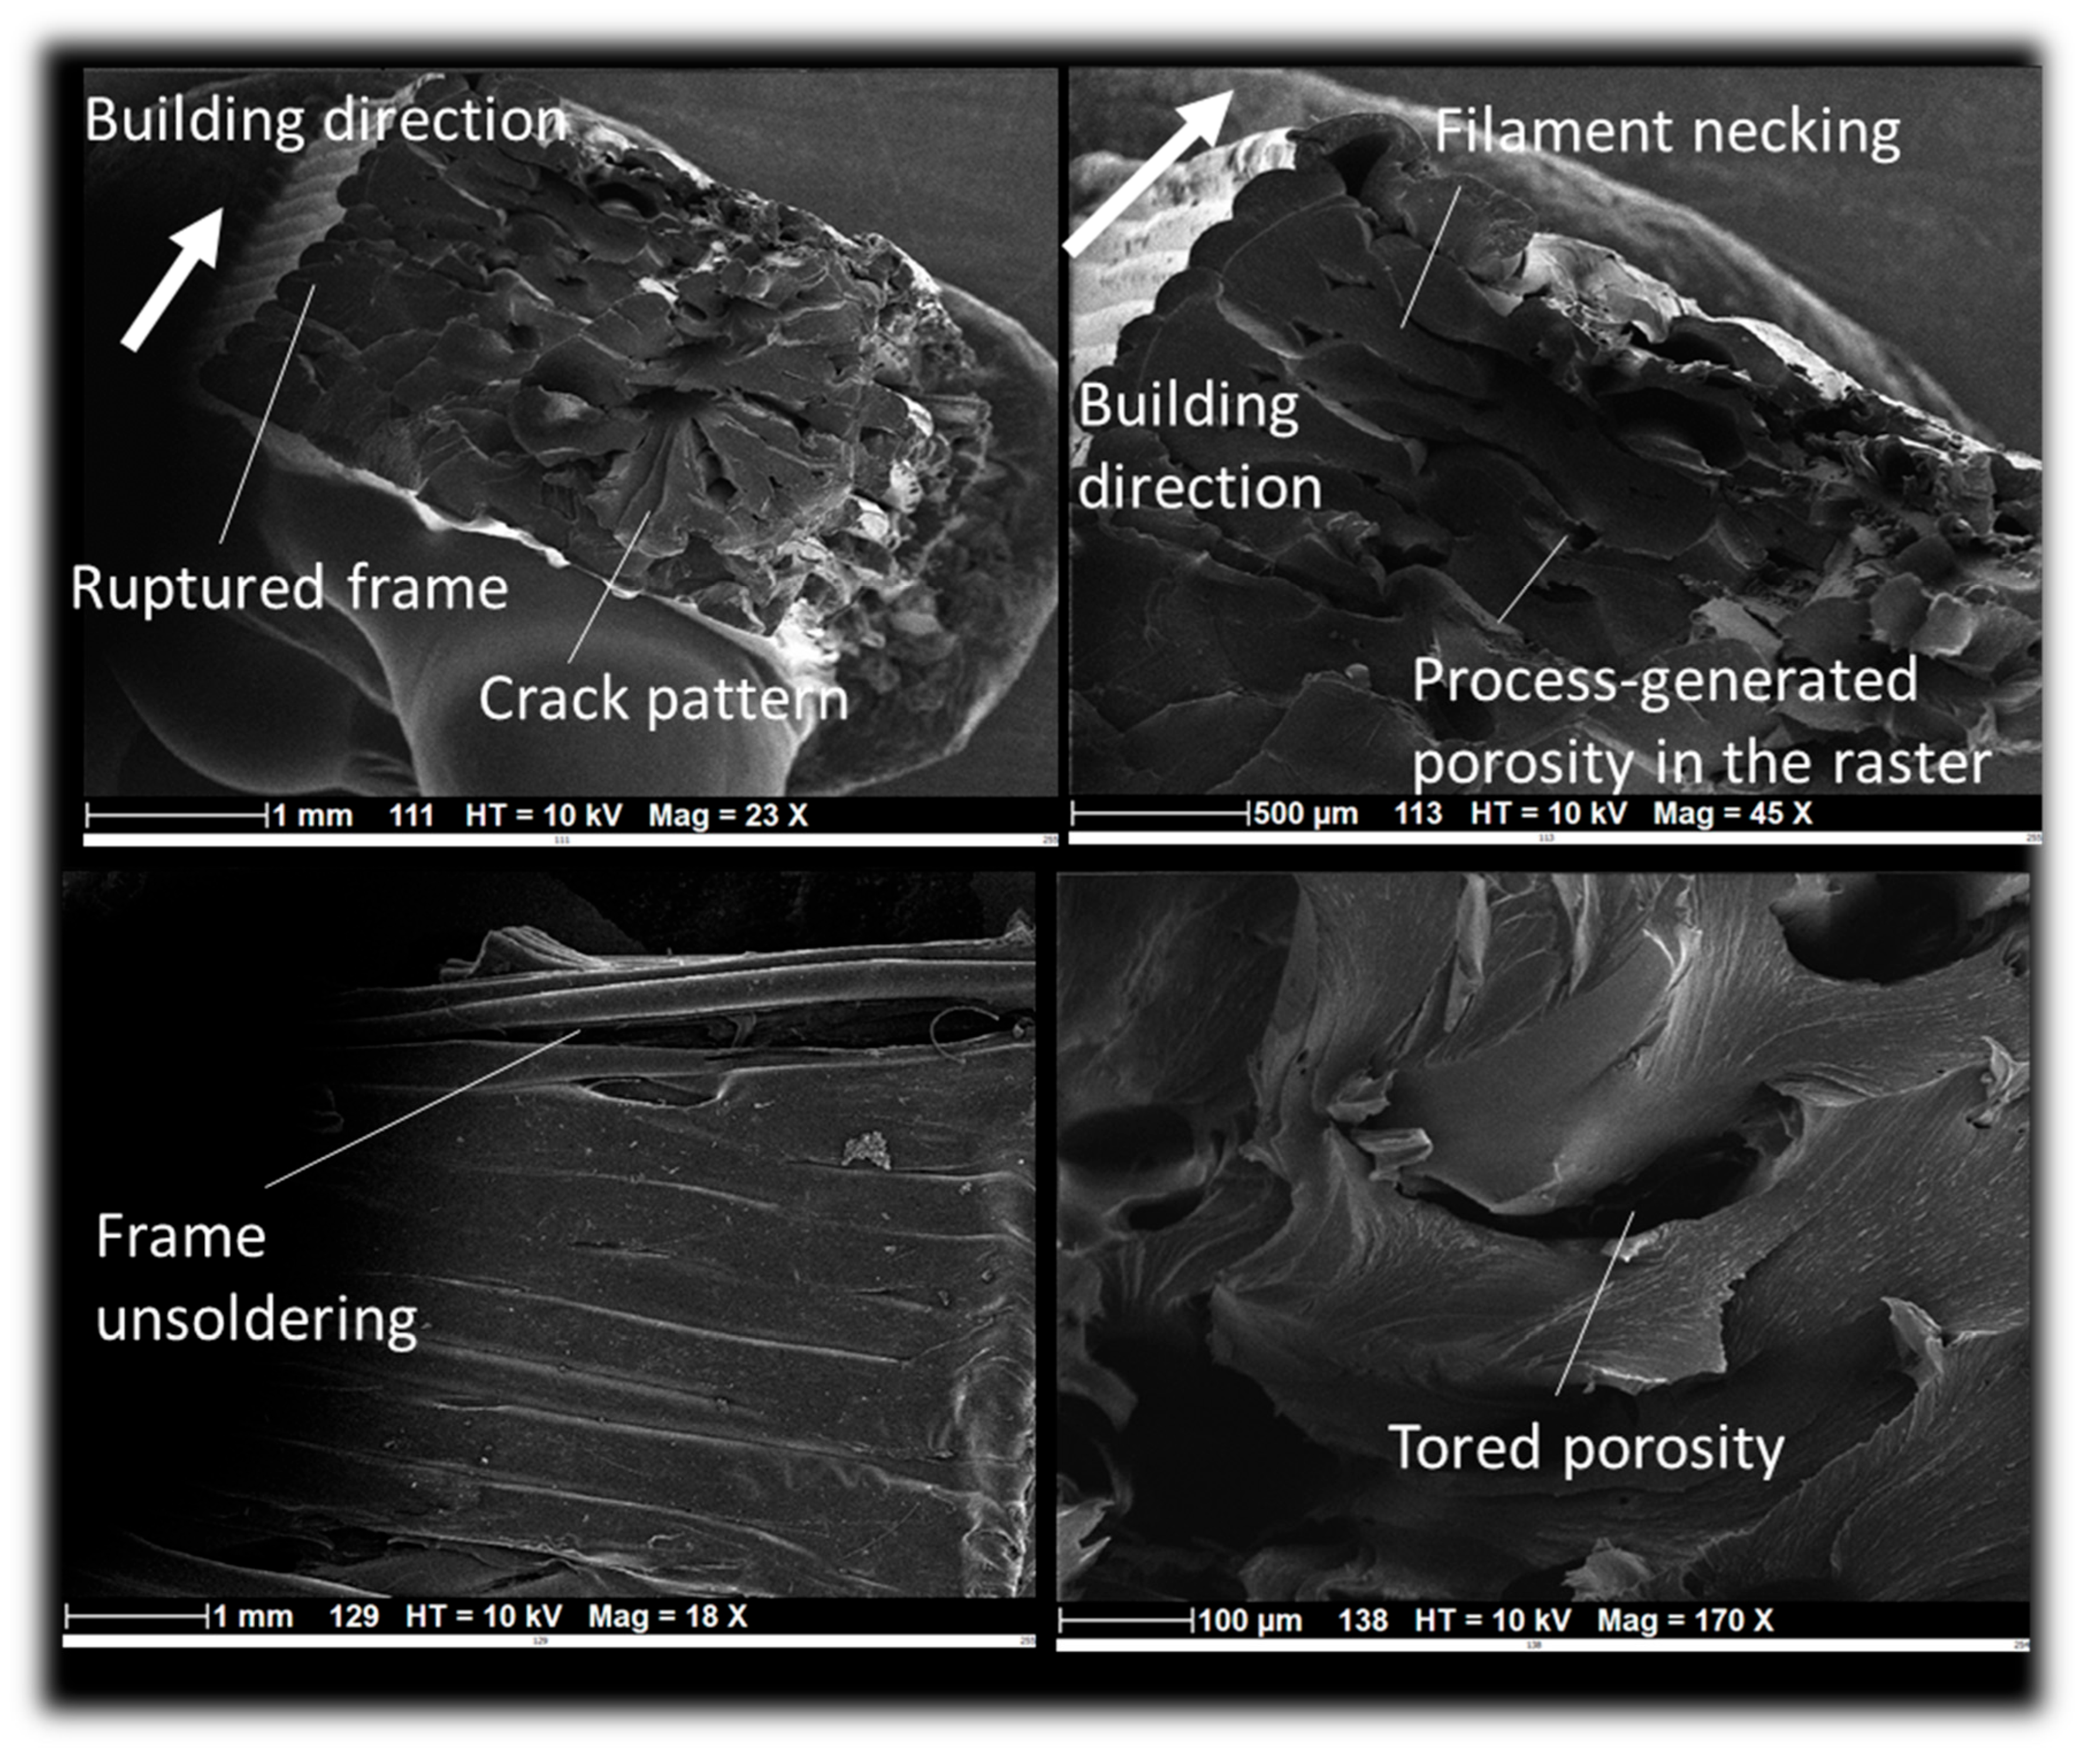
In order to provide further insight on the deformation mechanisms of 3D printed PLDA, SEM analysis is conducted as shown in
Figure 8. Among the identified modes of rupture, inter-filament decohesion is a common mode (micrograph on top left). It results from the lack of load transfer across the adjacent filaments. The large stretching of filaments result is significant tearing of some filaments and sudden breakage of others (micrographs on top right and bottom left). Depending on the loading and filament arrangements, mixed more rupture is observed for which transverse cracking of filament is combined with a large uniaxial extension (micrograph on bottom right).
Regarding the loss of mechanical response when PLDA is processed using 3D printing route,
Table 3 shows that the stiffness and elongation at break are in average increased by 26%, and 109%. This increase is even larger if the vertical orientation is excluded from the pool (31%, 134%). The tensile strength is fully restored in average with only -1.5% lower value compared to the as-received wire material. It is even larger with up to 5% of increase when only the lateral and horizontal orientations are considered.
4.3. Microstructural interpretation of tensile behaviour
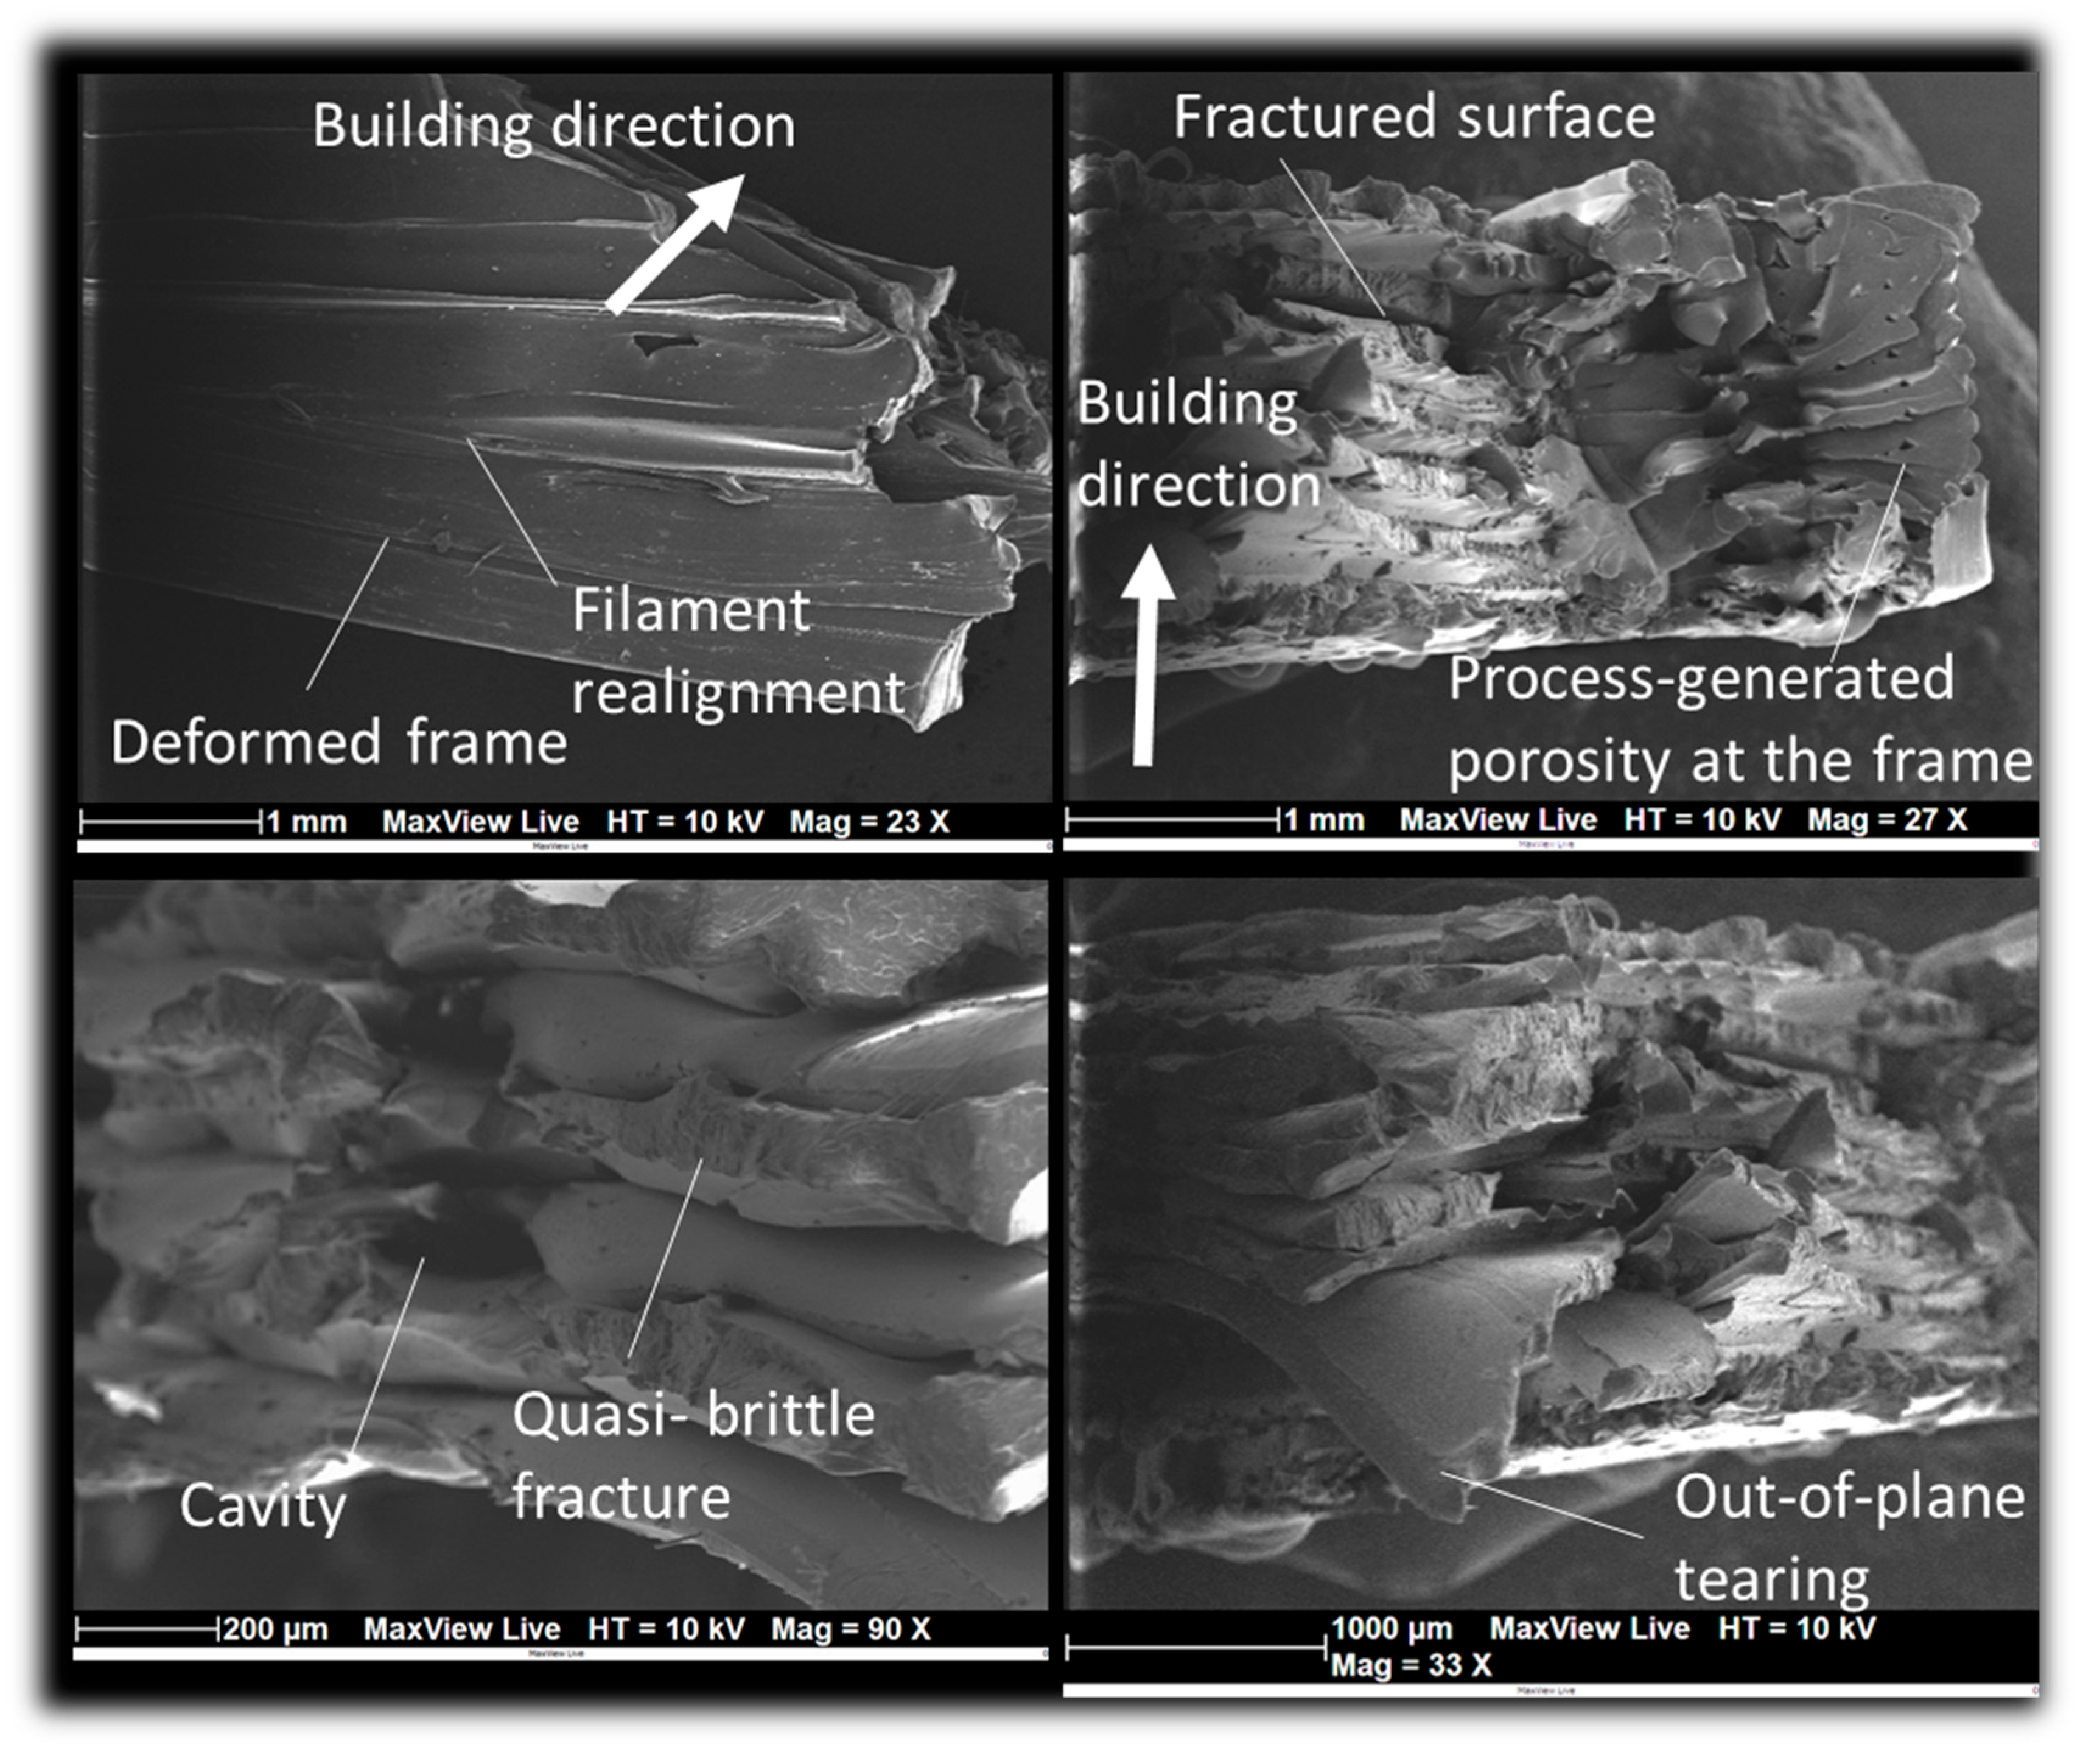
Figure 9 shows transverse and top views of the fractured surfaces. Filament realignment in the same direction of the external frame is highlighted by the micrograph on top left. On the same micrograph the large deformation of the filaments is responsible for the decohesion within the external frame, which is formed by two adjacent filaments. A transverse view on the fractured surface (micrograph on top right) reveals the extent of the cracking along the longitudinal direction, which indicate the predominance of a mixed crack propagation mode combining shear and crack opening. According to the same transverse view, the micrograph on the bottom left shows that adjacent filament decohesion leaves a quasi-brittle fractured surface. Due to the way the filament is arranged throughout the thickness, these fragile surfaces become visible every alternate pair of layers. Additionally, the significant tearing leads to a deformation that occurs out of the plane, thereby contributing to the further propagation of cracks in the longitudinal direction, as illustrated in the micrograph in the bottom right corner.
Figure 10 illustrates some of the localisation phenomena observed upon rupture, which are related to the combination of large stretching and filament arrangement. These localisation phenomena reflect the break in material arrangement symmetry upon loading. On the top left rose-like pattern is highlighted where the filament tearing appears to cover all possible in-plane angles. On the same micrograph a strong contrast between frame rupture is also illustrated, where on the arrowed side, quasi-brittle rupture under tension opposes a more jagged cracking of the frame on the other side. Filament cross-section necking is also a common observation (see micrograph on top right) in the plane perpendicular to the loading direction. Another feature is the longitudinal cracking responsible for the external frame unsoldering and the tored porosity (micrographs on the bottom).
4.4. Example of application of PLDA in bioengineering
In order to illustrate the use of PLDA in engineering applications, neck orthosis is considered as an application example. This structure commonly referred to as a neck brace or cervical collar, is a medical device designed to provide support and stability to the neck and cervical spine. It is often used in the treatment of various neck injuries, such as whiplash, cervical fractures, or post-surgery recovery.
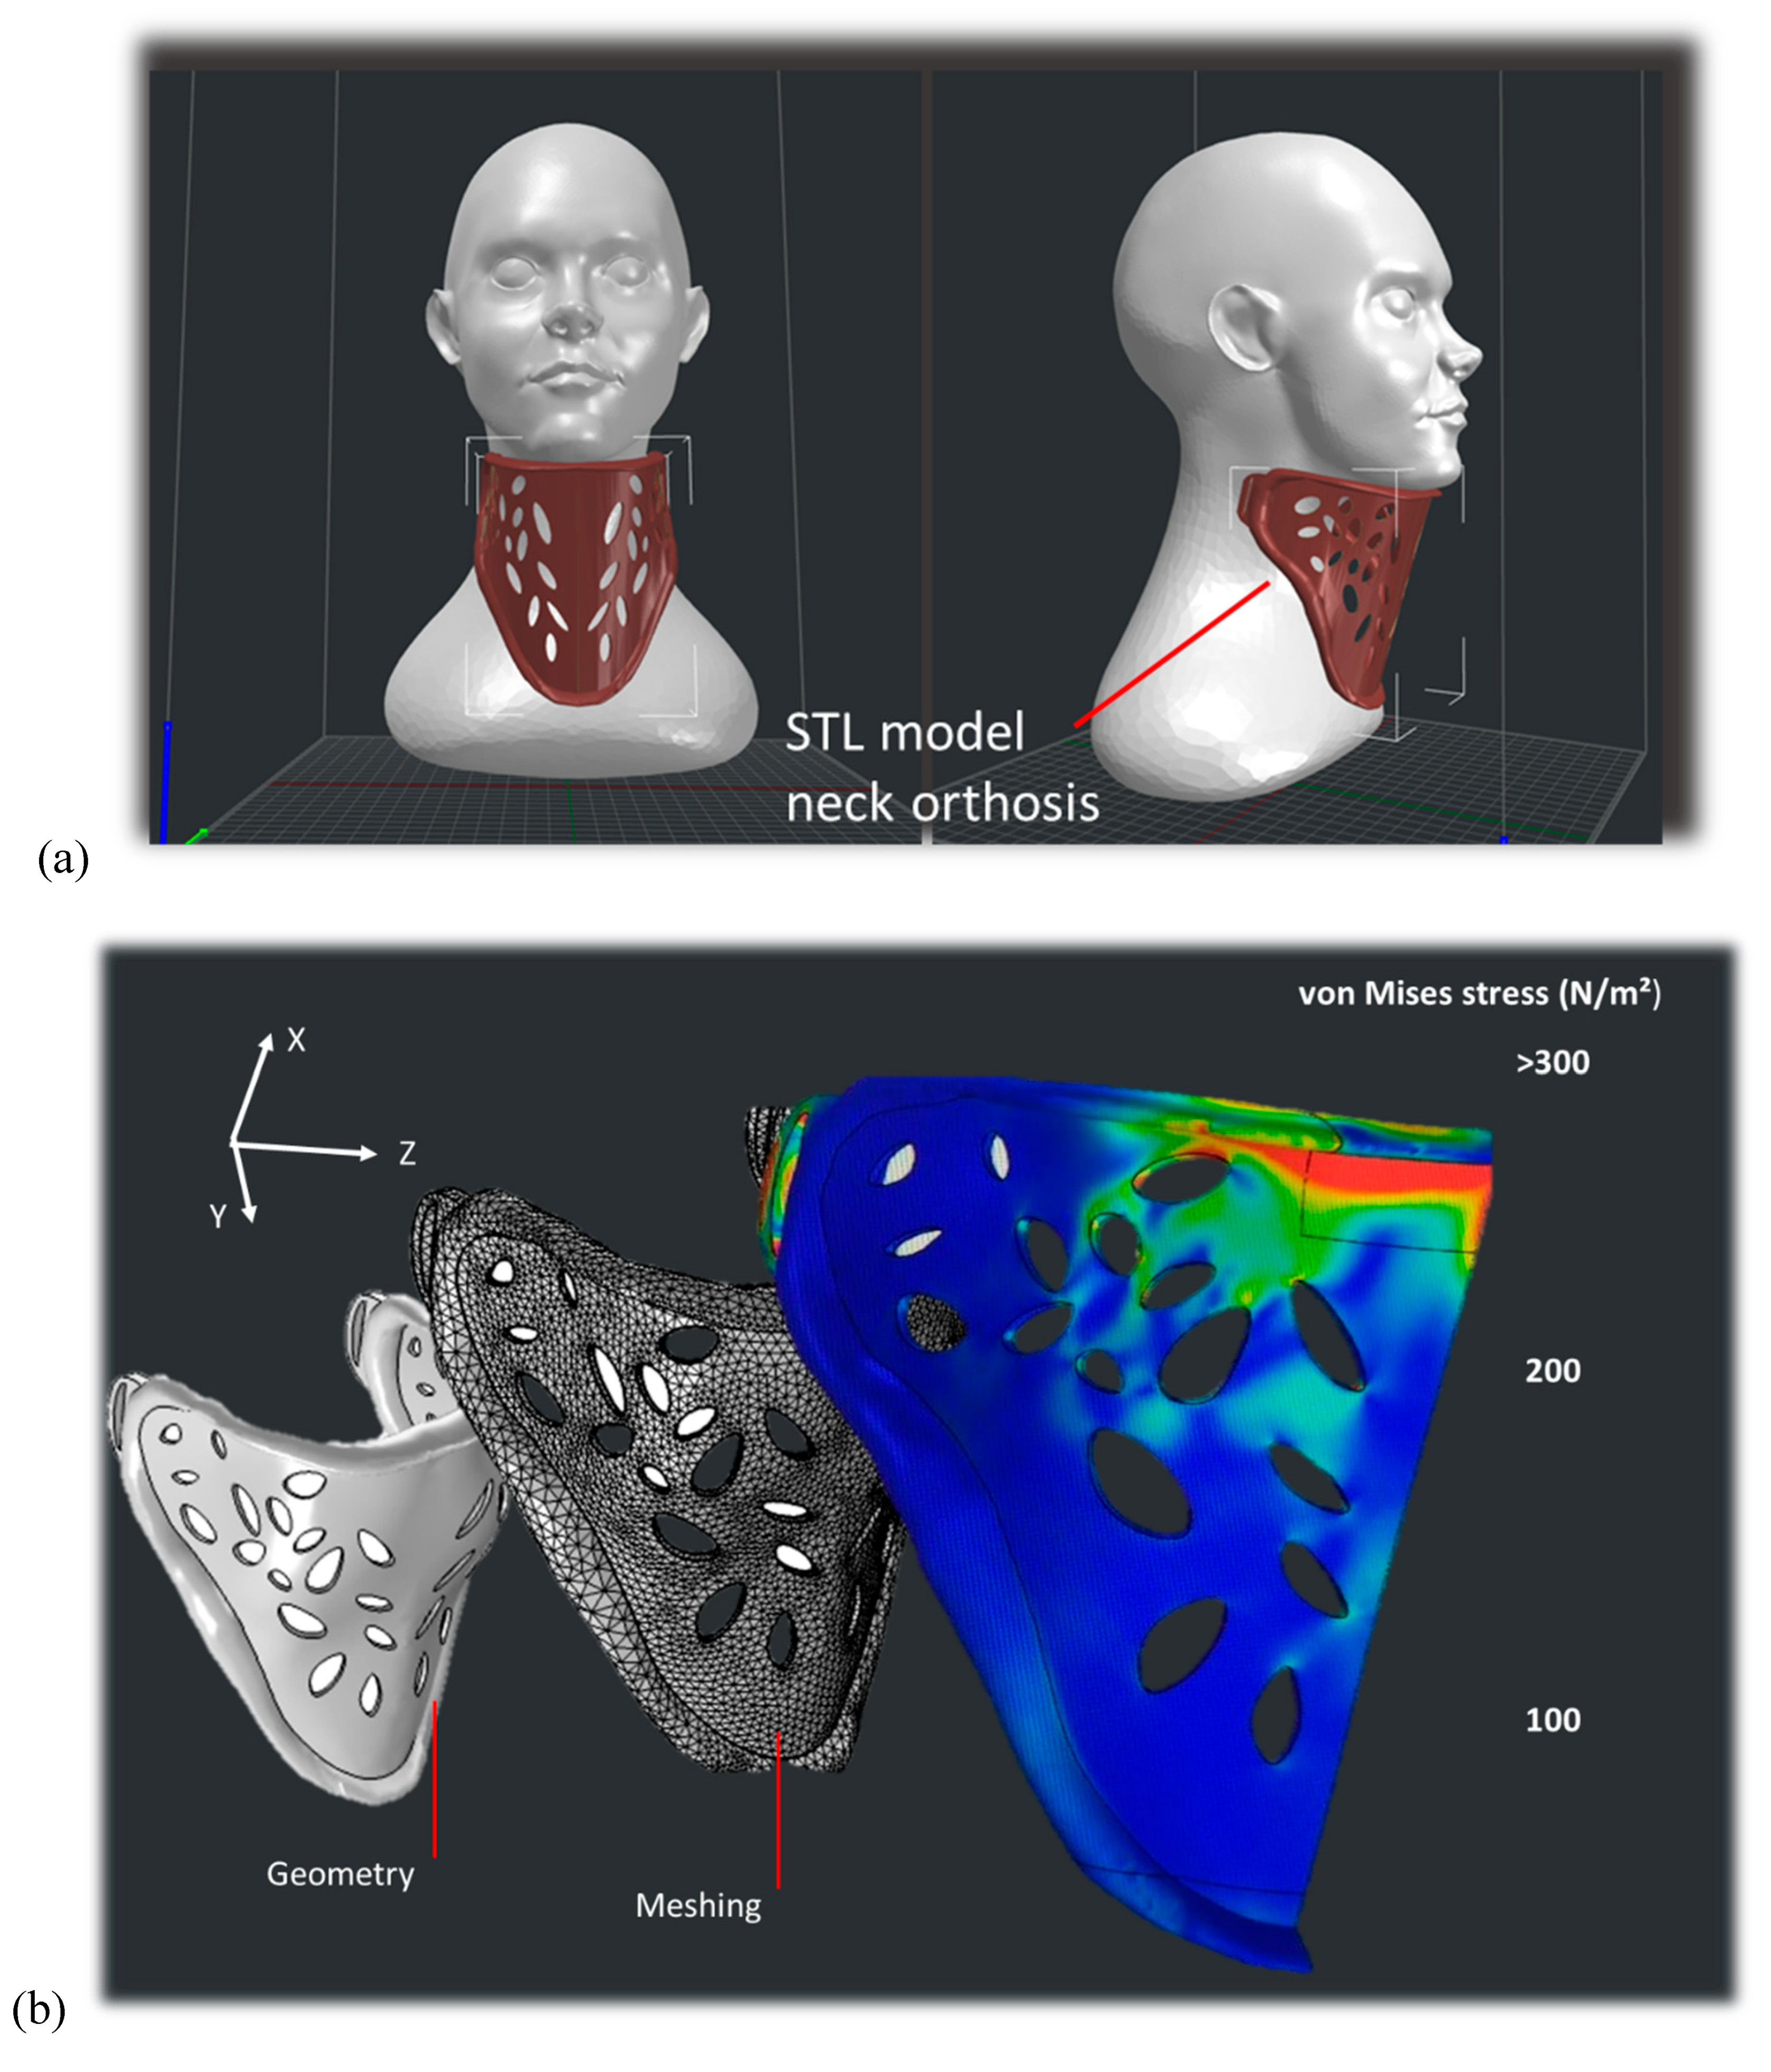
Figure 11a shows one particular style of neck orthosis called rigid brace used for more severe injuries. One of the main functions of this device is to help immobilize the neck, reducing movement and minimizing strain on injured or healing neck structures. The design is built by considering an airy structure to achieve a good compromise between material consumption and performance. Based on structural analysis, finite element computation provides the strain field that according to realistic loading (
Figure 11b). This analysis shows the development of symmetrical stress field with two main regions of stress concentration close to the chin and chest support regions. This result reflects the stress field related to a transverse isotropic model with longitudinal modulus (EL=291 MPa) is aligned with z-direction is 1.18 times lower than the two moduli in X and Y directions (ET=343 MPa).
The design space corresponds to 142 × 162 × 117 mm
3, and the optimised neck orthosis volume is 120 cm
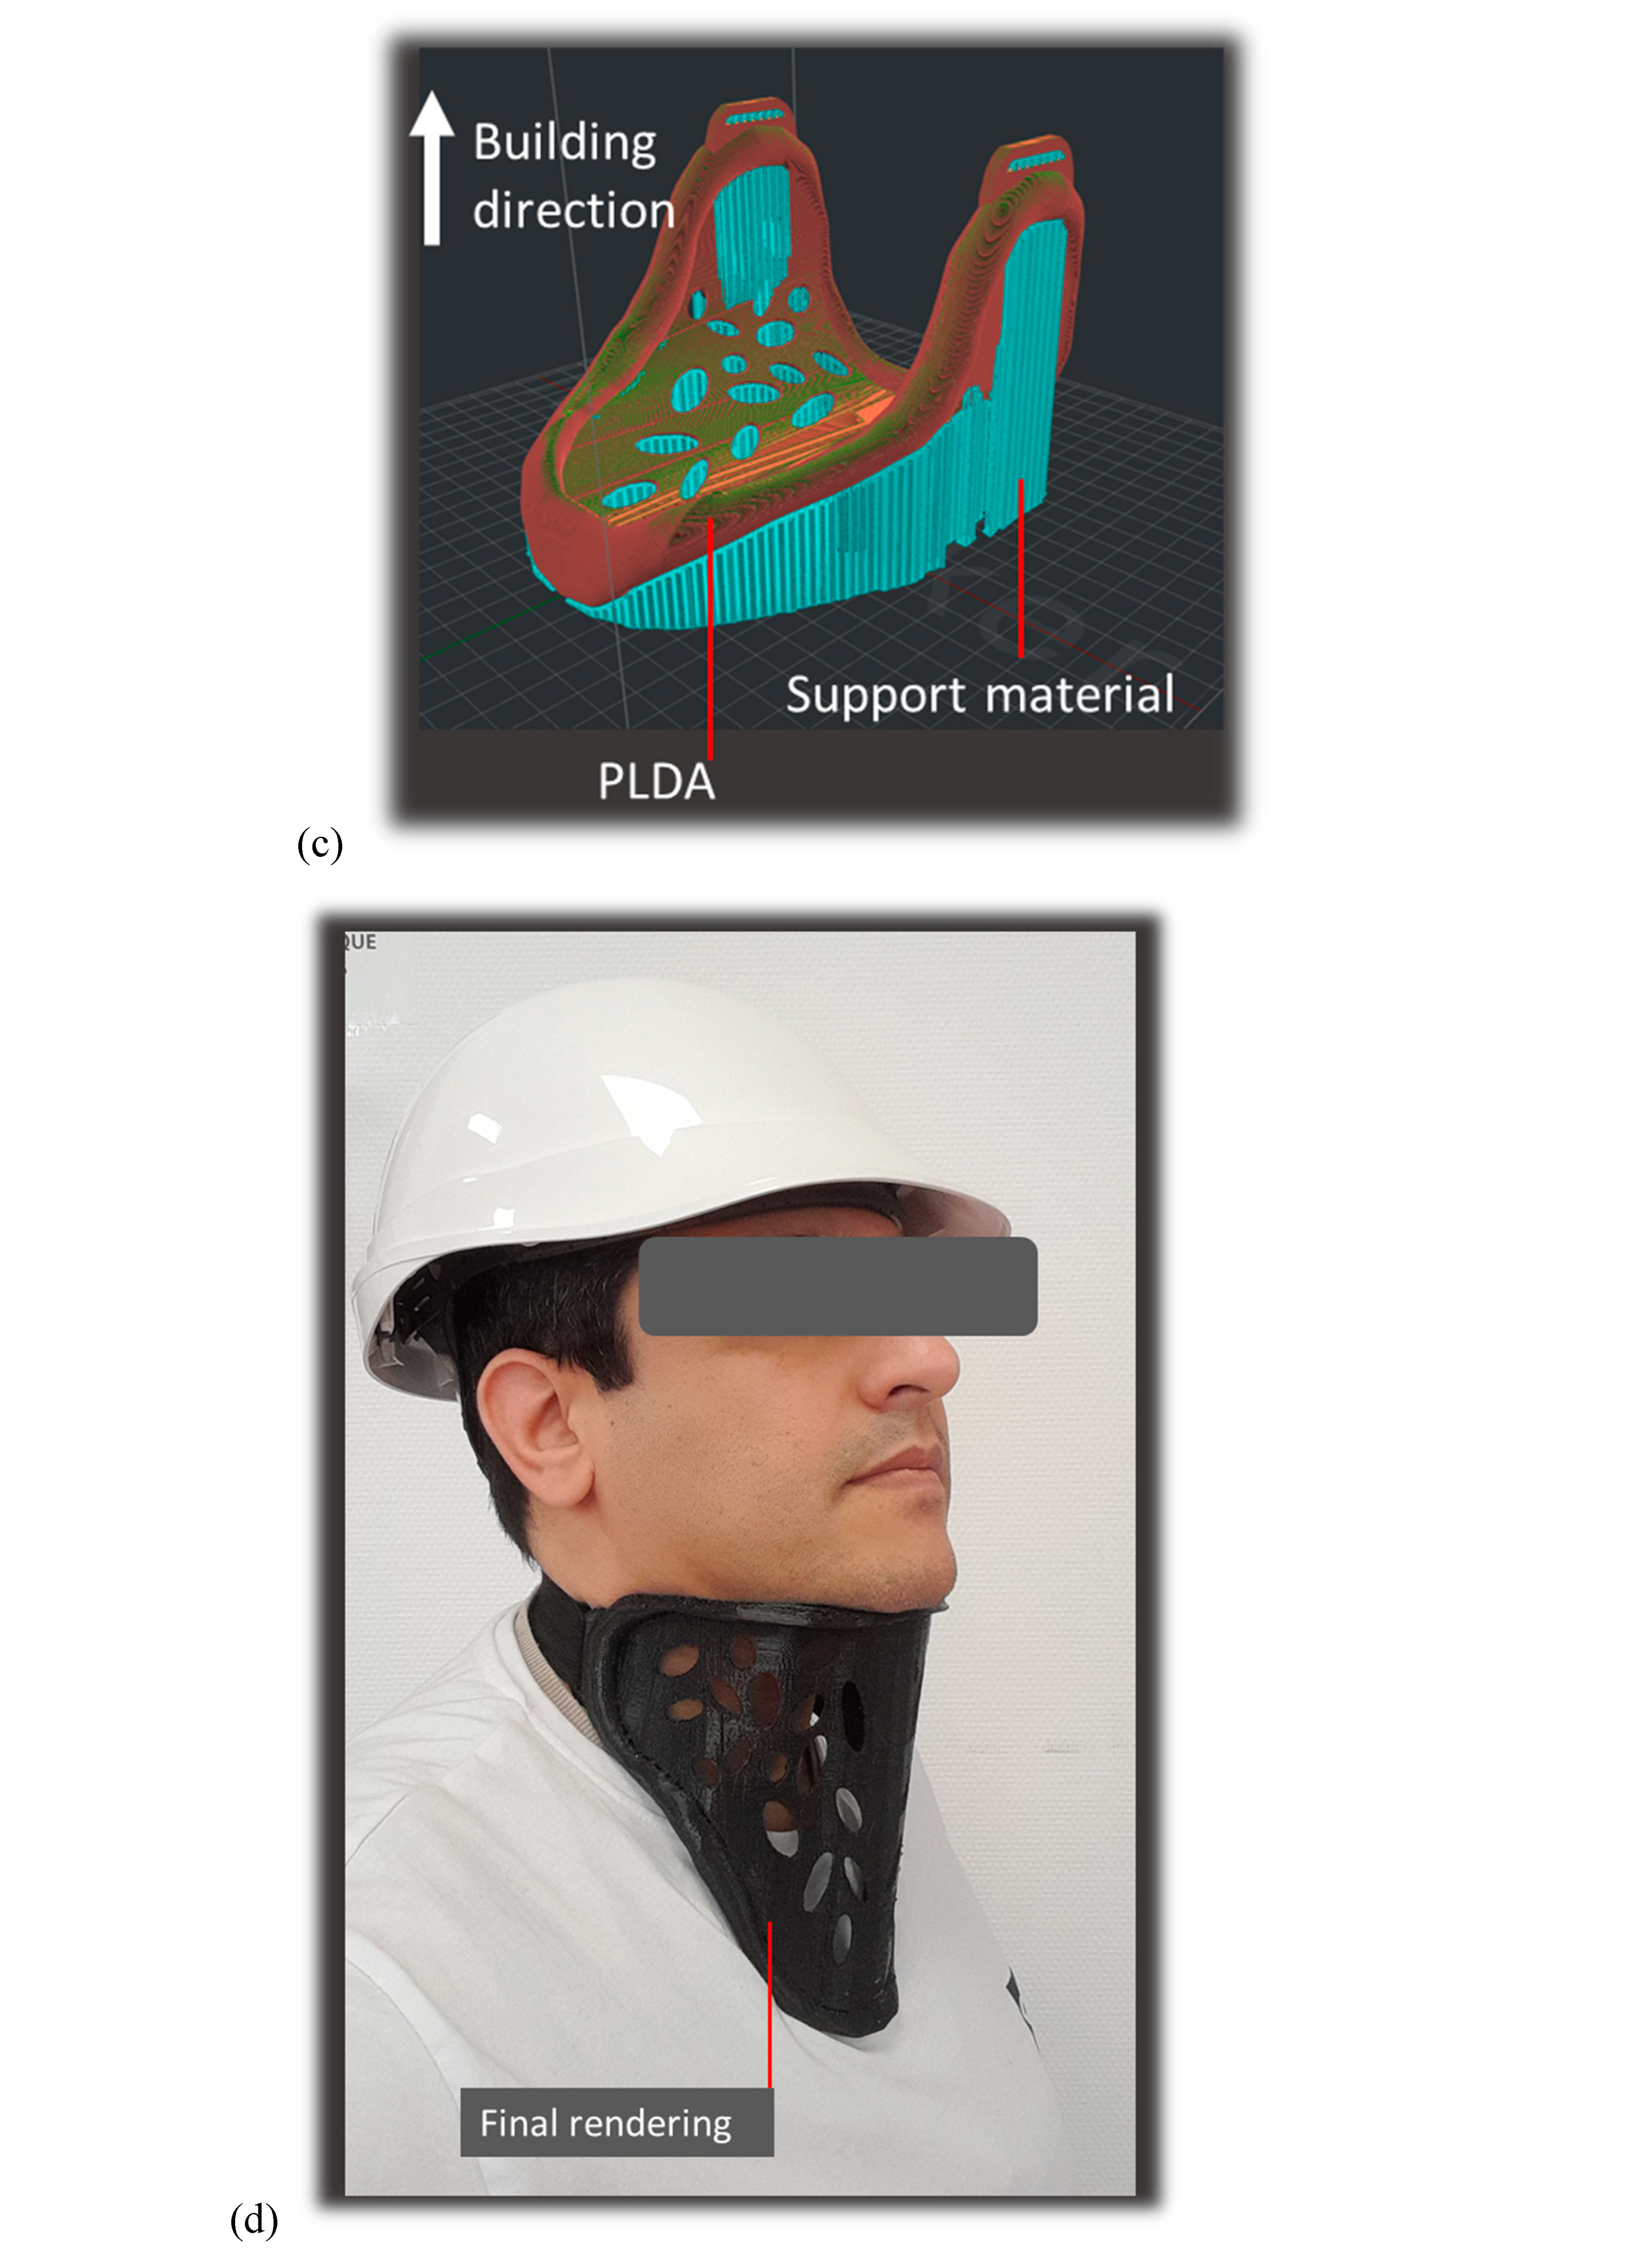
3, for which 163 g of PLDA is required for the printing stage. The part orientation is selected to guarantee the continuity of the filaments along the areas subject to significant tension and minimises the printing duration. The slicing step creates overhangs in the model, and the complexity of the neck orthosis design induce some risks of sagging or misshaping without support material. Thus, a support of the same material is added as shown in
Figure 11c, everywhere there is a risk of structure collapse. The amount of support represents 9 % of the total design weight. The same printing conditions shown in
Table 1 are used for printing the design with the exception of the printing temperature, which is fixed to 260°C. Under these conditions, a duration of 13.5 hours is needed to print the design.
Figure 11d shows the final rendering of the neck orthosis based on PLDA material. It can be upgraded by the use of foam or fabric on top of the rigid brace structure to add more soft support for comfort.
5. Conclusions
One of the distinct features of PLDA is the remarkable increase in tensile properties when the material is processed using fused filament route. Both stiffness and elongation at break exhibit higher scores compared to the as-received material, with levels as large as 343 MPa, and 451% for Young’s modulus and elongation at break. Tensile strength is fully restored in average with the largest levels of 54 MPa.
The large strechability of PLDA allows also significant change in material arrangement symmetry, which affects the tensile response. For instance, a strain stiffening is induced by change in the in-plane symmetry, which is materialised by the realignment of the filament in the loading direction. Within the printing temperature window of 250°C - 280°C, there is no much influence observed besides a slight improvement of stiffness by 15% and the reduction of elongation at break by 76% when the printing temperature increases. The part orientation is found to play the major role in tuning the performance of 3D printed PLDA and trigger significant change in symmetry in filament arrangement. Both necking and filament realignment are associated to these symmetry modifications. The vertical orientation where the building direction is aligned with the sample length is found to significantly reduce the stiffness by 76%. Lateral orientation corresponding to filaments aligned in the loading direction allows the highest tensile strength with levels as large as 54 MPa. The printing angles of 15° and 30° are found to improve the elongation at break taking advantage of the structural displacement induced by the filament realignment.
Regarding the deformation mechanisms, combination of uniaxial tension and shearing is found to trigger different damage scenarios such as quasi-brittle, and mixed mode rupture, where transverse and longitudinal cracking predominate.
The remarkable performance of PLDA material allows it to be used in varieties of applications such as in biomedical field such as ankle foot, knee, wrist, elbow orthosis. Successful design of a neck orthosis proves the effectiveness and the comfort of 3D printed PLDA allowing a proper fitting and adjustment.
References
- Wu Y, Fang J, Wu C, Li C, Sun G, and Li Q. International Journal of Mechanical Sciences 2023;246. [CrossRef]
- Yadav A, Rohru P, Babbar A, Kumar R, Ranjan N, Chohan JS, Kumar R, and Gupta M. International Journal on Interactive Design and Manufacturing (IJIDeM) 2022. [CrossRef]
- Ahn SH, Montero M, Odell D, Roundy S, and Wright PK. Rapid Prototyping Journal 2002;8(4):248-257. [CrossRef]
- Jadhav A and Jadhav VS. Materials Today: Proceedings 2022;62:2094-2099. [CrossRef]
- Shubham P, Sikidar A, and Chand T. Key Engineering Materials 2016;706:63-67. [CrossRef]
- Bakır AA, Atik R, and Özerinç S. Rapid Prototyping Journal 2021;27(3):537-561. [CrossRef]
- Lee C-Y and Liu C-Y. Additive Manufacturing 2019;25:196-203.
- Khatoon S and Ahmad G. Rapid Prototyping Journal 2023.
- Jin Y-a, Plott J, Chen R, Wensman J, and Shih A. Procedia CIRP 2015;36:199-204. [CrossRef]
- Carrico JD, Traeden NW, Aureli M, and Leang KK. Smart Materials and Structures 2015;24(12). [CrossRef]
- Feng J, Fu J, Lin Z, Shang C, and Li B. Visual Computing for Industry, Biomedicine, and Art 2018;1(1):1-16.
- Abouzaid K, Guessasma S, Belhabib S, Bassir D, and Chouaf A. European Polymer Journal 2018;108:262-273.
- Lin X, Gao J, Wang J, Wang R, Gong M, Zhang L, Lu Y, Wang D, and Zhang L. Additive Manufacturing 2021;47.
- Guessasma S, Belhabib S, and Nouri H. Macromolecular Materials and Engineering 2019;304(7).
- Ramezani Dana H and El Mansori M. Plastics, Rubber and Composites 2022;51(8):393-406.
- DoĞRu A, SÖZen A, SeydİBeyoĞLu MÖ, and NeŞEr G. Hacettepe Journal of Biology and Chemistry 2022;50(3):239-246.
- Kananathan J, Samykano M, Kadirgama K, Ramasamy D, and Rahman MM. European Journal of Wood and Wood Products 2021;80(1):75-100.
- Chaunier L, Guessasma S, Belhabib S, Della Valle G, Lourdin D, and Leroy E. Additive Manufacturing 2018;21:220-233. [CrossRef]
- Guessasma S, Belhabib S, and Altin A. Polymers 2020;12(5). [CrossRef]
- Ahn S-H, Montero M, Odell D, Roundy S, and Wright PK. Rapid prototyping journal 2002;8(4):248-257. [CrossRef]
- Hedjazi L, Belhabib S, D’Orlando A, and Guessasma S. Symmetry 2022;15(1).
- Fayazbakhsh K, Movahedi M, and Kalman J. Materials Today Communications 2019;18:140-148. [CrossRef]
- Zhang X, Fan W, and Liu T. Composites Communications 2020;21.
- Arigbabowo OK, Omer L, and Tate J. Materials Science and Engineering: B 2023;287.
- Belei C, Joeressen J, and Amancio-Filho ST. Polymers 2022;14(7).
Figure 1.
Ongoing 3D printing process of PLDA and three main orientations considered in this study : (a) Vertical - VER, (b) Horizontal – HOR and Lateral - LAT.
Figure 1.
Ongoing 3D printing process of PLDA and three main orientations considered in this study : (a) Vertical - VER, (b) Horizontal – HOR and Lateral - LAT.
Figure 2.
(a) Sample testing configuration of PLDA printed material, (b) overview of the stretching amounts for both as-received and printed PLDA material.
Figure 2.
(a) Sample testing configuration of PLDA printed material, (b) overview of the stretching amounts for both as-received and printed PLDA material.
Figure 3.
FTIR-ATR spectra of studied filament and typical polyamide taken as a reference: filament (red) and polyamide 6 (blue).
Figure 3.
FTIR-ATR spectra of studied filament and typical polyamide taken as a reference: filament (red) and polyamide 6 (blue).
Figure 4.
Tensile performance of as -received PLDA material, (a) Stretched PLDA at different loading levels, (b) engineering tensile response.
Figure 4.
Tensile performance of as -received PLDA material, (a) Stretched PLDA at different loading levels, (b) engineering tensile response.
Figure 5.
Tensile performance of 3D printed PLDA material as a function of the printing temperature for specimens printed in the horizontal direction (building direction // specimen thickness), (a) Deformed samples under various load levels, (b) engineering tensile response for a printing temperature between 250°C and 280°C.
Figure 6.
Effect of the part orientation on the tensile performance of 3D printed PLDA material for a fixed printing temperature of 260°C, (a) Deformed samples for both vertical and lateral configurations under various load levels, (b) engineering tensile response of printed samples for all considered part orientations.
Figure 7.
Effect of the printing angle on the tensile performance of 3D printed PLDA material for a fixed printing temperature of 260°C, (a) Deformed samples for printing angles between 09° and 45°, (b) engineering tensile response of printed samples for all considered printing angles.
Figure 7.
Effect of the printing angle on the tensile performance of 3D printed PLDA material for a fixed printing temperature of 260°C, (a) Deformed samples for printing angles between 09° and 45°, (b) engineering tensile response of printed samples for all considered printing angles.
Figure 8.
SEM micrographs showing the fractured surfaces and filament rupture modes in 3D printed PLDA (lateral views).
Figure 8.
SEM micrographs showing the fractured surfaces and filament rupture modes in 3D printed PLDA (lateral views).
Figure 9.
SEM micrographs showing the fractured surfaces and filament rupture modes in 3D printed PLDA (top and transverse views).
Figure 9.
SEM micrographs showing the fractured surfaces and filament rupture modes in 3D printed PLDA (top and transverse views).
Figure 10.
SEM micrographs showing localisation phenomena and rupture modes in 3D printed PLDA.
Figure 10.
SEM micrographs showing localisation phenomena and rupture modes in 3D printed PLDA.
Figure 11.
Design, manufacturing of neck
orthosis (a) CAD model of a rigid brace, (b) structural analysis showing the
strain field in the device, (c) orientation of the part in the building
platform, (d) final rendering of the printed prototype.
Figure 11.
Design, manufacturing of neck
orthosis (a) CAD model of a rigid brace, (b) structural analysis showing the
strain field in the device, (c) orientation of the part in the building
platform, (d) final rendering of the printed prototype.
Table 1.
Main physical parameters of the Nylon/polyamide-based filament.
Table 1.
Main physical parameters of the Nylon/polyamide-based filament.
| Mechanical properties |
Thermal properties |
| Young’s Modulus |
2223 ± 199 MPa |
Glass Transition Temperature |
67 ˚C |
| Tensile Strength |
66.2 ± 0.9 MPa |
Vicat Softening Temperature |
180 ˚C |
| Bending Strength |
97.0 ± 1.1 MPa |
Melting Temperature |
190 ˚C |
| Charpy Impact Strength |
9.6 ± 1.4 kJ/m2
|
|
|
Table 2.
Process parameters used to obtain 3D printed polyamide.
Table 2.
Process parameters used to obtain 3D printed polyamide.
| Parameter |
Value |
Parameter |
Value |
| Layer height |
0.3 mm |
Printing speed |
50 mm/s |
| Infill rate |
100 % |
Support density |
10% |
| Nozzle diameter |
0.4 mm |
Frame width |
0.6mm |
| Bed temperature |
60°C |
Support strategy |
everywhere |
| Printing angle |
0 – 90° |
Printing temperature |
250 – 280°C |
Table 3.
Measured engineering constants for as-received and printed PLDA wires.
Table 3.
Measured engineering constants for as-received and printed PLDA wires.
| Material* |
EY
(MPa) |
Y
(MPa) |
M
(MPa) |
R
(MPa) |
R
(-) |
| PLDA wire |
218±33 |
36.7±6.8 |
43.3±4.2 |
42.8±4.3 |
1.43 – 3.57 |
| PLDA-T250-00-HOR |
294±15 |
46±1.7 |
51±2.5 |
45±5.5 |
4.32±0.52 |
| PLDA-T260-00-HOR |
255±25 |
43±3.2 |
45±3.2 |
31±6.4 |
2.55±1.38 |
| PLDA-T270-00-HOR |
283±26 |
47±4.4 |
53±2.5 |
47±10.6 |
3.28±2.08 |
| PLDA-T280-00-HOR |
291±11 |
43±1.8 |
48±1.9 |
43±1.9 |
4.51±0.16 |
| PLDA-T260-00-LAT |
343±13 |
50±4.5 |
54±6.5 |
52±6.1 |
0.16±0.02 |
| PLDA-T260-00-VER |
195±66 |
21±3.6 |
21±3.6 |
21±3.6 |
0.13±0.05 |
| PLDA-T260-15-HOR |
277±13 |
44±2.1 |
46±3.3 |
43±1.4 |
4.35±0.05 |
| PLDA-T260-30-HOR |
270±31 |
45±3.5 |
47±3.4 |
43±0.0 |
4.18±0.00 |
| PLDA-T260-45-HOR |
272±25 |
46±3.5 |
48±3.9 |
35±2.3 |
3.45±0.10 |
| |
|
Disclaimer/Publisher’s Note: The statements, opinions and data contained in all publications are solely those of the individual author(s) and contributor(s) and not of MDPI and/or the editor(s). MDPI and/or the editor(s) disclaim responsibility for any injury to people or property resulting from any ideas, methods, instructions or products referred to in the content. |
© 2023 by the authors. Licensee MDPI, Basel, Switzerland. This article is an open access article distributed under the terms and conditions of the Creative Commons Attribution (CC BY) license (http://creativecommons.org/licenses/by/4.0/).
