Submitted:
07 November 2023
Posted:
08 November 2023
You are already at the latest version
Abstract
Keywords:
1. Introduction
2. Experiments and Methods
2.1. Modified CAM5 Model and Experiment Setup
2.2. Estimating Methods and Significance Tests
3. Results
3.1. Impacts on different components of ERF
3.2. Impacts on time series trend
3.3. Sensitivity to simulation lengths
4. Discussion
5. Conclusions
Author Contributions
Funding
Institutional Review Board Statement
Informed Consent Statement
Data Availability Statement
Acknowledgments
Conflicts of Interest
References
- Boucher, O.; Randall, D.; Artaxo, P.; Bretherton, C.; Feingold, G.; Forster, P.; Kerminen, V.M.; Kondo, Y.; Liao, H.; Lohmann, U.; et al. Clouds and Aerosols. In Climate Change 2013: The Physical Science Basis. Contribution of Working Group I to the Fifth Assessment Report of the Intergovernmental Panel on Climate Change; Stocker, T.F., Qin, D., Plattner, G.K., Tignor, M., Allen, S.K., Boschung, J., Nauels, A., Xia, Y., Bex, V., Midgley, P.M., Eds.; Cambridge University Press: Cambridge, UK; New York, NY, USA, 2013; pp. 571–658. [Google Scholar] [CrossRef]
- Eyring, V.; Bony, S.; Meehl, G.A.; Senior, C.A.; Stevens, B.; Stouffer, R.J.; Taylor, K.E. Overview of the Coupled Model Intercomparison Project Phase 6 (CMIP6) experimental design and organization. Geosci. Model Dev. 2016, 9, 1937–1958. [Google Scholar] [CrossRef]
- Szopa, S.; Naik, V.; Adhikary, B.; Artaxo, P.; Berntsen, T.; Collins, W.D.; Fuzzi, S.; Gallardo, L.; Kiendler-Scharr, A.; Klimont, Z.; et al. Short-Lived Climate Forcers. In Climate Change 2021: The Physical Science Basis. Contribution of Working Group I to the Sixth Assessment Report of the Intergovernmental Panel on Climate Change; Masson-Delmotte, V., Zhai, P., Pirani, A., Connors, S.L., Péan, C., Berger, S., Caud, N., Chen, Y., Goldfarb, L., Gomis, M.I., et al., Eds.; Cambridge University Press: Cambridge, UK; New York, NY, USA, 2021; pp. 817–922. [Google Scholar] [CrossRef]
- Hawkins, E.; Sutton, R. The Potential to Narrow Uncertainty in Regional Climate Predictions. Bull. Amer. Meteor. Soc. 2009, 90, 1095–1108. [Google Scholar] [CrossRef]
- Pincus, R.; Forster, P.; Stevens, B. The Radiative Forcing Model Intercomparison Project (RFMIP): Experimental Protocol for CMIP6. Geosci. Model Dev. 2016, 9, 3447–3460. [Google Scholar] [CrossRef]
- Stouffer, R.J.; Eyring, V.; Meehl, G.; Bony, S.; Senior, C.; Stevens, B.; Taylor, K.E. CMIP5 scientific gaps and recommendations for CMIP6. Bull. Amer. Meteor. Soc. 2016, 98, 95–105. [Google Scholar] [CrossRef]
- O’Neill, B.C.; Tebaldi, C.; van Vuuren, D.P.; Eyring, V.; Friedlingstein, P.; Hurtt, G.; Knutti, R.; Kriegler, E.; Lamarque, J.F.; Lowe, J.; et al. The Scenario Model Intercomparison Project (ScenarioMIP) for CMIP6. Geosci. Model Dev. 2016, 9, 3461–3482. [Google Scholar] [CrossRef]
- Sanchez, K.J.; Roberts, G.C.; Calmer, R.; Nicoll, K.; Hashimshoni, E.; Rosenfeld, D.; Ovadnevaite, J.; Preissler, J.; Ceburnis, D.; O’Dowd, C.; et al. Top-down and bottom-up aerosol–cloud closure: Towards understanding sources of uncertainty in deriving cloud shortwave radiative flux. Atmos. Chem. Phys. 2017, 17, 9797–9814. [Google Scholar] [CrossRef]
- Deser, C.; Phillips, A.; Bourdette, V.; Teng, H. Uncertainty in climate change projections: The role of internal variability. Clim. Dyn. 2012, 38, 527–546. [Google Scholar] [CrossRef]
- Thompson, D.W.J.; Barnes, E.A.; Deser, C.; Foust, W.E.; Phillips, A.S. Quantifying the Role of Internal Climate Variability in Future Climate Trends. J. Climate 2015, 28, 6443–6456. [Google Scholar] [CrossRef]
- Dai, A.; Bloecker, C. Impacts of internal variability on temperature and precipitation trends in large ensemble simulations by two climate models. Clim. Dyn. 2019, 52, 289–306. [Google Scholar] [CrossRef]
- Ji, D.F.; Liu, L.; Li, L.J.; Sun, C.; Yu, X.Z.; Li, R.Z.; Zhang, C.; Wang, B. Uncertainties in the simulation of 1.5°C and 2°C warming threshold-crossing time arising from model internal variability based on CMIP5 models. Clim. Chang. Res. 2019, 15, 343–351. [Google Scholar] [CrossRef]
- Chtirkova, B.; Folini, D.; Correa, L.; Wild, M. Internal Variability of All-Sky and Clear-Sky Surface Solar Radiation on Decadal Timescales. J. Geophys. Res. Atmos. 2022, 127, e2021JD036332. [Google Scholar] [CrossRef]
- Myhre, G.; Samset, B.H.; Schulz, M.; Balkanski, Y.; Bauer, S.; Berntsen, T.K.; Bian, H.; Bellouin, N.; Chin, M.; Diehl, T.; et al. Radiative forcing of the direct aerosol effect from AeroCom Phase II simulations. Atmos. Chem. Phys. 2013, 13, 1853–1877. [Google Scholar] [CrossRef]
- Seinfeld, J.H.; Bretherton, C.; Carslaw, K.S.; Coe, H.; DeMott, P.J.; Dunlea, E.J.; Feingold, G.; Ghan, S.; Guenther, A.B.; Kahn, R.; et al. Improving our fundamental understanding of the role of aerosol−cloud interactions in the climate system. Proc. Natl. Acad. Sci. 2016, 113, 5781–5790. [Google Scholar] [CrossRef]
- McCoy, D.; Bender, F.; Mohrmann, J.; Hartmann, D.; Wood, R.; Grosvenor, D. The global aerosol-cloud first indirect effect estimated using MODIS, MERRA and AeroCom: MODIS-MERRA Indirect Effect. J. Geophys. Res. Atmos. 2017, 122, 1779–1796. [Google Scholar] [CrossRef]
- Bellouin, N.; Quaas, J.; Gryspeerdt, E.; Kinne, S.; Stier, P.; Watson-Parris, D.; Boucher, O.; Carslaw, K.; Christensen, M.; Daniau, A.L.; et al. Bounding Global Aerosol Radiative Forcing of Climate Change. Rev. Geophys. 2020, 58, e2019RG000660. [Google Scholar] [CrossRef] [PubMed]
- Wang, Z.; Lin, L.; Xu, Y.; Che, H.; Zhang, X.; Zhang, H.; Dong, W.; Wang, C.; Gui, K.; Xie, B. Incorrect Asian aerosols affecting the attribution and projection of regional climate change in CMIP6 models. npj Clim. Atmos. Sci. 2021, 4, 2. [Google Scholar] [CrossRef]
- Vogel, A.; Alessa, G.; Scheele, R.; Weber, L.; Dubovik, O.; North, P.R.J.; Fiedler, S. Uncertainty in Aerosol Optical Depth From Modern Aerosol-Climate Models, Reanalyses, and Satellite Products. J. Geophys. Res. Atmos. 2022, 127, e2021JD035483. [Google Scholar] [CrossRef]
- Shindell, D.T.; Lamarque, J.F.; Schulz, M.; Flanner, M.; Jiao, C.; Chin, M.; Young, P.J.; Lee, Y.H.; Rotstayn, L.; Mahowald, N.; et al. Radiative forcing in the ACCMIP historical and future climate simulations. Atmos. Chem. Phys. 2013, 13, 2939–2974. [Google Scholar] [CrossRef]
- Regayre, L.A.; Johnson, J.S.; Yoshioka, M.; Pringle, K.J.; Sexton, D.M.H.; Booth, B.B.B.; Lee, L.A.; Bellouin, N.; Carslaw, K.S. Aerosol and physical atmosphere model parameters are both important sources of uncertainty in aerosol ERF. Atmos. Chem. Phys. 2018, 18, 9975–10006. [Google Scholar] [CrossRef]
- Stevens, B.; Fiedler, S.; Kinne, S.; Peters, K.; Rast, S.; Musse, J.; Smith, S.J.; Mauritsen, T. MACv2-SP: A parameterization of anthropogenic aerosol optical properties and an associated Twomey effect for use in CMIP6. Geosci. Model Dev. 2017, 10, 433–452. [Google Scholar] [CrossRef]
- Fiedler, S.; Kinne, S.; Huang, W.T.K.; Räisänen, P.; O’Donnell, D.; Bellouin, N.; Stier, P.; Merikanto, J.; van Noije, T.; Makkonen, R.; et al. Anthropogenic aerosol forcing—Insights from multiple estimates from aerosol-climate models with reduced complexity. Atmos. Chem. Phys. 2019, 19, 6821–6841. [Google Scholar] [CrossRef]
- Shi, X.; Zhang, W.; Liu, J. Comparison of Anthropogenic Aerosol Climate Effects among Three Climate Models with Reduced Complexity. Atmosphere 2019, 10, 456. [Google Scholar] [CrossRef]
- Fiedler, S.; Stevens, B.; Mauritsen, T. On the sensitivity of anthropogenic aerosol forcing to model-internal variability and parameterizing a Twomey effect. J. Adv. Model. Earth Syst. 2017, 9, 1325–1341. [Google Scholar] [CrossRef]
- Neale, R.B.; Gettelman, A.; Park, S.; Chen, C.-C.; Lauritzen, P.H.; Williamson, D.L.; Conley, A.J.; Kinnison, D.; Marsh, D.; Smith, A.K.; et al. Description of the NCAR Community Atmosphere Model (CAM 5.0). 2012, NCAR/TN-486+STR. [Google Scholar] [CrossRef]
- Morrison, H.; Gettelman, A. A New Two-Moment Bulk Stratiform Cloud Microphysics Scheme in the Community Atmosphere Model, Version 3 (CAM3). Part I: Description and Numerical Tests. J. Clim. 2008, 21, 3642–3659. [Google Scholar] [CrossRef]
- Gettelman, A.; Morrison, H. Advanced Two-Moment Bulk Microphysics for Global Models. Part I: Off-Line Tests and Comparison with Other Schemes. J. Clim. 2015, 28, 1268–1287. [Google Scholar] [CrossRef]
- Ghan, S.J.; Liu, X.; Easter, R.C.; Zaveri, R.; Rasch, P.J.; Yoon, J.-H.; Eaton, B. Toward a Minimal Representation of Aerosols in Climate Models: Comparative Decomposition of Aerosol Direct, Semidirect, and Indirect Radiative Forcing. J. Clim. 2012, 25, 6461–6476. [Google Scholar] [CrossRef]
- Liu, X.; Easter, R.C.; Ghan, S.J.; Zaveri, R.; Rasch, P.; Shi, X.; Lamarque, J.F.; Gettelman, A.; Morrison, H.; Vitt, F.; et al. Toward a minimal representation of aerosols in climate models: Description and evaluation in the Community Atmosphere Model CAM5. Geosci. Model Dev. 2012, 5, 709–739. [Google Scholar] [CrossRef]
- Iacono, M.; Delamere, J.; Mlawer, E.; Shephard, M.; Clough, S.; Collins, W. Radiative Forcing by Long-Lived Greenhouse Gases: Calculations with the AER Radiative Transfer Models. J. Geophys. Res. 2008, 113. [Google Scholar] [CrossRef]
- Boucher, O.; Lohmann, U. The sulfate–CCN–cloud albedo effect: A sensitivity study with two general circulation models. Tellus 1995, 47, 281–300. [Google Scholar] [CrossRef]
- Kinne, S. Aerosol radiative effects with MACv2. Atmos. Chem. Phys. 2019, 19, 10919–10959. [Google Scholar] [CrossRef]
- Hansen, J.; Sato, M.; Ruedy, R.; Nazarenko, L.; Lacis, A.; Schmidt, G.A.; Russell, G.; Aleinov, I.; Bauer, M.; Bauer, S.; et al. Efficacy of climate forcings. J. Geophys. Res. Atmos. 2005, 110, D18104. [Google Scholar] [CrossRef]
- Ghan, S. Technical Note: Estimating aerosol effects on cloud radiative forcing. Atmos. Chem. Phys. Discuss. 2013, 13, 9971–9974. [Google Scholar] [CrossRef]
- Forster, P.; Richardson, T.; Maycock, A.; Smith, C.; Samset, B.H.; Myhre, G.; Andrews, T.; Pincus, R.; Schulz, M. Recommendations for diagnosing effective radiative forcing from climate models for CMIP6: Recommended Effective Radiative Forcing. J. Geophys. Res. Atmos. 2016, 121, 12460–12475. [Google Scholar] [CrossRef]
- Mishra, P.; Singh, U.; Pandey, C.; Mishra, P.; Pandey, G. Application of student’s t-test, analysis of variance, and covariance. Ann. Card. Anaesth. 2019, 22, 407–411. [Google Scholar] [CrossRef] [PubMed]
| Names | Description |
|---|---|
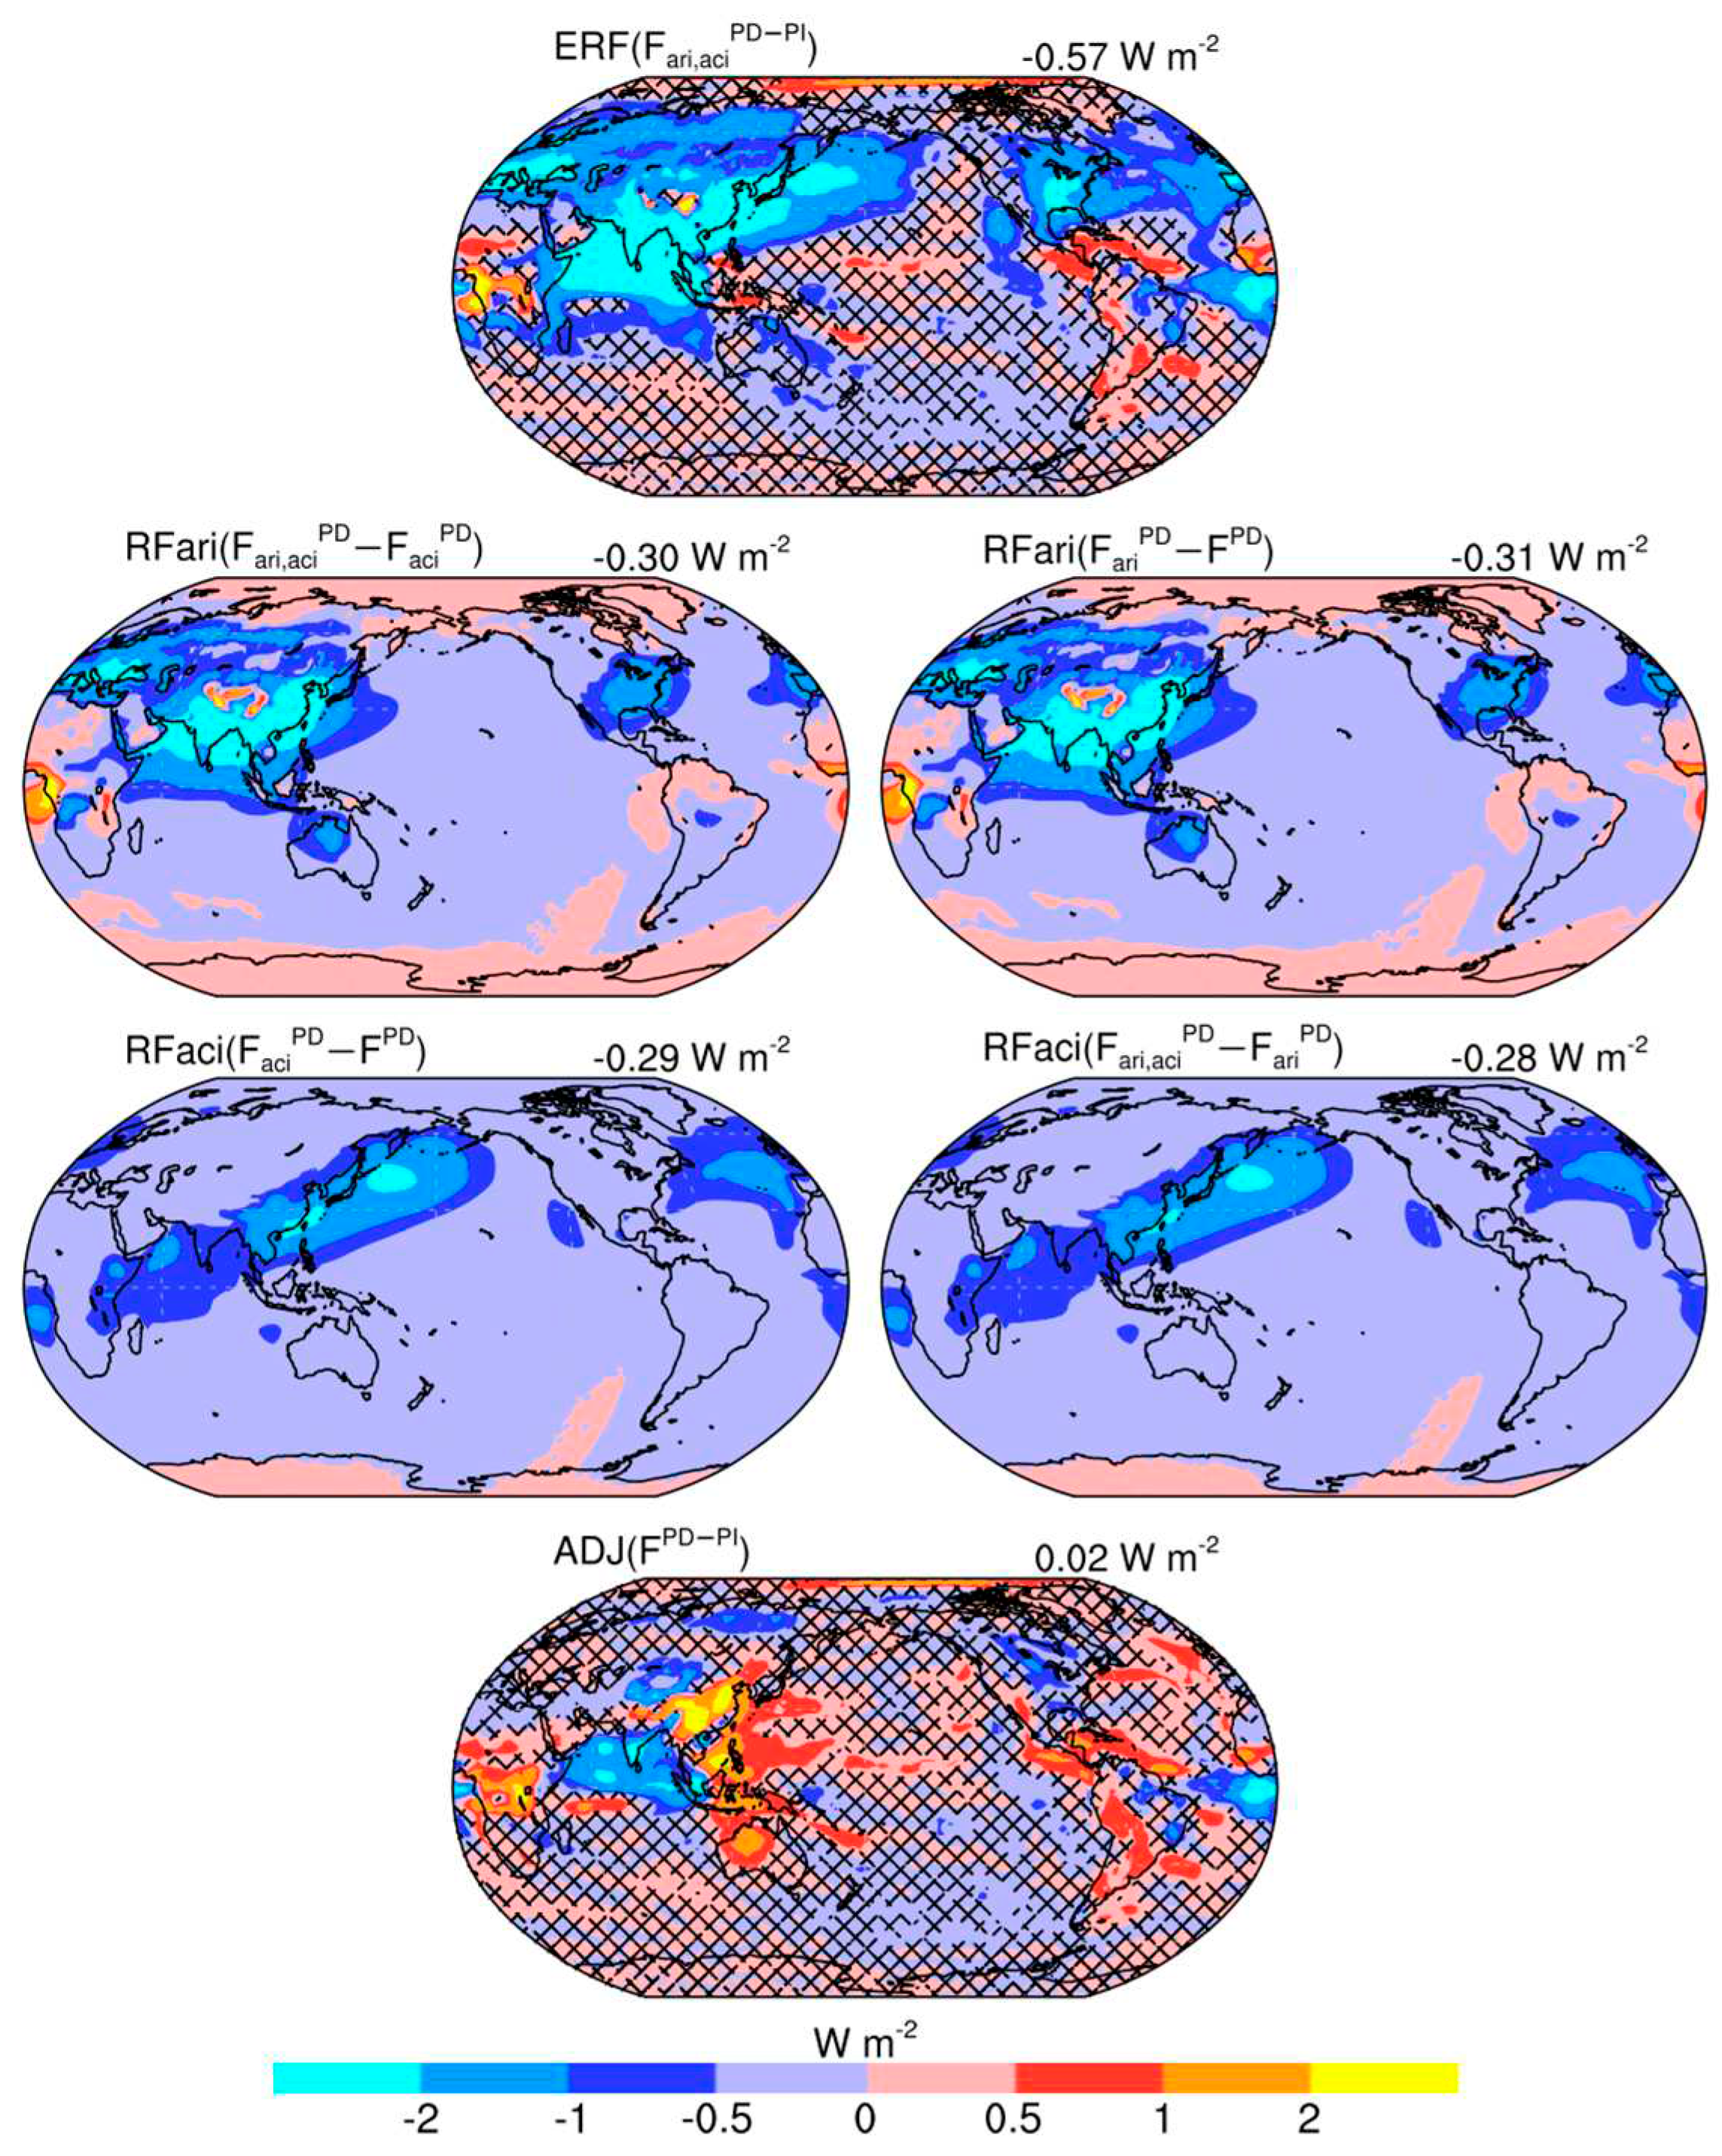
| Fari,aci | The default shortwave net radiative fluxes, considering anthropogenic aerosol direct radiative effect and Twomey effect |
| Faci | Similar to Fari,aci, but excluding anthropogenic aerosol direct radiative effect |
| Fari | Similar to Fari,aci, but excluding anthropogenic aerosol Twomey effect |
| F | Similar to Fari,aci, but excluding anthropogenic aerosol effects |
| RFari | Anthropogenic aerosol instantaneous radiative forcing from direct radiative effect, RFari = Fari,aci − Faci, RFari = Fari − F |
| RFaci | Anthropogenic aerosol instantaneous radiative forcing from Twomey effect, RFaci = Fari,aci − Fari, RFaci = Faci− F |
Disclaimer/Publisher’s Note: The statements, opinions and data contained in all publications are solely those of the individual author(s) and contributor(s) and not of MDPI and/or the editor(s). MDPI and/or the editor(s) disclaim responsibility for any injury to people or property resulting from any ideas, methods, instructions or products referred to in the content. |
© 2023 by the authors. Licensee MDPI, Basel, Switzerland. This article is an open access article distributed under the terms and conditions of the Creative Commons Attribution (CC BY) license (http://creativecommons.org/licenses/by/4.0/).


