1. Introduction
The pollution of the aquatic environment is a serious and growing problem caused by anthropogenic activities, such as industry, agriculture and trade [
1,
2,
3]. The resulting low quality of water negatively affects the life of aquatic organisms, by inducing stress and compromising the general health status [
4]. Rivers and lakes represent the aquatic ecosystems most threatened by the casual release of xenobiotic substances and different kind of waste [
5]. Indeed, the presence of toxic and chemical substances or untreated waste into the water alters the abiotic parameters (pH and dissolved oxygen) of river bodies, negatively affecting the survival of resident organisms [
6]. Furthermore, since molluscs, crustaceans and fish species are commonly consumed by humans, the accumulation of pollutants in aquatic organisms could be a risk for human heath [
7]. Among aquatic organisms, fish are considered sentinels of water pollution, since their health status reflects the aquatic environment in which they live [
8]. By carrying out the entire biological cycle in water, having a sufficiently long life and moving within more or less extensive areas, fish are often used in biomonitoring programs to assess environmental stresses [
9]. Among fishes, the Teleosts European eel (
Anguilla anguilla) and Brown trout (
Salmo trutta fario) represent excellent species for the biomonitoring of aquatic ecosystems due to the high degree of diffusion and some characteristics such as the mobility, the capacity to adapt to different salinity conditions and the sensibility to changes in the chemical state of the habitat make these fish suitable for the biomonitoring of the pollution of freshwater ecosystems [
9,
10,
11].
In fish, exposure to pollutants determines changes at molecular, cellular and tissue levels [
8,
12]. Only subsequently, changes in behavior or external appearance take place [
8]. Histological and immunohistochemical analyses therefore represent a sensitive and fundamental tool for the early determination of the negative effects induced by toxic and / or polluting substances at the morpho-physiological and biochemical level of the organs most sensitive to aquatic pollution, such as gills, liver, spleen and kidneys [
13,
14]. Performing essential functions such as metabolism and detoxification of toxic substances, liver and spleen are frequently used as tools for fish health assessment [
15]. The identification of biomarkers of these organs may provide a fairly rapid method for detecting the occurred exposure to environmental stressors and analyze the effects of contaminants [
16,
17]. Several studies have suggested that the exposure to contaminants and stressors induces changes in normal hepatocyte organization and cytoplasmic vacuolation, proliferation of white pulp, excessive production of connective tissue (fibrosis), and increase in melanomacrophagic centers (MMC) [
18]. Melano-macrophage centers (MMCs) are crucial to the fish immune system and play a key role in the inflammatory defense [
19,
20]. Moreover, exposure of fish to several contaminants can also induce the upregulation of some proinflammatory factors [
1,
21,
22,
23] including the pleiotropic pro-inflammatory cytokine TNFα (Tumor Necrosis Factor α) and the inflammation marker COX2 (Cycloxygenase 2). In aquatic animals, pesticides and heavy metal, widespread environmental pollutants, could also induce oxidative stress and compromise the antioxidant defense system generating consequent alterations to vital biomolecules, such as lipids, protein and DNA [
5].
Mediterranean rivers are among the most threatened ecosystems due to anthropogenic insults [
24]. The continuous polluting threats determine the degradation of the ecological status of aquatic habitats, which is the basis of the worrying decline in the fish populations [
25,
26]. Thus, it is very important to identify the direct or indirect effects of pollution caused by human-induced activities on living organisms in due time, in order to take the necessary counteractive measures. In this context, the aim of the present study, was to evaluate the wild freshwater fish health status using a vast array of health biomarkers to be employed as predictive factor of pollutant exposure. For this purpose, European eel and Brown trout, resident in rivers with different degree of pollution (Picentino river with good environmental quality and Tusciano river with low environmental quality), were examined using biometric parameters, histopathological and immunohistochemical analyses to evaluate the health status and possible adaptations of fish.
2. Materials and Methods
2.1. Sampling sites
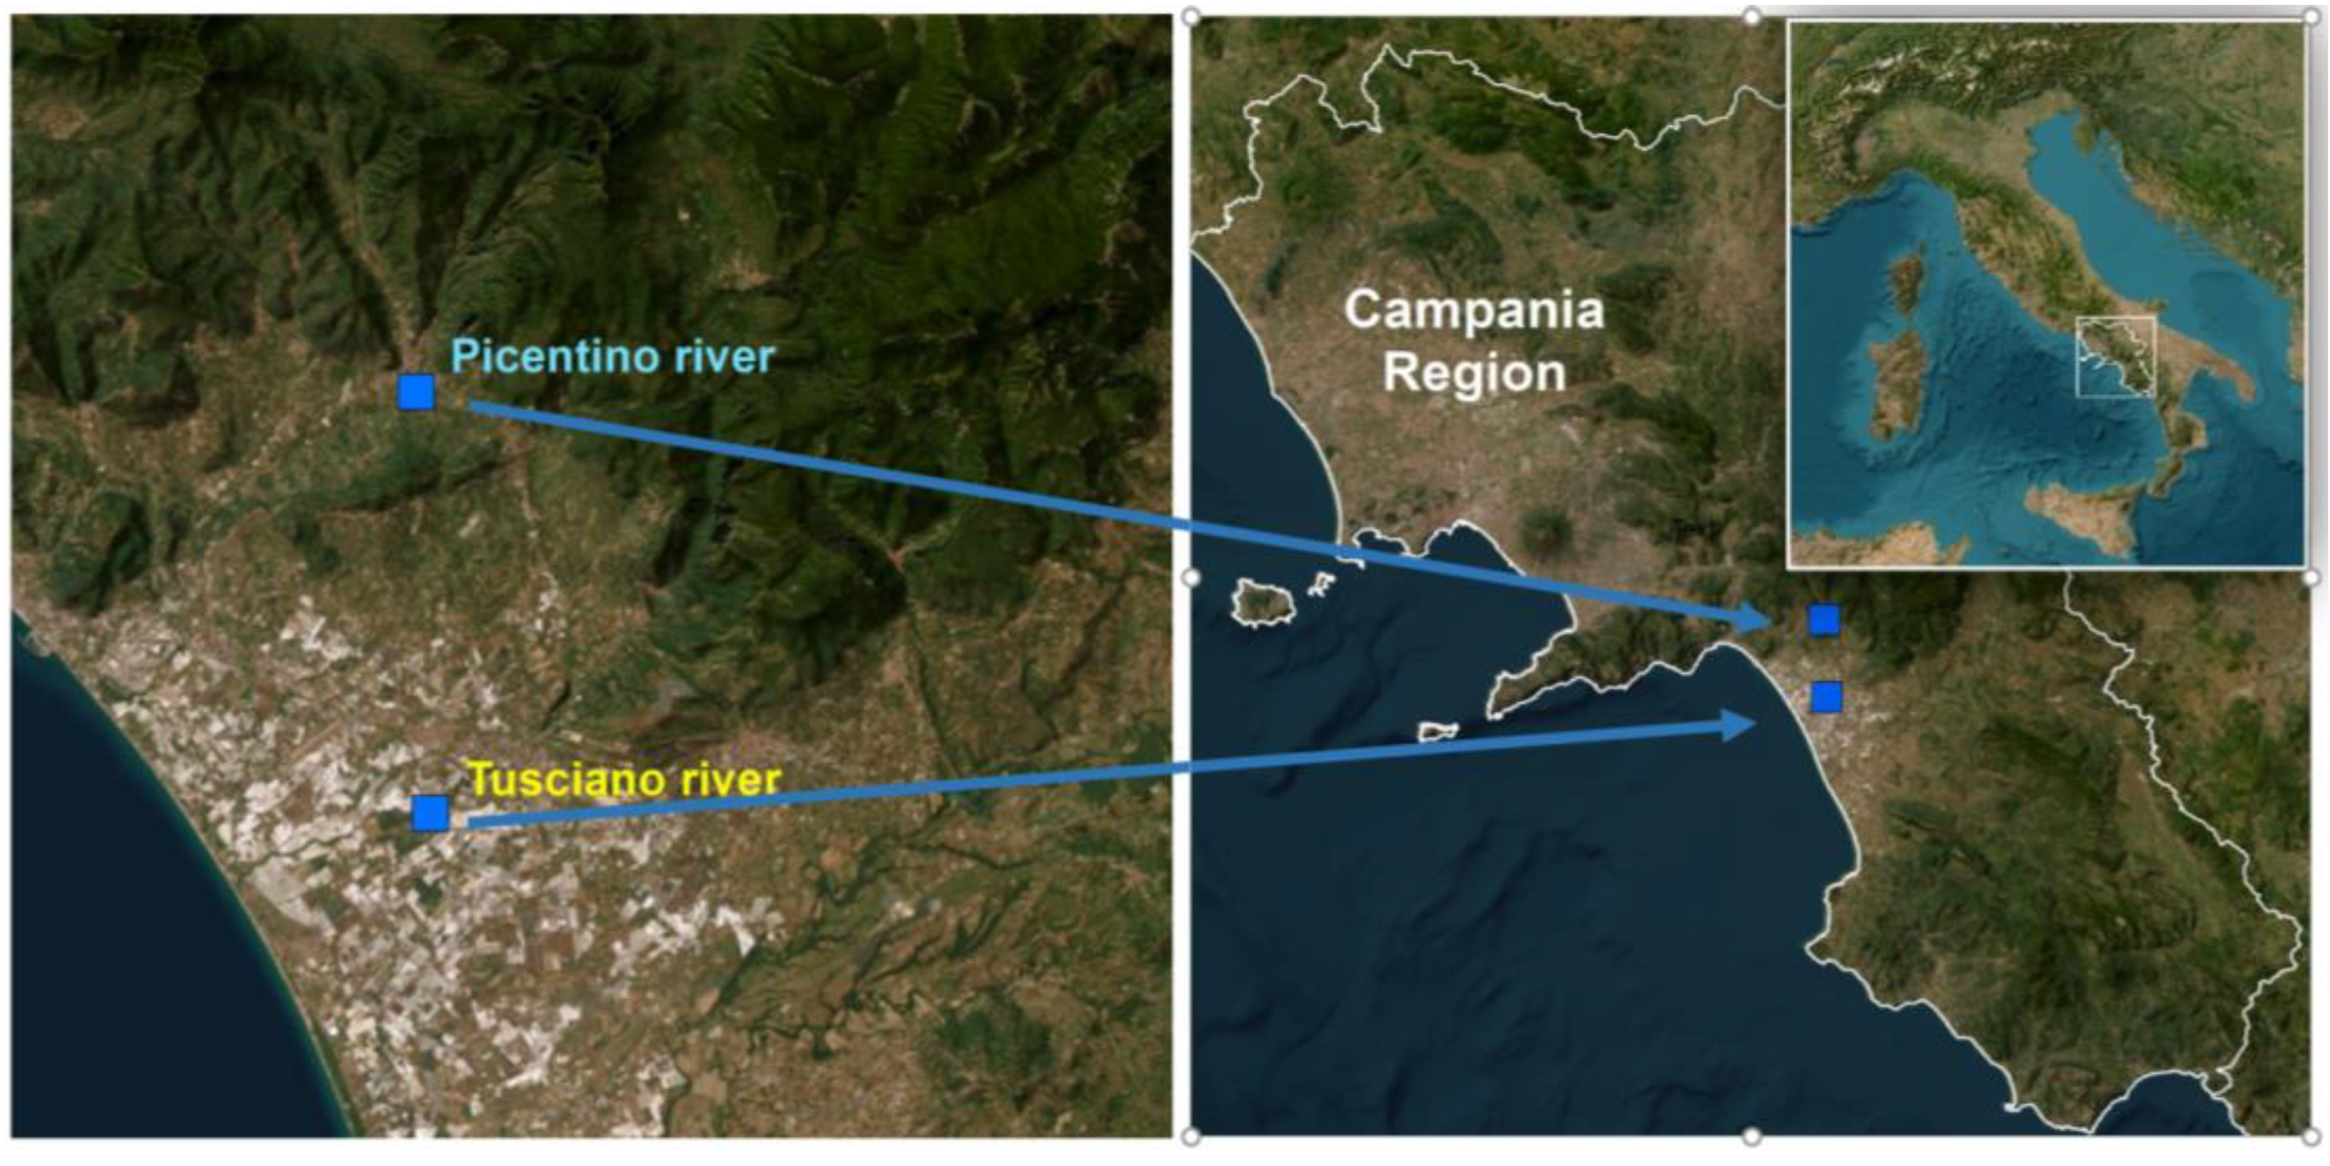
In this study, two different rivers located in the Campania region (South of Italy) were selected based on different levels of water and soil contamination (
Figure 1).
The Picentino river (site of sampling: 40°42'27.5''N and 14°56'39.6''E) originates from the Picentini Mountains and the total area of the hydrographic basin is 150 km². The Tusciano river (site of sampling: 40°35’58.9’’N and 14°56’57.4’’E), also originates from the Picentini Mountains and along its course it crosses upstream a territory covered by wooded vegetation which towards the valley gives way to intensely urbanized and industrialized areas, suffering all the effects of the anthropic environmental alterations.
In order to establish the environmental health status of the two rivers, concentration data of potentially toxic elements (PTEs) and persistent organic pollutants (POPs) in river waters and soil near the fish sampling sites were used. These data are part of a very large and detailed environmental monitoring program of the entire Campania Region carried out in 2018/2019 (they are freely available at the link
http://www.campaniatrasparente.it/gis.php). Specifically, the data refer to the concentration in water and soils of potentially toxic elements (PTEs) (Sb, As, Be, Cd, Cr, Co, Cu, Pb, Hg, Ni, Se, Tl, Sn, V, Zn), polycyclic aromatic hydrocarbons (PAHs), polychlorinated biphenyls (PCBs) and organochlorine pesticides (OCPs)
2.2. Animals and biological indices
European eel (Anguilla anguilla) (n = 10; 5/sites) and Brown trout (Salmo trutta fario) (n= 10; 5/sites) were collected during the period November – December 2020 using an electroshock equipment. Blood was promptly withdrawn from the caudal tail vessels using a heparin-rinsed syringe with a 23-gauge needle. Fish were kept refrigerated and transported to the laboratory. Total length (TL) was measured with a ruler. The body weight (BW) was measured with a scale, to the second decimal place. Liver and spleen were removed and weighed. Physiological integrative indicators such as condition factor (K) and hepatosomatic index (HSI) were calculated. The condition factor (K) was calculated as K = 100 * BW/TL^3. The HSI was calculated as the ratio of liver mass to body mass.
2.3. Histo-pathological analysis
Liver and spleen were fixed in 4% formalin in phosphate buffer pH 7.4, processed according to Coccia et al. [
27] and embedded in paraffin. 5-μm sections were stained with hematoxylin-eosin (H&E) and Gomori trichrome. The histological sections were examined under an optical microscope with a Leica DMI6000 equipped with a Leica DFC340 CCD digital camera (Leica Microsystems) and microscopic images were acquired at 10X, 20X and 40X magnification.
Identification of histological alterations was primarily based on the work of Mumford et al. [
28] and Martins et al. [
29]. The evaluation of histological alterations was carried out by examining 10 sections and 20 fields per section of each organ, each section selected at 50µm distance. The indices of histopathological alteration (HA) of liver and spleen were calculated adapting the scoring system suggested by Bernet et al. [
12]. Briefly, according to this semi-quantitative method, to each observed alteration was assigned an importance factor (ω) ranging from 1 to 3 (
Table 1). Specifically, the importance factor 1 corresponded to minimal and reversible damages (circulatory, cellular and structural alterations), factor 2 corresponded to moderate and reversible damages (inflammation and lipid accumulation) and factor 3 corresponded to irreversible alterations that determine the loss of organ function (cellular death).
Moreover, the degree and extent of the alterations observed in liver and spleen were evaluated by using a score value (a) ranging from 0 to 3 (0 = no alterations or very mild changes in < 5% of fields; 1 = slight and localized modifications in < 20% of fields; 2 = moderate and mild diffuse modifications in 20 to 60% of fields; 3 = severe and widespread modification in >60% of fields. This ranking was used by Nataraj et al. [
30] to define a general assessment value of the histopathological lesion in animal tissues. Using the factors of importance (ω) and score values (a), the histopathological alteration indices (HA) were calculated using the following equation:
To compare the degree of hepatic damage of European eel and Brown trout in the two different rivers, the liver histopathological index (LHP) was calculated for each fish by using the formula:
The LHP value was interpreted inspiring to the organ evaluation indices proposed by Zimmerli et al. [
31]. The LHP was divided into four different ranges of values of which the range of 0-10 indicated normal structural organization of the organ, the range of 11-20 indicated mild structural changes in the organ, the range 21-40 indicated moderate structural changes, and the range >40 indicated the presence of severe alterations. For the histo-pathological analysis of spleen, were also evaluated, the number of MMC and the percentage of the area of fibrosis. The number of melanomacrophages centers (MMC) was calculated using ten randomly selected splenic sections stained with H&E and counted on the entire section. Measurements were made using the image analysis software Motic Image Plus version 3.0. The fibrosis surface areas were quantified in ten randomly selected splenic sections stained with Gomori Trichrome using the IHC Toolbox in Image J [
32]. All the histological analyses were performed by two independent operators blinded to the type of sample in order to make the results more objective.
2.4. Immunohistochemical Analysis
For immunohistochemical analysis, the following primary antibodies were used: anti-TNFα (tumor necrosis factor α) (Novus, Cat No. 19532; 1:100); anti-COX2 (ciclooxigenase 2) (Cayman, No. 160126; 1:200); anti-SOD (superoxide dismutase) (Genetex, Cat No. 124294; 1:100); anti-CAT (catalase) (Genetex, Cat No. 124357; 1:100); anti-8OHdG (8-Hydroxy-2'-deoxyguanosine) (Abcam, Cat No. 48508), 1:100). Sections of liver and spleen were hydrated, and 3% hydrogen peroxide (H2O2) was used to block endogenous peroxidase. After blocking, primary antibodies were applied using their respective dilutions overnight at 4 °C. The secondary antibody incubation was followed by 1 h with the avidin-biotin complex diluted in Tris-buffered saline according to the manufacturer’s instructions (ABC Kit; Vectastain, Vector). Thereafter, 10-min. incubation with 0.05% of 30-diaminobenzidine (DAB) (DAB Sigma Fast, Sigma-Aldrich, Milano, Italy) were applied. Leica DMI6000 light microscopy (Leica Microsystems, Wetzlar, Germany) was used to examine the sections. Images were acquired using a digital camera (JCV FC 340FX, Leica) at magnification of 20x. A control-staining procedure was carried out to confirm the specificity of the immunoreaction. The density of biomarkers-positive immunosignal was quantified with densitometric analysis on each sample divided into six regions (n=3 animals/site; n=6 pairs of sections/animal, each section selected at 50µm distance). Optical density was performed with the image analysis software Image Pro Plus® 6.0 (MediaCybernetics, Rockville, MD, USA). All the histological analyses were performed by an independent operator blinded to the type of treatment.
2.5. Blood smear and staining
A drop of fresh blood (20 μl) from each fish was smeared on a glass slide, dried and stained with May Grunwald-Giemsa to assess the morphological changes of erythrocytes [
33]. To perform the blood qualitative-quantitative analysis, three smears were analyzed for each sample and four regions of interest were examined for each smear. Percentage of erythrocytic nuclear abnormalities (ENA: micronucleus, bledded nucleus, notched nucleus), erythrocytic cellular abnormalities (ECA: erythrocyte deformed, elongated, or circular) and erythrocytic fusion (EF) were analyzed by using Image Pro Plus® 6.0 image analysis software (MediaCybernetics).
2.6. Statistical analyses
All data were analyzed statistically, using GraphPad Prism 8 software (GraphPad, Inc.) and the histopathological data were presented as Mean ± Standard Deviation (SD), while optical density and ENA, ECA, and EF were reported as Mean ± Standard Error (SE). Comparison between two sampling sites was performed using t-test or two-way ANOVA. P-values below 0.05 were considered statistically significant. A correlation analysis was applied to investigate the relationship between environmental pollutants in stream water and soil and histopathological alterations of tissues. P-value is from a two-tailed test with a confidence interval of 95%. Statistical differences were considered significant whenever P < 0.05 and statistical output was represented by stars as follows: non-significant (ns) > 0.05, *P ≤ 0.05, **P ≤ 0.01.
4. Discussion
In this work, we report the assessment of the health status of two of the most abundant and widely distributed fish species: the European eel (
Anguilla anguilla) and the Brown trout (
Salmo trutta fario). As reported by scientific studies, fish represent an excellent tool in the biomonitoring of the aquatic environments [
4,
34]; however, as suggested by Griffiths [
35], the use of only one fish species as a bioindicator of aquatic environment may arise some problems mainly related to the narrowness of the fish zoning. For this reason, we selected two fish species widely distributed in the Mediterranean rivers and commonly employed in the assessment of the impacts of anthropogenic activities [
36,
37].
The analysis of biological indices provided interesting information about the health status of the species living in the Picentino and Tusciano rivers. The analysis of the condition index K, a not invasive indicator of fish health [
38], showed values similar to the reference scores for European eel [
39] and Brown trout [
40], suggesting a good nutritional status in both river locations. On the contrary, the hepatosomatic index (HSI), another useful indicator of the physiological state of fish [
18]. was significantly higher in both species living in the Tusciano river. Numerous scientific studies report that the exposure to aquatic pollutants (including heavy metals) can lead to an increase in the HSI of fish [
17,
41,
42], due to the increment in detoxification activity and lipid accumulation in the liver [
43]. The high HSI value found in European eel and Brown trout living in the Tusciano river is, therefore, an indication of pollutant exposure.
Among the ecotoxicological methods, histopathology is a useful tool for detecting the toxic effects of pollutants, allowing the localization and quantification of lesions induced by contaminants on key organs, such as spleen and liver [
12,
44]. In fish, the liver carries on vital functions, from basic metabolism to accumulation, biotransformation and excretion of contaminants [
2,
21], thus liver tissue changes are indicative of the fish health status [
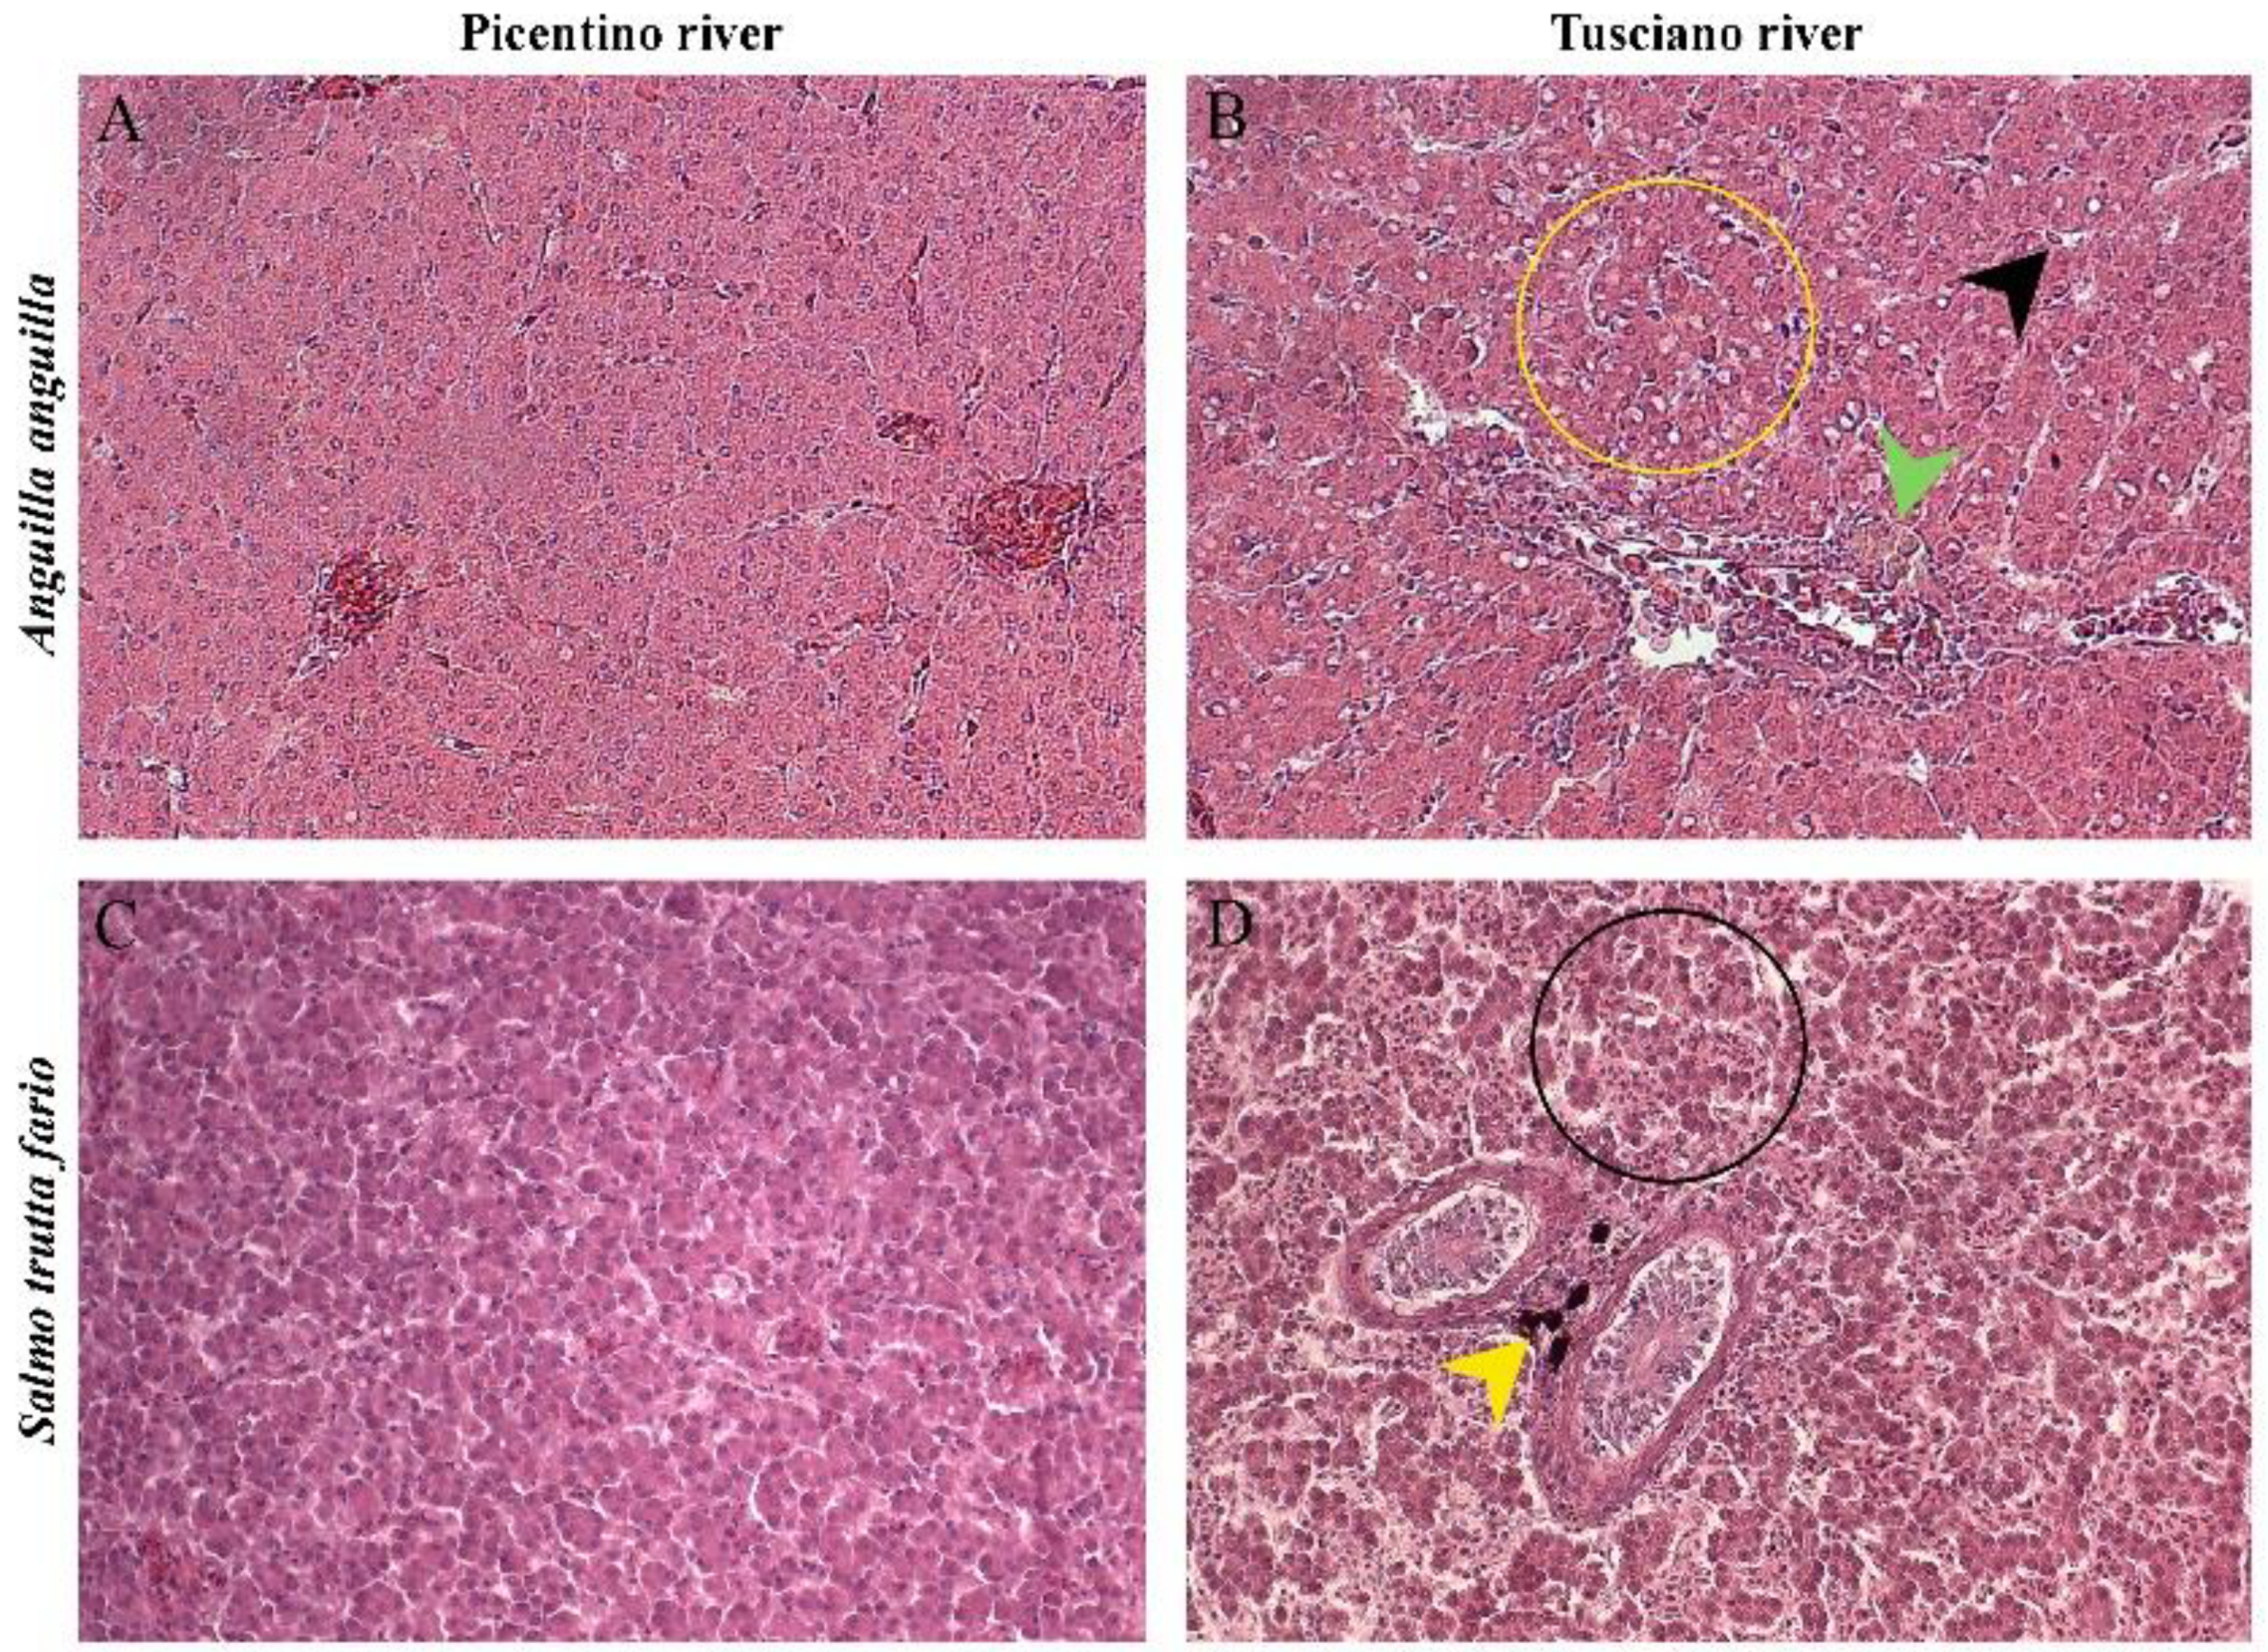
44]. Morpho-histopathological analysis has shown a significant increase in the number of liver alterations in European eel and Brown trout from Tusciano river compared to the Picentino river. Numerous liver histopathological lesions were observed including degeneration of the liver parenchyma, deformation of hepatocytes, cytoplasmic vacuolization and dilation of the hepatic capillaries. It has been reported that cytoplasmatic vacuolization represents the most pathological lesion of fish exposed to aquatic contaminants [
45]. Indeed, exposure to heavy metals induces metabolic damage, leading to degenerative process that causes accumulation of fat under the form of vacuoles in the cytoplasm of liver [
2,
46]. Several reports have demonstrated that there is a correlation between exposure to contaminants and development of toxicopathic and histocytopathological hepatic lesions in fish [
47,
48,
49]. Other important histopathological lesions found in the liver of European eels and Brown trout in the Tusciano river that could represent the consequence of exposure to environmental contaminants are hemorrhage, congestion in sinusoids, and leukocyte infiltration. As reported by Javed et al. [
50], hepatic hemorrhage may result from congestion of blood vessels due to the increase in blood pressure induced by exposure to toxic substances. Similarly, leukocyte infiltration, one of the main alterations typical of the inflammatory process, is another morphological disorder commonly found in the liver of organisms exposed to pollutants. Kaur et al. [
51] report the presence of hepatic cellular infiltrations as an index of activation of the immune system following exposure to environmental contaminants and, according to Bernet et al. [
12], leukocyte infiltrations can be classified as tissue alteration of moderate severity.
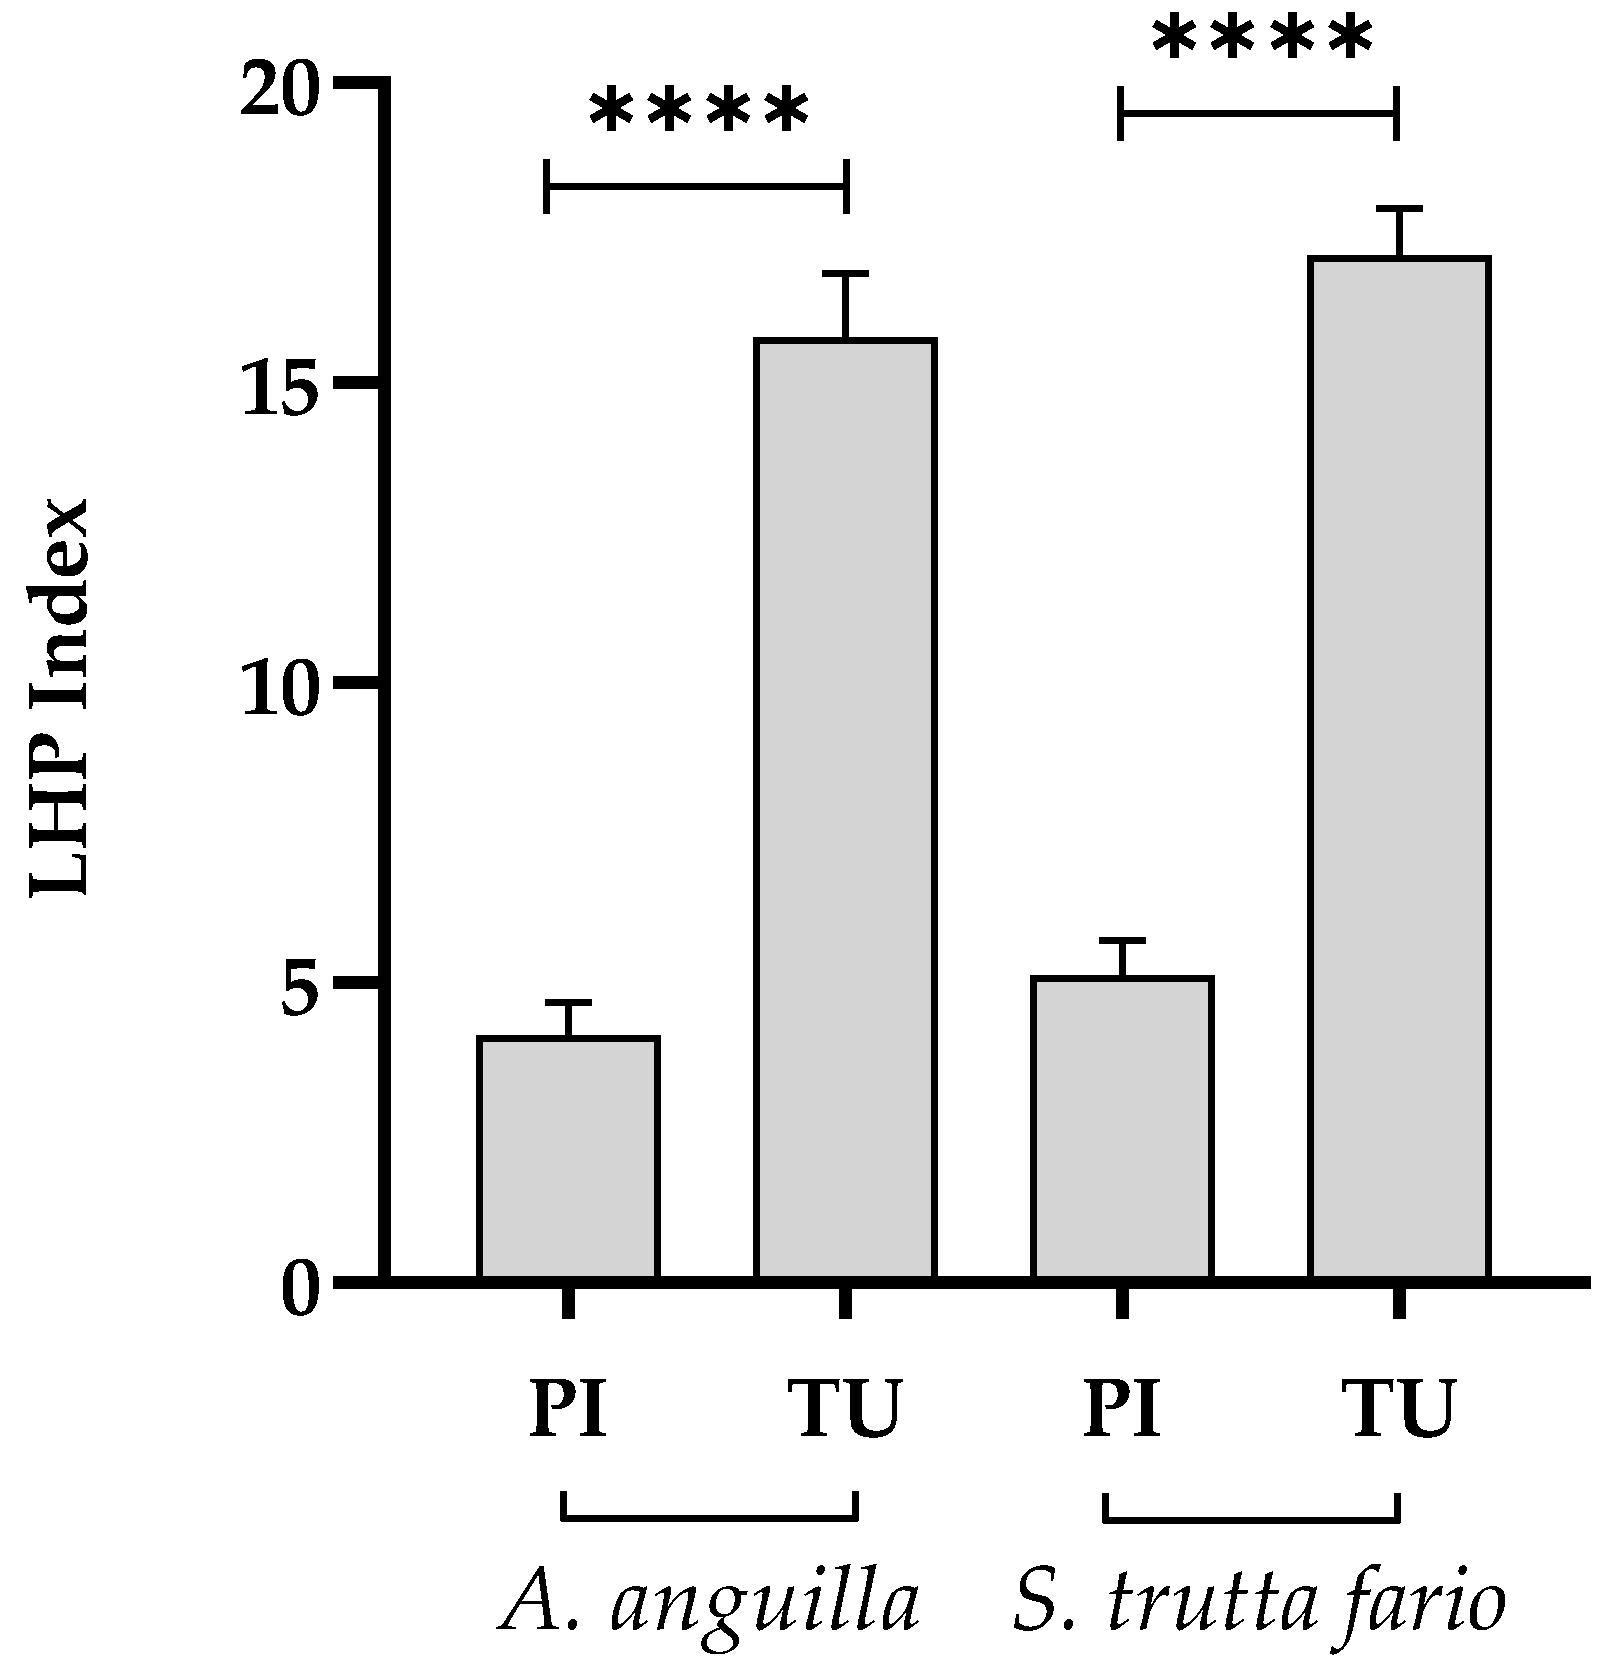
Using the factors of importance (ω) and the score values (a) of all the alterations found in the liver sections analyzed, the histopathological index of the liver of both fish species from Tusciano river showed a significant increase when compared with the Picentino river. As reported by Bernet et al. [
12], the histopathological index represents the degree of damage to an organ examined and a high histopathological index indicates a high degree of organ damage. Therefore, the increase in the histopathological index of the liver identified in European eel and Brown trout from Tusciano river suggests the presence of mild / moderate liver damage compared to Picentino river.
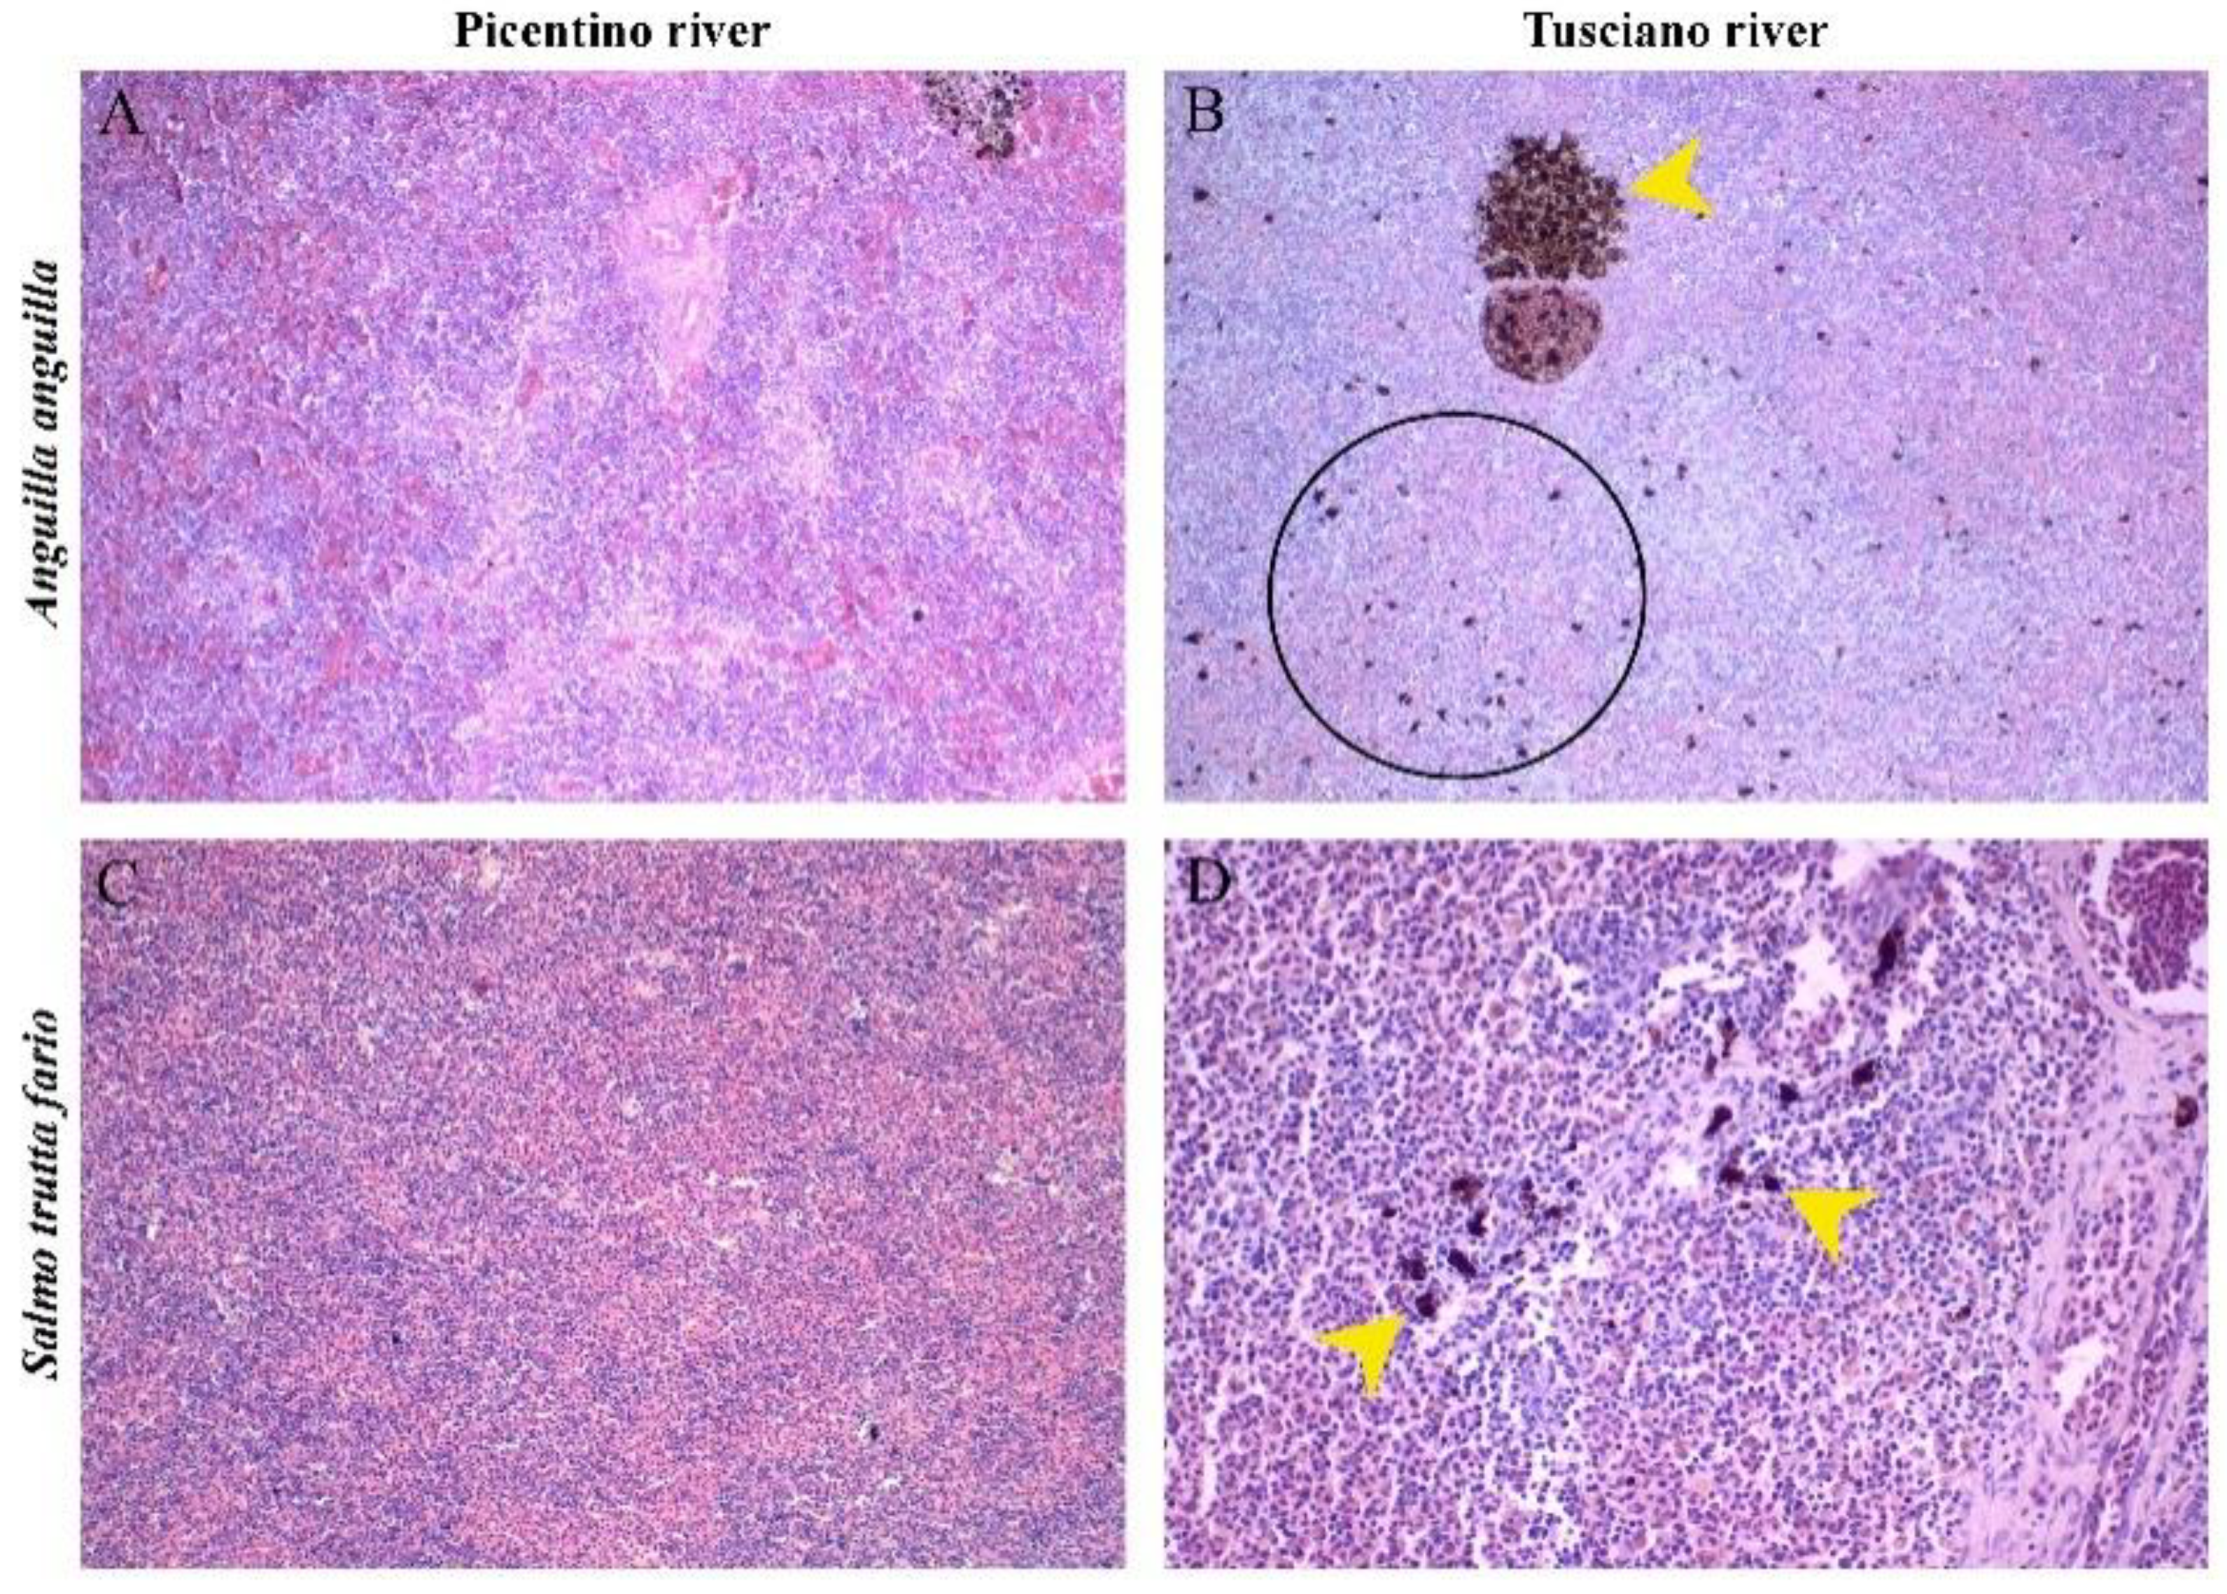
An altered tissue morphology was observed in the spleen of the European eel and Brown trout sampled in the Tusciano river. The main splenic histopathological changes identified included the presence of free melanomacrophages and hemosiderosis, the increase in connective tissue (fibrosis) and the increase in the number of MMC. MMC of the fish spleen represent one of the most important physiological characteristics to be evaluated in the biomonitoring studies of aquatic species. It has been reported that stressful conditions result in an increase in the number and size of splenic MMC [
18]. In the spleen, MMC are mainly located near the blood vessels and are an integral part of the immune system. In the presence of environmental pollution, an increase in MMC is expected, due to a robust phagocytic activity [
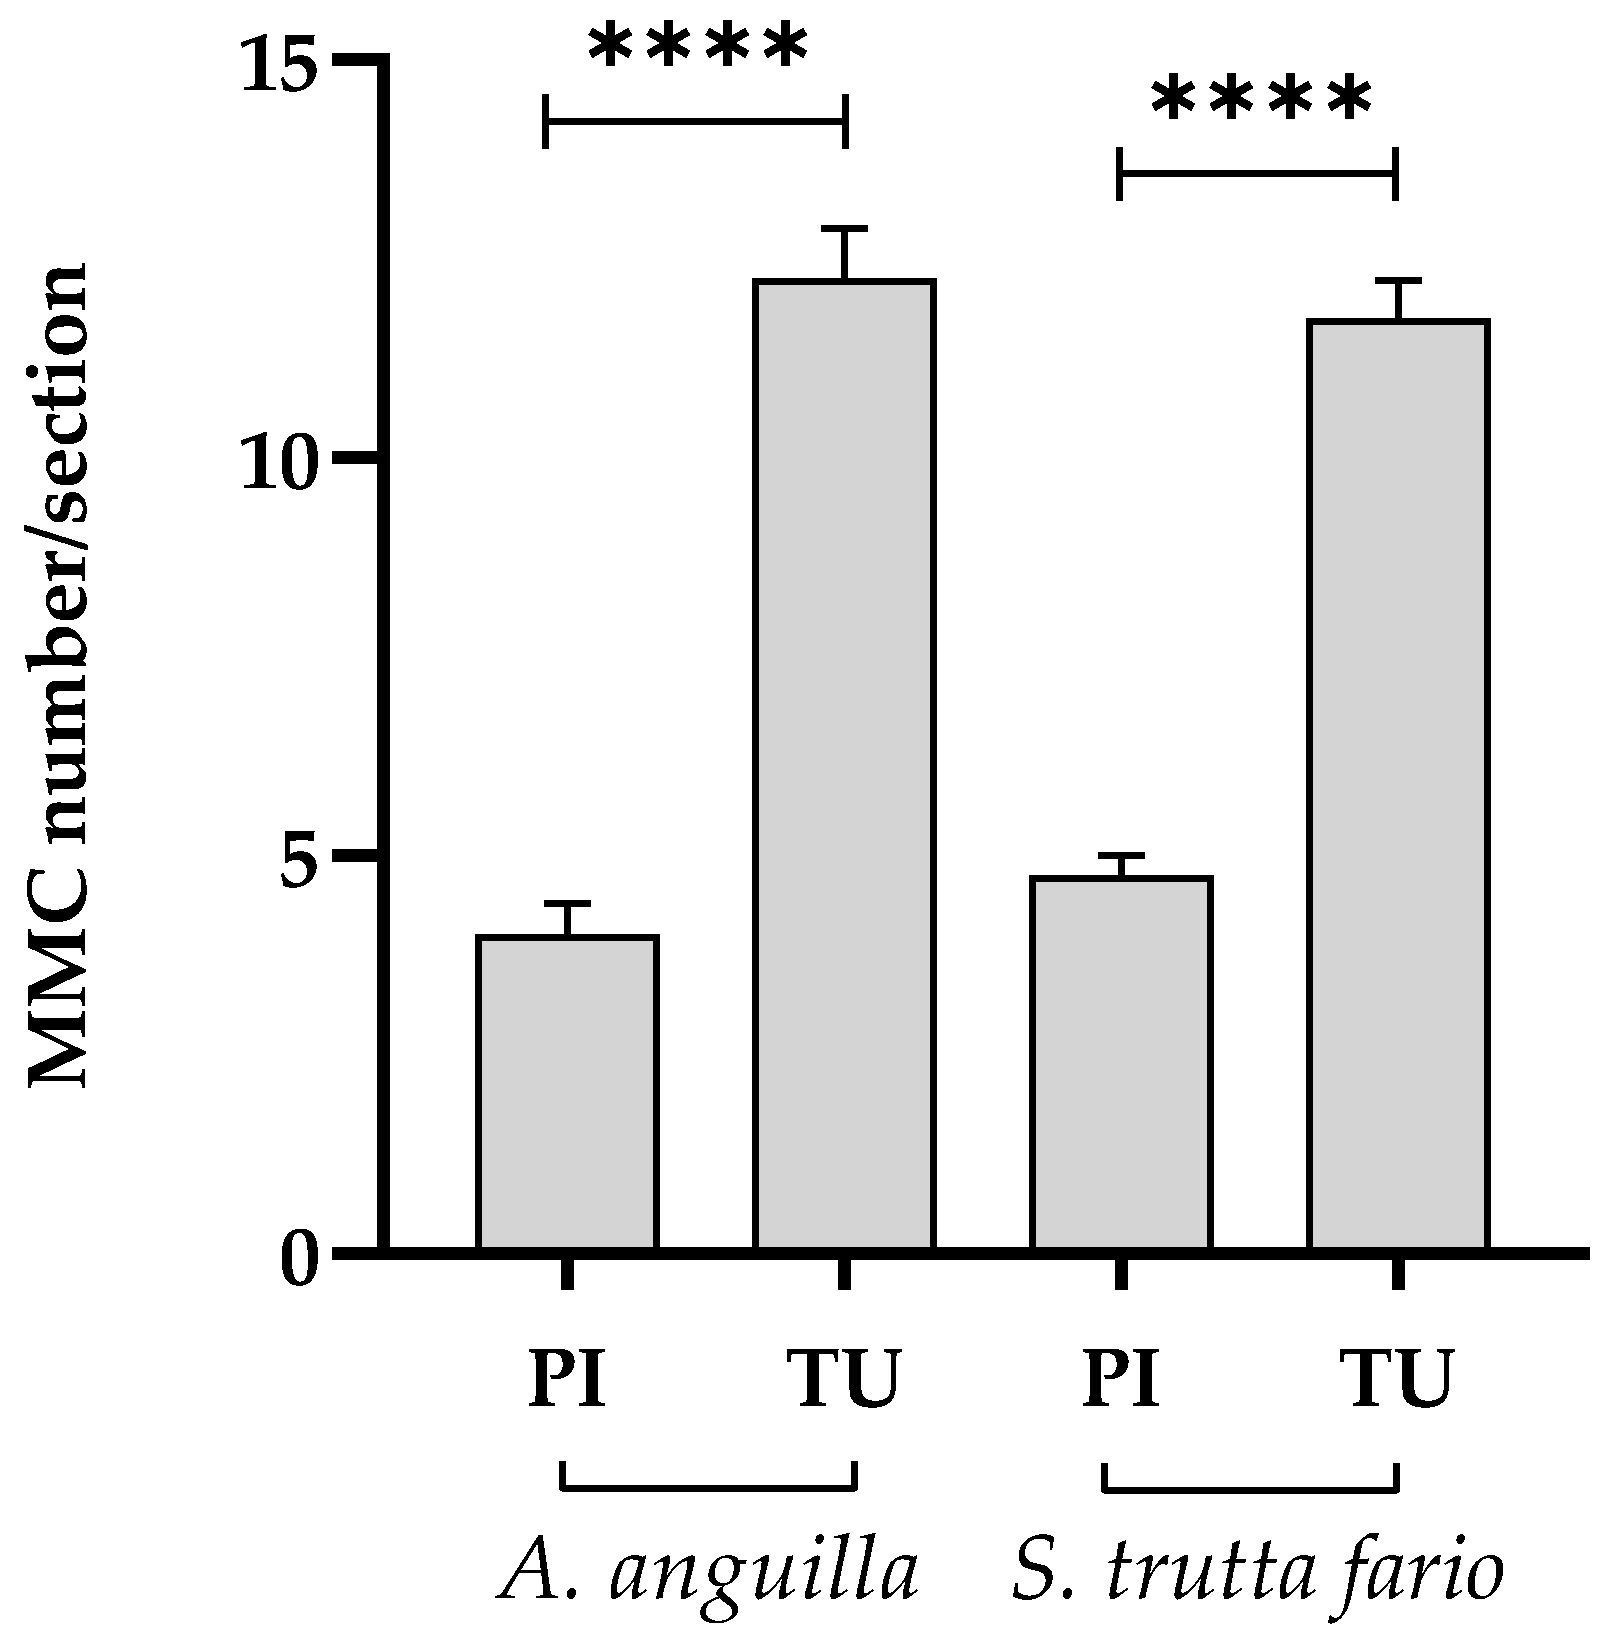
52]. Our results show an increase in the number of MMCs in the splenic sections of both fish species of the Tusciano river compared to Picentino river. These results, in agreement with the studies conducted by Araújo et al. [
53] and Passantino et al. [
54], suggest that the increase in splenic MMCs in fish from the Tusciano river may be linked to the exposure to aquatic contaminants.
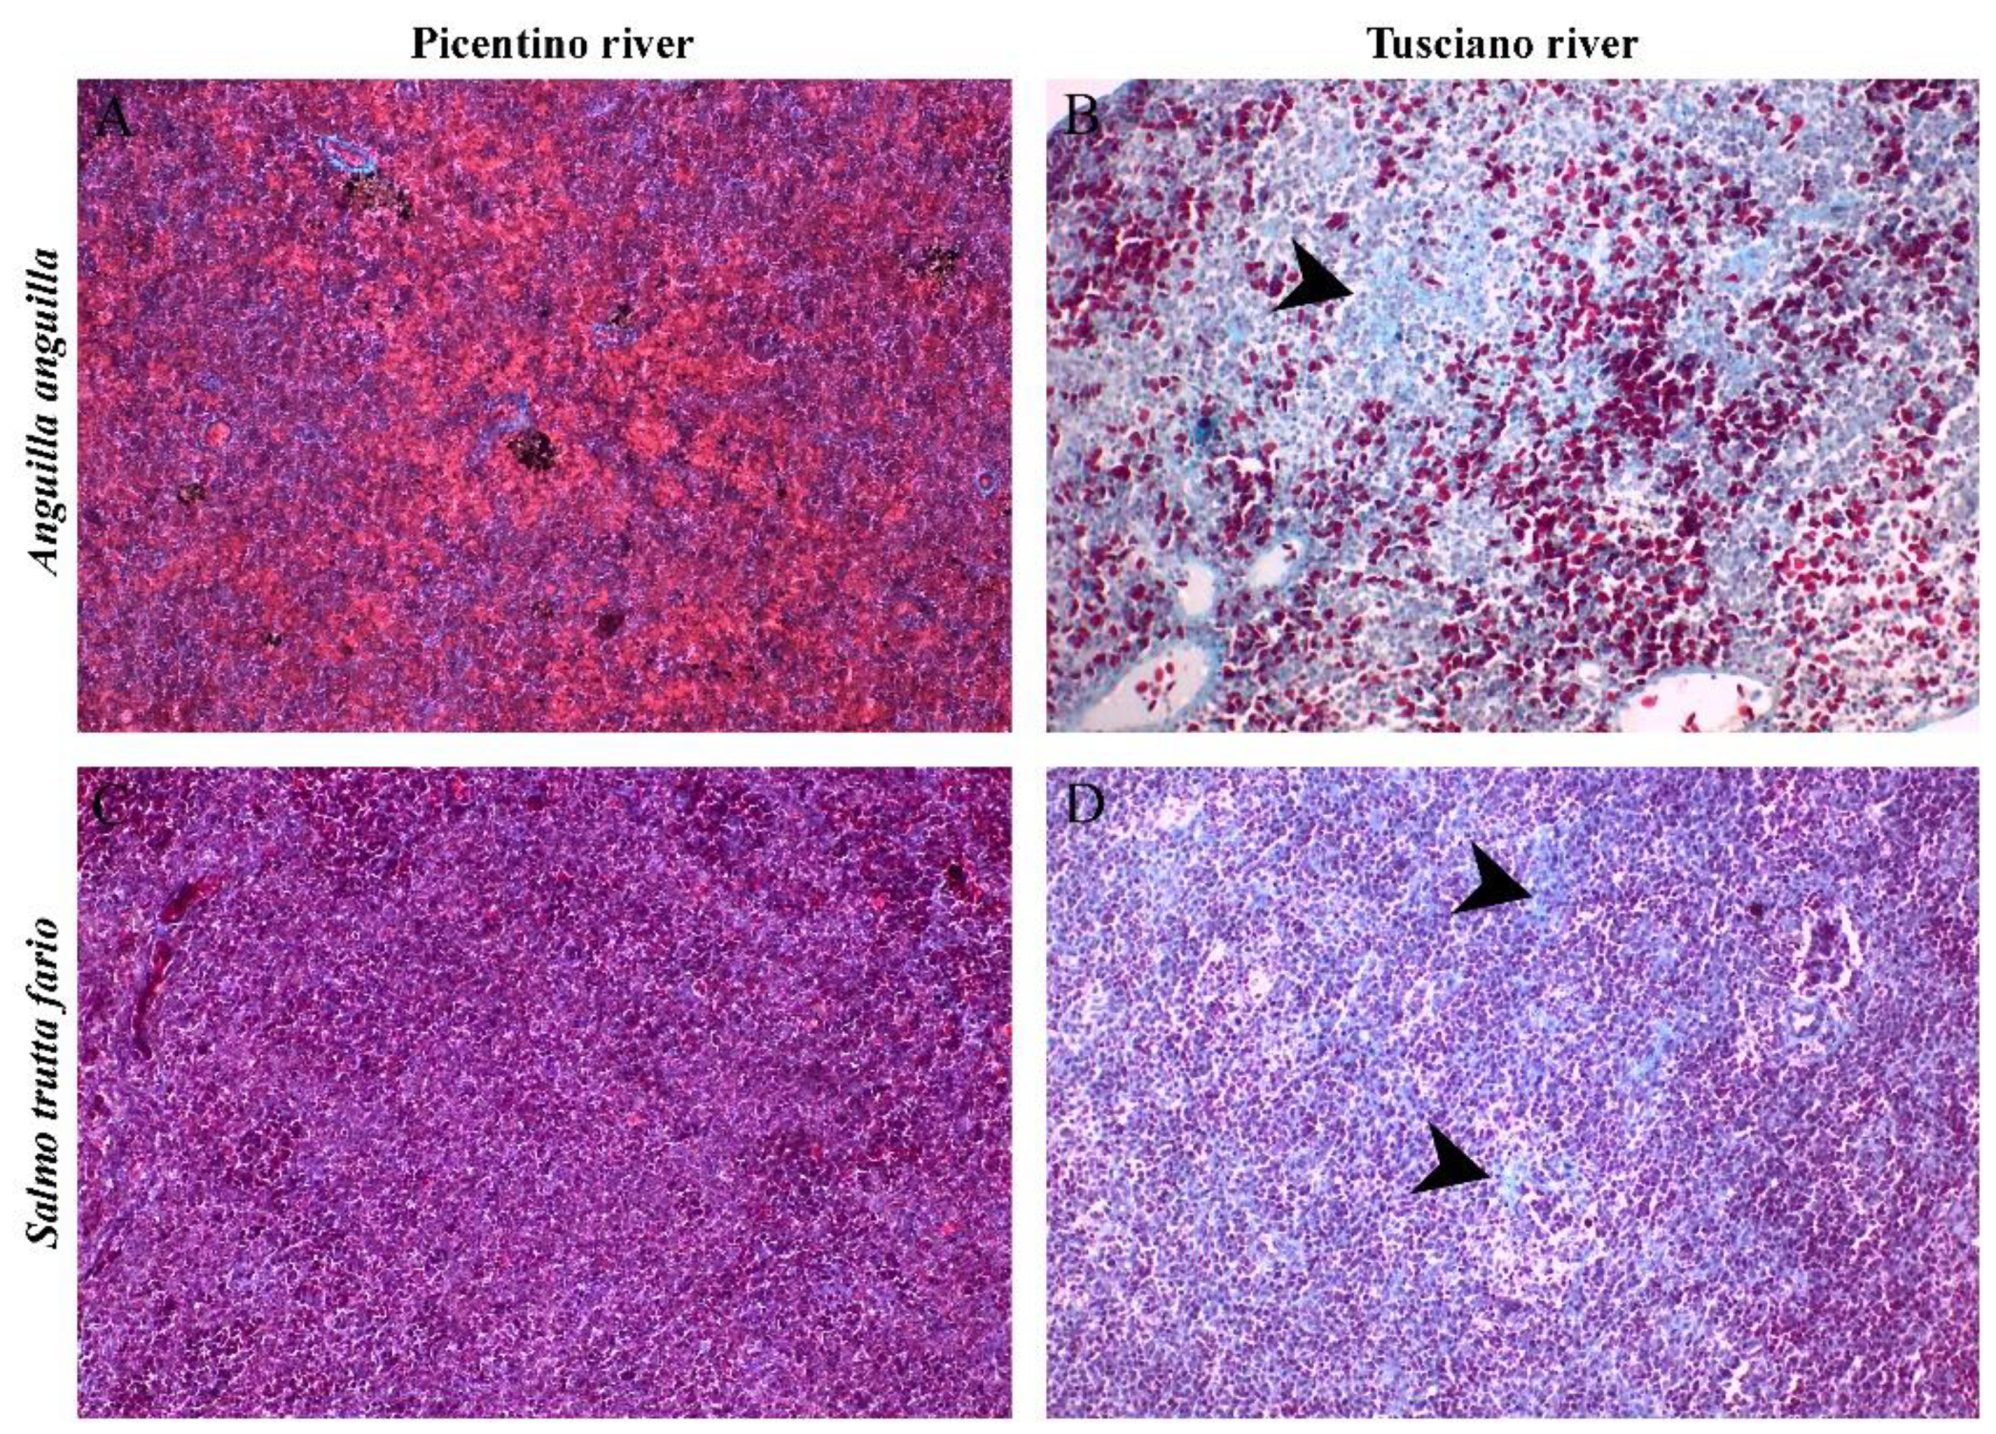
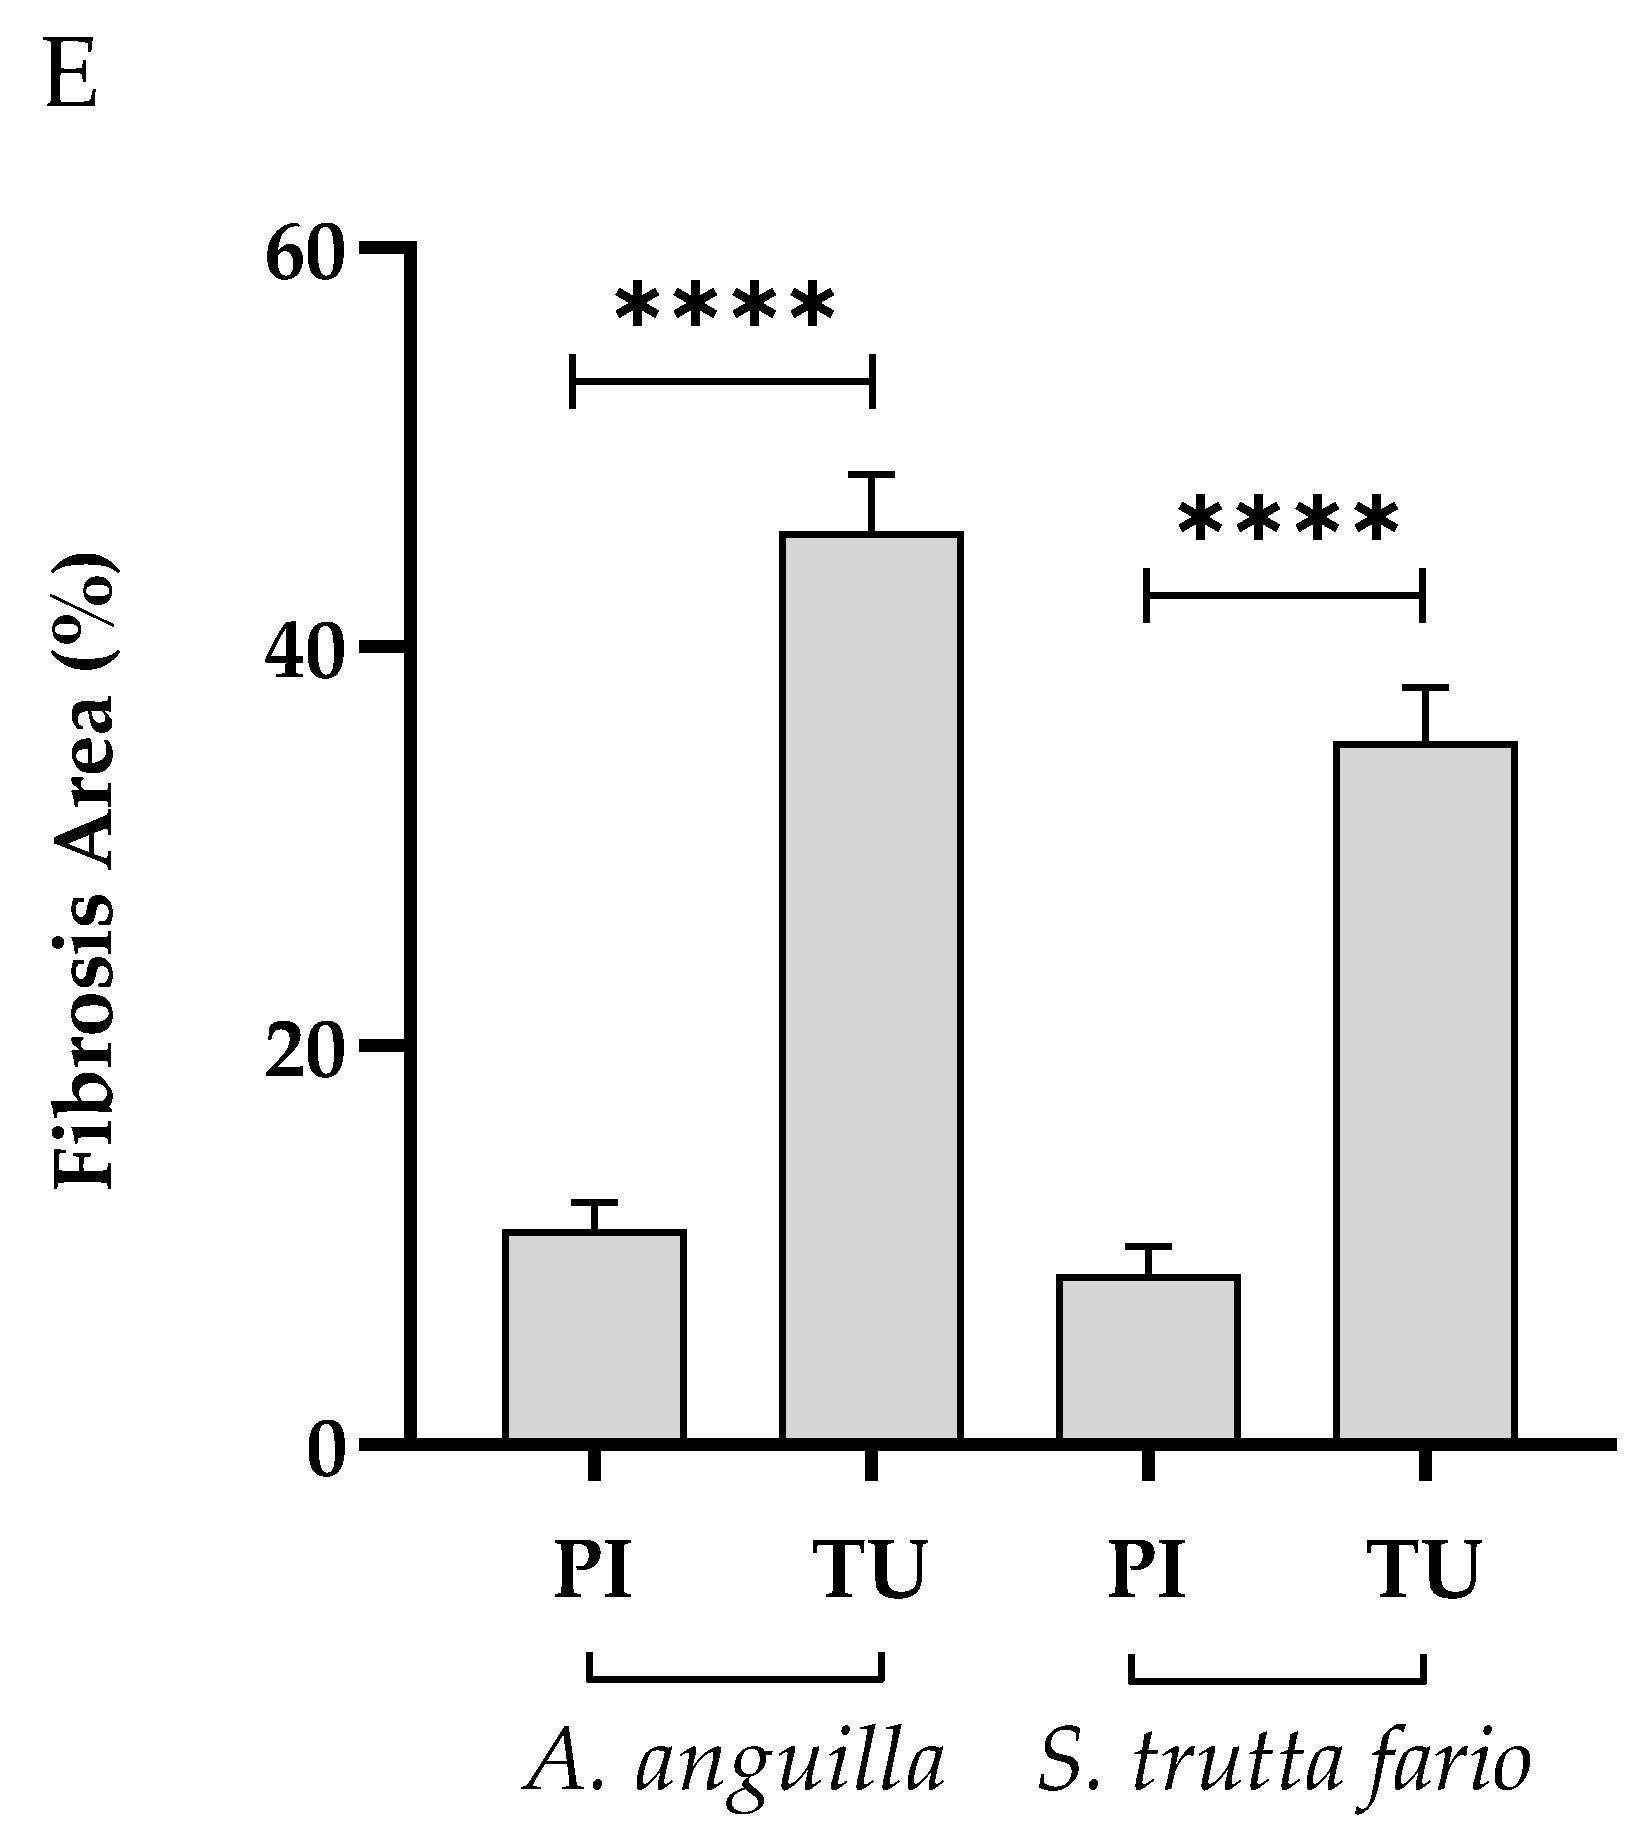
Both Europen eel and Brown trout from Tusciano river showed a high presence of connective tissue (a condition called fibrosis) in the splenic sections examined. Similar levels of fibrosis have been documented in fish exposed to different pollutants, including pesticides [
55,
56], heavy metal [
18,
57] and contaminating waste [
58]. Studies conducted by Vieira et al. [
59] and Nai et al. [
60] report that exposure to high concentrations of heavy metals (such as lead, mercury, chromium and nickel), alter ion homeostasis and induce DNA damage, causing various diseases, including fibrosis splenic. Histological analysis of the spleen, therefore, detecting large areas of fibrosis, suggests a potential exposure to pollutants in fish from the Tusciano river compared to those sampled in the Picentino river.
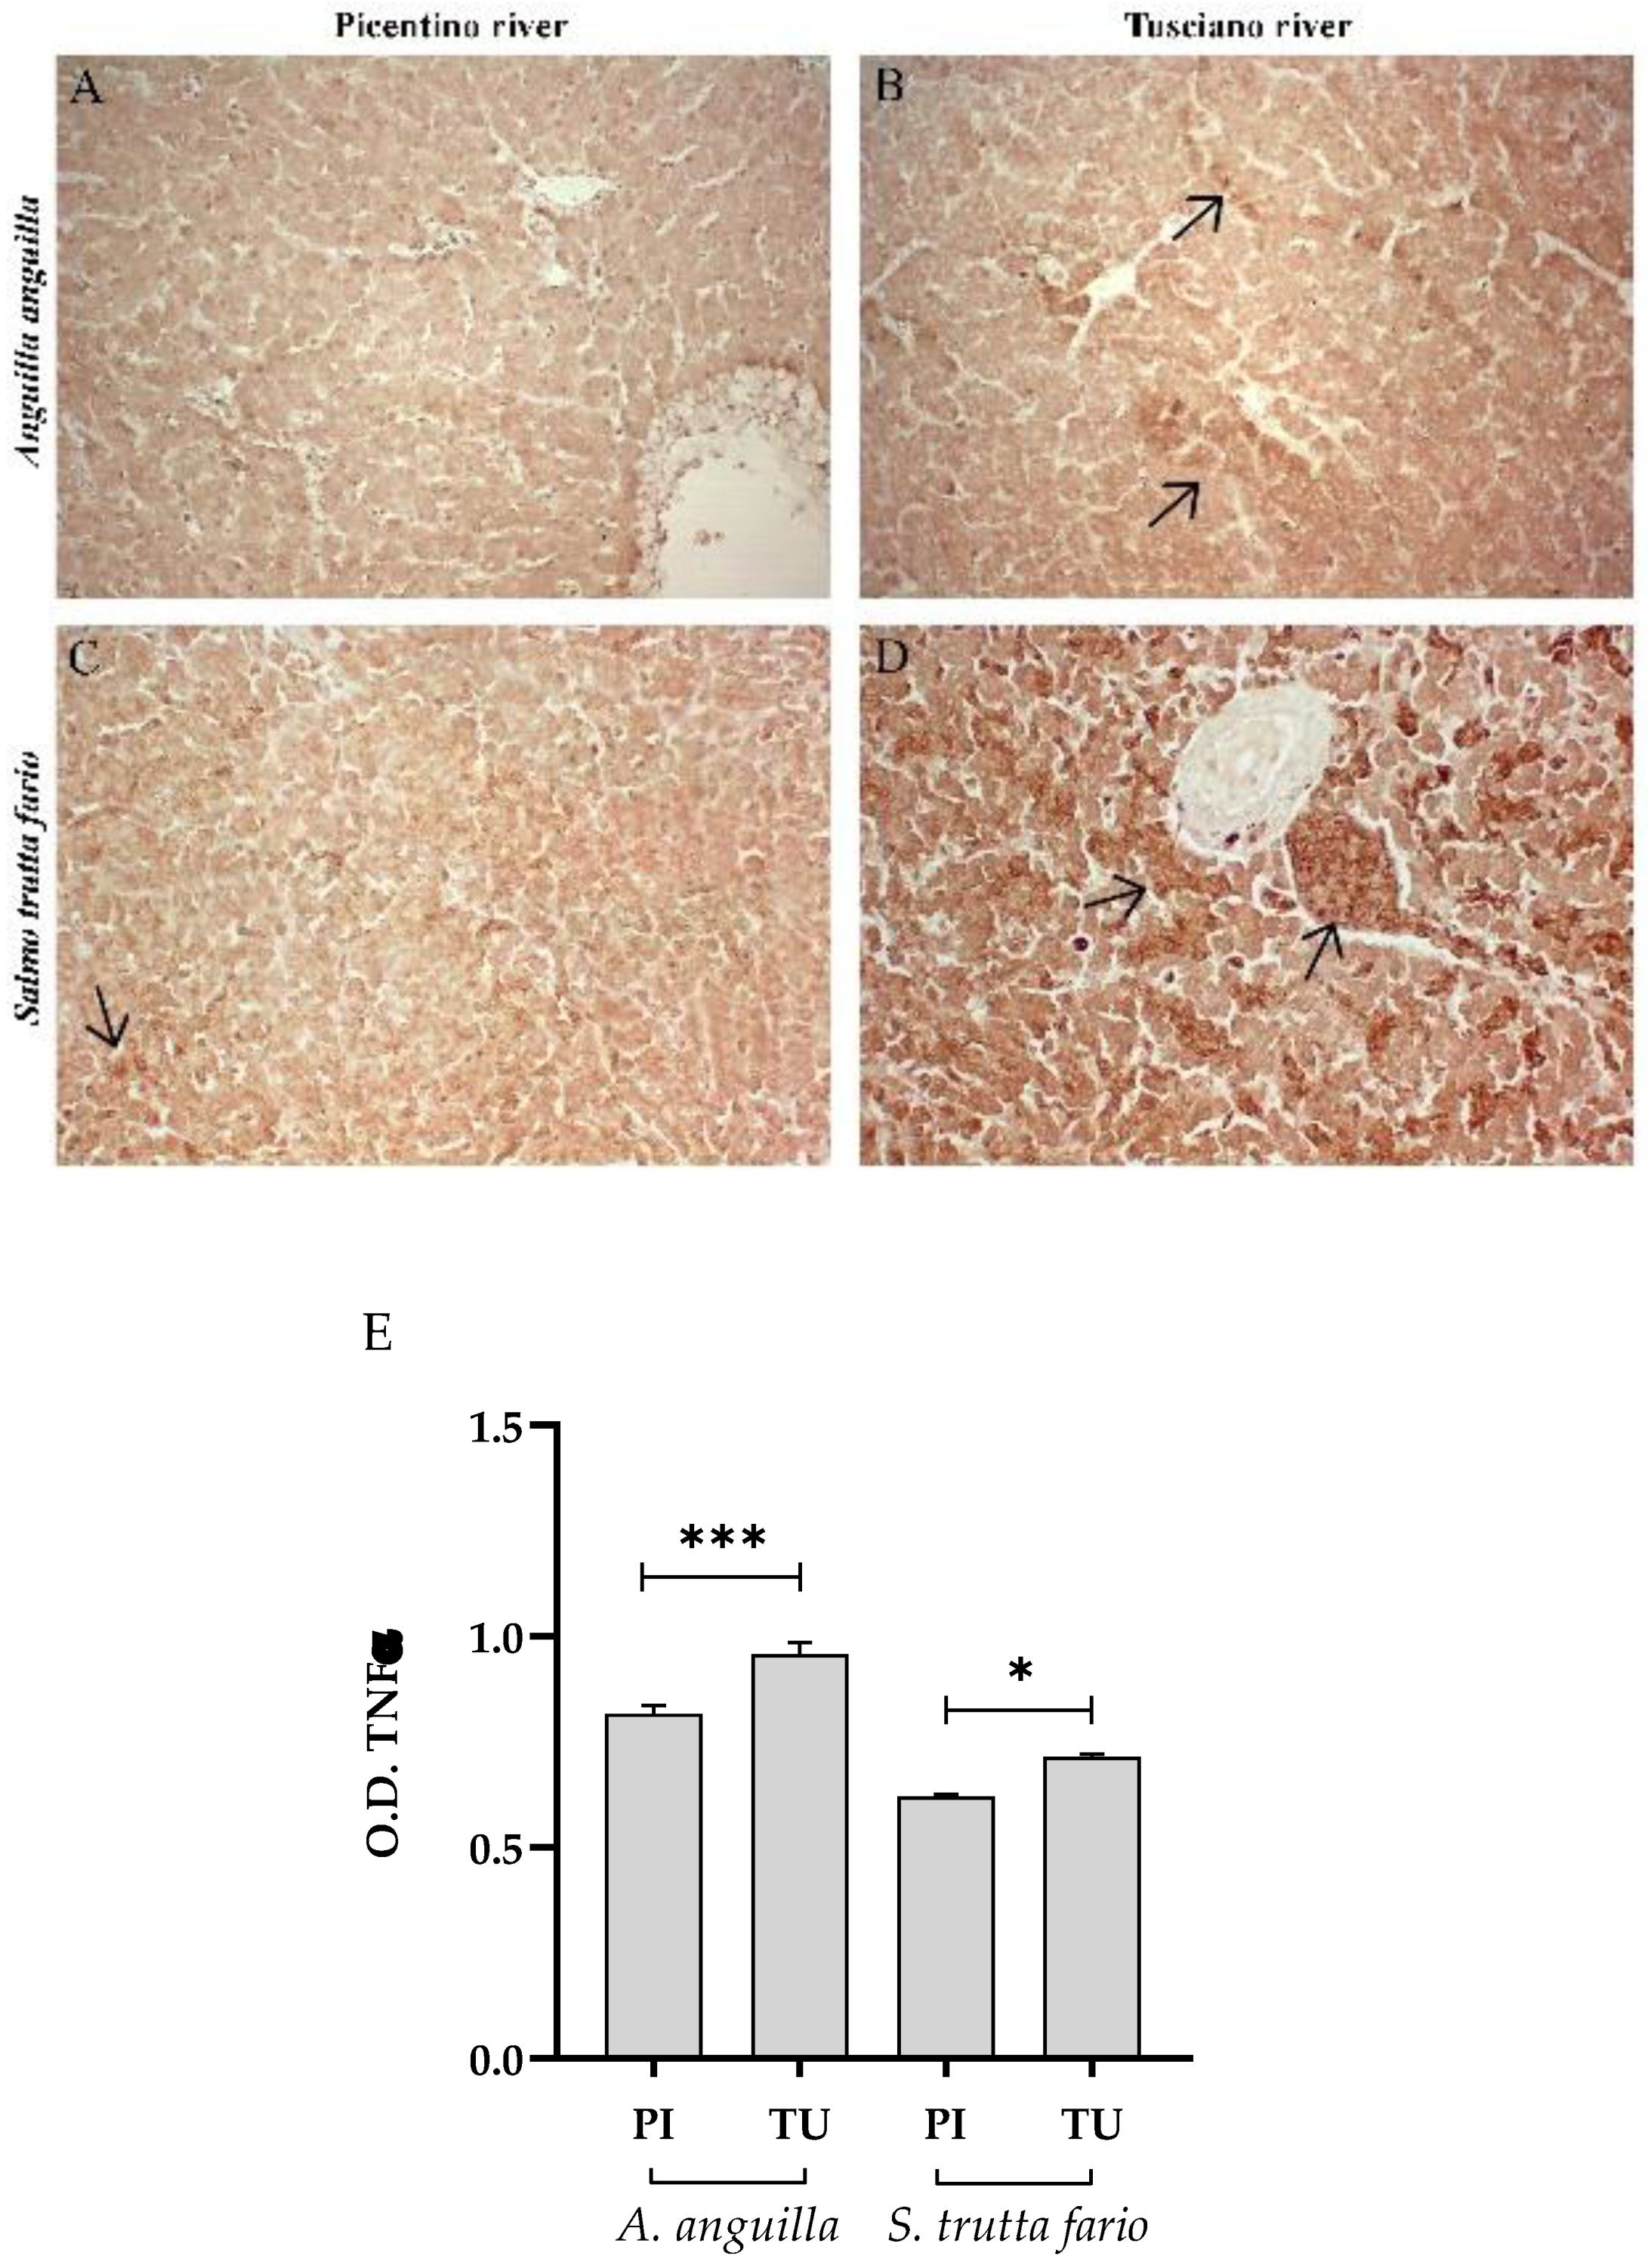
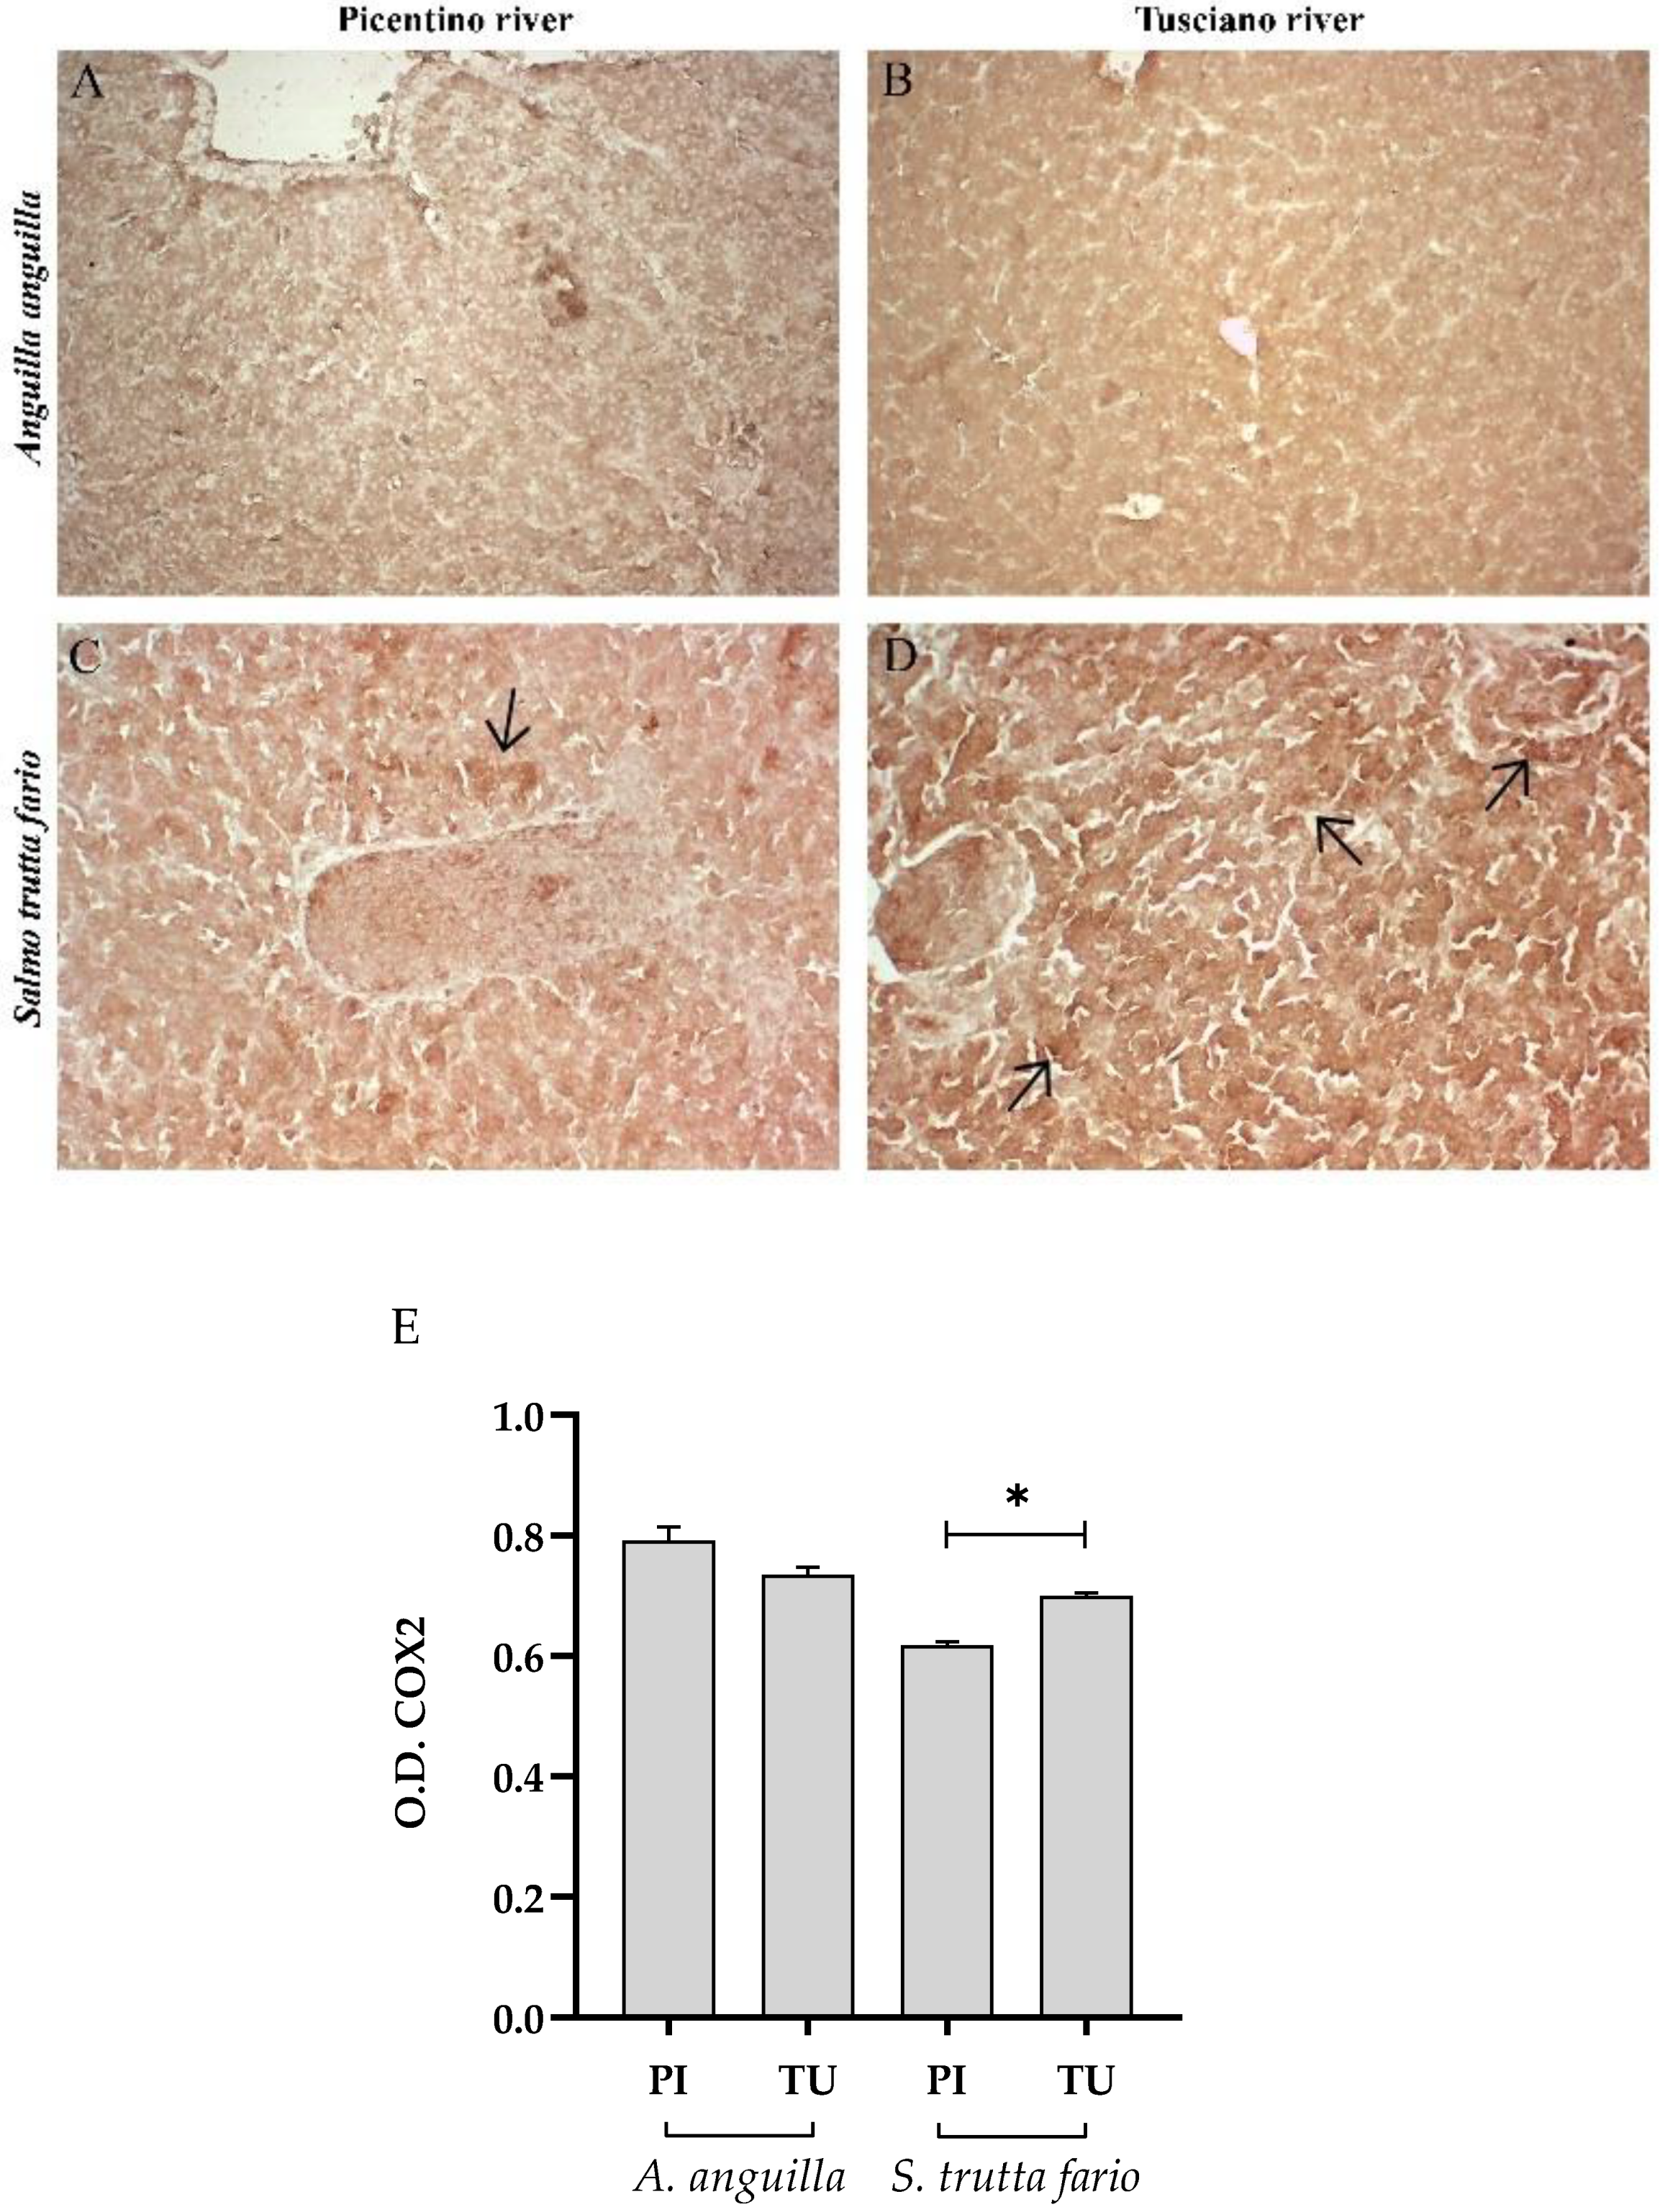
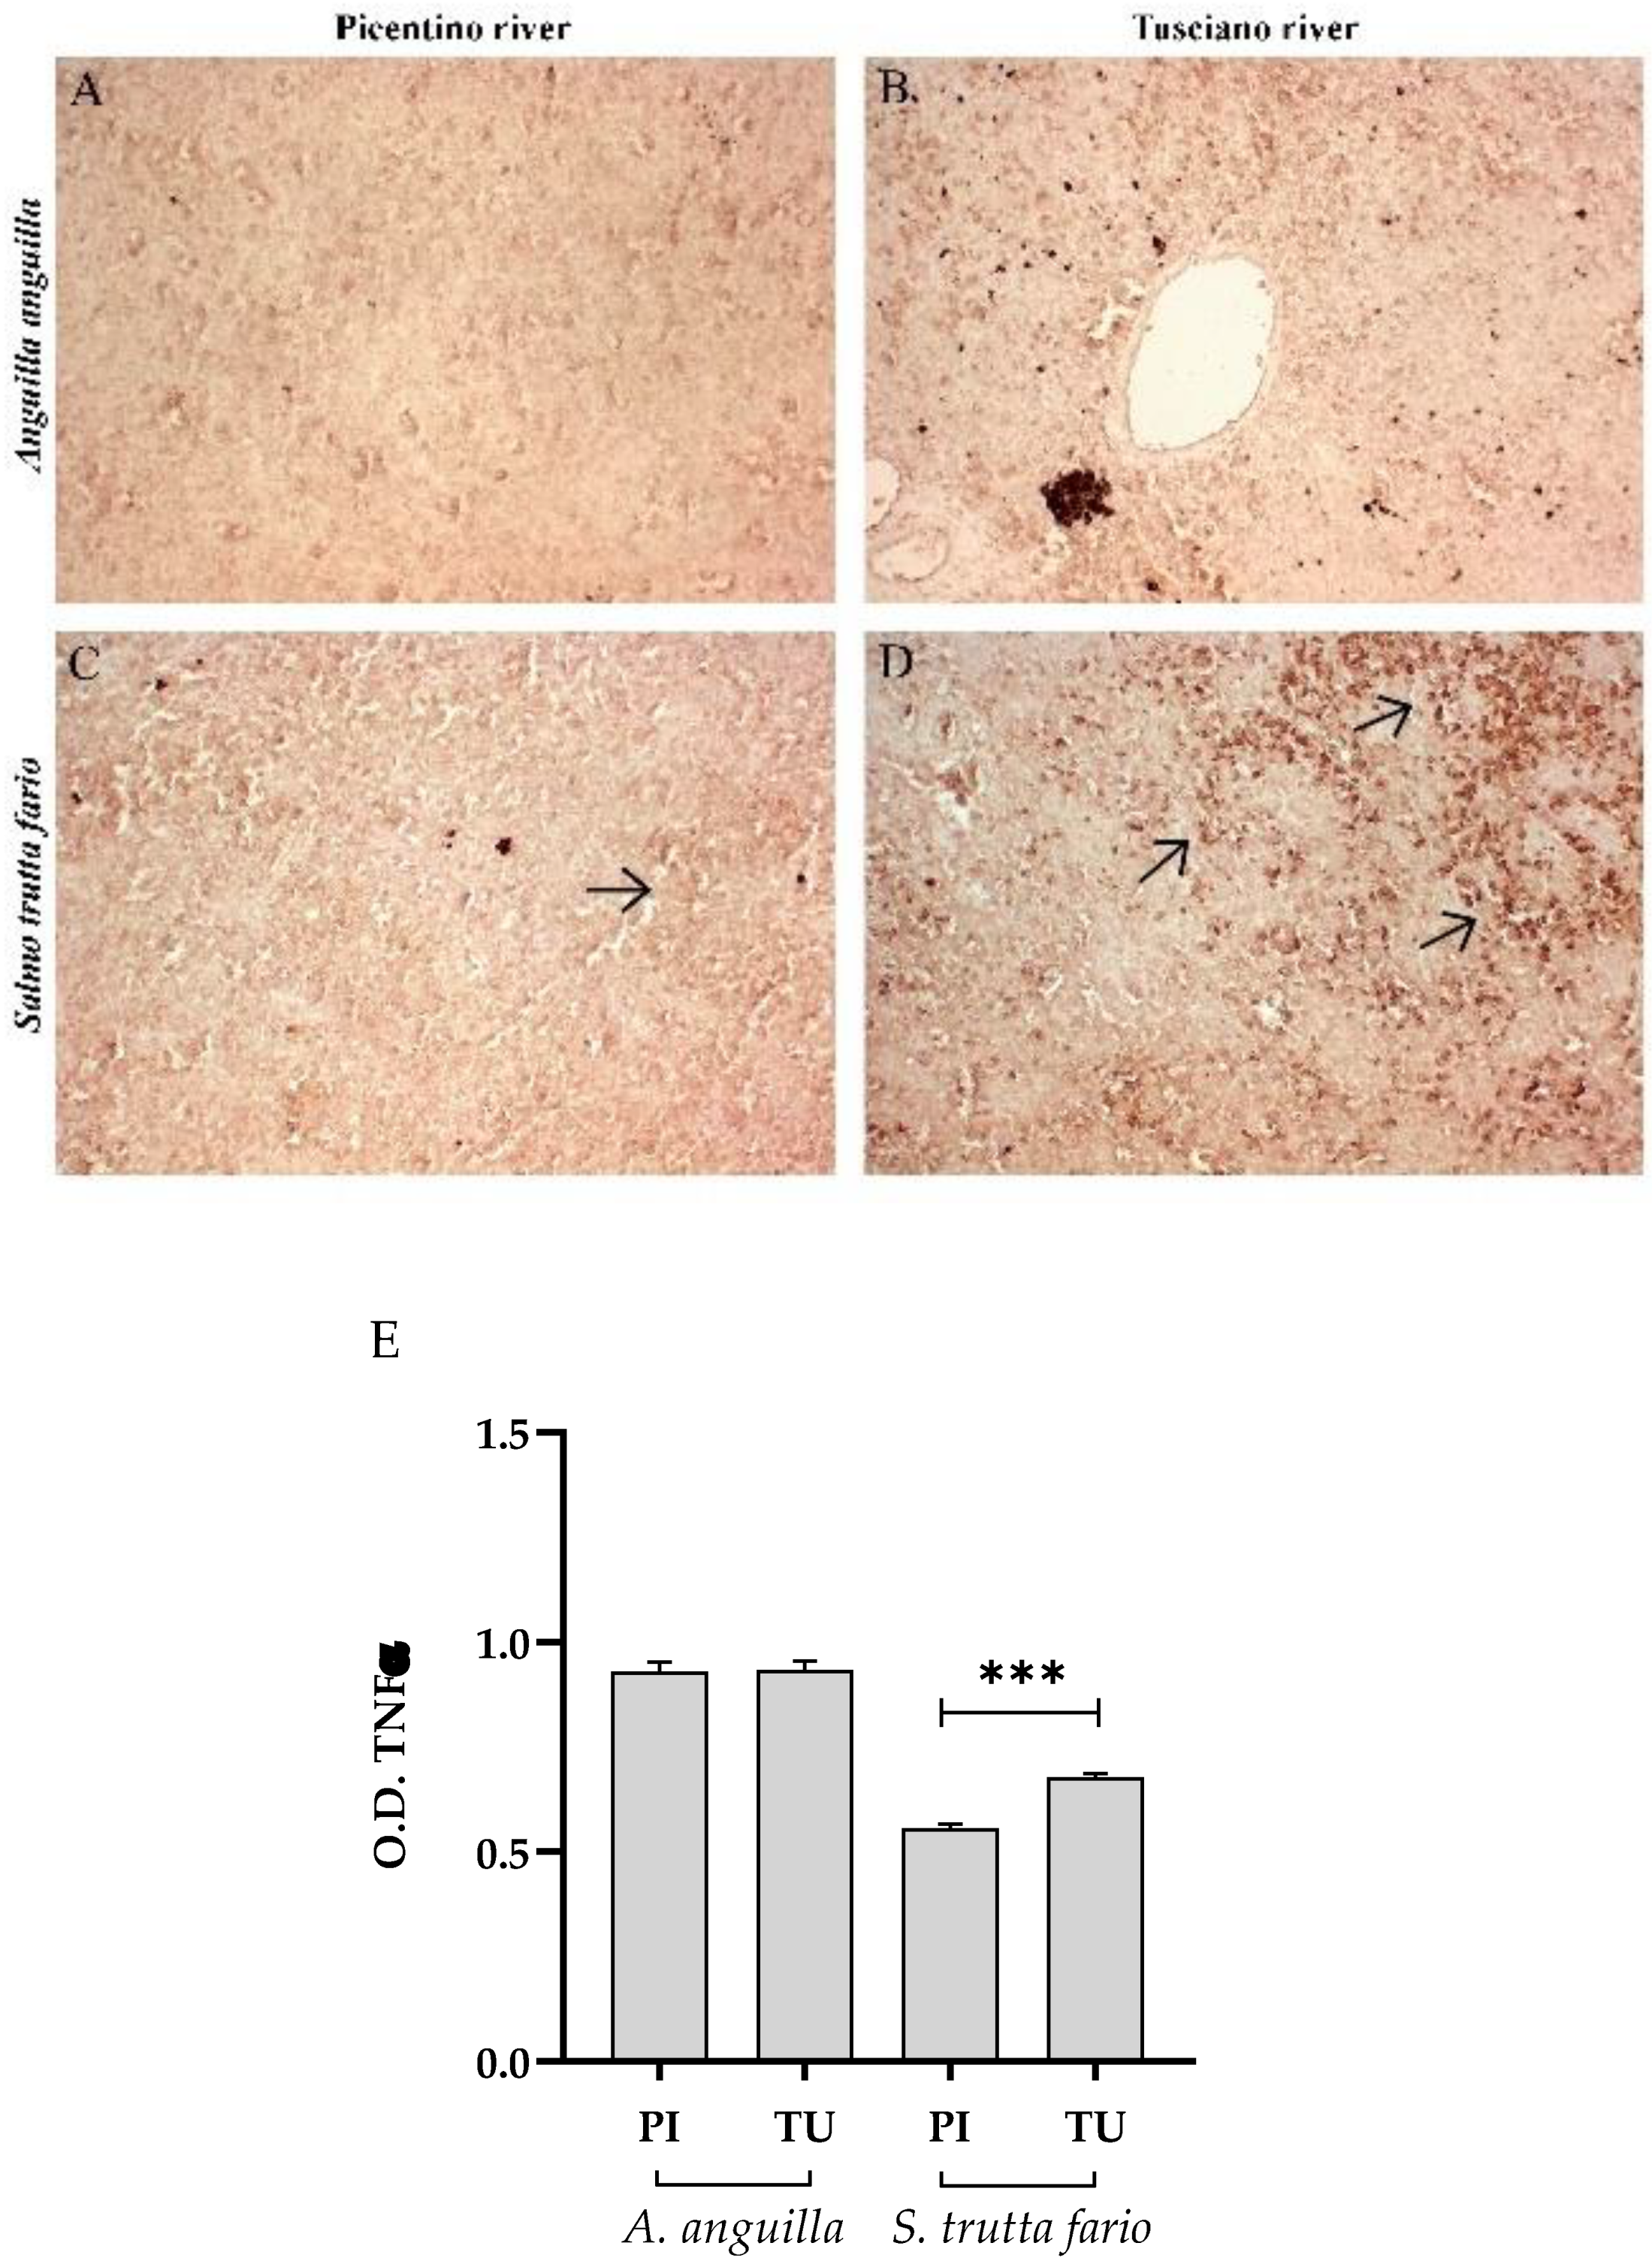
Since the liver and spleen histopathological investigations suggested the presence of morphological damage, we decided to carry on an immunohistochemical analysis to monitor the inflammation and the antioxidant defense status. The hepatic and splenic immunohistochemical results suggest the presence of an inflammatory state in both European eel and Brown trout living in the Tusciano river. TNFα is an important pro-inflammatory cytokine involved in several activities, such as cell proliferation, inflammation and apoptosis [
61]. An increasing number of scientific research reports that exposure to environmental contaminants affect the expression and function of TNFα [
1,
23]. Similarly, the enzyme COX2, being induced by inflammatory stimuli such as bacterial endotoxins and cytokines, is closely linked to the fish innate immune response [
62] and its expression increases in the presence of tissue damage [
63].
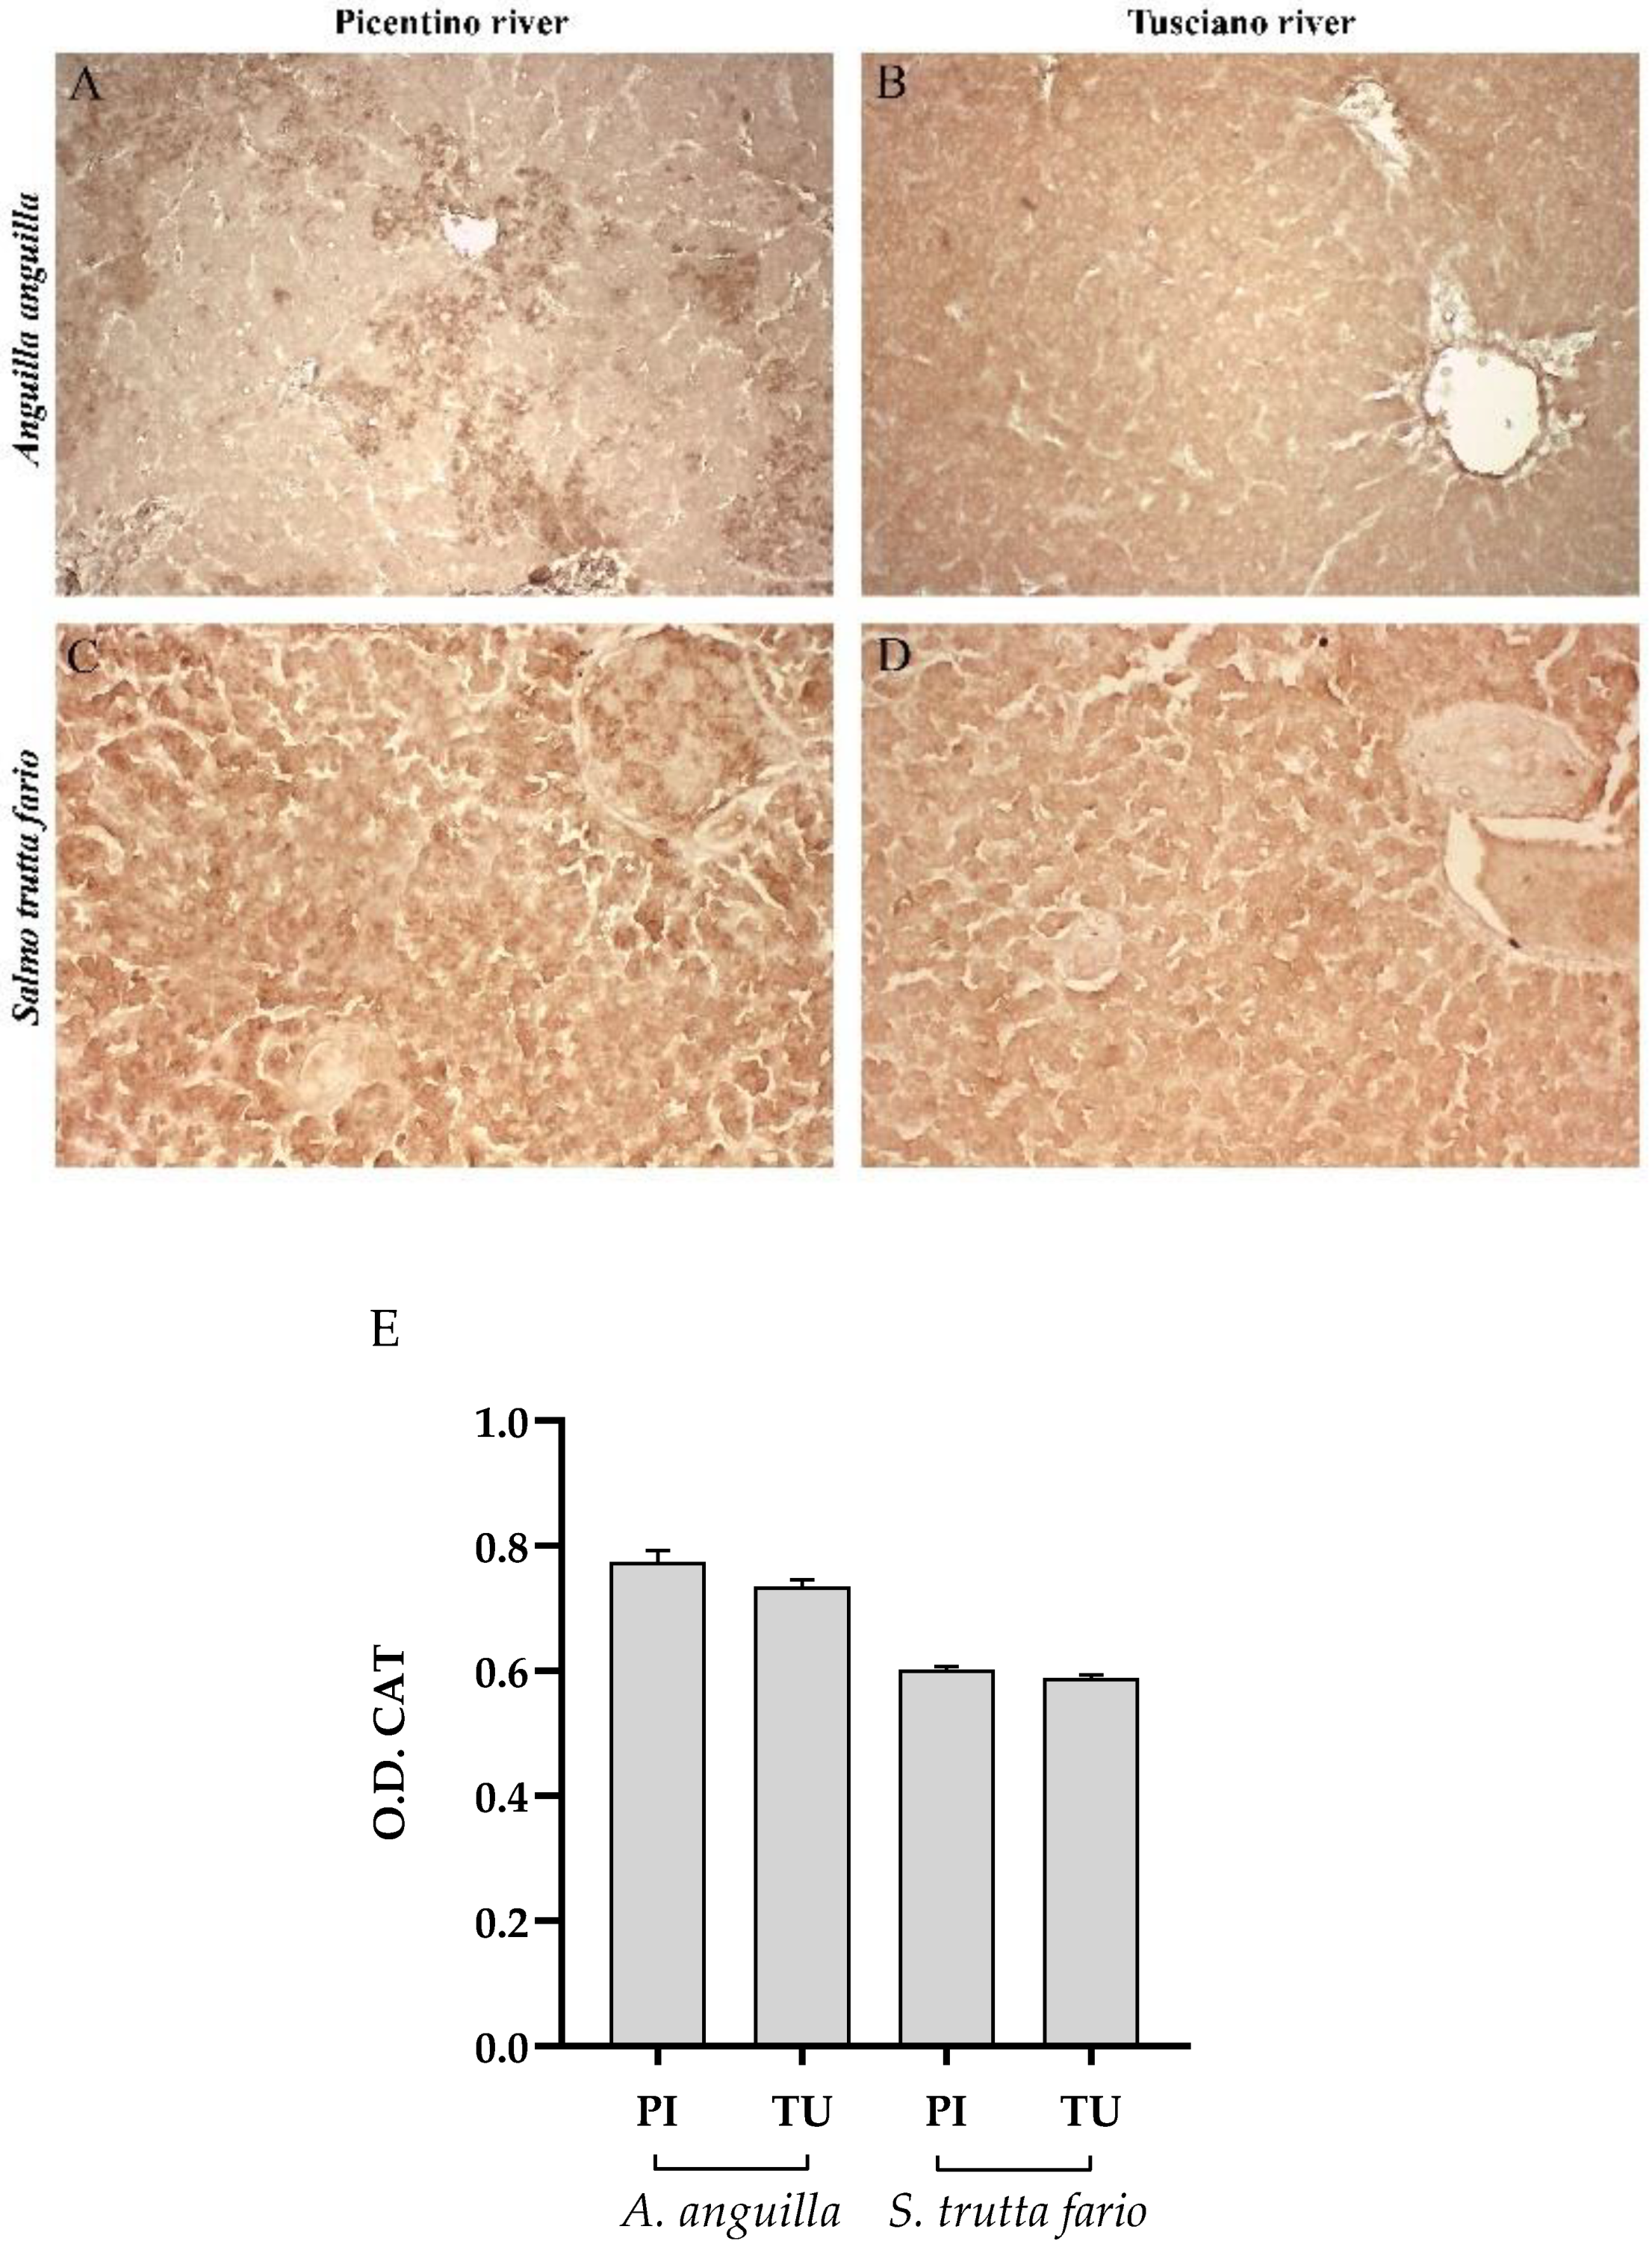
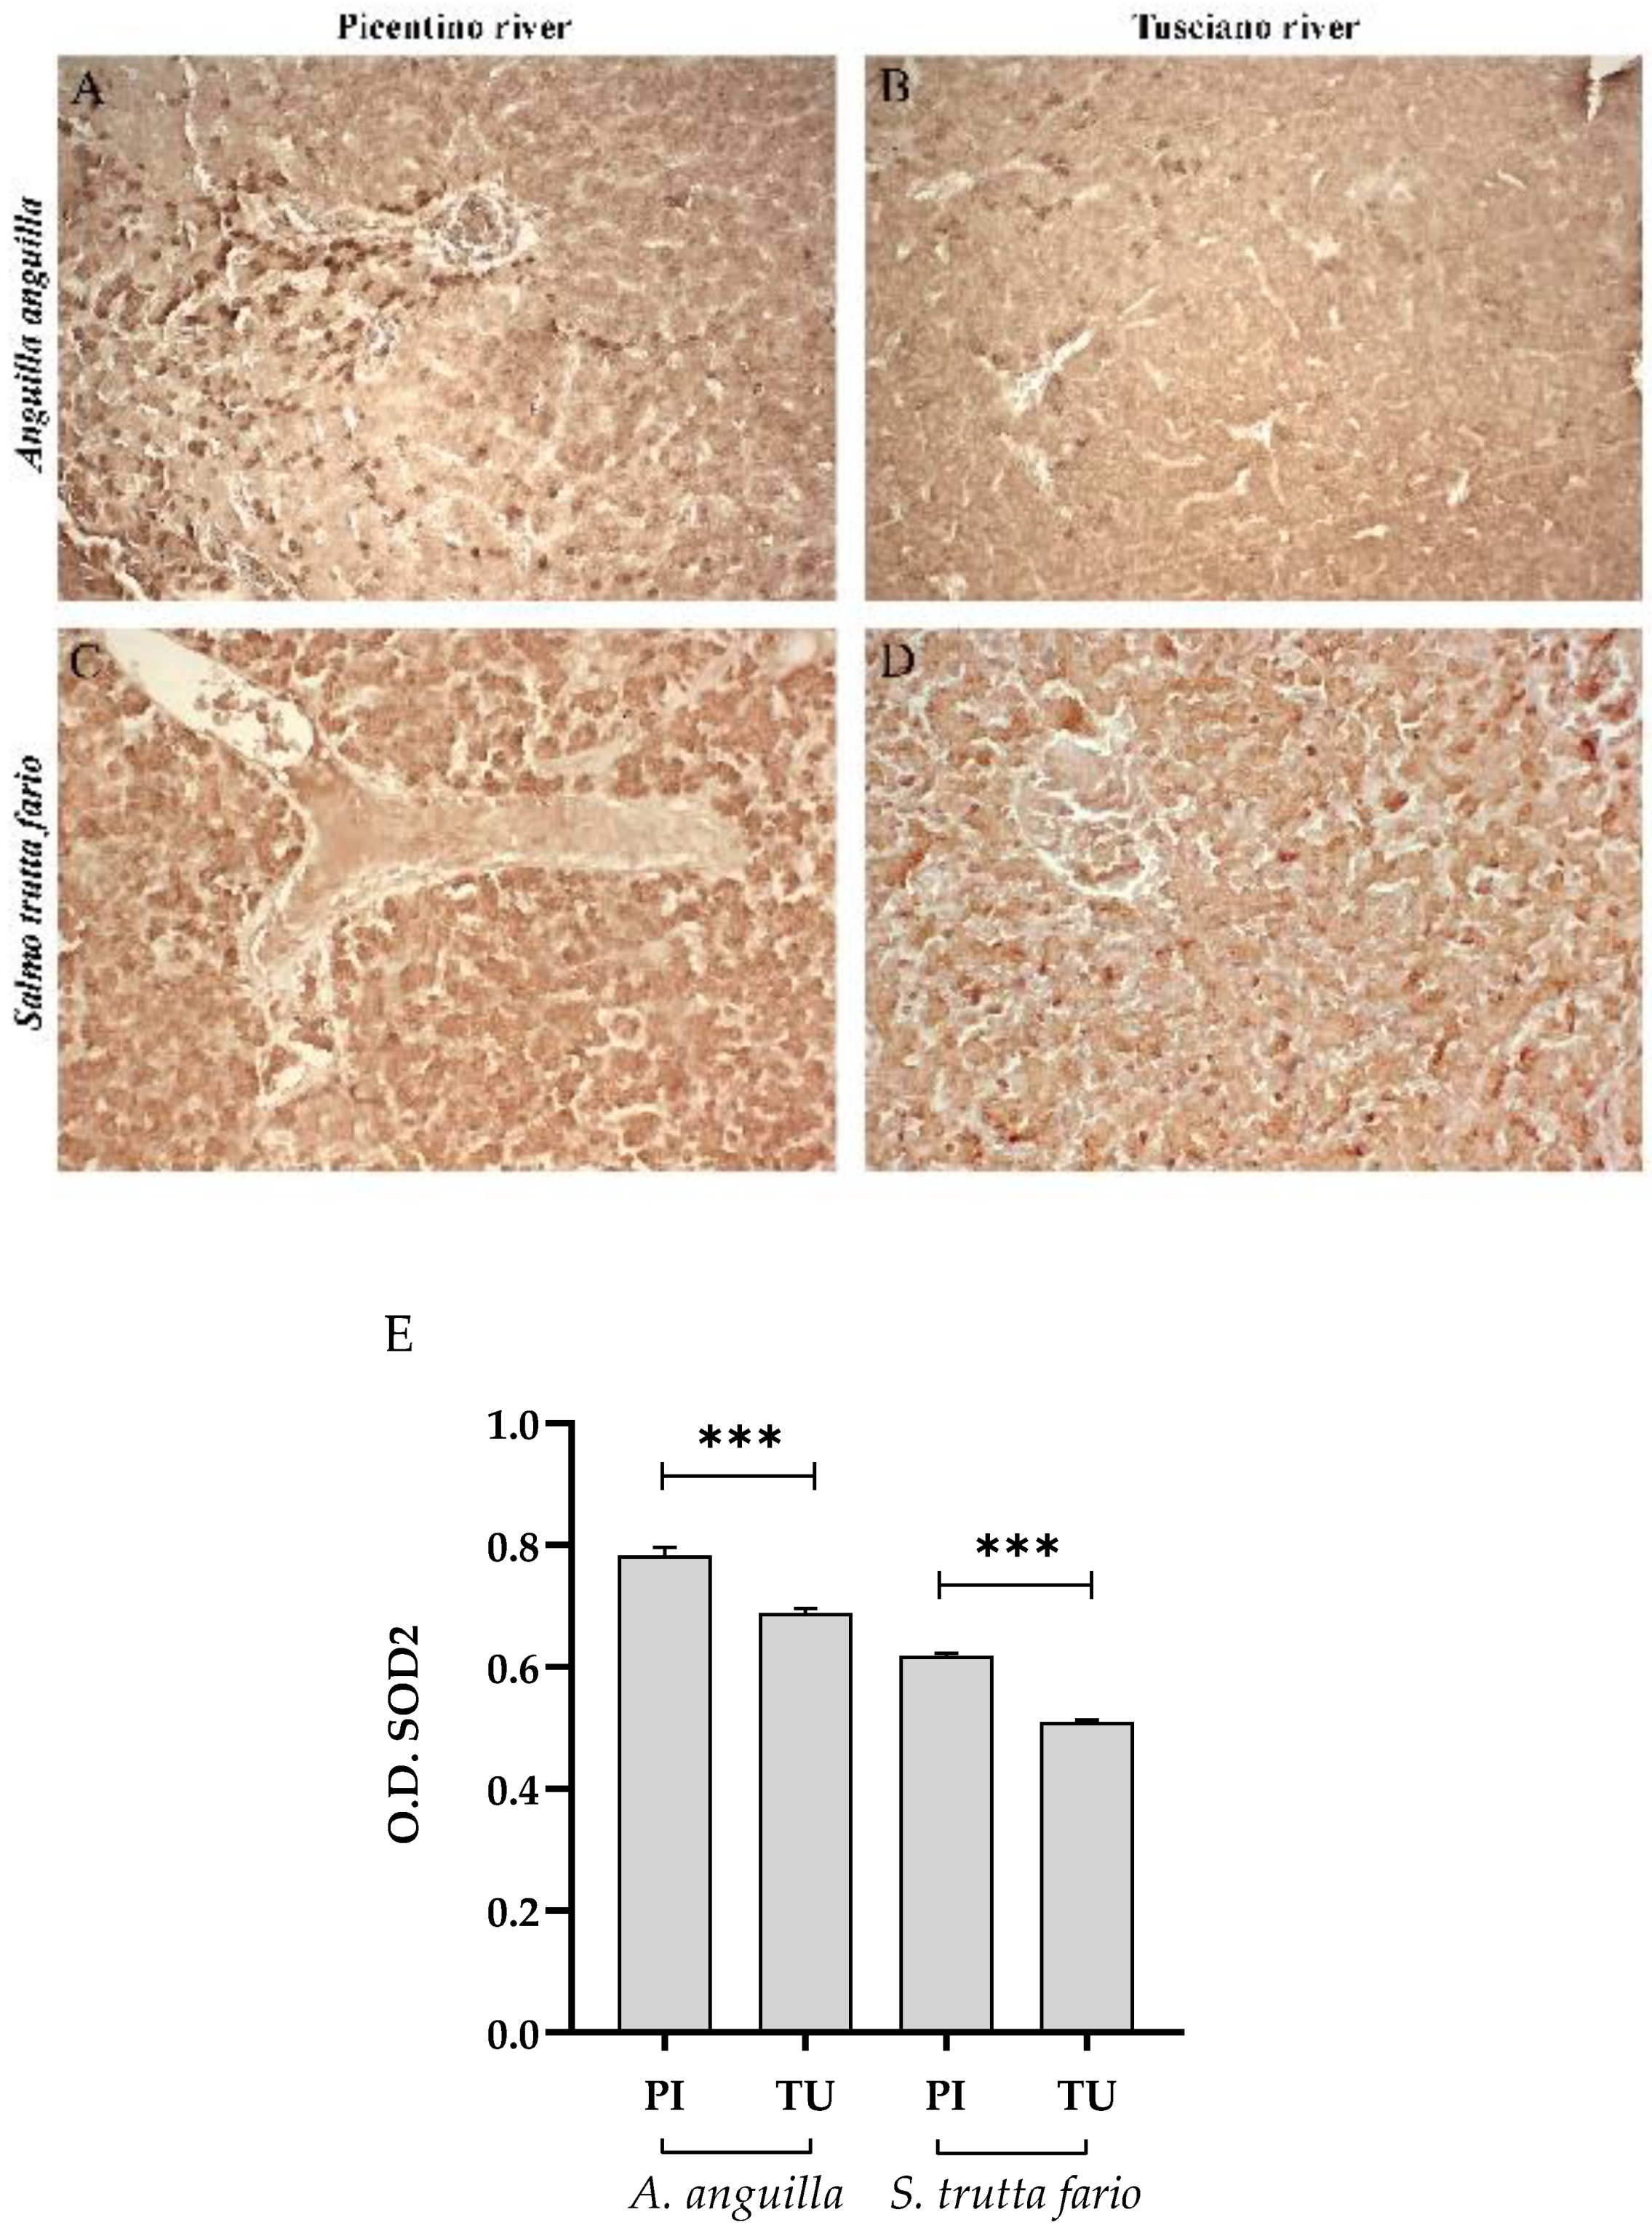
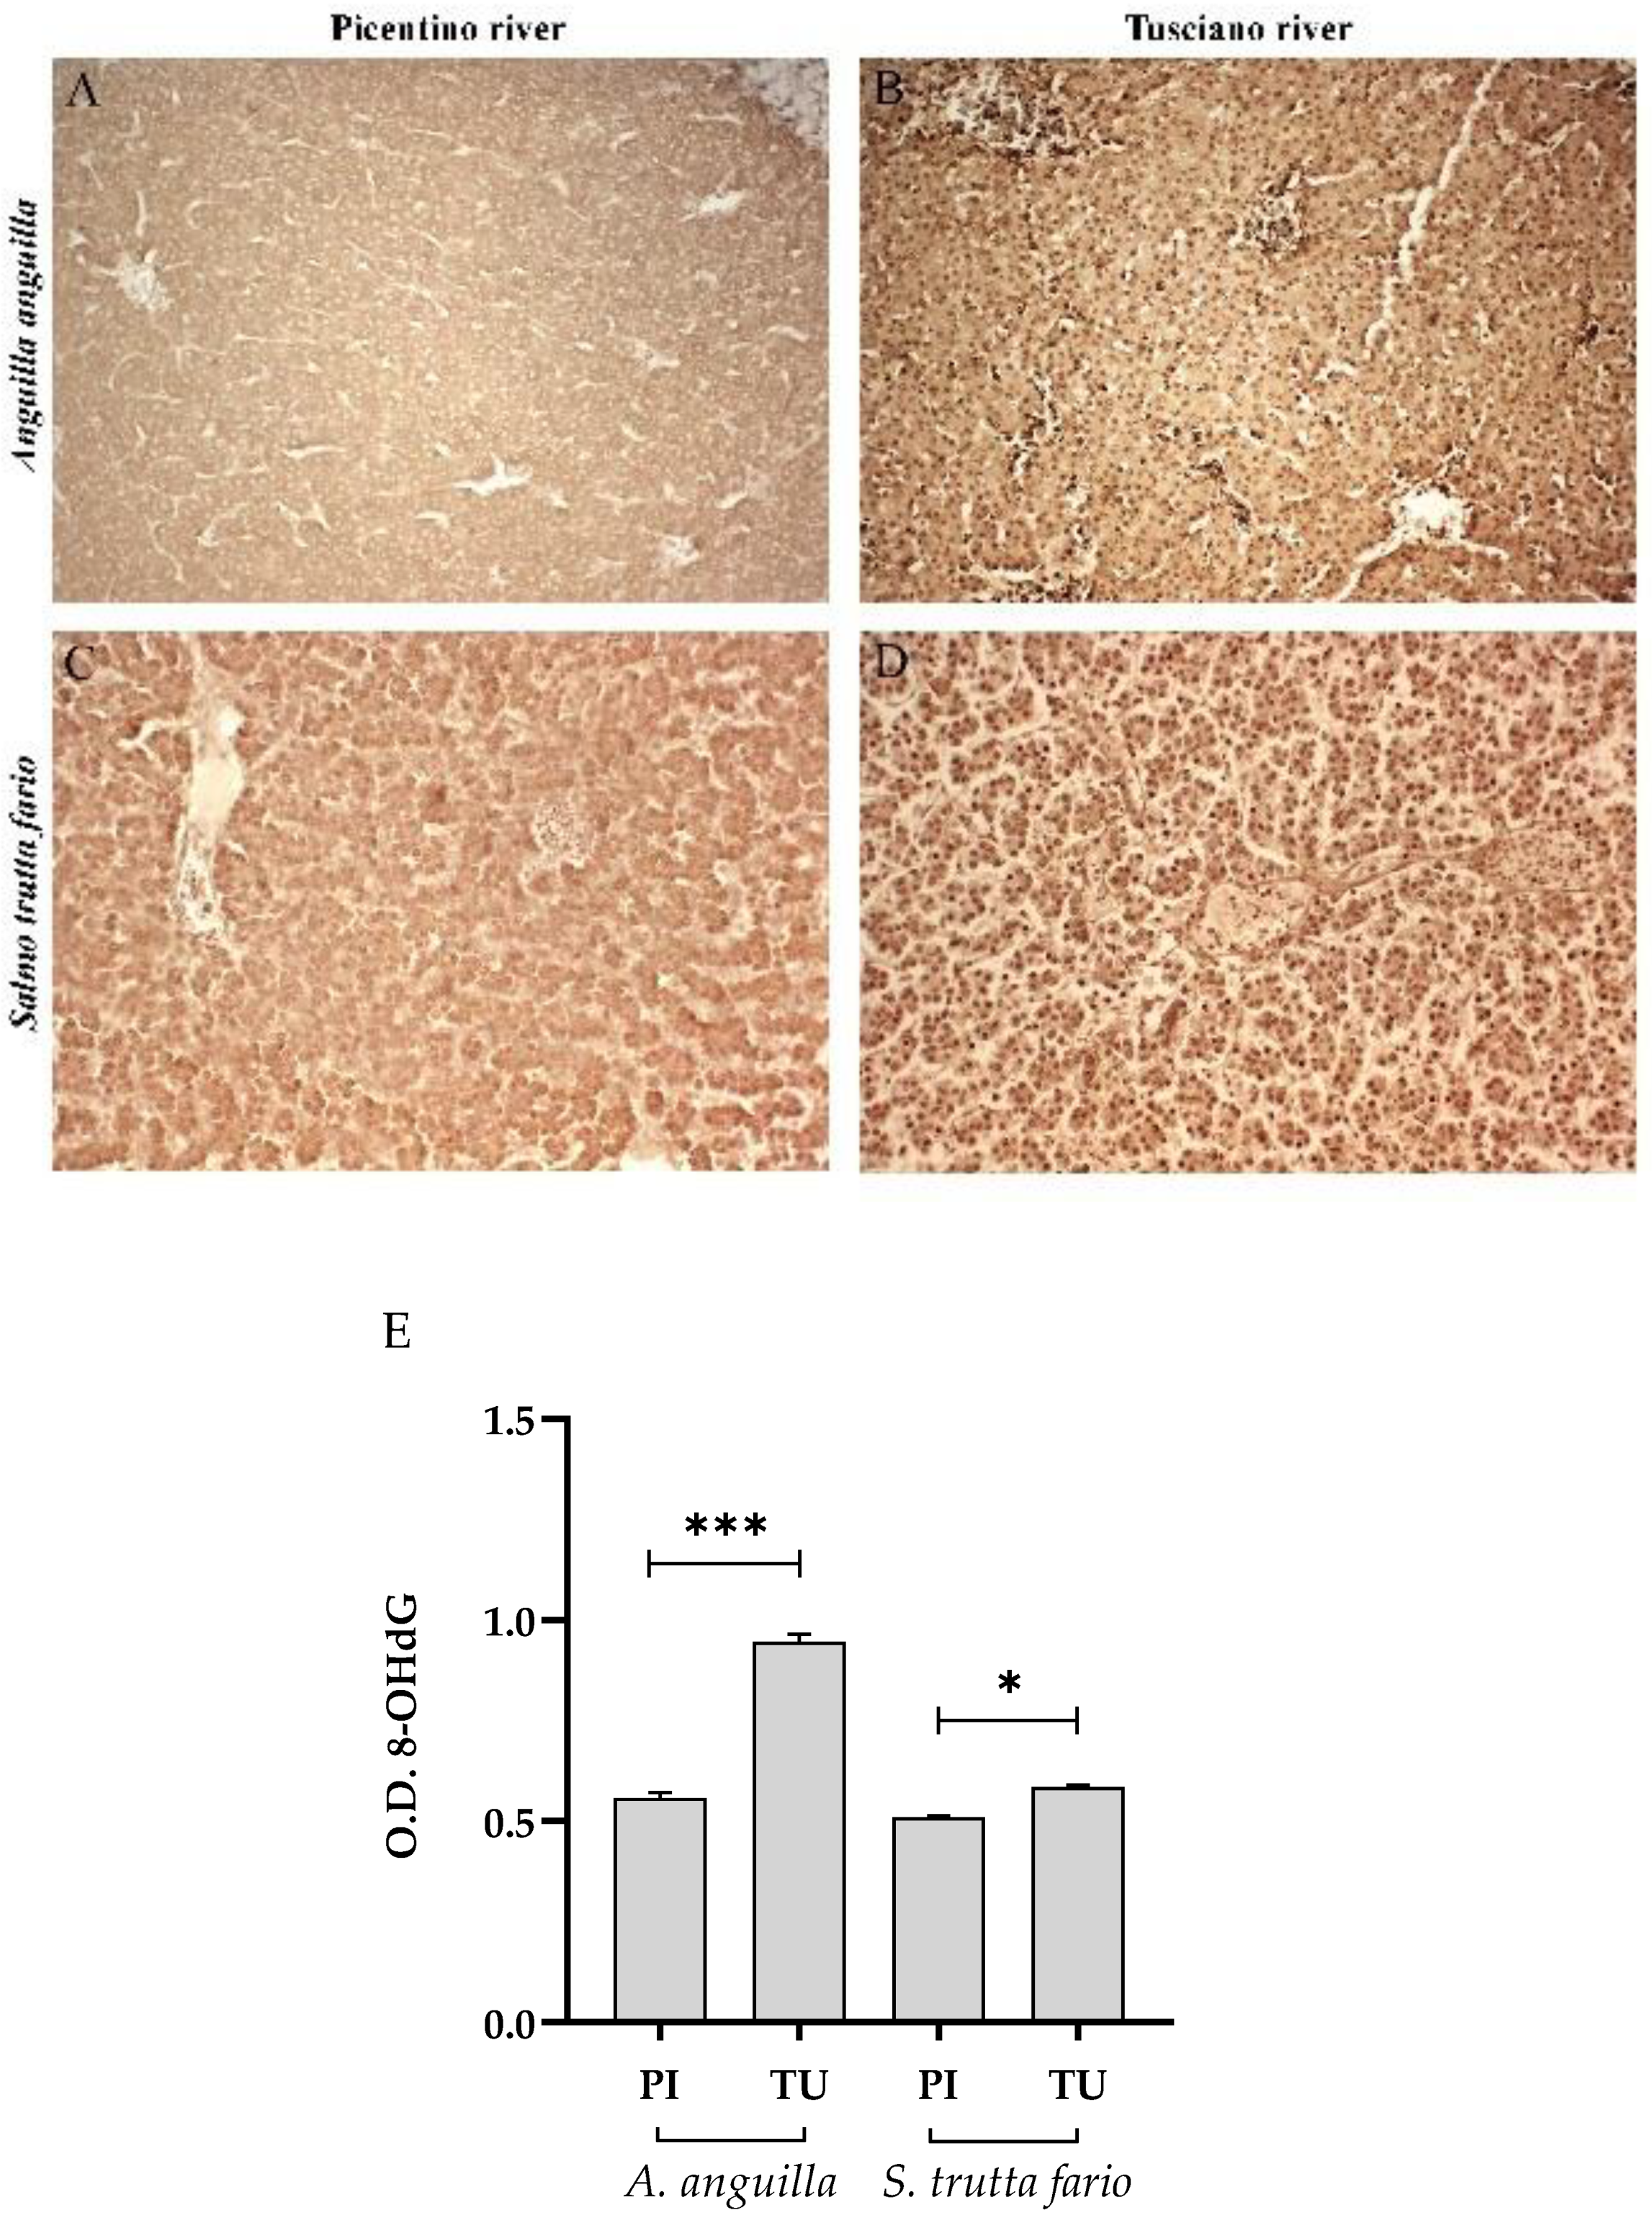
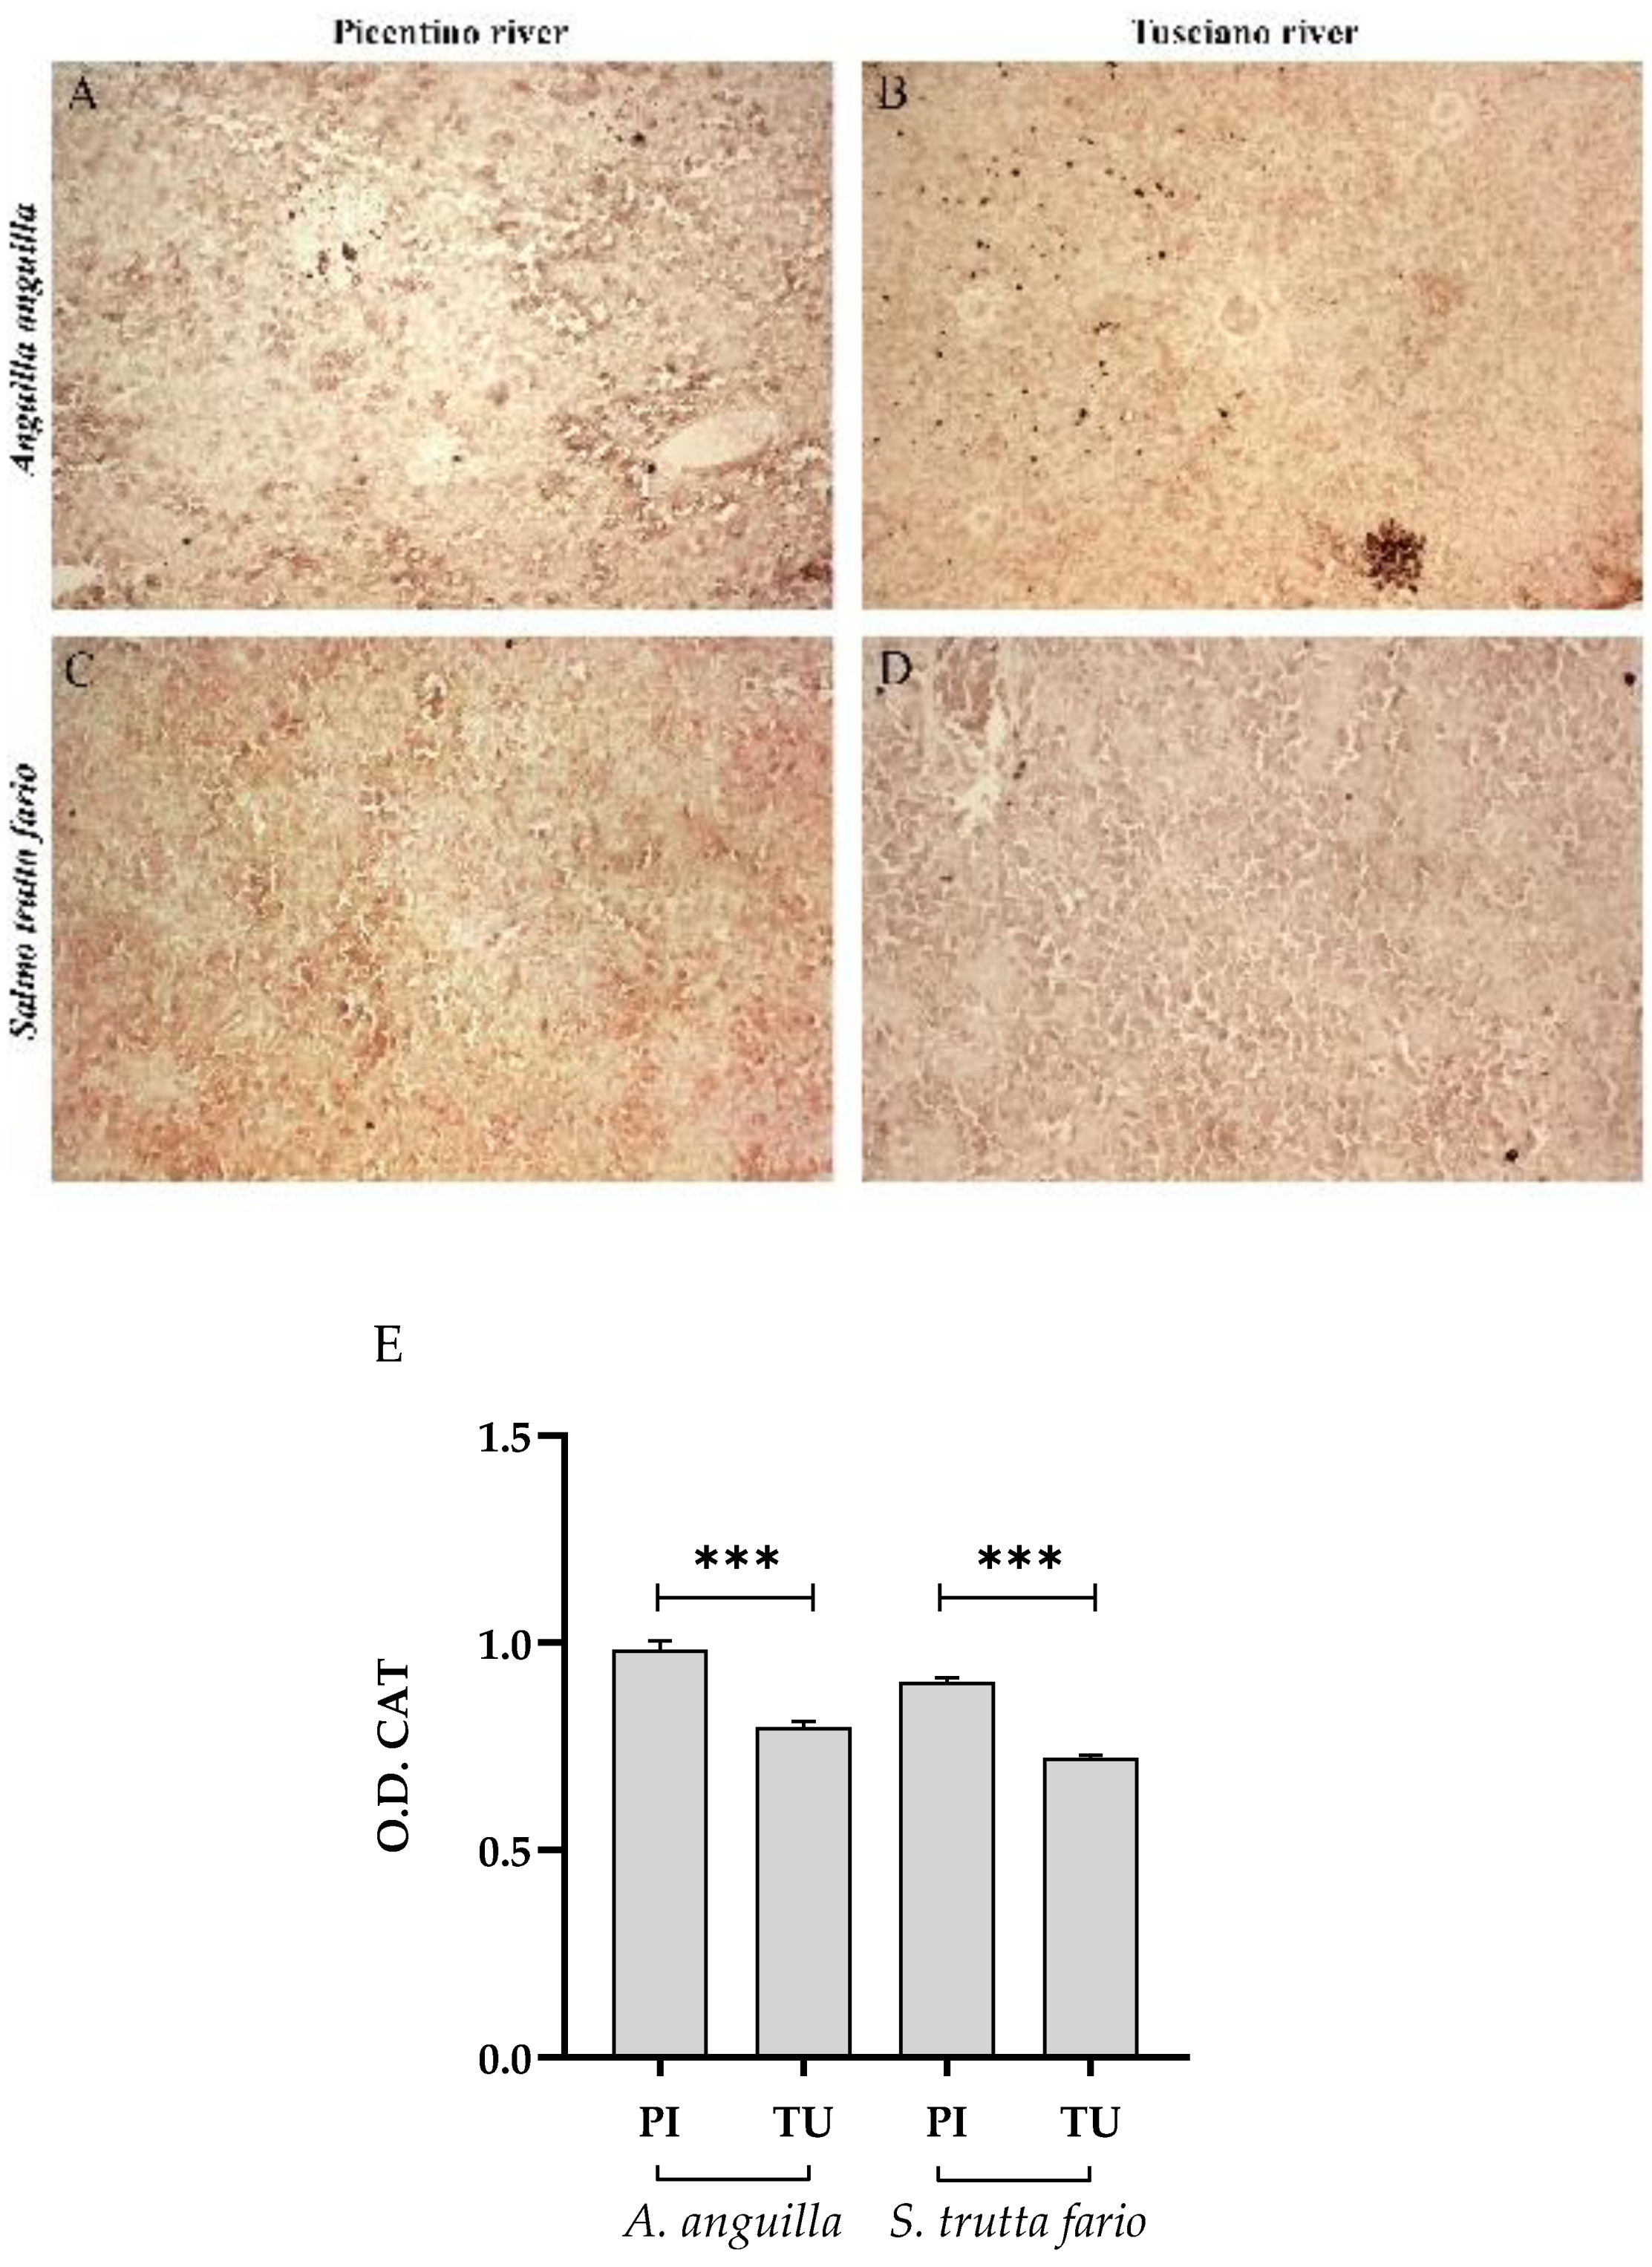
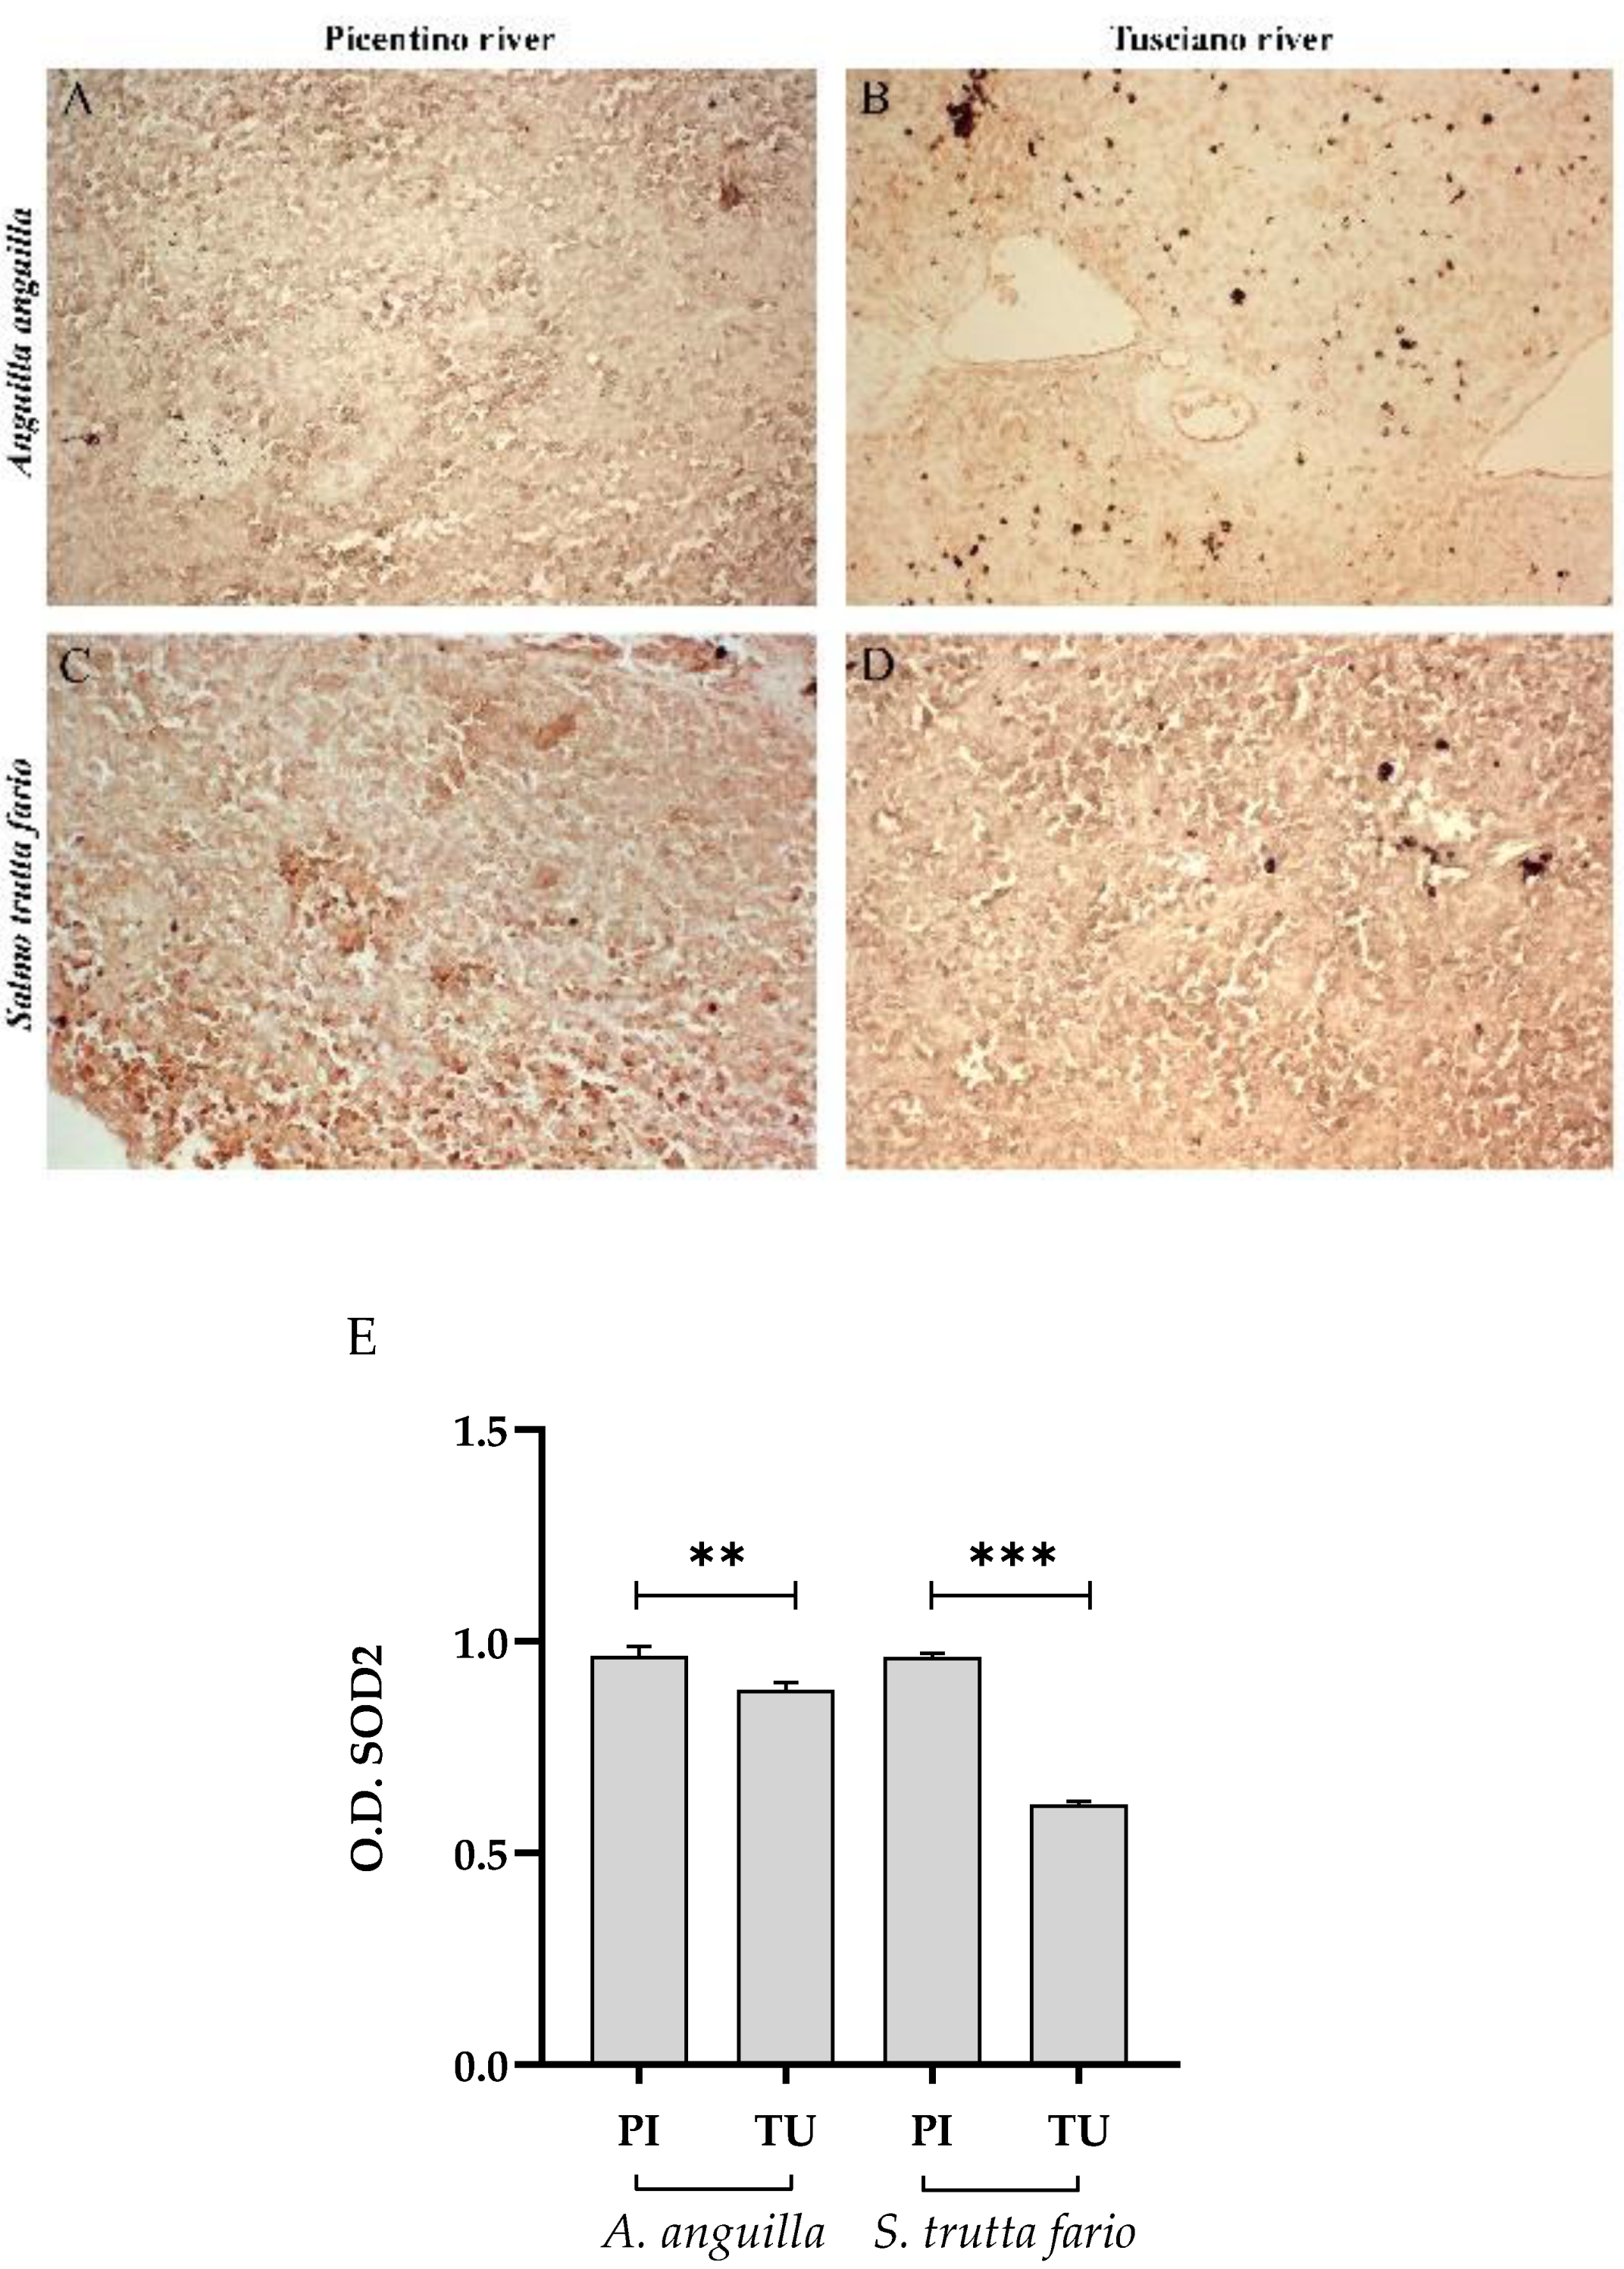
The oxidative stress occurs when there is a physiological imbalance in favor of oxidants between the levels of antioxidants and oxidants (free radicals or oxygen reactive species). Among the antioxidant defense system, there are the enzymes SOD and CAT. These enzymes are considered the vital first-line defense against oxidative stress. The hepatic and splenic immunohistochemical results suggest an impairment of the antioxidant defense system in both European eel and Brown trout living in the Tusciano river, characterized by an almost total absence of CAT immunoexpression and a poor SOD immunoexpression, accompanied by the increase in 8-OHdG immunoexpression, the main biomarker of DNA damage induced by oxidative stress. Studies suggest that exposure to aquatic contaminants and / or stressors induce alterations in the fish antioxidant system [
5,
64]. Environmental pollutants cause an increase in reactive oxygen species (ROS) and disturb the efficiency of the cellular antioxidant enzymatic system. When the physiological conditions are optimal, the antioxidant defense system is able to reduce the ROS induced by the exposure to exogenous compounds. On the contrary, when an excessive production of ROS occurs, an imbalance of antioxidant defense system takes place, resulting in oxidative damage and suppression of the antioxidant activity of SOD and CAT [
5]. The reduction of SOD and CAT activity observed in the tissues of European eel and Brown trout from Tusciano river may reflect an altered antioxidant defense system or a direct effect of toxic substances altering the activity of such enzymes [
64,
65]. The results of the 8-hydroxy-2-deoxyguanosine (8-OHdG) immunohistochemical analysis also confirm the hypothesis of a contamination of the aquatic environment of the Tusciano river. 8-OHdG is one of the most studied biomarker of the oxidative DNA damage induced by ROS generated from normal metabolism and several environmental factors. The immunoexpression of the oxidative stress marker 8-OHdG was in fact elevated in the splenic and hepatic tissues of the specimens collected in the Tusciano river, suggesting a high degree of oxidative damage to DNA induced by the excessive production of ROS likely caused by exposure to toxic agents and / or pollutants [
66].
Another important indicator of fishes’ physiological conditions is represented by blood parameters, principal markers of different environmental changes and stressors in fish [
67,
68]. Specifically, some cellular and nuclear morphological alterations of erythrocytes can be used as biomarkers to assess the stress caused by environmental pollutants [
33,
69,
70]. In line with this indication, here we found an increase in the cellular and nuclear morphology alterations in both species living in the Tusciano river.
The results obtained in the present study show that there is certainly a correlation between the histopathological alterations of fish tissues and the quality of water and soil since the higher presence of pollutants is reflected on morphological alterations of the tissues. The liver was the most sensitive organ, while the spleen was least responsive. Although it is not possible to attribute the observed alterations to a specific water or soil parameter, however, the present study demonstrates that histopathology represents a useful tool for aquatic ecosystem biomonitoring and paves the way for the possibility of using liver and some of its alterations as possible indicators. Even more interesting is the possibility of using a non-invasive blood sample in biomonitoring programs to evaluate environmental stress.
Figure 1.
Geographical location of the sampling sites.
Figure 1.
Geographical location of the sampling sites.
Figure 2.
Histopathological assessment of the liver of European eel (A. anguilla) and Brown trout (S. trutta fario) from the Picentino and Tusciano rivers. (A) Liver of European eel from Picentino river showing normal morphology; (B) Liver of European eel from Tusciano river showing cytoplasmic vacuolization (yellow circle), sinusoid dilation (black arrow), hemosiderosis (green arrow) (x200; H&E); (C) Liver of Brown trout from Picentino river showing normal morphology; (D) Liver of Brown trout from Tusciano river showing accumulation of melanomacrofages centers (MMC) (yellow arrow), irregular arrangement of hepatocytes (black circle) (x200; H&E).
Figure 3.
Liver histopathological index (LHP) index of European eel (A. anguilla) and Brown trout (S. trutta fario) of the Picentino (PI) and Tusciano (TU) rivers. Values are presented as mean ± SD. * indicates statistical difference between sampled sites (**** p <0.0001).
Figure 3.
Liver histopathological index (LHP) index of European eel (A. anguilla) and Brown trout (S. trutta fario) of the Picentino (PI) and Tusciano (TU) rivers. Values are presented as mean ± SD. * indicates statistical difference between sampled sites (**** p <0.0001).
Figure 4.
Immunohistochemical analysis of Tumor Necrosis Factor α (TNFα) in the liver of European eel (A. anguilla) from Picentino (A) and Tusciano rivers (B) and in the liver of Brown trout (S. trutta fario) from Picentino (C) and Tusciano rivers (D). Arrows indicate immunopositivity. (E) Bar graph shows TNFα optical density (O. D.) in the liver of European eel (A. anguilla) and Brown trout (S. trutta fario) from Picentino (PI) and Tusciano (TU) rivers. Values are presented as mean ± standard deviation. * indicates statistical difference between sampled sites (***p<0.0001; *p<0.05).
Figure 5.
Immunohistochemical analysis of Cycloxygenase 2 (COX2) in the liver of European eel (A. anguilla) from Picentino (A) and Tusciano rivers (B) and in the liver of Brown trout (S. trutta fario) from Picentino (C) and Tusciano rivers (D). Arrows indicate immunopositivity. (E) Bar graph shows COX2 optical density (O. D.) in the liver of European eel (A. anguilla) and Brown trout (S. trutta fario) from Picentino (PI) and Tusciano (TU) rivers. Values are presented as mean ± standard deviation. * indicates statistical difference between sampled sites (*p<0.05).
Figure 6.
Immunohistochemical analysis of Catalase (CAT) in the liver of European eel (A. anguilla) from Picentino (A) and Tusciano rivers (B) and of Brown trout (S. trutta fario) from Picentino (C) and Tusciano rivers (D). (E) Bar graph shows CAT optical density (O. D.) in the liver of European eel (A. anguilla) and Brown trout (S. trutta fario) from Picentino (PI) and Tusciano (TU) rivers. Values are presented as mean ± standard deviation.
Figure 7.
Immunohistochemical analysis of Superoxide dismutase 2 (SOD2) in the liver of European eel (A. anguilla) from Picentino (A) and Tusciano rivers (B) and of Brown trout (S. trutta fario from Picentino (C) and Tusciano rivers (D). (E) Bar graph shows SOD2 optical density (O. D.) in the liver of European eel (A. anguilla) and Brown trout (S. trutta fario) from Picentino (PI) and Tusciano (TU) rivers. Values are presented as mean ± standard deviation. * indicates statistical difference between sampled sites (***p<0.0001).
Figure 8.
Immunohistochemical analysis of 8-Hydroxy-2'-deoxyguanosine (8-OHdG) in the liver of European eel (A. anguilla) from Picentino (A) and Tusciano rivers (B) and of Brown trout (S. trutta fario) from Picentino (C) and Tusciano rivers (D). (E) Bar graph shows 8-OHdG optical density (O. D.) in the liver of European eel (A. anguilla) and Brown trout (S. trutta fario) from Picentino (PI) and Tusciano (TU) rivers. Values are presented as mean ± standard deviation. * indicates statistical difference between sampled sites (***p<0.0001; *p<0.05).
Figure 9.
Histopathological assessment of the spleen of European eel (A. Anguilla) and Brown trout (S. trutta fario) from the Picentino and Tusciano rivers. (A) and (C) Normal structure of the spleen of a fish from the Picentino river (x200; H&E). (B) and (D) Histopathological splenic alterations in fish from Tusciano river: (B) accumulation of free melanomacrophages distributed in the parenchymal area (black circle), MMC (yellow arrow) (x200; H&E); (D) accumulation of melanomacrophages centers (MMC (yellow arrow) (x200; H&E).
Figure 10.
Number of MMC per splenic section in European eel (A. Anguilla) and Brown trout (S. trutta fario) of the Picentino (PI) and Tusciano (TU) rivers. Values are presented as mean ± standard deviation. * indicates statistical difference between sampled sites (**** p <0.0001).
Figure 10.
Number of MMC per splenic section in European eel (A. Anguilla) and Brown trout (S. trutta fario) of the Picentino (PI) and Tusciano (TU) rivers. Values are presented as mean ± standard deviation. * indicates statistical difference between sampled sites (**** p <0.0001).
Figure 11.
Histopathological evaluation of the spleen of European eel (A. anguilla) and Brown trout (S. trutta fario) from the Picentino and Tusciano rivers. (A) and (B) Splenic tissue with normal structure of fish from the Picentino river (x200; Gomori trichrome); (B) and (D) Excessive production of connective tissue called fibrosis (black arrow) of fish of the Tusciano river (x200; Gomori trichrome); (E) Quantification of fibrosis area in European eels and Brown trouts spleens from Picentino and Tusciano rivers. Values are presented as mean ± standard deviation * indicates statistical difference between sampled sites (**** p <0.0001).
Figure 12.
Immunohistochemical analysis of Tumor Necrosis Factor α (TNFα) in the spleen of European eel (A. anguilla) from Picentino (A) and Tusciano rivers (B) and of Brown trout (S. trutta fario) from Picentino (C) and Tusciano rivers (D). Arrows indicate immunopositivity of inflammation biomarker. (E) Bar graph shows TNFα optical density (O. D.) in the spleen of European eel (A. anguilla) and Brown trout (S. trutta fario) from Picentino (PI) and Tusciano (TU) rivers. Values are presented as mean ± standard deviation. * indicates statistical difference between sampled sites (***p<0.0001).
Figure 13.
Immunohistochemical analysis of Cycloxygenase 2 (COX2) in the spleen of European eel (A. anguilla) from Picentino (A) and Tusciano rivers (B) and of Brown trout (S. trutta fario) from Picentino (C) and Tusciano rivers (D). Arrows indicate immunopositivity of inflammation biomarker. (E) Bar graph shows COX2 optical density (O. D.) in the spleen of European eel (A. anguilla) and in Brown trout (S. trutta fario) from Picentino (PI) and Tusciano (TU) rivers. Values are presented as mean ± standard deviation. * indicates statistical difference between sampled sites (***p<0.0001; *p<0.05).
Figure 14.
Immunohistochemical analysis of Catalase (CAT) in the spleen of European eel (A. anguilla) from Picentino (A) and Tusciano rivers (B) and of Brown trout (S. trutta fario) from Picentino (C) and Tusciano rivers (D). (E) Bar graph shows CAT optical density (O. D.) in the spleen of European eel (A. anguilla) and Brown trout (S. trutta fario) from Picentino (PI) and Tusciano (TU) rivers. Values are presented as mean ± standard deviation. * indicates statistical difference between sampled sites (***p<0.0001).
Figure 15.
Immunohistochemical analysis of Superoxide dismutase 2 (SOD2) in the spleen of European eel (A. anguilla) from Picentino (A) and Tusciano rivers (B) and of Brown trout (S. trutta fario) from Picentino (C) and Tusciano rivers (D). (E) Bar graph shows SOD2 optical density (O. D.) in the spleen of European eel (A. anguilla) and Brown trout (S. trutta fario) from Picentino (PI) and Tusciano (TU) rivers. Values are presented as mean ± standard deviation. * indicates statistical difference between sampled sites (***p<0.0001; **p<0.001).
Figure 16.
Immunohistochemical analysis of 8-Hydroxy-2'-deoxyguanosine (8-OHdG) in the spleen of European eel (A. anguilla) from Picentino (A) and Tusciano rivers (B) and of Brown trout (S. trutta fario) from Picentino (C) and Tusciano rivers (D). (E) Bar graph shows 8-OHdG optical density (O. D.) in the spleen of European eel (A. anguilla) and Brown trout (S. trutta fario) from Picentino (PI) and Tusciano (TU) rivers. Values are presented as mean ± standard deviation. * indicates statistical difference between sampled sites (***p<0.0001).
Table 1.
Description of tissues alterations and their importance factor (ω).
Table 1.
Description of tissues alterations and their importance factor (ω).
| General description |
Alterations |
Importance Factor (ω) |
| Alterations result from a pathological condition of blood and tissue fluid flow |
Blood sinusoid dilation |
1 |
| Hemorrhage |
1 |
| Alterations result in functional redution or loss of the organ. |
Cytoplasmic vacuolization |
1 |
| Hemosideriosis |
1 |
| Irregular arrangment of hepatocytes |
1 |
| Lipid accumulation |
2 |
| Necrosis |
3 |
| Cellular hyperplasia |
2 |
| Alterations result from increased presence of cells used in tissue repair; response to damaged tissue |
Leukocytes infiltration |
2 |
| Melanomacrophage aggregates |
1 |
| Free melanomacrofages |
1 |
Table 2.
Water analysis of the Picentino and Tusciano rivers.
Table 2.
Water analysis of the Picentino and Tusciano rivers.
| |
|
Picentino river |
Tusciano river |
| Physico-chemical parameters |
Conductivity (µS/cm) |
387 |
1680 |
| |
Oxygen (mg/L) |
9.4 |
7.8 |
| |
pH |
7.2 |
8.2 |
| |
Temperature (°C) |
14.8 |
15.3 |
| |
Total Inorganic Carbon mg/L |
45 |
86 |
| |
Chlorides mg/L |
7.4 |
22 |
| |
Bromine mg/L |
<0.1 |
0.2 |
| |
Nitrates mg/L |
2.8 |
39 |
| PTEs |
As (µg/L) |
< 1 |
3.13 |
| |
Cd (µg/L) |
< 0.1 |
0.17 |
| |
Co (µg/L) |
< 0.5 |
0.8 |
| |
Hg (µg/L) |
< 0.1 |
0.23 |
| |
Ni (µg/L) |
< 0.5 |
0.77 |
| |
Pb (µg/L) |
< 1 |
1.22 |
| Pesticides |
Boscalid (µg/L) |
< 0.01 |
0.44 |
| |
Glifosate (µg/L) |
< 0.01 |
0.32 |
| |
AMPA (µg/L) |
< 0.01 |
0.85 |
| |
Propizamide (µg/L) |
< 0.01 |
0.02 |
| |
Terbutryn (µg/L) |
< 0.01 |
0.05 |
| Fungicide |
Metalaxil (µg/L) |
< 0.01 |
0.04 |
| Other contaminants |
Tetrachlorethylene (µg/L) |
< 0.01 |
0.17 |
| |
Toluene (µg/L) |
< 0.01 |
0.15 |
| |
Trichloroethylene (µg/L) |
< 0.01 |
0.11 |
| |
Trichloromethane (µg/L) |
< 0.01 |
0.14 |
Table 3.
Soil analysis of Picentino (PI) and Tusciano (TU) rivers drainage basin.
Table 3.
Soil analysis of Picentino (PI) and Tusciano (TU) rivers drainage basin.
| PTEs (mg/kg) |
PI
|
TU
|
PAHs
(mg/kg) |
PI
|
TU
|
PCBs
(µg /kg) |
PI
|
TU
|
OCPs
(µg /kg) |
PI
|
TU
|
| As |
8.7 |
12.5 |
Total PAHs |
0.0155 |
0.0182 |
PCB 77 |
0.003 |
<0.003 |
Hexachlorobenzene |
0.005 |
0.113 |
| Be |
3.3 |
5.8 |
Dibenzo(a,i)pyrene |
<0.005 |
0.0051 |
PCB 118 |
<0.003 |
0.032 |
α-Chlordane |
<0.005 |
0.078 |
| Cd |
0.32 |
0.21 |
|
|
|
PCB 105 |
<0.003 |
0.02 |
Chlordane |
0.005 |
0.081 |
| Co |
5.7 |
11.2 |
|
|
|
PCB 167 |
<0.003 |
0.004 |
o,p'-DDE |
<0.005 |
0.059 |
| Cu |
38.8 |
35.8 |
|
|
|
PCB 156 |
0.004 |
0.007 |
p,p'-DDE |
0.02 |
7.591 |
| Cr |
10.4 |
18.3 |
|
|
|
PCB 157 |
0.006 |
<0.003 |
o,p'-DDD |
<0.005 |
0.019 |
Hg
(µg /kg) |
23 |
23 |
|
|
|
PCB 189 |
0.004 |
<0.003 |
p,p'-DDD |
<0.005 |
0.109 |
| Ni |
10.5 |
12.6 |
|
|
|
PCB-28 |
<0.003 |
0.005 |
o,p'-DDT |
<0.005 |
0.292 |
| Pb |
36.1 |
39.9 |
|
|
|
PCB-52 |
<0.003 |
0.006 |
p,p'-DDT |
<0.005 |
1.771 |
| Sn |
2.5 |
2.7 |
|
|
|
PCB-101 |
<0.003 |
0.012 |
Dieldrin |
<0.005 |
0.191 |
| Tl |
0.8 |
1.36 |
|
|
|
PCB-153 |
0.135 |
0.042 |
Endosulphan sulphat |
0.128 |
<0.005 |
| V |
45 |
80 |
|
|
|
PCB-138 |
0.065 |
0.043 |
DDD, DDT, DDE |
0.0325 |
9.84 |
| Zn |
77.1 |
75.6 |
|
|
|
PCB-180 |
0.063 |
0.055 |
|
|
|
| |
|
|
|
|
|
Trichlorobiphenyls |
<0.01 |
0.012 |
|
|
|
| |
|
|
|
|
|
Tetrachlorobiphenyls |
<0.01 |
0.036 |
|
|
|
| |
|
|
|
|
|
Pentachlorobiphenyls |
<0.01 |
0.121 |
|
|
|
| |
|
|
|
|
|
Hexachlorobiphenyls |
<0.01 |
0.16 |
|
|
|
| |
|
|
|
|
|
Heptachlorobiphenyls |
0.227 |
0.098 |
|
|
|
| |
|
|
|
|
|
Octachlorobiphenyls |
0.081 |
0.013 |
|
|
|
| |
|
|
|
|
|
Nonachlorobiphenyls |
0.059 |
0.032 |
|
|
|
| |
|
|
|
|
|
Decachlorobiphenyls |
0.051 |
0.064 |
|
|
|
| |
|
|
|
|
|
Total PCB |
0.418 |
0.536 |
|
|
|
Table 4.
Biological indices of European eel (A. anguilla) and Brown trout (S. trutta fario) from the Picentino and Tusciano rivers. Values are presented as mean ± SD.
Table 4.
Biological indices of European eel (A. anguilla) and Brown trout (S. trutta fario) from the Picentino and Tusciano rivers. Values are presented as mean ± SD.
| Species |
River |
BW (g) |
TL (cm) |
K |
HSI (%) |
European eel
(A. anguilla)
|
Picentino |
|
|
|
|
| Tusciano |
|
|
|
|
Brown Trout
(S. trutta fario)
|
Picentino |
|
|
|
|
| Tusciano |
|
|
|
|
Table 5.
Indices of histopathological alterations (HA) in the liver of European eel (A. anguilla) and Brown trout (S. trutta fario) from the Picentino and Tusciano rivers. Scores are presented as mean values ± SD. Liver alterations were scored as follows: 0 = none, 1 = mild, 2 = moderate and 3 = severe.
| Alterations |
European eel (A. anguilla)
|
Brown trout (S. trutta fario)
|
| Picentino river |
Tusciano river |
Picentino river |
Tusciano river |
| Blood sinusoid dilation |
|
|
|
|
| Hemorrhage |
|
|
|
|
| Cytoplasmic vacuolization |
|
|
|
|
| Hemosideriosis |
|
|
|
|
| Irregular arrangment of hepatocytes |
|
|
|
|
| Lipid accumulation |
|
|
|
|
| Necrosis |
|
|
|
|
| Cellular hyperplasia |
|
|
|
|
| Leukocytes infiltration |
|
|
|
|
| melanomacrophages centers (MMC) |
|
|
|
|
Table 6.
Indices of histopathological alterations (HA) of spleen found in European eel (A. Anguilla) and Brown trout (S. trutta fario) of the Picentino and Tusciano rivers. Values are reported as mean ± SD. Spleen alterations were scored as follows: 0 = none, 1 = mild, 2 = moderate and 3 = severe.
Table 6.
Indices of histopathological alterations (HA) of spleen found in European eel (A. Anguilla) and Brown trout (S. trutta fario) of the Picentino and Tusciano rivers. Values are reported as mean ± SD. Spleen alterations were scored as follows: 0 = none, 1 = mild, 2 = moderate and 3 = severe.
| Alteration |
European eel (A. anguilla)
|
Brown trout (S. trutta fario)
|
| Picentino river |
Tusciano river |
Picentino river |
Tusciano river |
| Free melanomacrophages |
|
|
|
|
| Hemosideriosis |
|
|
|
|
| Melanomacrophage aggregates |
|
|
|
|
| Necrosis |
|
|
|
|
Table 7.
Correlation analysis of liver histopathological alterations and environmental pollutants in stream water and soil. P-value is from a two-tailed test with a confidence interval of 95%. Statistical significance was represented by stars as follows: non-significant (ns) > 0.05, *P ≤ 0.05, **P ≤ 0.01.
| |
Water pollutants |
Soil pollutants |
| Alterations |
Pearson r |
P value (two-tailed) |
Statistical significance |
Pearson r |
P value (two-tailed) |
Statistical significance |
| Blood sinusoid dilation |
0.9417 |
0.0583 |
ns |
0.9417 |
0.0583 |
ns |
| Hemorrhage |
0.9886 |
0.0114 |
* |
0.9886 |
0.0114 |
* |
| Cytoplasmic vacuolization |
0.9939 |
0.0061 |
** |
0.9939 |
0.0061 |
** |
| Hemosiderosis |
0.9874 |
0.0126 |
* |
0.9874 |
0.0126 |
* |
| Irregular arrangment of hepatocytes |
0.9962 |
0.0038 |
** |
0.9962 |
0.0038 |
** |
| Lipid accumulation |
0.9611 |
0.0389 |
* |
0.9611 |
0.0389 |
* |
| Necrosis |
0.9921 |
0.0079 |
** |
0.9921 |
0.0079 |
** |
| Cellular hyperplasia |
0.9831 |
0.0169 |
* |
0.9831 |
0.0169 |
* |
| Leukocytes infiltration |
0.9923 |
0.0077 |
** |
0.9923 |
0.0077 |
** |
| MMC |
0.9925 |
0.0075 |
** |
0.9925 |
0.0075 |
** |
Table 8.
Correlation analysis of spleen histopathological alterations and environmental pollutants in stream water and soil. P-value is from a two-tailed test with a confidence interval of 95%. Statistical significance was represented by stars as follows: non-significant (ns) > 0.05, *P ≤ 0.05, **P ≤ 0.01.
| |
Water pollutants |
Soil pollutants |
| Alterations |
Pearson r |
P value (two-tailed) |
Statistical significance |
Pearson r |
P value (two-tailed) |
Statistical significance |
| Free melanomacrophages |
0.9258 |
0.0742 |
ns |
0.9258 |
0.0742 |
ns |
| Hemosiderosis |
0.9874 |
0.0126 |
* |
0.9874 |
0.0126 |
* |
| Melanomacrophage aggregates |
0.7432 |
0.2568 |
ns |
0.7432 |
0.2568 |
ns |
| Necrosis |
0.7675 |
0.2325 |
ns |
0.7675 |
0.2325 |
ns |
Table 9.
Percentage of erythrocytic cellular abnormalities (ECA), erythrocytic fusion (EF), and erythrocytic nuclear abnormalities (ENA) in European eel (A. anguilla) and Brown trout (S. trutta fario) from the Picentino and Tusciano rivers.
Table 9.
Percentage of erythrocytic cellular abnormalities (ECA), erythrocytic fusion (EF), and erythrocytic nuclear abnormalities (ENA) in European eel (A. anguilla) and Brown trout (S. trutta fario) from the Picentino and Tusciano rivers.
| |
|
ECA |
EF |
ENA |
| European eel (A. anguilla)
|
Picentino River |
12.7± 2 |
1.18 ± 0.3 |
7.7 ± 2.1 |
| Tusciano River |
27.15 ± 2*** |
2.8 ± 0.3 |
20.3 ± 0.9** |
| Brown trout (S. trutta fario)
|
Picentino River |
16.3 ± 0.9 |
16.3 ± 0.9 |
9.1 ± 1.6 |
| Tusciano River |
28.6 ± 1,9** |
28.6 ± 1.9*** |
21.1 ± 2.8** |
