
Submitted:
07 November 2023
Posted:
08 November 2023
You are already at the latest version
Abstract
In this paper, based on the symmetrical reliability theory, a research method for the safety factor of overall overturning stability of continuous beam bridge under carbon fiber reinforced polymers (CFRP) during cantilever and horizontal rotation construction is proposed. Under the premise that the given target reliability index is known, the method solves the overall overturning stability safety factor of continuous beam bridge under carbon fiber reinforced polymers during cantilever and horizontal rotation construction by using the symmetrical reliability analysis theory and considering the randomness of structural parameters. This method is used to calculate the safety factor and the design reinforcement aera of CRFP of overturning stability and the design reinforcement aera of CRFP of a continuous beam bridge, and the parameters are analyzed. The calculation results show that the randomness of parameters will have a great impact on the overall safety factor and the CRFP aera of overturning stability of cantilever and horizontal rotation construction of continuous beam bridge, and ignoring the influence of randomness of parameters will lead to overestimation of the overall safety factor and underestimation of the CRFP aera of overturning stability of cantilever and horizontal rotation construction of continuous beam bridge.
Keywords:
carbon fiber reinforced polymers
; CRFP aera
; safety factor
; continuous beam bridge
; cantilever and horizontal rotation construction
; overall overturning stability
; symmetrical reliability theory
; uncertainty
; target reliability index
1. Introduction
During the cantilever and horizontal rotation construction of prestressed concrete continuous beam bridge, with the increase of the cantilever construction length, the risk of bridge longitudinal overturning caused by unbalanced load on both sides of the cantilever and horizontal rotation becomes higher and higher [1]. To ensure structural safety, temporary consolidation measures are usually provided at the fixed pier to resist the overturning bending moment caused by unbalanced loading on both sides of the cantilever and horizontal rotation [2].
At present, the temporary reinforcement measures against overturning are commonly used rebar. The rebar has the disadvantages of low strength and needs to be arranged in a large area, which requires high requirements for the connection structure of the structure. CFRP steel bars with high strength can be used for temporary reinforcement, which plays a very important role in bridge stability. CFRP bars are formed by extruding and drawing with special molds after the strands of continuous carbon fibers are glued through base materials (such as polyamide resin, polyethylene resin, epoxy resin, etc.). In recent years, carbon fiber reinforced composite, with its advantages of high tensile strength, light weight, corrosion resistance and fatigue resistance, is increasingly used in the reinforcement and reconstruction of concrete structures, and is increasingly considered to be the best alternative material for external tendons in external prestressing reinforcement technology.
Carbon fiber-reinforced plastic (CFRP) is widely used globally for strengthening the existing concrete structures because of its effectiveness and convenience of construction [3,4]. In recent years, some design specifications related to structure strengthening by CFRP have been issued. It had been proven that, strengthening using CFRP is capable to enhance the performance or RC concrete structural elements e.g., [5,6]. Different failure modes were observed, which can be classified into two types according to the location of occurrence. First, modes occur at position of maximum moment. Such modes are concrete crushing, CFRP mid span debonding (due to flexural crack or flexural-shear crack), and CFRP rupture. Second, failure modes occur at plate end. Such modes are interfacial shear stress induced CFRP end debonding, cover separation, and CFRP debonding (due to pure shear crack). The increase in section performance due to strengthening depends on actual deterioration level of concrete section. The ACI Committee 440 [7] reports an increase in nominal resistance ranges between 10% and 160% when strengthening RC elements with CFRP materials. However, reduction in ductility requirements ranges between 5% and 40% may be observed after strengthening.
At present, the commonly used inspection method is to check the safety of structural overturning stability through a deterministic model, without considering the influence of parameter randomness. Therefore, in fact, the safety of structural overturning stability is unknown [8,9]. Stochastic analysis provides an effective analysis method for considering the random influence of parameters in the study of the safety of the overturning stability of the cantilever and horizontal rotation construction of continuous beam bridges. Li [10], Zhang [11], Luo [12] and Casas [2] respectively took a prestressed concrete continuous bridge as an example to analyze the reliability of its overall overturning stability during cantilever and horizontal rotation construction. However, the above scholars all use the positive reliability analysis method to verify whether the overall overturning stability reliability of continuous beam bridges during cantilever and horizontal rotation construction meets the requirements.
The current bridge design code has developed into a performance-based design concept, that is, the target reliability index of the structure is given in advance to design the structure to ensure structural safety [13,14]. In this way, it is necessary to ensure the given overturning stability reliability of cantilever and horizontal rotation construction by correcting the overturning stability safety factor; However, the current research methods of safety factor and the CFRP reinforcement aera of overturning stability are not suitable for the analysis of this problem.
At present, the safety evaluation of concrete structures mainly relies on probability reliability analysis methods, but it requires many statistical samples to obtain the probability distribution function of load effect, concrete strength, and other influencing parameters. A large amount of measured data means that a large amount of manpower and funds need to be invested, which is difficult to complete or even unrealistic for many projects. However, in engineering, the upper and lower limits of uncertain parameters are often easy to determine, so non probabilistic analysis methods based on interval models are more applicable. References [15,16] applied non probabilistic reliability theory in the evaluation of the bearing capacity of arch bridges, Reference [17] applied non probabilistic methods to evaluate the vibration reliability of a second stage blade of an engine low-pressure compressor with more damage. References [18,19,20] applied non probabilistic reliability theory based on interval analysis to the stability reliability analysis of geotechnical structures, achieving certain results. Reference [21] used interval models to describe structural uncertainty, A non-probabilistic robust optimization model was established and an example optimization design was carried out.
Therefore, based on the previous studies, this paper proposes a method to study the safety factor and the CFRP reinforcement aera of overturning stability based on the theory analysis of symmetrical reliability, and studies the safety factor and the CFRP reinforcement aera of overturning stability of a continuous beam bridge during cantilever and horizontal rotation construction. Using interval reliability theory to evaluate the safety performance of cantilever rotating construction concrete beam bridges during the construction stage can not only meet the objective randomness existing in practical engineering, but also accurately evaluate the safety performance of the structure from the essence of objective randomness.
2. Symmetric reliability theory
When the overall structure or part of the structure exceeds a certain specific state and cannot meet a certain functional requirement specified by the design, this specific state is the limit state of the function. The limit state of the structure can be described by the limit state equation, which is expressed as:
where, g (R, S) is the limit state function of the structure; R is the resistance of the structure or structural members; S is the effect of the action.
g=g (R, S)=R-S=0
For a given target reliability index , the inverse reliability problem can be described as calculating or according to the given that meeting Equations (2) and (3).
where, is the limit state function.
2.1. Forward reliability
The failure criterion of the structure is usually expressed by the load effect , and the statistical information of the structure is expressed by the basic random vector . The relationship between and can be expressed as
Equation (4) is usually called “mechanical transformation”. In actual engineering, since the mechanical transformation is generally implicit, it can only be solved by numerical algorithms (such as the finite element method).
For the finite element first-order reliability method, the limit state function is
The value of the limit state function in Formula (6) can be obtained through finite element analysis, so the calculation of the gradient becomes the key. According to the chain differential law, the relationship with the gradient of the limit state function , is:
where, is the gradient of the limit state function to ; is the gradient of the limit state function to ; is the Jacobian matrix of probability transformation; is the Jacobian matrix of mechanical transformation.
2.2. Inverse reliability
Der kiureghian A., Zhang Y., Li C. C. [22] defined the problem of structural reliability back analysis as follows:
where is a vector of standard normal distribution space; is the structural target reliability index; is a function of the structure; is the gradient operator; and is the design parameters to be determined.
Hong Li and Ricardo O. Foschi [23] proposed a direct algorithm to solve for these parameters. The basic idea of the algorithm is that is known, and we solve for (or the mean value of ), such the parameters to be solved meet and .
According to the theory of primary reliability analysis, the parameter vector satisfies the following formula at the design point:
Thus, the target reliability index of the structure is:
The target reliability index can be obtained by Taylor expansion at ; the result is:
where j+1 and j are the (j +1)th and jth iteration values of the safety factor and the reinforcement aera CFRP, respectively, which are the reliability index values calculated for the jth iteration.
The iterative formula [24] of the safety factor can be obtained:
Equation (17) was selected as the convergence criterion of the reliability back analysis method adopted in this paper:
In the formula, is taken as an appropriately small number; 0.0001 can be used in in specific calculations.
3. Non probabilistic reliability theory
When the randomness of resistance R and action effect S is represented by interval probability, i.e R∈RI = [Rd, Ru], S∈SI = [Sd, Su], Rd, Sd, Ru and Su represent the lower and upper bounds, respectively, The corresponding midpoint of the interval is Rc and Sc, the interval radius is Rr and Sr. So
Rc = (Rd + Ru)/2
Sc = (Sd + Su)/2
Rr = (Ru -Rd)/2
Sr = (Su -Sd)/2
There are three forms of safety factors for interval models:
(1) Center safety factor Kc
Kc = Rc/Sc
(2) Non probabilistic safety factor Knr
Knr = Rd/Su
(3) Interval safety factor KI
Knr = R/S
4. Reliability Model of Overall Overturning Stability in Cantilever Construction
In the process of cantilever construction, the continuous beam bridge is in danger of longitudinal overall overturning and instability due to the arrangement of asymmetric loads. In order to resist the unbalanced load on both sides of the cantilever, temporary consolidation measures are usually taken on both sides of the fixed pier support (as shown in Figure 1).
During the cantilever construction of prestressed continuous beam bridge, the most unfavorable load condition under the maximum cantilever construction state (as shown in Figure 2) is taken to study the safety factor of overturning stability. Q was when the concrete pouring on both sides of the cantilever is not synchronous, the quality is poor, taking 30% of the dead weight of the beam section [17]; q was the weight difference of beams on both sides, loaded according to line load; q1 was the live loads during construction, such as pedestrians, transportation vehicles, materials and temporary facilities, can be applied as uniform loads (taking the load difference at both ends); q2 was the maximum wind pressure difference during the construction period (taken as 0.5 times of the vertical wind pressure during the calculation); lp was the length of one piece before the closure section; lc was the Length of closure section.
The overturning stability function is
where was the basic random variable.
The overturning stability limit state function can be expressed as:
where, was the safety factor of overturning stability, and were anti-overturning moment and overturning moment, respectively.
Anti-overturning moment and overturning moment were as follows:
where, was the ratio of dead weight difference of beams on both sides to dead weight of beams, was the distance from center of gravity of reinforcement to pier center, was the length of the bridge, was the resistance of carbon fiber reinforced polymers.
5. Procedure
The procedure for calculating the safety factor of overturning stability using the above reliability back analysis method is as follows:
Step 1: Assume the initial value of the random variable and the overall overturning stability safety factor of the cantilever construction of the continuous beam bridge, and determine the structural target reliability index and convergence error. The initial value of the random variable can be the mean value of its probability distribution, and the initial value of the overturning stability safety factor of the cantilever construction of the continuous beam bridge can be calculated according to the deterministic model.
Step 2: Initialize the iteration number j=1, and calculate the sum.
Step 3: Calculate the updated K value by substituting the sum calculated in the previous step into Equation (17).
Step 4: Check the convergence according to the convergence criterion of Equation (18). If the convergence criterion is not met, set j=j+1 and go to step 2; Otherwise, the calculation result is output.
6. Application
The calculation parameters of a 73m+110m+73m three span prestressed concrete continuous beam bridge in the maximum cantilever state are as follows: . Taking the above parameter values into equations (11) and (12), the structural overturning stability function can be obtained from Equation (19) as
The statistical parameter values of each random variable in Equation (29) [2,10,11,25] are shown in Table 1
6.1. Influence on safety factor of target reliability index
The target reliability index of the structure is taken as 1.5~3.5, so as to analyze the influence of the target reliability on the safety factor of overturning stability. See Table 2 for the specific calculation results.
According to the analysis of the calculation data in Table 3, with the increase of the structural target reliability index, the overall overturning stability safety factor of the cantilever construction of the continuous beam bridge will be significantly reduced. The safety factor of overturning stability calculated based on the deterministic model is 1.6042. Therefore, ignoring the influence of parameter randomness will overestimate the safety of overturning stability of the structure.
6.2. Parameter analysis of safety factor
According to the analysis results of the safety factor of overturning stability of continuous beam bridges based on the deterministic model, because the influence of the randomness of parameters is ignored, a large safety factor of overturning stability will be obtained. In order to analyze the influence of parameter randomness on the safety factor of overturning stability, the structural target reliability index is taken as 2.5, and the mean value of each random variable is increased by −10%~+10%. The calculated results of the safety factor of overturning stability are shown in Table 3 and Figure 3.
It can be seen from Figure 3 and Table 3 that the distance d between the reinforcement and the pier center has the most obvious influence on the safety factor of overturning stability. When d changes from −10% to +10%, the safety factor of overturning stability increases by 23%; During the construction period, live load q1 and wind load q2 have little influence on the safety factor of overturning stability. When q1 and q2 change from −10% to +10% respectively, the safety factor of overturning stability decreases by less than 1%; The reinforcement resistance P and the self-weight concentration deviation v on both sides of the cantilever have a certain impact on the safety factor of overturning stability. When P and v change from −10% to +10%, the safety factor of overturning stability increases and decreases by 10% respectively.
From the above analysis, it can be seen that in the process of cantilever construction, special attention should be paid to the rationality of temporary consolidation measures, so as to ensure the safety of structural overturning stability; During the construction, strictly control the relative deviation of the weight of the left and right cantilevers, so that the measurement of the cantilevers on both sides is nearly symmetrical, which will be a very effective measure to ensure stability, safety and reliability; The resistance of reinforcement at the temporary consolidation site has certain influence on the overturning stability of the structure; The magnitude of live load and wind load during construction has little influence on the overturning stability, so it is unnecessary to improve the analysis accuracy.
6.3. Reinforcement aera of CFRP
In order to determine the area of CFRP strengthened by random parameters against overturning, the following factors are considered: (1) target reliability index; (2) Random variable parameters.
Taking the target reliability indexes as 3.5, 2.5 and 1.5 respectively, the calculated area of anti-overturning CFRP reinforcement is shown in Table 4. It can be seen from the analysis in Table 4 that the area of anti-overturning CFRP reinforcement decreases with the reduction of the target reliability index, indicating that the area of anti-overturning CFRP reinforcement has an important influence on the reliability index of the structure. Conversely, the CFRP reinforcement area required for different target reliability indexes is different. Therefore, the influence of randomness of parameters should be taken into account when calculating the area of anti-overturning CFRP reinforcement.
Take the mean values of random variables as 0.9, 1.0 and 1.1 times of the original mean values, change the mean values of one random variable each time, and take the original values for the mean values of other random variables. The calculated area of anti-overturning CFRP reinforcement is shown in Table 5. According to the analysis in Table 5, when the mean value of random variables changes, the required anti overturning CFRP reinforcement area is different. Therefore, when calculating the area of anti-overturning CFRP reinforcement, the influence of the mean value of statistical parameters should be accurately considered.
Take the variation coefficients of random variables as 0.5, 1.0 and 2 times of the original mean value, change the variation coefficients of one random variable each time, and take the original values for the variation coefficients of other random variables. The calculated results of anti-overturning CFRP reinforcement area are shown in Table 6. According to the analysis in Table 6, when the coefficient of variation of random variables changes, the required area of anti-overturning CFRP reinforcement is different. The overall trend is that the greater the variability of parameters, the greater the required area of anti-overturning CFRP reinforcement. Therefore, the influence of parameter variability should be accurately considered when calculating the area of anti-overturning CFRP reinforcement.
The general distribution types of random variables are different (see Table 1 for distribution types), all are normal distribution, all are lognormal distribution, and all are extreme value I distribution. The calculated anti overturning CFRP reinforcement area is shown in Table 7. According to the analysis in Table 7, when the distribution type of random variables changes, the required anti overturning CFRP reinforcement area is different. Therefore, the influence of statistical distribution type of parameters should be accurately considered when calculating the area of anti-overturning CFRP reinforcement.
6.4. Safety factors of interval non-probabilitic theory
When using the non-probability reliability theory to calculate the safety factor of overturning stability during the construction stage of the bridge structure in this example, the interval values of each random variable are taken as one standard deviation, that is, the variation interval of the random variable is, which is in line with practical engineering applications. The safety factor for cantilever rotation of the bridge calculated using non probabilistic reliability theory in this example is 1.4213, while the safety factor calculated based on deterministic models is K=1.6042. Using deterministic models to calculate may overestimate the safety performance of bridge structures, resulting in insufficient structural safety reserves and increasing the risk of overturning and instability.
According to the above analysis, it can be seen that in the process of determining the safety factor of bridge cantilever rotation design, the results calculated based on non-probabilistic reliability models are smaller than the results calculated by deterministic models, indicating that the randomness of parameters has a significant impact on the calculation results of the safety factor. In order to quantitatively analyze the specific impact of the statistical characteristics of parameters on the safety factor, parameter sensitivity analysis was conducted on the safety factor of bridge cantilever rotation design from the perspectives of parameter statistical probability model, correlation coefficient, random variable mean, and random variable variation coefficient.
(1) The Influence of Parameter Statistical Probability Model on the Safety Factor of Roadbed Slope Stability
In order to study the influence of parameter statistical probability models of random variables on the safety factor of bridge cantilever rotation stability, it is possible to assume that the random variables follow normal distribution, logarithmic normal distribution, extreme value I type distribution, etc. Each time, the random variables are subjected to a single probability distribution type separately, and then the parameter combinations are subjected to different probability distribution types. The specific calculation results are shown in Table 8.
Through the analysis of Table 8, it can be seen that the statistical probability model of random variables has a significant impact on the safety factor of roadbed slope stability. When different statistical probability distribution types are used for different random variables, the probability safety factors obtained are all smaller than the calculation results of the deterministic model. It is necessary to conduct accurate parameter statistical analysis in engineering practice based on the specific situation of the project, This allows the calculated safety factor to accurately reflect the stability of the slope. In the design of slope stability, different probability models and parameter values are selected based on engineering practice to achieve a balance between safety and economy.
7. Conclusions
In this paper, a research method for safety factor and CFRP reinforcement aera of overturning stability based on symmetrical reliability analysis is proposed. The calculated safety factor and CFRP reinforcement aera takes into account the influence of randomness of structural parameters on the premise of meeting the structural objective reliability index. The following conclusions are drawn:
(1) The randomness of parameters has a great influence on the safety factor and CFRP reinforcement aera of overturning stability. Ignoring the randomness of parameters will make the research on the safety of structural overturning stability unsafe.
(2) The safety factor decreases with the increase of the target reliability index of the structure; For temporary consolidation measures, the distance d between reinforcement and pier center has a great influence on the safety factor; The size of live load and wind load during construction has little influence on the safety factor.
(3) The CFRP reinforcement aera decreases with the increase of the target reliability index of the structure; the mean value, the coefficient of variation, and distribution types of random variables have great influence on the CFRP reinforcement aera;
Author Contributions
Y.L., Z. Z., investigation; D.F., Y. H., writing. All authors have read and agreed to the published version of the manuscript.
Funding
The Natural Science Foundation of Jiangsu Province (Grant No. BK20200793).
Data Availability Statement
The data used to support the findings of this study are available from the corresponding author upon request.
Acknowledgments
The authors wish to express their sincere thanks to the Natural Science Foundation of Jiangsu Province (Grant No. BK20200793).
Conflicts of Interest
The authors declare no conflict of interest.
References
- Ge Yaojun. Bridge Analysis and Control of Segment Construction [M]. Beijing: China Communications Press, 2003. (In Chinese).
- Casas, J.R. Reliability-based partial safety factors in cantilever construction of concrete bridges. J. Struct. Eng. 1997, 123, 305–312. [Google Scholar] [CrossRef]
- Günaydin, M.; Adanur, S.; Altunisik, A.; Sevim, B. Static and dynamic responses of Halgavor Footbridge using steel and FRP materials. Steel Compos. Struct. 2015, 18, 51–69. [Google Scholar] [CrossRef]
- Park, J.-W.; Yoo, J.-H. Flexural and compression behavior for steel structures strengthened with carbon fiber reinforced polymers (CFRPs) sheet. Steel Compos. Struct. 2015, 19, 441–465. [Google Scholar] [CrossRef]
- Lee, H.K.; Kim, B.R.; Ha, S.K. Numerical evaluation of shear strengthening performance of FRP sheets/strips and sprayed FRP coating repair systems. Compos Part B Eng 2008, 39, 851–862. [Google Scholar] [CrossRef]
- Lee, H.K.; Cheong, C.H.; Ha, S.K.; Lee, C.G. Behavior and performance of RC T-section deep beams externally strengthened with CFRP sheets. Compos Struct 2011, 96, 911–922. [Google Scholar] [CrossRef]
- ACI Committee 440. 2002. ACI 440.2R-02: Guide for the design and construction of externally bonded FRP system for strengthening concrete structures. Farmington Hills (MI): ACI; 2002.
- Liang, P.; Xu, Y.; Liu, Y. Unified Analysis Theory of Cable Stay and its Applications. J. Archit. Civ. Eng. 2006, 23, 68–77. (In Chinese) [Google Scholar]
- Wang, Y.; Zhang, Y.; Shi, Y.; et al. Analysis of Load Capacity of New Style Joints Between Cable and Concrete-filled Steel Tube Arch Bridge. J. Archit. Civ. Eng. 2005, 22, 55–58. (In Chinese) [Google Scholar]
- Li Shengyong, Zhang Zhe, Huang Cailiang, et al. Reliability Analysis of Curved Bridge at Maximum Cantilever Construction. J. Wuhan Univ. Technol. (Transp. Sci. Eng.) 2008, 32, 518–521. (In Chinese) [Google Scholar]
- Zhang Jianren, Xu Fuyou. Reliability Analysis of Cantilever Construction Stability of Continuous Girder Bridge. J. Chang. Commun. Univ. 2002, 18, 26–29. (In Chinese) [Google Scholar]
- Luo Zuolong, Dong Fenghui. Reliability Analysis of Cantilever Construction Stability of Continuous Girder Bridge. Highw. Eng. 2002, 18, 26–29. (In Chinese) [Google Scholar]
- Reid, S.G. Specifications of design criteria based on probabilistic measures of design performance. Struct. Saf. 2002, 24, 333–345. [Google Scholar] [CrossRef]
- Tai Kouxia, Ding Dajun. New leaps in construction of bridges in China. J. Archit. Civ. Eng. 2006, 23, 30–40. (In Chinese) [Google Scholar]
- Chen Xuyong, Fan Jianping. Application of convex model based on non-probabilistic concept of reliability in bridge assessment. J. Huazhong Univ. Sci. Technol. 2009, 37, 120–123. (In Chinese) [Google Scholar]
- Chen Xuyong, Hu Haitang, Gao Bingyong. Application of Non-Probabilistic Reliability Theory to Assessment and Reinforcement of Arch Bridges. Bridge Constr. 2016, 46, 60–64. (In Chinese) [Google Scholar]
- Jiang Longping, Xu Kejun. Vibration reliability assessment of aeroengine’s LP2 compressor rotor blade. Gas Turbine Technol. 2005, 18, 18–21. (In Chinese) [Google Scholar]
- Su Yonghua, Chang Weitao, Zhao Minghua. Non Probabilistic Index Analysis Method of the Stability of Deep Rock around Roadway Based on Interval Variable. J. Hunan Univ. 2007, 34, 17–21. (In Chinese) [Google Scholar]
- Jiang Chong, Zhao Minghua, Cao Wengui. Non Probabilistic Reliability Research on Uncertain Parameters in Rock Mechanics. J. Hunan Univ. 2008, 35, 11–14. (In Chinese) [Google Scholar]
- Zhao Minghua, Jiang Chong, Cao Wengui. Non-probabilistic reliability analysis of retaining walls based on interval theory. Chin. J. Geotech. Eng. 2008, 30, 467–472. (In Chinese) [Google Scholar]
- Wang Minrong, Fan Jianping, Chen Xuyong. Non-probabilistic robust optimization design of structures based on interval model. Chin. J. Solid Mech. 2014, 35, 583–588. (In Chinese) [Google Scholar]
- Der Kiureghian, A., Zhang, Y., Li C C. Inverse reliability problem. J. Eng. Mech. ASCE 1994, 120, 1154–1159. [CrossRef]
- Li, H., Foschi R O. An inverse reliability method and application. Struct. Saf. 1998, 20, 257–270. [CrossRef]
- Ma Baolin, Li Ziqing. Long Span Continuous Rigid Frame Bridge with Tall Piers [M]. Beijing: China Communications Press, 2003. (In Chinese).
- <Unified Standard for Reliability Design of Highway Engineering Structures> (GB/T 50283-1999). Beijing: China Planning Press. 1999. (In Chinese).
Disclaimer/Publisher’s Note: The statements, opinions and data contained in all publications are solely those of the individual author (s) and contributor (s) and not of MDPI and/or the editor (s). MDPI and/or the editor (s) disclaim responsibility for any injury to people or property resulting from any ideas, methods, instructions or products referred to in the content. |
Figure 1.
Temporary Anchored Measures.
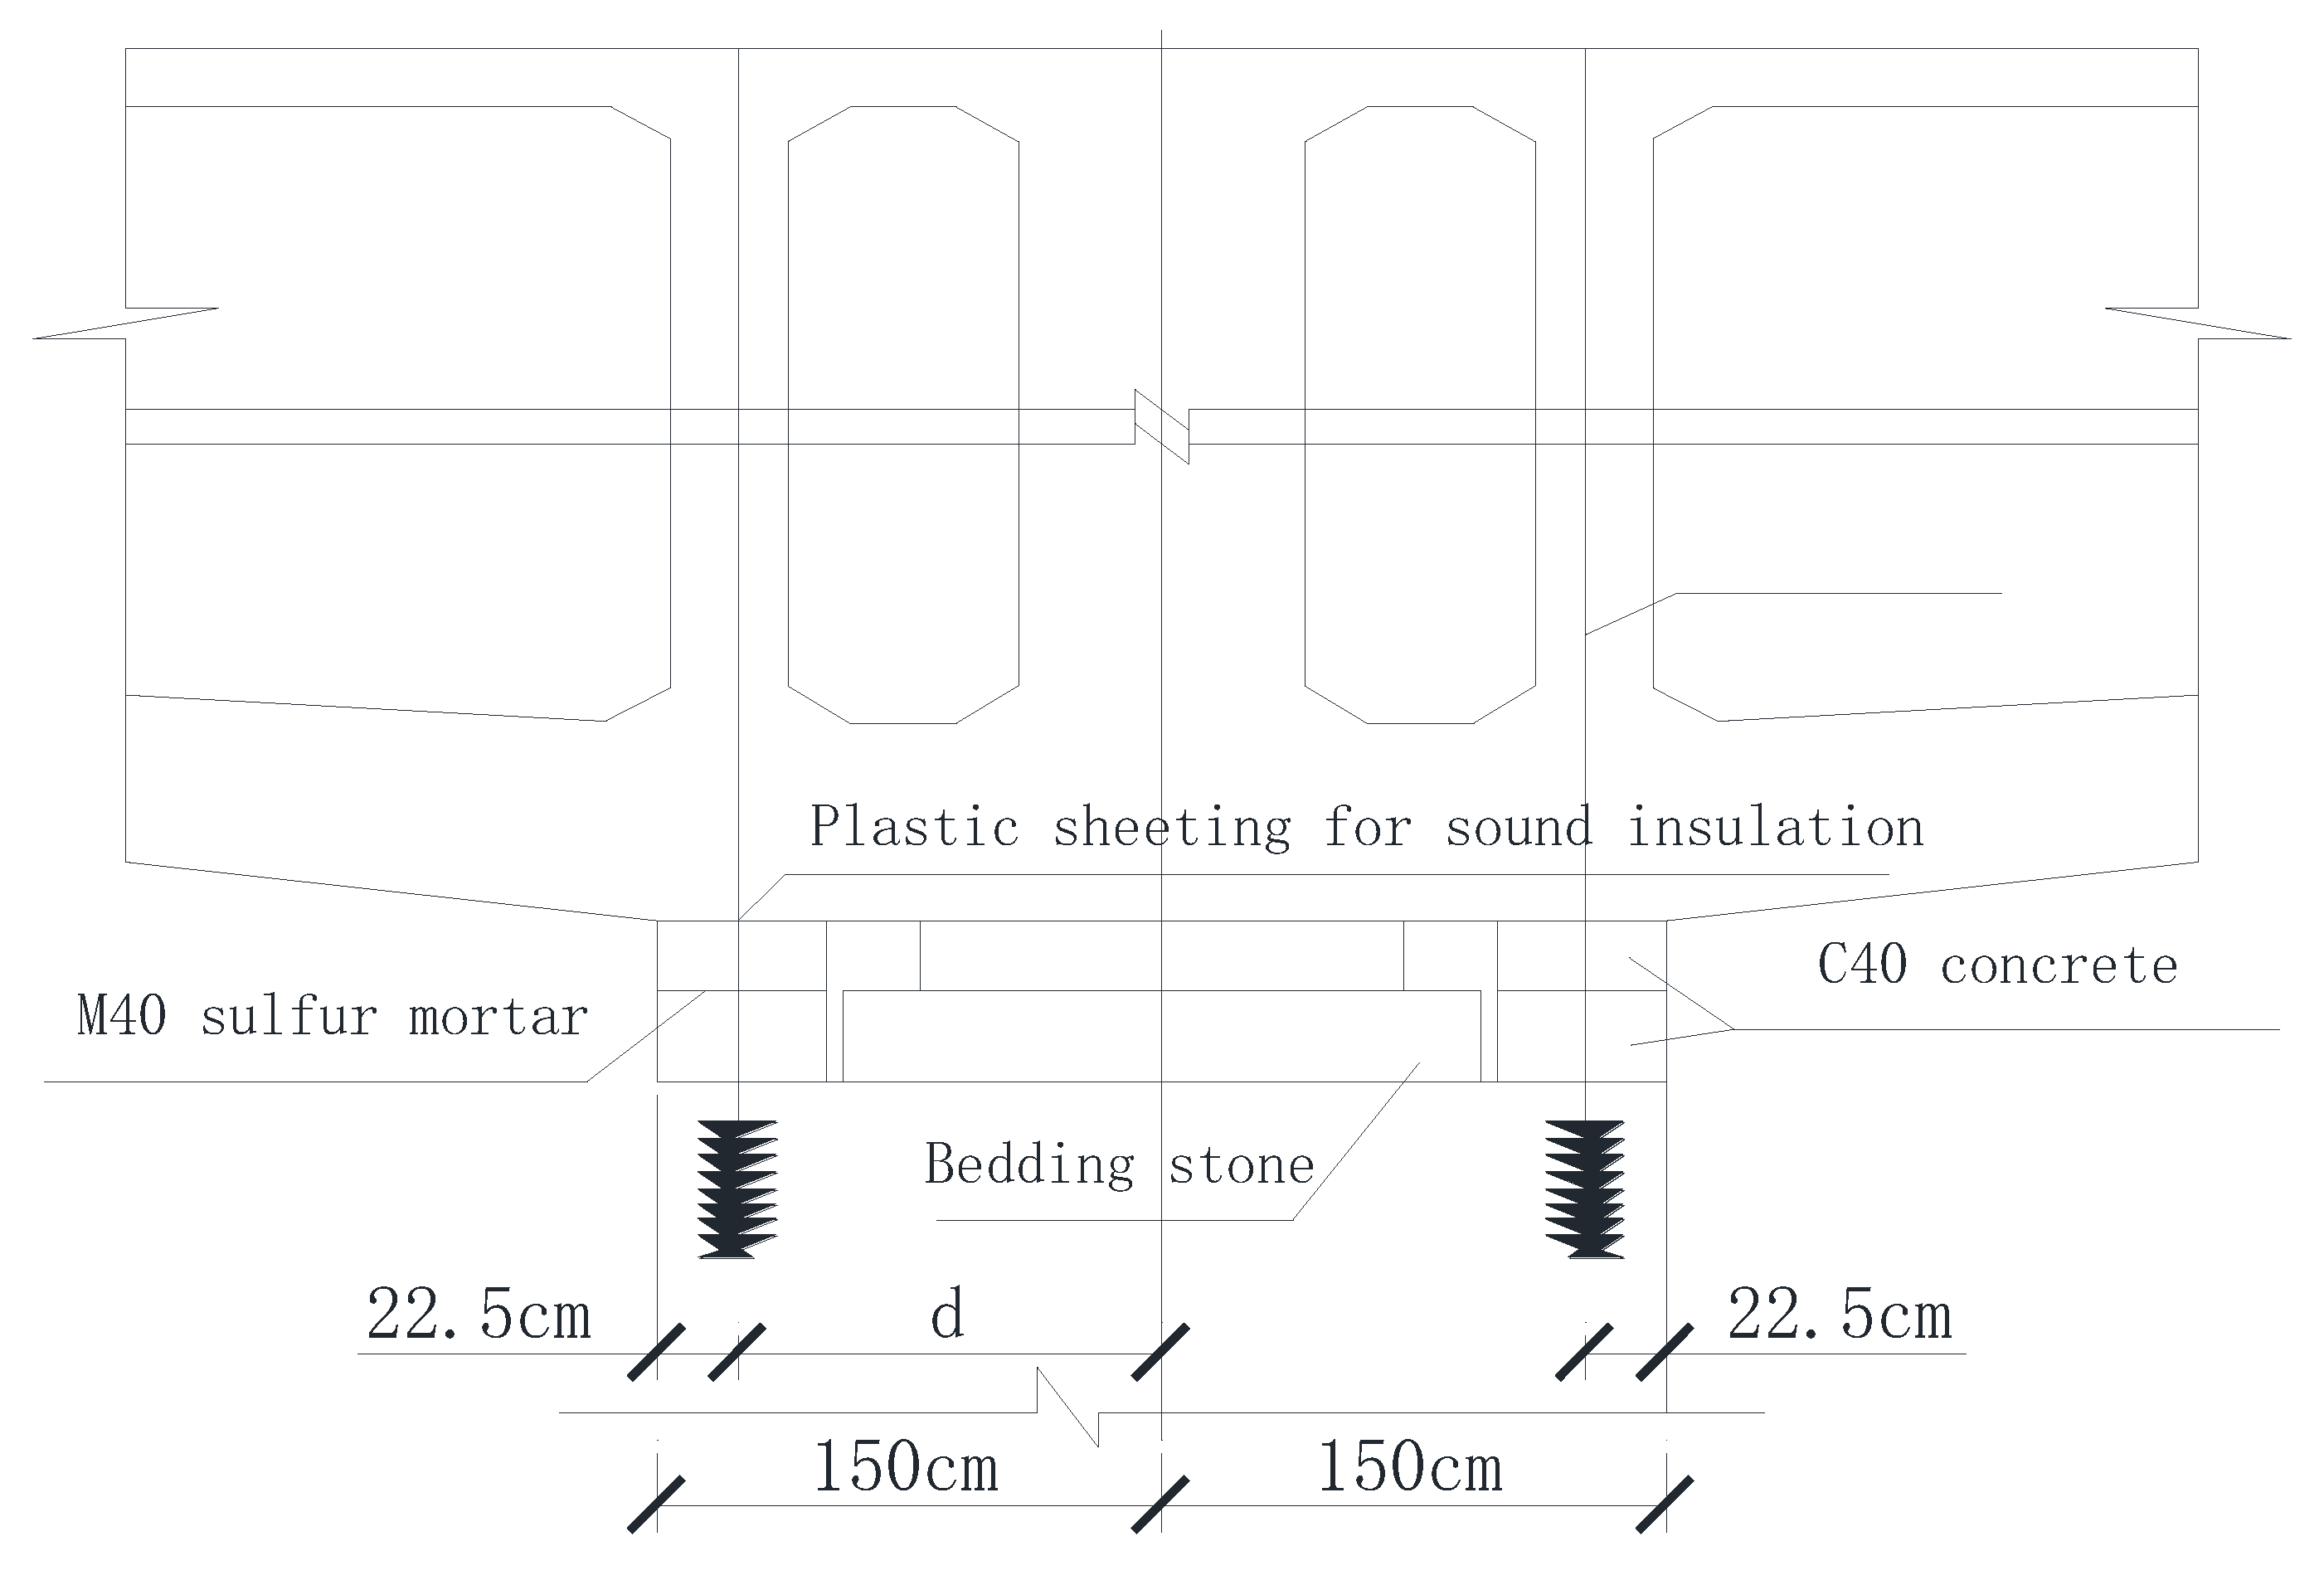
Figure 2.
Overturning Stability Analysis Model of the Longest Cantilever State.
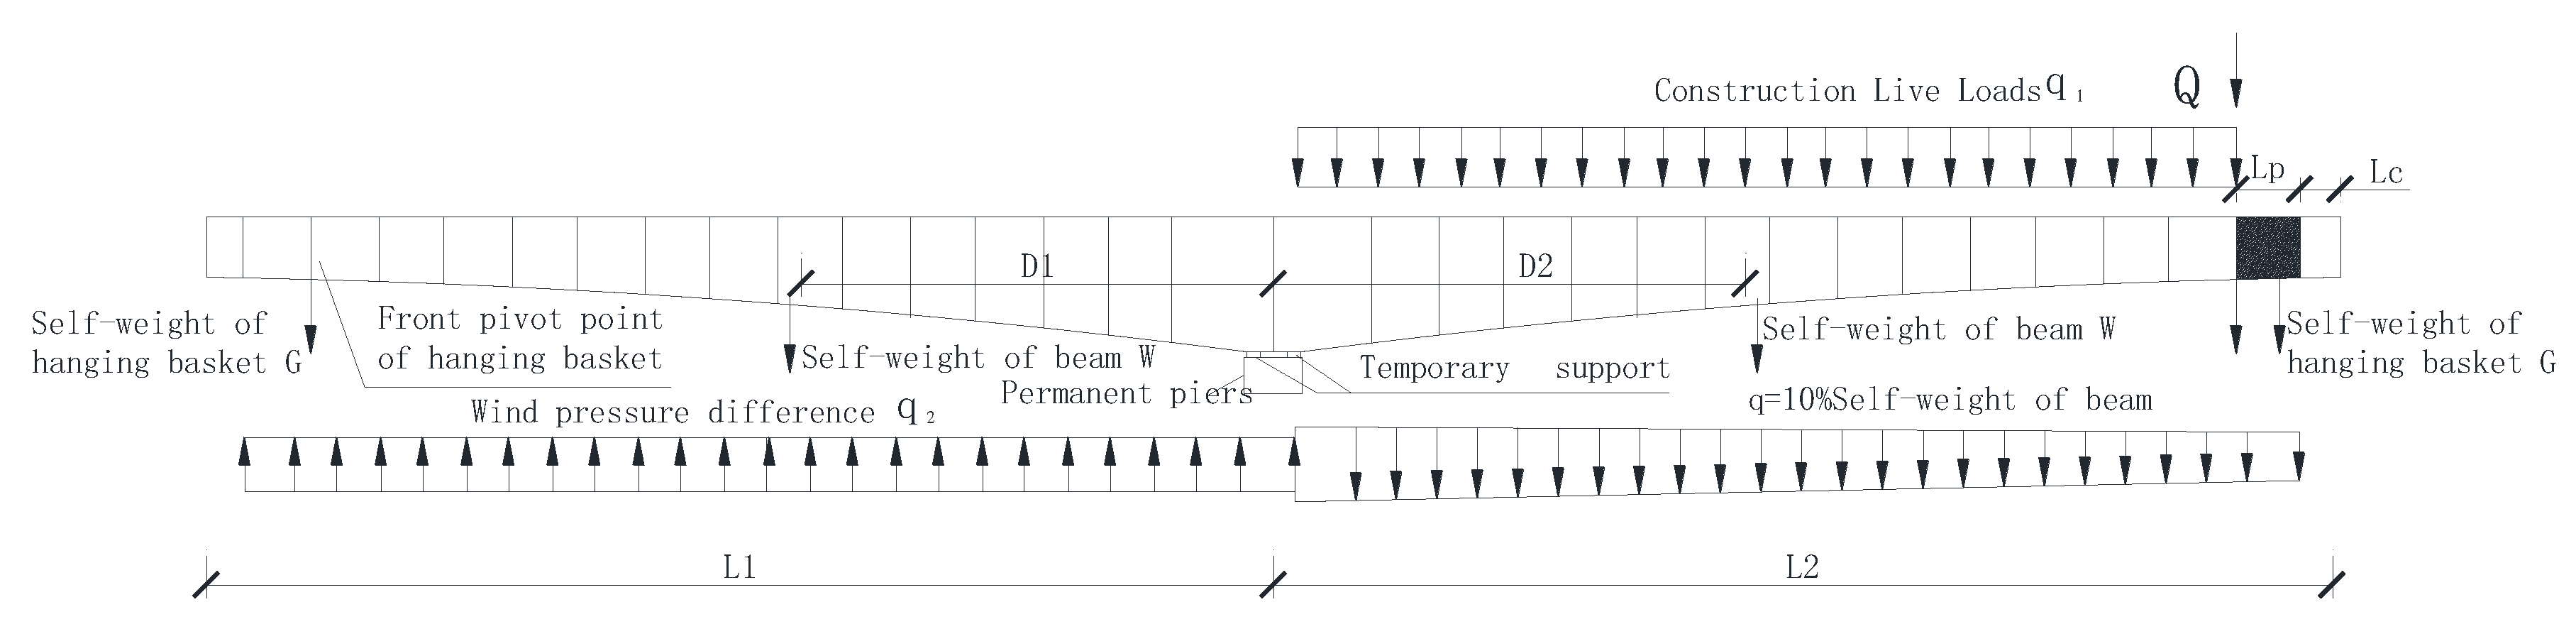
Figure 3.
Parameter Analysis on Stability Safety Factor.
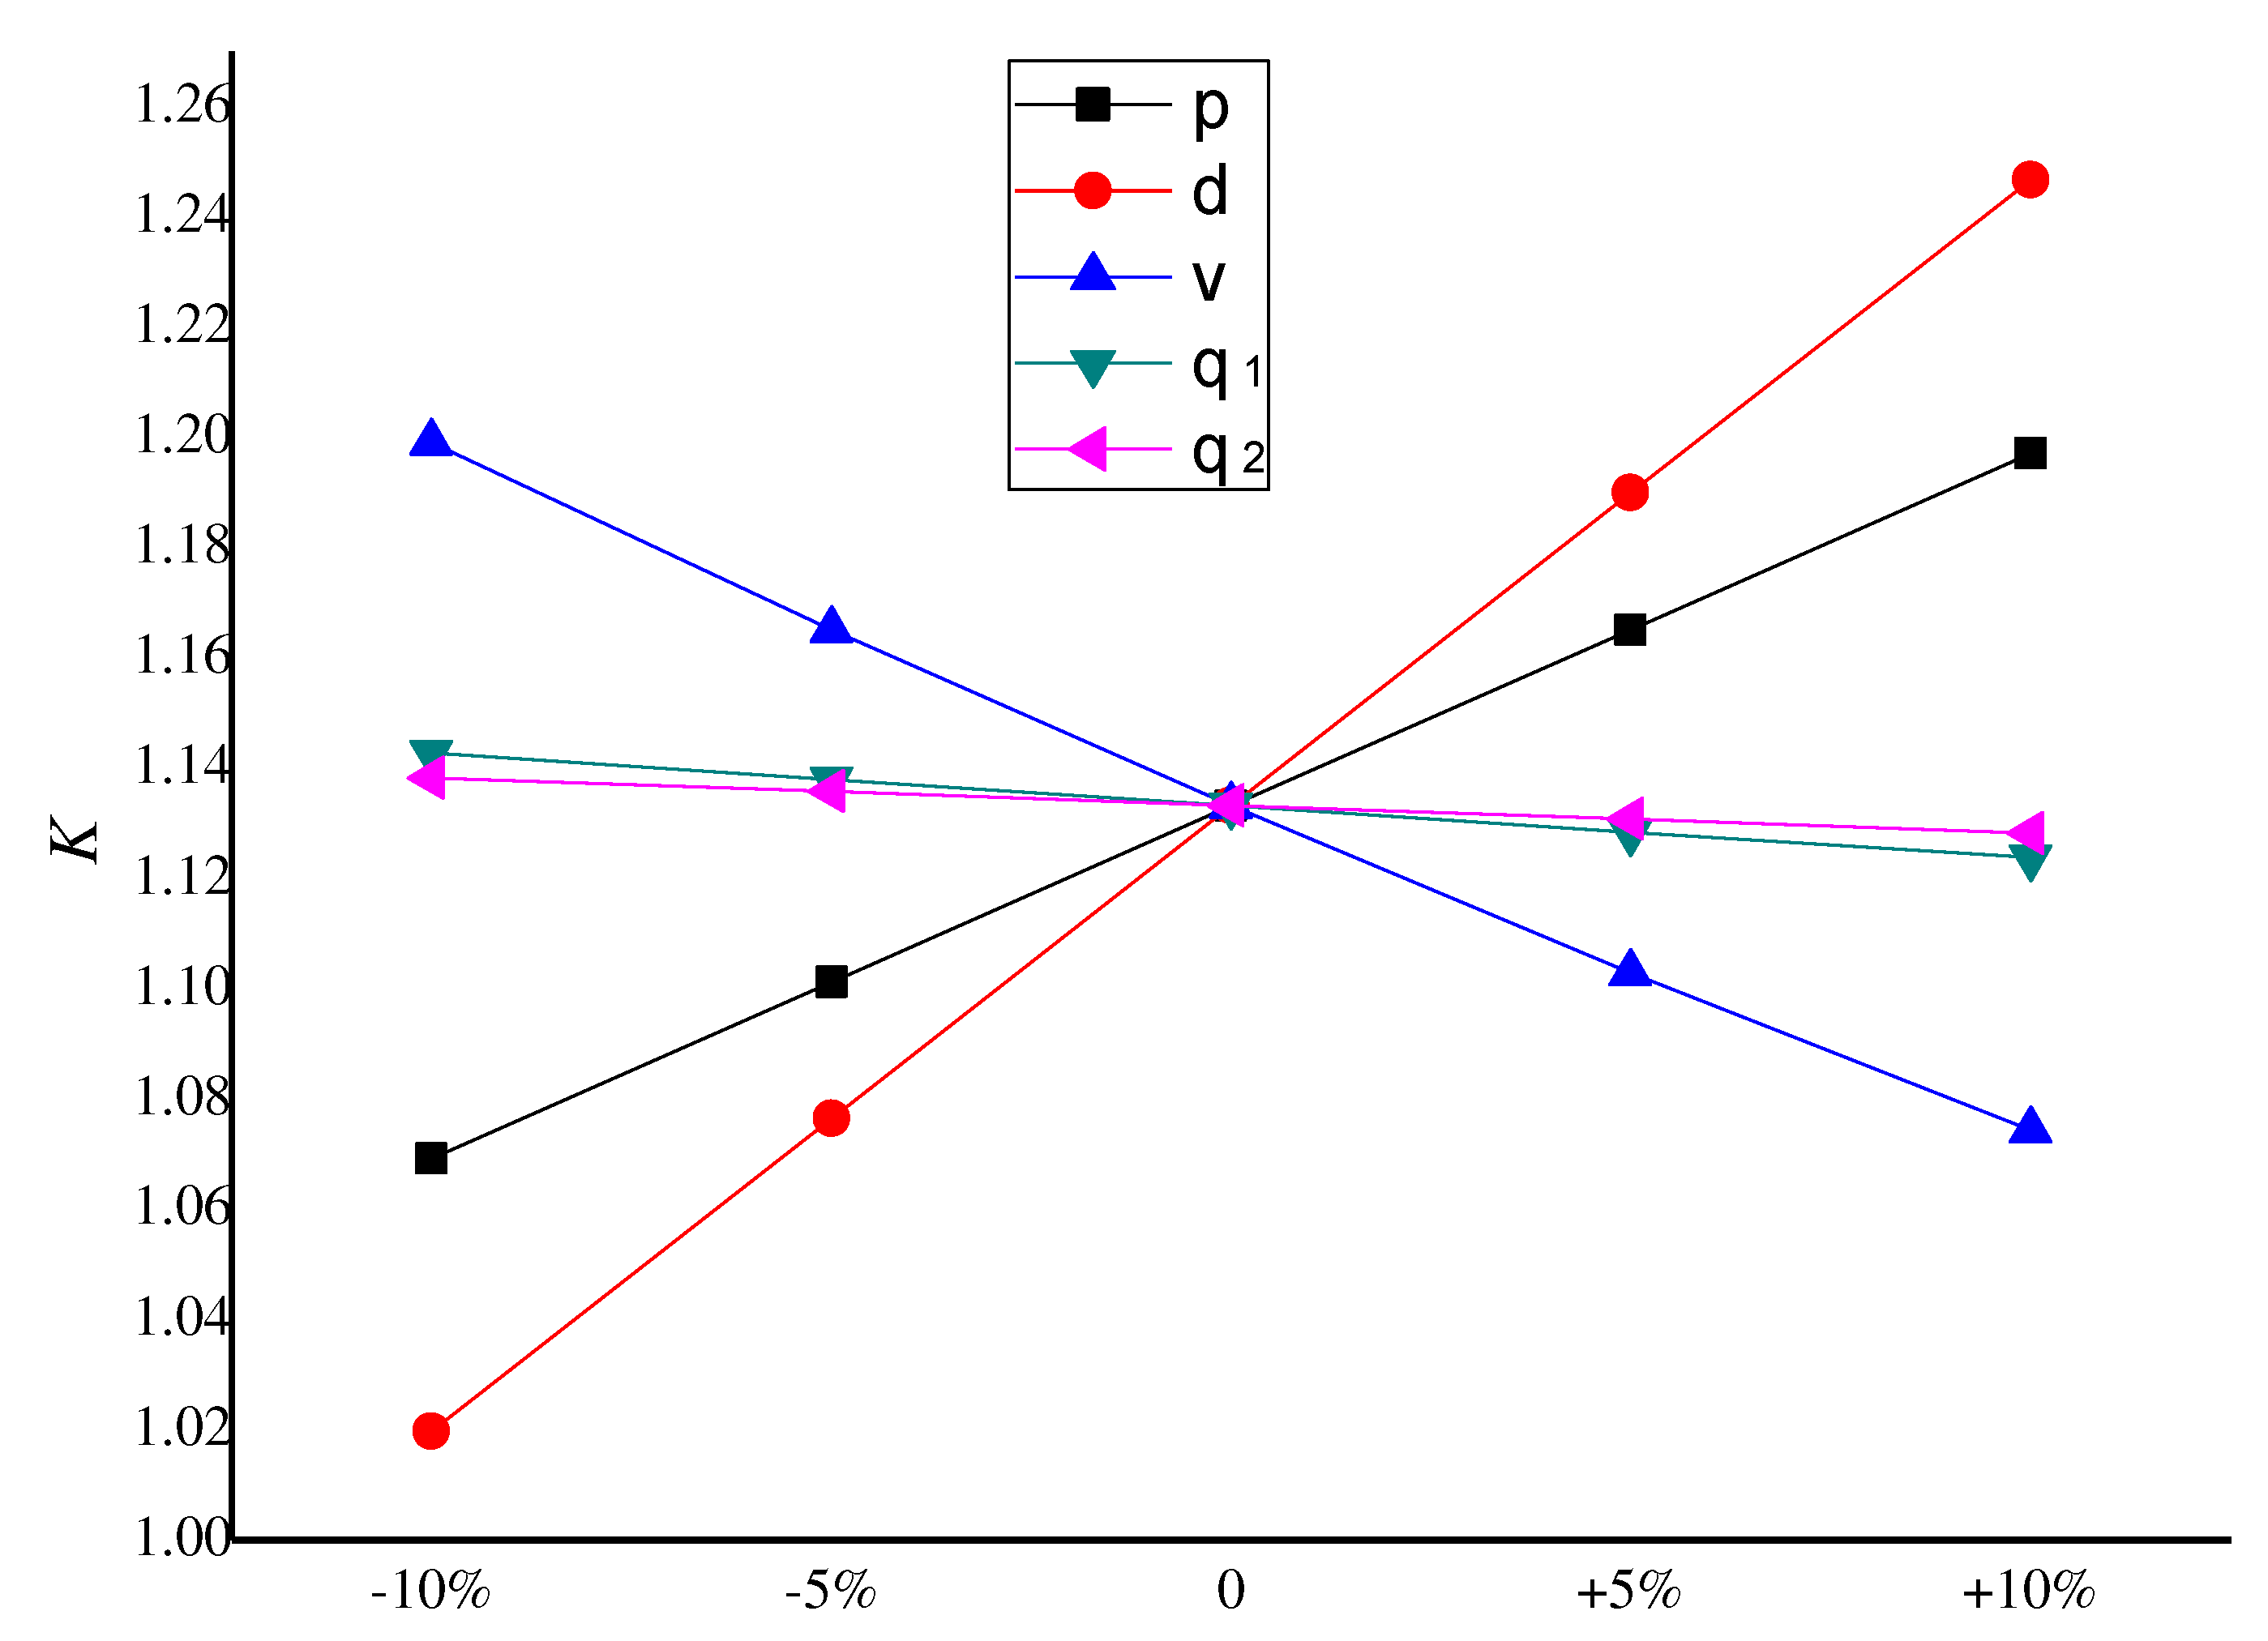

Table 1.
Statistics of Basic Random Parameters.
| Random variables | Probability distribution type | Mean value | Coefficent of variation |
|---|---|---|---|
| Lognormal distribution | 14268 | 0.10 | |
| Normal distribution | 1.28 | 0.10 | |
| Normal distribution | 0.10 | 0.15 | |
| Normal distribution | 0.30 | 0.15 | |
| Extreme-I distribution | 0.15 | 0.15 |
Table 2.
Influence of Reliability Index on Stability Safety Factor.
| Reliability index | 1.5 | 2.0 | 2.5 | 3.0 | 3.5 |
|---|---|---|---|---|---|
| Safety factor based on reliability model | 1.3170 | 1.2229 | 1.1332 | 1.0473 | 0.9647 |
| Safety factor based on deterministic model | 1.6042 | 1.6042 | 1.6042 | 1.6042 | 1.6042 |
Table 3.
Influence of Reliability Index on Variable Mean Value.
| Mean value | Safety factor | Mean value | Safety factor | Mean value | Safety factor | Mean value | Safety factor | Mean value | Safety factor |
|---|---|---|---|---|---|---|---|---|---|
| -10% | 1.0692 | -10% | 1.0197 | -10% | 1.1990 | -10% | 1.1427 | -10% | 1.1382 |
| -5% | 1.1012 | -5% | 1.0764 | -5% | 1.1651 | -5% | 1.1379 | -5% | 1.1357 |
| 0 | 1.1332 | 0 | 1.1332 | 0 | 1.1332 | 0 | 1.1332 | 0 | 1.1332 |
| +5% | 1.1651 | +5% | 1.1899 | +5% | 1.1029 | +5% | 1.1284 | +5% | 1.1307 |
| +10% | 1.1971 | +10% | 1.2467 | +10% | 1.0743 | +10% | 1.1238 | +10% | 1.1282 |
Table 4.
Influence of Target Reliability Index on CFRP Reinforcement Area.
| Target reliability index | 3.5 | 2.5 | 1.5 |
|---|---|---|---|
| CFRP reinforcement aera | 602 mm2 | 563 mm2 | 519mm2 |
Table 5.
Influence of mean value of random variable on CFRP reinforcement area (mm2).
| Random Variables | Mean Value | ||
|---|---|---|---|
| 0.9 | 1.0 | 1.1 | |
| 574 | 563 | 559 | |
| 574 | 563 | 559 | |
| 582 | 563 | 547 | |
| 571 | 563 | 554 |
Table 6.
Effect of variation coefficient of random variable on area of overturned CFRP reinforcement (mm2).
Table 6.
Effect of variation coefficient of random variable on area of overturned CFRP reinforcement (mm2).
| Random variables | Coefficients of variation | ||
|---|---|---|---|
| 0.5 | 1.0 | 2.0 | |
| 528 | 563 | 592 | |
| 526 | 563 | 594 | |
| 539 | 563 | 588 | |
| 551 | 563 | 574 | |
Table 7.
Influence of probability distribution types of random variables on the area of overturned CFRP reinforcement (mm2).
Table 7.
Influence of probability distribution types of random variables on the area of overturned CFRP reinforcement (mm2).
| Random variable distribution type | Different distributions | Normal distribution | Log-normal distribution | Extreme-value I distribution |
|---|---|---|---|---|
| Anti overturning CFRP reinforcement area | 563 | 578 | 539 | 501 |
Table 8.
The Influence of Random Variable Statistical Probability Models on Safety Factors.
| Combination of probability distribution types of random variables | Cantilever rotation stability safety factor | ||
|---|---|---|---|
| 1.4213 | |||
| normal distribution | normal distribution | normal distribution | 1.4229 |
| Lognormal distribution | Lognormal distribution | Lognormal distribution | 1.3289 |
| Extreme value type I distribution | Extreme value type I distribution | Extreme value type I distribution | 1.3382 |
| normal distribution | Lognormal distribution | Lognormal distribution | 1.4128 |
| normal distribution | Extreme value type I distribution | Extreme value type I distribution | 1.4436 |
| Lognormal distribution | normal distribution | Lognormal distribution | 1.2267 |
| Extreme value type I distribution | normal distribution | Extreme value type I distribution | 1.3172 |
| Lognormal distribution | Lognormal distribution | normal distribution | 1.4627 |
| Extreme value type I distribution | Extreme value type I distribution | normal distribution | 1.5126 |
Disclaimer/Publisher’s Note: The statements, opinions and data contained in all publications are solely those of the individual author(s) and contributor(s) and not of MDPI and/or the editor(s). MDPI and/or the editor(s) disclaim responsibility for any injury to people or property resulting from any ideas, methods, instructions or products referred to in the content. |
© 2023 by the authors. Licensee MDPI, Basel, Switzerland. This article is an open access article distributed under the terms and conditions of the Creative Commons Attribution (CC BY) license (http://creativecommons.org/licenses/by/4.0/).
Copyright: This open access article is published under a Creative Commons CC BY 4.0 license, which permit the free download, distribution, and reuse, provided that the author and preprint are cited in any reuse.


