1. Introduction
In this paper, an analysis of the system capacity of a Wide Area Network (WAN) is presented. The WAN is served by a set of Gateways (GW). Each GW serves to multiple End Nodes (ENs). The WAN can be for a house, an apartment complex, a farm or for an enterprise comprised of smart sensors. Each WAN is a form of Internet-of-Things (IoT) network that is connected to a cloud-based application. The prevalence of IoT devices onsite allows remote real-time monitoring via GWs. The GWs can be any device that has connection to the Internet and the cloud server. These devices have multiple connectivity hardware (HW). First, they have a narrow-band IoT capable communications HW that can directly connect to the sensors. Second, they have dedicated Wi-Fi connectivity HW to route the sensor data to the Internet/cloud server. The GWs can typically have access to a power source, hence complexity of the network is added to the GWs while simplifying the protocol for the sensors. The number of sensor devices and GWs in each home, apartment complex or an enterprise is expected to grow exponentially. Hence, it is important to understand the limits of such networks in terms of total number of devices that can be supported with a good Quality of Service (QoS). These devices are installed by the general public in locations in and around a house/neighborhood. Given the use of ISM bands, these networks will experience interference from other networks. This study provides an in-depth model for performance evaluation of such networks versus the size of the co-existing devices. The performance evaluation is provided for the coverage area, GW density, latency and Packet Success Rates (PSR).
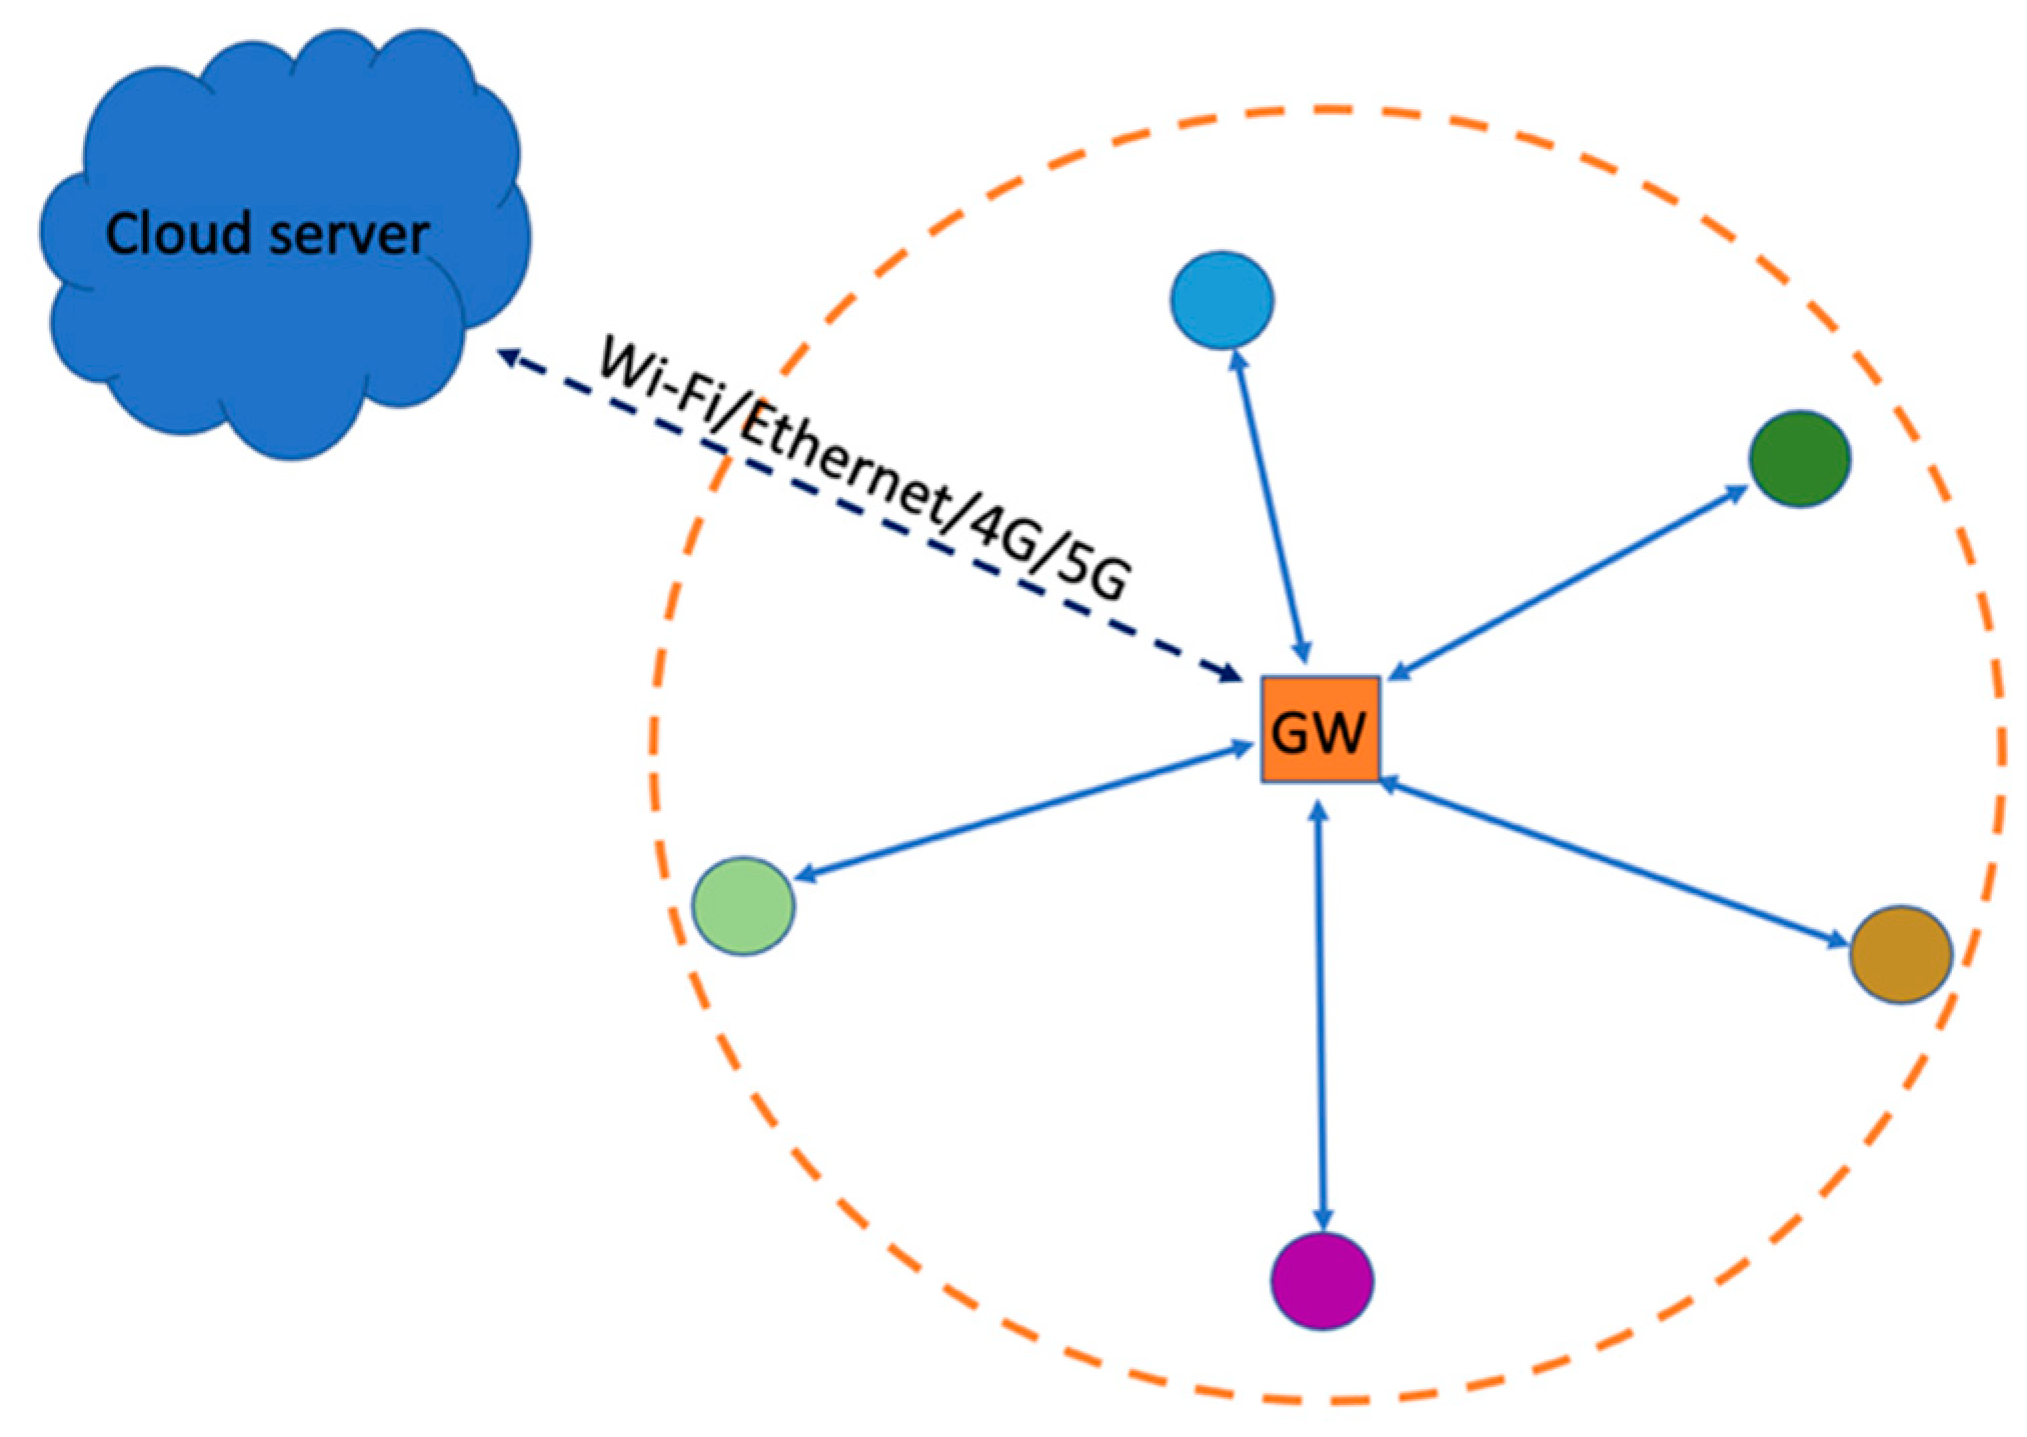
The GWs have access to a power outlet and Internet, hence they can be used as central devices with more sophisticated system operations to serve and simplify the WAN sensors. In this paper, it is assumed that the IoT sensors connect to the GW with a star network topology. This is illustrated in
Figure 1 [
1]. Having a multi-hop mesh topology is not recommended due to the already low bit-rates available in each link. Coverage issue is overcome by GW diversity instead [
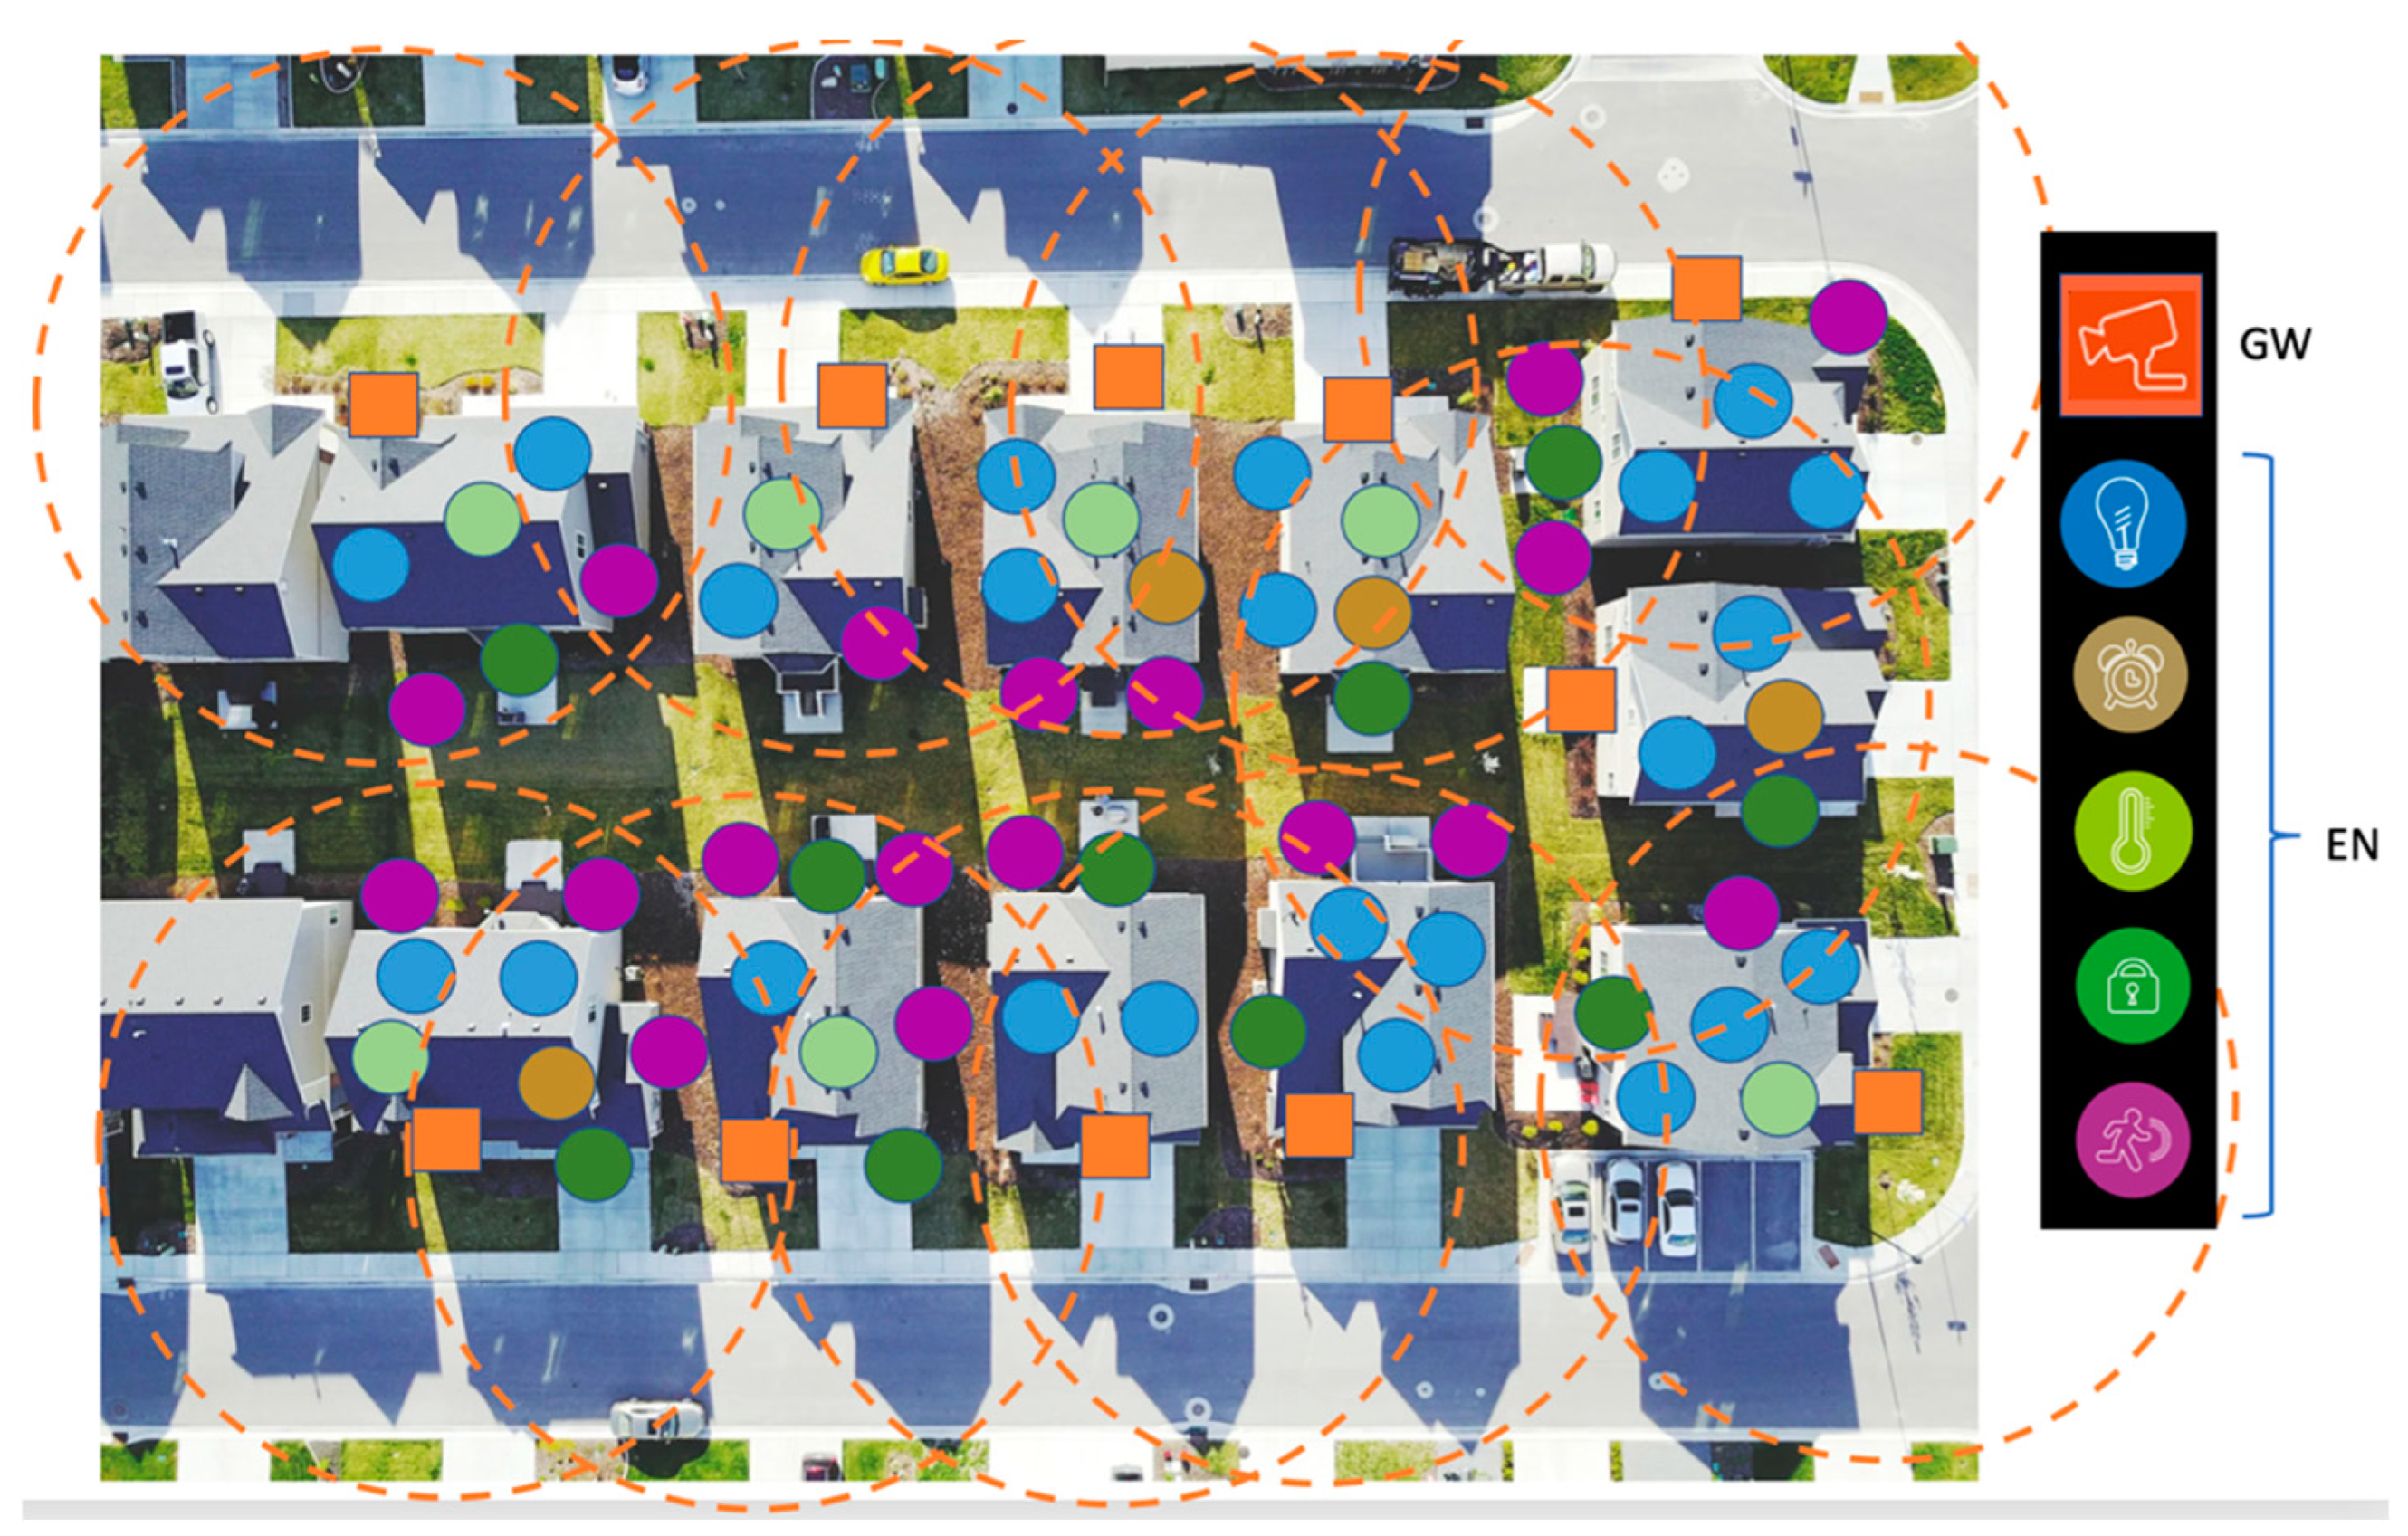
2]. With GW diversity provided by the network operator, sensors can access the cloud via the closest neighbor’s GW or via the user’s own GW. The ENs serve as sensors for various IoT applications and are typically battery operated. These applications can be motion sensing, smart lock and contact sensing, geo-fencing, smart metering, temperature sensing, asset/pet tracking, and any other IoT applications. This is illustrated in
Figure 2. All the GWs connect to the Cloud server, where the scale of the WAN can be extended to the scale of a Wide Area Network (WAN). Since the WAN is operated in an un-licensed frequency spectrum, it needs to co-exist among other WANs as illustrated in
Figure 2. Each one of the star networks (i.e., each WAN) operates independently from all the other star networks; but the GWs can access to the same cloud server. For such a network, further system optimizations among the GWs can be done centrally via the cloud server. With a narrow-band connectivity hardware suitable for low-bitrate IoT applications, the coverage area of each GW can span to few hundreds of meters, causing interference to the neighboring GWs. Hence, it is important to understand the system performance within such an interference rich environment.
In this study, system capacity is defined in terms of the number of Gateways (GWs) needed to be able to serve a given geographical area. The analysis is provided for Packet Success Rate (PSR) and latency versus number of End Nodes (ENs) as they join the network. The analysis is extended to include the neighboring GWs which interfere with the primary GW. The paper presents how distance to a GW is mapped to a PSR and Carrier-to-Interference (C/I) ratio. The channel access is assumed to be over the sub-GHz Industrial, Scientific, Medical (ISM) band, also known as 915 MHz band in the U.S. and 868 MHz band in Europe. Hence, the system is impacted by not only intra-network interference from neighboring GWs, but also the inter-network interference from other networks. While interference in the environment cannot be controlled, intra-network interference can be reduced by using efficient channel access algorithms such as Listen Before Talk (LBT) and frequency hopping or time slotted channel hopping (TSCH) [1, 3]. To control the collisions in random medium access, various techniques such as carrier sense, and random backoff mechanisms can be used [1-12]. Collisions refer to the simultaneous use of the same radio channel by two or more devices transmitting at the same time. Collisions cause co-channel interference. It occurs when there are one or more interfering signals present in the channel during communication between the desired transmitter and receiver. The LBT requires the transmitter to transmit only when the channel is determined to be idle by a carrier activity detection (CAD). If the CAD determines the medium to be busy, the backoff mechanism described in section 2.A forces each end node to wait for a random period before attempting retransmission. This improves the performance by reducing the collisions. However, LBT scheme suffers from hidden-node problem where two nodes might be out of coverage to each other while causing interference to a given GW [
13].
The LBT mechanism is used for the Uplink (UL) transmissions by the ENs to avoid interfering each other and the other beacons of neighboring GWs. This improves the performance significantly [1-12]. Nonetheless, in the Downlink (DL), Gateway devices (GWs) do not employ the Listen-Before-Talk (LBT) mechanism. Instead, GWs are required to periodically transmit their high-priority beacons, sending one beacon at each beacon interval. This practice is essential to prevent End Nodes (ENs) from losing synchronization with the desired GW, which could lead to network disconnection, particularly when consecutive beacon signal losses occur. This study primarily examines the performance of beacon collisions in between multiple GWs and their success rates as received by the ENs. The paper is organized as follows. In
Section 2, the system model regarding the channel access scheme, interference, and path-loss models are presented.
Section 3 presents the Physical (PHY) layer model with GFSK modulation parameters specifically tailored for narrowband IoT sensors. Such parameters study has not been previously explored, making it of significant importance for narrowband devices. The theoretical analysis on the beacon collision probability versus network size is presented in
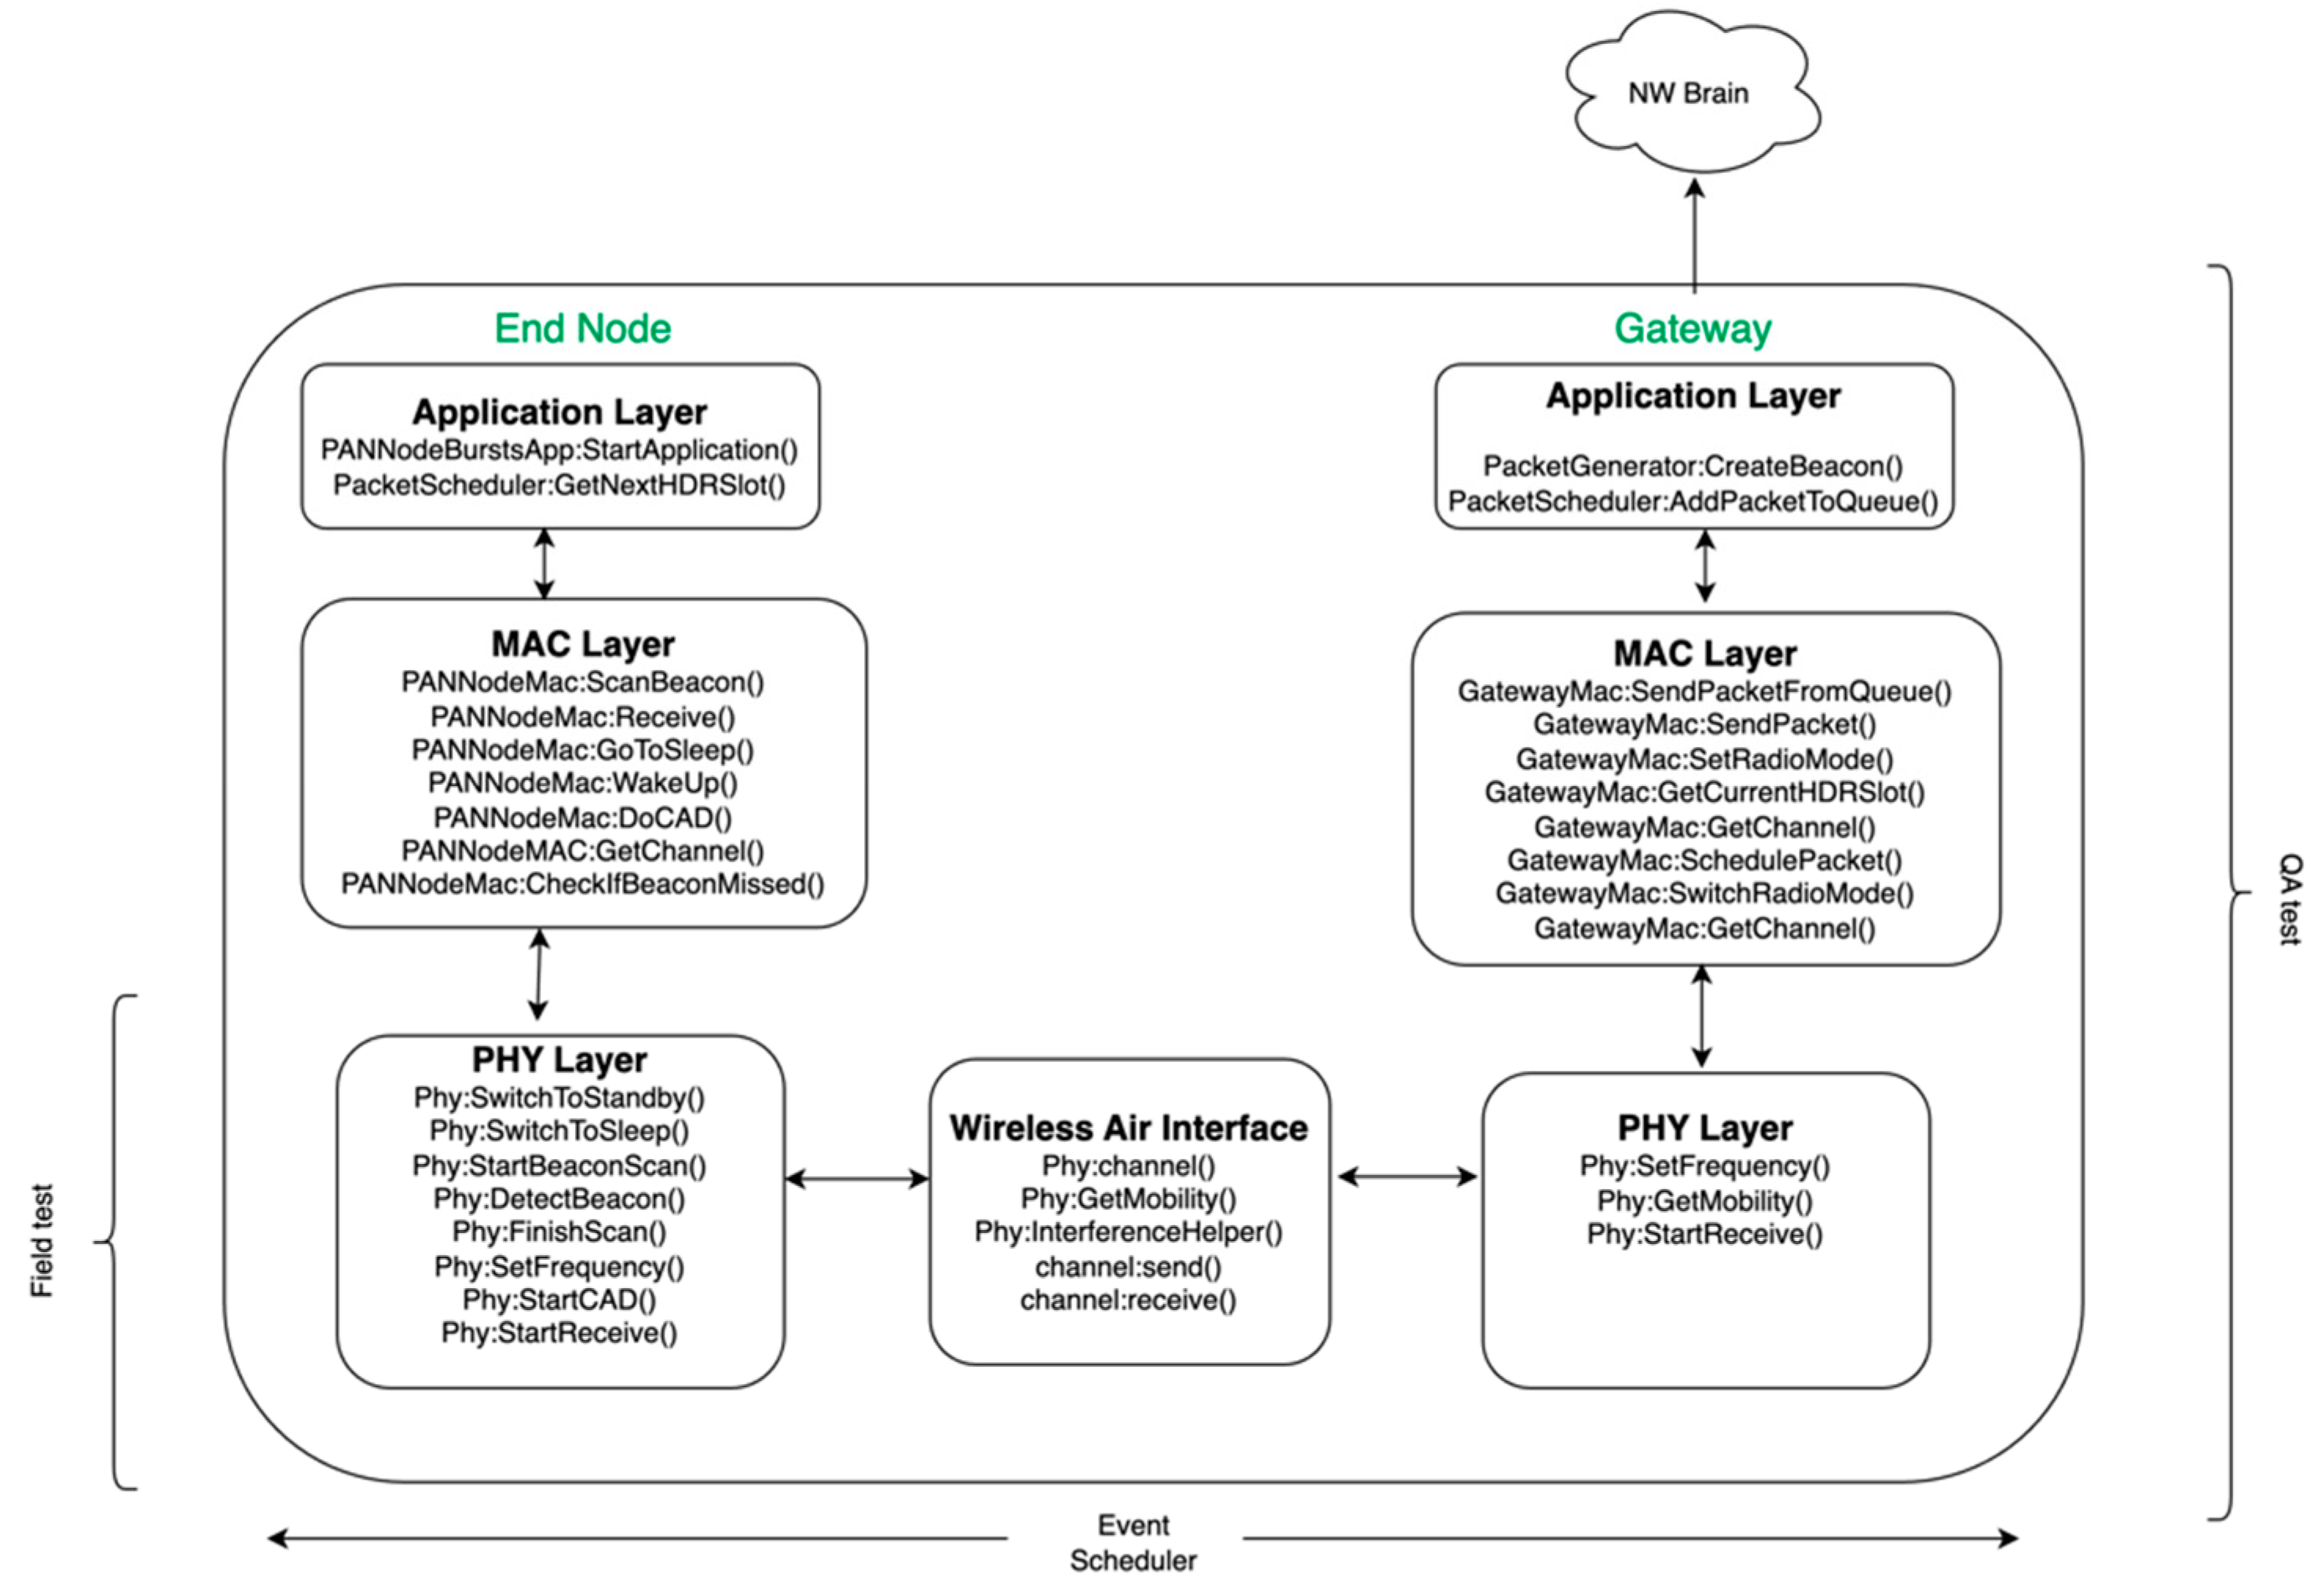
Section 4. The simulator architecture is presented in
Section 5. Finally, the numerical simulation results on the collision probability versus network density are presented in
Section 6 with the PHY and MAC layer models. The conclusions out of this study are presented in
Section 7.
2. System Model
In this section, the channel access and interference model along with the path loss model are presented which are used in our simulations. The IEEE 802.15.4 standard specifies the MAC and PHY layers of Low-Rate Wireless Personal and Wide Area Networks [
1]. It provides the basis of various IoT standards that find applications in smart home automation and sensor networks. Hence, the system parameters selected in this study are based on the 802.15.4 specification.
- (A)
Channel Access
In this section, the channel access scheme is presented. Each GW periodically broadcasts beacons which allow the ENs to discover the GW and join its WAN. In other words, the ENs connect to a nearby GW by scanning its advertising beacons. The Beacon frame format is used for broadcasting radio configuration parameters from the GWs. Endpoints use the information in the Beacon frame to choose a Gateway and for maintenance of the Gateway-Endpoint connection, such as power control and channel hopping.
Endpoints working in synchronous connection mode shall be synchronized with a Gateway before an uplink or downlink transmission is performed. The synchronization mechanism works by searching for a periodic frame sent by Gateways, namely Beacon frames. The time in between the two consecutive beacons is referred to as beacon interval or beacon period. When initially joining the WAN network, the ENs detect available Gateways by performing a beacon scan process where all channels are swept for beacon preambles. When a preamble is detected on a channel, the EN will lock onto the channel in attempts to receive a beacon. If a beacon is successfully received and decoded, the EN will use the timing and parameters transmitted within the payload of the beacon to acquire synchronization with that particular GW.
Frequency Hopping Spread Spectrum (FHSS) is used and hopping sequence is determined by the GWs. The beacon’s payload provides synchronization information such as GW seed and beacon sequence number information. This is used by the EN for frequency hopping sequence calculations. Time synchronization is maintained by periodic beacon transmissions by each GW. The beacon payload can also carry additional information about the state of the Gateway, such as current Gateway load, cloud connectivity status, roaming support, or information about the other nearby gateways belonging to the same network. This additional data can influence gateway selection by the EN when multiple gateways are available. Beacons provide time and channel synchronization and network discovery across the network. The periodicity of the beacons provides time synchronization, while the sequence number and seed provide channel synchronization. Each WAN is served by one GW, but the EN can choose from multiple GWs available in the NW. After beacon discovery, if an EN can no longer receive consecutive beacons, for e.g., at least three times, then it falls out of the WAN and needs to re-scan for beacons from other GWs.
The WAN network is a synchronized system following a star network topology, where there are specific time slots for transmission and reception. There are fixed 160 time slots from the start of beacon transmission to the start of consecutive beacon transmission. Slots 0-3 are reserved for beacon transmission, while the remaining 156 time slots are available for data transmission shared across the entire WAN. The beacon interval and the number of slots can be programmed to different values to optimize the overall network performance in terms of collision probability and the number of devices that can be supported with a good QoS.
The FHSS uses 69 channels in the ISM band starting from 902.2 MHz carrier frequency and up to 927.8 MHz in 2MHz spacing. The channel calculations for the Beacon broadcasting and Endpoint uplink or downlink transmissions are calculated separately. The result of the calculations is a hopping sequence that is derived from the total number of channels available for upcoming transmissions. The hopping sequence is calculated by shuffling the channel list through a channel shuffler. This channel shuffler is shuffled by iterative calls to a pseudo random number generator (PRNG) seeded by the seed and sequence number. This PRNG is of type linear feedback shift register (LFSR). This shuffle provides a hopping sequence that guarantees all channels will be visited exactly once within each full hopping cycle. The channel shuffler used for beacon calculation for DL is different than those used for UL data transmission due to differences in periodicity. Each beacon is sent in one channel. Hence, the beacon channel shuffler is only drawn once every beacon interval. The data transmissions in UL can be done in one out of 156 slots. Hence, the data channel shuffler is drawn 156 times within each beacon. This way, the GW can also determine which channels to listen to during UL.
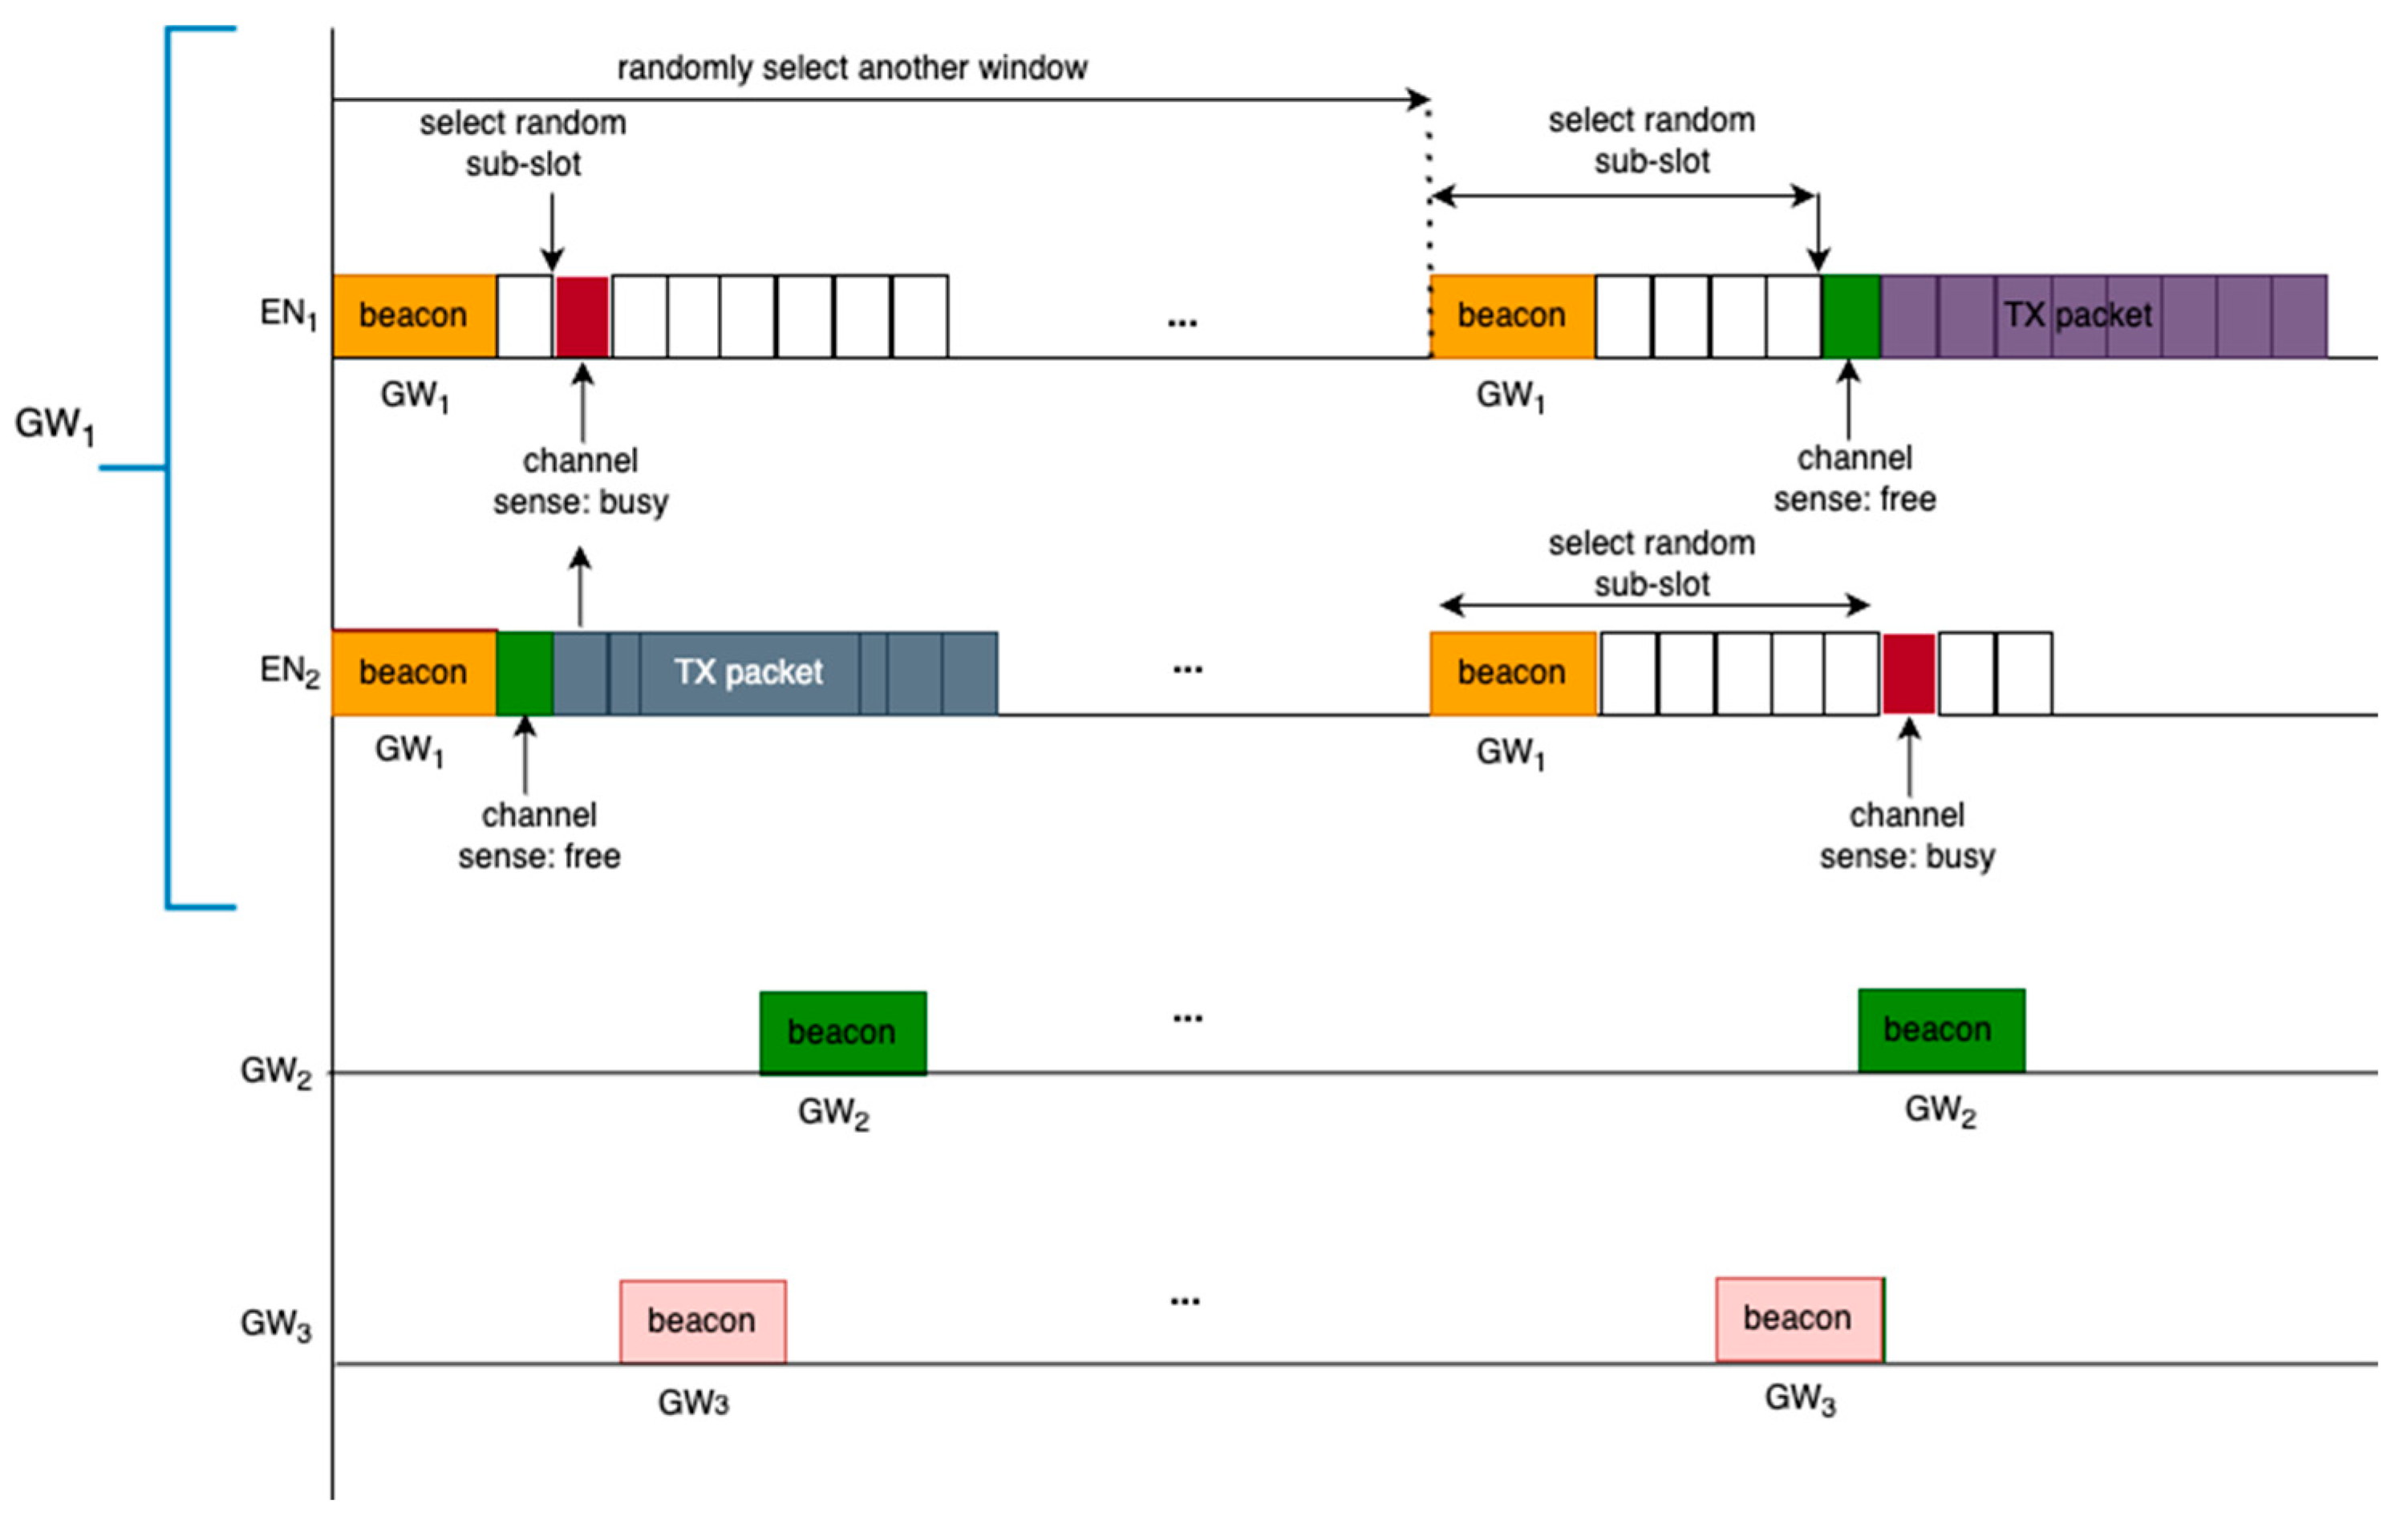
The previous paragraphs described how a synchronized connection is established in between an EN and a GW based on the beacons. As part of the mechanism to minimize interference, non-beacon packets (i.e., the data packets) use Listen Before Talk (LBT) mechanism. When an EN has a packet that needs to be transmitted in the queue, it first randomly selects one of the next 4 transmission slots relative to the beacon start time. It then selects one out of the 6 LBT sub-slots by drawing from a geometric random distribution. It will then schedule for the LBT operation to occur at the correct time based off of the time slot and LBT sub-slot. When the scheduled LBT operation occurs, the EN first listens to determine if anyone else is actively transmitting a packet by entering in preamble detection mode. If the medium is available, i.e., when there is no preamble detected from others, then the EN starts its UL data transmission. If the medium is detected to be busy, then the EN backs-off a random duration by selecting one of next set of 4 transmission slots. From there, it will select an LBT sub-slot where it will repeat the LBT process. This is illustrated in
Figure 3. The connection to a GW is established via successful discovery of the beacon in the DL and when the GW registers the EN by receiving the UL packets from it. This channel access scheme reduces the chances of packet collisions within the WAN as ENs join the network, but it does not guarantee a collision free medium. An analysis of such capacity will be presented in
Section 6. The analysis shows that the system capacity depends on the number of channels available for FHSS, the number of ENs in the desired WAN, the number of ENs in the neighboring WAN, the number of GWs in the area, and airtimes of the packets (beacon interval, beacon duration, UL packet durations and UL packet rates).
- (B)
The Co-channel Interference Model
In this section, the co-channel interference model is presented. The packets can potentially collide due to the shared medium access with finite number of channels and finite number of transmission slots. Collisions occur when transmission attempts occur on the same channel and overlap in time. Within the same WAN network, this occurs when the same transmission slot and same LBT sub-slot is selected. When both of these conditions are met, the same channel is selected, and LBT returns channel clear during LBT for both transmissions, leading to both devices starting TX. Although collision avoidance is in place for the ENs within the coverage of a given GW, collisions on a beacon can still happen from the neighboring devices. This is illustrated in
Figure 3, where the beacon of GW
2 is interfered by the UL packet from EN
1 which is connected to GW
1.
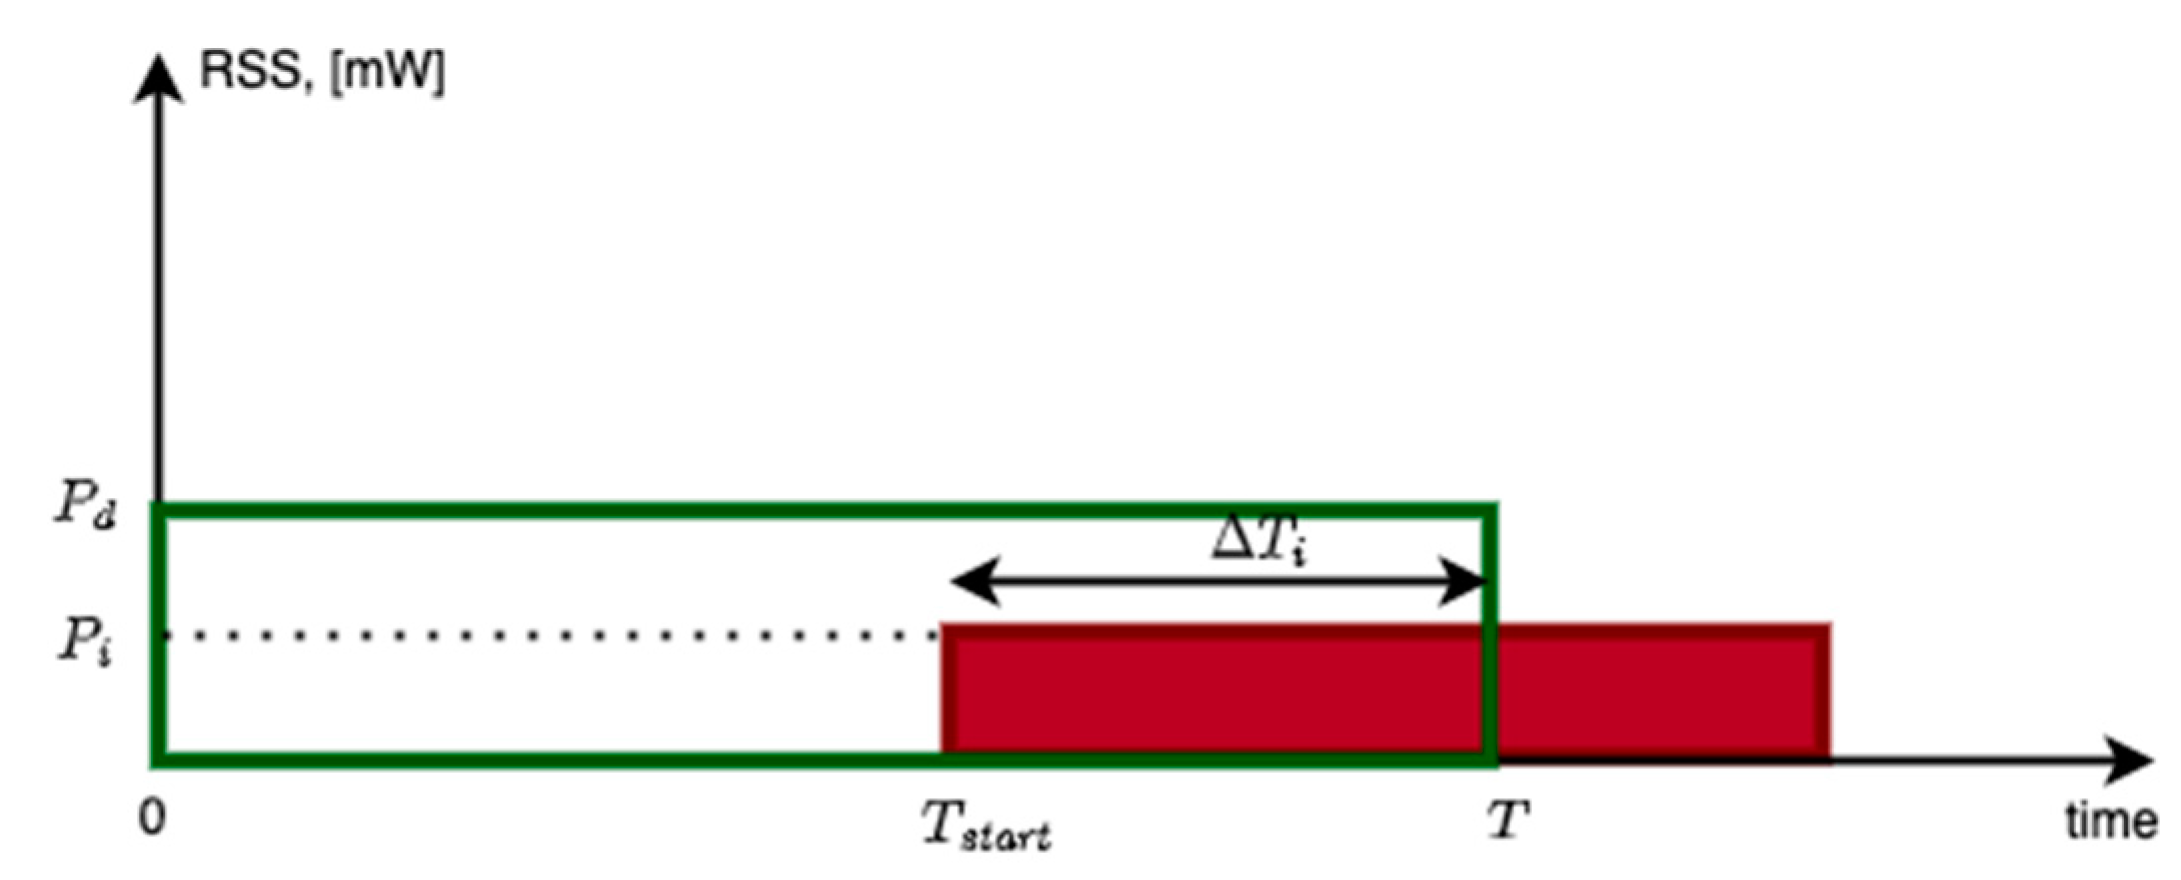
The co-channel collisions can happen over a portion of the desired packet. Let
represent this portion of time and let
represent the duration of the desired packet. Let
represent the interferer overlap ratio for the interferer
. Let
represent the Received Signal Strength (RSS) in mW from the desired transmitter and the interferer,
i. These definitions are illustrated in
Figure 4. Let
represent the carrier to interference ratio (in dB) when a co-channel interferer is present. With these definitions, the carrier to interference ratio can be derived as:
In this equation, the overlapping interference power of all the interferers are summed up to determine the overall carrier to interference ratio.
The Packet Success Rate (PSR) is the probability at which packets can be received successfully. The PSR can therefore be related to the Packet Error Rate (PER) by:
The PSR depends on various factors such as:
The distance, d, in between the receiver and the transmitter which determines the received signal strength (RSS) at the receiver
The receiver sensitivity for the selected Modulation and Coding Scheme (MCS)
The carrier to interference ratio () and number of interfering events
The collision and interference model in the simulator considers all these parameters before a packet can be marked as successfully received or dropped. A packet drop can be caused by unfavorable conditions such as large interference or path-loss. This is illustrated in
Figure 5. The term
represents the receiver sensitivity in dBm. In order for the packets to be deemed as successfully received, the RSS of the desired signal at distance
d to the transmitter needs to be greater than the receiver sensitivity, i.e.,
Furthermore, once this condition is satisfied, the
needs to be above a threshold in order for the packet to be received successfully. This threshold depends on the selected MCS in the communication link. Let
represents this threshold in dB. The higher bitrate MCSs require a larger threshold and larger sensitivity. These thresholds will be presented in detail in Section-3 assuming that Gaussian Frequency Shift Keying (GFSK) modulation is used for the MCS.
If there are two packets colliding in time, and one of them is from the desired signal link, and the other one is from the interfering link, then the PSR can be related to the Bit Error Rate (BER) as follows:
where the term
p represents the number of bits in the packet, and the term
r represents the overlap ratio of these two packets/links over the course of the desired packet (ref.
Figure 4) The bit-error-rate is applicable to the portion of the packet under interference. This is derived from the fact that all the bits under interference needs to be correctly received in order for the packet to be successfully received [
14]. This PSR derivation is made for an un-coded wireless link which is assumed in the PHY layer. If error correcting coding is used, its coding gain can be introduced to the C/I value based on measurements. In this derivation, it is assumed that the only impairment in the link is interference as captured in the C/I value. Packets with a larger number of payload bits require stronger C/I value in order to achieve the same PSR. The PSR depends on the number of payload bits under interference. Smaller collision time-overlaps represented by the ratio
r, results in favorable conditions for surviving co-channel interference. Worst case is when
r =1 which represents the case of a full overlap across the desired packet. In such a case, the entire packet will be under interference.
The numerical results with this model will be presented in the Numerical results section.
- (C)
Path loss Model
In this section, the path loss model is presented for the US 902–928 MHz ISM band in an outdoor urban area. The path-loss (in dB) is defined as the total propagation loss in between the transmitter and the receiver and can be defined as:
where the term
RSS(d) represents the received signal strength at distance,
d, and the term
TxP represents the transmitted power at the transmitter. The term RSSI represents the estimate on RSS as reported by the receiver. Additional insertion losses due to analog RF hardware losses needs to be added to this formula. This is relevant if the
RSS is reported for the antenna port of the receiver, whereas the signal is processed at the chipset port. The path loss depends on various factors such as the channel frequency, distance in between the transmitter and receiver, and random shadow fading variations caused by the environment [15-24]. In most of the models published to date, the path loss can be modeled as follows:
where the term
PL0(d0, f0) represents the path loss at reference distance
do, and on reference channel frequency, f
0. The term
n represents the path loss exponent, the term
d is the distance between the GW and the EN, and
f is the channel frequency in Hz. The term X(0, σ) (in dB) is a random variable that represents the large-scale shadow fading effects. The field measurements show that it has a log-normal distribution.
The carrier frequency of the radio waves affects the overall path-loss. For example, the path-loss is typically higher for higher frequencies than for smaller frequencies. This is because higher frequencies have smaller wavelengths, and hence are more susceptible to diffraction and scattering, which can reduce the signal strength.
The path-loss exponent, n, can change depending on the terrain type and the non-uniform buildings around. In practice, the path-loss exponent is not constant throughout an area, like the one assumed in Equation 4, and it can vary significantly depending on the surrounding environment and its dimensions. There are a few reasons for this. First, the path-loss exponent is typically higher in urban areas than in rural areas. This is because urban areas are typically more cluttered with buildings and other obstacles, which can scatter and absorb radio waves. Second, the presence of non-uniform buildings can also affect the path-loss exponent. For example, if there are a lot of tall buildings in an area, the path-loss exponent will be higher than if there are only a few short buildings. This is because tall buildings can block radio waves, which can reduce the signal strength. The path-loss exponent is an important factor in determining the range of a wireless communication system. If the path-loss exponent is too high, the signal strength will be too low to reach the receiver. This can lead to dropped connections or poor PSR.
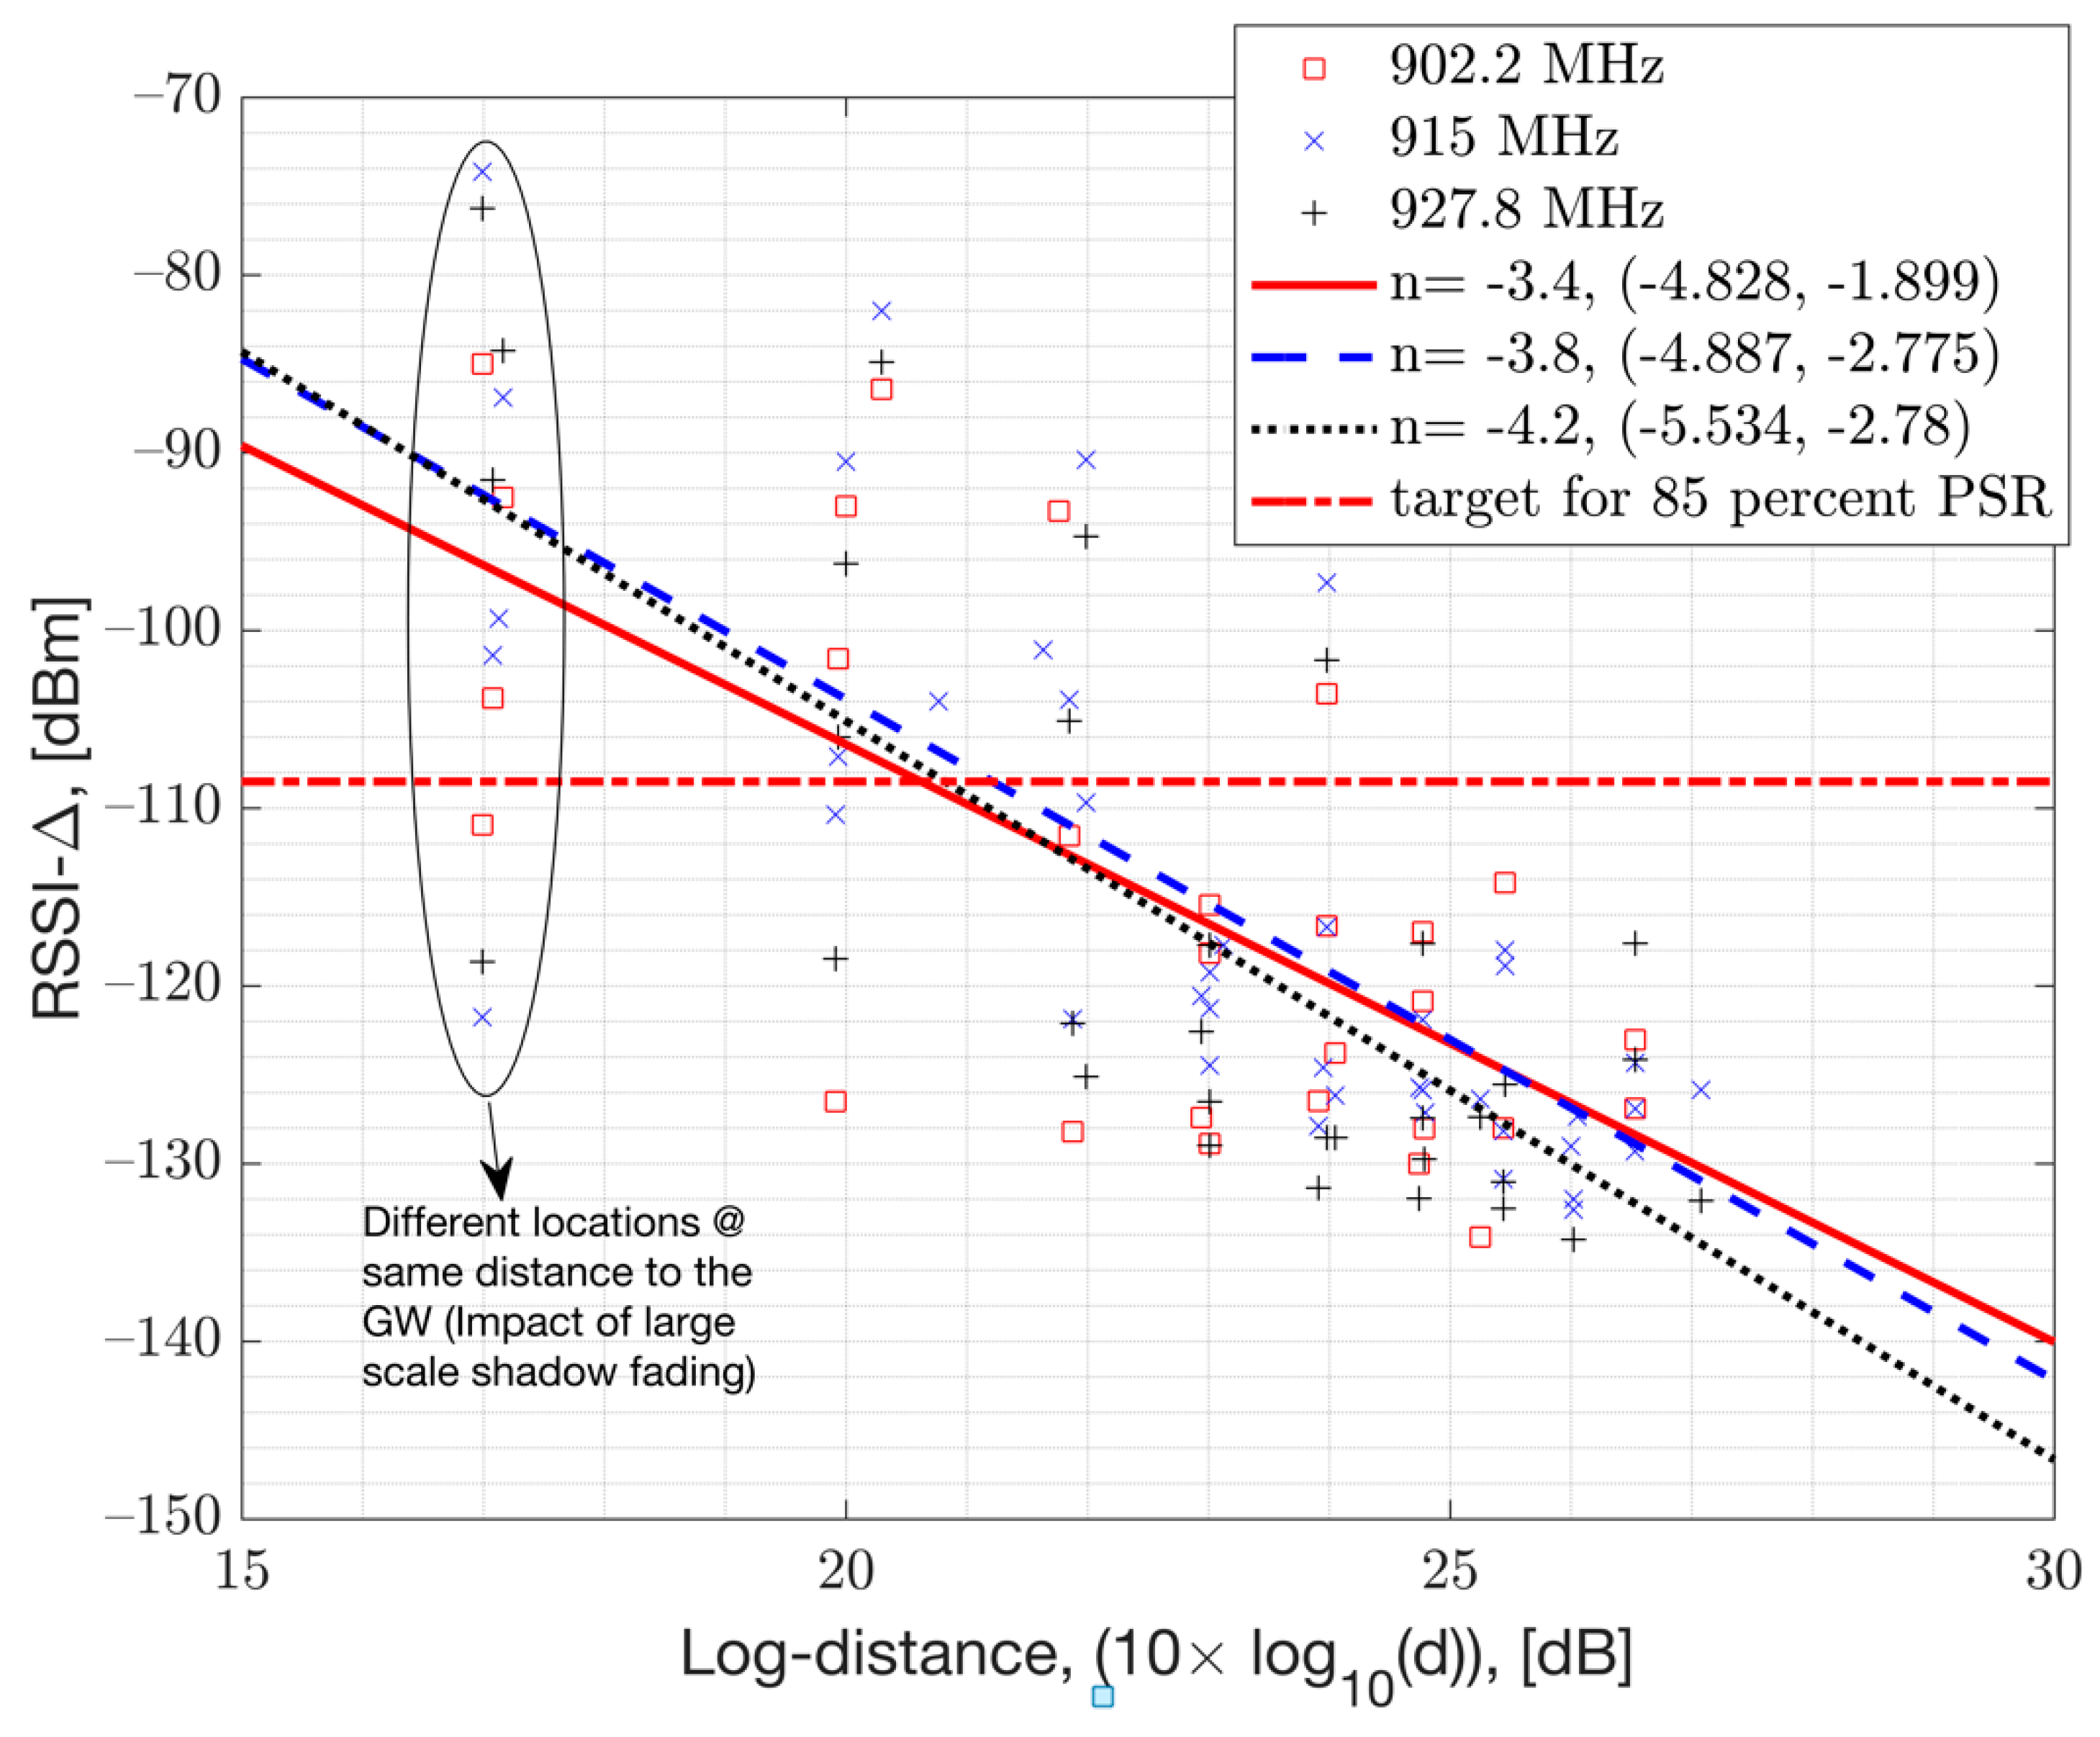
To account for the variation in the path-loss exponent, one can use a more complex path-loss model that takes into account the terrain type and the presence of buildings and vegetations such as tall trees. Doing so may require importing a map. Instead of such complicated approach, we simply use a statistical approach to model the path-loss exponent. This approach involved collecting data on the path-loss exponent in different locations and using this data to generate an estimate for the expected path-loss exponent. The mean path-loss exponent,
n, is estimated from the mean RSSI samples per location as they are plotted versus the log-distance to the GW. This plot is presented in
Figure 8. This allows the ability to estimate the slope of the linear log-distance line given by:
The estimation is done with a Least Squares Linear Regression. The estimated mean-path-loss exponent is presented in
Figure 8, presented in the legends of each measurement data set, along with its 95% confidence intervals for each channel. The 95% confidence intervals show that the mean path-loss exponent can vary from a value of
n= -2 all the way up to
n = -5.5 with an overall mean value of
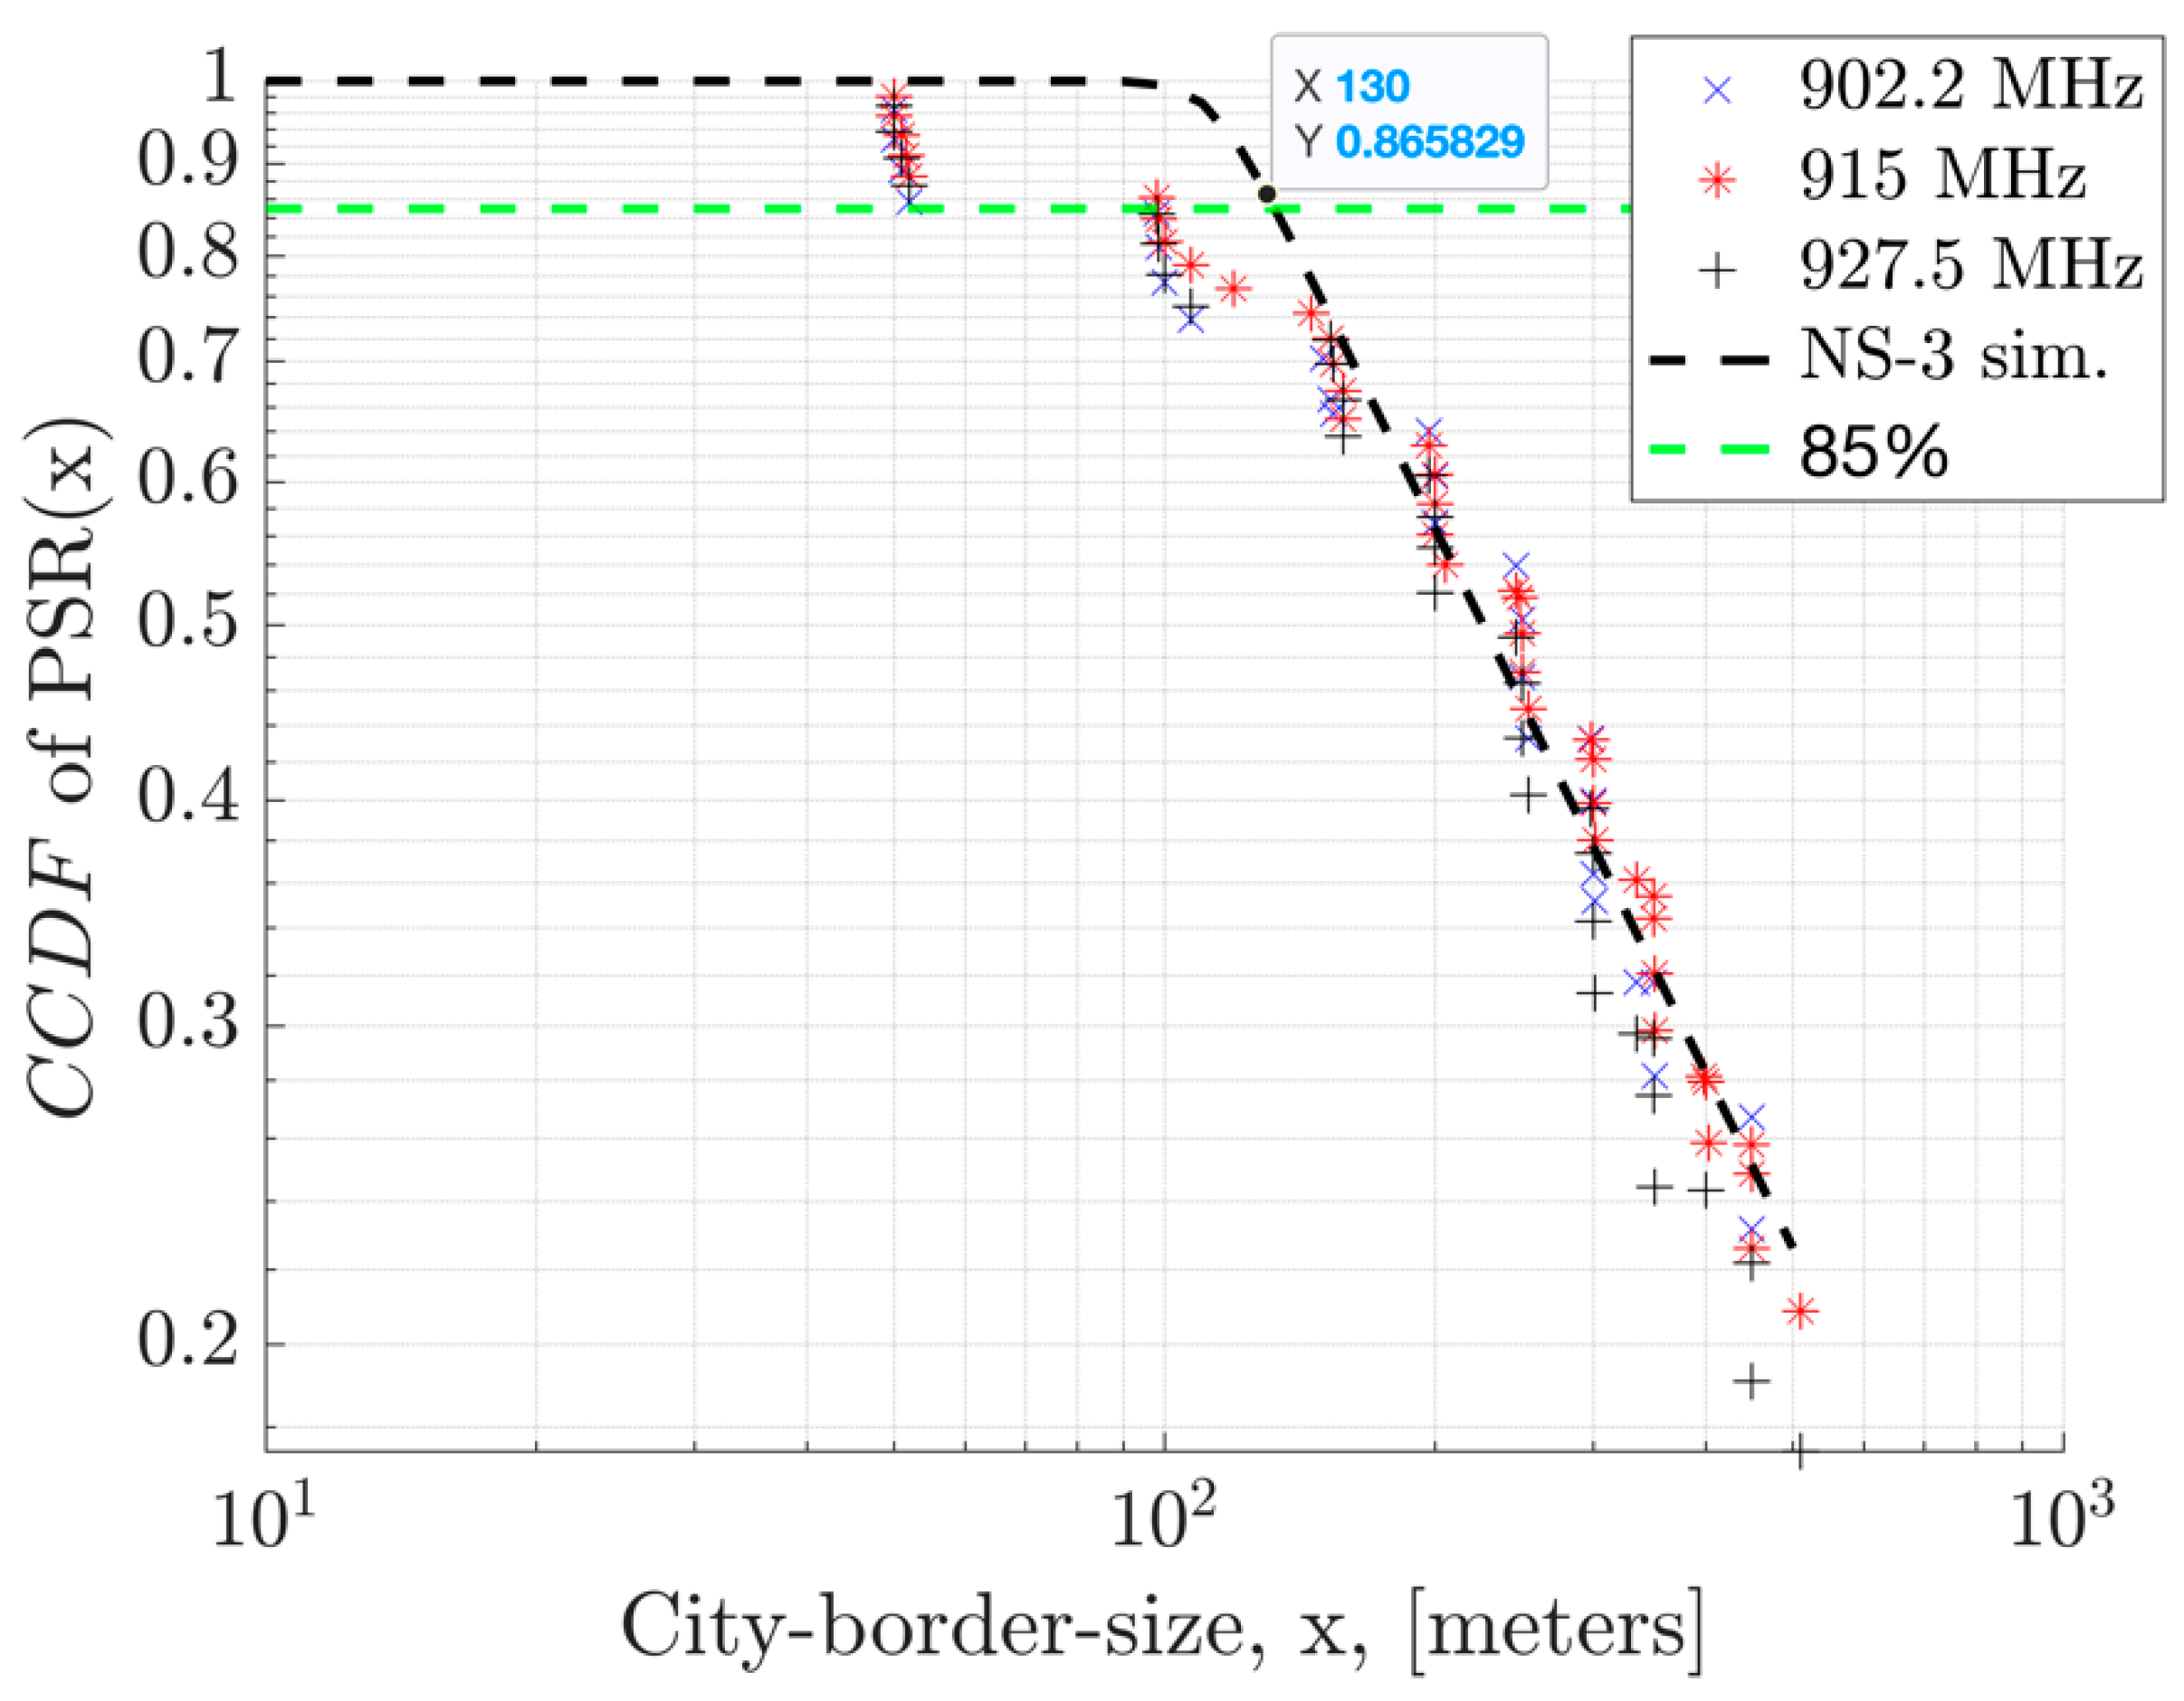
n = -4 averaged across channels. This is due to the variations in the terrain and the surrounding buildings, along with the variation in the interference levels. In numerical results, we assume a mean path-loss exponent value of
n= -4 and a log-normal shadow fading with standard deviation
dB (ref.
Figure 6). This simplifies the model. In
Figure 8, the term
represents the additional path-loss coming from the HW losses such as RF insertion losses as the signal travels from the antenna port to the HW chip port.
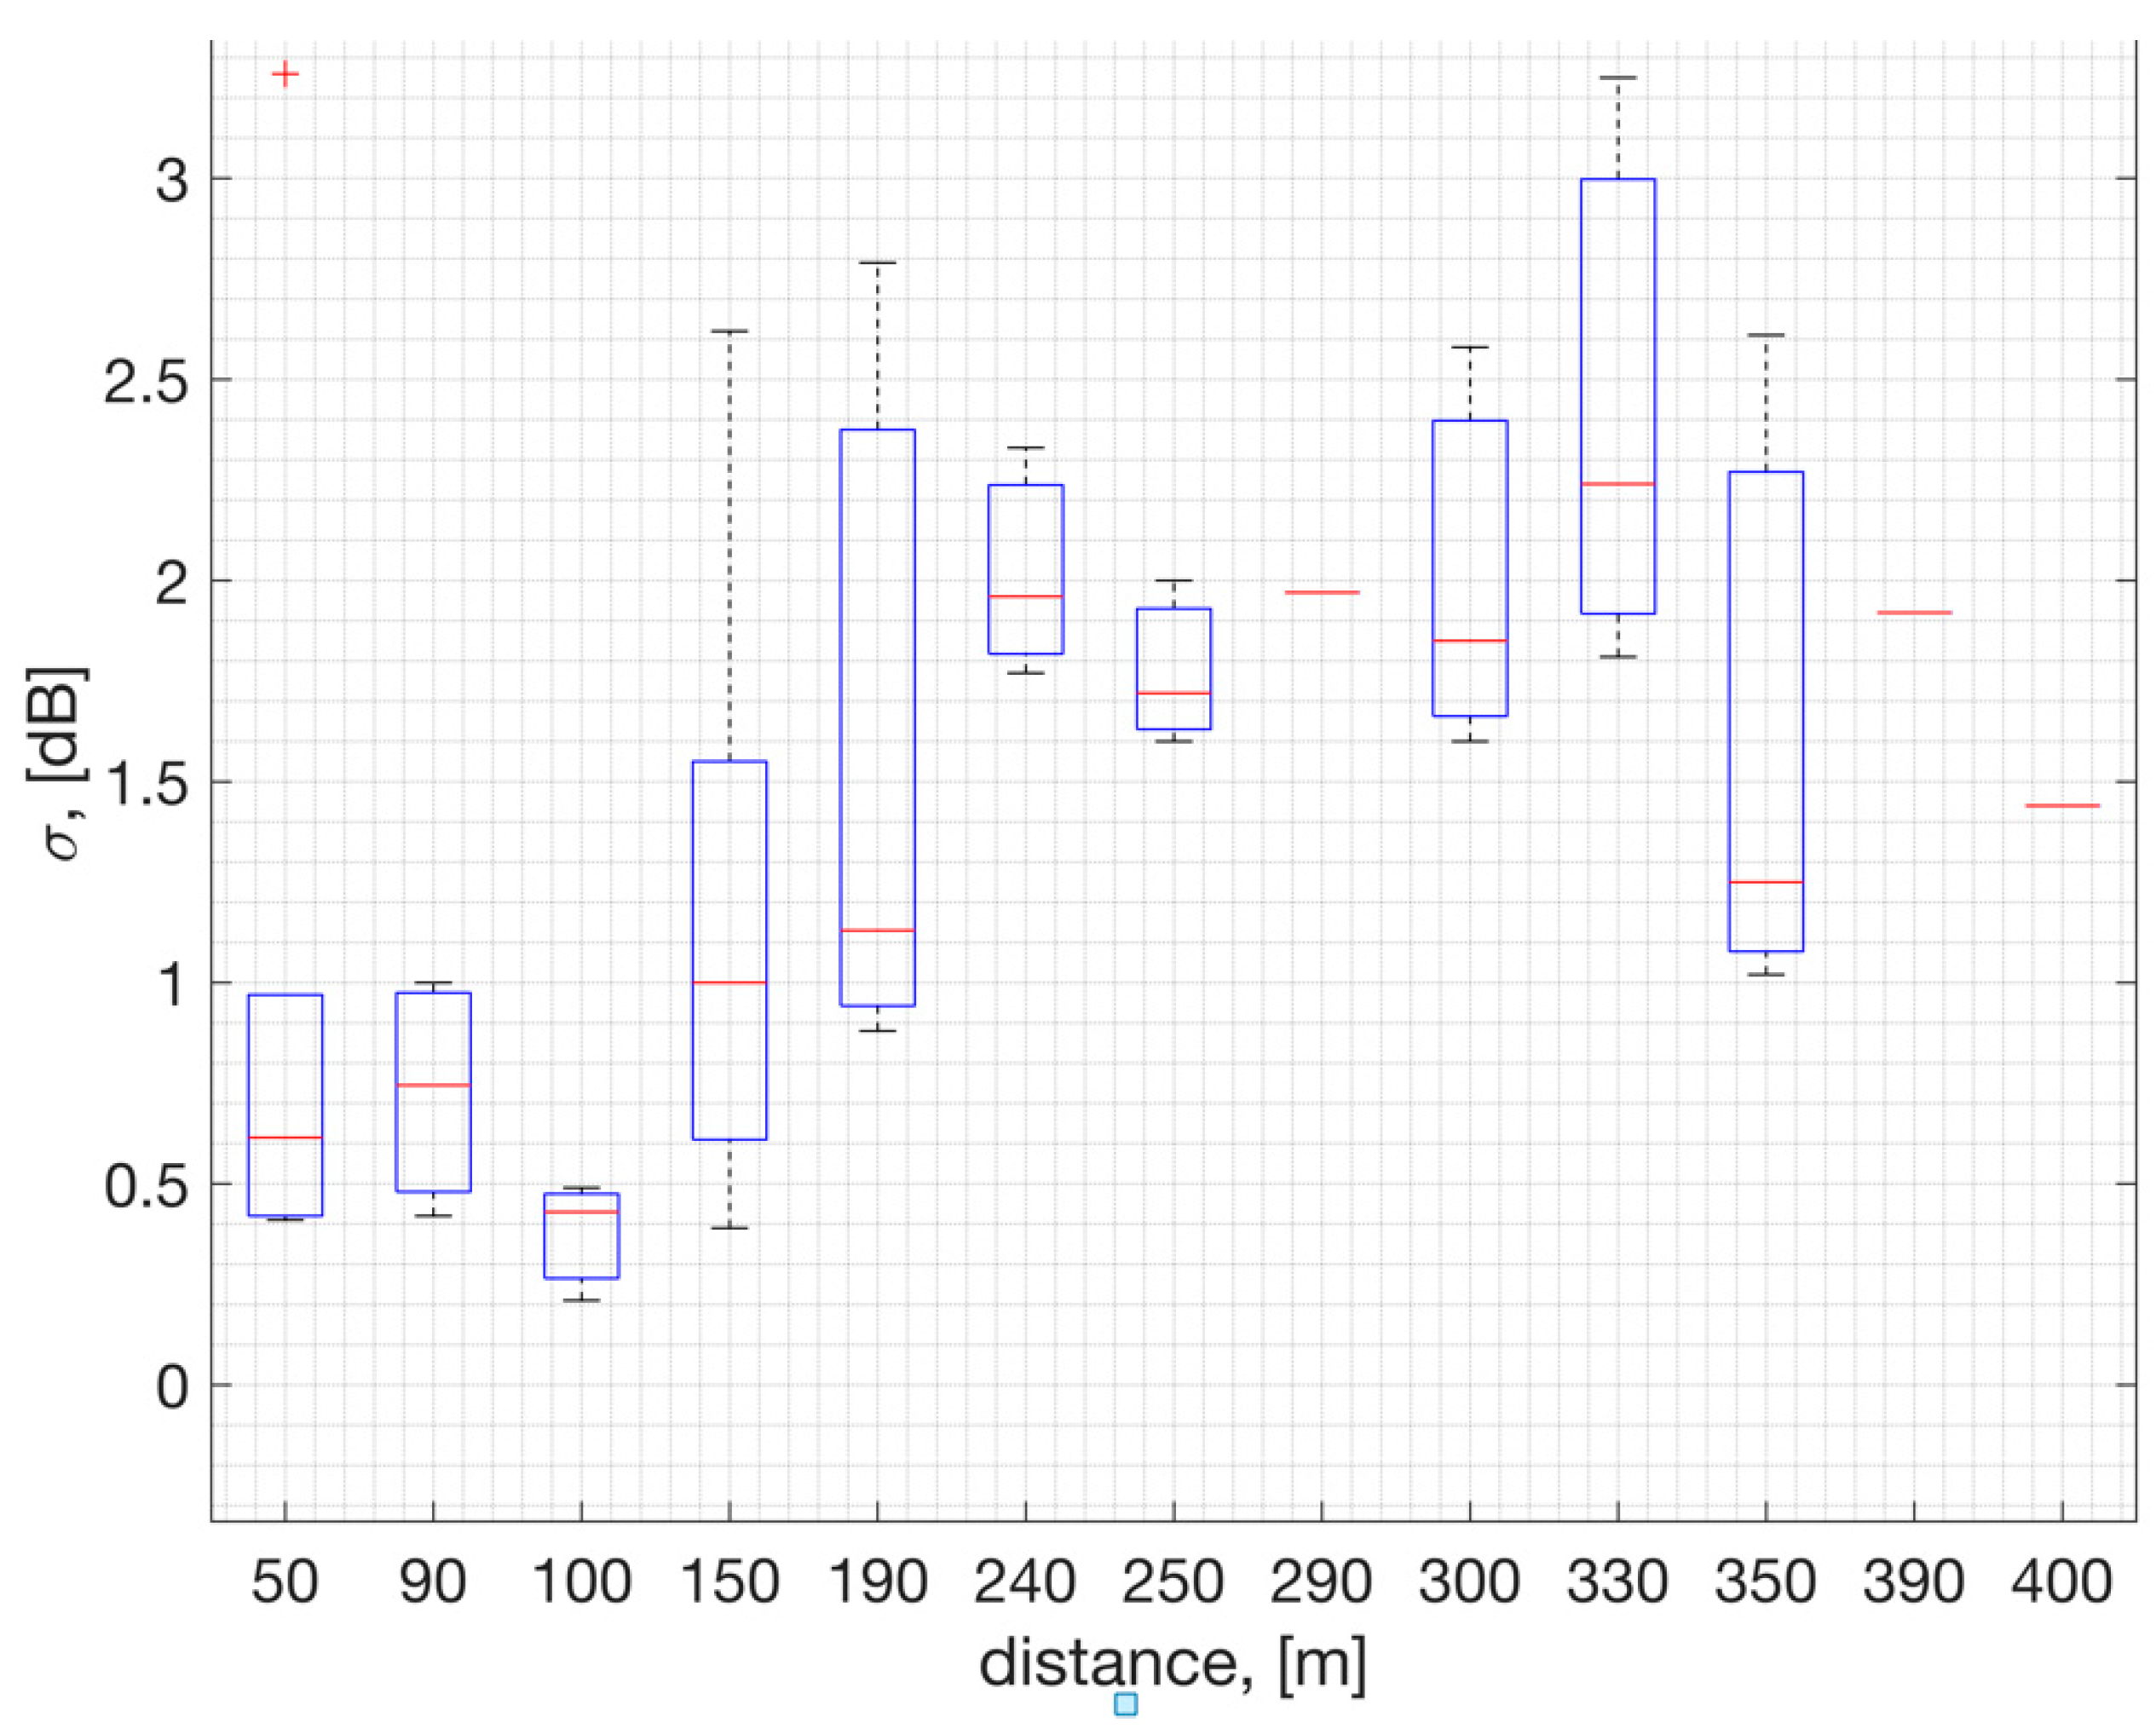
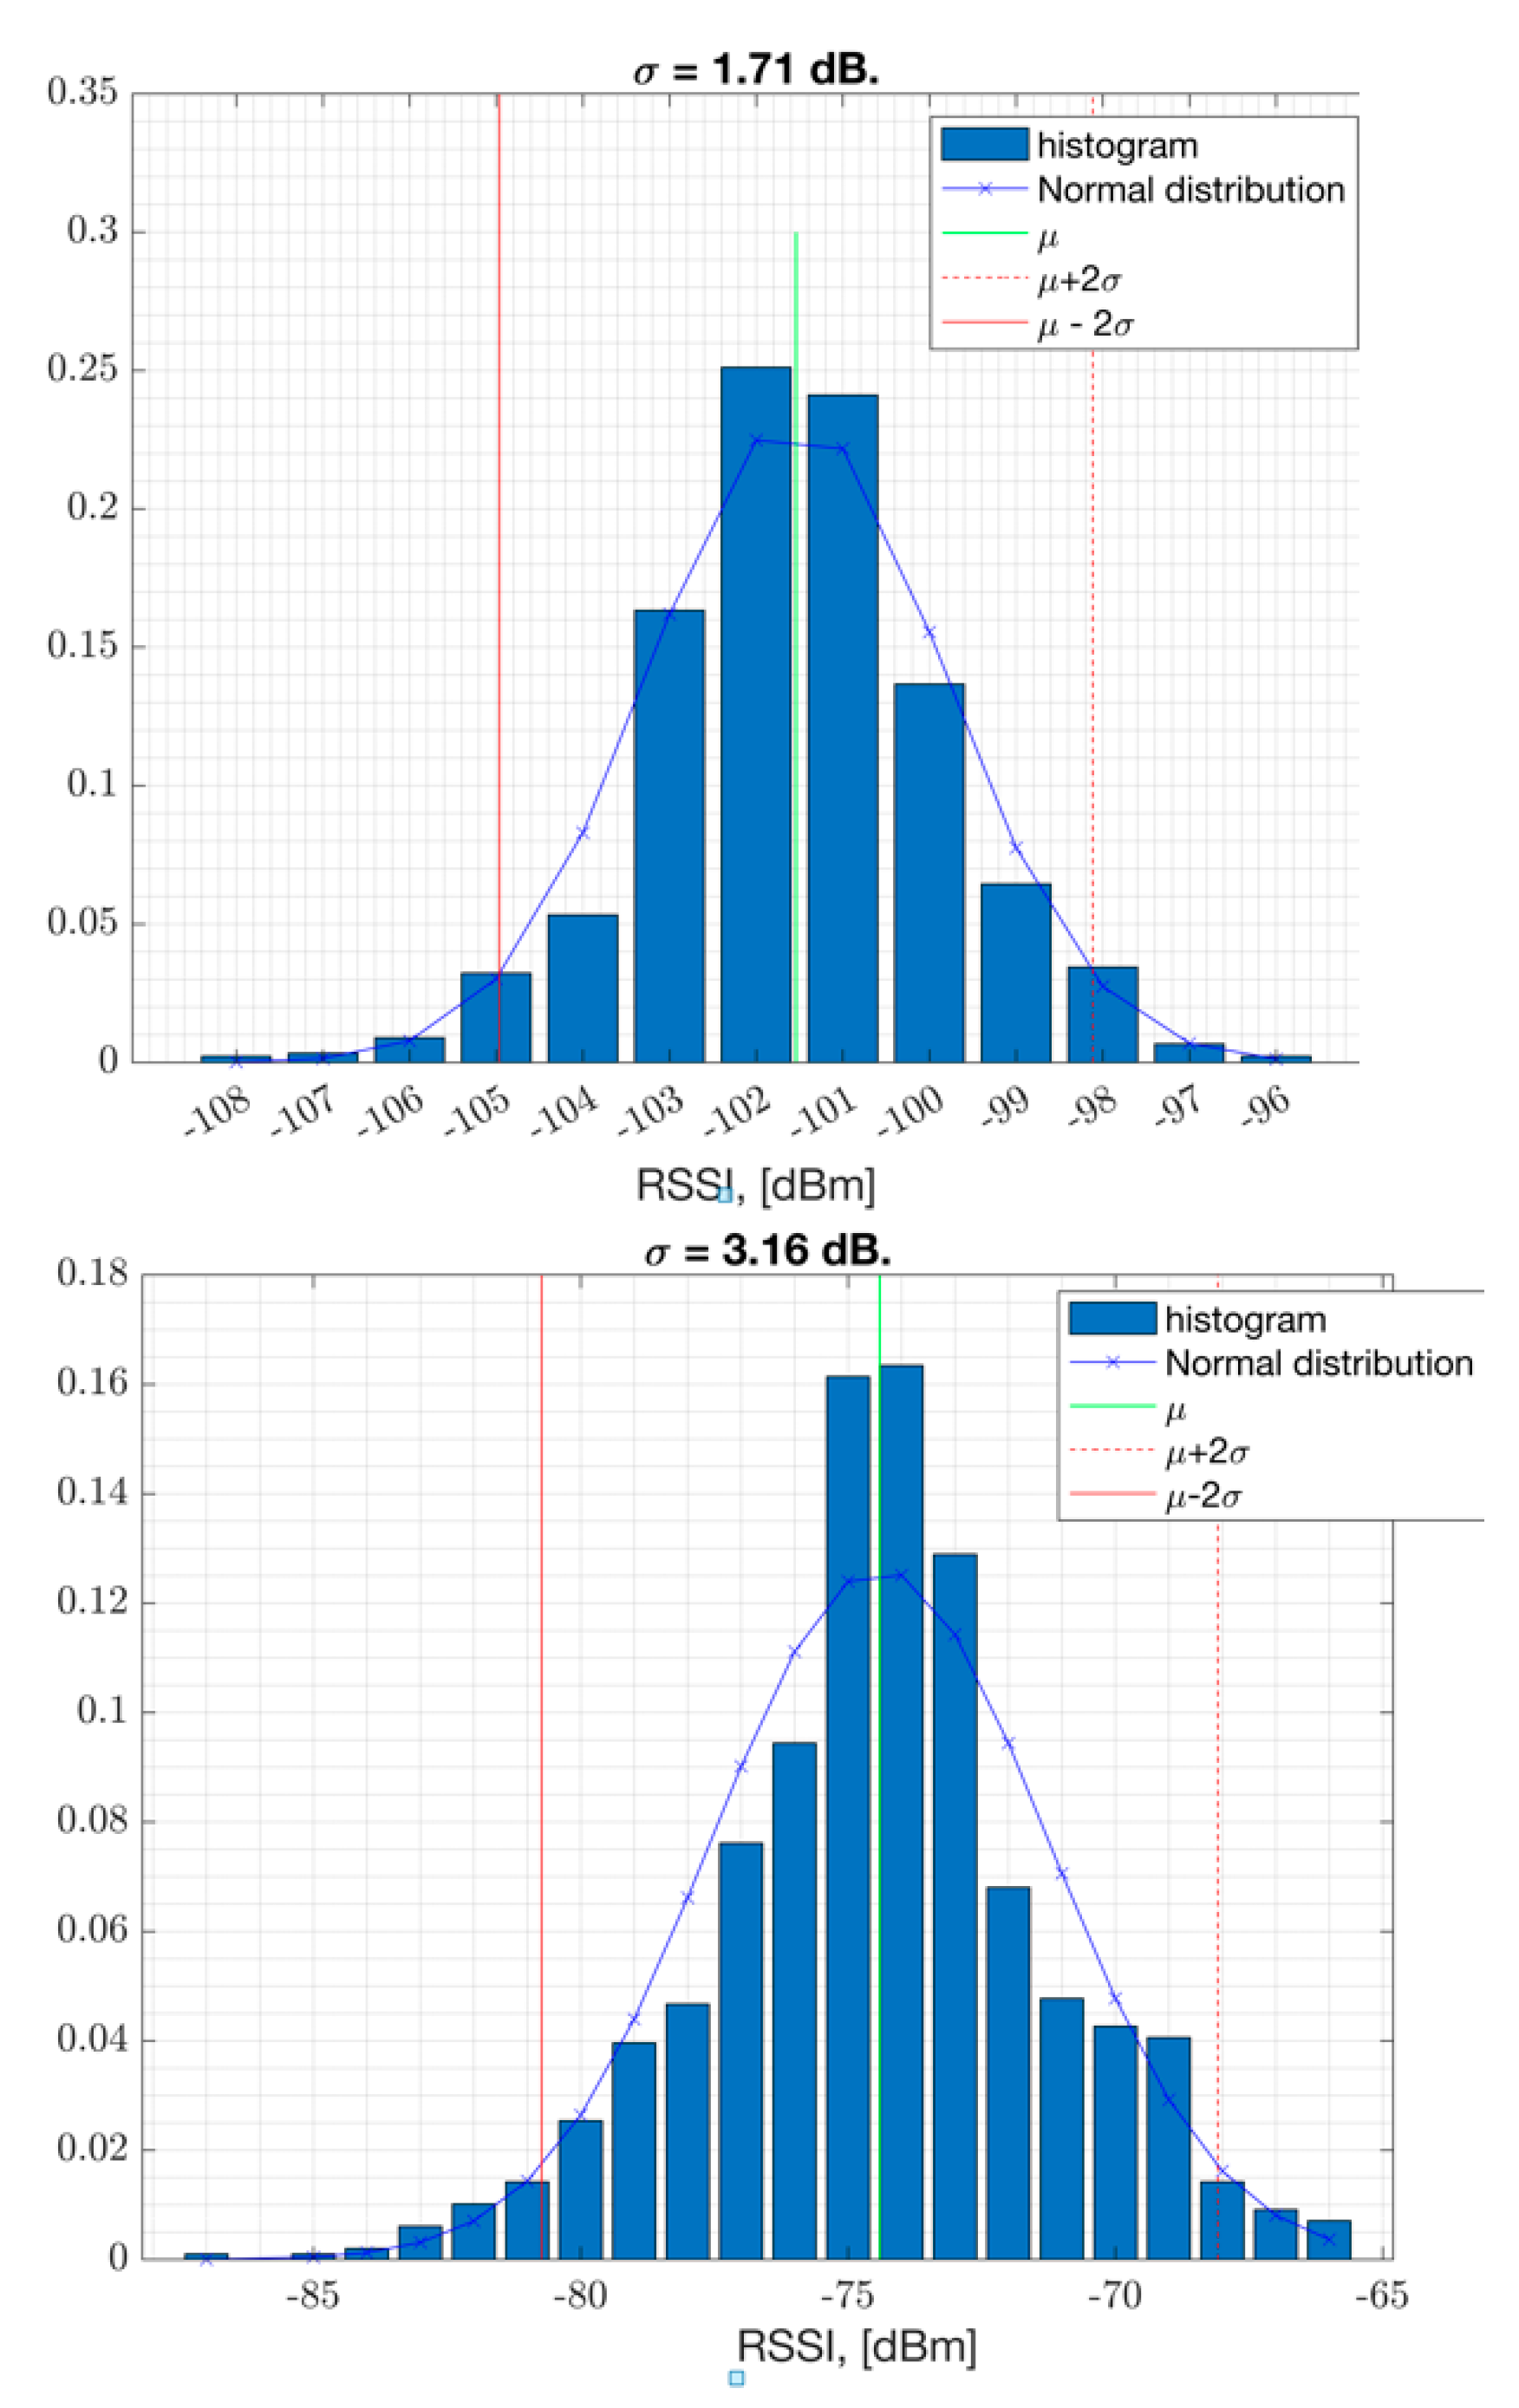
The field measurements taken in an urban area such as Westchester LA show that the shadow fading standard deviation is estimated to be σ = 1.4 dB averaged across locations (
Figure 6 and
Figure 7). This estimate is based on measurements within 400 meters to the GW where the RSSI is represented in full range to cover PSR of 100% down to 0 %. In
Figure 6, on each box, the central red line indicates the median, and the bottom and top edges of the box indicate the 25th and 75th percentiles of the measurements, respectively. The whiskers extend to the most extreme data points not considered outliers, and the outliers are plotted individually using the '+' symbol.
Figure 6.
The standard deviation of the RSSI samples versus distance to the GW, with statistical analysis conducted across channels centered at [902, 902.2, 915, 927] MHz.
Figure 6.
The standard deviation of the RSSI samples versus distance to the GW, with statistical analysis conducted across channels centered at [902, 902.2, 915, 927] MHz.
Figure 7.
RSSI samples in dBm and their histogram per location (
Figure 7.
RSSI samples in dBm and their histogram per location (
Figure 8.
Path loss measurement versus log distance from the GW in an urban neighborhood in Westchester, CA, USA.
Figure 8.
Path loss measurement versus log distance from the GW in an urban neighborhood in Westchester, CA, USA.
3. PHY Model with GFSK for Low Bit-rate IoT Applications
The principles of the GFSK modulation have been analyzed in detail in the literature along with detailed analytical models [
1,
14,
25]. In this section, the GFSK modulation is introduced for IoT applications along with the selected modulator parameters. A PHY model for 50 kbps mode is assumed, which is suitable for the indoor and outdoor IoT applications [
1]. First, the sensitivity performance is presented. The simulation results are compared to lab measurements. Second, the co-channel interference measurement method is presented along with conducted lab measurements. Both the co-channel interference model and the sensitivity model provide the building blocks for coverage area and network capacity analysis. Such coverage area analysis will be presented in the Numerical results section. The additional link budget losses coming from the interference from other networks are accounted for in the path-loss model.
- (A)
GFSK Parameters selection
In this section, the most important PHY parameters are presented for GFSK modulation. The values of these parameters are determined for narrow band low bitrate IoT applications. For GFSK modulation, the modulation index, h, and the frequency deviation, , are defined as follows: [Hz]. In this paper, the term m is set to 1 bits/symbol for 2-GFSK and 0<h ≤1. The modulation index determines the maximum phase shift in between two adjacent symbols in time. And this phase shift is given by When the modulation index is set to the maximum value of 1, then the modulator runs with a maximum frequency deviation of 25 kHz with 50kbps PHY rate. Reducing the modulation index from h=1 results in a reduced frequency deviation for the modulated bits. This can be unfavorable against RF impairments such as carrier frequency offset (CFO) especially with such narrow bandwidth.
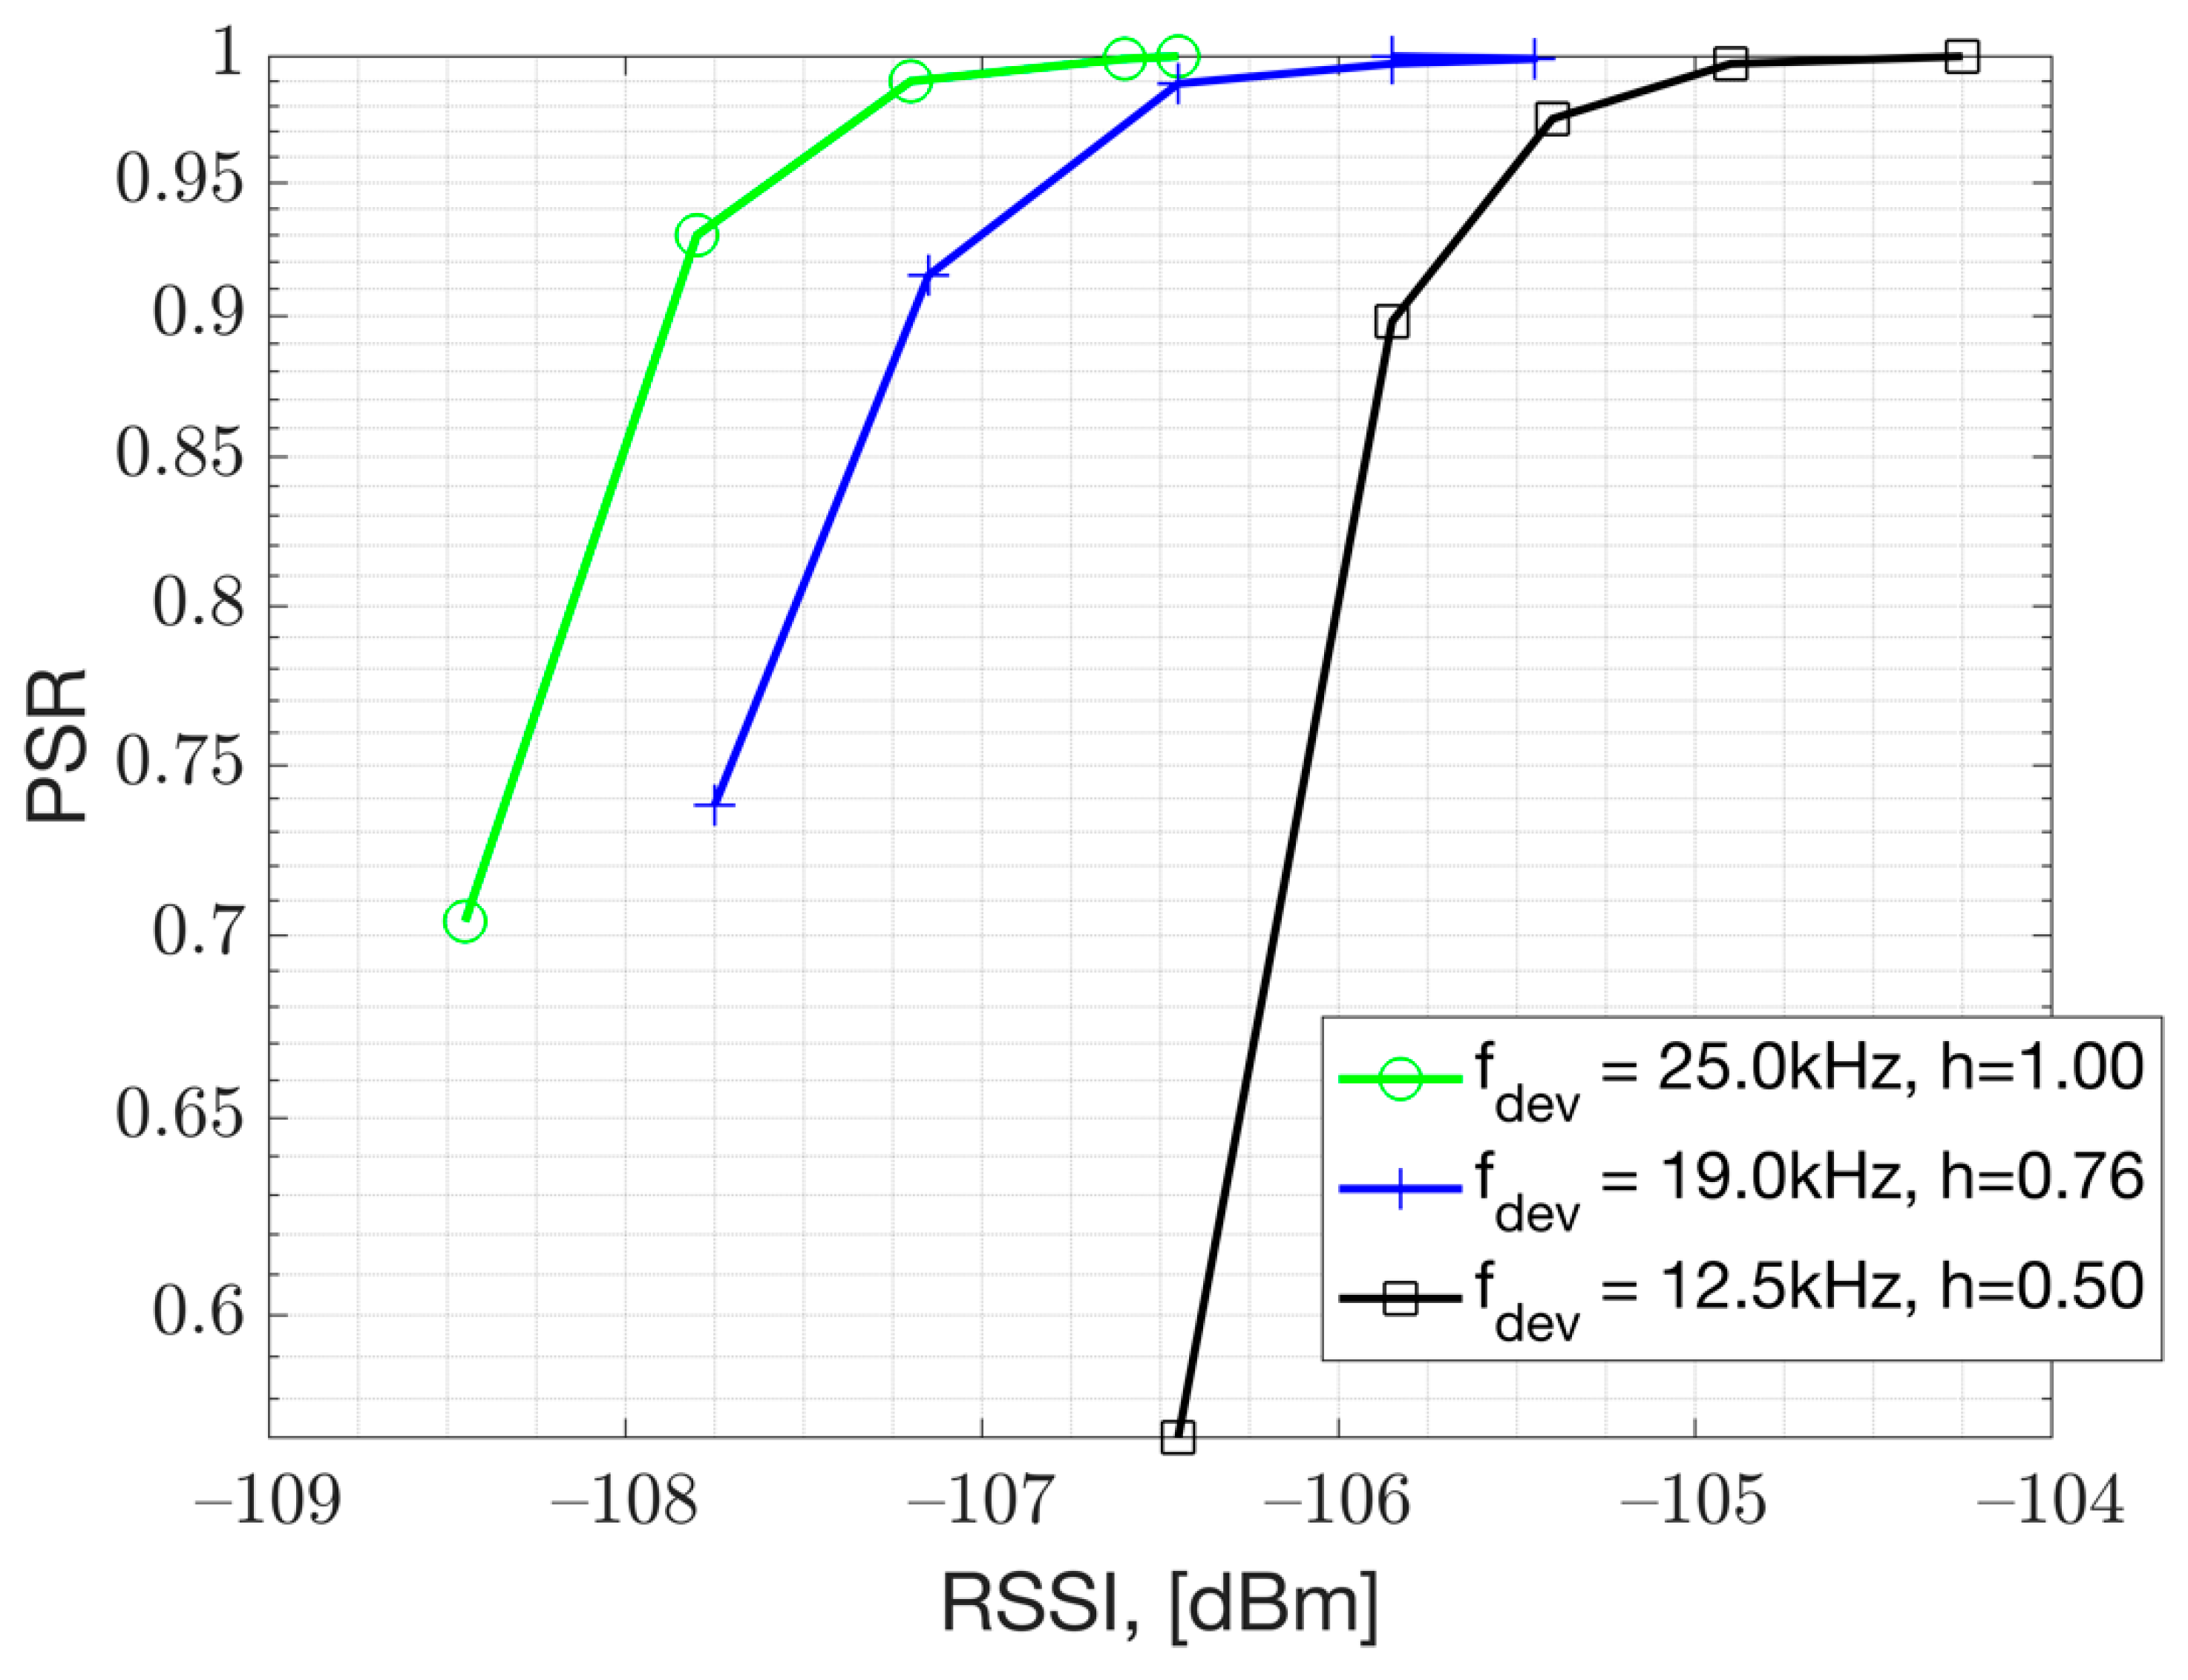
Based on conducted PSR versus RSS measurements presented in
Figure 9, it is recommended to keep the modulation index at
h=1 for GFSK 50kbps implementation. The PSR results presented in
Figure 9 show that
h=1 achieves better performance than
h=0.76 and
h=0.5. This makes sense as larger frequency deviation results in more separation in between the soft FSK bits which are under a white gaussian noise (AWGN). This is especially important for very low bit-rate IoT applications which use very small frequency deviations. This result is measured with Texas Instruments Evaluation Board (TI-EVB) which supports GFSK 50 kbps modulation. The result is obtained in a conducted test setup by varying the Rx signal power that is input to the EVB. Essentially this is the result under thermal noise and corresponds to AWGN performance.
The main impact to the Rx sensitivity is the modulation index used for GFSK modulation (ref
Figure 9). The measurements presented in
Figure 9 show that larger modulation index improves the sensitivity performance for low bandwidth GFSK modulation. The channel spacing is set to 200 kHz, which is significantly larger than the modulation bandwidth. This allows larger modulation index to be feasible in terms of Adjacent Channel Leakage Ratio (ACLR). The Gaussian pulse shaper helps with the larger modulation index by limiting the power spectrum density (PSD) (ref.
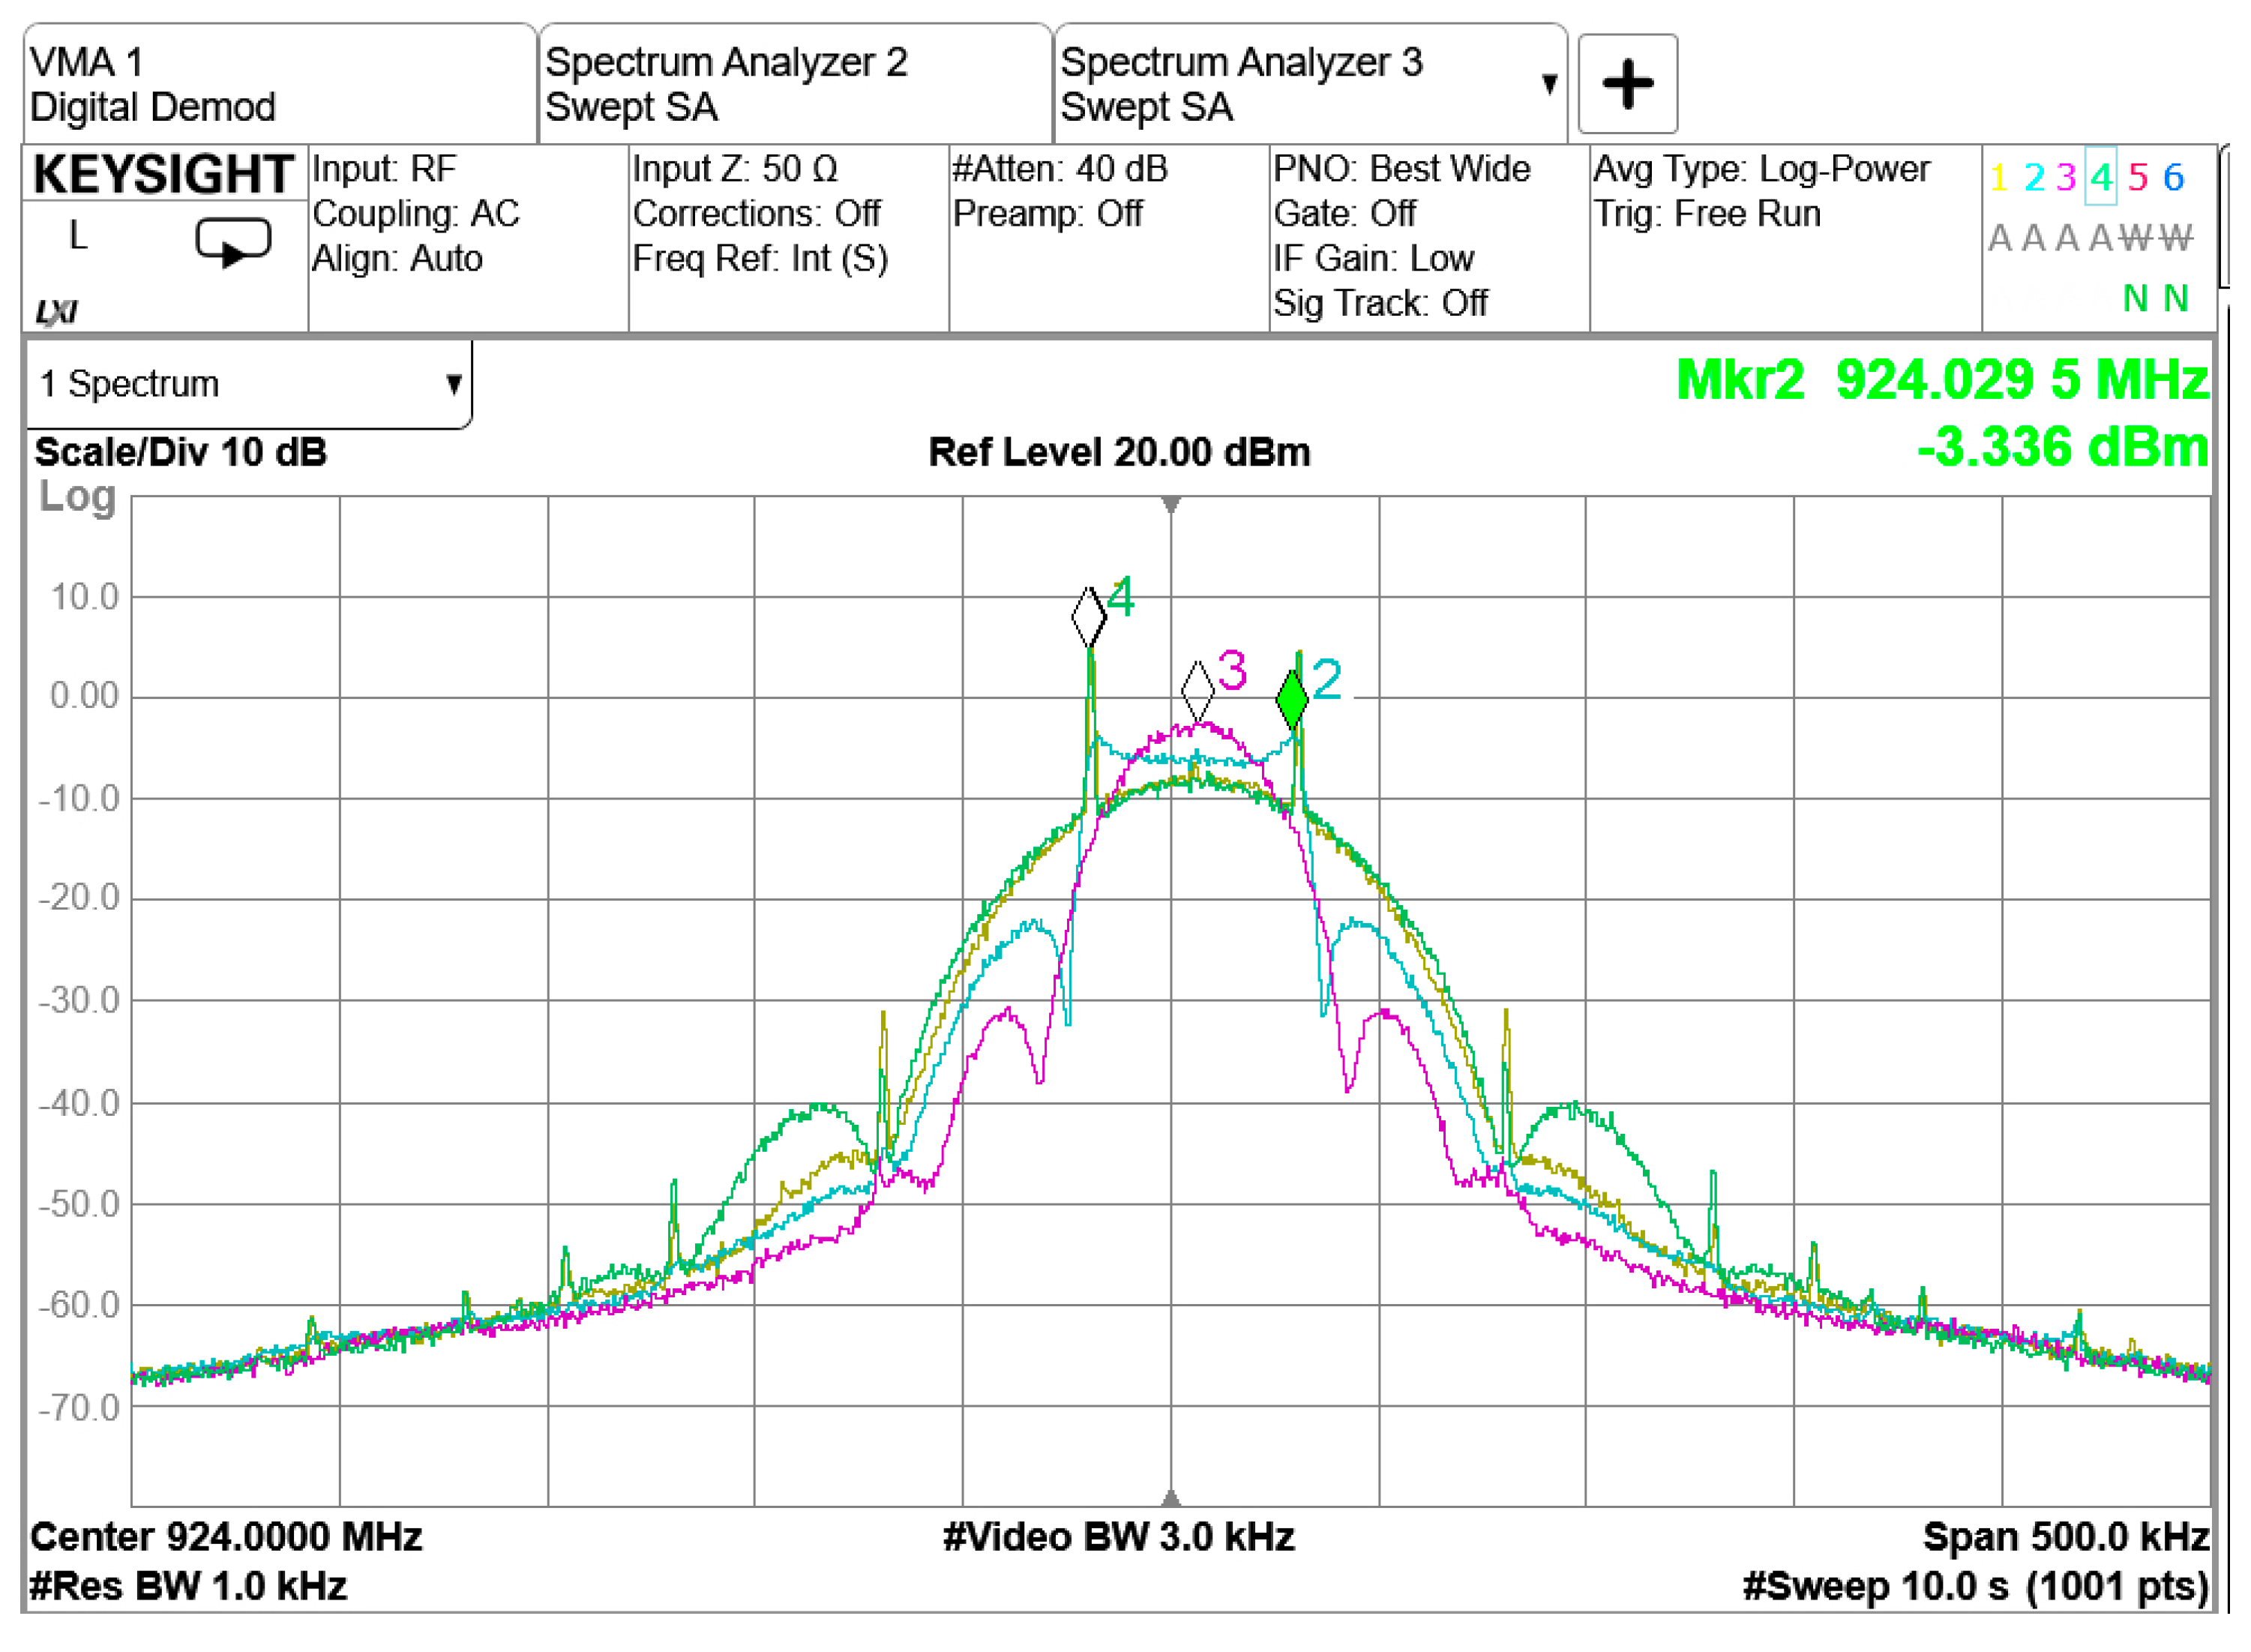
Figure 10). The PSD analysis shows that the transmitter's Gaussian pulse shaper Bandwidth Time product (BT) parameter should be set to
BT=0.5 in order to improve the ACLR [
1]. This analysis is presented in
Figure 10. The traces are obtained with the settings presented in
Table 1. For instance, when the modulation index is set to 1, the green and yellow traces demonstrate that the second ACLR can be improved by 5 dB when the pulse shaper filter BT is tightened from 1 to 0.5. The measurements showed that the Rx sensitivity with a BT value of 1 and 0.5 did not show any significant difference.
Figure 9.
The PSR measurement versus modulation index, h, with GFSK 50 kbps, BT=0.5.
Figure 9.
The PSR measurement versus modulation index, h, with GFSK 50 kbps, BT=0.5.
Table 1.
The modulation parameters for GFSK 50 kbps IoT modulation that have been tested in the lab with TI-EVB.
Table 1.
The modulation parameters for GFSK 50 kbps IoT modulation that have been tested in the lab with TI-EVB.
| |
Pulse shaper
BT parameter |
Modulation index, h |
Frequency deviation, kHz |
bitrate |
Trace -1
(Yellow trace) |
BT = 0.5 |
1 |
|
50 kbps |
Trace-2
(Blue trace) |
0.76 |
|
Trace-3
(Magenta trace) |
0.5 |
|
Trace-4
(Green trace) |
BT = 1 |
1 |
|
Figure 10.
The PSD versus modulation index and pulse shaping filter coefficient for GFSK modulation.
Figure 10.
The PSD versus modulation index and pulse shaping filter coefficient for GFSK modulation.
In this section, the receiver sensitivity performance is presented with GFSK 50kbps modulation. The Received Signal Strength (RSS) and the Signal to Noise Ratio (
, in dB) are related as follows:
where, the term
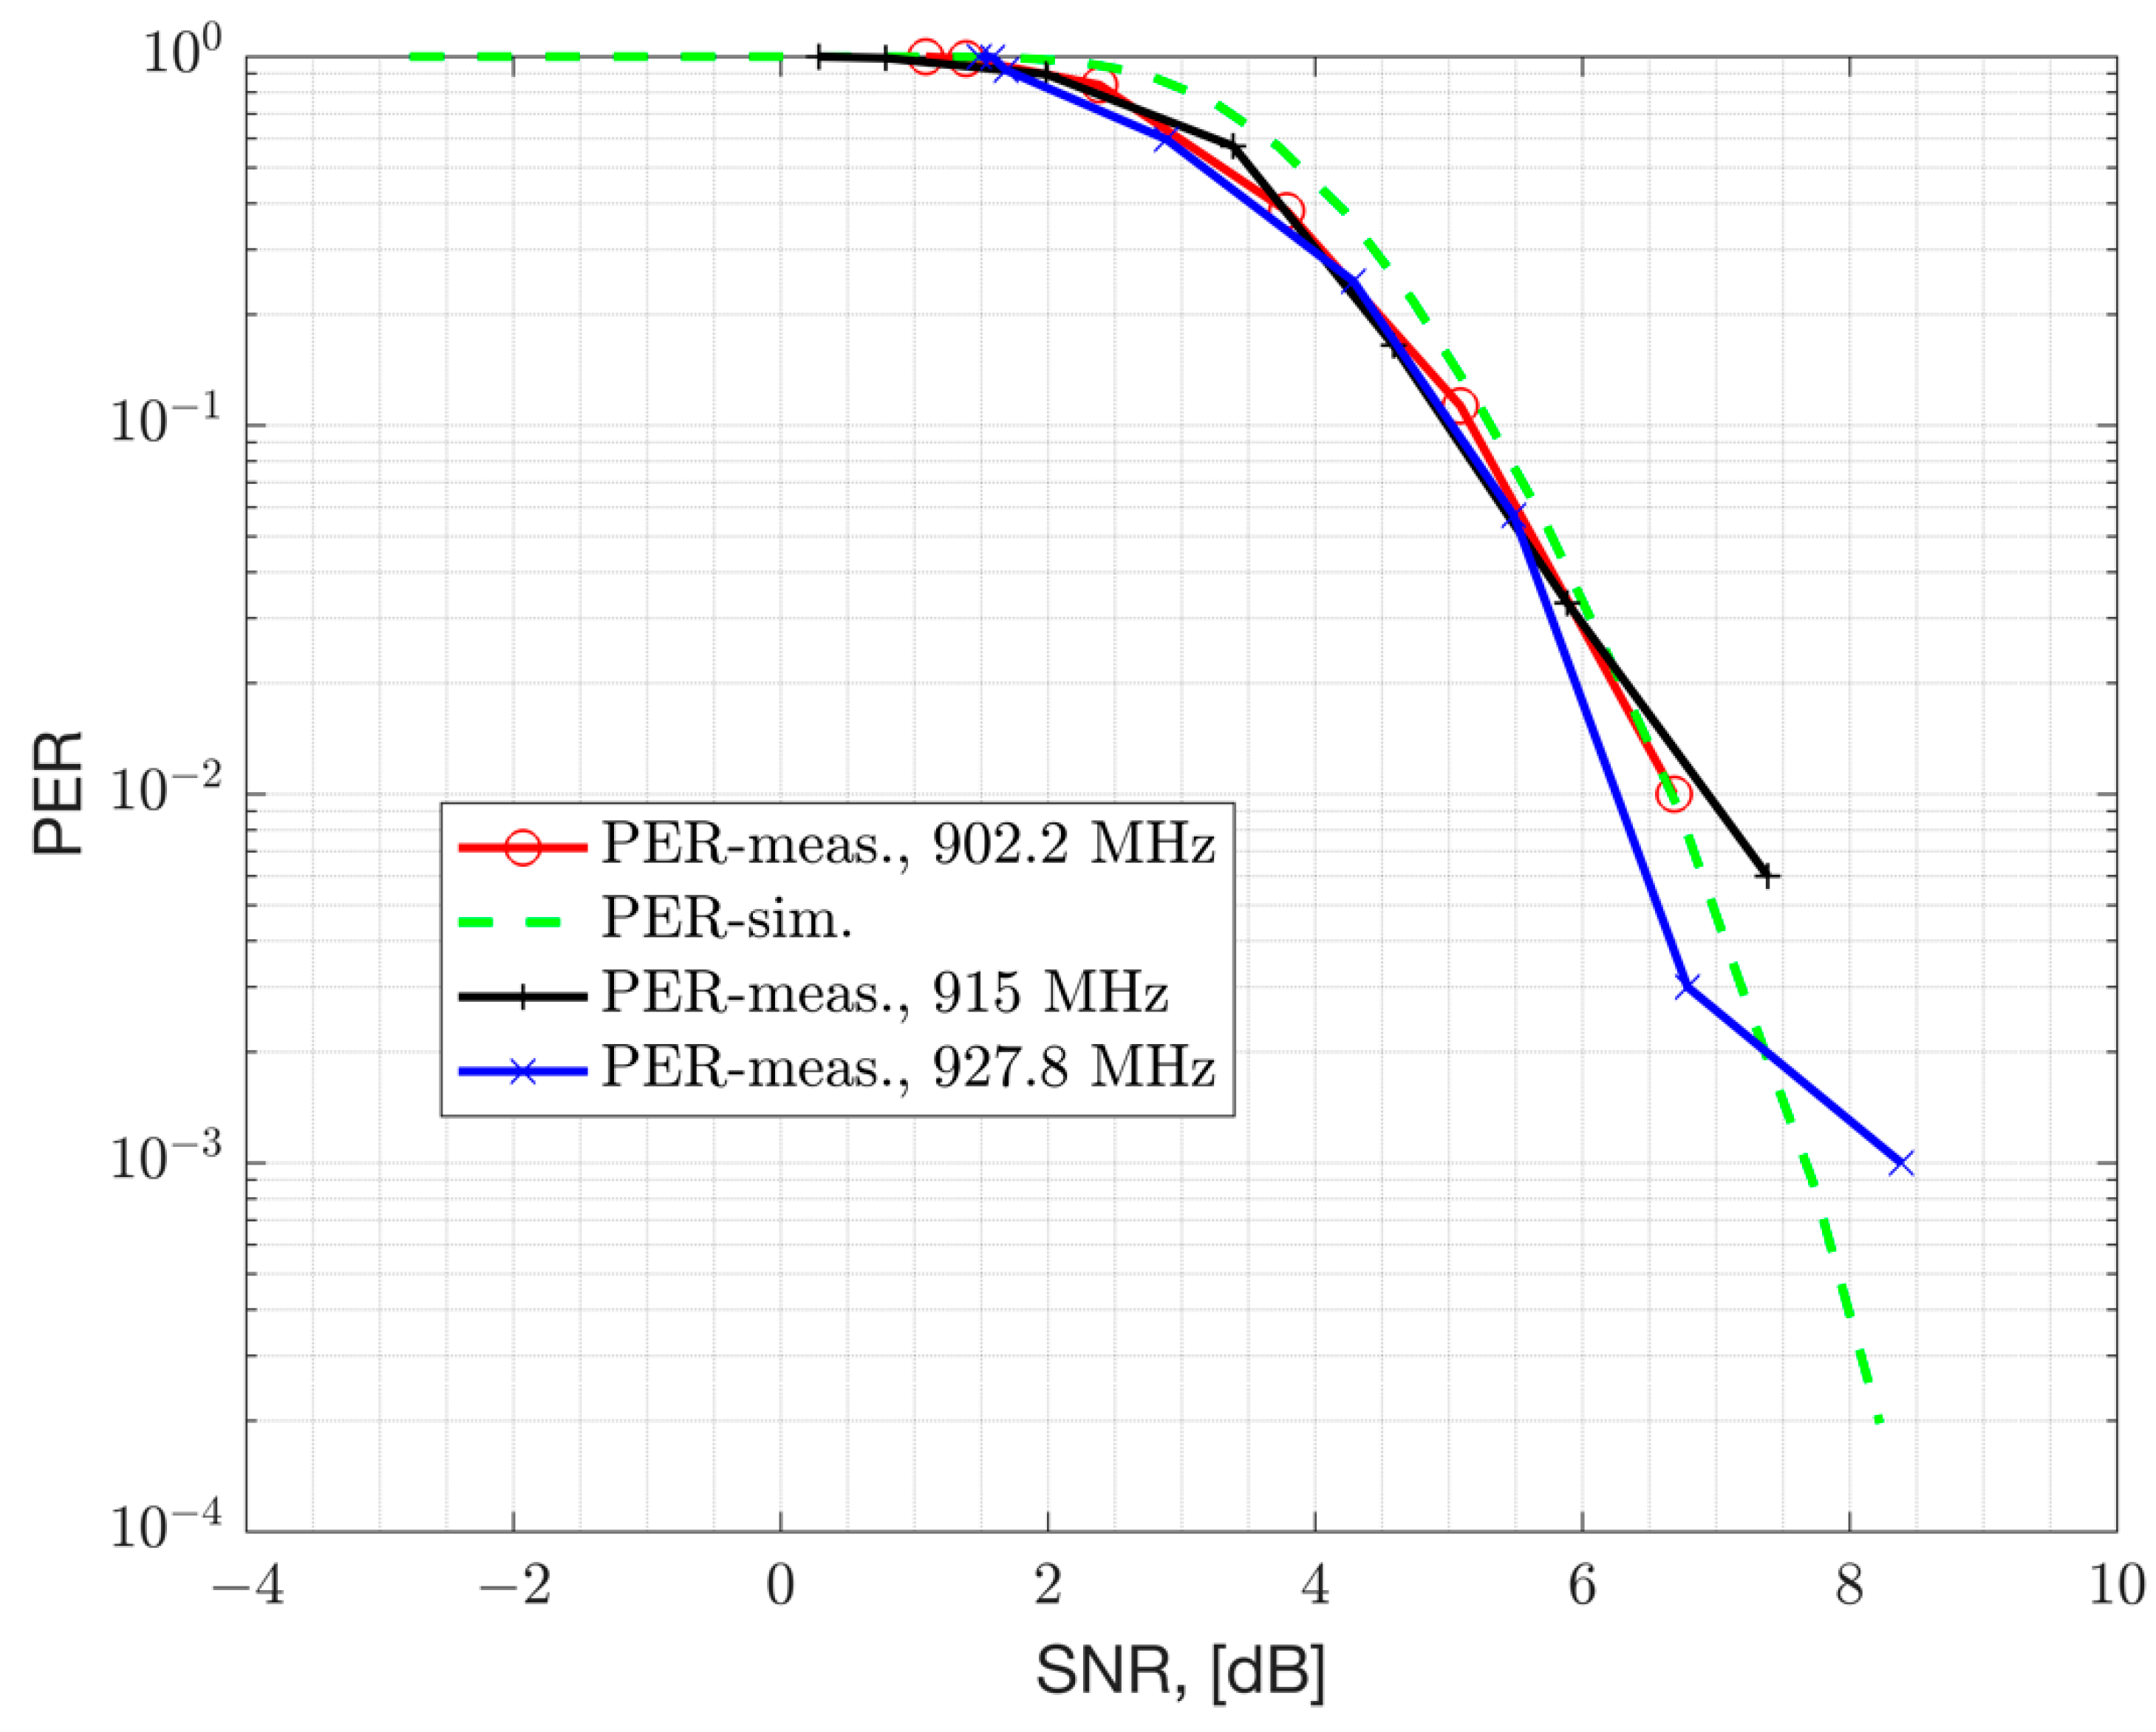
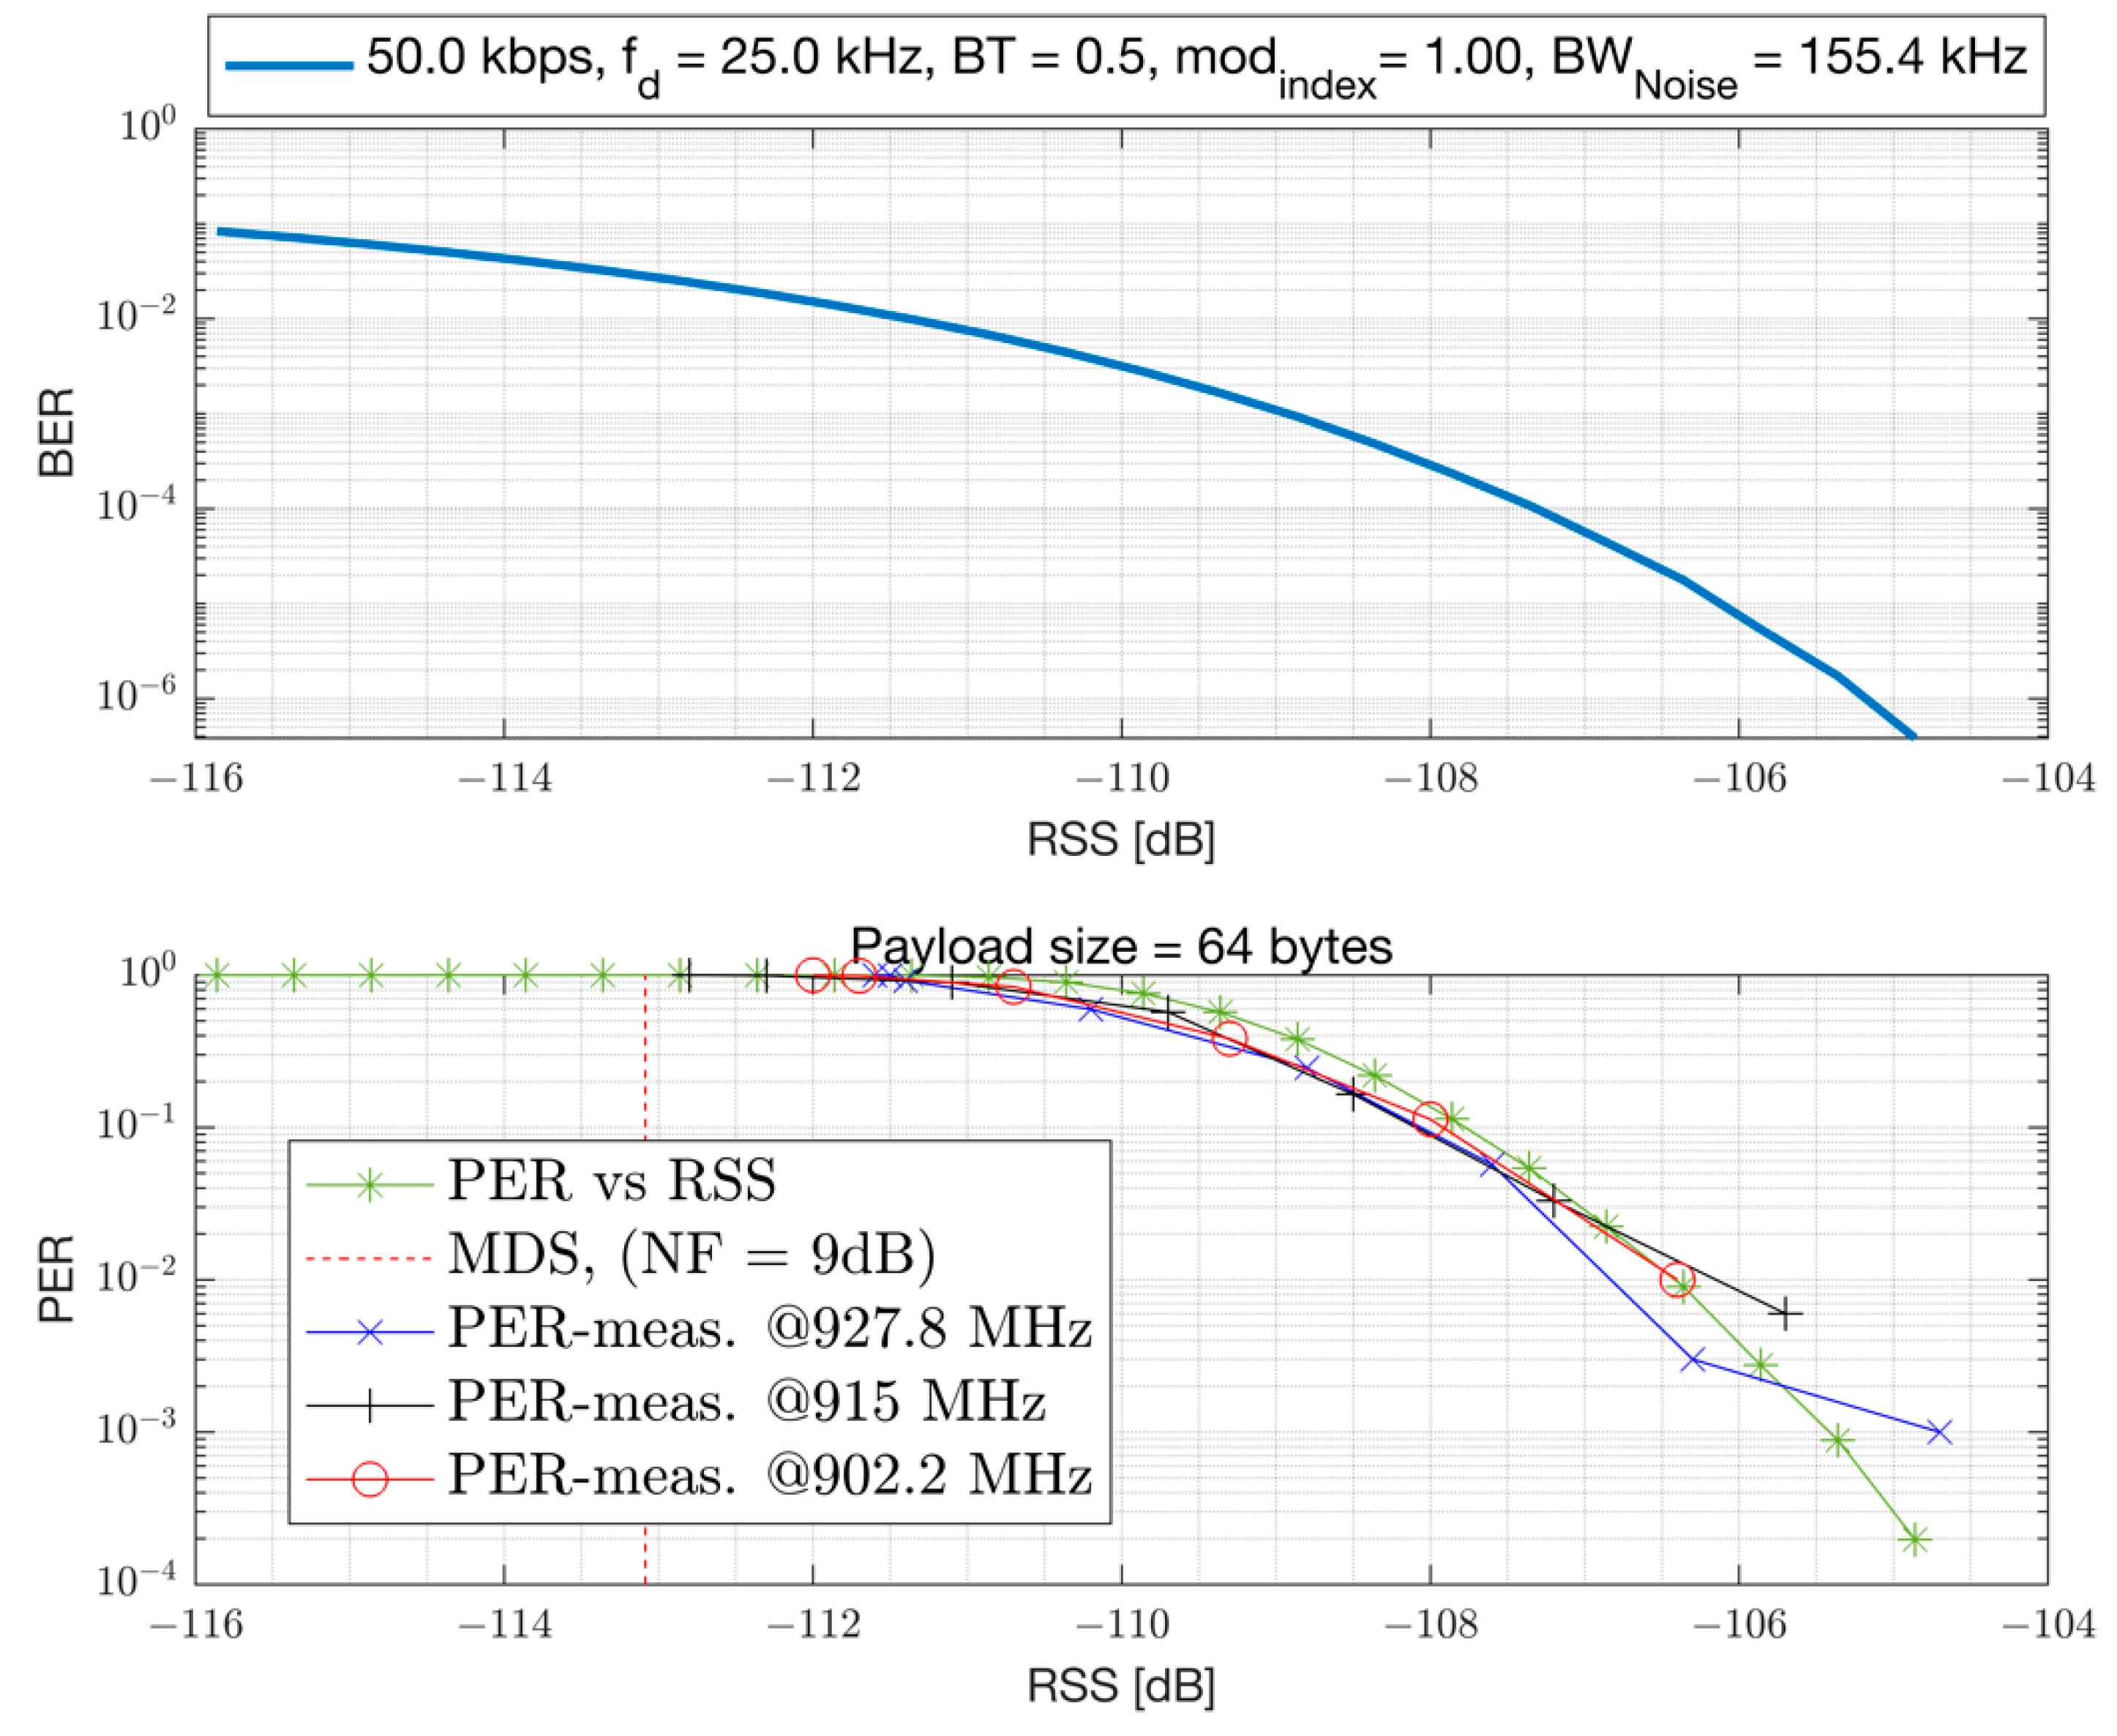
represents the Noise Figure (NF) of the device for the thermal noise and other noise sources. The chipset under characterization is a TI-EVB and had 9 dB NF. The PER versus the SNR and RSS are presented in
Figure 11 and
Figure 12, respectively. Both the simulation results in an AWGN channel and conducted lab measurements are presented. The Rx filter bandwidth of the device is set to 155.4 kHz for the 50 kbps GFSK mode with a modulation index of 1 and a Gaussian filter coefficient of
BT=0.5. The Rx filter bandwidth is set to a value larger than the modulation bandwidth (50 kHz) to accommodate carrier frequency offset (CFO) impairment that can vary across process, voltage, temperature and frequency. However, larger Rx filter bandwidth passes more thermal noise and causes a degradation in Rx sensitivity, but simplifies the hardware. A mod index of 1 is selected for such a narrowband modulation in order to improve robustness to RF impairments such as CFO. The receiver sensitivity of the device can be related to the
RSS level required in order to be able to achieve a bit error rate of
. This corresponds to a PER of 1% with a 64 bytes payload. From the results it can be seen that this device can achieve a sensitivity of -107 dBm (at 155.4 kHz Rx bandwidth) and requires an SNR of 6 dB with 9 dB NF. The presented simulation results in AWGN channel are compared to conducted lab measurements and they show good agreement.
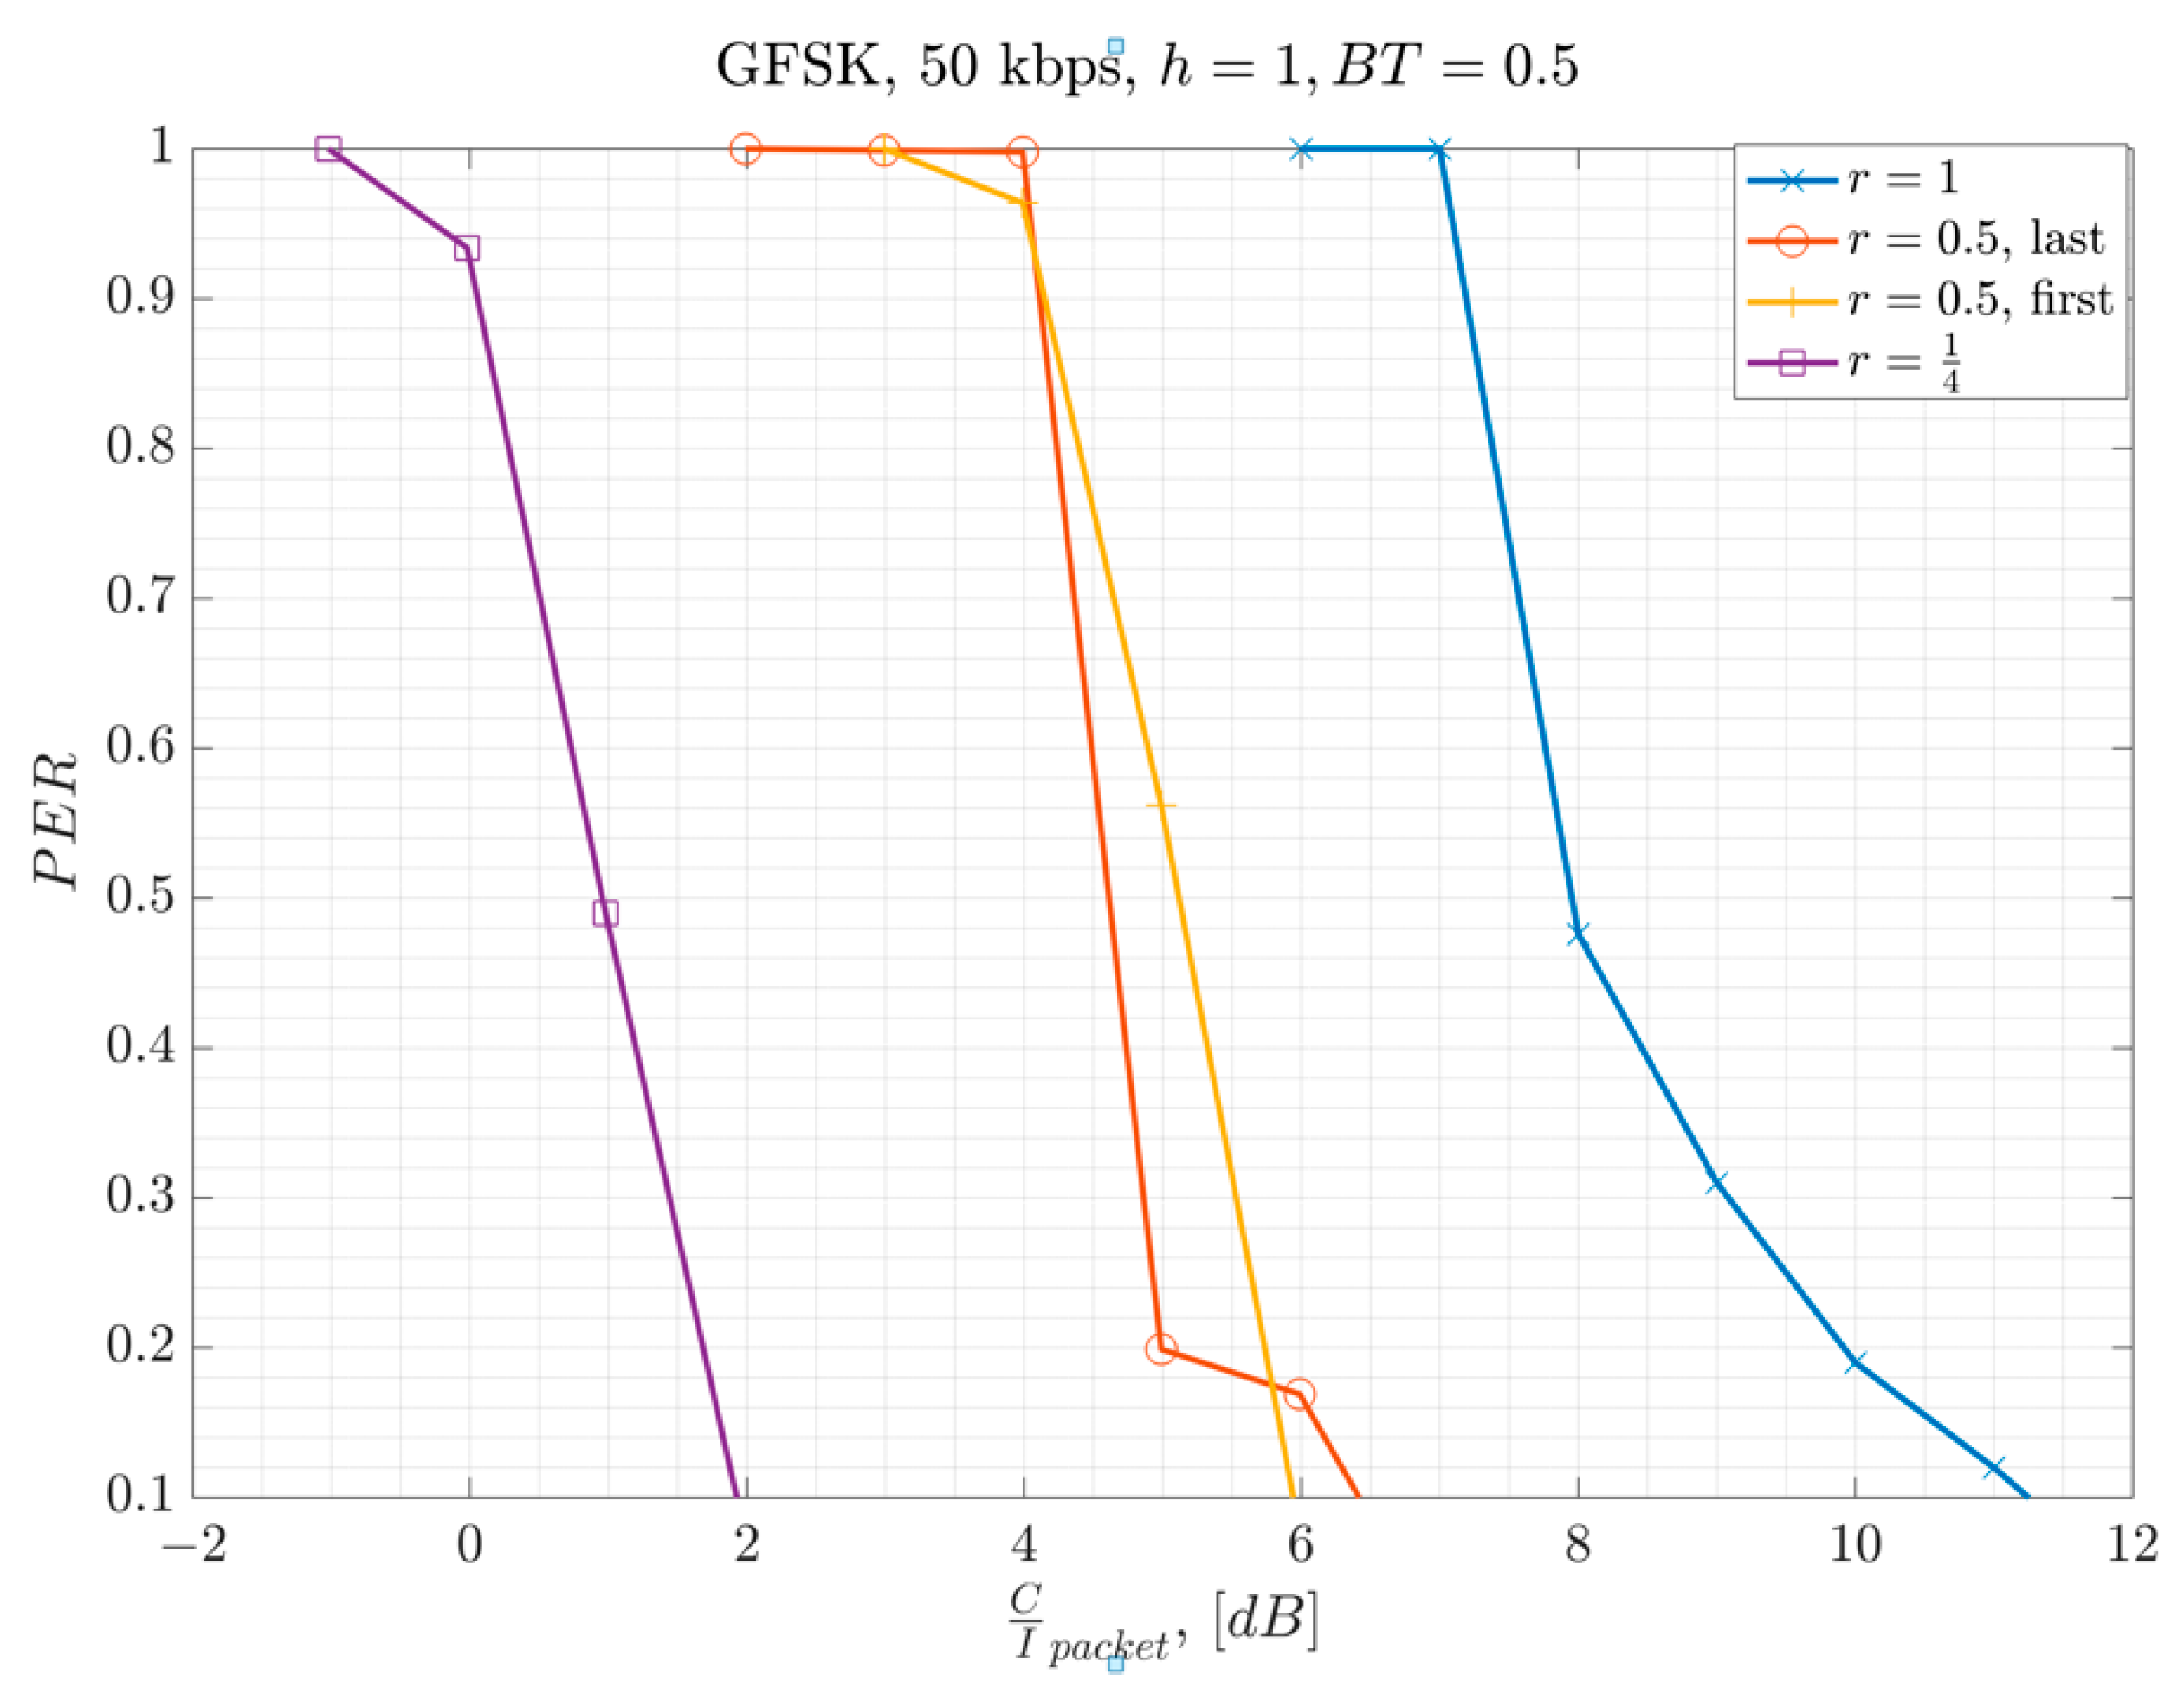
In this section, the measured performance of GFSK 50 kbps PSR under co-channel interference is presented. The results are measured with the overlap ratios of
r = 1 for baselining, with
r = 0.5, and
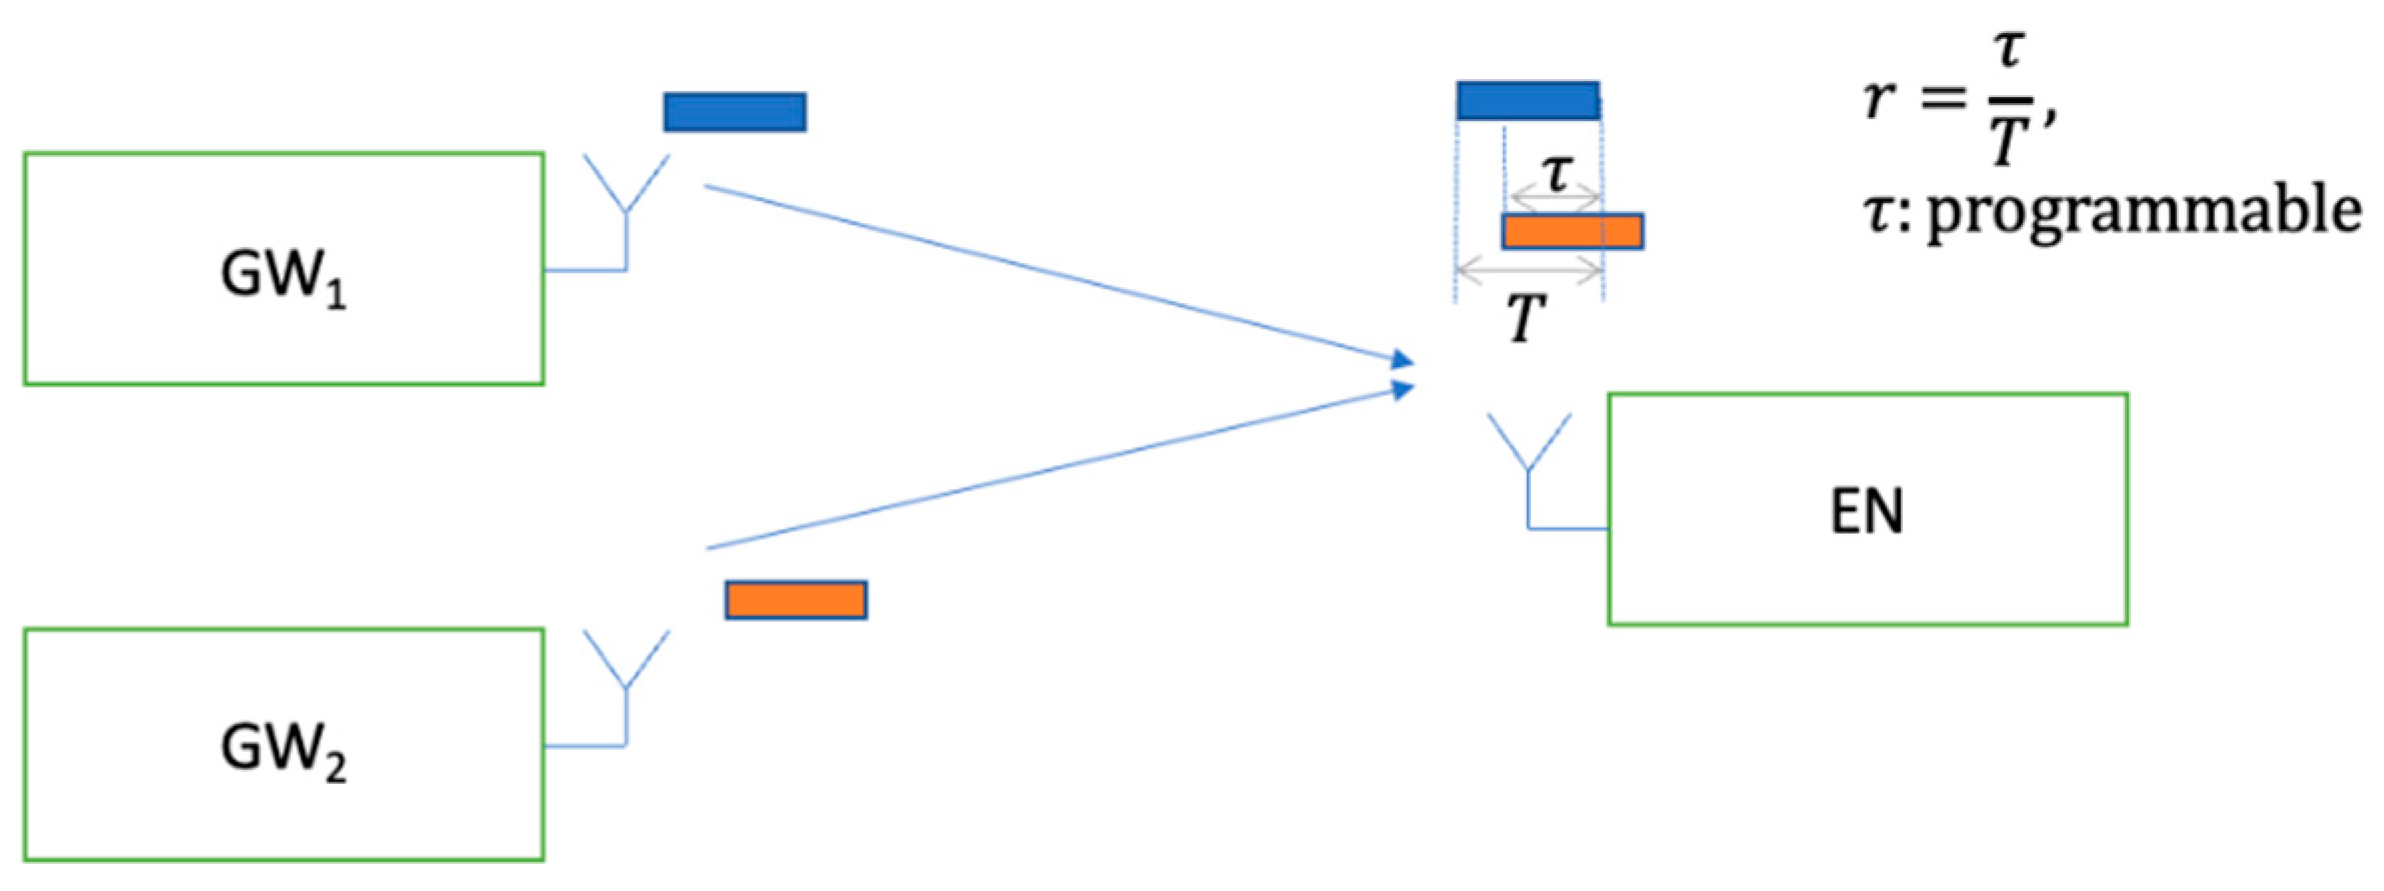
r = 0.25 for comparison. The system setup presented in
Figure 13 is used for the conducted measurements where there is one interfering user for link level system characterization. The term
represents the duration of the overlapping section of the interferer over the desired packet, where
represents the overlap ratio presented in Equation 1. The measurements are conducted for different values of
and hence different values of
.
The conducted lab measurements with this test setup are presented in
Figure 14. In the lab, the GW1 and GW
2 represent a signal generator which plays a GFSK waveform created by SX-1262 EVB [
26]. The waveform is created by using a modulation index of
,
and assuming 50 kbps bit rate (ref.
Table 1). The waveforms are scaled relative to each other in order to achieve the desired C/I level at full overlap. The second waveform from the signal generator is delayed by a time equal to
seconds relative to the first signal. And then both waveforms are added to each other after the scaling and delaying on one of them. Then the resulting waveform is input into the EN’s receiver. The EN used is another SX-1262 EVB. The measurement results are presented in
Figure 14. In the x-axis,
is calculated based on the partial interfering overlap duration
, and packet duration
by using Equation 1. The results illustrate that Equation-1 represents the performance well, where, smaller overlap ratios help improving the performance. In other words, the required C/I threshold for successful packet reception reduces by as much as
, dB. The measurements show that a C/I threshold of at least
dB is required when there is a full overlap, where
.
4. The Relationship in Between the Beacon Collision Probability and Beacon Error Rate
The loss of a beacon causes increased latency to resynchronize and might result in falling out of network, hence, beacon collision probability is investigated in detail in this section. Each beacon must be transmitted periodically, hence GWs do not employ LBT mechanism, which does not help in collision avoidance.
Assuming a binomial distribution for the devices that can collide with each other at a given instant in time, we can write the collision probability as follows. Let
N represent the number of devices that can collide with each other. It can for example represent the number of ENs in the neighbor WAN doing UL. Or
N represents the number of GWs in the area which are beaconing that can potentially collide with another beacon from another GW. Such beacon-to-beacon collision is referred to as Downlink collision as well since beacons are broadcast in the DL direction. Let
represent the collision probability in between individual links. The probability of
x devices colliding out of
N devices can be calculated as follows, where
}:
Here, x represents the number of collisions in N trials of a Bernoulli process with an individual probability of collision given by .The term represents the Probability Mass Function (PMF) of the number of collisions, x.
Then, the total probability of collision summed across all possible values of
x≤N can be calculated as:
The term represents the Cumulative Distribution Function (CDF) of the number of collisions. Here, it is assumed that any transmission on a given channel is independent than the other transmissions.
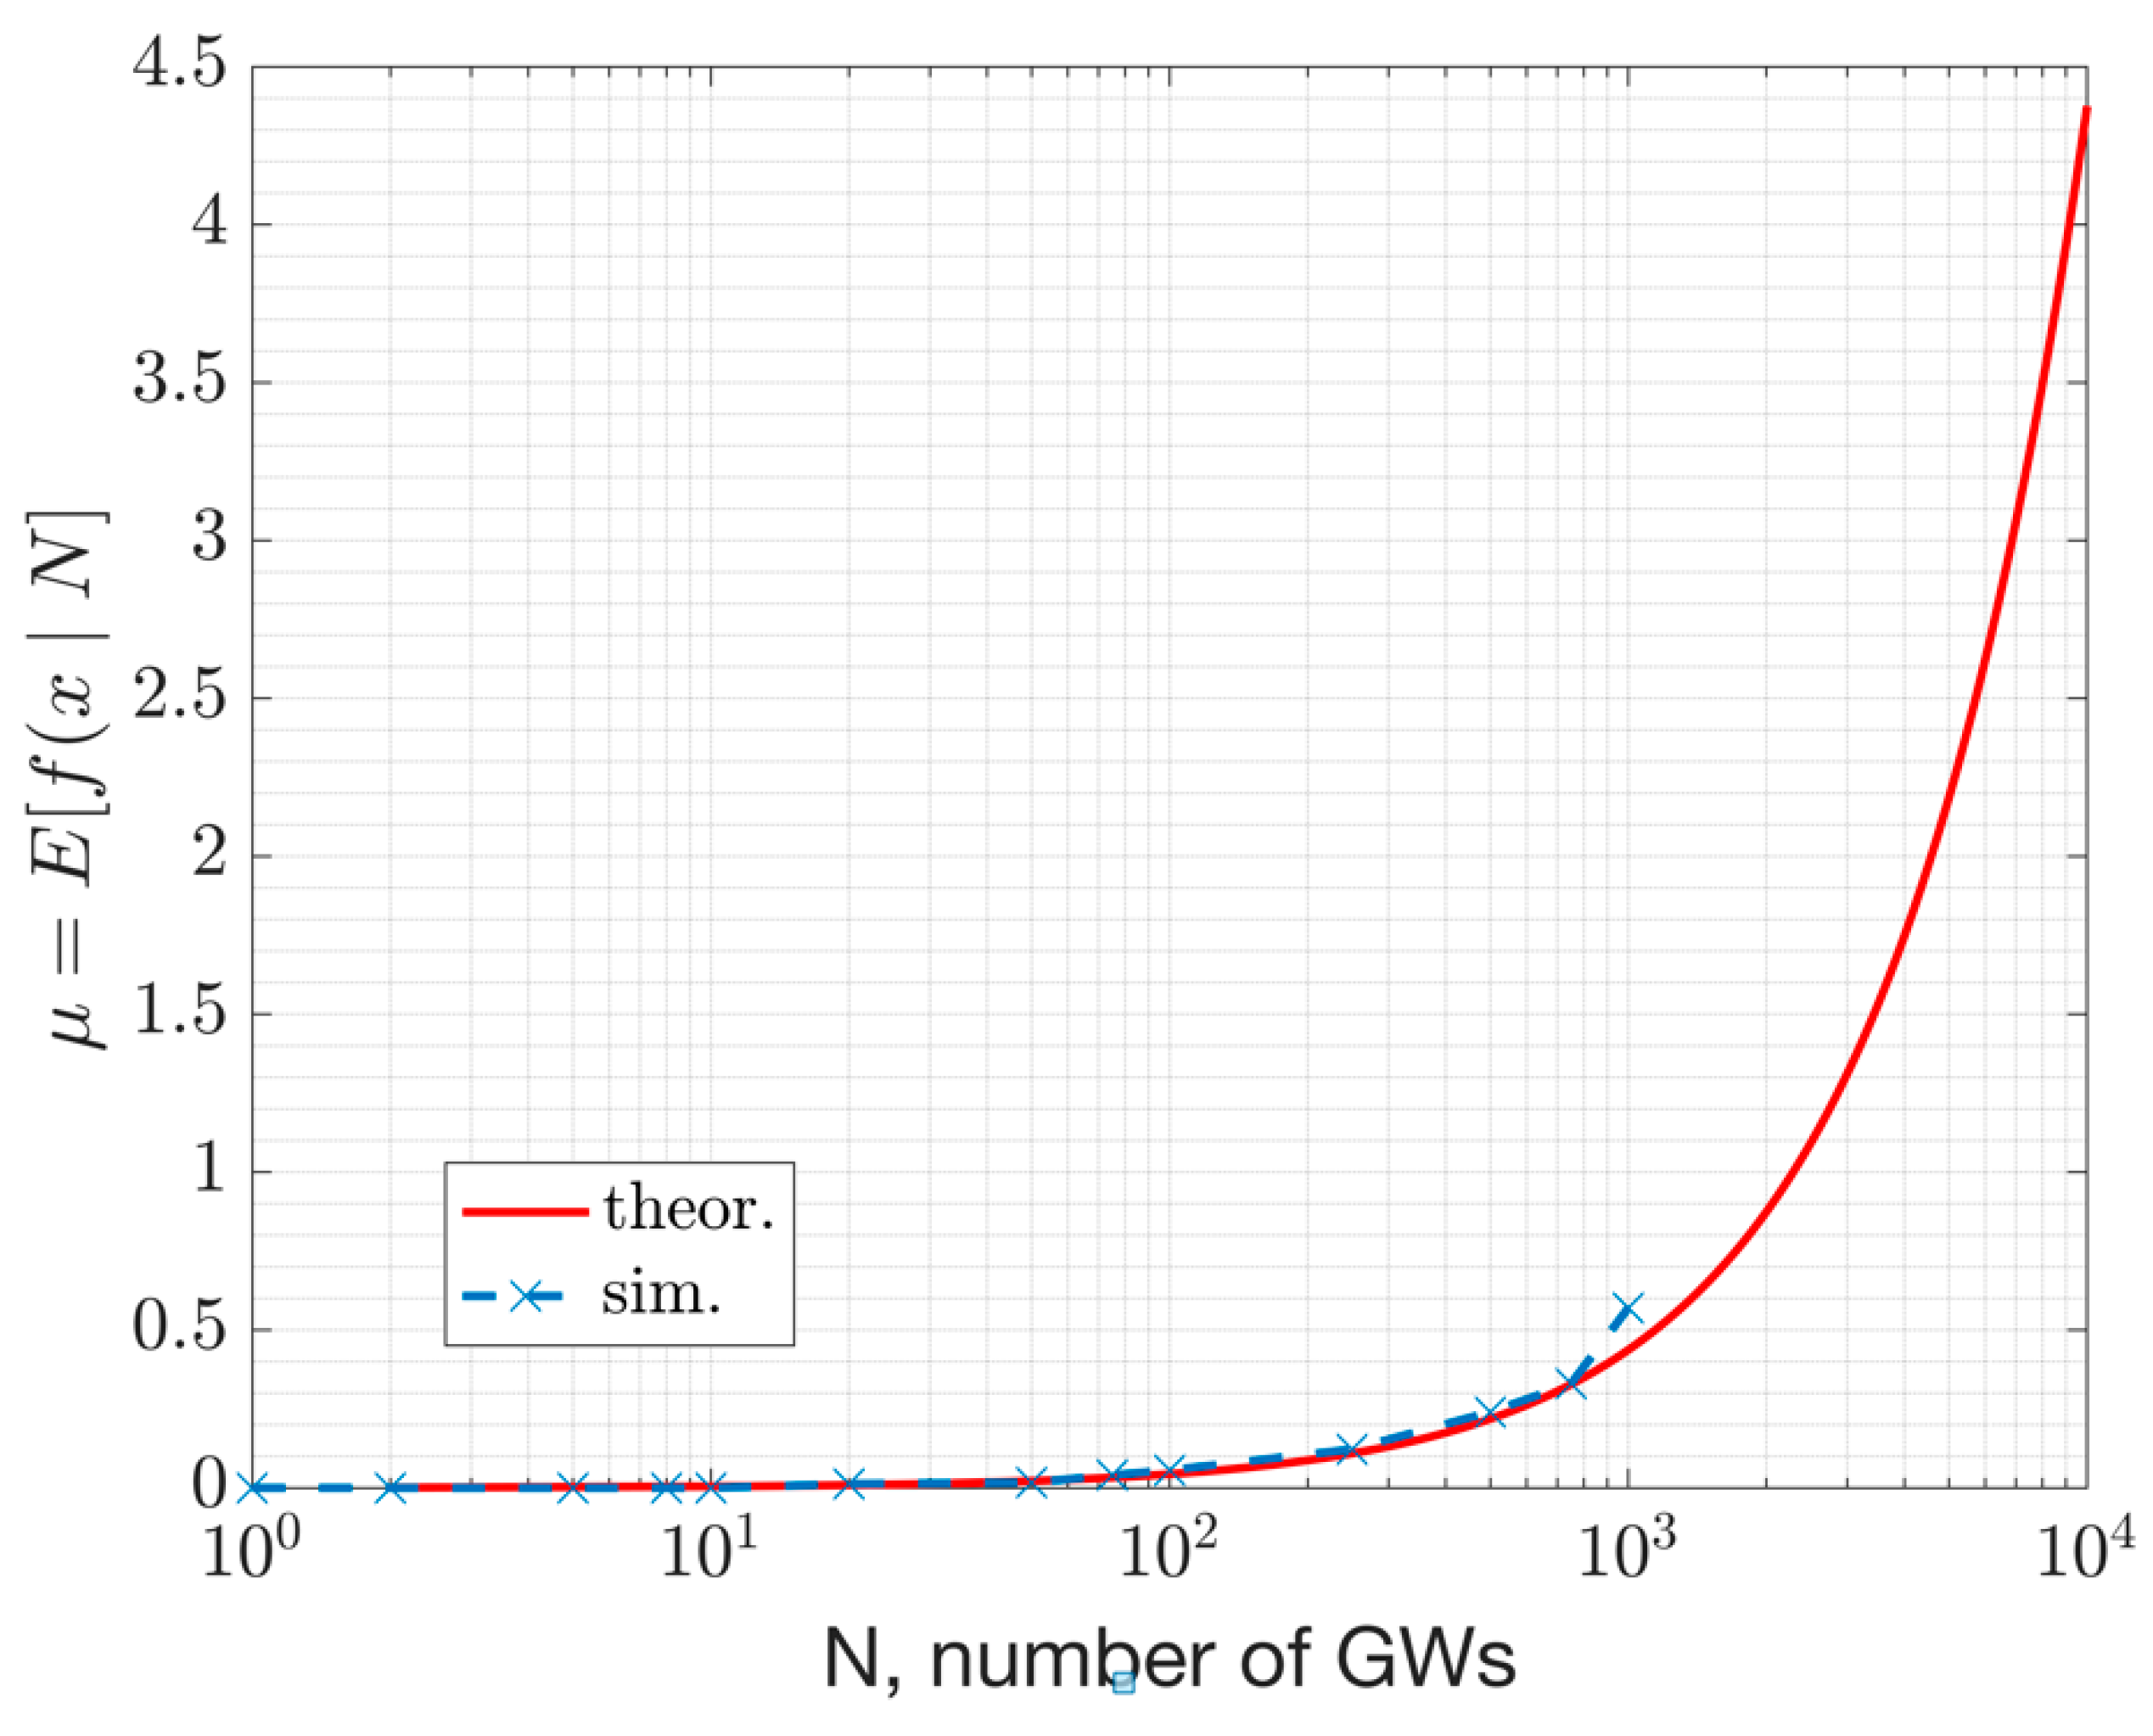
The mean number of collisions can be calculated as:
Any packet colliding for any duration greater than zero is assumed to be in collision. With this assumption, the individual collision probability per link, denoted by
, can be calculated as follows [
27]:
The terms and represent the individual collision probabilities on a beacon from the UL links and the DL links, respectively. The term represents the probability of collision in between a beacon and an UL packet. The term represents the collision probability in between two individual beacons from two different GWs. The primary GW’s beacon is assumed to occupy seconds, which is sent once every across channels. The term represents the number of UL packets within each beacon interval. The term represents the duration of each UL packet from each neighbor EN. The number of channels where frequency hopping is exercised is represented by the term. The larger the number of channels or the beacon interval, the less likely the collisions become. Similarly, larger number of packets per beacon interval increases the collision probability in the UL.
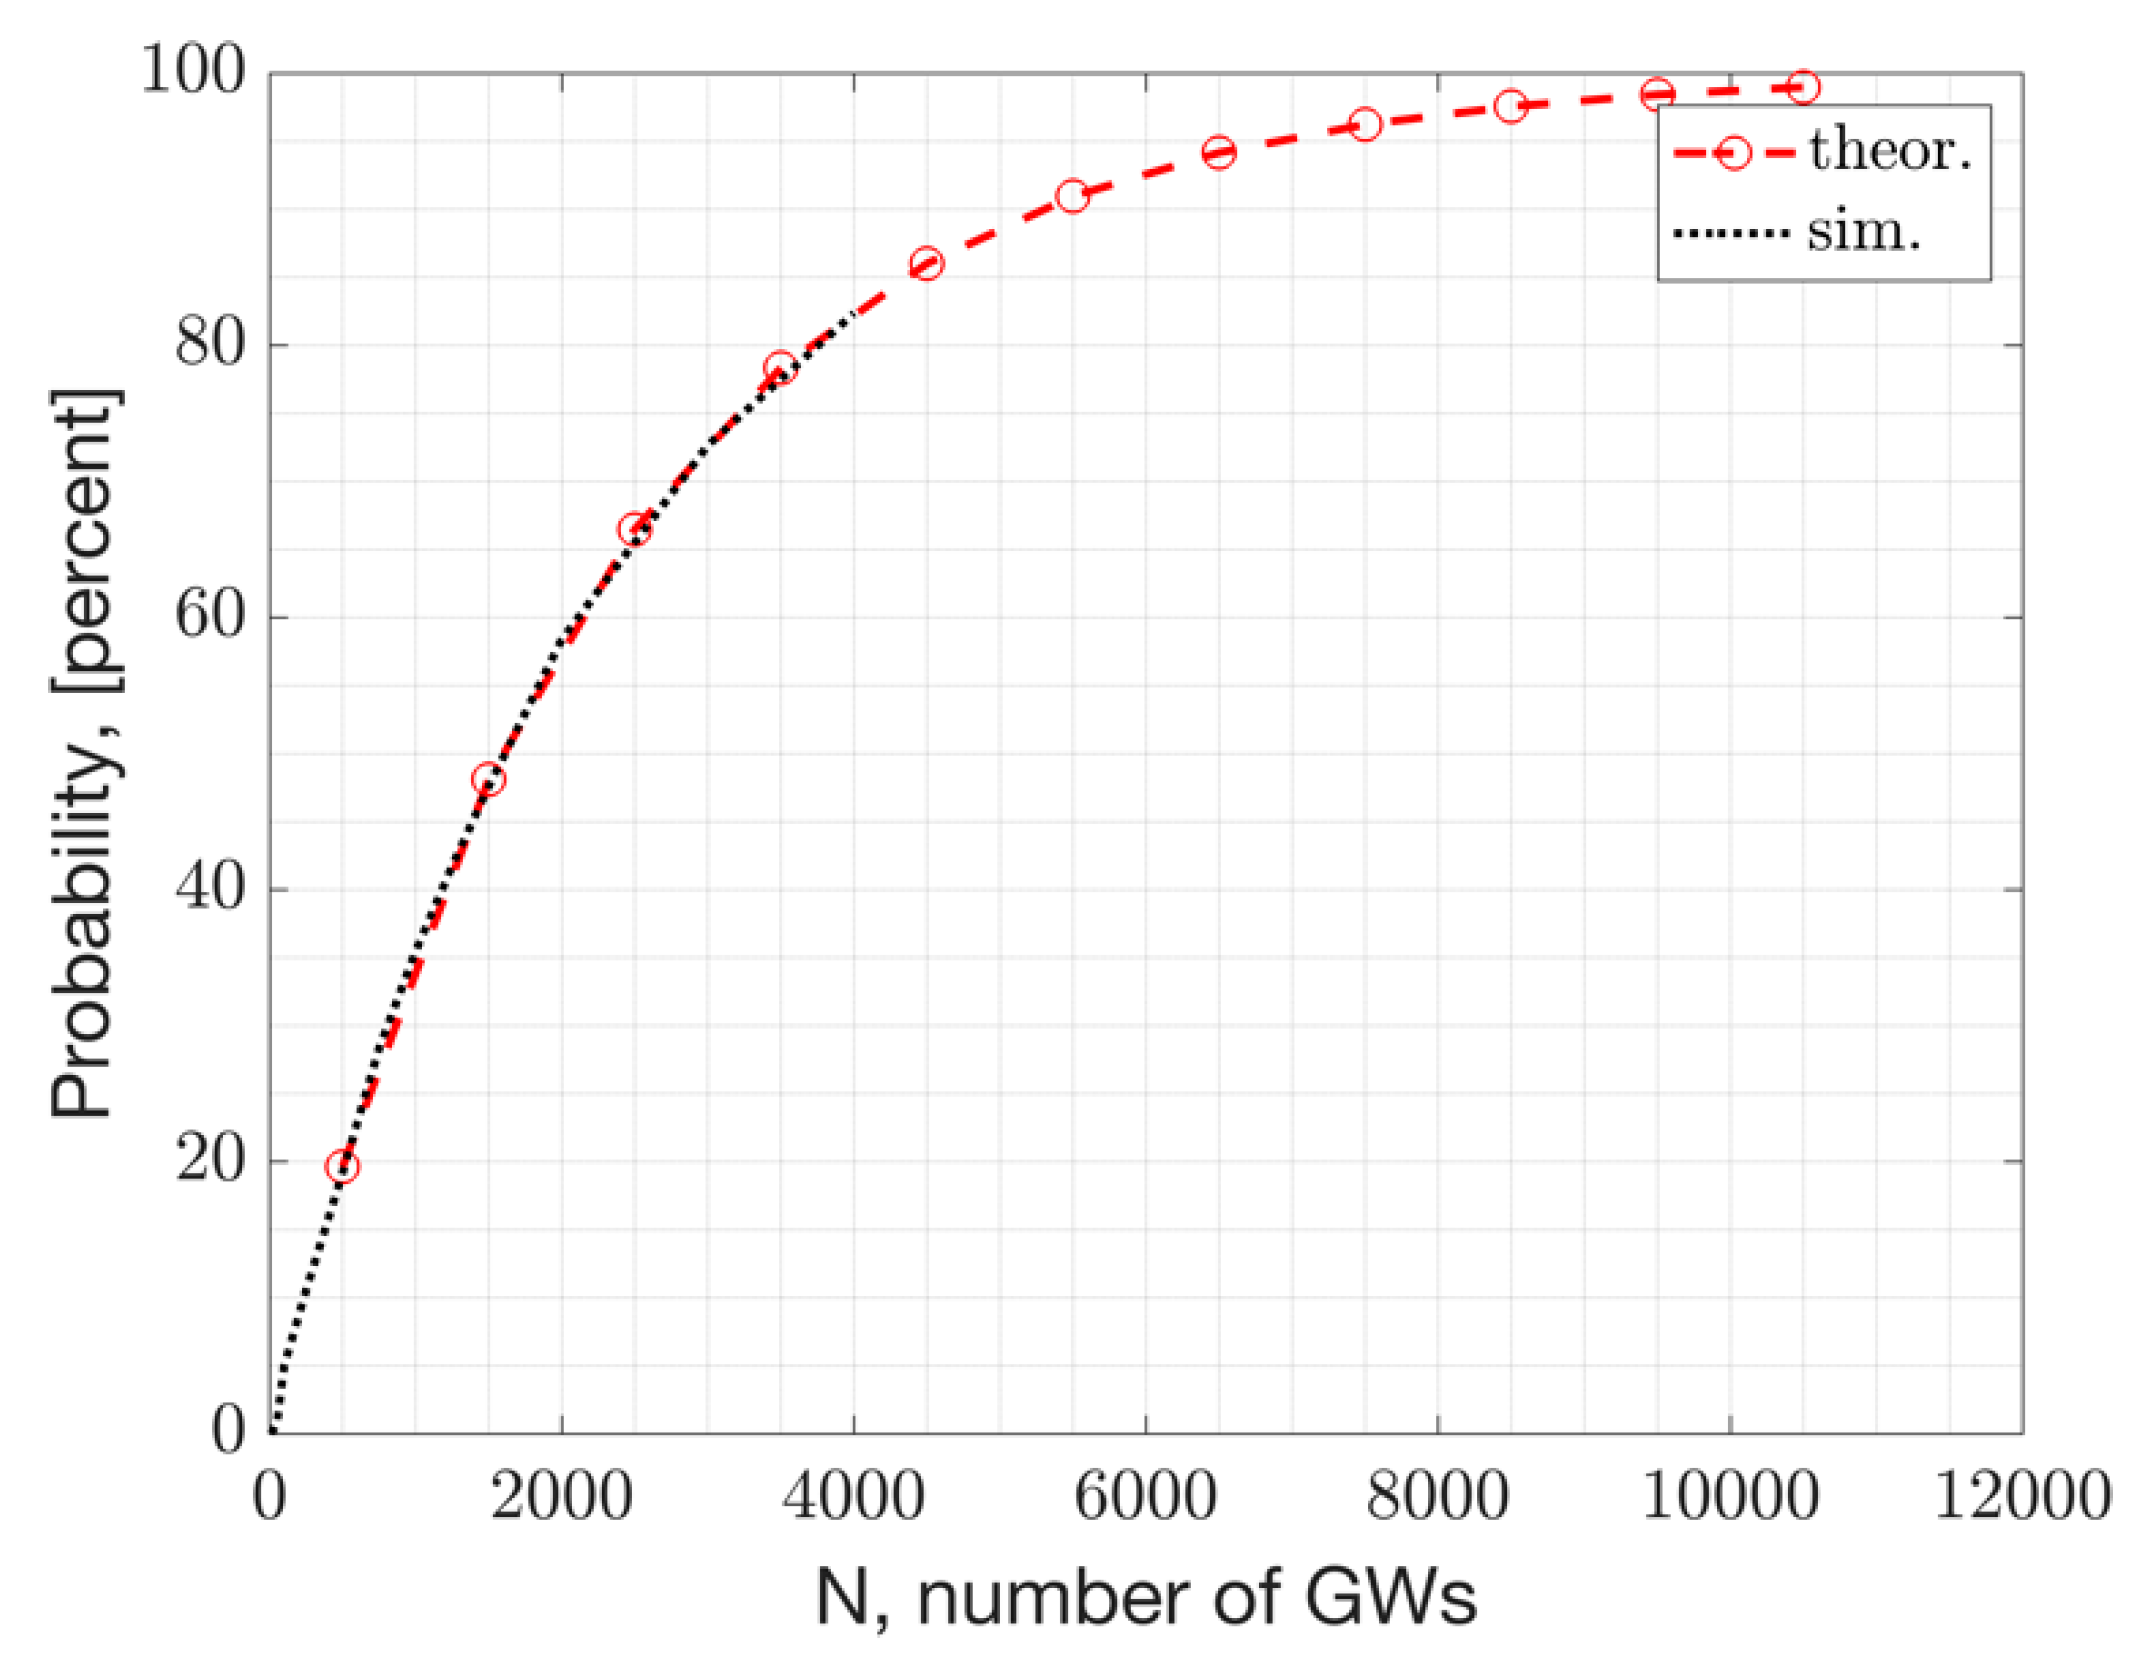
For example, the PMF with N = 5000 GWs, i.e., is plotted versus x in the following figure for the DL. This plot represents the beacon collision probability distribution. For this result, the following parameters are assumed: =152 ms, , . With these assumptions, the mean number of collisions is .

This PMF plot above shows that when there are N = 5000 GWs, the probability of x=1 and x=2 devices colliding is ~0.25 and ~0.27, respectively. Whereas the probability of x>10 devices colliding at a given time is zero.
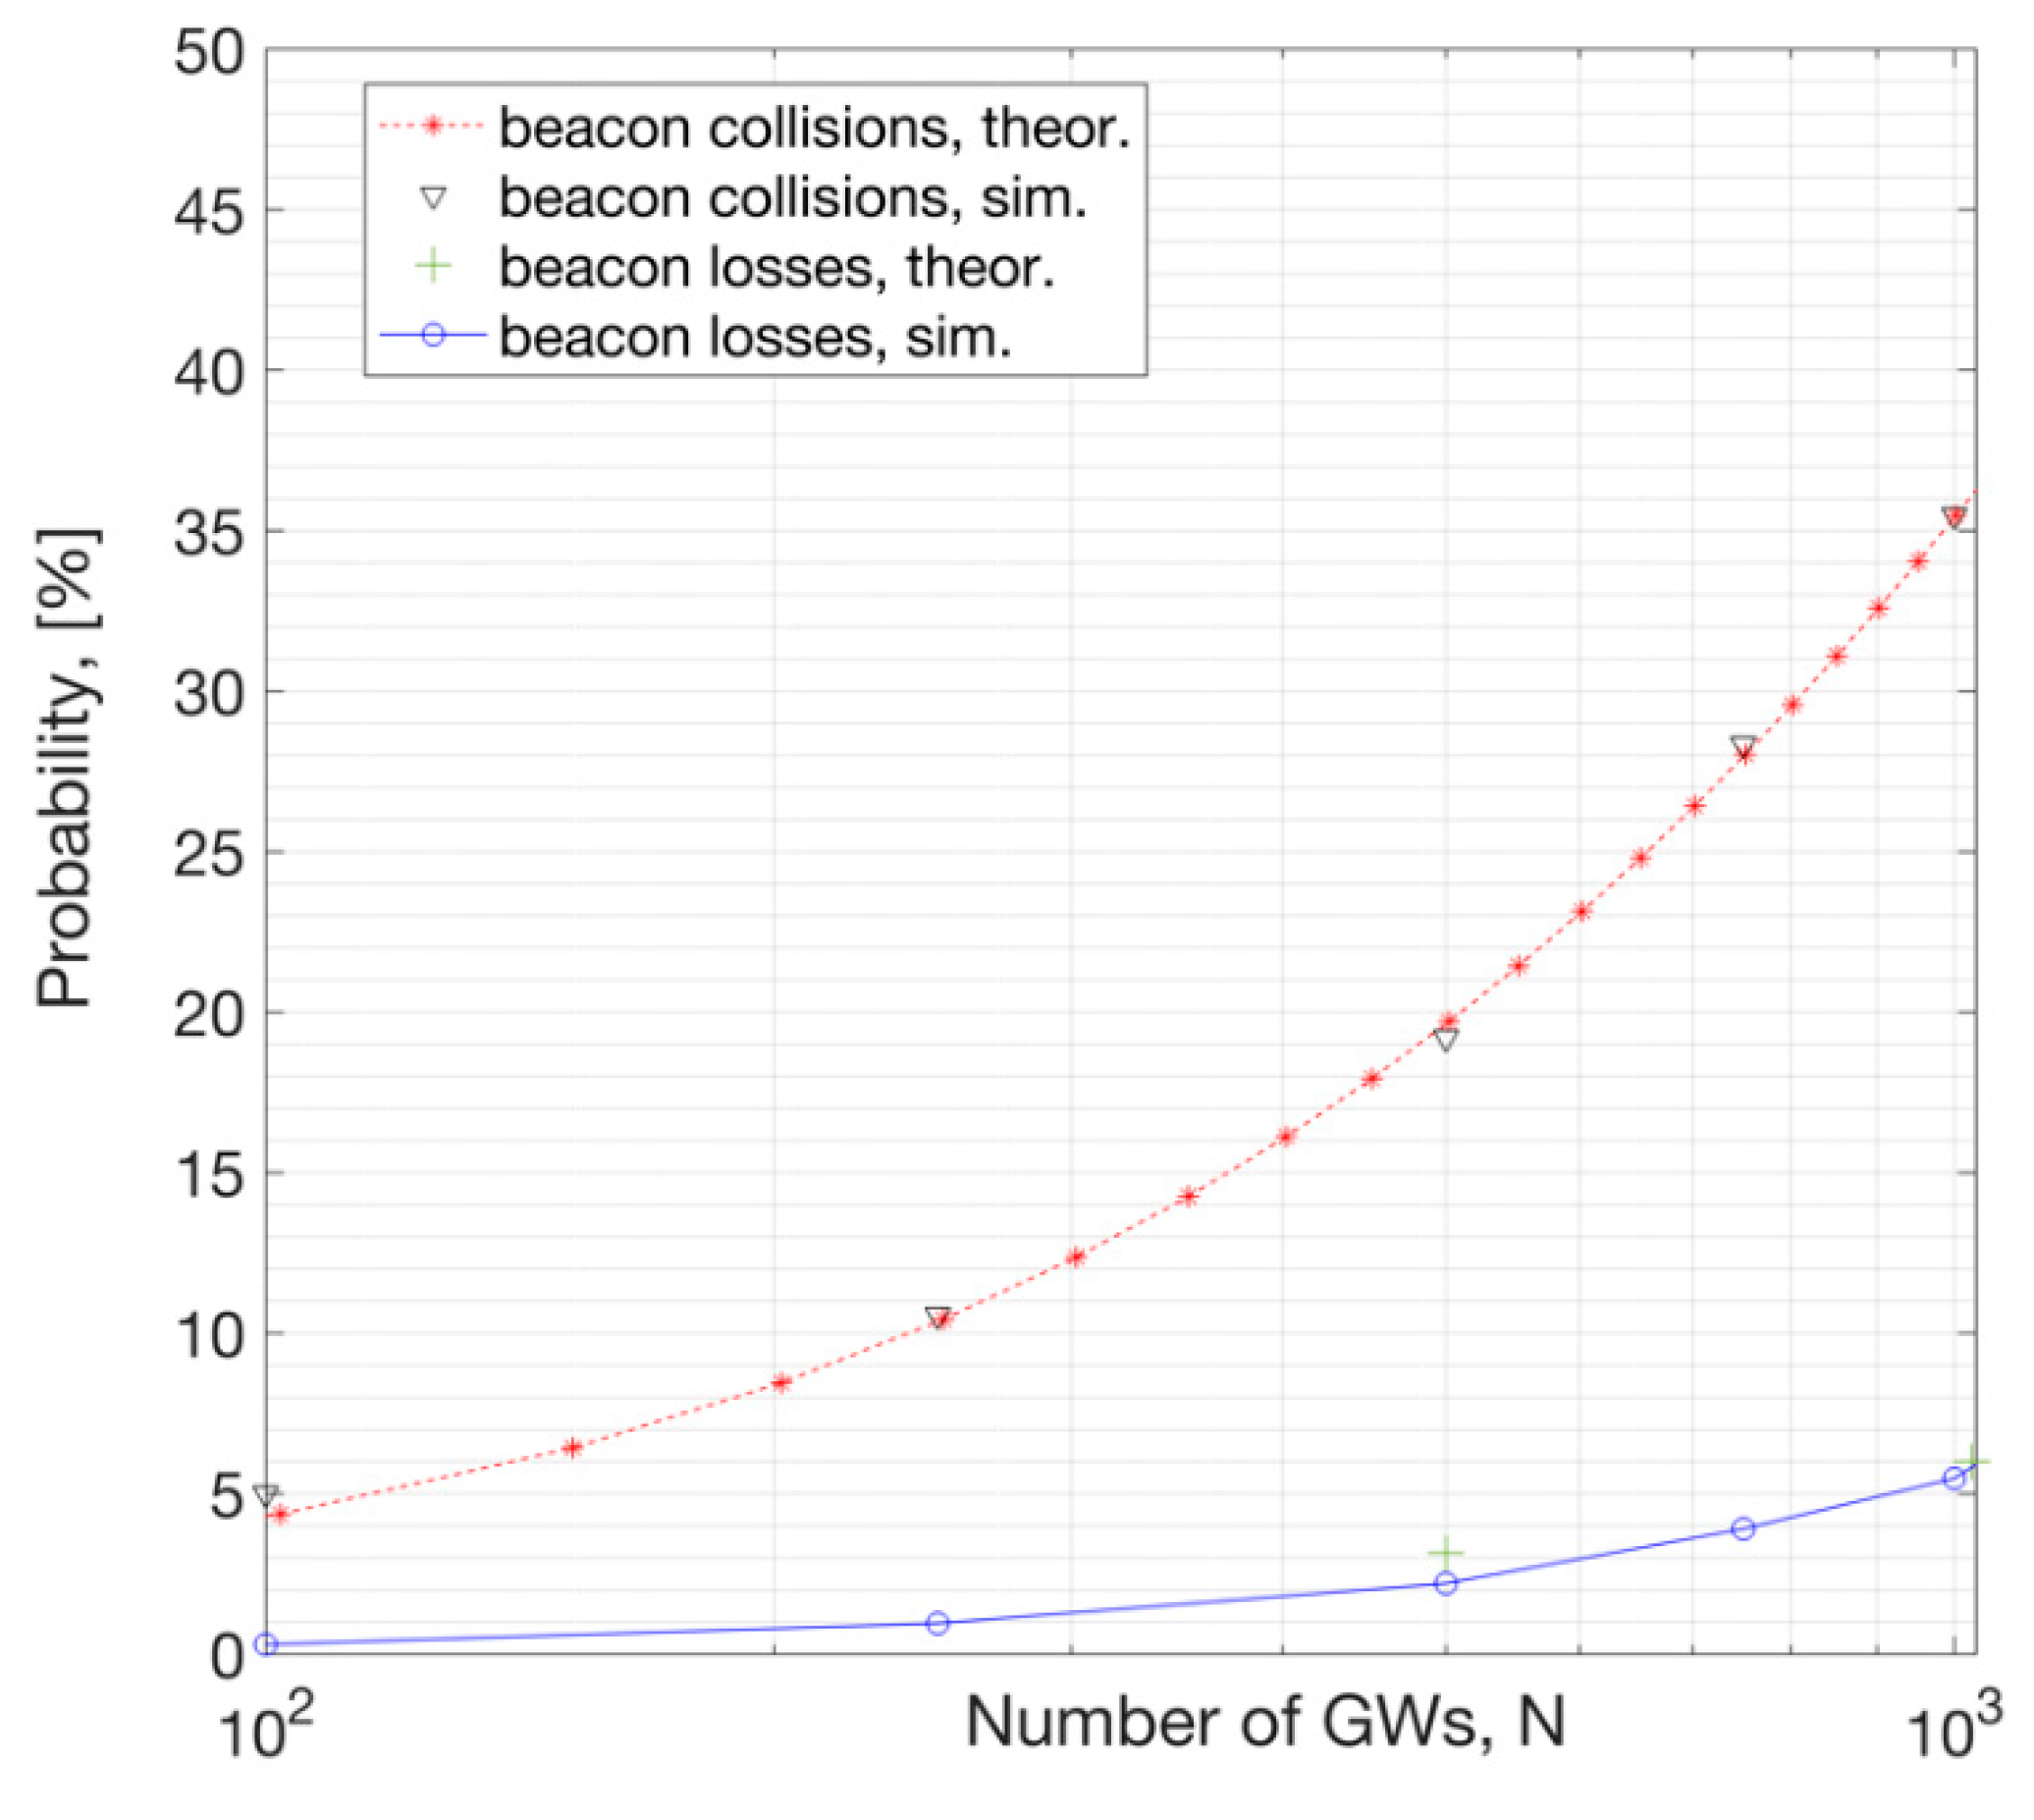
Packet collisions on a beacon happen with probabilities outlined in Equations 6 to 9. However, not all collisions result in a beacon loss. This is due to the fact that, when
then the beacon is successfully received by the EN despite a collision (ref.
Figure 5,
Section 2-B and
Section 4-C.). Hence, the overall performance depends not only the distance to a GW, but also the interference observed by the ENs. Closer ENs to a GW see a better
RSS, increasing their chance to have
. The expected values of the
versus the network size is presented in Numerical Results Section.
In order for a beacon to be lost, the following has to happen:
the signal needs to be below the sensitivity level, else,
a collision has to happen,
and the C/I on the packet calculated with the overlap ratio needs to be worse than a threshold. (The thresholds and the co-channel interference model is presented in
Section 3.C.)
With this introduction, the beacon loss rate can be approximated as follows:
The terms
represents the location of each end node, relative to the GW that it is connected to. The term
D represents the area border size in meters where the beacon error rate calculation is made. The term
represents the probability at which the
(in dBm) is greater than sensitivity, represented by the term
, dBm. The probabilistic sum of all possible collisions for a total of
N gateways is represented by the term
, which is given in Equation (7). The term
represents the probability of its argument. For example,
represents the probability at which the carrier to interference ratio
) at location
observed at the EN
is less than a threshold
dB. Our PHY layer model shows this threshold to be
~7 dB (ref.
Section 3). The closed form expression on how
is calculated while considering the overlap ratio is given in Equation 1.
Author Contributions
Conceptualization, B.C., B. K., A. B., F. Z., S. P., and U. B.; methodology, B.C., B. K., A. B., F. Z., S. P., M. F. G. and U. B.; software, A. B., F. Z., S. P., B. C., and M. F. G.; validation, B.C., A. B., F. Z., S. P., M. F. G.; formal analysis, B.C., F. Z., S. P., and A. B.; investigation, B.C., B. K., A. B., F. Z., S. P., and M. F. G.; data curation, B.C., B. K., A. B., F. Z., S. P.; writing—original draft preparation, B.C.; writing—review and editing, B.C.,A.K., F.Z., A.B.; visualization, B.C., S. P., F. Z., A. B.; supervision, B.C., B.K., A. B., U. B., R. S., S. M., A.K., V. S. K. V. S. All authors have read and agreed to the published version of the manuscript.
