Preprint
Article

Automatic Detection of Feral Pigeons in Urban Environment Using Deep Learning

This version is not peer-reviewed.

Submitted:

09 November 2023

Posted:

10 November 2023

You are already at the latest version

A peer-reviewed article of this preprint also exists.

Abstract
The overpopulation of feral pigeons in Hong Kong has significantly disrupted the urban ecosystem, highlighting the urgent need for effective strategies to control their population. In general, control measures should be implemented and re-evaluated periodically following accurate estimations of feral pigeon population in the concerned regions, which, however, is very difficult in urban envi-ronments due to the concealment and mobility of pigeons within complex building structures. With the advances in deep learning, computer vision can be a promising tool for pigeon monitoring and population estimation but has not been well investigated so far. Therefore, we propose an improved deep learning model based on Mask-RCNN (Swin-Mask R-CNN) for feral pigeon detection using computer vision techniques. Specifically, our model consists of a Swin transformer network (STN) as the backbone, a feature pyramid network (FPN) as the neck, and three decoupled detection heads. The STN is utilized to extract deep feature information of feral pigeons through local and cross-window attention mechanisms. The FPN is employed to fuse multi-scale features and enhance the multi-scale learning ability. Heads in the three branches are responsible for classification, pre-dicting best bounding boxes, and segmentation of feral pigeons, respectively. During the prediction phase, a Slicing Aided Hyper Inference (SAHI) tool is employed to zoom in on the feature infor-mation of small feral pigeon targets, and the segmentation head is frozen to expedite inference of large images. Experiments were conducted on feral pigeon dataset to evaluate model performance. The results reveal that our model is well-suited for detecting small targets in high-resolution images and achieves excellent recognition performance for feral pigeons with a mAP (mean average pre-cision) and an AP50 (average precision at 50% intersection over union) of 0.74 and 0.93, respectively. For small target feral pigeons, AP50 in small scale (AP50s) improved by 10% as compared to the Mask R-CNN (AP50s of 0.75), demonstrating its potential for dynamic pigeon detection and population estimation in the future.
Keywords: 
Subject: 
Biology and Life Sciences  -   Ecology, Evolution, Behavior and Systematics

1. Introduction

The overpopulation of feral pigeons can lead to an imbalance of environmental and human health in the urban ecosystem. Excessive droppings from dense pigeon populations contaminate air and water resources while these birds can harbor pathogens like chlamydiosis and cryptococcosis, transmissible to humans via respiratory secretions, feathers, and feces [1], thereby elevating infection risks for vulnerable individuals. In addition, the overpopulation will negatively affect urban infrastructure due to increased excess of feces. Then the feces of feral pigeon usually damage valuable buildings and statues and cause a huge economic loss [2]. Consequently, monitoring and quantifying feral pigeon populations is essential for evaluating their distribution and identifying instances of overpopulation, ultimately informing the design of effective intervention strategies. Traditional studies of feral pigeons typically utilize the mark-recapture method [3], where the pigeons are identified by marks like rings or tags for future recapture and survival study. Alternatively, point-count surveys [4] record the number of pigeons visually or audibly observed at a specific location and time. Nest-site surveys [5] record the location and number of pigeon nests. However, each method has drawbacks. Marking pigeons is labor-intensive and potentially harmful. Point-count surveys may be inaccurate due to pigeon mobility, and nest-site surveys struggle to predict pigeon numbers and densities in urban areas due to nest observation difficulties. Moreover, traditional counting methods of feral pigeons present a formidable challenge due to factors such as object fast movement, overlap, obscured visibility, and varying population density across environments.
Deep learning [6] has rapidly emerged as a potent and efficient solution for object detection [7] and counting across diverse settings, replacing traditional manual methods. Its applications apply to the realm of animal detection [8,9] and counting. Huang et al. [10] proposed a center clustering network to enhance piglet counting accuracy under occlusion in farrowing pens. For sheep monitoring, a region-based Convolutional Neural Network (CNN) [11] model was employed to detect and count sheep in paddocks using UAV footage [12]. Additionally, Xu et al. [13] utilized Mask R-CNN for automated cattle counting in pastures and feedlots. While these deep learning approaches address animal detection from a single scene, bird detection [14] scenarios present greater complexity and variability in target scales compared to the relatively uniform environments of livestock detection and counting. Consequently, there is a need to detect concealed and diminutive pigeon targets in dynamic surroundings.
To solve the problem of bird detection and counting, a series of enhanced deep learning techniques has been employed. In its early attempts, the CNN algorithm showed promise in boosting bird detection accuracy [15]. For expedited bird detection, the You Only Look Once (YOLO) strategy [16], which adopts a one-stage approach, has been utilized. A model dubbed DC-YOLO, based on YOLOv3, was devised to accurately detect bird populations near power lines [17]. Furthermore, a temporal boosted YOLO model was constructed for detecting birds in specific wind farms [18], and a combination of YOLO and Kalman filter [19] was applied to low-light images for detecting and tracking chickens [20]. While these methods have improved bird detection accuracy, the modified YOLO algorithms' key limitation is their fast one-time detection, making them vulnerable to noise and other confounding factors (multi-scale objects, image details, different shapes of the same object, etc.). Additionally, they frequently fail to detect small objects and objects far away from the camera in high-resolution images.
Compared with one-stage detection models [21], two-stage networks [22] place greater emphasis on image details. To enhance the accuracy of small object detection in large scale images, the two-stage Faster R-CNN [23] employs an RPN network to generate candidate regions and extract intricate image features. Hong et al. [24] developed a two-stage deep learning-based bird detection model for monitoring avian habitats and population sizes. Their study utilized a dataset containing diverse bird habitats, lakes, and agricultural landscapes, and compared the performance of YOLO, Faster R-CNN, and SSD detection models [25]. The results indicated that the Faster R-CNN model exhibited great detection accuracy. To further augment image detail extraction capabilities, the state-of-the-art Mask R-CNN [26] introduces the RoIAlign mechanism, which accurately extracts features from candidate regions, thereby improving small object detection accuracy. This model demonstrates greater adaptability to environmental changes and stronger generalization capabilities compared to earlier deep learning methods. Nevertheless, ample room remains for enhancing the detection capabilities of two stage algorithms, particularly for small object detection for feral pigeons within large scale images.
To the best of our knowledge, no extant research presents a feral pigeon detection model suitable for complex urban environments. In pursuit of this objective, we propose a Swin-Mask R-CNN with SAHI model for feral pigeon detection. First, this model adopts the Swin Transformer [27] as its backbone network, utilizing a hierarchical local attention mechanism and cross-layer information exchange to decrease computation and enhance feature extraction capabilities, respectively. Second, we select FPN [28] as the neck in this model to merge feature maps of varying scales, thereby improving the model's detection capacity for differently sized feral pigeon targets. Lastly, we employ Slicing Aided Hyper Inference (SAHI) [29] for image slicing and feature information allocation for large and small targets. We subsequently apply the Non-Maximum Suppression (NMS) [30] algorithm to identify the optimal detection box and freeze the target segmentation branch during the inference and prediction stages to expedite target detection.
In summary, the proposed Swin-Mask R-CNN with SAHI model further refines the accuracy of small target object detection and exhibits enhanced generalization capabilities. These advancements hold significant potential for detection and counting of feral pigeons. As far as we are aware, our research represents the first urban pigeon detection and counting initiative across diverse urban environments. Our major contributions can be summarized as follows:
(1) We created a unique dataset of feral pigeons in urban environment with manually annotated bounding boxes, concentrating on the detection and enumeration of urban pigeons across diverse cityscapes.
(2) We developed Swin-Mask R-CNN with SAHI model for pigeon detection, incorporating the SAHI tool to preserve fine details of smaller targets during the inference phase, thereby enhancing detection accuracy.
(3) We further improved the model with SAHI tool and enabled it to encompass a greater number of feral pigeons by utilizing large-scale images (4032×3024), achieving broader detection coverage.

2. Materials and Methods

2.1. Image data collection

Feral pigeon images used in this study were collected from various areas across Hong Kong SAR, China. Two cameras are used for image collection: a main camera with a 12MP Sony IMX503 sensor featuring optical stabilization and HDR mode, and a secondary camera with a 12MP Sony IMX372 sensor featuring a 120° ultra-wide-angle function and PDAF phase detection technology. To ensure that the data collected covers different urban environments and pigeon poses, data collectors conducted the following enrichment shots: (1) Different urban environments include park grounds, flowerbeds, tree groups, residential buildings, and sky; (2) Different illumination levels in the dawn, morning, and afternoon; and (3) Different postures of birds include flying (wing flapping), standing, eating, and walking. To avoid disturbing feral pigeons' normal activities, photos were taken quietly from at least 3 meters away. Since feral pigeons are small targets, and in some cases, they may also be far away from the lens or even obstructed by other objects, high-resolution images (i.e., 4032×3024 pixel) were collected to obtain a more straightforward target display effect. Consequently, the dataset consists of 400 images, which have diverse backgrounds and pigeon poses. Examples of the images are shown in Figure 1, where feral pigeons inhabit various poses at different locations within urban environments.

2.2. Data labelling and augmentation

The LabelImg annotation tool [31] was used to label all feral pigeons in the images. Full-body labelling of rectangle boxes was used for fully visible feral pigeons, while only the visible parts were labeled for partially visible feral pigeons (Figure 1). The 400 high-resolution images were manually labeled, and the label information was saved as a COCO format JSON file. In this task, we have one class named feral pigeon for our model to learn the feral pigeon feature.
Figure 1. Examples of annotated images of feral pigeons inhabiting various poses at different locations within urban environments: (a) feral pigeons perching on trees; (b) feral pigeons standing in flower beds, (c) feral pigeons flying under the sky, and (d) feral pigeons flying, standing, and hovering near trees.
Preprints 90113 g001
In the context of target detection tasks, the term "small" refers to object instances with a bounding box area between 0 and 32×32, while "medium" refers to object instances with a bounding box area between 32×32 and 96×96. Following this definition, feral pigeons are typically small to medium-sized targets in images when captured from at least three meters away. Consequently, traditional image flipping operations may alter the original shape of the feral pigeons if being applied directly on pigeon images, affecting the model's accuracy in capturing the target’s precise location in the original environment. To effectively perform data enhancement, the 400 original images were expanded to 4,000 images for training, evaluation, and testing to increase the network's robustness and prevent overfitting. Specifically, image slicing was used to increase the number of images. The images were first proportionally split into 9 equal-sized sub-images with the same pixel value, as part of the dataset. Additionally, the original images were scaled down to the same size as the sliced sub-images according to their aspect ratio.
During the image slicing stage, the bounding box information was also converted to correspond to the feral pigeon target in each slice while performing image augmentation. However, scaling may cause smaller targets to become even smaller, and feral pigeons cropped at the segmentation line may be split into different parts, leading to the loss of target-related pixel information. These operations may cause the model to learn feral pigeon features incorrectly during the training. To mitigate these issues, the following methods were used in this experiment: during the scaling process, original boxes that are too small were directly removed, and during the segmentation process, labeling information where the bounding box of the sub-image is significantly smaller than the bounding box of the original image was deleted. The results are shown in Figure 2. After processing all the images and labelling information, the dataset was randomly divided into a training set, a testing set, and a validation set in a ratio of 4:1:1. The dataset splitting is shown in Table 1.

2.3. Workflow overview

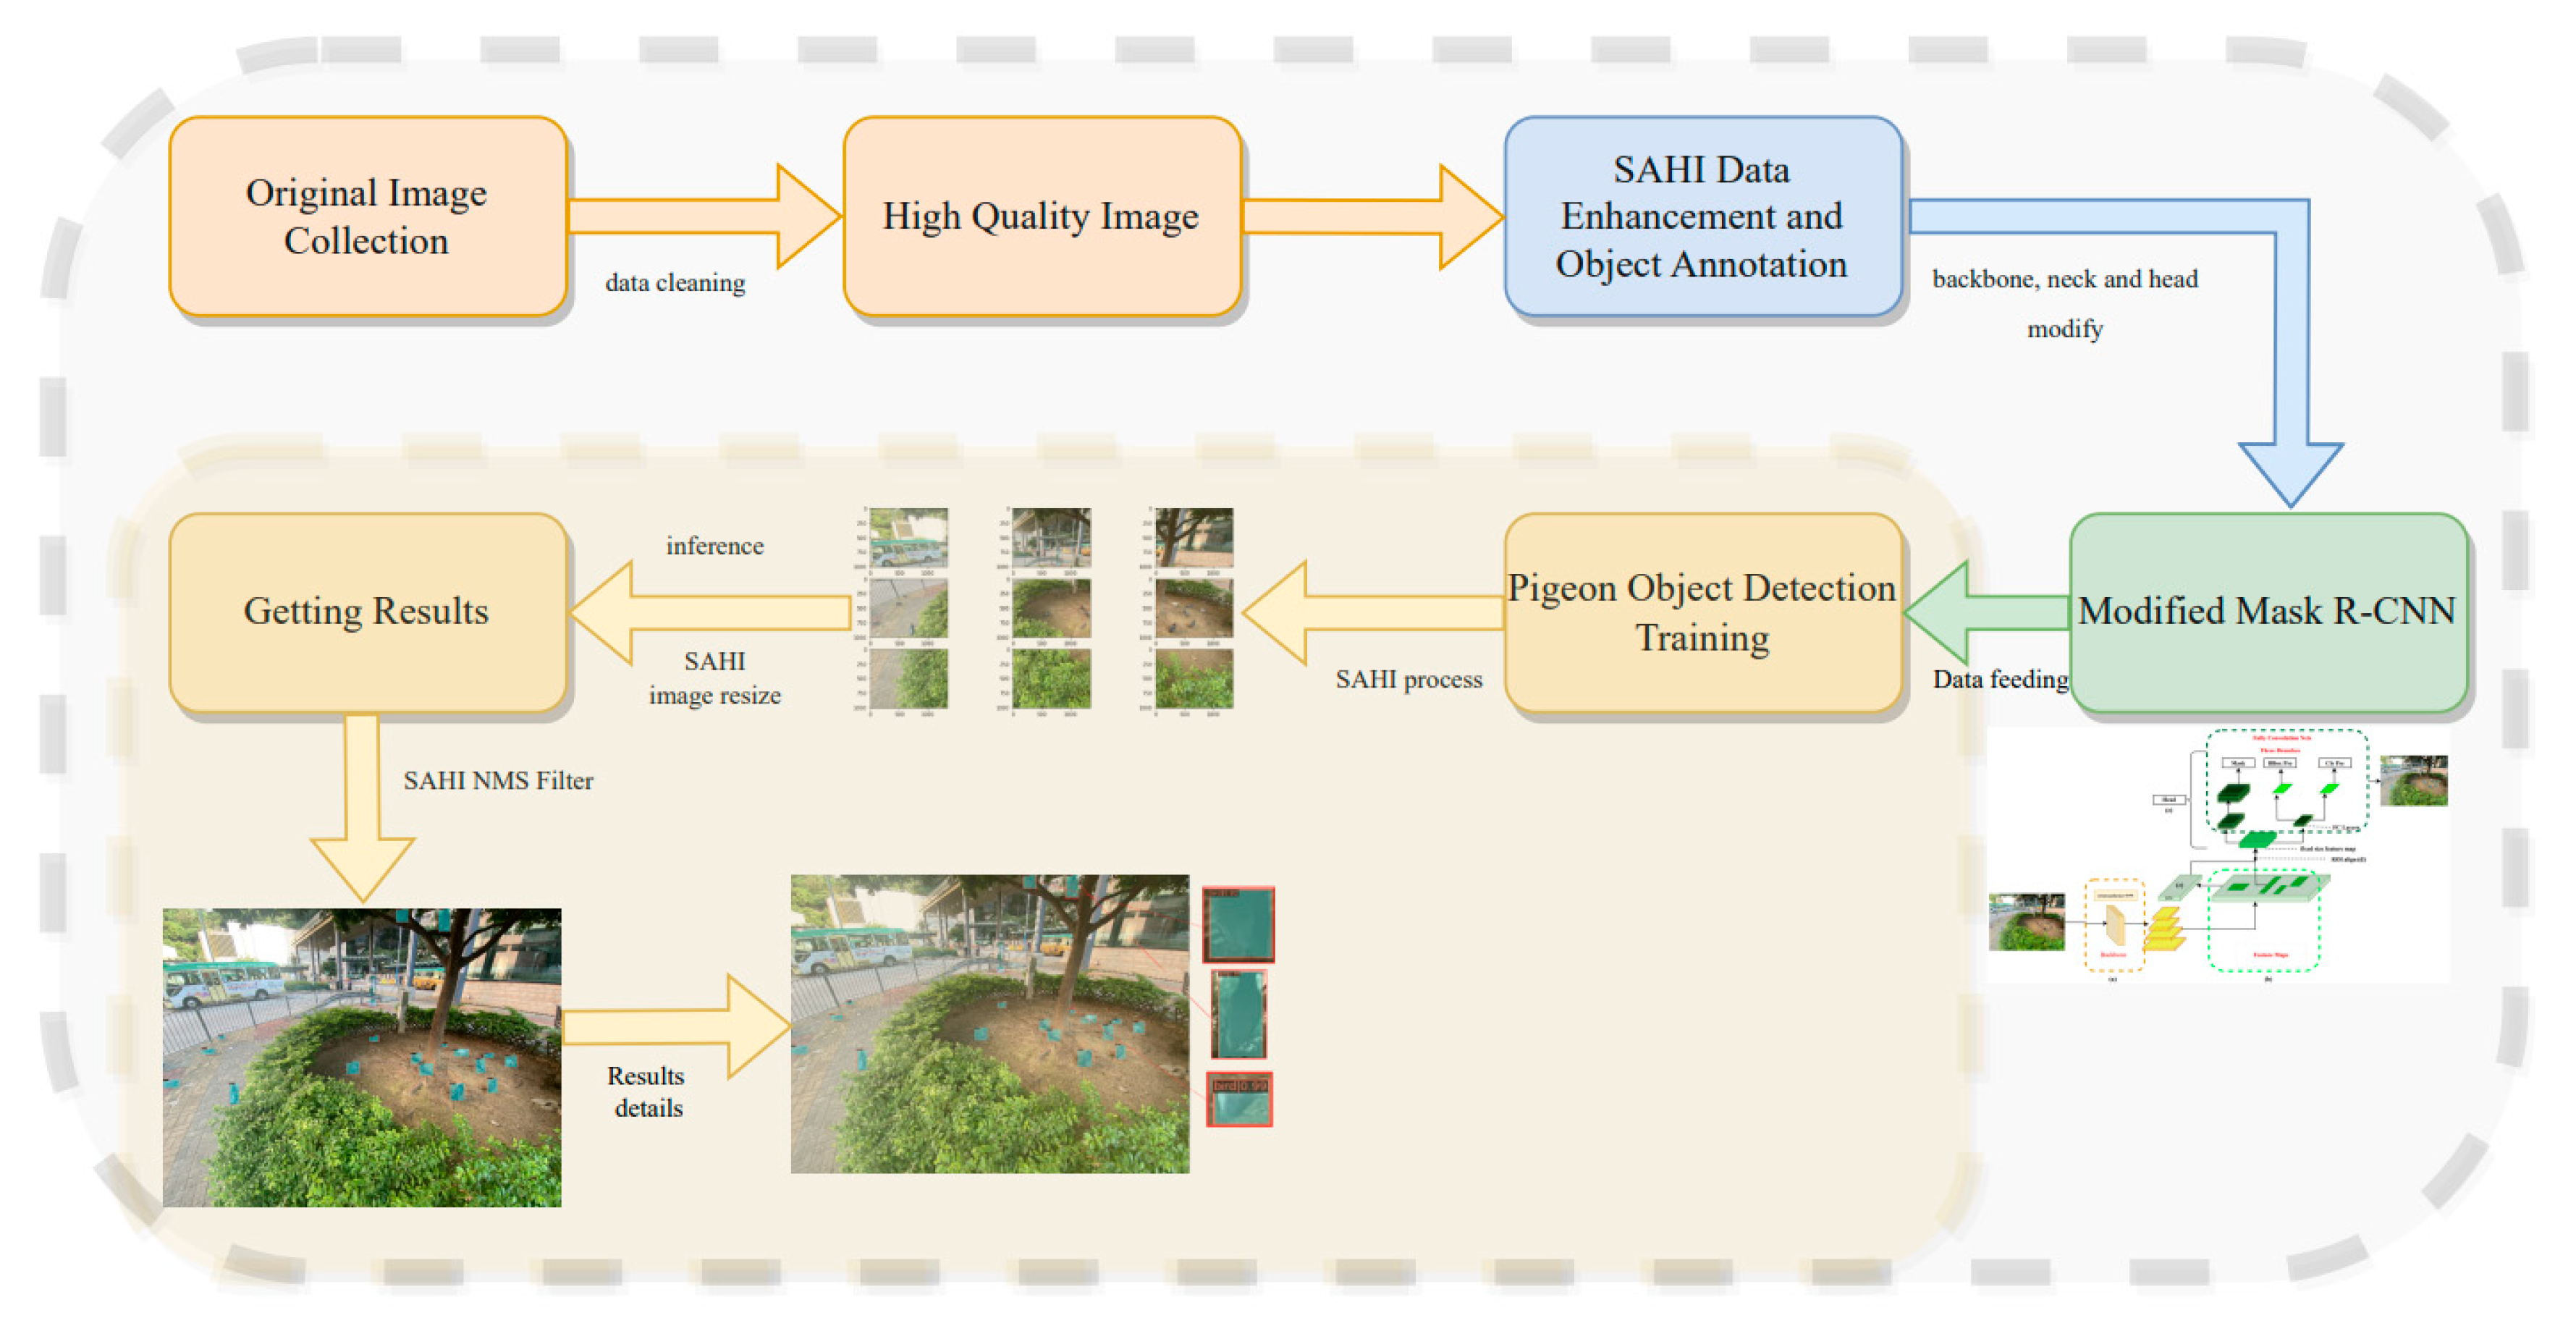
The overall workflow of our method is illustrated in Figure 3. The methods described in section 2.1 were used to construct the dataset in the model training stage. The dataset was then fed into a modified Mask R-CNN network, which was built using Swin Transformer as backbone, to train the model and achieve high accuracy. SAHI was used in the prediction stage to identify feral pigeons effectively, especially the small ones and these partially occluded or in shadowed areas. Here are the steps taken in this experiment for feral pigeon target detection.
We constructed an object detection model for feral pigeons using a modified Mask R-CNN network workflow (Figure 4). The model was trained with a dataset of annotated images in SAHI, which were cleaned and augmented to ensure high quality and diversity. After training the model, we extract high dimension features by SAHI tool to predict the feral pigeon targets in the prediction process, including the detection of small targets, partially occluded targets, and targets in shadowed areas. Meanwhile, the mask head is frozen to speed up the inference process. The output of the model includes prediction images, which display the predicted results and the position information of the target boxes. In the final process, to assess the effectiveness of the model, the mean average precision (mAP) is utilized as a metric for comparison with other models (i.e., YOLOv5-s, YOLOv5-m, Faster R-CNN, Mask R-CNN) and determine how well it performs in terms of accuracy and robustness. The detailed implementation of the above steps can be found in section 2.4. The flowchart can be referred to Figure 4.

2.4. Swin-Mask R-CNN with SAHI model

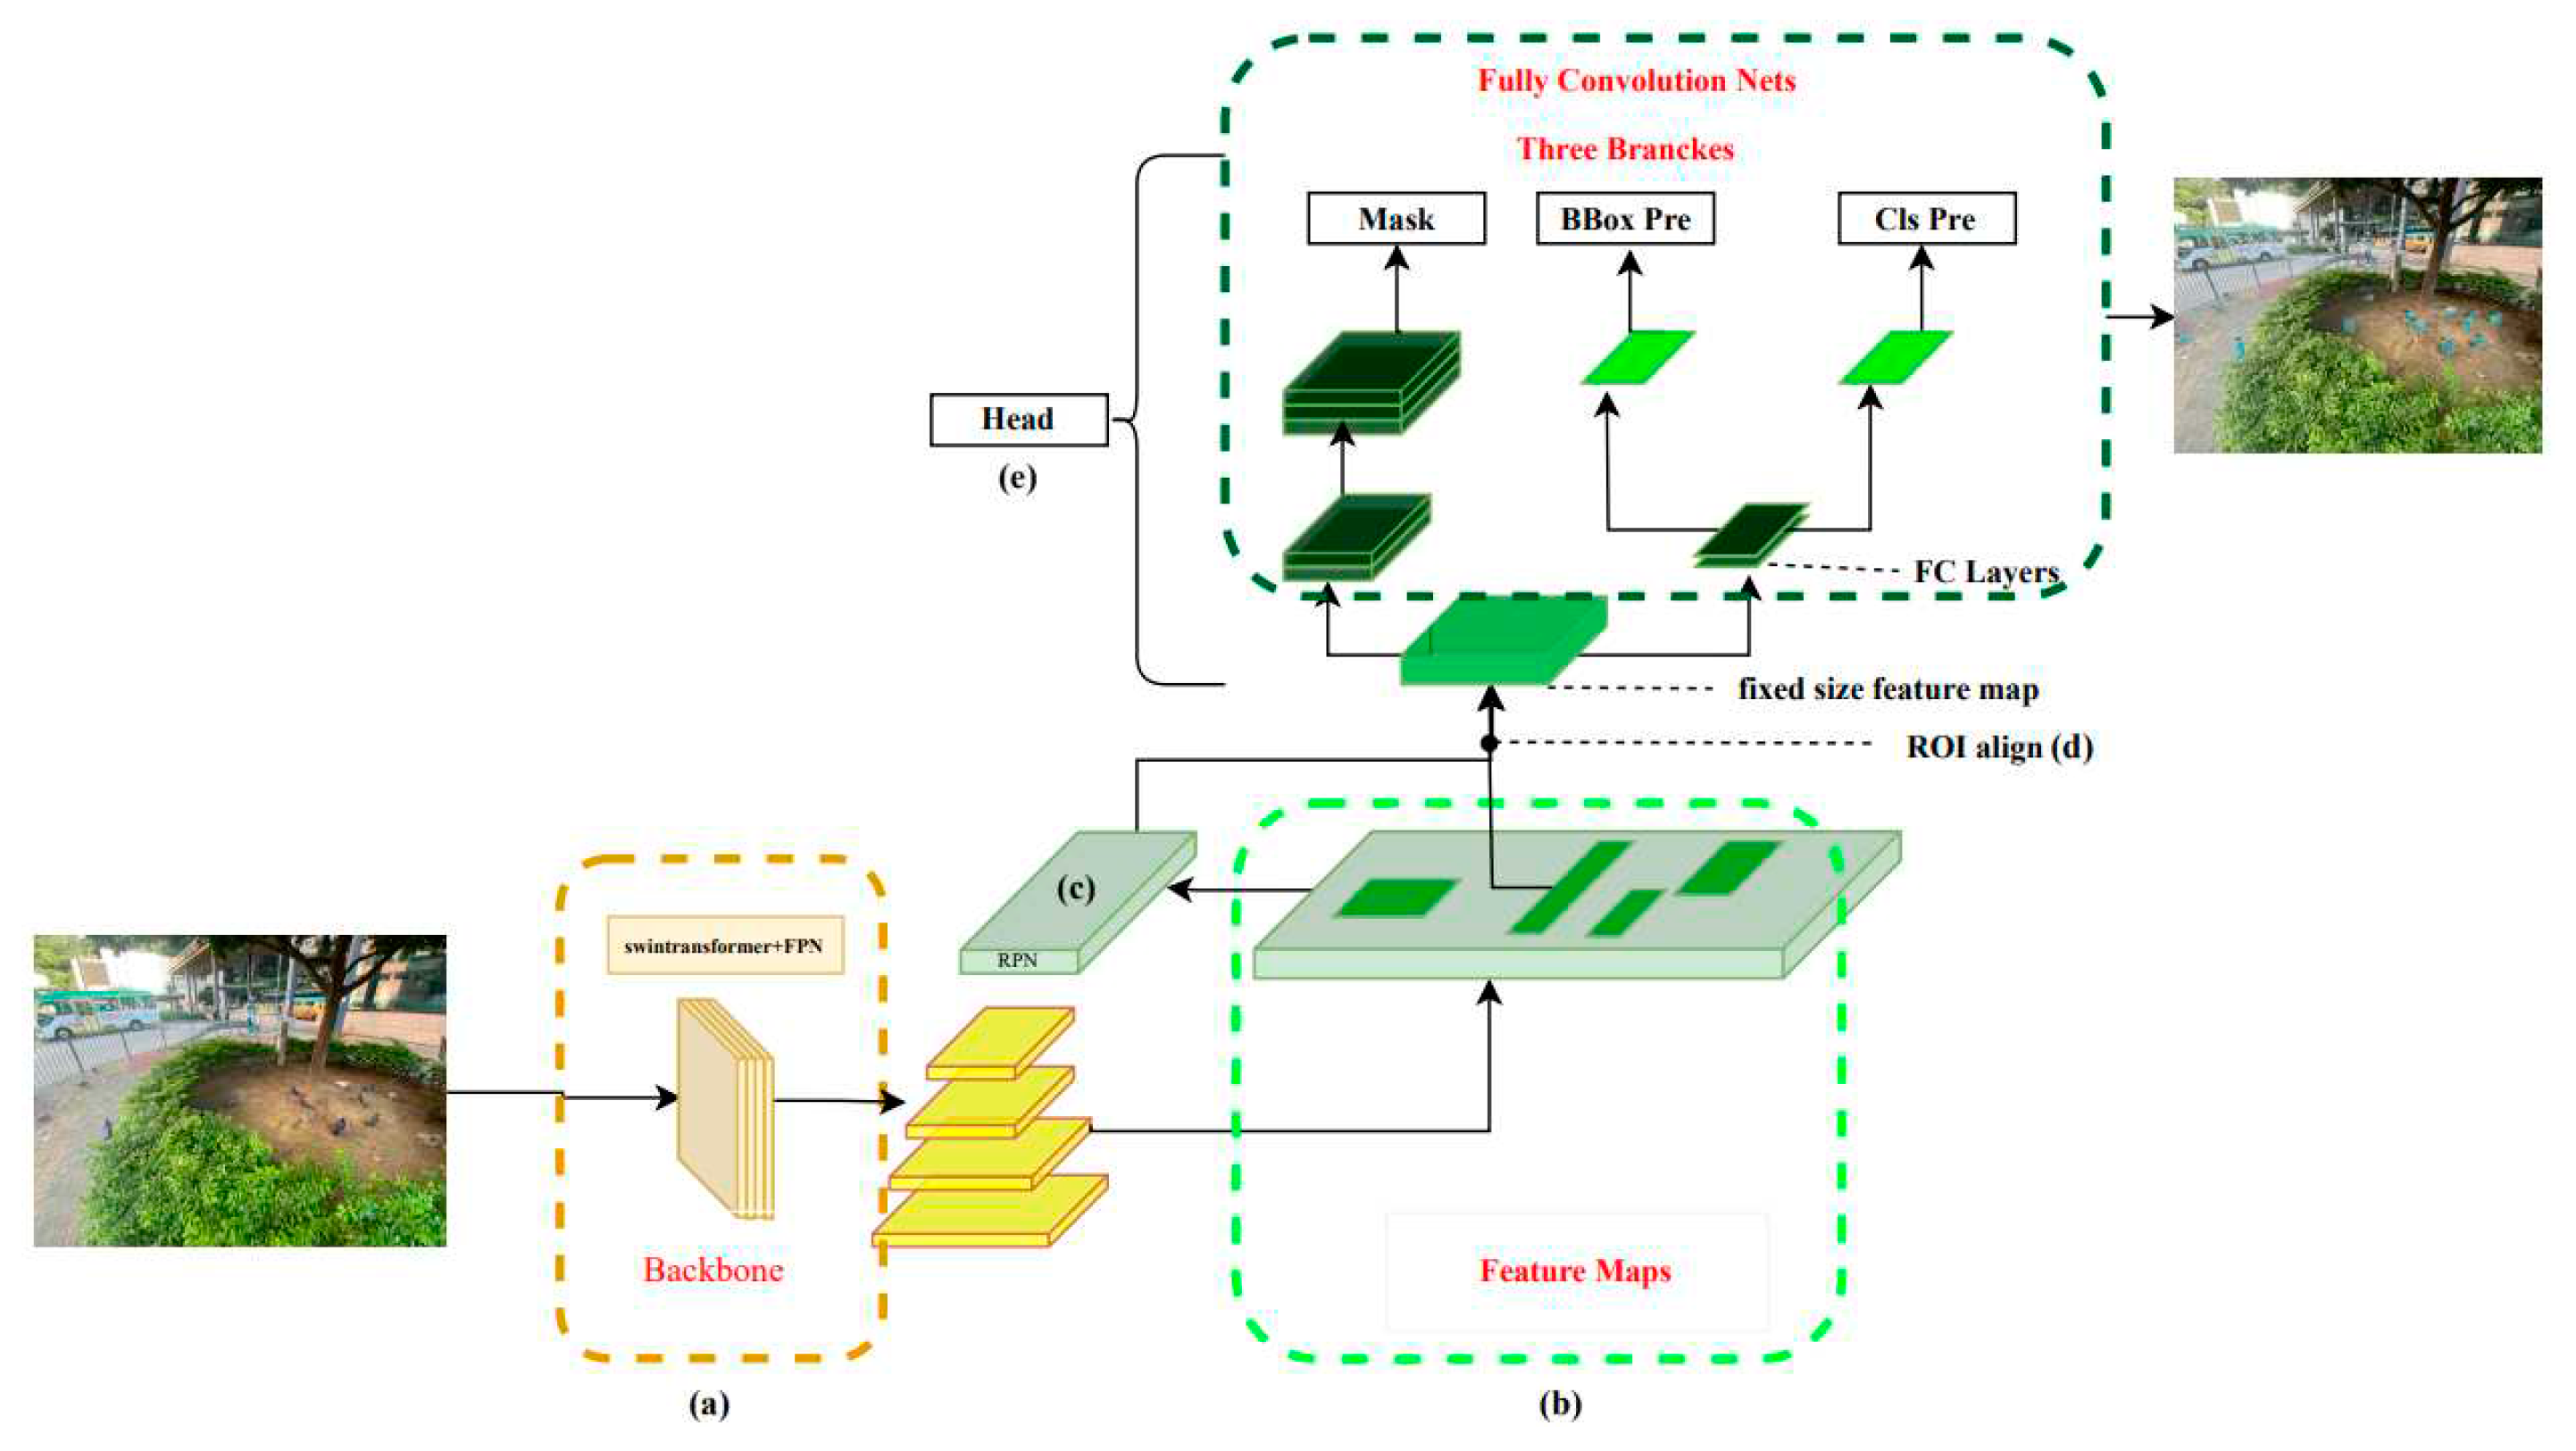
In this experiment, the images are large-sized images of 4032×3024 pixels, and most of the detected objects are small sized. Therefore, to fully extract the image detail features, the Swin Transformer was used as the backbone network, and FPN (a) was used as the improved version of the neck to construct a state-of-the-art modified Mask R-CNN (Figure 4).
In the first stage, the Swin transformer network is used to extract hierarchical multi-scale image information, and four stages are used to construct four scales of feature layers. Then, FPN is used to fuse large-scale low-level features and small-scale high-level features through upsampling and downsampling to obtain four scales of feature layers with richer information. The feature maps (b) are input to the RPN network (c) to generate candidate regions of different sizes, and the candidate boxes are preliminarily screened. In the second stage, RoI Align (d) is performed on the candidate regions generated in the previous step to extract fixed-size feature maps, and then classification, bounding box regression, and mask regression tasks are performed to obtain more accurate detection boxes in the head module (e).
Finally, in the Swin-Mask R-CNN with SAHI, the mask head is modified because the prediction stage only involves object detection tasks. We use conditional judgment to ignore the mask head sub-network and only output the two sub-networks of object classification and bounding box regression in the head to accelerate the process of generating images during object detection in the prediction stage.

2.5. Swin transformer Backbone

To construct a multi-scale hierarchical structure for pigeon detection, the Swin transformer modifies the image dimensions using different operation combinations at various stages. First, 4032×3024 RGB images are batched as input to the network, and the images are divided into patches with a patch size of 4×4. In Figure 5, the patch partition module then partitions the input images into small regions to expand the network's receptive field and enhance its feature representation capabilities. The image's height (H) and width (W) are reduced to a quarter of their original size, while the number of channels is set to 48, resulting in image dimensions of 1,008×756×48. Next, in Stage 1, a Linear Embedding operation is applied to change the vector dimensions to a pre-set value of C=96. The current H and W dimensions are flattened and stored as a linear dimension, with a sequence length of 762,048. Since this sequence length is too long, a window-based self-attention computation is used in the Swin transformer block to reduce the sequence length, effectively reducing the complexity of training, and resulting in image dimensions of 1,008×756×96. Following this, in Stage 2, the patch merging method is employed to combine adjacent small patches into larger patches, achieving a similar effect to convolution and providing a downsampling effect for the basic patches. After passing through the Swin transformer block, the final image dimensions are changed to 504×378×192. In Stages 3 and 4, the Patch Merging and Swin transformer block operations from Stage 2 are repeated, further reducing the image dimensions to 252×189×384 and 126×94×768, respectively. Lastly, the image information from the final three channels will be further utilized in the subsequent Feature Pyramid Network (FPN).
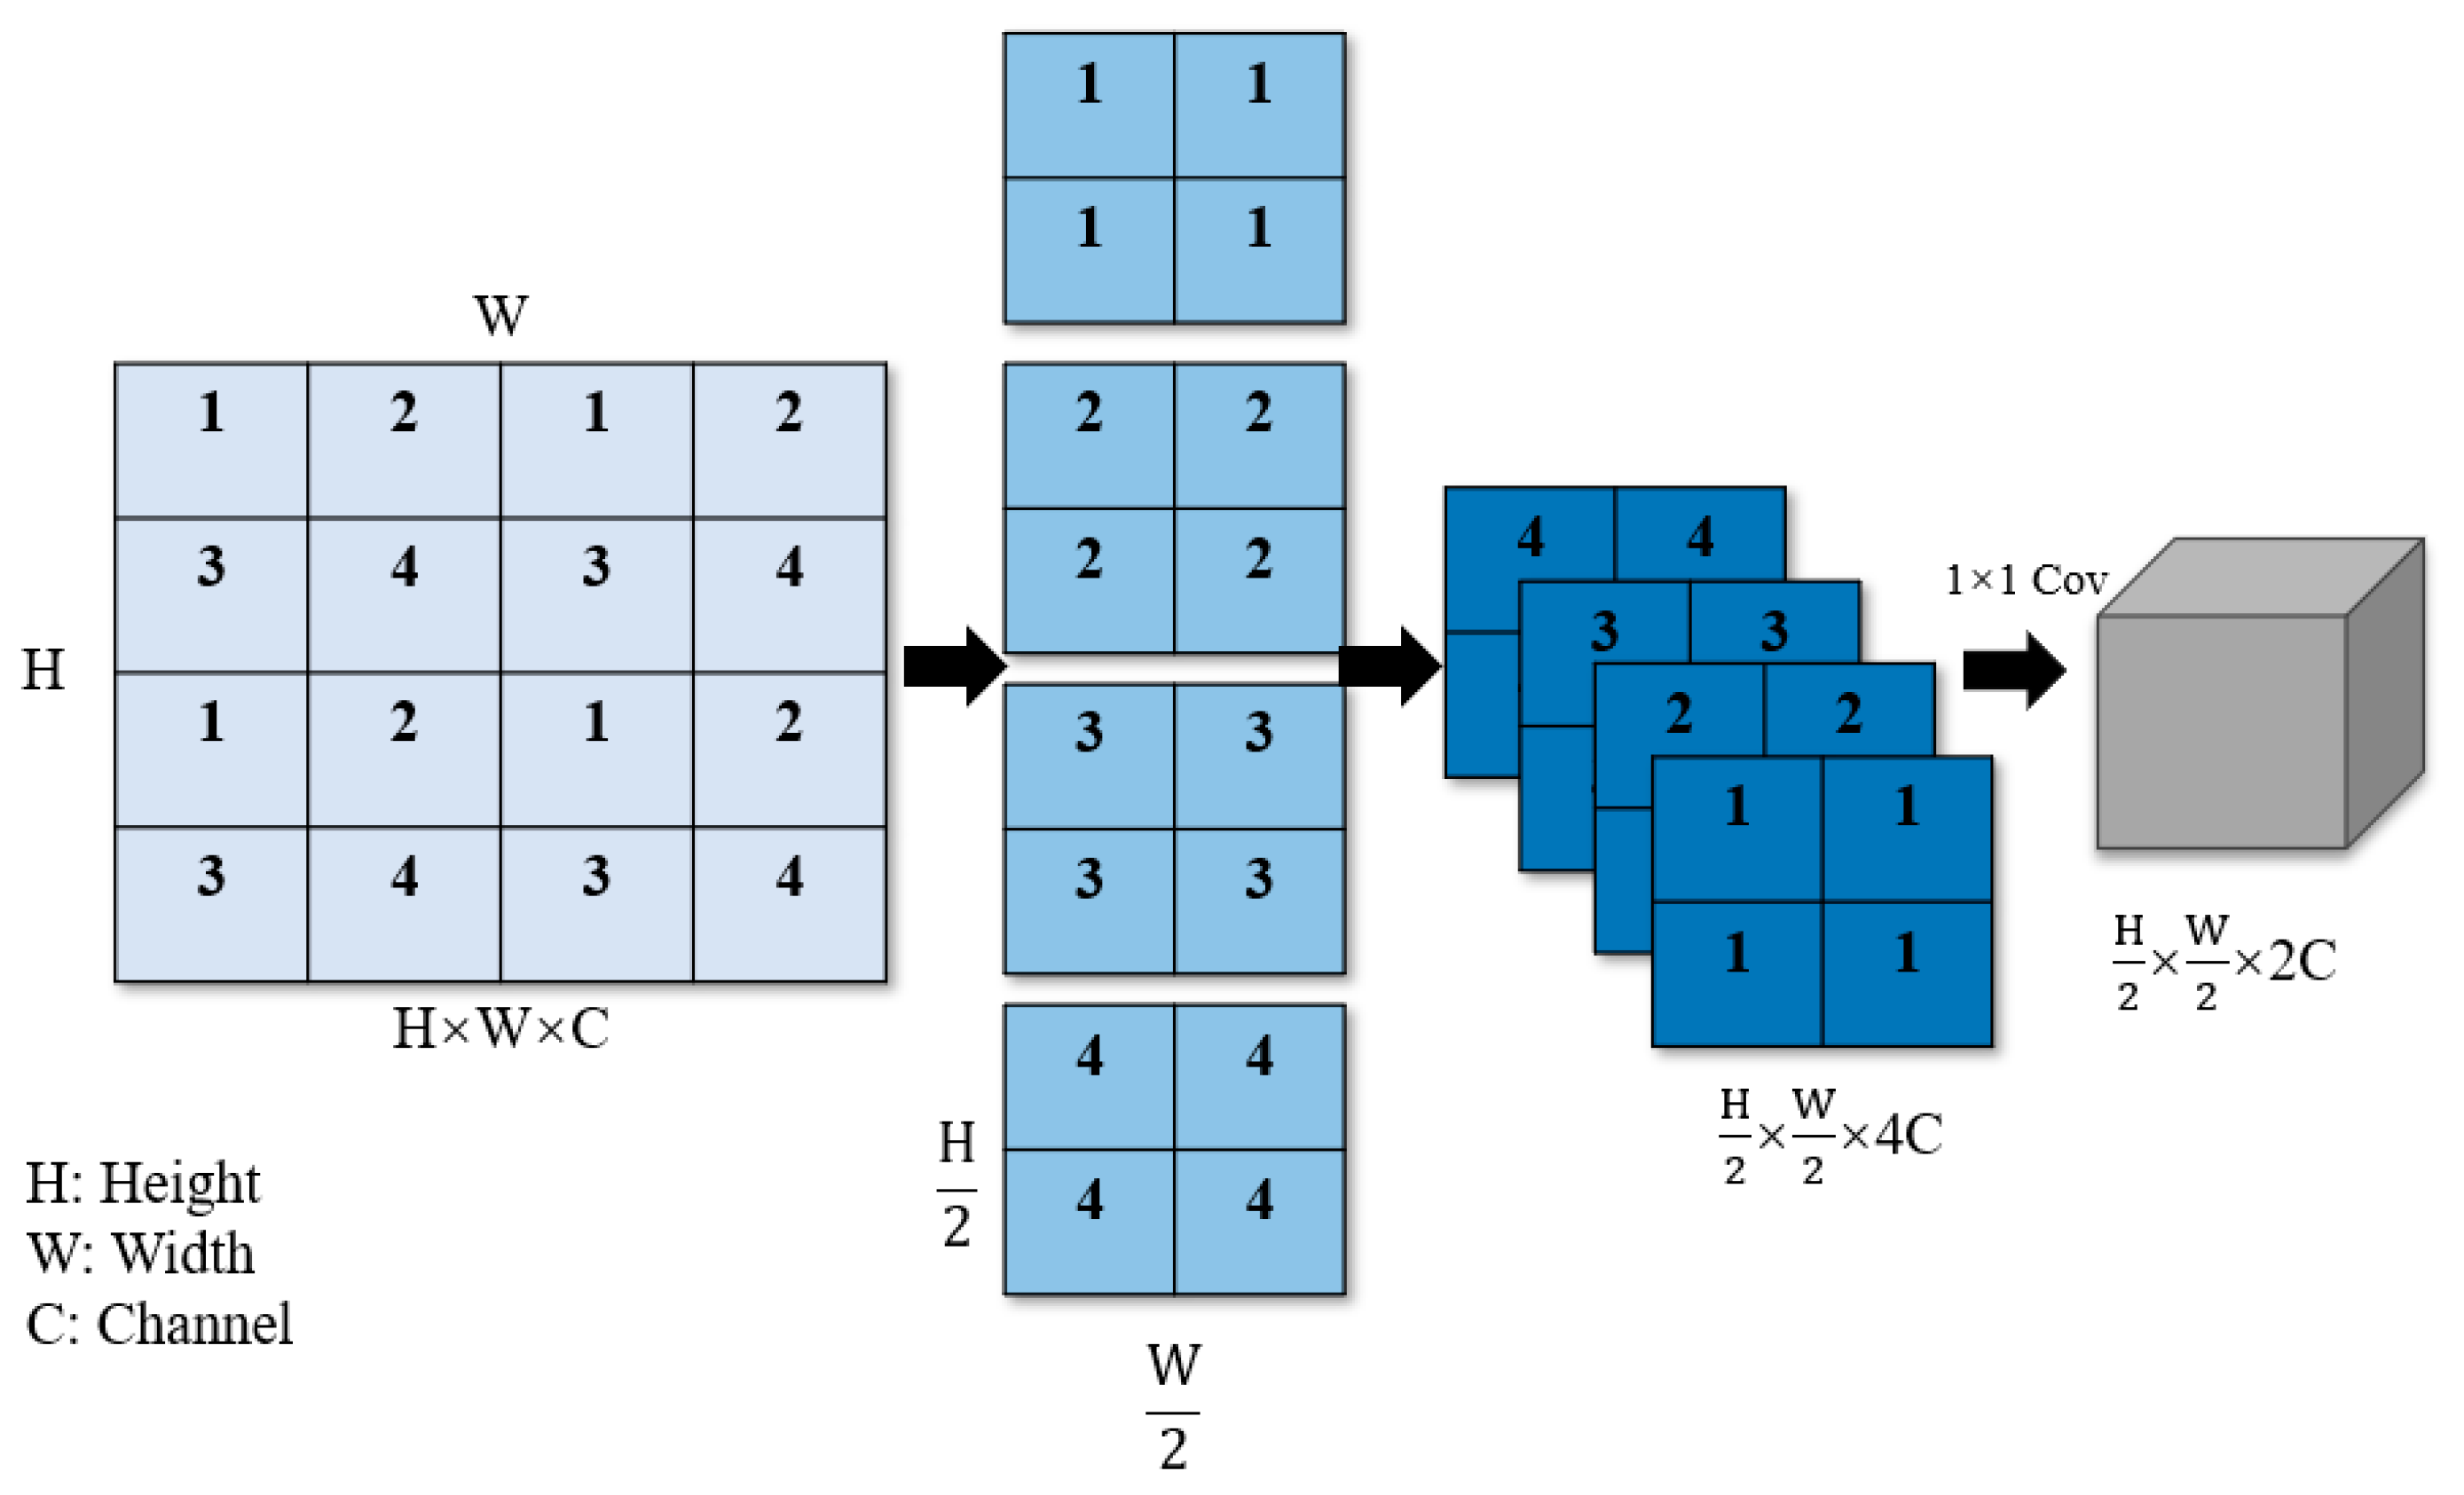
The patch merging operation, similar to the pooling operation in convolutional neural networks, gradually extracts higher-level abstract features from the original pixel-level features, thereby improving the performance of object detection and classification tasks. In Figure 6, downsampling by a factor of two is first performed, and each basic patch labeled with the numbers 1, 2, 3, and 4 is combined. By performing stride sampling for points with the same index, basic patches with the same label are merged into a larger patch, which helps to construct multi-scale representations and simultaneously increases the network's receptive field. This operation reduces the image's height and width dimensions by half. Subsequently, the downsampled image information is concatenated in the channel dimension, resulting in a fourfold increase in the number of channels (C). To achieve the effect of doubling C as in the dimensionality reduction methods used in convolutional neural networks, a 1×1 convolution is employed to change the number of channels to 2c. Through these steps, the spatial dimensions of the image width (W) and height (H) are reduced by half, while C is doubled.

2.6. Feature Pyramid Network (FPN)

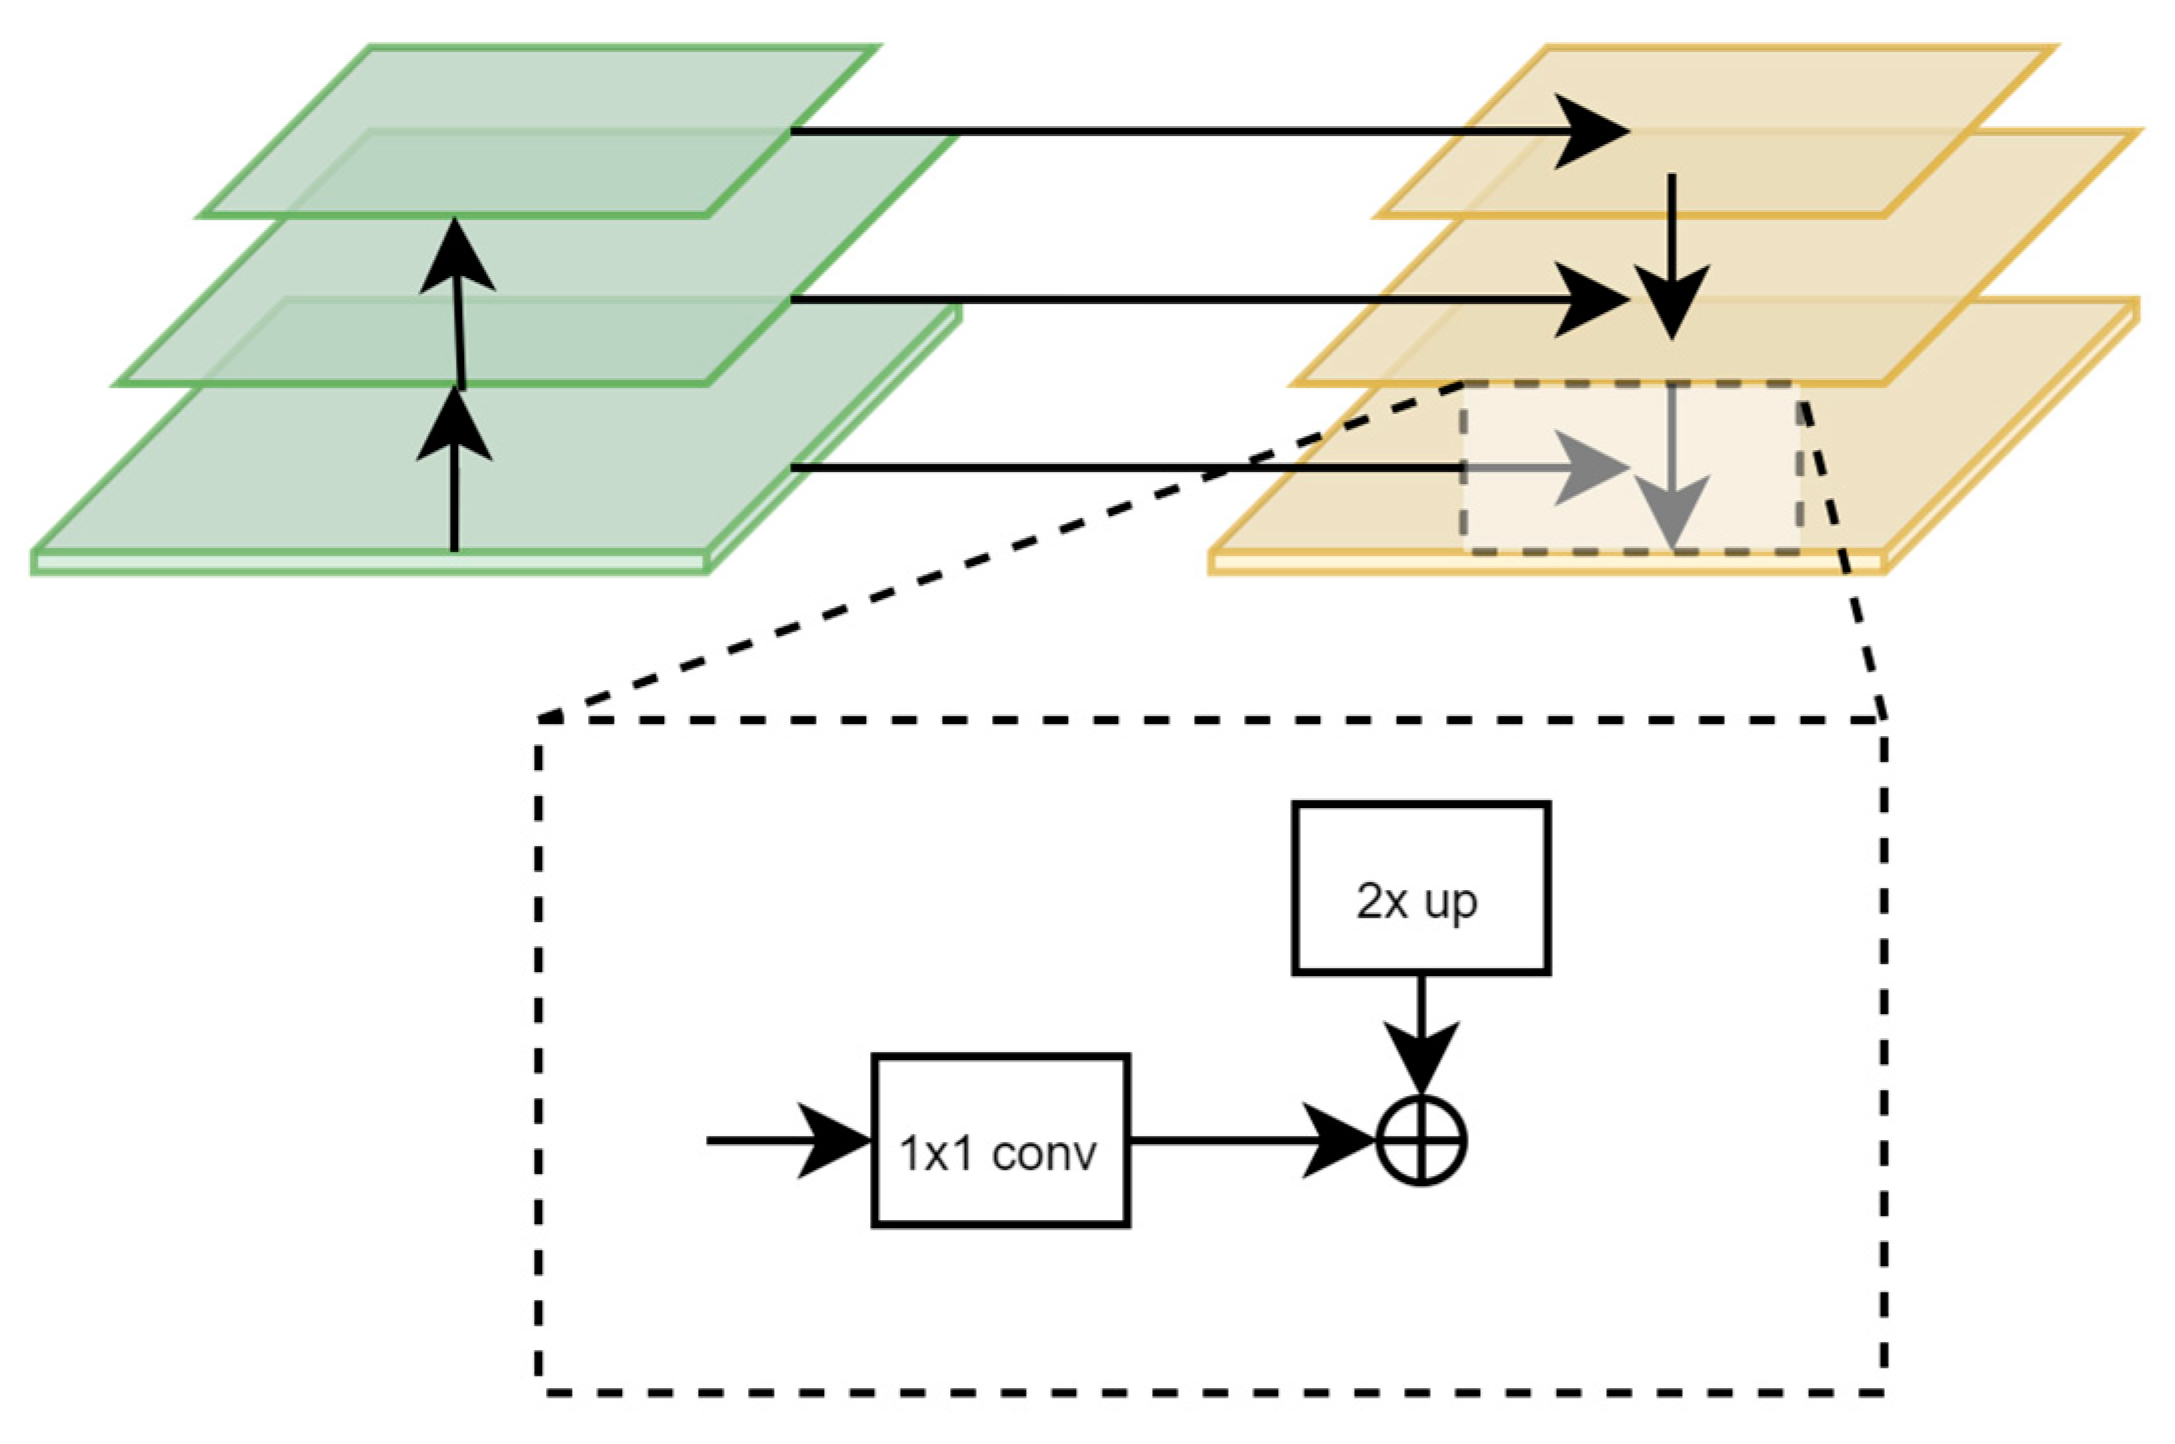
FPN is a robust object detection strategy that merges multi-scale features to handle varying object sizes in images, compared to conventional methods. It includes two modules: a down-to-top feature pyramid construction and a top-to-down feature fusion, producing a high-resolution feature map rich in deep semantic information.
In Figure 7, the first module constructs a feature pyramid in a down-to-top manner, grouping feature maps of the same size into stages during the image’s forward propagation through the Swin transformer backbone network. This process involves convolution, pooling, and activation operations, with the feature map size decreasing from bottom to top. In the second module, the top-to-down feature fusion, the small-scale feature maps containing deeper semantic information are upsampled following the creation of a feature pyramid with decreasing scales in the backbone network. These are then concatenated with the corresponding size feature map from the previous stage, resulting in a high-resolution feature map containing profound semantic information.

2.7. Slicing Aided Hyper(SAHI) tool

The predictive approach of Swin Mask R-CNN paired with SAHI is designed to mitigate pixel information loss for feral pigeons, all without requiring additional training. In the conducted experiment, we utilized the SAHI method, specifically utilized for small-target feral pigeon detection, to enhance the accuracy of identifying small objects.
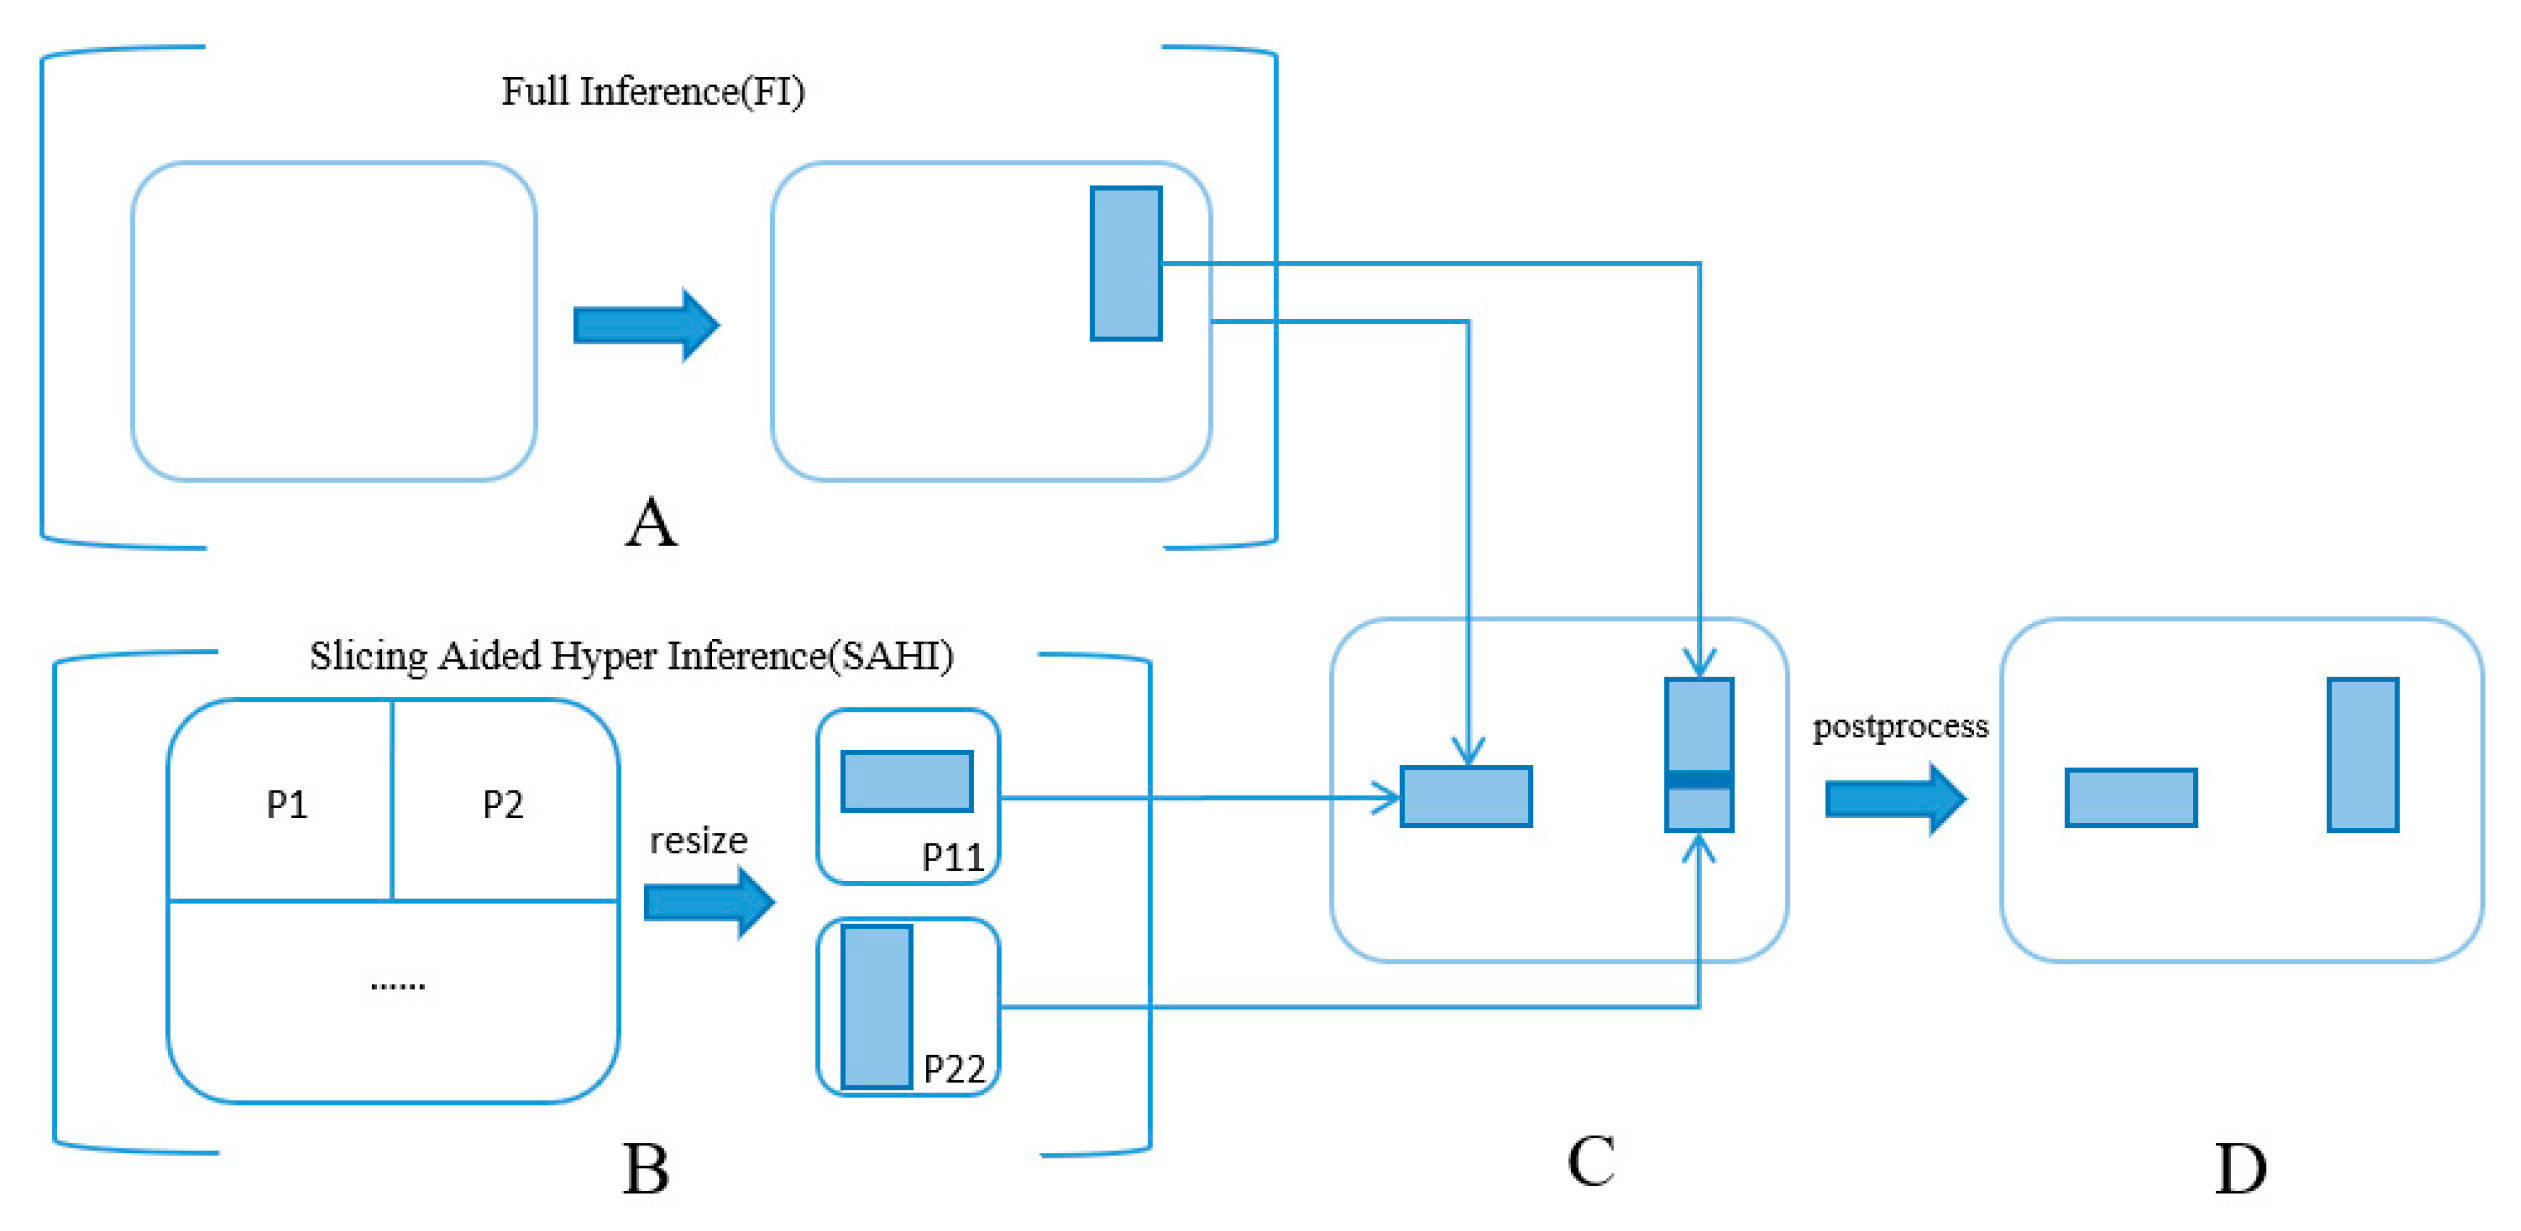
In Figure 8, part A presents a direct full inference from the original image. Meanwhile, part B illustrates a process where the original image is divided into nine sub-images. These resulting patches are resized to match the original dimension of 4032×3024 pixels, and subsequently fed individually into the Swin-Mask R-CNN model for independent inference. Upon completing a batch of ten images, the detection boxes for each image are computed. The original image serves to identify larger objects, while the nine sub-images assist in enhancing the detection of smaller objects. In part C, all the processed bounding boxes are consolidated. Overlapping predicted targets are managed using Non-Maximum Suppression (NMS). Specifically, for small and densely packed feral pigeon targets, overlapping boxes often represent different parts of the same target. When the Intersection over Union (IoU) value surpasses a pre-set threshold, the box with the highest confidence score is chosen as the result. Boxes with detection scores falling below the threshold are discarded, thereby refining the detection accuracy. Finally, the remaining bounding boxes, representing the detection results for feral pigeons, are illustrated in part D of Figure 9.

3. Results

3.1. Experimental settings and model evaluation indicators

To allow the model to achieve sufficient fitting, the model was trained for 200 epochs. The AdamW optimizer was used, and the learning rate was 0.0001. At the same time, the step adjustment strategy was used, and a linear strategy was used for the learning rate warm-up, with a weight deviation of 0.05. We used a GPU for model training and set the batch size to 16. The parameters remained the same for the other models used for comparison. All experiments were conducted on Ubuntu 18.04, and the hardware parameter settings for training, testing, and prediction are shown in Table 2.
Metrics including mean Average Precision (mAP), AP50, AP50s, and AP50s were used to evaluate the model's performance. mAP is the average precision score of the model on all categories and is a comprehensive evaluation metric. AP50 is the average precision score when the Intersection over Union (IoU) is greater than or equal to 0.50 and is an evaluation metric for larger targets. AP50s is the average precision score when the IoU is greater than or equal to 0.50 for small targets (areas less than or equal to 32×32 pixels).

3.2. mAP comparison of different model

Our methodology is evaluated in comparison with one-stage and two-stage object detection algorithms under identical experimental conditions. We selected two versions of YOLOv5, Faster R-CNN, and Mask R-CNN for performing comparative experiments. In this context, model parameters, mAP, AP50, and AP50s served as the evaluation metrics.
As Table 3 indicates, the two-stage series network, represented by Faster R-CNN and Mask R-CNN, outperformed the one-stage series network (YOLOv5) by achieving a mAP above 50%. Furthermore, by employing Swin Transformer and FPN as the core network within Mask R-CNN to learn more intricate information, the detection accuracy reached a new benchmark with a mAP of 0.68.
Remarkably, the modified Mask R-CNN model's capacity for small target recognition was also significantly enhanced, achieving an AP50s of 0.57. This improvement can be attributed to the effective integration of Swin Transformer and FPN, which facilitates better interaction of information from each feature layer, thereby enabling more precise global and local recognition. In conclusion, the use of Swin Transformer and FPN as the backbone of Mask R-CNN within a two-stage network aligns with the ability to boost detection accuracy, particularly in regard to small target detection.
To further verify that the effectiveness of SAHI tools can improve the accuracy of small target detection, we incorporated them into all previously mentioned models during inference. The final row in Table 4 indicates that our proposed SAHI, when used in conjunction with Swin Transformer and FPN as the backbone network, yields the most substantial improvement in small target recognition, achieving an AP50s of 0.66. This surpasses all other models combined with SAHI.
When SAHI is added to YOLOv5-s, YOLOv5-m, Faster R-CNN, and Mask R-CNN, there is a notable increase in the mAP, with scores of 0.51, 0.56, 0.60, and 0.62, respectively. In conclusion, the SAHI tool, by optimizing model recognition outcomes through a greater focus on image details while preserving original results, can improve the detection capability of all models involved in the experiment.

3.3. Results visualization

From the above series of experiments, it is evident that our proposed method greatly outperforms other methods in terms of accuracy. Subsequently, in this section, we present the image results obtained from our model's inference in comparison to other models and demonstrate our model's robustness against interference and its proficient recognition ability under density targets of various posture feral pigeons.
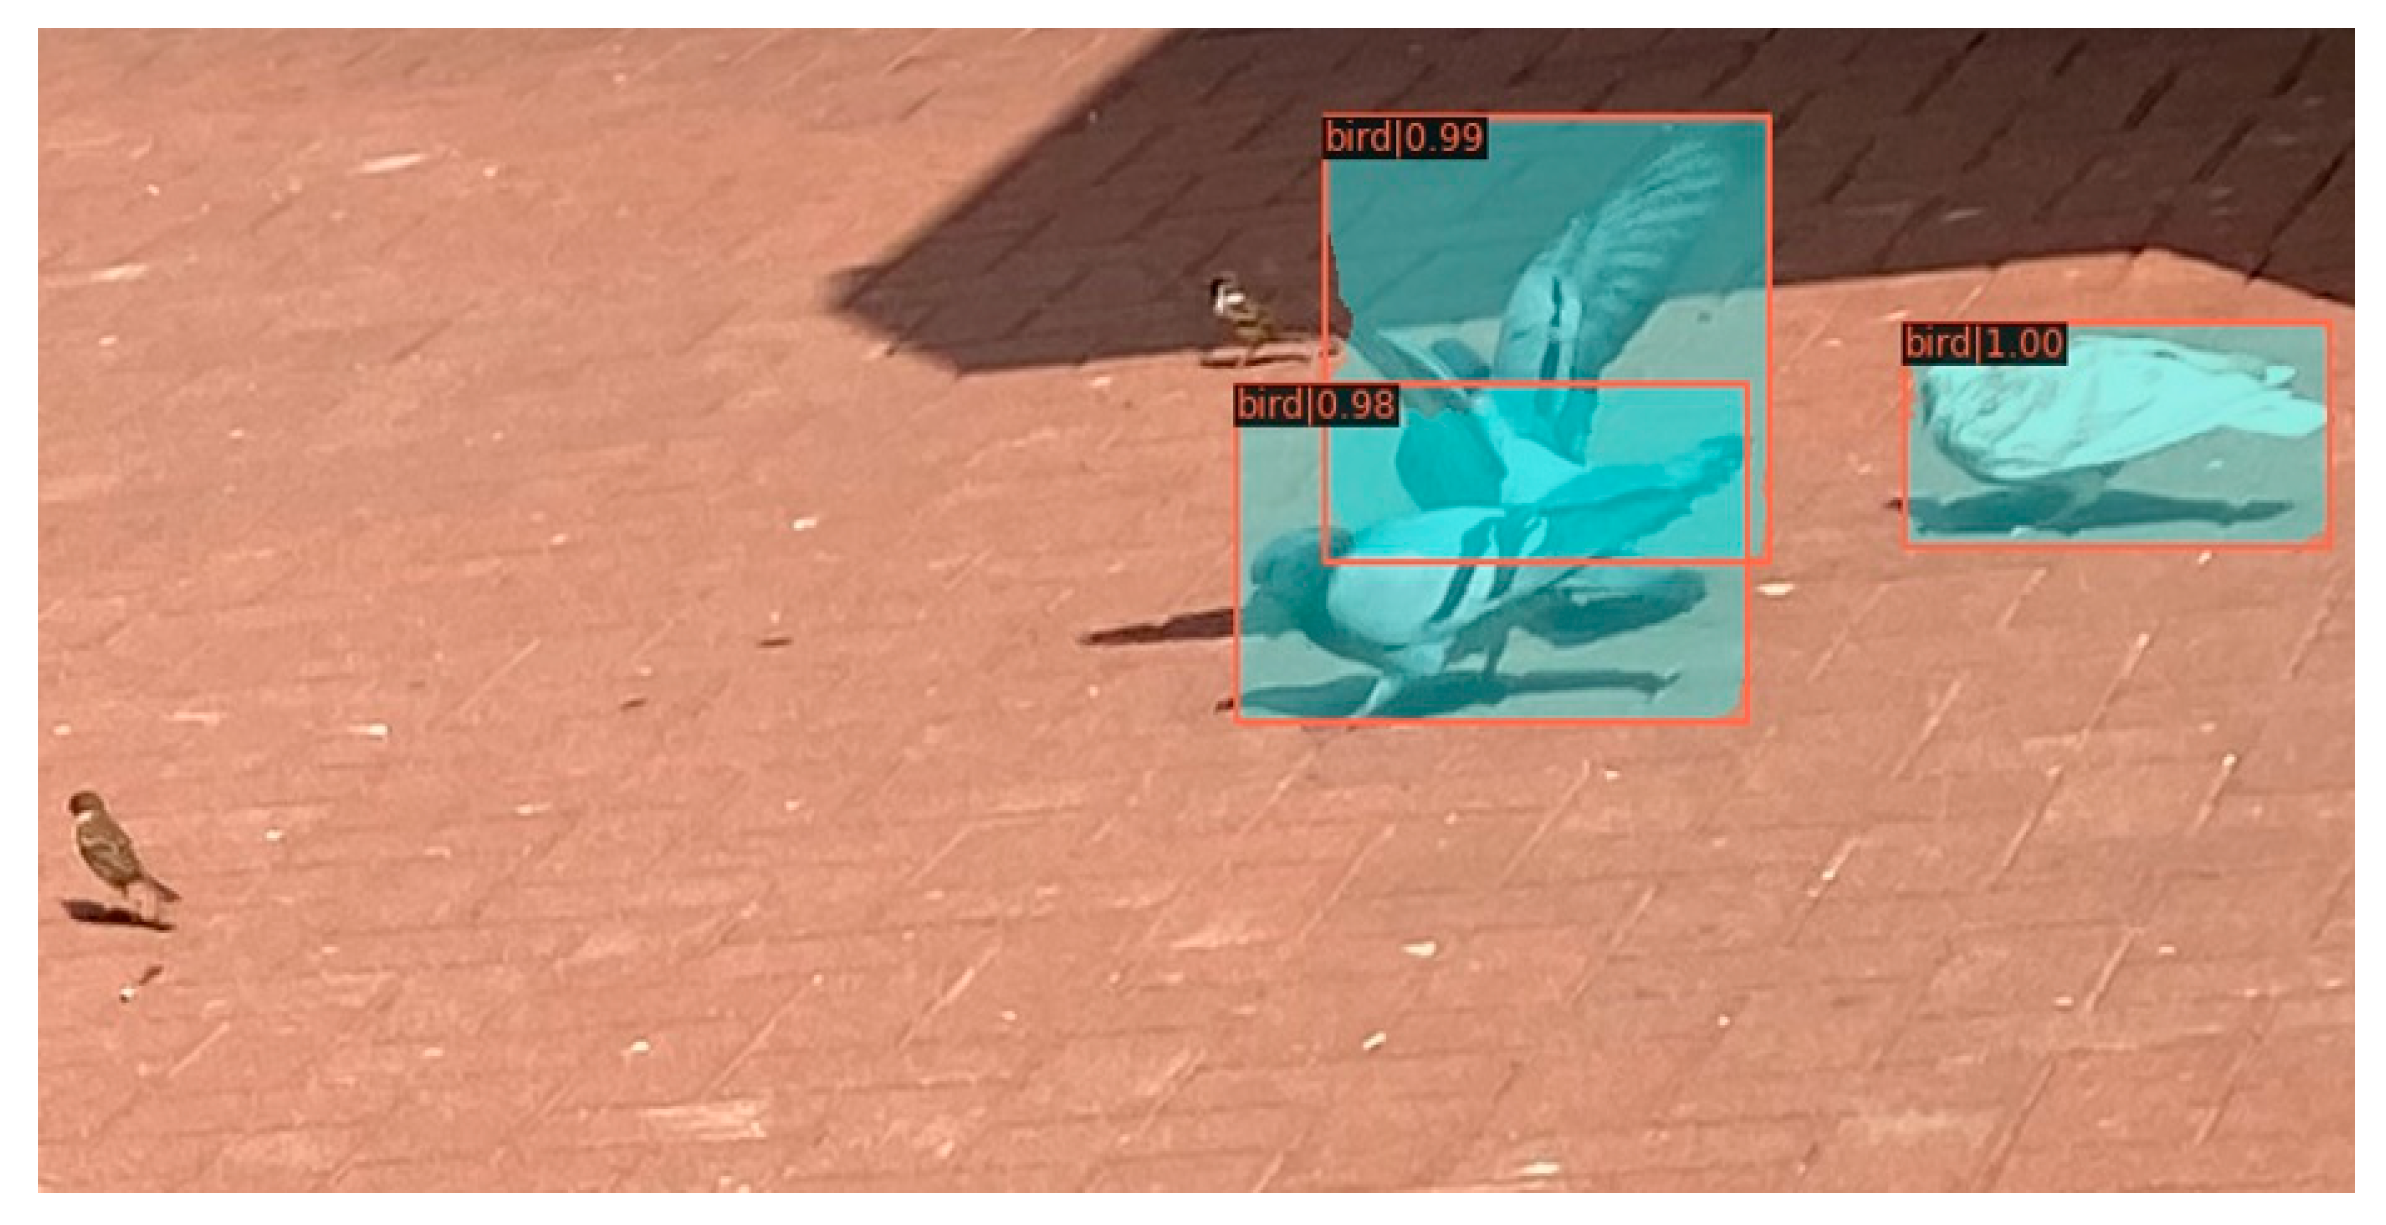
In urban environments, feral pigeons are often found with sparrows. Consequently, it is crucial for the model to accurately distinguish between these species and effectively eliminate sparrow interference for accurate identification. As depicted in Figure 9, our model successfully discriminates between feral pigeons and sparrows, thereby preventing erroneous detections of sparrows.
Figure 9. Results for predicting feral pigeon.
Preprints 90113 g009
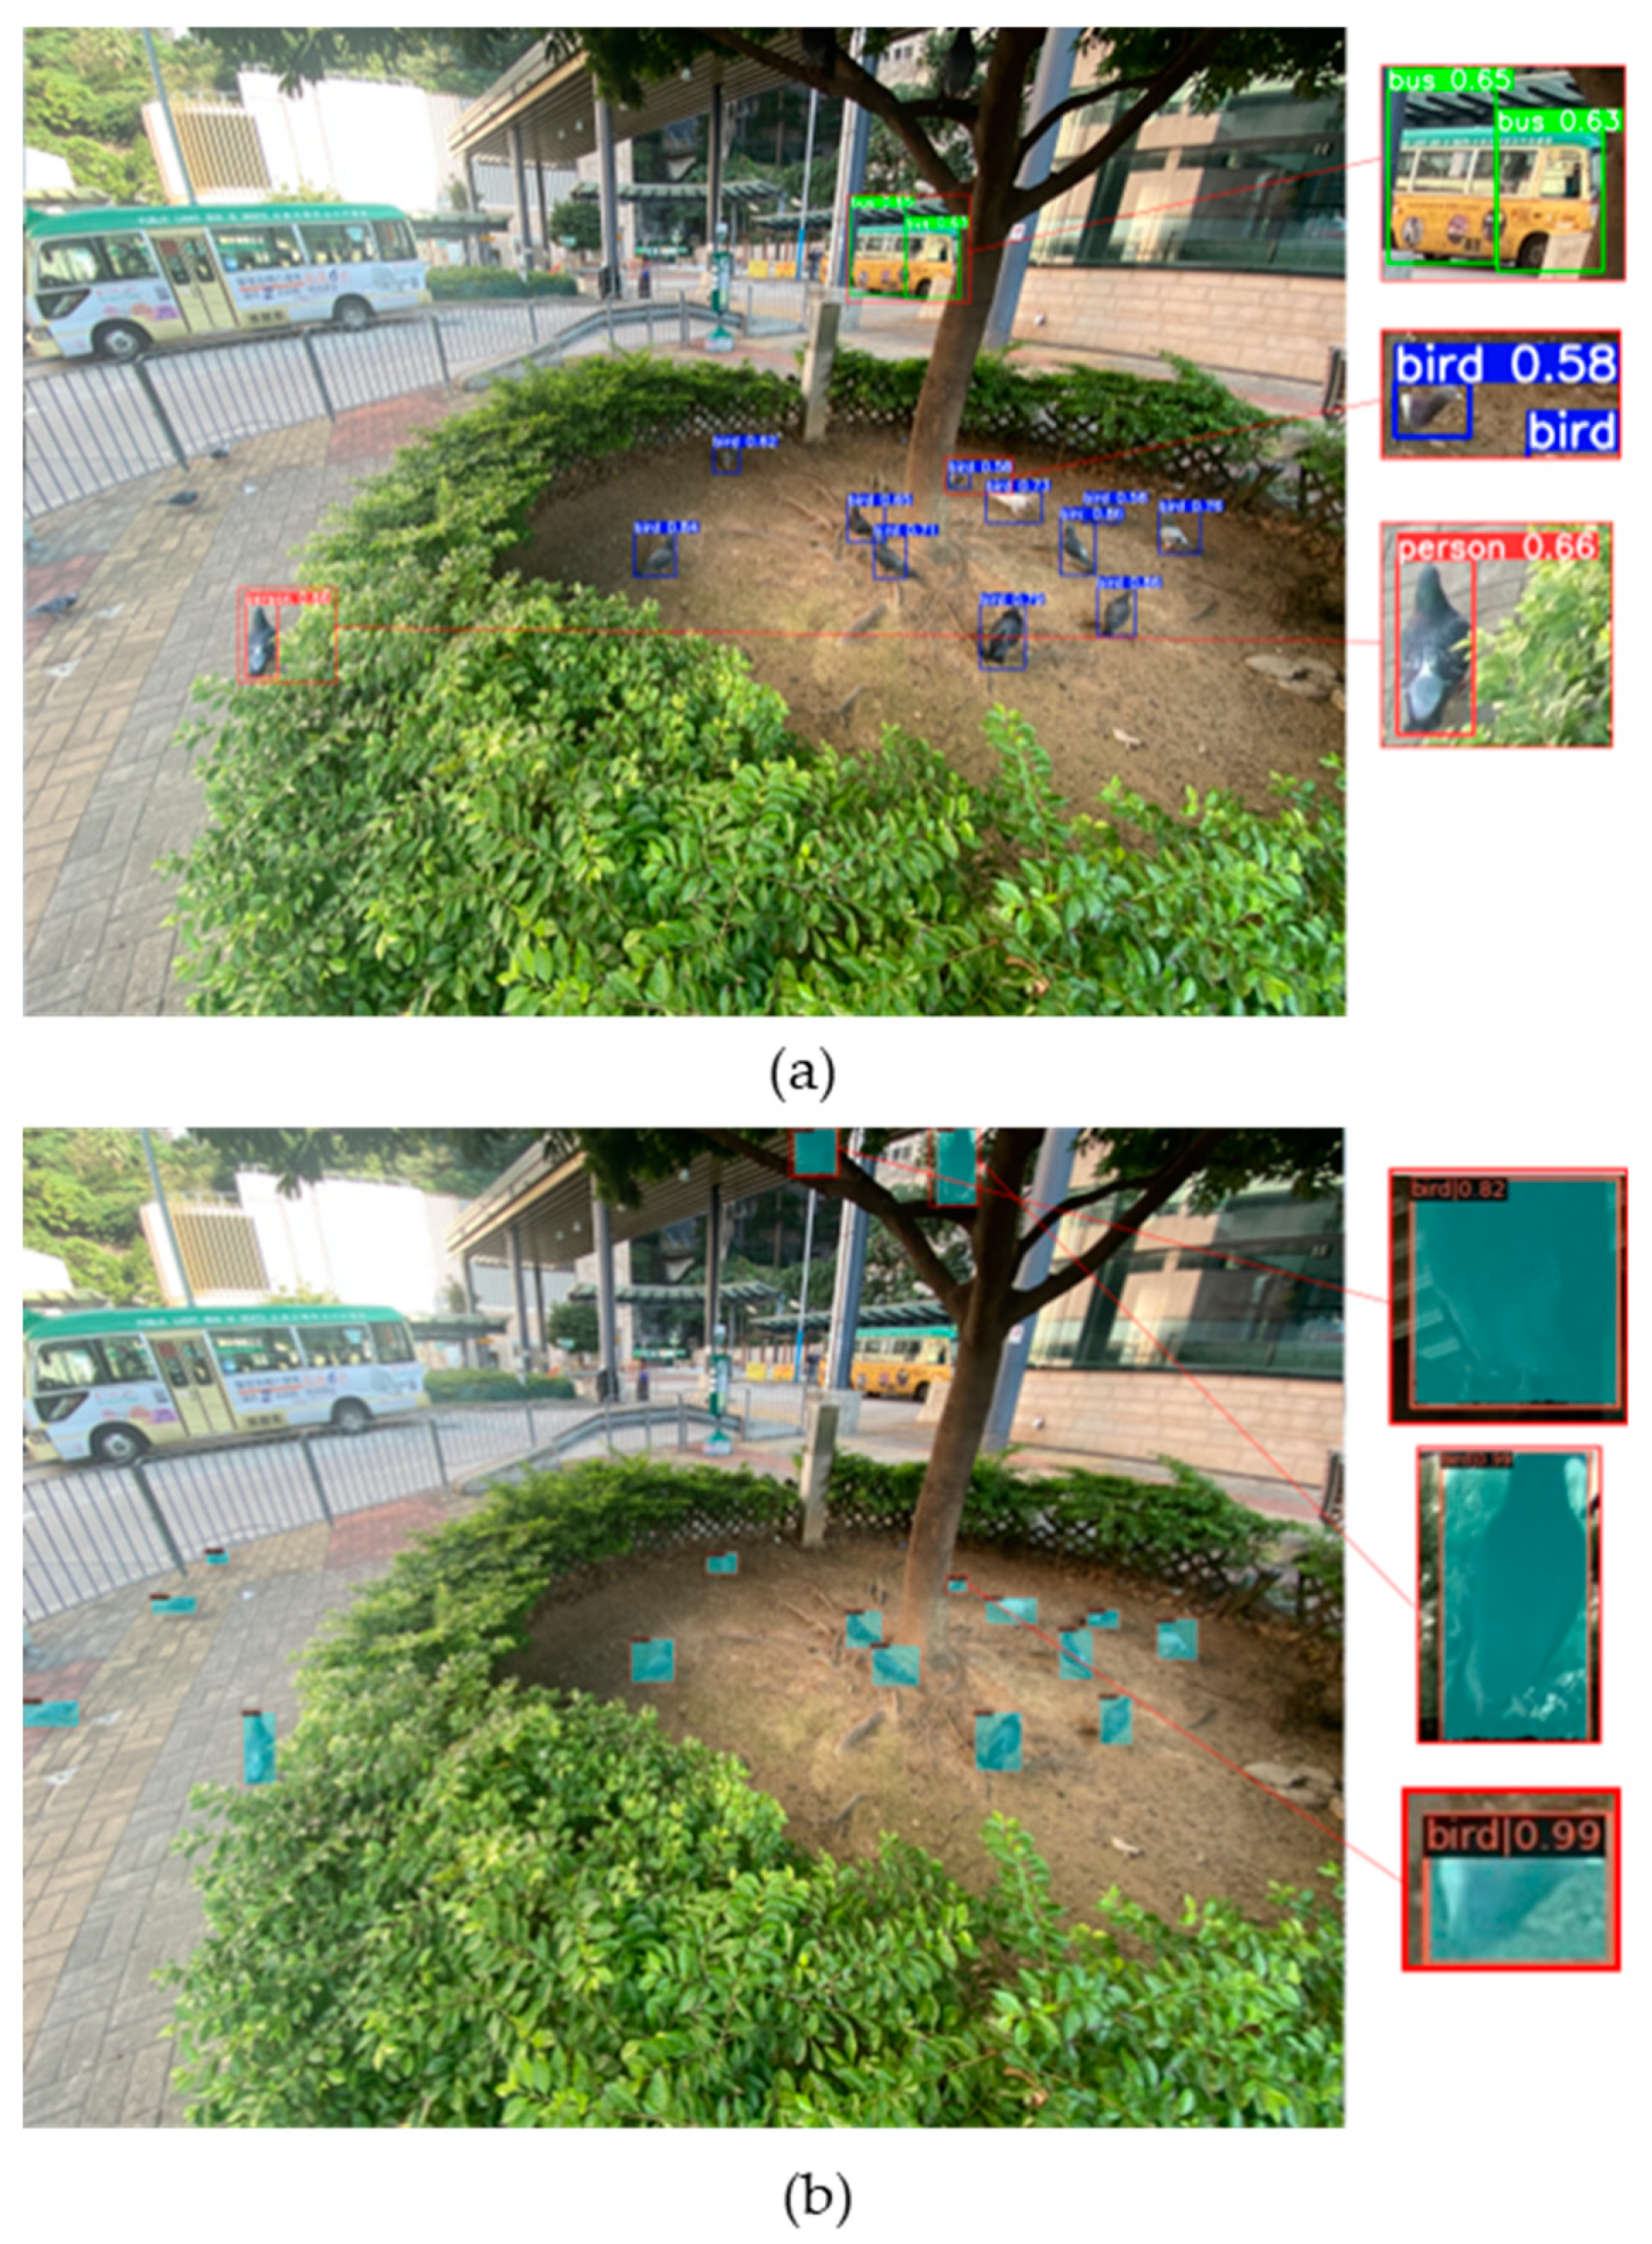
Figure 10 (a) shows the result of using YOLOv5-s pre-trained weights with the COCO80 classes for image inference and feral pigeon detection without fine-tuning. Besides predicting other classes such as buses, we can see that the model also incorrectly predicted the feral pigeon as a person category. Moreover, for the pigeon prediction, the model only had low confidence in predicting the selected object as a feral pigeon. Figure 10 (b) shows the result of using our proposed model for the same inference. Our model can make high-confidence predictions for partially occluded and shadowed feral pigeon targets.
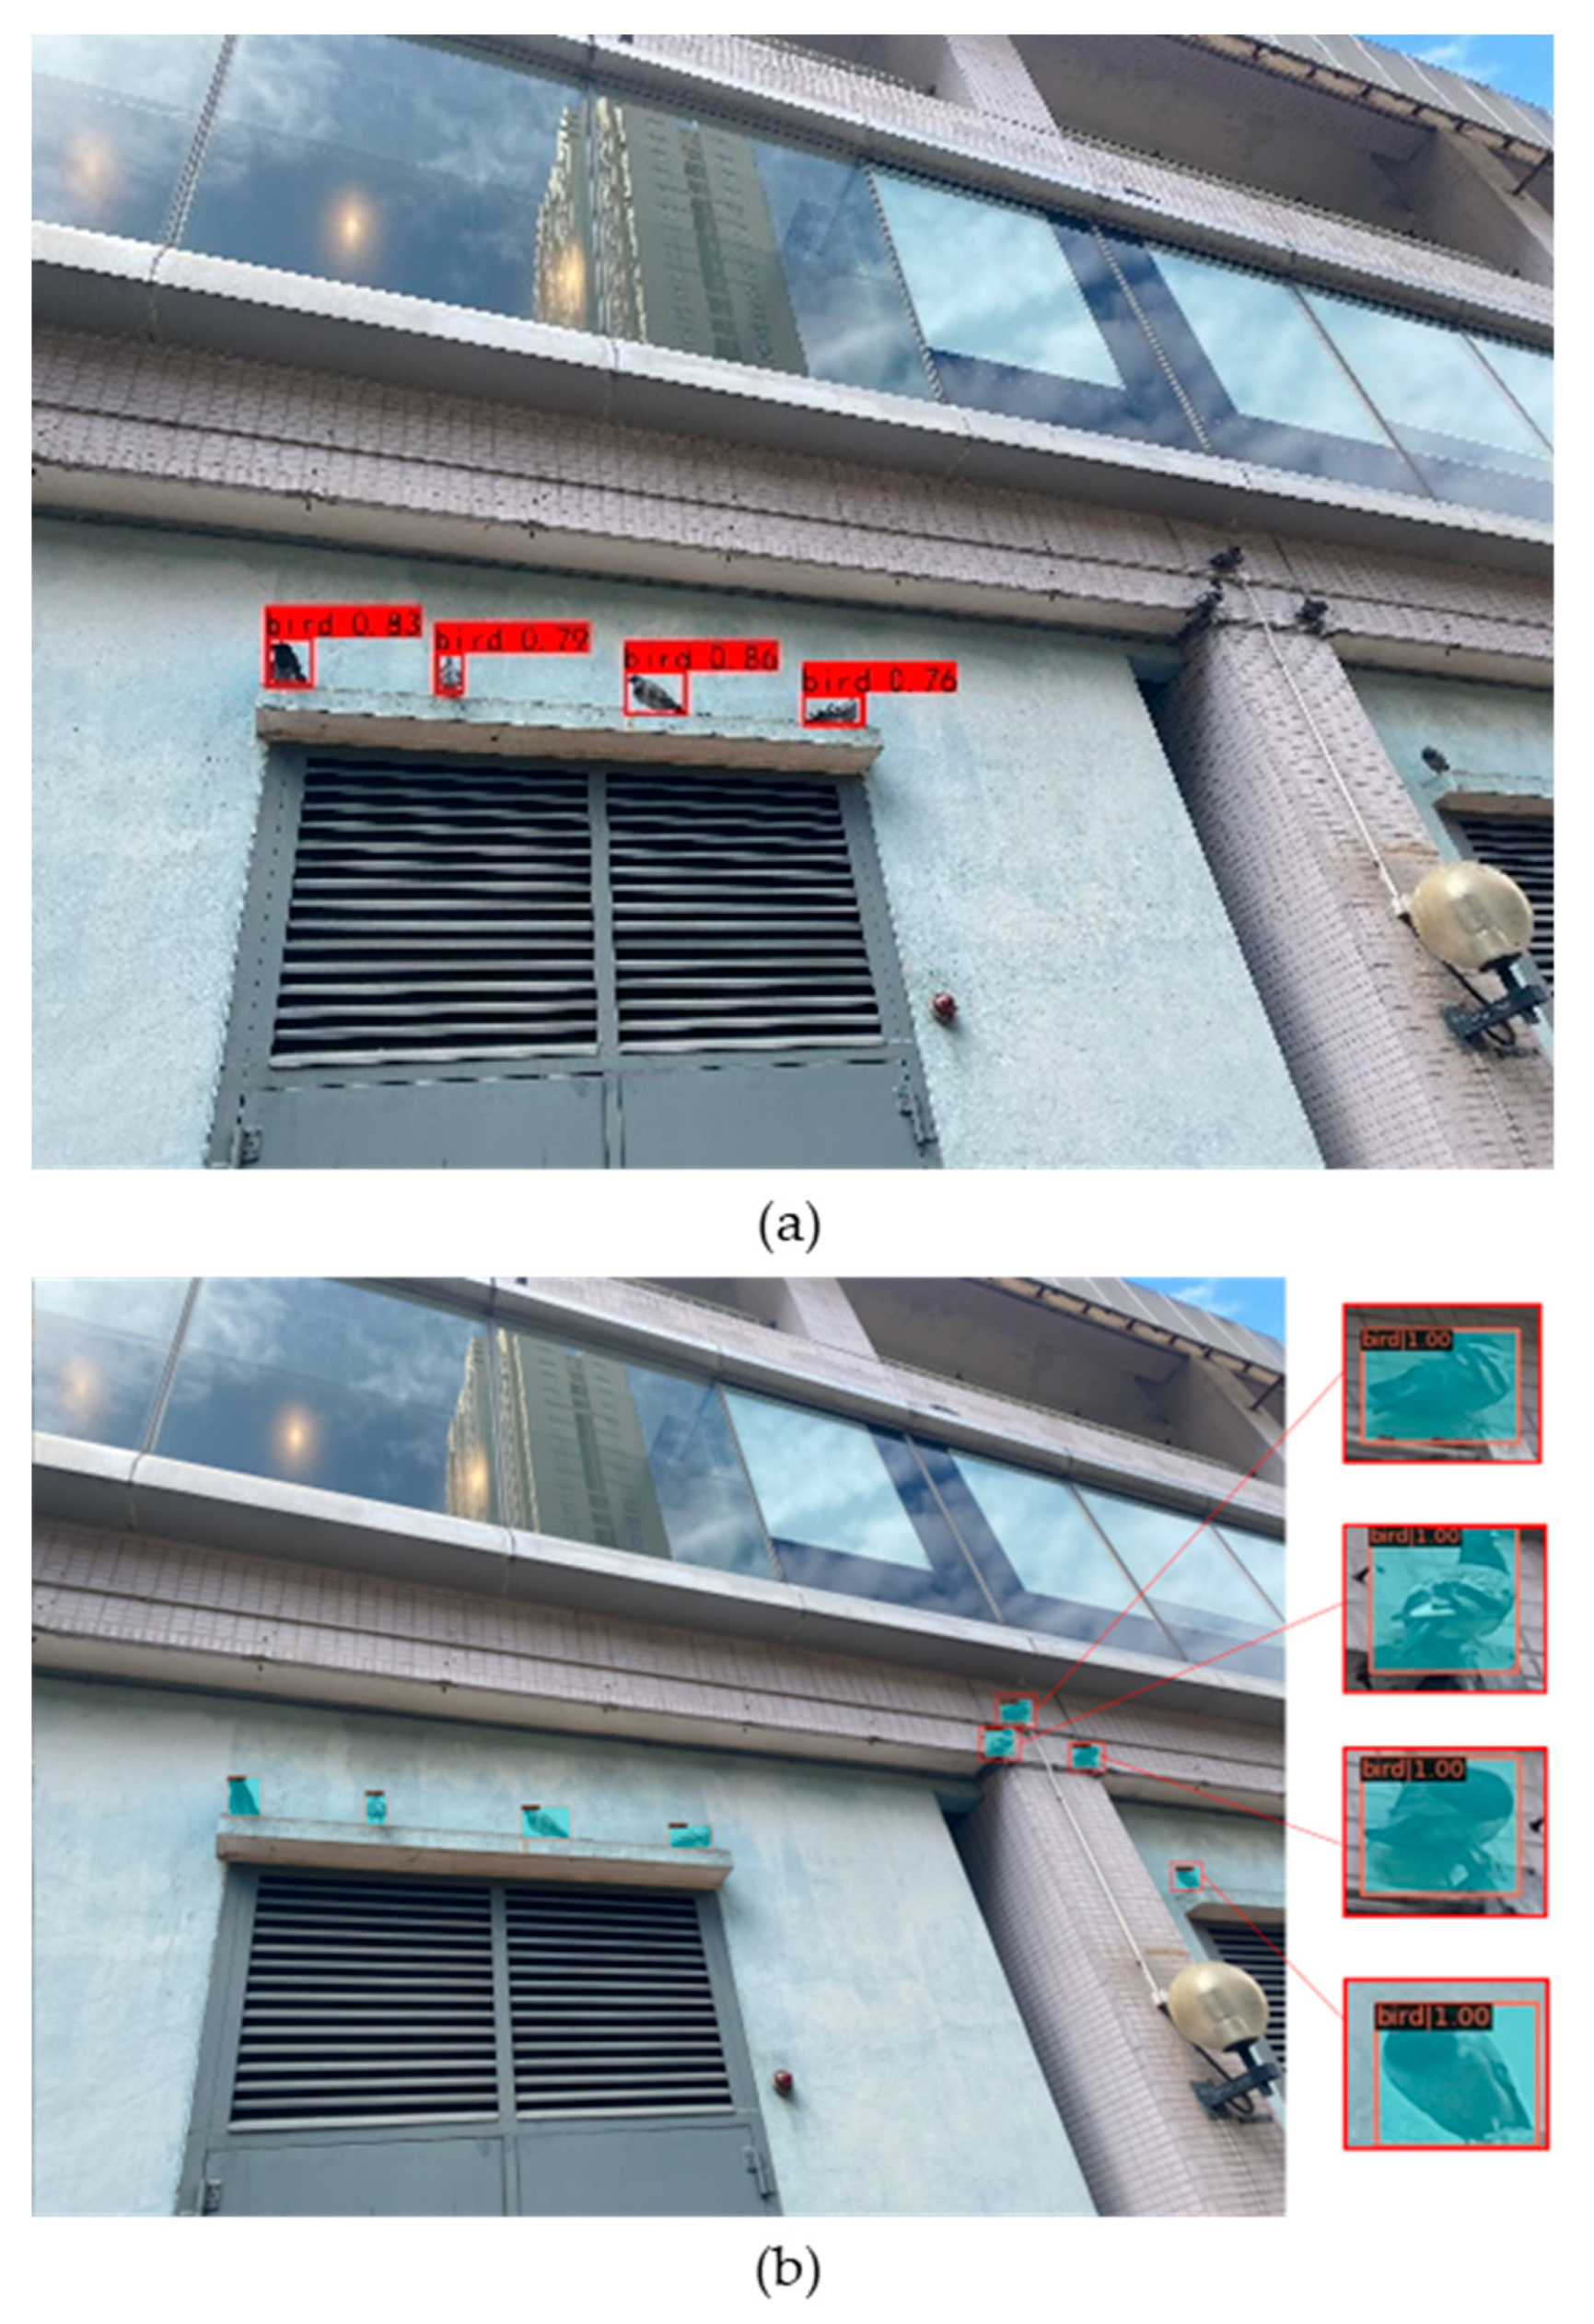
As shown in Figure 11 (a), the left image shows the original Mask R-CNN model, which still has missed detections for some small targets in large images. Figure 11 (b) clearly demonstrates that our proposed model can easily detect all feral pigeon targets.
Figure 12 shows the dense feral pigeons flying in the sky or standing on the ground we captured. Although feral pigeons have significant differences in their postures, our model can still capture different postures of feral pigeons in different scenes, further demonstrating the robustness of our model.

3.4. Pigeon counting demo

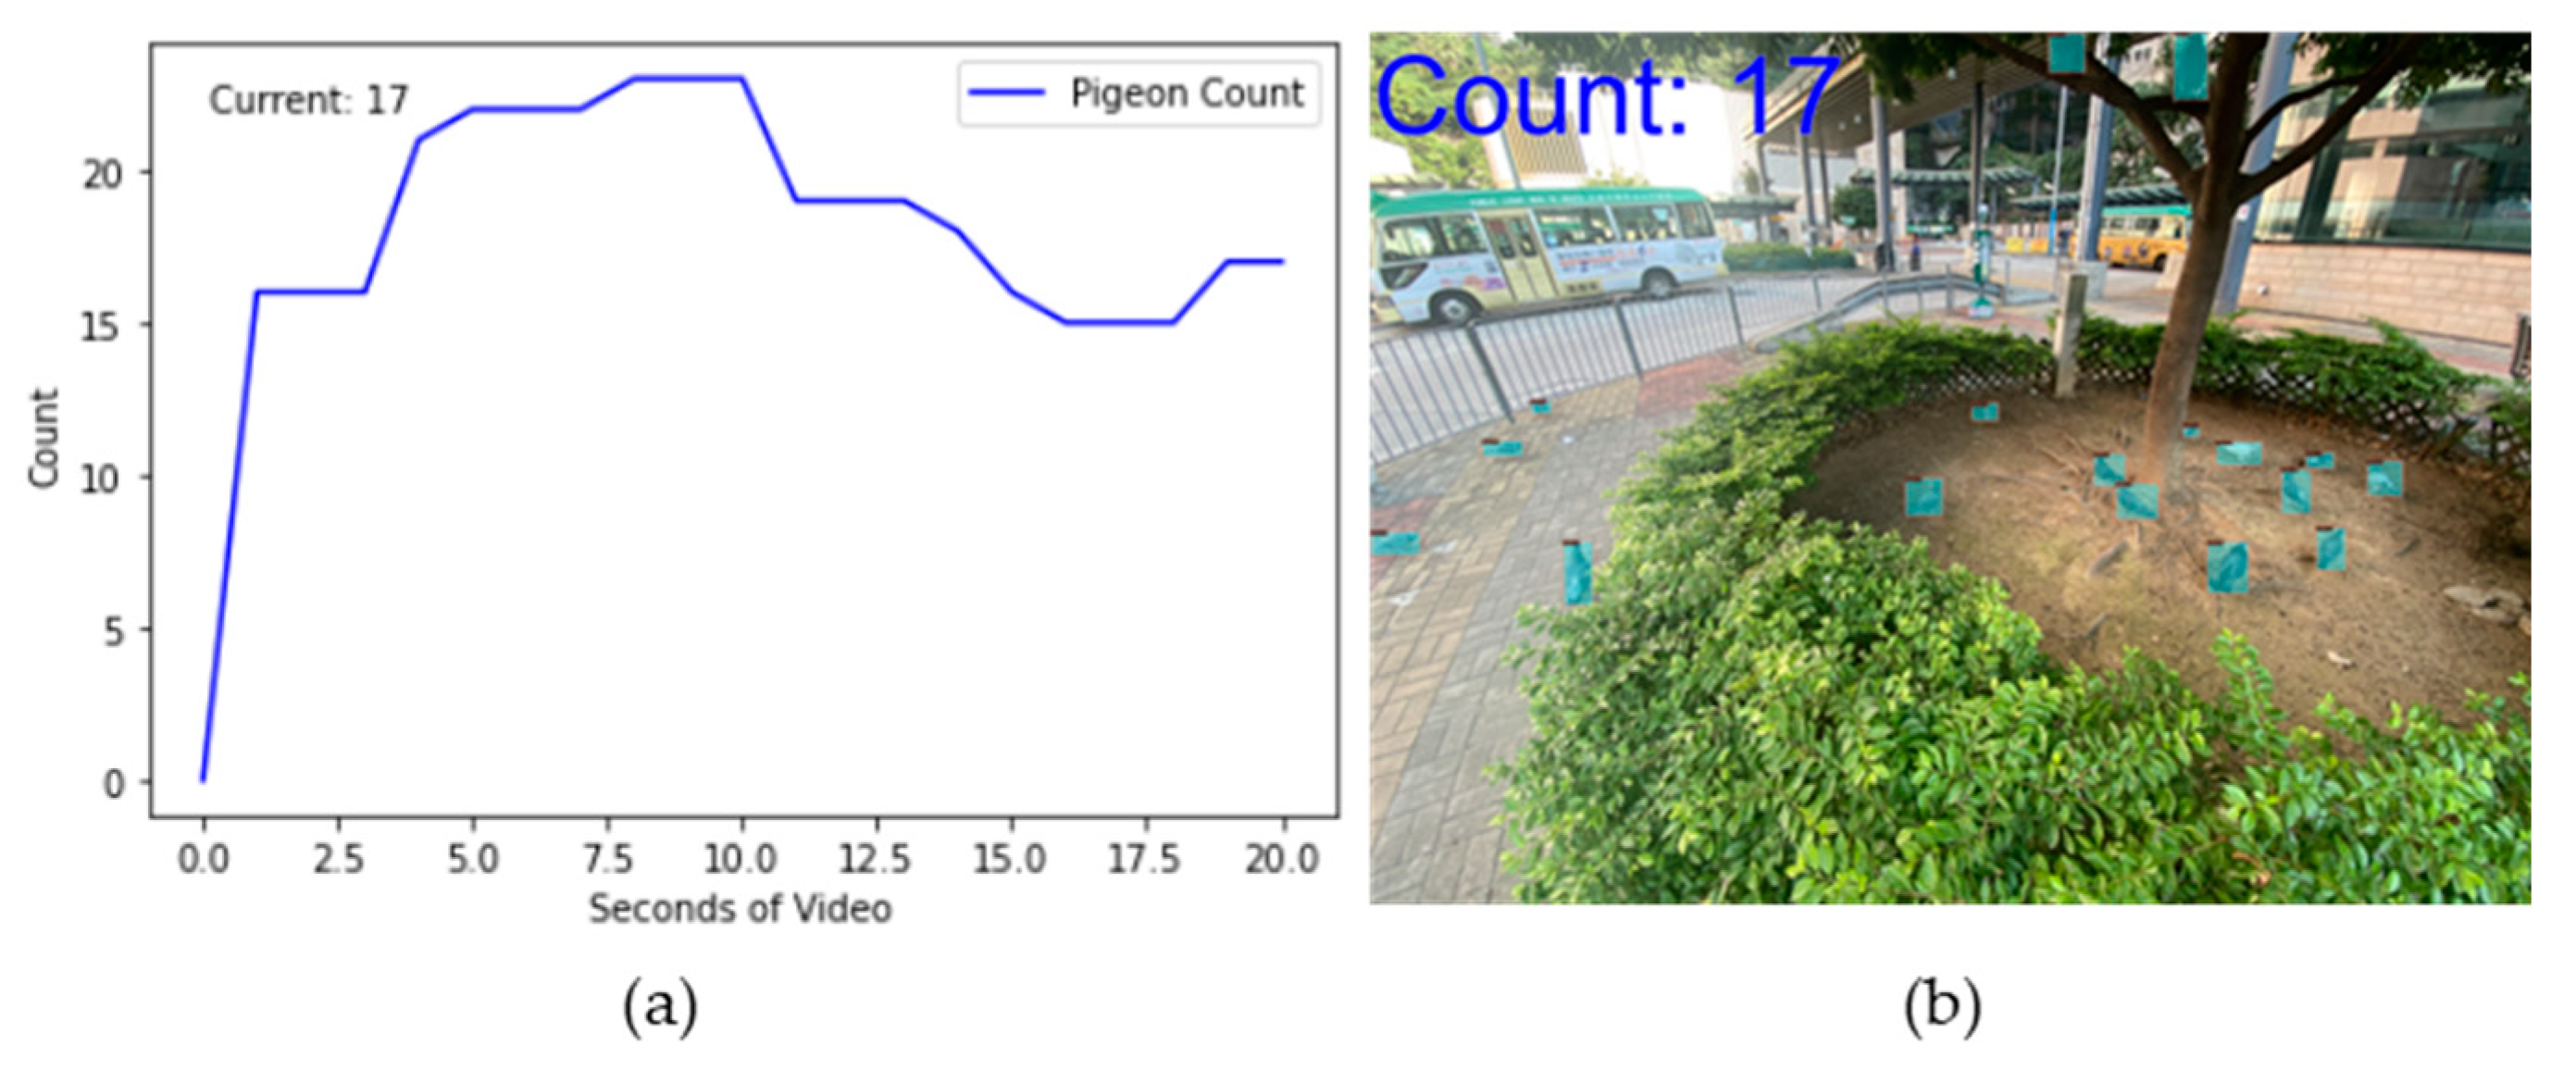
To achieve dynamic counting of feral pigeons, the current statistical method for feral pigeons allows for the selection of videos of varying durations for analysis. In this study, we selected a 20-second video of feral pigeons and extracted one frame per second from the video stream. Each frame was input into our model for feral pigeon detection, and the resulting image is displayed in Figure 13 (b). The total number of detected feral pigeons will be shown in the upper left corner of the image, while the dynamic count of feral pigeons will be displayed in Figure 13 (a) after the image inference is completed, and the results indicate that there were 17 feral pigeons present in the 20th second.

4. Discussion

To address the challenge of accurately detecting feral pigeons in complex urban environments, we propose an improved Mask R-CNN model called Swin-Mask R-CNN with SAHI Model. To validate the performance of our proposed model, we compare it with other classic detection models. Through researching the former study and two stages of experimental comparisons, we draw the following conclusions:
  • The use of deep learning network algorithms for bird recognition has consistently demonstrated strong performance [32,33]. However, there are several limitations in current bird detection methods. Firstly, the utilization of traditional backbone networks in two-stage detection approaches [34,35] hinders the maximization of network performance in bird detection. For instance, backbone networks such as CNN-based Mobilenet, VGGnet, Resnet, and ShuffleNet [7] fail to adequately capture the intricate details and contextual information specific to target bird species. Secondly, most existing studies on bird detection using deep learning techniques lack a specific focus on individual bird species, such as feral pigeons. Some studies concentrate on accurate identification of various bird species in airborne scenarios [14,15,24,35], while others explore the classification and detection of different bird species in natural environments, such as wind farms or aquatic habitats [18,34]. Additionally, a few studies specifically investigate the detection and counting of different bird species in specific regions, such as birds on transmission lines [17]. Moreover, extensive resources are required for traditional feral pigeon research in urban environments [36], and the limited urban pigeon detection focuses only on specific areas such as buildings [37]. There is currently no comprehensive study on feral pigeon detection in complex urban settings. To address these challenges, we propose an automatic detection method for feral pigeons in urban environments using deep learning. Through a series of experiments, we demonstrate the effectiveness of our proposed method in feral pigeon detection in urban areas.
  • In bird detection, most studies have utilized one-stage (YOLO) [15,17,18,20] and two-stage (Faster R-CNN and Mask R-CNN) [34,35] object detection models. The original Mask R-CNN has demonstrated great performance in bird detection [35]. Based on this, we propose an improved algorithm that enhances the main components of the original Mask R-CNN and incorporates the SAHI tool to improve the model's detection performance. Recent studies have shown the effectiveness of the Swin Transformer in capturing fine-grained animal details [38,39]. Therefore, we replace the backbone of the original Mask R-CNN with the Swin Transformer and add FPN as the network's neck for multi-scale feature fusion [40]. After adjusting the network, to evaluate the performance of the Swin-Mask R-CNN model, we compare it with commonly used object detection methods for bird detection, including YOLO [15,17,18,20], Faster R-CNN [34], Mask R-CNN [35], and our proposed method (Swin-Mask R-CNN) on our feral pigeon dataset. The mAP of our proposed Swin-Mask R-CNN model reaches the highest value of 0.68. These experimental results demonstrate that by applying various bird detection models and the Swin-Mask R-CNN model to feral pigeon detection, our model achieves the best performance. Moreover, although using Swin-Mask R-CNN as the architecture yields optimal results in the previous comparative experiments, there is still room for improvement in detecting small objects of birds (AP50s). There are specific studies focused on the detection of small objects of birds [14,35]. Therefore, to further enhance the accuracy of detecting small objects of feral pigeons, we introduce the SAHI tool [29] to assist inference processing. In this phase, we incorporate the SAHI tool into all the models involved in the previous experiments and conduct further experiments on our dataset. The experimental results demonstrate that our Swin-Mask R-CNN with SAHI model significantly improves the accuracy of feral pigeon detection, achieving the highest values in mAP, AP50 and AP50s with improvements of 6%, 6%, and 10% respectively.
  • Our current work has significantly improved the detection capability of feral pigeons in urban environments, but we still face some challenges in the future. Our research has the following two limitations: we have not further tested the generalization ability of our model, and we have not fully deployed it in real-time on portable terminals. In future work, we plan to enhance these aspects. On one hand, although our proposed model demonstrates good detection performance, to further validate its generalization ability, we intend to collect larger datasets encompassing feral pigeons and other bird species from various cities through collaborations with researchers and public data sources. On the other hand, while we have developed a demo for automatic feral pigeon counting, it has not been extensively deployed in real-world scenarios. Our goal for future work is to deploy our algorithm on cloud and mobile platforms, enabling researchers to upload photos and videos for automatic analysis by the model. This will provide feral pigeon detection and counting results, allowing estimation of feral pigeon populations in different areas and assessment of the impact of feral pigeon overpopulation.

5. Conclusion

In this study, we introduce a novel model modified Mask R-CNN model called Swin-Mask R-CNN with SAHI for feral pigeon detection in Hong Kong urban, which aims to detect feral pigeons in large-size images with 4032×3024 resolution. Our model uses the Swin Transformer backbone network and FPN to construct a feature map with more detailed information. To capture more small pigeon targets, SAHI tool is applied to zoom in on the pigeon information. And we finally freeze the segmentation network to speed up the detection process during the inference part. The results demonstrate that Swin-Mask R-CNN with SAHI model architecture has the greater performance for pigeon detection with 74% mAP. Compared with other models, our model can achieve the best detection of feral pigeons in different environments such as bushes, buildings, and cities under the sky. It can identify overlapping pigeons, pigeons in the shadow, flying pigeons, pigeons eating, and walking pigeons.

Author Contributions

Conceptualization, K.L. and Z.G.; methodology, Z.G.; software, Z.G., and Z.H.; validation, Z.H., Z.G., and L.L.; formal analysis, Z.G.; investigation, Z.G.; resources, Z.G.; data curation, Z.H., Z.G., and L.L.; writing original draft preparation, Z.G.; writing—review and editing, A.M., E.H., and L.L.; visualization, Z.G.; supervision, K.L.; project administration, K.L. All authors have read and agreed to the published version of the manuscript.

Funding

Not applicable.

Institutional Review Board Statement

Since the images were taken from at least three meters away from feral pigeons and there was no manipulation on them, animal research ethics approval was not required by the City University of Hong Kong’s Animal Research Ethics Sub-Committee.

Data Availability Statement

Feral Pigeon Dataset constructed in this study will be shared if the manuscript is accepted for publication. Link to access the dataset will be provided in the revised manuscript at a later stage.

Acknowledgments

Thanks to OpenMMlab for providing the open-source architecture for our model evaluation and comparison.

Conflicts of Interest

The authors declare no conflict of interest.

References

  1. Giunchi D, Albores-Barajas Y V, Baldaccini N E, et al. Feral pigeons: problems, dynamics and control methods[J]. Integrated pest management and pest control. Current and future tactics, London, InTechOpen, 2012: 215-240.
  2. Haag-Wackernagel D. Regulation of the street pigeon in Basel[J]. Wildlife Society Bulletin, 1995: 256-260.Author 1, A.; Author 2, B. Book Title, 3rd ed.; Publisher: Publisher Location, Country, 2008; pp. 154–196.
  3. Sandercock B K. Estimation of survival rates for wader populations: a review of mark-recapture methods[J]. Bulletin-Wader Study Group, 2003, 100: 163-174.
  4. Volpato G H, Lopes E V, Mendonça L B, et al. The use of the point count method for bird survey in the Atlantic forest[J]. Zoologia (curitiba), 2009, 26: 74-78.
  5. Li P, Martin T E. Nest-site selection and nesting success of cavity-nesting birds in high elevation forest drainages[J]. The Auk, 1991, 108(2): 405-418.
  6. LeCun, Y.; Bengio, Y.; Hinton, G. Deep learning. Nature 2015, 521, 436–444. [Google Scholar] [CrossRef] [PubMed]
  7. Xiao, Y.; et al. A review of object detection based on deep learning. Multimedia Tools and Applications. 2020, 79, 23729–23791. [CrossRef]
  8. Oliveira, D.A.B.; et al. A review of deep learning algorithms for computer vision systems in livestock. Livestock Science. 2021, 253, 104700. [CrossRef]
  9. Banupriya, N.; et al. Animal detection using deep learning algorithm. J. Crit. Rev. 2020, 7(1), 434–439.
  10. Huang, E.; et al. Center clustering network improves piglet counting under occlusion. Computers and Electronics in Agriculture. 2021, 189, 106417. [CrossRef]
  11. Li, Z.; et al. A survey of convolutional neural networks: analysis, applications, and prospects. IEEE Transactions on Neural Networks and Learning Systems. 2021.
  12. Sarwar F, Griffin A, Periasamy P, et al. Detecting and counting sheep with a convolutional neural network[C]//2018 15th IEEE International Conference on Advanced Video and Signal Based Surveillance (AVSS). IEEE, 2018: 1-6.
  13. Xu B, Wang W, Falzon G, et al. Automated cattle counting using Mask R-CNN in quadcopter vision system[J]. Computers and Electronics in Agriculture, 2020, 171: 105300.
  14. Chabot, D.; Francis, C.M. Computer-automated bird detection and counts in high-resolution aerial images: a review. Journal of Field Ornithology 2016, 87(4), 343–359. [Google Scholar] [CrossRef]
  15. Boudaoud L B, Maussang F, Garello R, et al. Marine bird detection based on deep learning using high-resolution aerial images[C], OCEANS 2019-Marseille. IEEE, 2019: 1-7.
  16. Redmon, J.; Divvala, S.; Girshick, R.; et al. You only look once: Unified, real-time object detection. In Proceedings of the IEEE Conference on Computer Vision and Pattern Recognition, 2016, 779-788.
  17. Zou, C.; Liang, Y.Q. Bird detection on transmission lines based on DC-YOLO model. In: Proceedings of the 11th IFIP TC 12 International Conference on Intelligent Information Processing (IIP 2020), Hangzhou, China, July 3-6, 2020; Springer International Publishing, 2020; pp. 222-231.
  18. Alqaysi, H.; Fedorov, I.; Qureshi, F.Z.; et al. A temporal boosted YOLO-based model for birds detection around wind farms. Journal of Imaging 2021, 7(11), 227.
  19. Welch, G.; Bishop, G. An introduction to the Kalman filter. 1995, 2.
  20. Siriani, A.L.R.; Kodaira, V.; Mehdizadeh, S.A.; et al. Detection and tracking of chickens in low-light images using YOLO network and Kalman filter. Neural Computing and Applications 2022, 34(24), 21987–21997. [CrossRef]
  21. 21.Zhang, Y.; et al. A comprehensive review of one-stage networks for object detection. In: Proceedings of the 2021 IEEE International Conference on Signal Processing, Communications and Computing (ICSPCC); IEEE, 2021.
  22. Du, L.; Zhang, R.; Wang, X. Overview of two-stage object detection algorithms. Journal of Physics: Conference Series 2020, 1544(1), 012034. [Google Scholar] [CrossRef]
  23. Girshick, R. Fast R-CNN. In Proceedings of the IEEE International Conference on Computer Vision,2015, 1440-1448.
  24. Hong S J, Han Y, Kim S Y, et al. Application of deep-learning methods to bird detection using unmanned aerial vehicle imagery[J]. Sensors 2019, 19(7), 1651. [CrossRef] [PubMed]
  25. Liu, W.; Anguelov, D.; Erhan, D.; et al. SSD: Single Shot Multibox Detector. In: Proceedings of the 14th European Conference on Computer Vision (ECCV 2016), Amsterdam, The Netherlands, October 11-14, 2016; Springer International Publishing, 2016; pp. 21-37.
  26. 26.He, K.; Gkioxari, G.; Dollár, P.; et al. Mask R-CNN. In Proceedings of the IEEE International Conference on Computer Vision, 2017, 2961-2969.
  27. Liu, Z.; Lin, Y.; Cao, Y.; et al. Swin Transformer: Hierarchical Vision Transformer Using Shifted Windows. In Proceedings of the IEEE/CVF International Conference on Computer Vision, 2021, 10012-10022.
  28. Lin, T.Y.; Dollár, P.; Girshick, R.; et al. Feature Pyramid Networks for Object Detection. In Proceedings of the IEEE Conference on Computer Vision and Pattern Recognition, 2017, 2117-2125.
  29. Akyon, F.C.; Altinuc, S.O.; Temizel, A. Slicing aided hyper inference and fine-tuning for small object detection. In: Proceedings of the 2022 IEEE International Conference on Image Processing (ICIP); IEEE, 2022; pp. 966-970.
  30. Neubeck, A.; Van Gool, L. Efficient non-maximum suppression. In: Proceedings of the 18th International Conference on Pattern Recognition (ICPR'06); IEEE, 2006; Vol.
  31. Tzutalin. LabelImg. Git code,2015. https://github.com/tzutalin/labelImg.
  32. Datar, Prathamesh, Kashish Jain, and Bhavin Dhedhi. Detection of birds in the wild using deep learning methods. 2018 4th International Conference for Convergence in Technology (I2CT). IEEE, 2018.
  33. 33. Pillai, S. K., Raghuwanshi, M. M., & Borkar, P. (2021). SUPER RESOLUTION MASK RCNN BASED TRANSFER DEEP LEARNING APPROACH FOR IDENTIFICATION OF BIRD SPECIES. International Journal of Advanced Research in Engineering and Technology 2022, 11(11).
  34. Xiang, W., et al. Birds detection in natural scenes based on improved faster RCNN. Applied Sciences 2022, 12(12), 6094.
  35. Kassim, Y. M., et al. Small object bird detection in infrared drone videos using mask R-CNN deep learning. Electronic Imaging, 2020(8), 85-1. [CrossRef]
  36. Giunchi D, Gaggini V, Baldaccini N E. Distance sampling as an effective method for monitoring feral pigeon (Columba livia f. domestica) urban populations[J]. Urban Ecosystems 2007, 10, 397–412. [CrossRef]
  37. Schiano F, Natter D, Zambrano D, et al. Autonomous detection and deterrence of pigeons on buildings by drones[J]. IEEE Access 2021, 10, 1745–1755.
  38. Agilandeeswari, L.; Meena, S. Swin transformer based contrastive self-supervised learning for animal detection and classification. Multimed. Tools Appl. 2023, 82, 10445–10470. [Google Scholar] [CrossRef]
  39. Gu, T.; Min, R. A Swin Transformer based Framework for Shape Recognition. In Proceedings of the 2022 14th International Conference on Machine Learning and Computing (ICMLC), Guangzhou, China, 18–21 February 2022; pp. 388–393. [Google Scholar]
  40. Dogra, A., Goyal, B., & Agrawal, S. From multi-scale decomposition to non-multi-scale decomposition methods: a comprehensive survey of image fusion techniques and its applications. IEEE Access 2017, 5, 16040–16067.
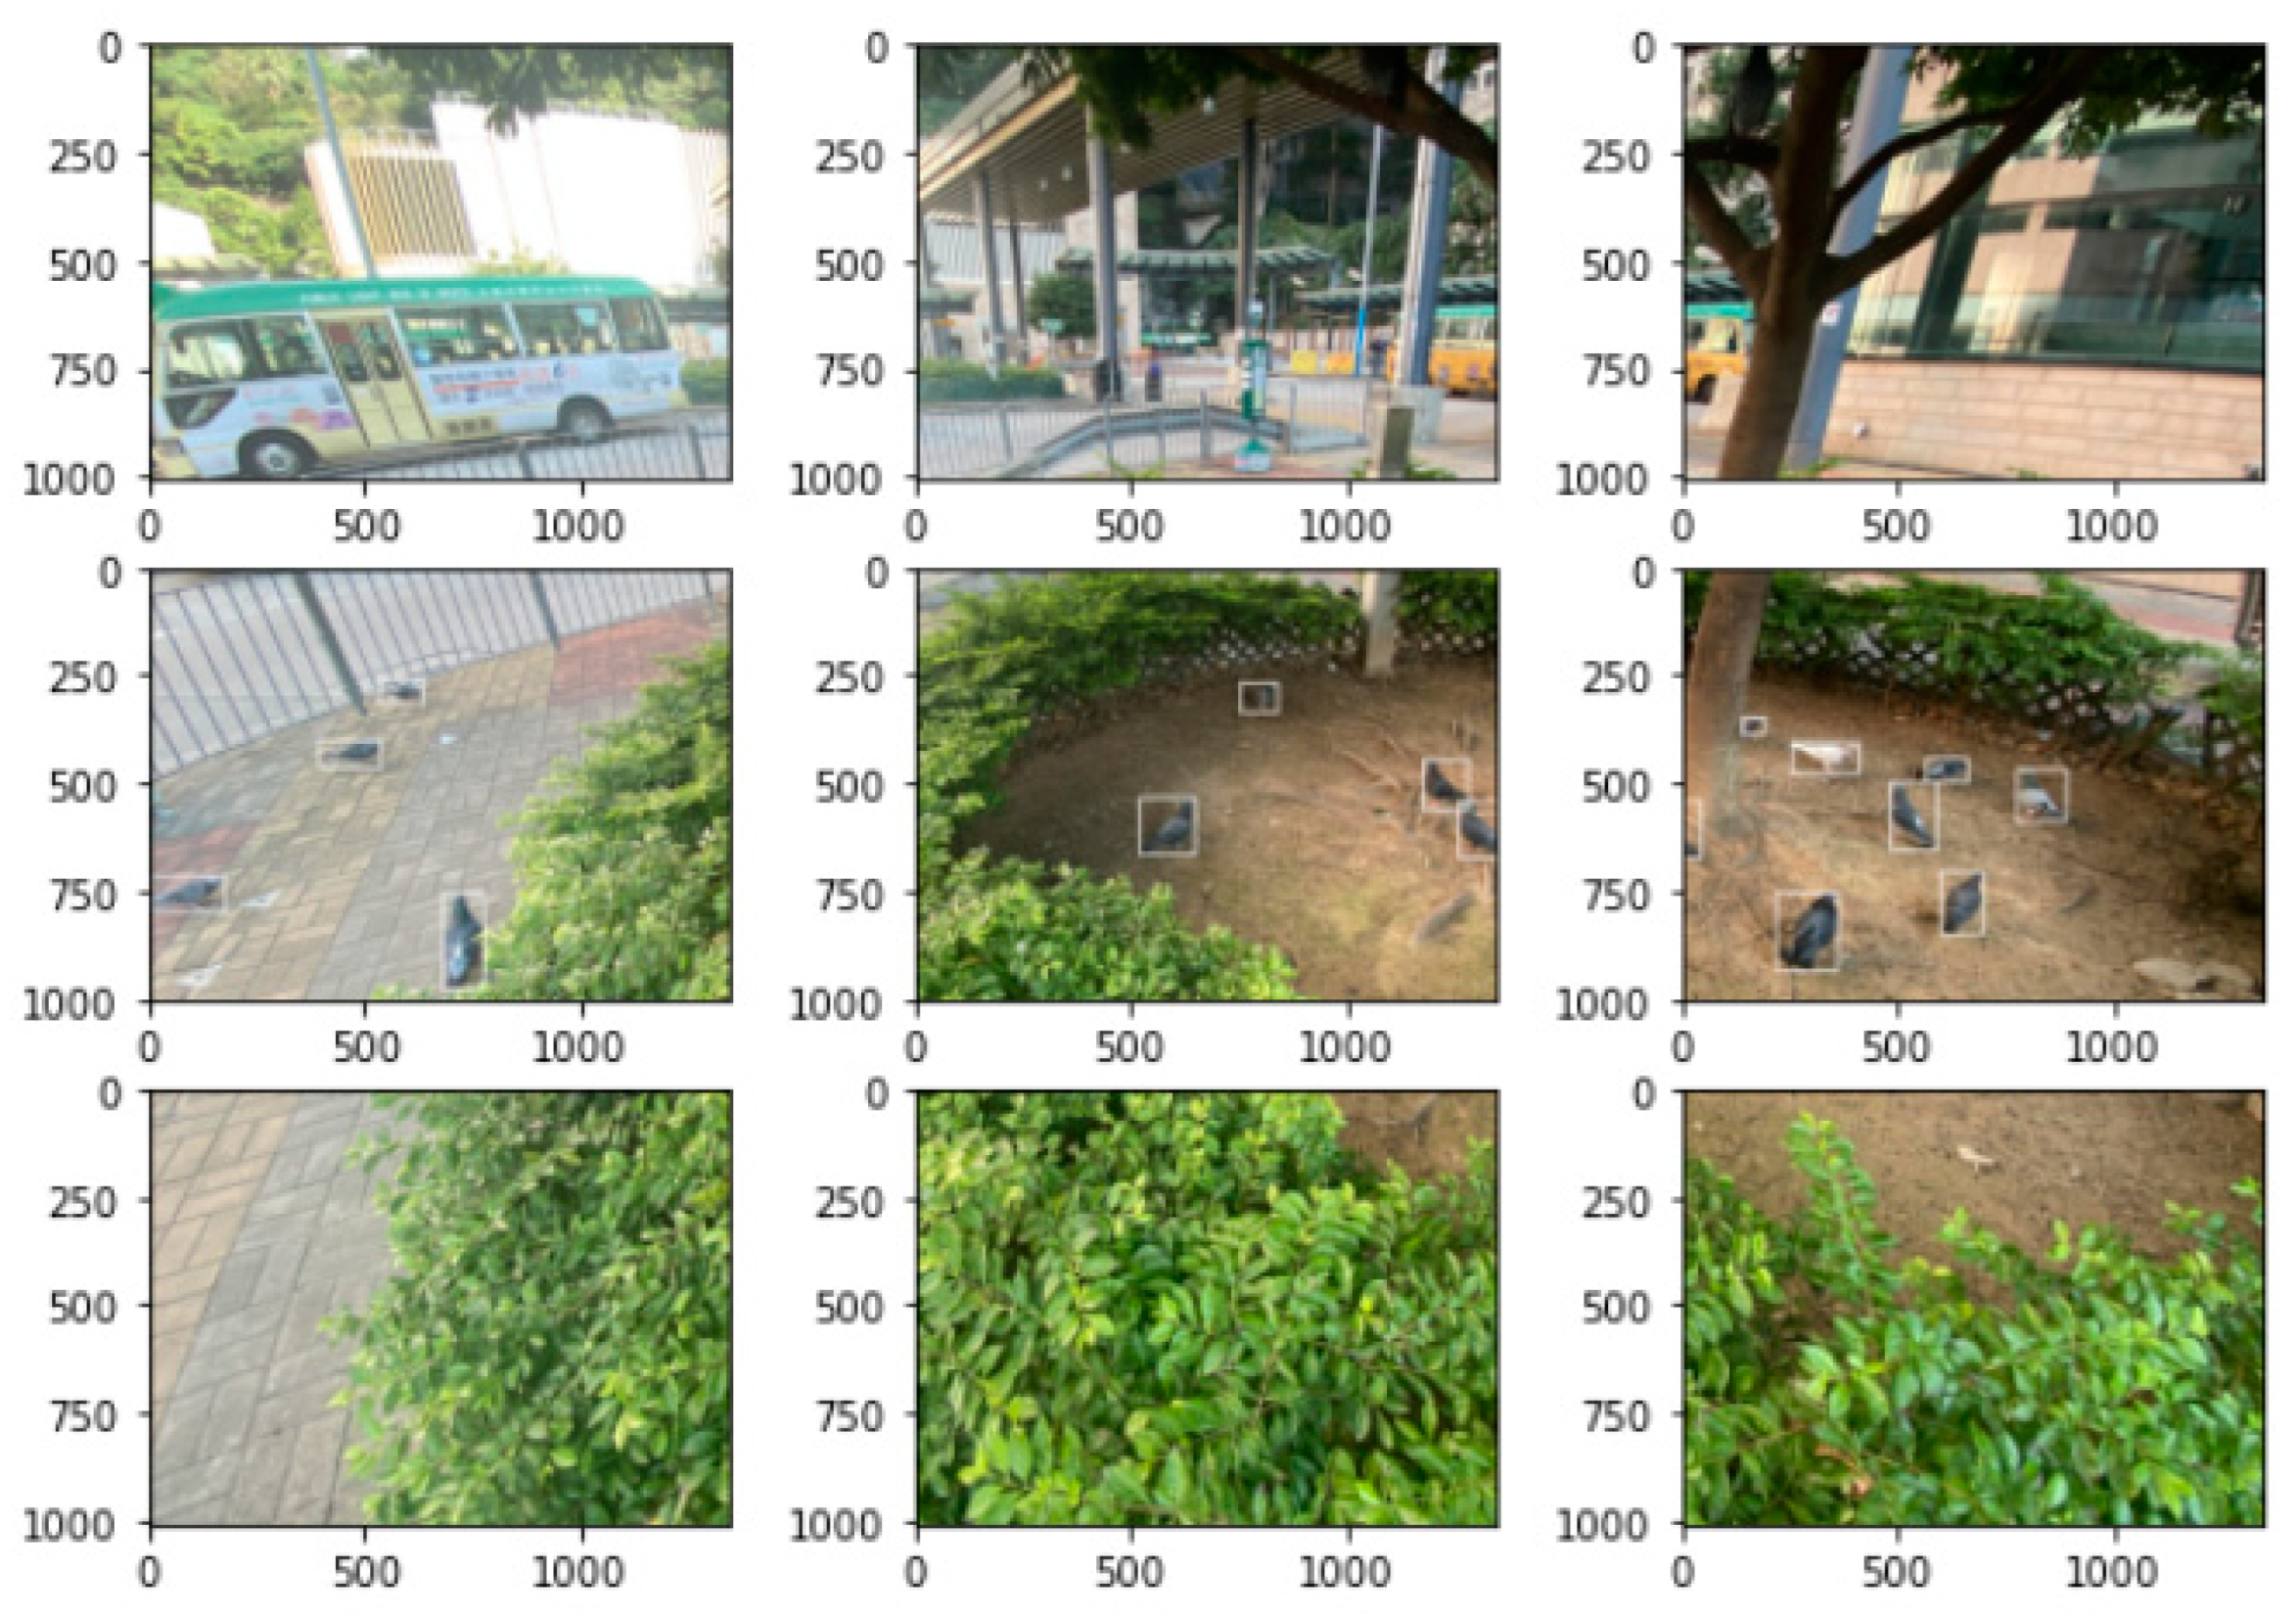
Figure 2. images splitting with annotation box information.
Preprints 90113 g002
Figure 3. The Pigeon detection system overview.
Preprints 90113 g003
Figure 4. Swin-Mask R-CNN with SAHI model.
Preprints 90113 g004
Figure 5. Swin transformer backbone architecture detail.
Preprints 90113 g005
Figure 6. Patch Merging in Swin transformer.
Preprints 90113 g006
Figure 7. FPN Network.
Preprints 90113 g007
Figure 8. Slicing Aided Hyper Inference (SAHI) process.
Preprints 90113 g008
Figure 10. Results for prediction: (a) YOLOv5 in COCO 80classes; (b) Swin-Mask R-CNN with SAHI.
Preprints 90113 g010
Figure 11. Results of prediction: (a) original Mask R-CNN; (b) Swin-Mask R-CNN Slicing-aided hyper inference after slicing-aided fine-tuning.
Preprints 90113 g011
Figure 12. Feral pigeons with different postures in different backgrounds of results in our model: (a) Road environment; (b) Roof environment.
Preprints 90113 g012
Figure 13. Dynamic data display of feral pigeon: (a) pigeon counting graph; (b) the image corresponding to the nth second.
Preprints 90113 g013
Table 1. Dataset splitting for modeling.
Dataset Train Validation Test All
Original dataset 266 67 67 400
Data augment 2400 600 600 3600
Final dataset 2466 667 667 4000
Table 2. Experimental Environment and model evaluation indicators.
Configuration Parameters
CPU 32 vCPU AMD EPYC 7763 64-Core Processor
GPU A100-SXM4-80GB (80GB)
Development environment Python 3.8
Operation system Ubuntu 18.04
Operating Deep Learning Framework Pytorch 1.9.0
CUDA Version CUDA 11.1
Table 3. The experiment of detection performance between different models.
Model Backbone Model weight size mAP AP50 AP50s
YOLOv5-s Darknet53 72m 0.45 0.65 0.36
YOLOv5-m Darknet53 98m 0.44 0.69 0.39
Faster R-CNN Resnet 142m 0.52 0.70 0.43
Mask R-CNN Resnet 229m 0.51 0.75 0.40
Modified Mask R-CNN (Swin-Mask-RCNN) Swin Transformer + FPN 229m 0.68 0.87 0.57
Table 4. The experiment of detection performance between different models.
Model mAP AP50 AP50s
YOLOv5-s + SAHI 0.51 0.71 0.42
YOLOv5-m + SAHI 0.56 0.74 0.46
Faster R-CNN + SAHI 0.60 0.72 0.46
Mask R-CNN+ SAHI 0.62 0.78 0.52
Swin-Mask R-CNN + SAHI (ours) 0.74 0.93 0.67
Disclaimer/Publisher’s Note: The statements, opinions and data contained in all publications are solely those of the individual author(s) and contributor(s) and not of MDPI and/or the editor(s). MDPI and/or the editor(s) disclaim responsibility for any injury to people or property resulting from any ideas, methods, instructions or products referred to in the content.
Copyright: This open access article is published under a Creative Commons CC BY 4.0 license, which permit the free download, distribution, and reuse, provided that the author and preprint are cited in any reuse.
Alerts
Prerpints.org logo

Preprints.org is a free preprint server supported by MDPI in Basel, Switzerland.

Subscribe

© 2025 MDPI (Basel, Switzerland) unless otherwise stated