1. Introduction
The rapid pace of globalization and economic growth has brought urban development to the forefront, necessitating a paradigm shift towards sustainability in urban settlements [
1,
2,
3]. Sustainability in this context encompasses thoughtful consideration of Environmental, Social, and Governance (ESG) elements and examines various components of demographic, environmental, social, economic, transportation, and ecologic features of an area [
4,
5,
6], acknowledging their intricate interplay and their far-reaching impact on the urban ecosystem in both short and long-term horizons. Ultimately, sustainability in urban development aims to create livable and friendly places that are not only habitable but also nurturing for current and future generations. This pursuit aligns with the Sustainable Development Goals (SDGs) of the United Nations that recognize cities to be centers of innovation and hubs of growth, underscoring the imperative to make them sustainable, inclusive, safe, and resilient [
7].
In response to the call for action on the Sustainable Development Goals, there has been a growing demand for initiatives that advance sustainable cities’ planning, management, and capacity-building. The urgency comes from the realization that urban ecosystems are vulnerable to irrevocable damage, particularly from challenges such as pollution, resource depletion, and overconsumption, when the pressures exerted on them exceed their inherent capacities [
1,
3,
8]. Within this context, the Urban Carrying Capacity (UCC) concept emerges as an essential metric, offering thresholds that delineate the limits of human activities, population growth, per capita consumption, waste production, land utilization, and physical infrastructure development before urban ecosystems reach potential devastation [
1,
2,
3,
9,
10,
11,
12,
13].
Several descriptive-analytical and numerical models have been introduced in the past few years to measure UCC. These methods typically involve the selection of indicators and their categories, the evaluation of the limits of indicators, and the calculation of their weights or relative contribution to UCC. Wei et al. [
10] proposed using Mean-Variance Analysis to determine the weight of each of their chosen indicators based on five categories of variables: economic, resources, environmental, infrastructure, and transportation. They further evaluated the comprehensive UCC conditions of megacities and determined that environmental and infrastructural aspects, followed by resources, economic factors, and transportation, contribute the most to UCC. To incorporate the ecological dimension of an urban ecosystem in the selection of indicators, Irankhani et al. [
14] proposed the use of Geographic Information System Fuzzy Modeling (GISFM) in gradating the carrying capacities of the ecological indicators according to the maximum accepted and desirable limits. Combined with the Technique for Order of Preference by Similarity to the Ideal Solution (TOPSIS) method in identifying the limits of socioeconomic indicators, they showed that no districts in Shemiran City, Tehran, Iran had desirable UCCs. The selection of their indicators was based on the Driving forces-Pressures-States-Impacts-Responses (DPSIR) framework, which describes interactions and causal relationships between human activities and the environment [
5,
14]. Esfandi and Nourian [
9] also assessed the UCC of Tehran’s districts in the context of the development of mega malls based on economic, social, environmental, and traffic indices in their proposed UCC Assessment Framework (UCCAF), which calculates the Degree of Carrying Capacity (DCC) of each district in relation to each indicator. DCC consists of 6 categories that are utilized in evaluating the pressure of the indicators from desirable to critical level (see
Table 5) [
3,
15].Their results revealed that some districts have very poor carrying capacity levels for mega malls and that site selection for mall construction neglected urban planning principles. Li et al. [
13] proposed a "Pressure-Capacity-Potential" framework to calculate Urban Comprehensive Carrying Capacity (UCCC) using multifactor weighted summation, graded assignment, stepwise correction, and subsection variable weight. Their framework evaluates the urban carrying pressure, capacity, and potential indices based on their particular indicators, which are then used to calculate the UCCC of an area. The researchers identified three (priority, key, moderate) development zones from the calculated UCCC which have their own recommended actions for sustainable urban development.
Recently, Tehrani et al. [
1] proposed the Enhanced Urban Carrying Capacity Load Number (EUCCLN) model as an improvement to the Urban Carrying Capacity Load Number (UCCLN) model [
2,
3]. Both models use weighted indicators and DCCs to calculate the study area load numbers (LNs), which represent the combined impact from the pressure that an indicator places on an urban ecosystem based on DCC and the perceived importance of that indicator by experts. Although the UCCLN model aims to estimate the UCC of an area based on indicators in the contracted DPSIR framework called Pressures-States-Impacts-Responses (PSIR), the EUCCLN model focuses on monitoring human-induced impacts and thus only uses human impact indicators. It also integrates remote sensing and Geographic Information System (GIS) for better data management and monitoring. With this simplification, the authors concluded that impact pressures alone, such as waste production, air pollution, and traffic congestion, can cause irreversible damage to the urban ecosystem [
1].
The urban economic, social, and environmental criteria comprise a holistic description of sustainable urban development [
4], which can then be used as indicators to calculate the UCCLN. Some studies also indicate the addition of infrastructure and transportation as separate criteria for the assessment of carrying capacity indices [
9,
10]. Examples of indicators that characterize the socio-environmental conditions of an area are waste production and air pollution indicators, while traffic congestion is an example indicator that characterizes transportation. The impact indicators that the EUCCLN model used are not related to the urban economy [
1].
Although prior research [
1,
2,
3,
5,
8,
9,
10,
14,
16] was proven to be useful in assessing the UCC of an area, rapid urban development, tourism-related activities, and population growth make the UCC very dynamic, implying the need for it to be recalculated for various temporal contexts, such as for regular days, for holidays, and during weather-related disturbances. This dynamicity was previously recognized by several works [
8,
43]. Wang et al. [
8] when they conducted dynamic assessments of the Tourism Carrying Capacity (TCC) of some of the top Chinese urban tourism destinations. They evaluated their TCC under various simulation scenarios based on the focus of different policies, which highlighted the significant role of environmental management strategies for TCC. Although this study explored different scenarios, thereby exhibiting the dynamicity of TCC, it overlooked daily fluctuations. Zhang et al. [
17] also used TCC to monitor the impact of visitor attendance in theme parks and distinguished between busy and non-busy days, noting its influence on visitor experiences, satisfaction, and behavioral intentions. While the TCC provides thorough attention to the conditions in tourist hotspot settlements, calculating the TCC requires extensive tourism data from the study area, which may not be available to developing countries. A notable research gap lies in the exploration of advanced techniques, particularly the utilization of satellite data, to improve the precision and efficiency of UCC and TCC assessments.
Nighttime light (NTL) intensity data, collected by satellites, is publicly available daily data that provides a unique way to track urban growth. These data show us where and how people use artificial light at night, revealing human activity or urban vibrancy in cities and communities. Studies suggest the use of Nighttime Light (NTL) data to effectively capture urban activity [
18,
19,
20,
21]. NTL can be used as a proxy for urbanization within a city, as it exhibits a robust correlation with socioeconomic factors, making it well-suited for modeling and monitoring spatial variables [
21]. This aids in understanding temporal and spatial patterns of socioeconomic activities that are crucial for developing sustainable strategies for urban planning.
This work focuses on Baguio City, Philippines, a city that has a unique position as both a highly urbanized center and a tourist hotspot: it is known to be the "Summer Capital" of the Philippines[
22]. The city’s local festivals and special events attract tens of thousands of tourists, far surpassing the regular influx on typical days [
23]. However, this surge in tourism and population movement has brought significant challenges to the city. Traffic congestion is a prevalent problem, especially during peak seasons and holidays, leading to inconveniences and increased air pollution due to congested narrow roads and the resulting delays. In addition, the increase in tourists strains waste management systems, resulting in higher waste generation from hotels and restaurants. Therefore, the UCC load number is expected to be dynamic for this city, and even its local government [
24] has recognized the need to regularly measure UCC and use it as a basis to develop customized solutions that can support and maintain tourism activities.
This paper measures the UCCLN of Baguio City using the EUCCLN model updated with an economic indicator and contextualized on varying days. Due to the lack of data on economic indicators for the city’s districts, NTL is used as a proxy indicator of economic activity and urban vibrancy. This study extends the EUCCLN model to incorporate economic indicators through NTL data as a proxy indicator of economic activity or urban vibrancy. Using this extended model, the changes in load number for various temporal contexts are investigated. The resulting insights into the dynamics of UCCLN are especially useful in assessing the pressures in highly urbanized tourist hotspots, where LN is highly fluctuating. The same framework can then be applied to less urbanized tourist hotspots or urbanized cities that are not tourist hotspots.
4. Discussion
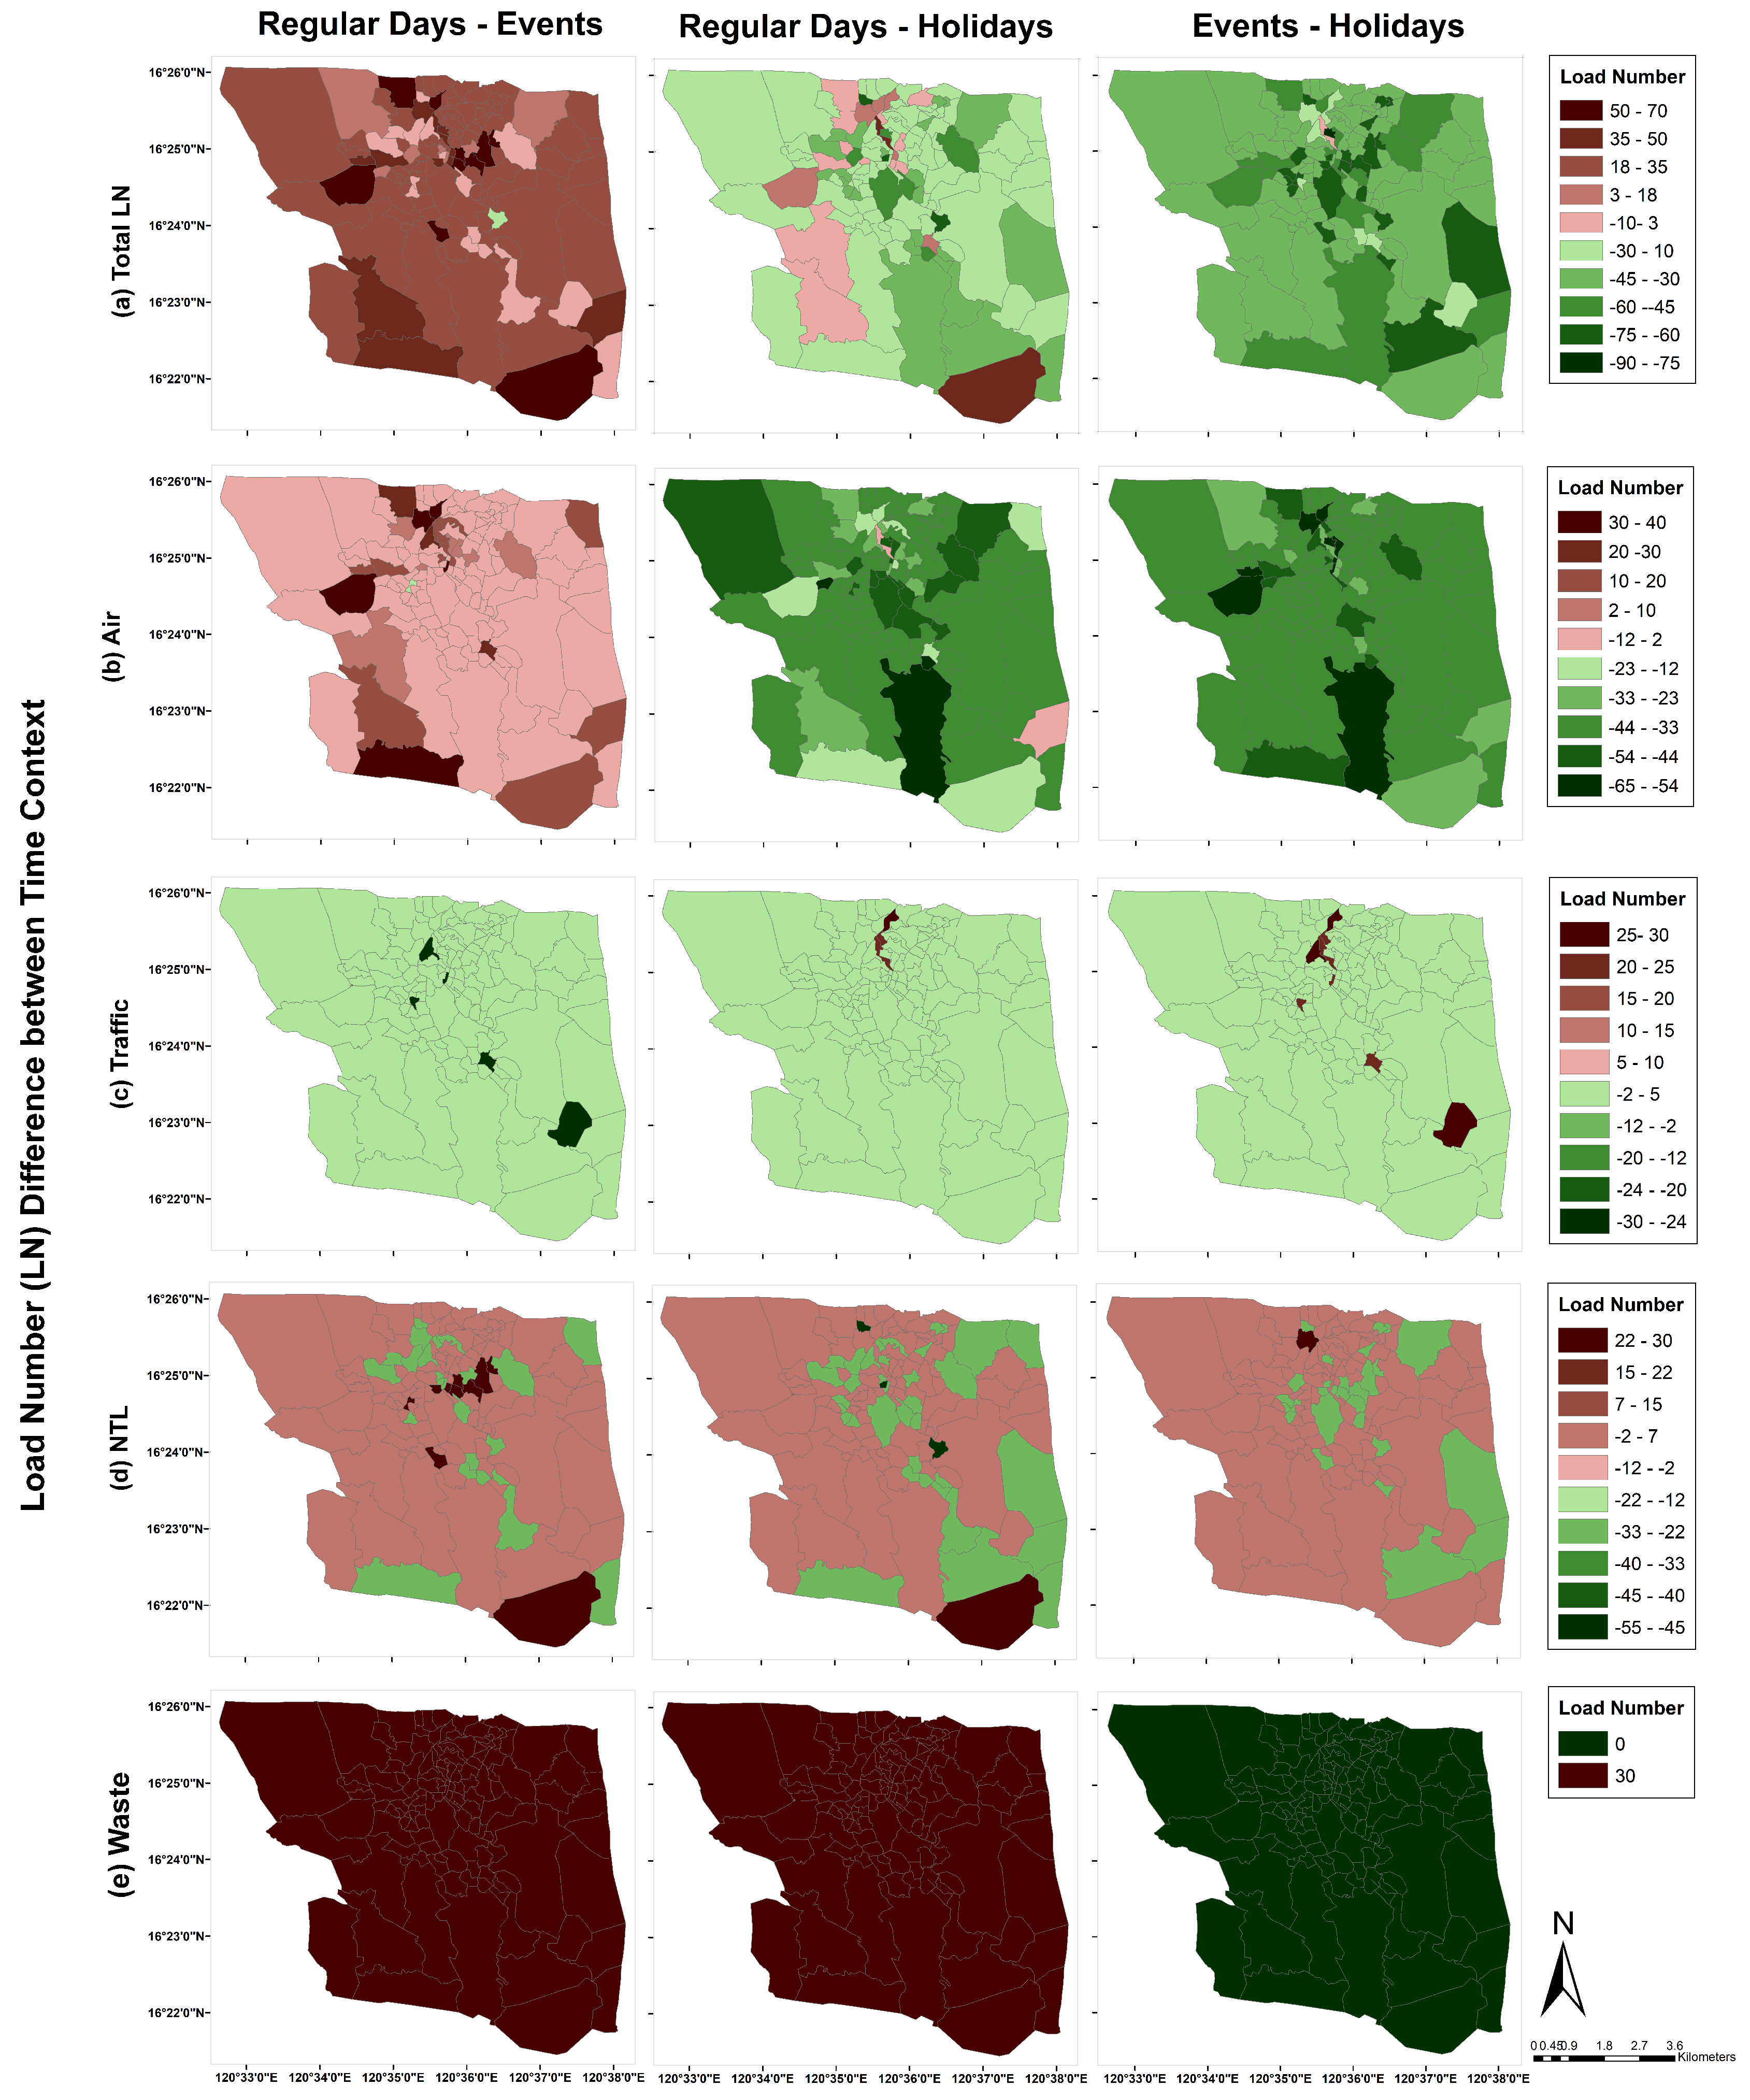
Our results above show that EUCCLN used with GIS spatial visualization provides useful insights about the load number that a city experiences during different temporal contexts. Looking at the LN per indicator, the model results increase awareness regarding the areas that need more attention on days with events and during holidays. For a better understanding of the change in impact from regular days to days with events and holidays, differences in human-induced impacts between (a) regular and days with events, (b) regular and holidays, and (c) events and holidays are analyzed.
Figure 6 shows the maps of the differences in LN of each criterion between temporal variations. Positive difference values in brown indicate that the first temporal context in the comparison has higher LN values than the second temporal context (e.g.
Regular Days - Holidays in brown indicates that LN is higher on regular days than on holidays for the specific
barangay). Green indicates otherwise. For instance,
Figure 6a substantiates the interpretation that the LN for different
barangays are highest for holidays, followed by regular days, and lowest for days with events.
In
Figure 6b under
Regular Days-Holidays, the results captured the severely increased levels of pollution in
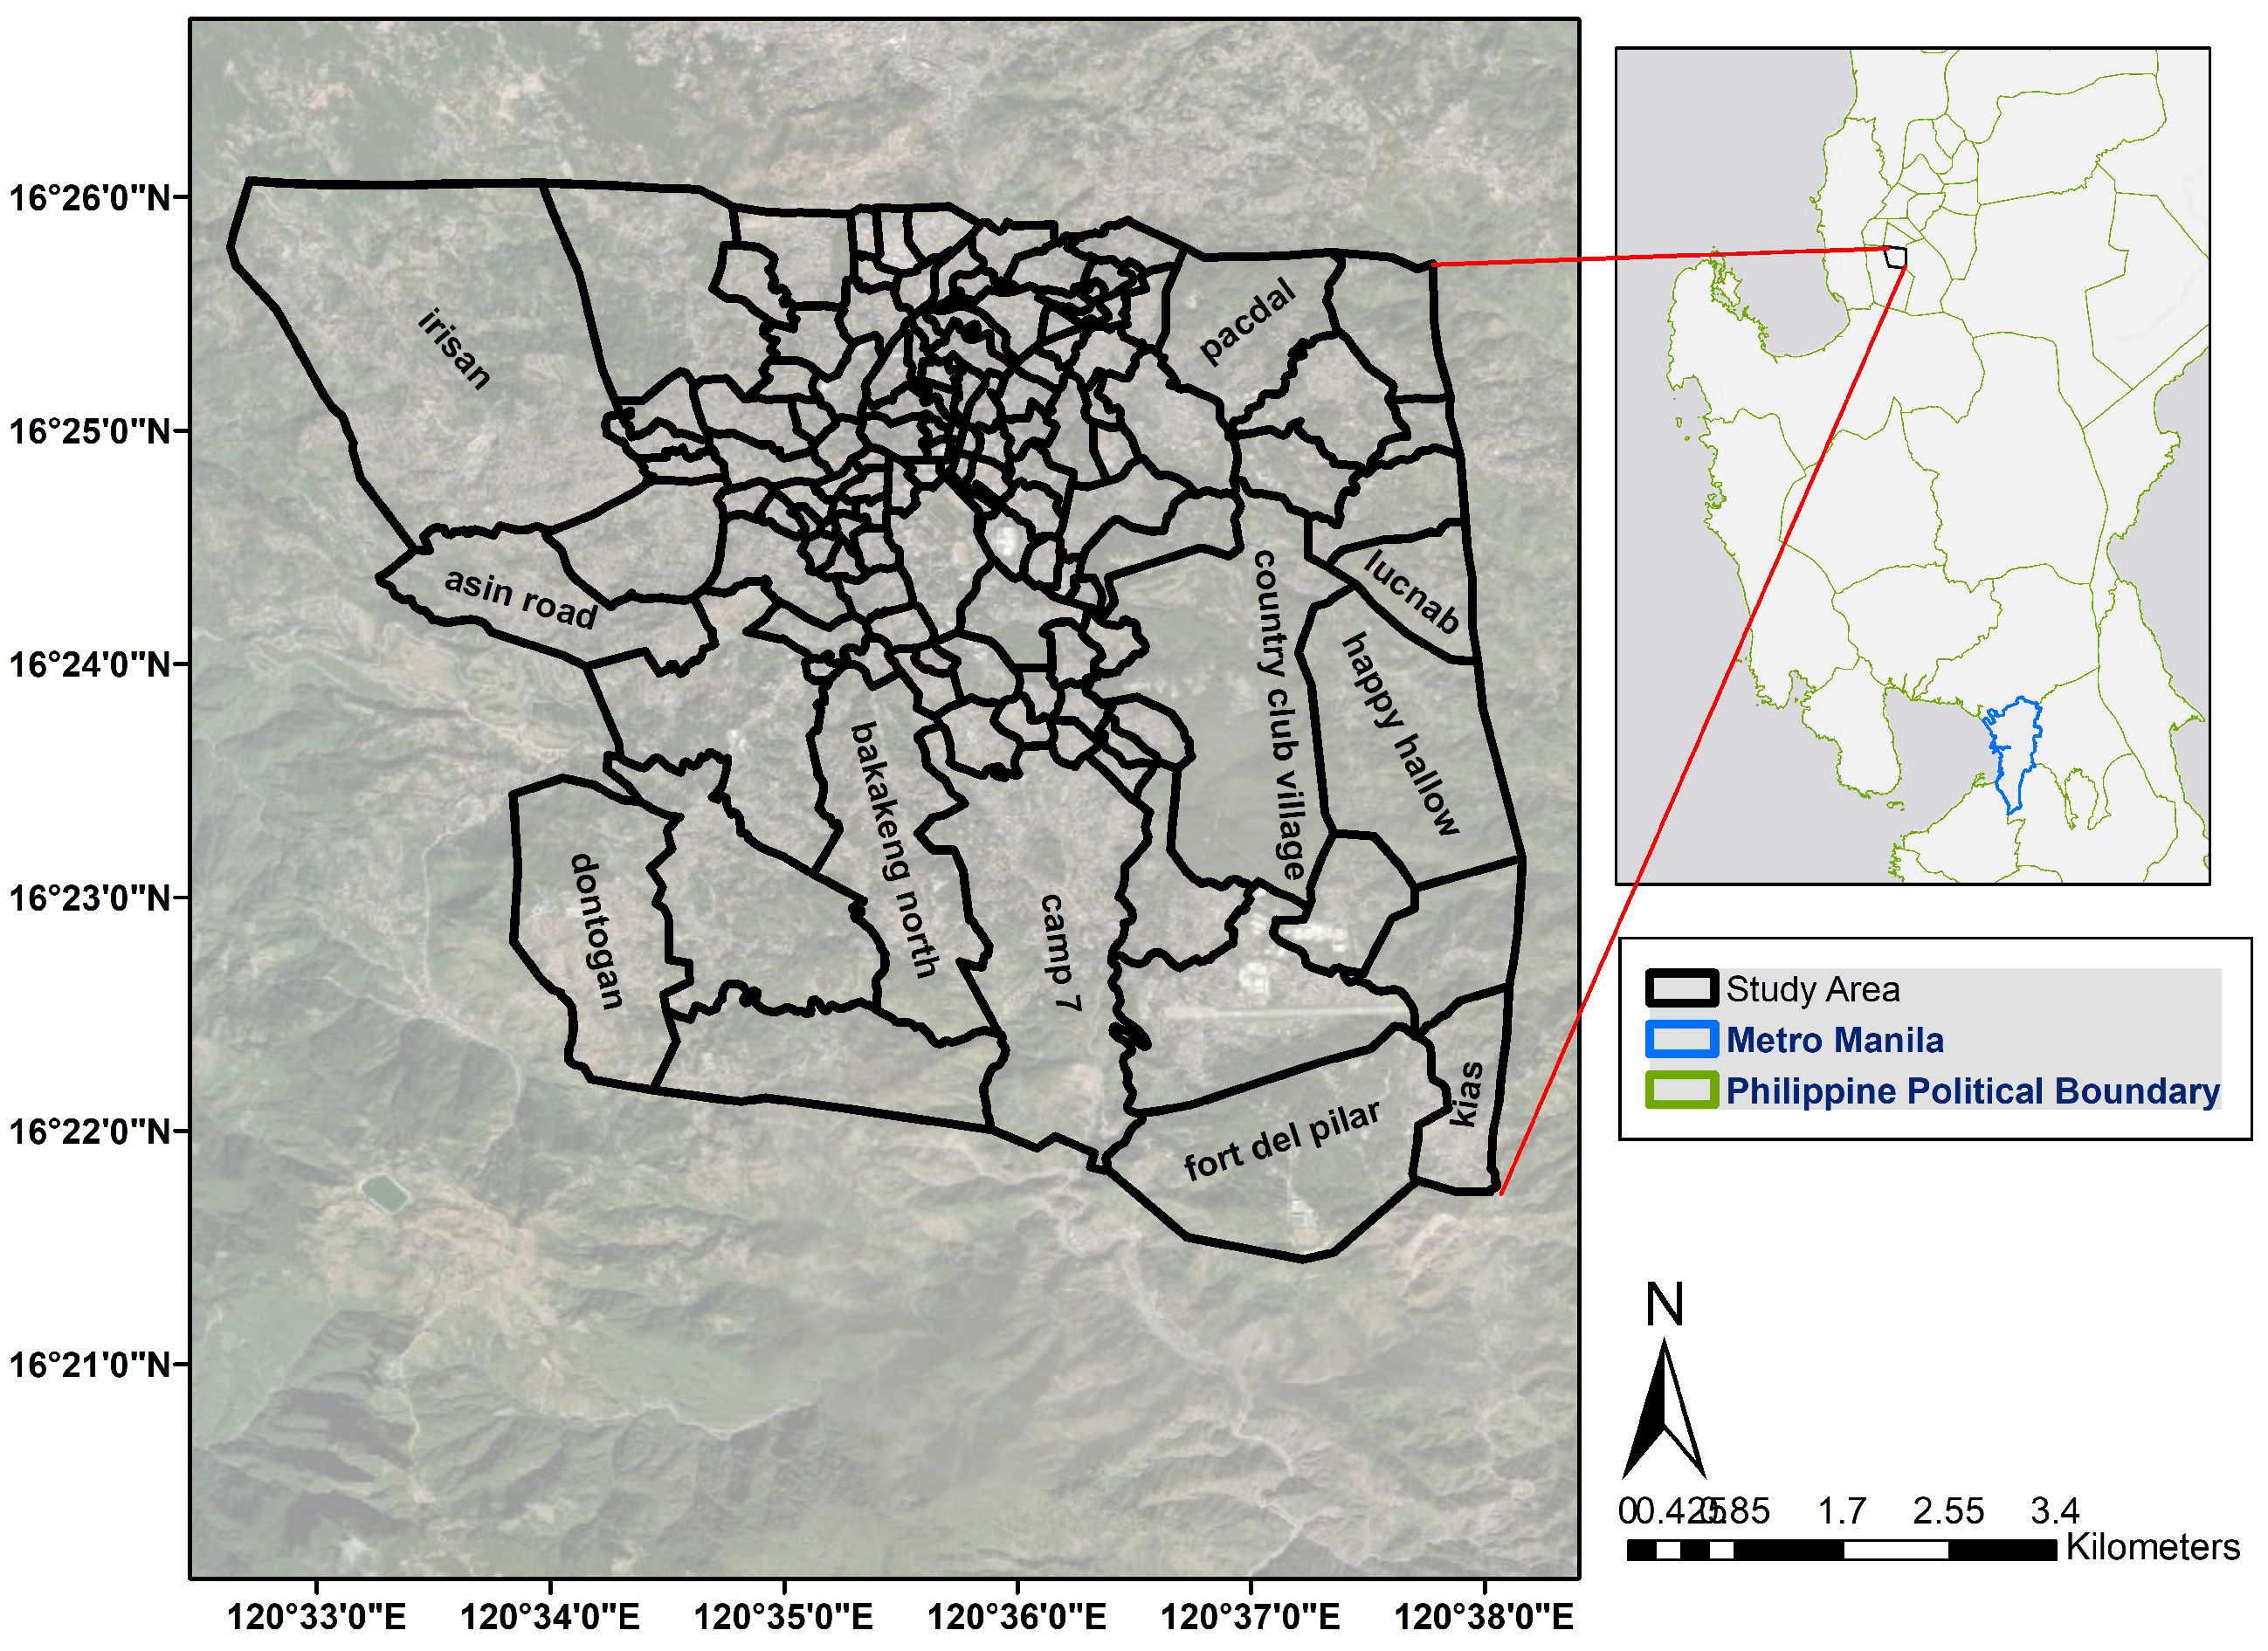
barangay Camp 7 (see
Figure 1) during holidays compared to regular days. This area includes
Kennon road which is infamous for being congested with vehicles during the holidays [
40,
41], as it serves as one of the gateways of Baguio. However, we do not see any similar result in terms of traffic in
Figure 6c, since most GPS trackers are connected to taxis whose travel is mostly limited within the city. However, through these graphs showing the differences in total trips in each
barangay, one can see which areas suffer the worst traffic during events (for example, the
barangays in the vicinity of the Loakan Airport, where tourists also enter the city). More evidently, with the different plots, the central city area becomes less traffic during holidays than during days of events, as discussed in the previous section. This may be due to the idea that on holidays, tourists mainly move around the city, while residents prefer to rest. This coincides with the result of [
42] in which resting activity was observed to increase during vacations, with a more pronounced magnitude if the duration of vacation is four days or more. The holidays included in
Table 2 are more or less a week long. Although the results from the number of trips may not capture the comprehensive effect of events on holidays in most parts of the city, the use of NTL may be more informative in terms of measuring the change in load number of human-induced impacts on non-regular days from regular days (
Figure 6d), as NTL has been demonstrated to capture information regarding economic activities and human movements [
21]. Finally, the differences in waste generation in
Figure 6e may provide insight into the improvements needed in the city. The high difference in waste generation between regular days and non-regular days may be indicative of the suspension of waste collection as workers may also be having their breaks on holidays or may not be able to collect waste on days with events because of a lack of access to collection sites as several roads are closed and blocked during events.
Author Contributions
Conceptualization, M.L.; methodology, M.L.; software, M.L., G.F., and A.V.; validation, M.L., G.F., and A.V.; formal analysis, M.L., and G.F.; investigation, M.L. and A.V.; resources, M.L., G.F, and A.V.; data curation, M.L. and A.V.; writing—original draft preparation, M.L., G.F., and A.V.; writing—review and editing, M.L., G.F., A.V., C.A., C.M.; visualization, G.F. and A.V.; supervision, C.A. C.M.; project administration, M.L. and C.M.; funding acquisition, C.M. All authors have read and agreed to the published version of the manuscript.
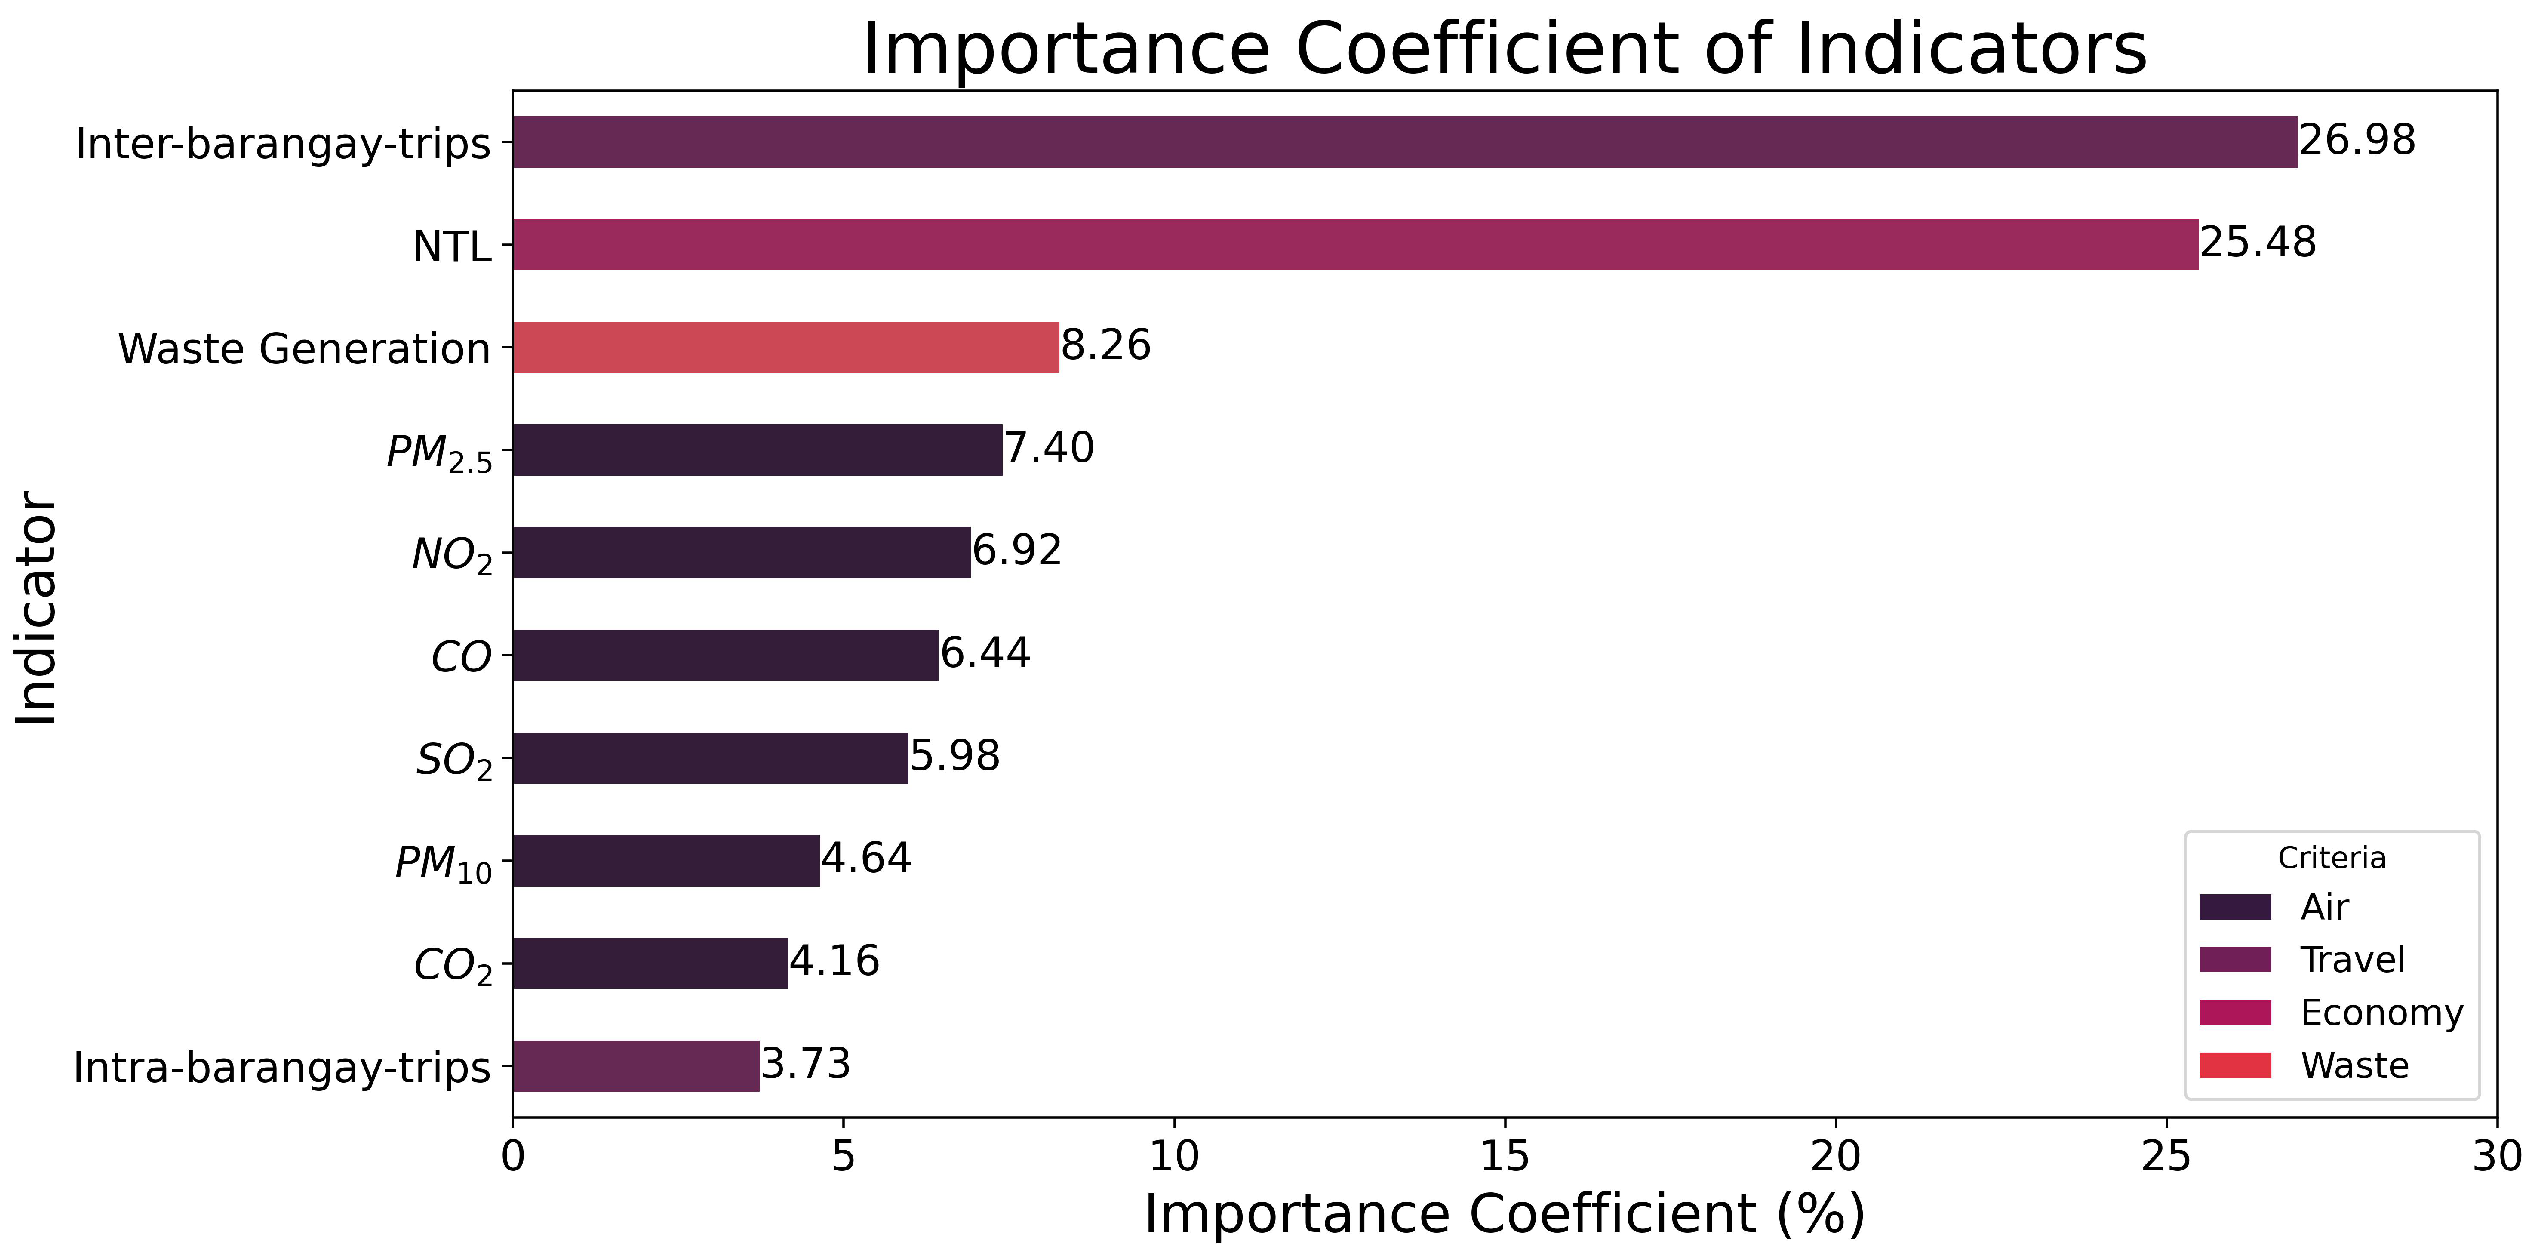
Figure 2.
Importance Coefficient (IC) values of indicators used for assessing the UCCLN of Baguio City. The total IC for all air quality indicators has the greatest IC value, followed by the total IC values for travel indicators and NTL. Lastly, the IC value for waste generation is the smallest.
Figure 2.
Importance Coefficient (IC) values of indicators used for assessing the UCCLN of Baguio City. The total IC for all air quality indicators has the greatest IC value, followed by the total IC values for travel indicators and NTL. Lastly, the IC value for waste generation is the smallest.
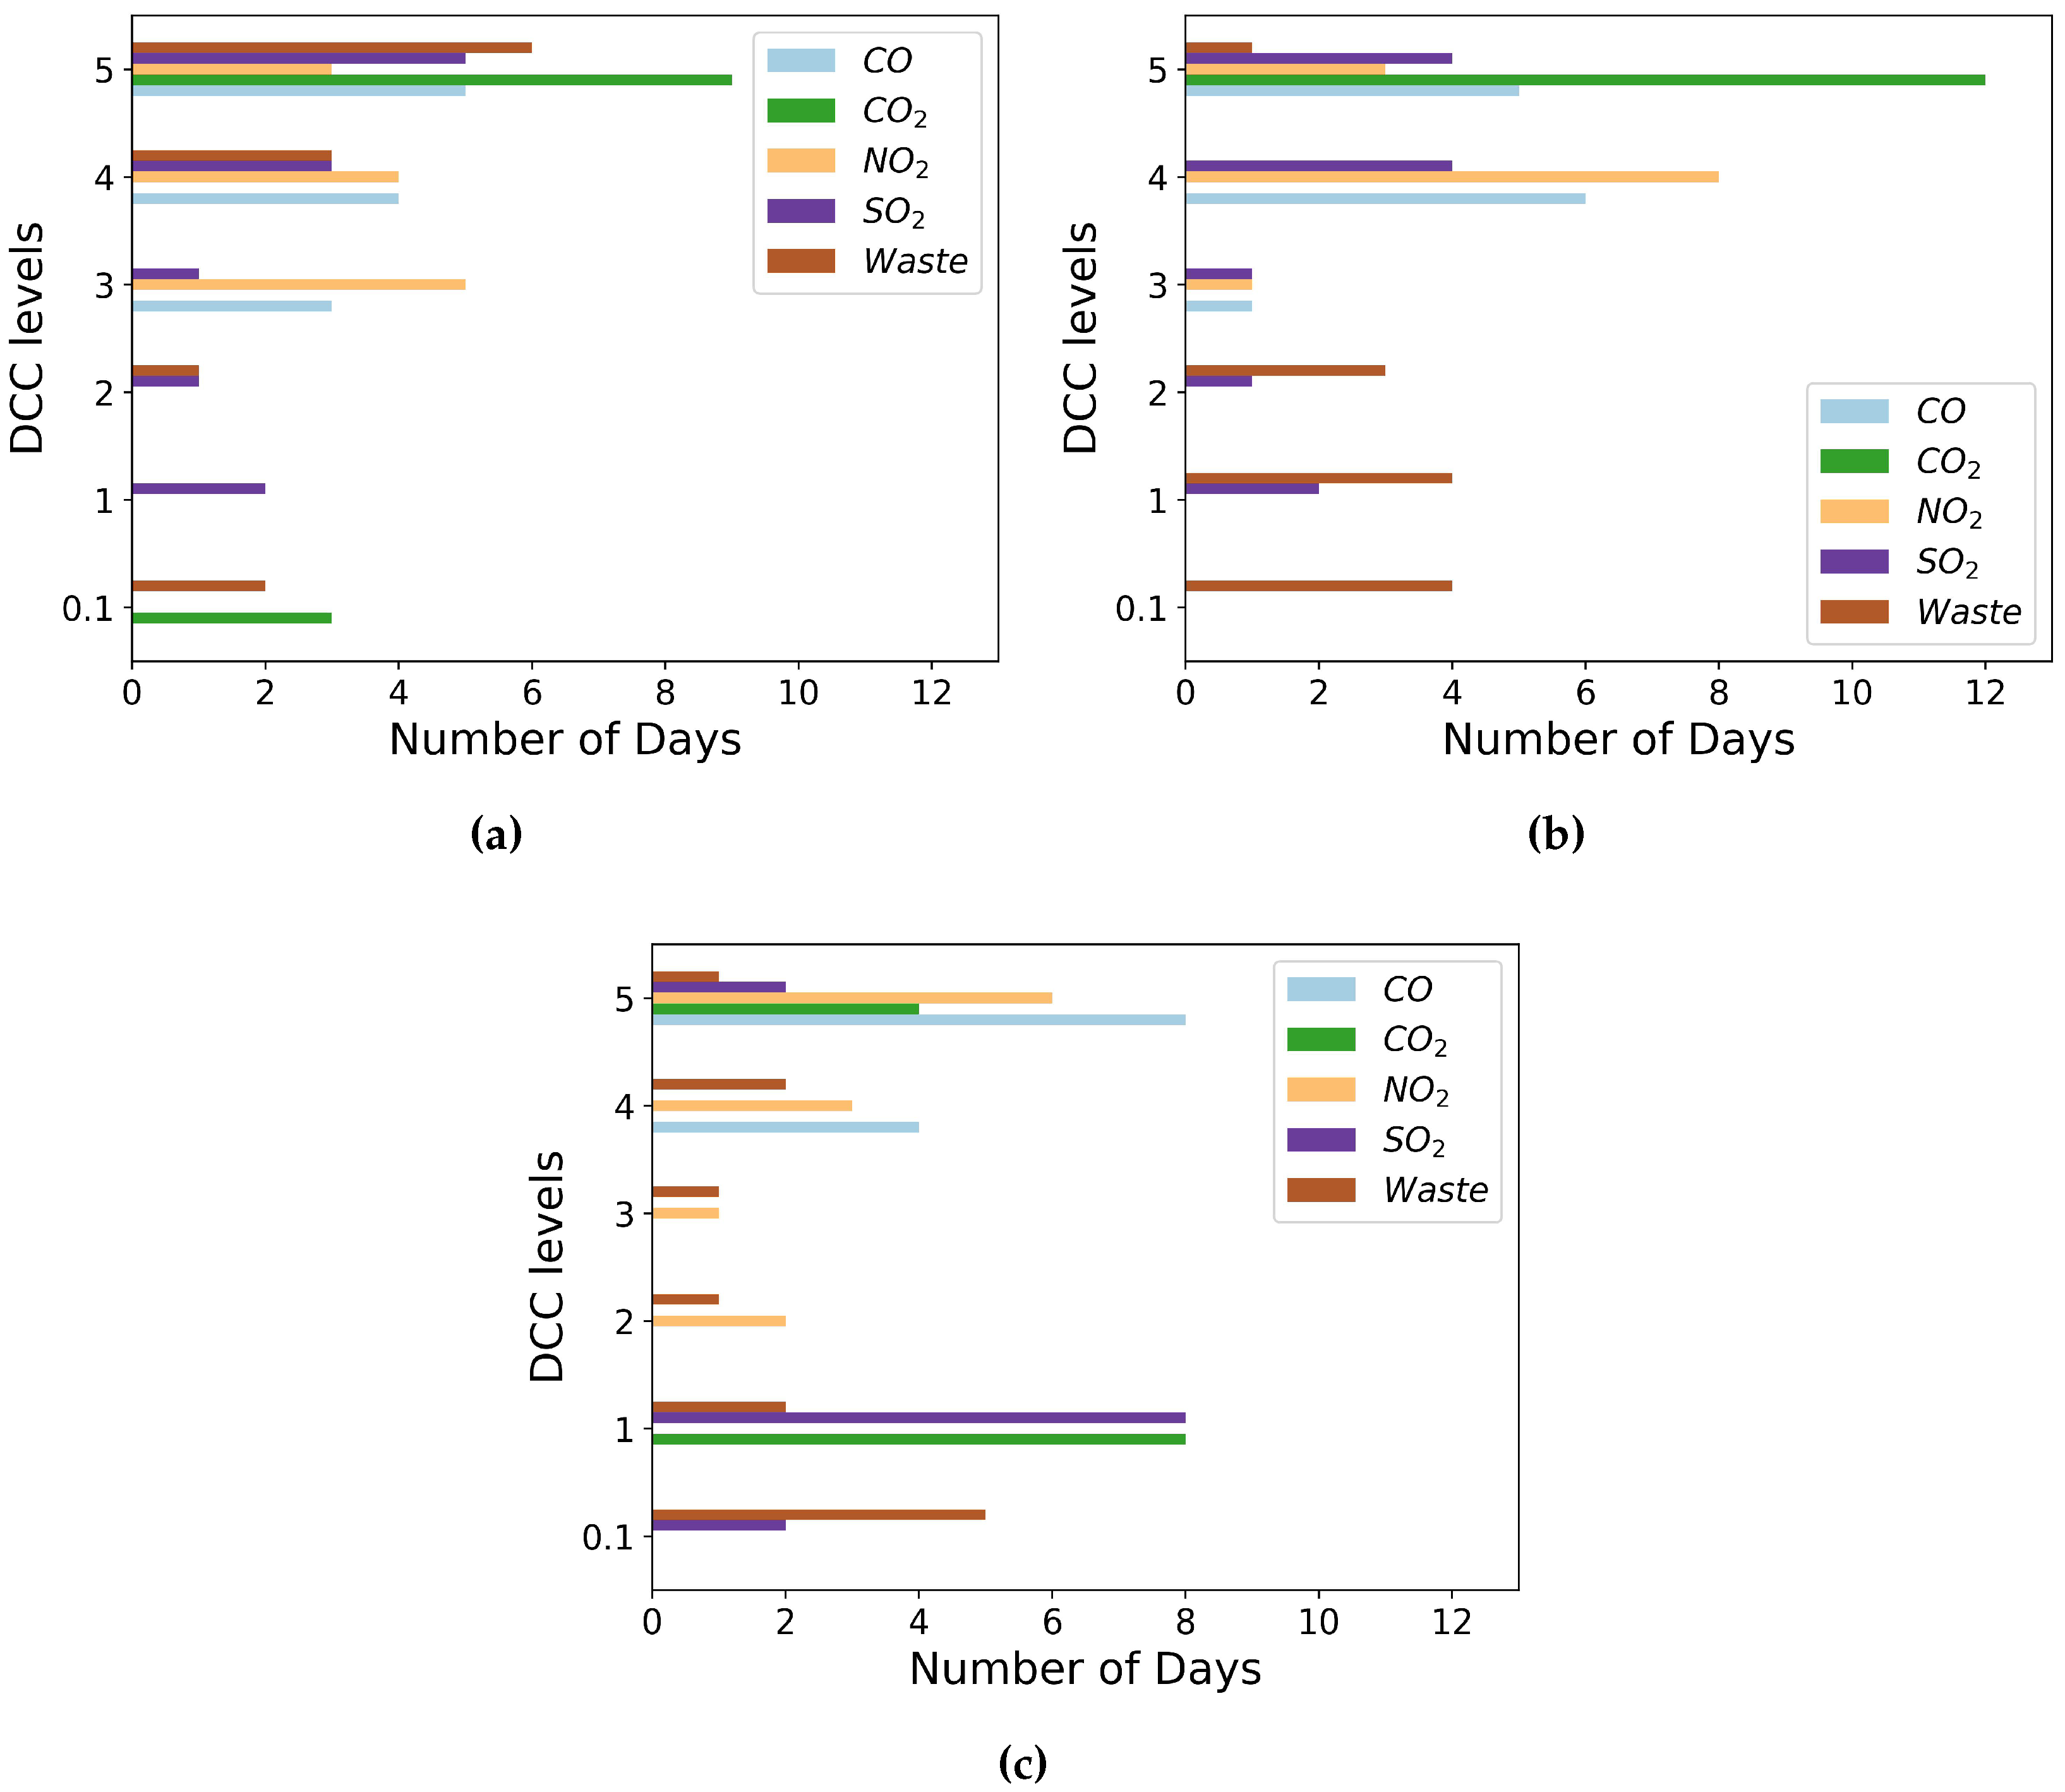
Figure 3.
DCC levels distribution of city-level indicators on (a) regular days, (b) holidays, and (c) days with events. Among the indicators, is at the critical DCC level (level 5) for most days during holidays and even on regular days, albeit for slightly fewer days.
Figure 3.
DCC levels distribution of city-level indicators on (a) regular days, (b) holidays, and (c) days with events. Among the indicators, is at the critical DCC level (level 5) for most days during holidays and even on regular days, albeit for slightly fewer days.
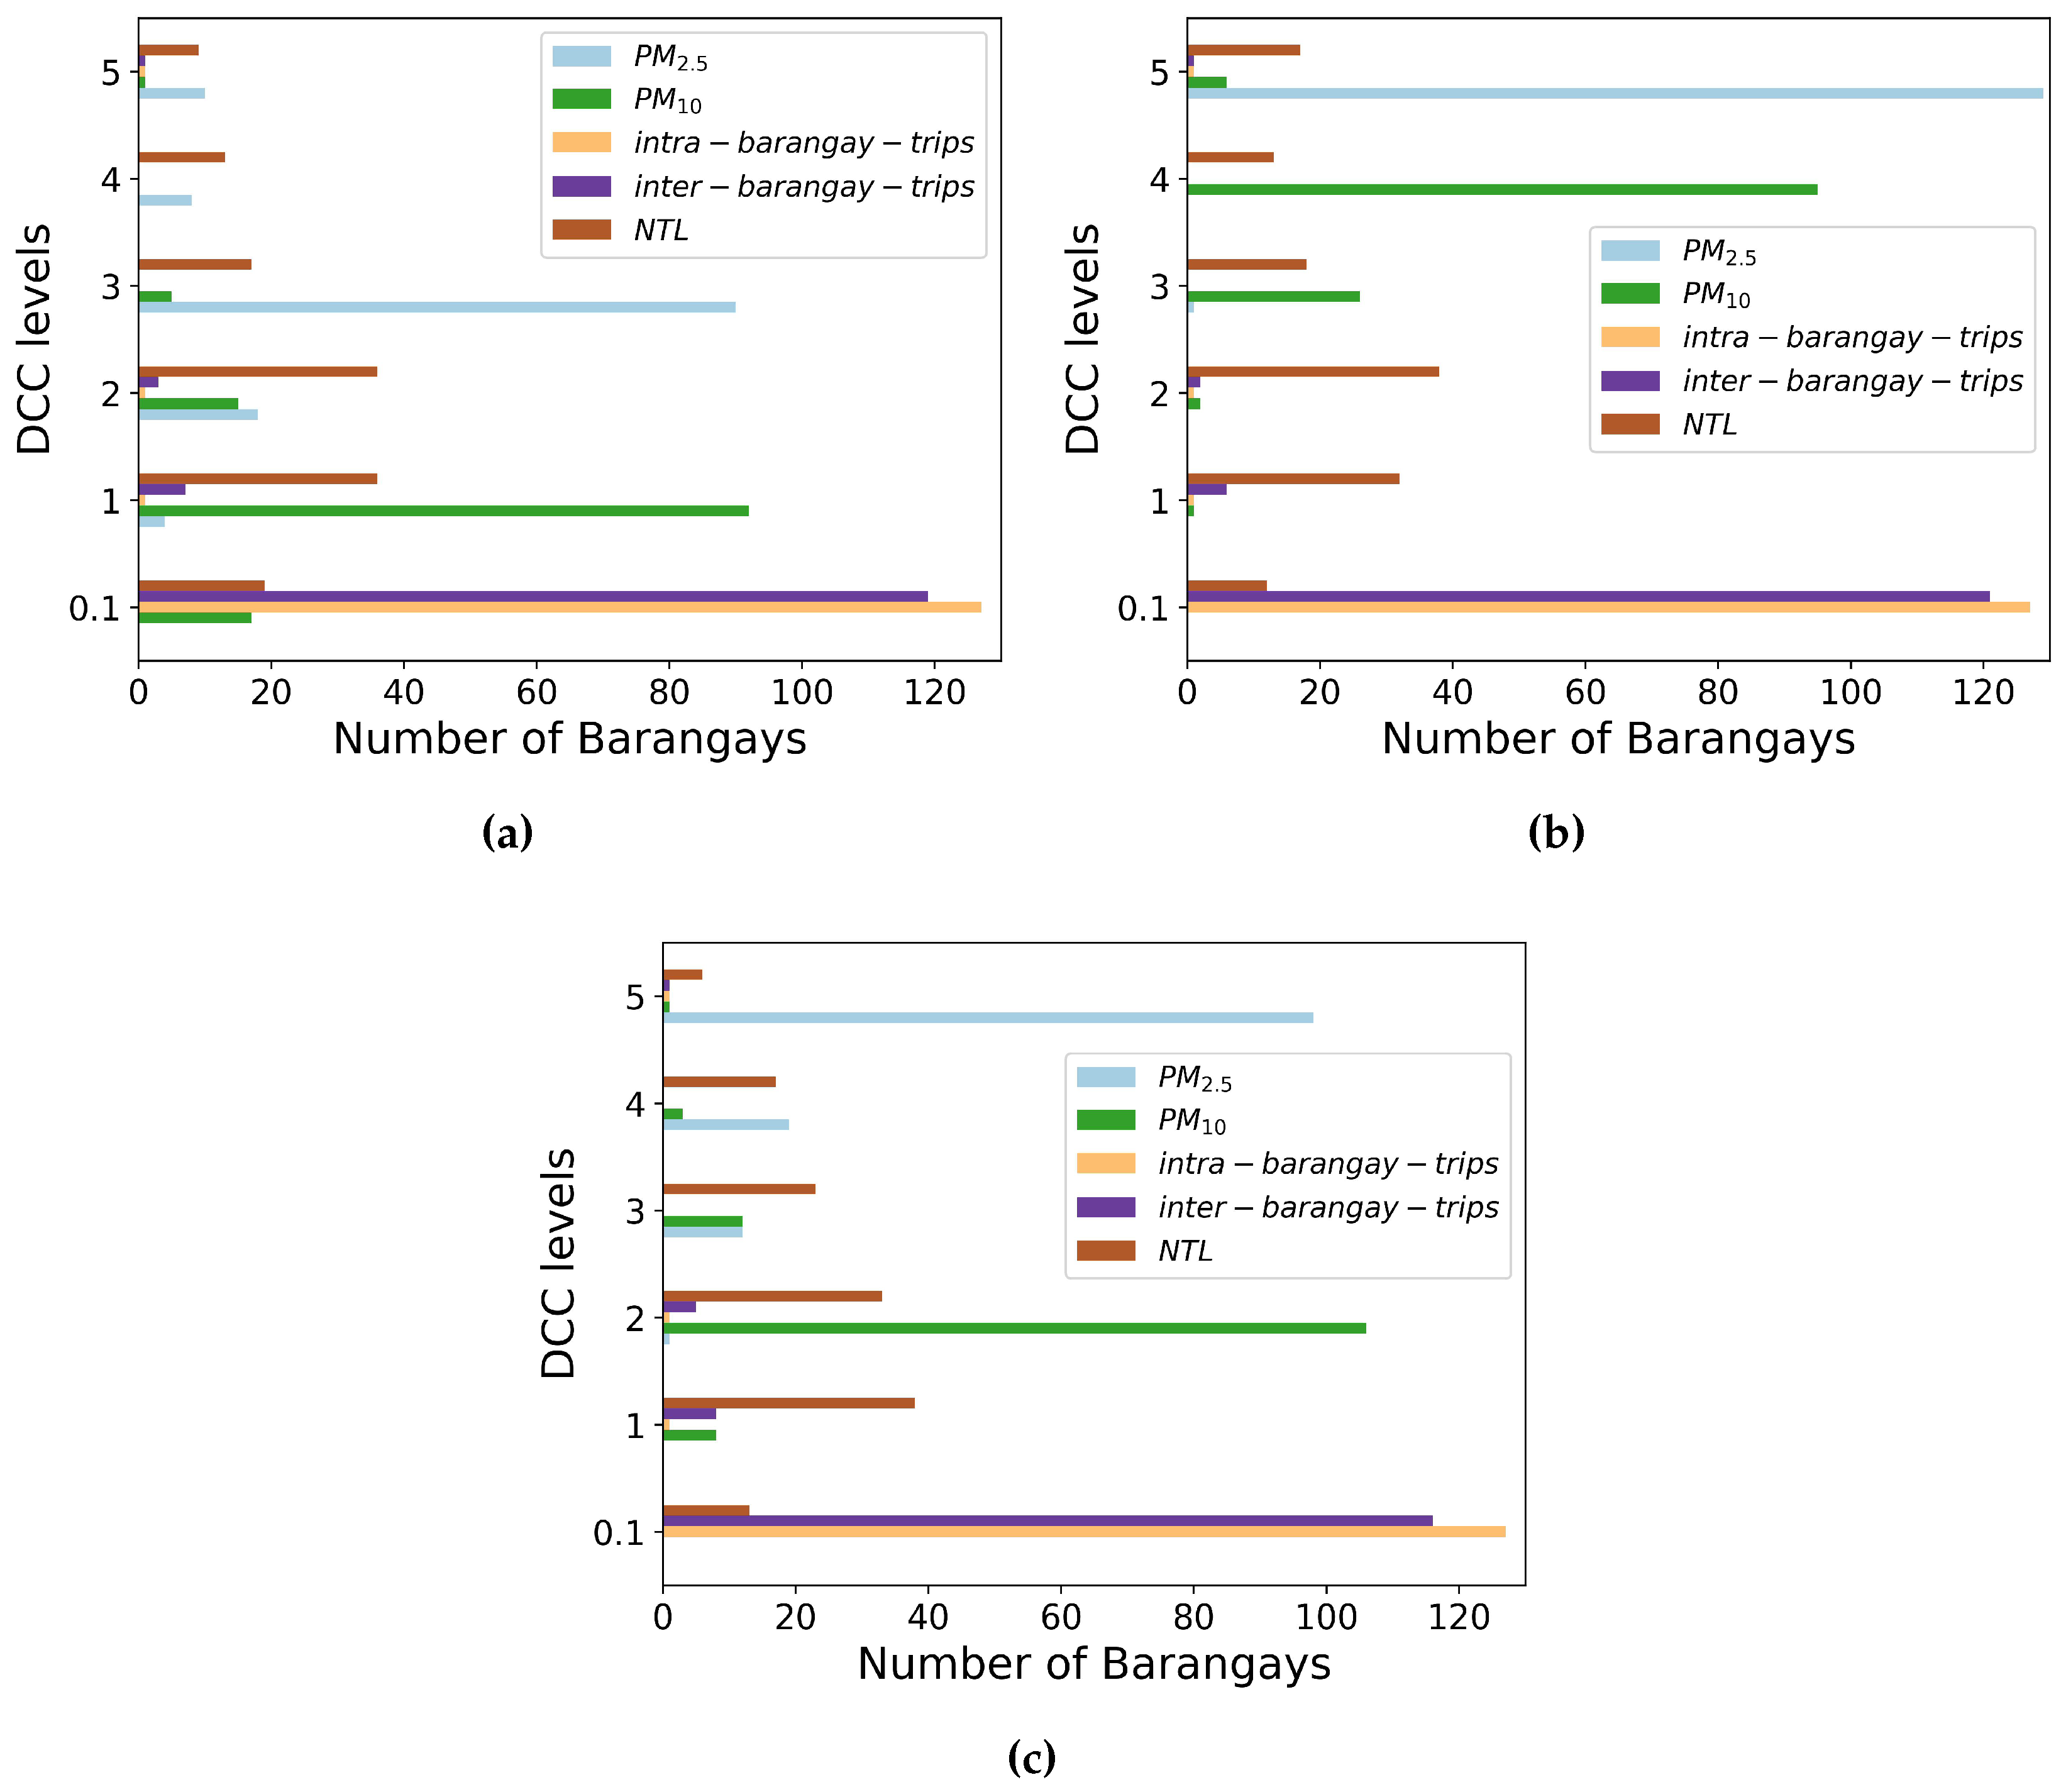
Figure 4.
DCC levels distribution of barangay-level indicators on (a) regular days, (b) holidays, and (c) days with events. While most barangays have increased DCC levels for both and from regular days to holidays and days with events, traffic are consistently at desirable levels.
Figure 4.
DCC levels distribution of barangay-level indicators on (a) regular days, (b) holidays, and (c) days with events. While most barangays have increased DCC levels for both and from regular days to holidays and days with events, traffic are consistently at desirable levels.
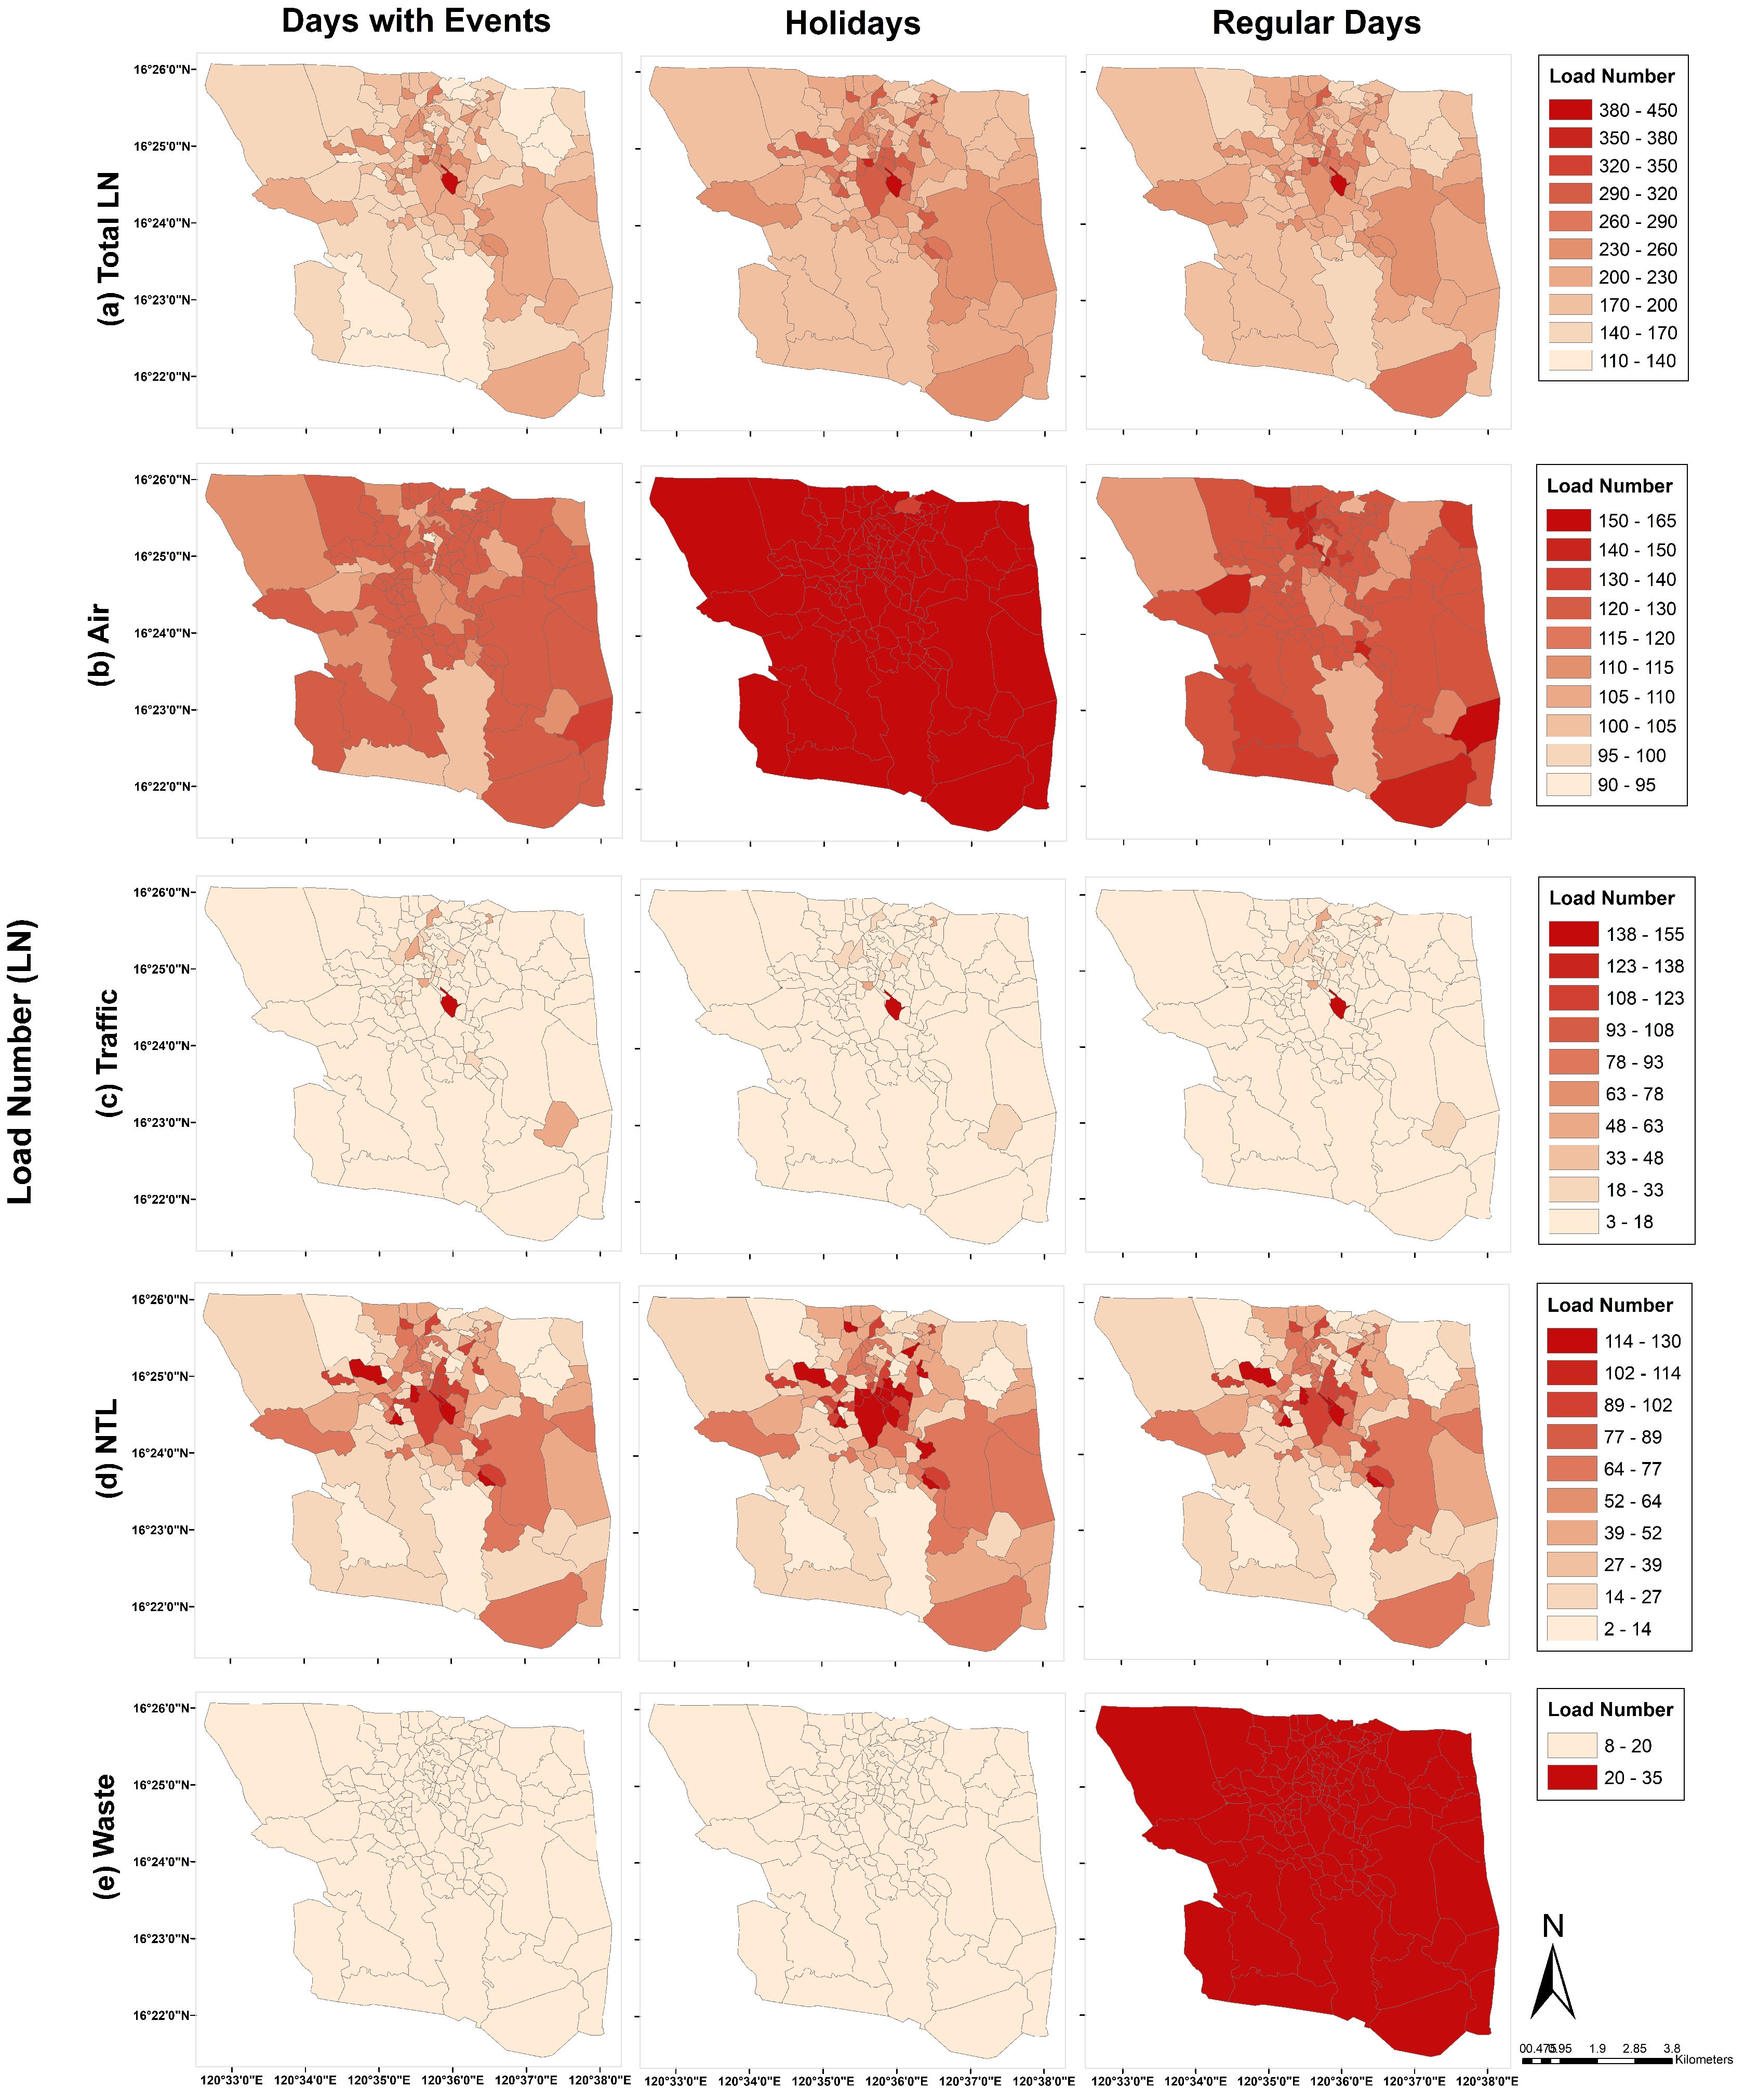
Figure 5.
Visualization of LN levels for all barangays of Baguio City. (a) Total LN map and LN maps for the indicators: (b) air, (c) traffic, (d) NTL, and (e) waste; under different temporal contexts, Days with Events, Holidays, and Regular Days. Higher total LN numbers are found close to the central and eastern regions of the city. Notably, the LN for air is highest on holidays, indicating that the city experiences the worst pollution levels.
Figure 6.
Visualization of the differences in LN levels for (a) Total LN, (b) air, (c) traffic, (d) NTL, and (e) waste, between different temporal contexts
Regular Days - Events,
Regular Days -Holidays, and
Events - Holidays. A positive difference in brown indicates that the impact is greater in the first temporal context in the comparison, while a negative difference in green indicates otherwise. The differences highlight which
barangays suffer from increased LN or worse impacts for each indicator and captured actual observations on the ground (e.g. the worsened pollution level at the main gateway of Baguio City (Camp 7 in
Figure 1) on holidays.
Table 1.
Different criteria with their corresponding indices that were considered for the Load Number (LN) calculation. Due to data availability, the spatial granularity is either at barangay-level or city-level.
Table 1.
Different criteria with their corresponding indices that were considered for the Load Number (LN) calculation. Due to data availability, the spatial granularity is either at barangay-level or city-level.
| Criteria |
Indices |
Spatial Granularity |
| Air Quality |
, , CO, , ,
|
Barangay-, City-level
|
| Traffic |
Intra-barangay trips, Inter-barangay trips |
Barangay-level
|
| Economy |
NTL (GDP) |
Barangay-level
|
| Waste |
Waste generation |
City-level |
Table 2.
List of dates used for the different temporal context variations, based on the actual happening in Baguio City.
Table 2.
List of dates used for the different temporal context variations, based on the actual happening in Baguio City.
| Regular days |
Holidays |
Days with events |
| January 13 |
April 2 |
January 22 |
| January 14 |
April 3 |
January 27 |
| January 15 |
April 4 |
January 29 |
| January 16 |
April 5 |
March 6 |
| January 17 |
April 6 |
March 13 |
| January 18 |
April 7 |
March 20 |
| January 19 |
April 8 |
March 24 |
| June 19 |
April 9 |
March 25 |
| June 20 |
April 10 |
March 26 |
| June 21 |
December 23, 2022 |
March 27 |
| June 22 |
December 24, 2022 |
September 8 |
| June 23 |
December 25, 2022 |
September 9 |
Table 3.
Comparison matrix for the AHP indicator in the study.
Table 3.
Comparison matrix for the AHP indicator in the study.
| Criteria/Sub-criteria |
Indicator A |
Indicator B |
... |
Indicator Z |
Priority Vector |
| Indicator A |
|
|
|
|
|
| Indicator B |
|
|
|
|
|
| ⋮ |
|
|
|
|
|
| Indicator Z |
|
|
|
|
|
Table 4.
AHP scoring values and their corresponding description based on Tehrani et al. (2023) [
1]
Table 4.
AHP scoring values and their corresponding description based on Tehrani et al. (2023) [
1]
| Relative Importance |
Equal importance |
Somewhat more important |
Definitely more important |
Much more important |
Very much important |
| Value |
1 |
3 |
5 |
7 |
9 |
Table 6.
Ratio of barangays with critical LN. The air quality of almost the whole city is at critical state on holidays. However, the more barangays at desirable levels at the same time, balances it.
Table 6.
Ratio of barangays with critical LN. The air quality of almost the whole city is at critical state on holidays. However, the more barangays at desirable levels at the same time, balances it.
| Criteria |
Regular |
Events |
Holidays |
| Air |
3.85% |
12.31% |
99.23% |
| Traffic |
0.7% |
0.7% |
0.7% |
| Economy |
14.61% |
10.0% |
9.23% |
| Waste |
no spatial information available |
|
|

