1. Introduction
A time series is a type of dataset that offers valuable data about an entity based on different factors over different time intervals. Most importantly, it gives valuable insights regarding factors that impact a certain entity from time to time. It includes sequential observations that can be used to monitor processes or track performance metrics in many other fields. A time series is merely a series of points that are calculated at different times but can also be used to identify market trends and predict possible future occurrences. Time series datasets could contain hourly, daily, weekly, monthly, or yearly information but are differentiated based on the components. There are four components in a time series: trends, seasonal variations, cyclic variations, and irregular movements. Trends include the data representing movement along the term. Seasonal data provides information about seasonal trends, which represent seasonal changes. Cyclic variations mean continuous variation. Random variations showcase random sources of variation that can be seen in a dataset.
However, time series analysis is a statistical technique that uses collected data to devise solutions, make predictions, and classify things. For time series analysis, time is the most important factor. Trends, changes, and predictions are made by analyzing the data outcomes. Time series analysis not only provides surfacing results but also uses the data values to help us understand the underlying causes of the trends happening.
Time series forecasting is a subdomain of time series analysis that is use to have a complete make future predictions. There is no any specific predictions it could be able to done anything. All of these predictions help us in decision-making, analyzing future requirements, making adjustments accordingly, preparing for the unseen, and helping us in imagining what comes ahead. Time series forecasting could be done through modern models leveraging artificial intelligence. Firstly, we have to train these models, and then it will provide us with predictions on the basis of variables and the type of data that we are targeting. These models are available in different coding frameworks, like Python and R. However, Python is the most significant framework used to deploy many AI-based models. In this paper, we are using Python libraries to make the prediction model. Python has plenty of models for regression problems, but we are using the three most dominant models for building the model.
The three models used in this paper are SARIMA, the neural prophet model, and the FB prophet model. SARIMA (Seasonal autoregressive integrated moving average) is a prediction-based AI model that is capable of integrating both exogenous variables and endogenous variables. Exogenous variables are analyzed as independent time series; they include external factors that can help make our models more reliable. Although endogenous are the dependent factors, in this paper, the precision value itself is an endogenous factor dependent on many factors. On the other hand, neural prophet and Facebook prophet models are developed by the Facebook team to handle larger datasets and use them for training. These models are available to use and are present in the Pytorch library. It is a powerful tool to manage complex datasets and get insights from complex sets of information. There is only one difference between these two models: their methods of learning through information. By prosecuting interconnected layers, the neural prophet analyzes the data, and the FB prophet utilizes a traditional statistical approach.
This methodology used for model building follows a five-step model-building methodology that includes data preprocessing, model structure defining, Model training, Model Evaluation, and Model tuning. When the model is created, we use evaluation metrics such as loss functions, accuracy, precision, recall, or F1 scoring to evaluate the functioning of the model. Subsequently, once the results are obtained, model parameters can be adjusted to optimize the functioning of the prediction model. The evaluation parameters indicated that each has its own specifications. SARIMA provides reliable results when the datasets contain various seasonality trends. In our dataset, we have obvious dataset information; that’s why SARIMA works perfectly in terms of reliability. The composed model performs exceptionally well when it’s trained on Prophet Models. Overall, SARIMA is reliable, given the prediction values, while pointing out inconsistent errors. Although the Prophets Model evaluation parameters showcase good results, they are not as reliable as the SARIMA models. The observation from this paper helps us identify suitable models with the help of different scenarios and utilizing time series forecasting for different domains of stock market prediction and beyond.
2. Literature Review
Form the past two decades, time series forecasting has experienced more significant advancements. With the advent of big data analysis, time series forecasting is the best possibility whenever there is a problem related to data [
24]. Deep neural networks (DNNs) are versatile approaches that are helpful for deep neural networks (DNNs) to adopt versatile approaches and find applications in various fields such as prediction, detection, and creation. With the comparison of traditional machine learning models, DNNs can provide more accurate forecasts. In real-world problem-solving, shallow neural networks may require significant complexity to achieve optimal predictions, whereas DNNs have been suggested as a means of developing more effective predictive models [
23].
Time series data consist of a sequence of values measured over time intervals. The method used to get results from such data is called time series analysis [
1]. The main objective is to extract valuable analysis from the available data and then utilize these insights to analyze an AI model. Time series forecasting is a popular technique in which certain predictions are made by a model when a trained model is used to extract information. Mostly, this popular technique is used to solve prediction-based problems [
2]. A deep neural network or in a machine learning model implemented by time series forecasting. However, these two methods exhibit outstanding performance and precision.
Deep learning-based forecasting models have gained popularity due to their power and ability to achieve high accuracy across a diverse range of application fields. Deep learning has been proven to be the most useful method to derive results from big data nowadays [
15]. There was research conducted in April 2021 to analyze the efficiency of deep learning models, in which 1, 3, and 5 layer-based neural network models were evaluated and the outcomes that were calculated based on the MSE score, with the help of the three models' MSE avg values are 0.98 for the 1 and 3-layered models and 0.96 for the 5-layered models. These values indicate the efficiency of the neural networks [
16].
Deep learning has also emerged and gained popularity for raising stock price prediction models. Using the stock price for the growth of a company plays a crucial role in increasing the interest of speculators in investing their money in the company. Due to this, stock price prediction has become a targeted problem for researchers. That’s why they have built several machine learning and deep learning models to predict the stock price [
19,
20,
21]. Several models were attested, and deep learning-based models were able to produce more accurate results than machine learning models [
22]. The most commonly attested deep learning models are the LSTM, ARIMAS, and prophet models.
The most recommended model for time series forecasting is SARIMA. It is derived from the LSTM model, which supports univariate entries that come with seasonal components [
3]. We used seasonality information in our data, and using this model was quite a great decision. In the past, SARIMA models have been used in many time series forecasting problems and consistently provide exceptionally good results in this domain [
4,
5,
6]. It is perfectly fitting when the features of the data have seasonal behaviors. Although, by separating all of the seasonal behaviors, SARIMA has separate polynomials to get each value. With the use of external feature values, SARIMA models also come with exogenous values that help to improve forecasting [
7].
There is an open-source library available on the internet that is the Facebook Prophet Model, devised by Facebook. This model is very popular for accuracy showcasing and the seasonality trends that are present in datasets [
11]. However, Facebook models are used for an analyst-in-the-loop approach, which means that analysis could apply to their domain knowledge even if they could not easily understand the statistical methods. This approach is a blend of statistical forecasting and traditional human forecasting [
12]. The Facebook Prophet model is used to forecast sales using real-world data, and this model was able to generate an accurate forecast regarding sales [
13]. Although the Facebook prophet model has also been used in COVID case forecasting [
7,
14].
The following model is utilized: the neural prophet model, which builds upon the progress of the Facebook prophet model. It is basically the same as a hybrid framework model, which depends on Pytorch. It likewise gives full automation and permits users to change and tune the given dataset appropriately [
8]. The neural prophet model is very popular for its hybrid framework, and it is also used to solve several problems. In 2023, the neural prophet was utilized (alongside different models) to assess the outbreak of the Monkeypox virus in the US. The Neural Prophet model performed well in the wide range of various models as far as prediction of the data [
9]. The neural prophet gives exceptionally exact outcomes when it is utilized in the LSTM hybrid model. By utilizing this model, the forecasting of the electrical burden was done effectively, and it gave high accuracy values [
10]. And afterward, each model works appropriately in its specific domains.
Evaluating a model is a crucial stage to estimating the future values needed to build a model, and choosing the right parameters for evaluation depends on the type of dataset used. However, general terms like MSE, F1 score, and accuracy remain the same [
18]. There are multiple parameters that help us estimate the performance of a particular model. One of the best ways to evaluate a model is by using a holdout procedure, meaning testing the model using out-of-sample data. However, another approach that is highly recommended for testing the performance of the forecasting model is cross-validation [
17].
3. Methodology
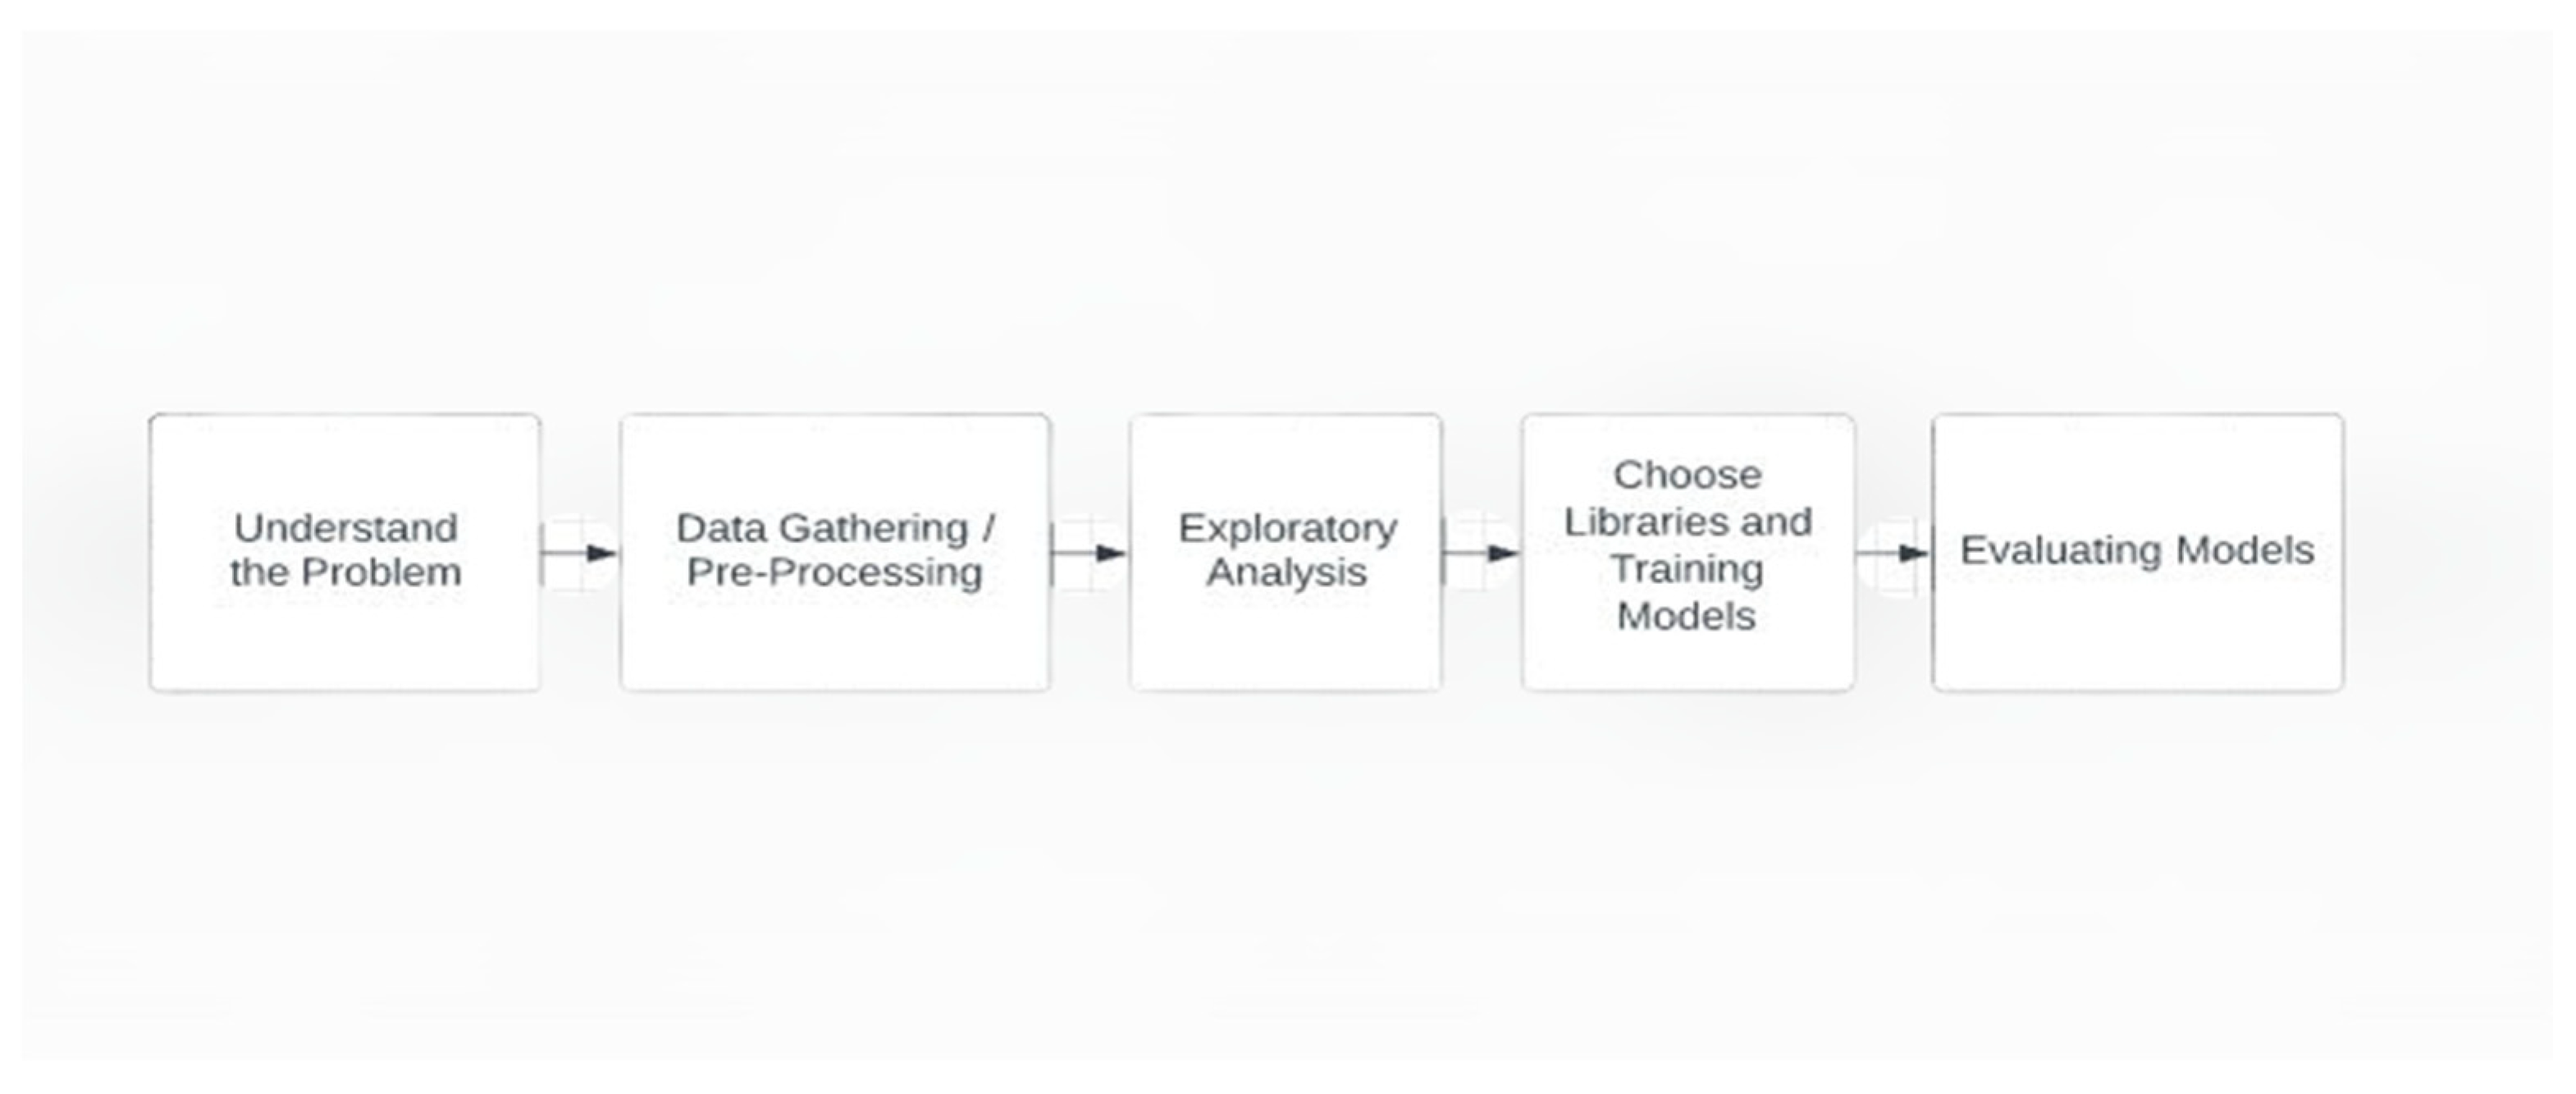
In this paper, three distinct Python models are utilized to precut the stock value. These models are independently prepared on accessible datasets, yet they are utilized in the same general approach. An overall strategy for preparing a model incorporates five stages: understanding the problem, data pre-processing, exploratory analysis, training the models (three models are trained separately), and evaluation of models using evaluating parameters like MSE, RMSE, MAE, MdAPE, etc. There is
Figure 1 that describe general methodology that will be used:
3.1. Understanding the problem statement
In the real world, there are a lot of problems in the life of every human, and they are constantly trying to resolve them and find great solutions for them. Having a solution to every problem exists, but grasping the true concept behind every problem and comprehending a solution while keeping in view the broader prospect is important. By doing this, it is necessary to understand the nature of the problem. In this paper, we address the solution to the time series forecasting problem in which proper prediction is required. A proposed solution is a deep learning model that can predict future stock market values for the Saudi Exchange.
3.2. Data gathering/ Data pre-processing
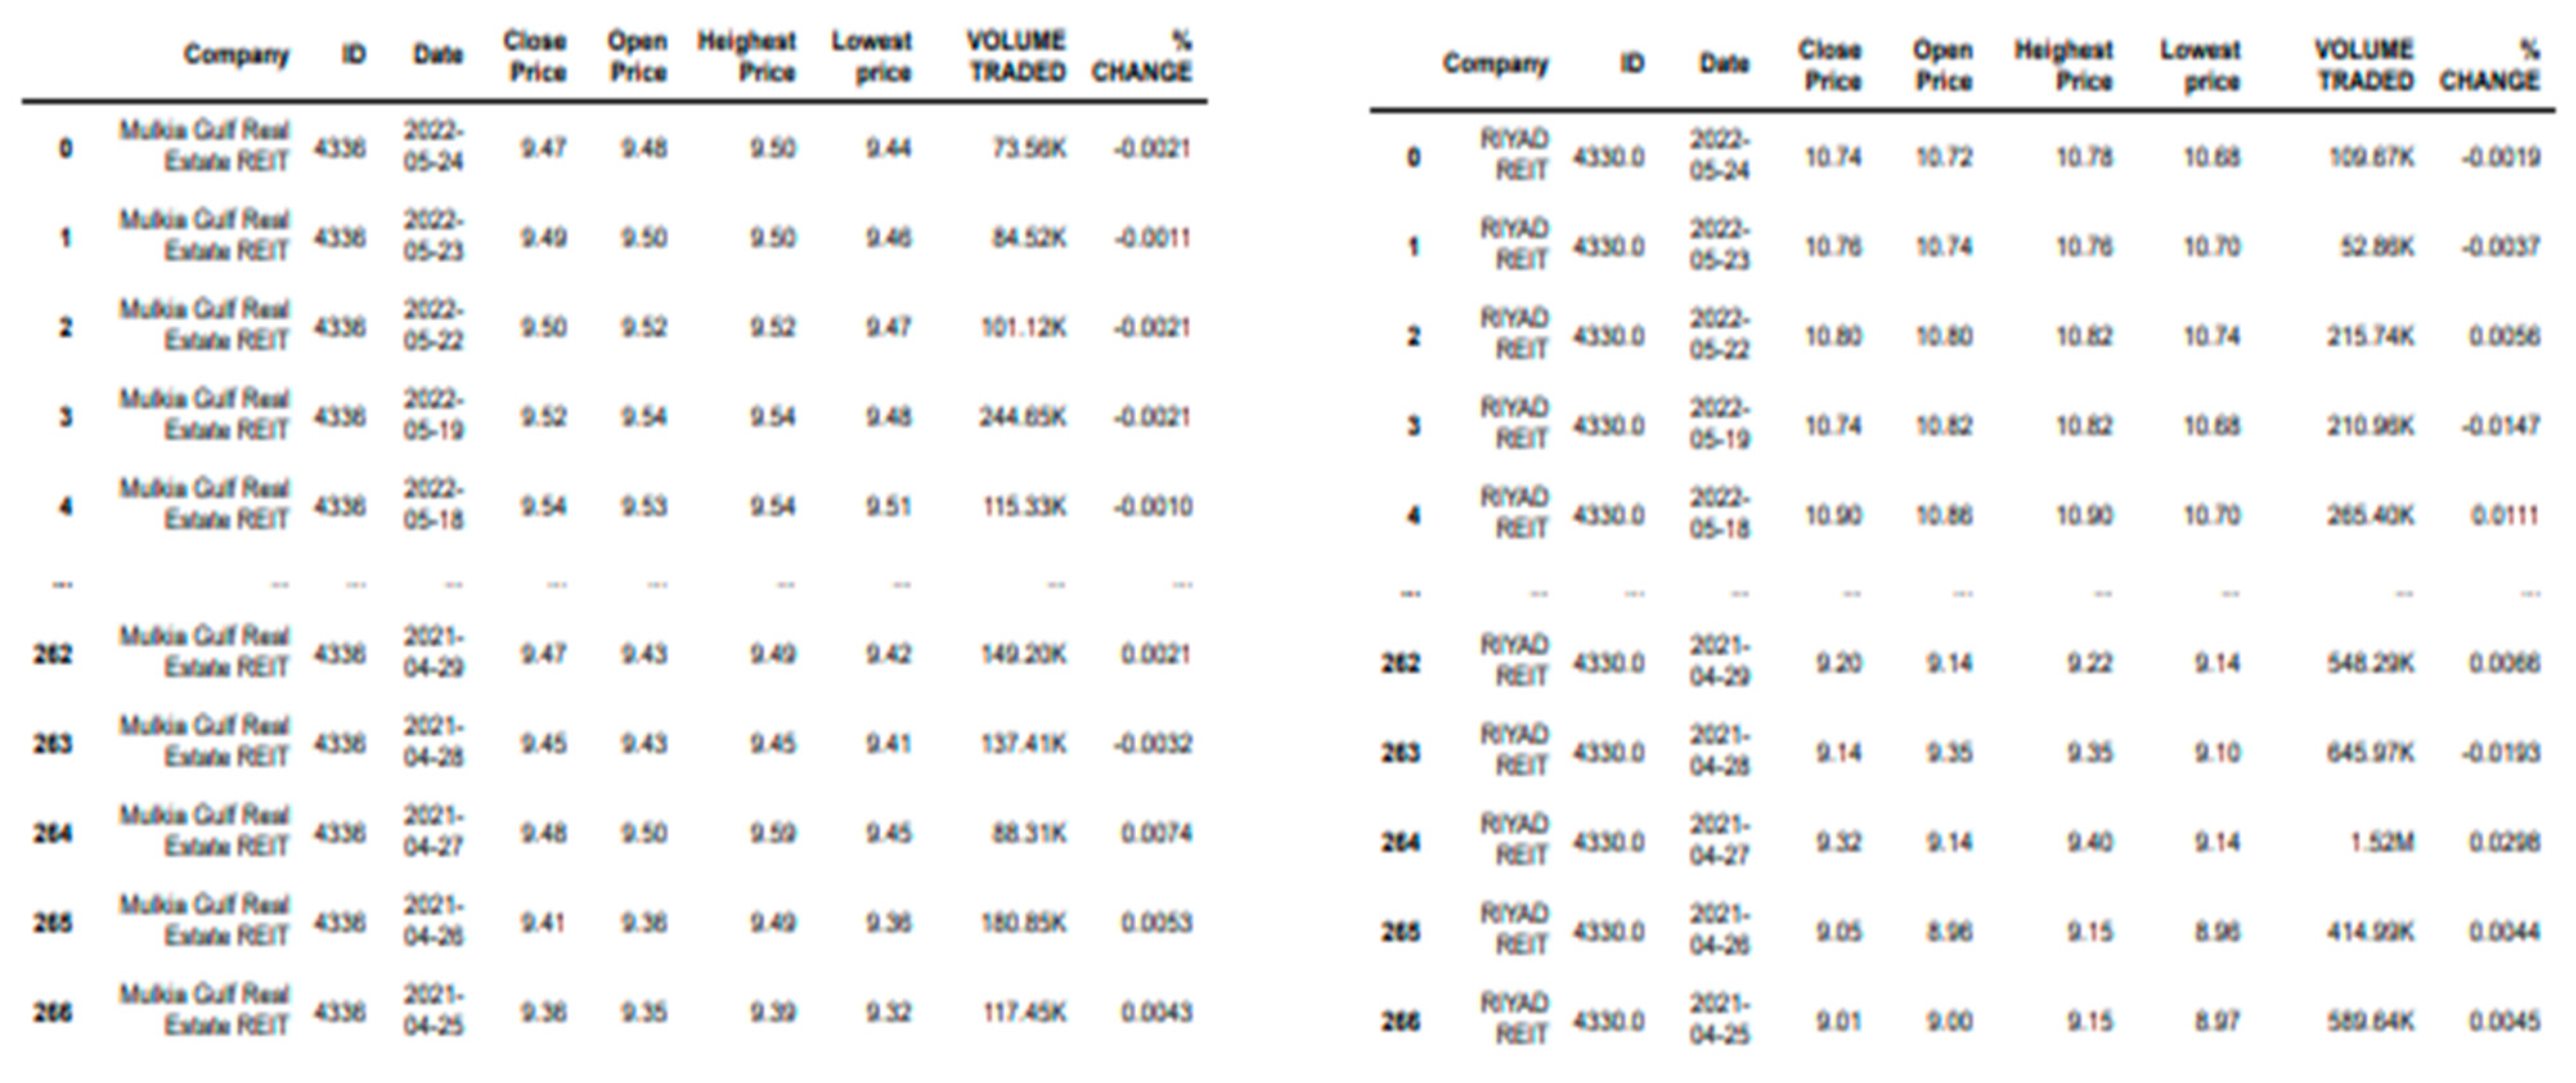
The data is in the form of Mulkia Gulf Real Estate, which contains information about the stock prophets. However, the data is extremely large, so there are two sheets of data, Sheet 1 and Sheet 7, which are selected to be used in building the models. This model has cross-functional data that is used before the training and is also pre-processed for splitting and encoding. There are data sheets 1 and 7 shown in
Figure 2.
3.3. Exploratory Analysis
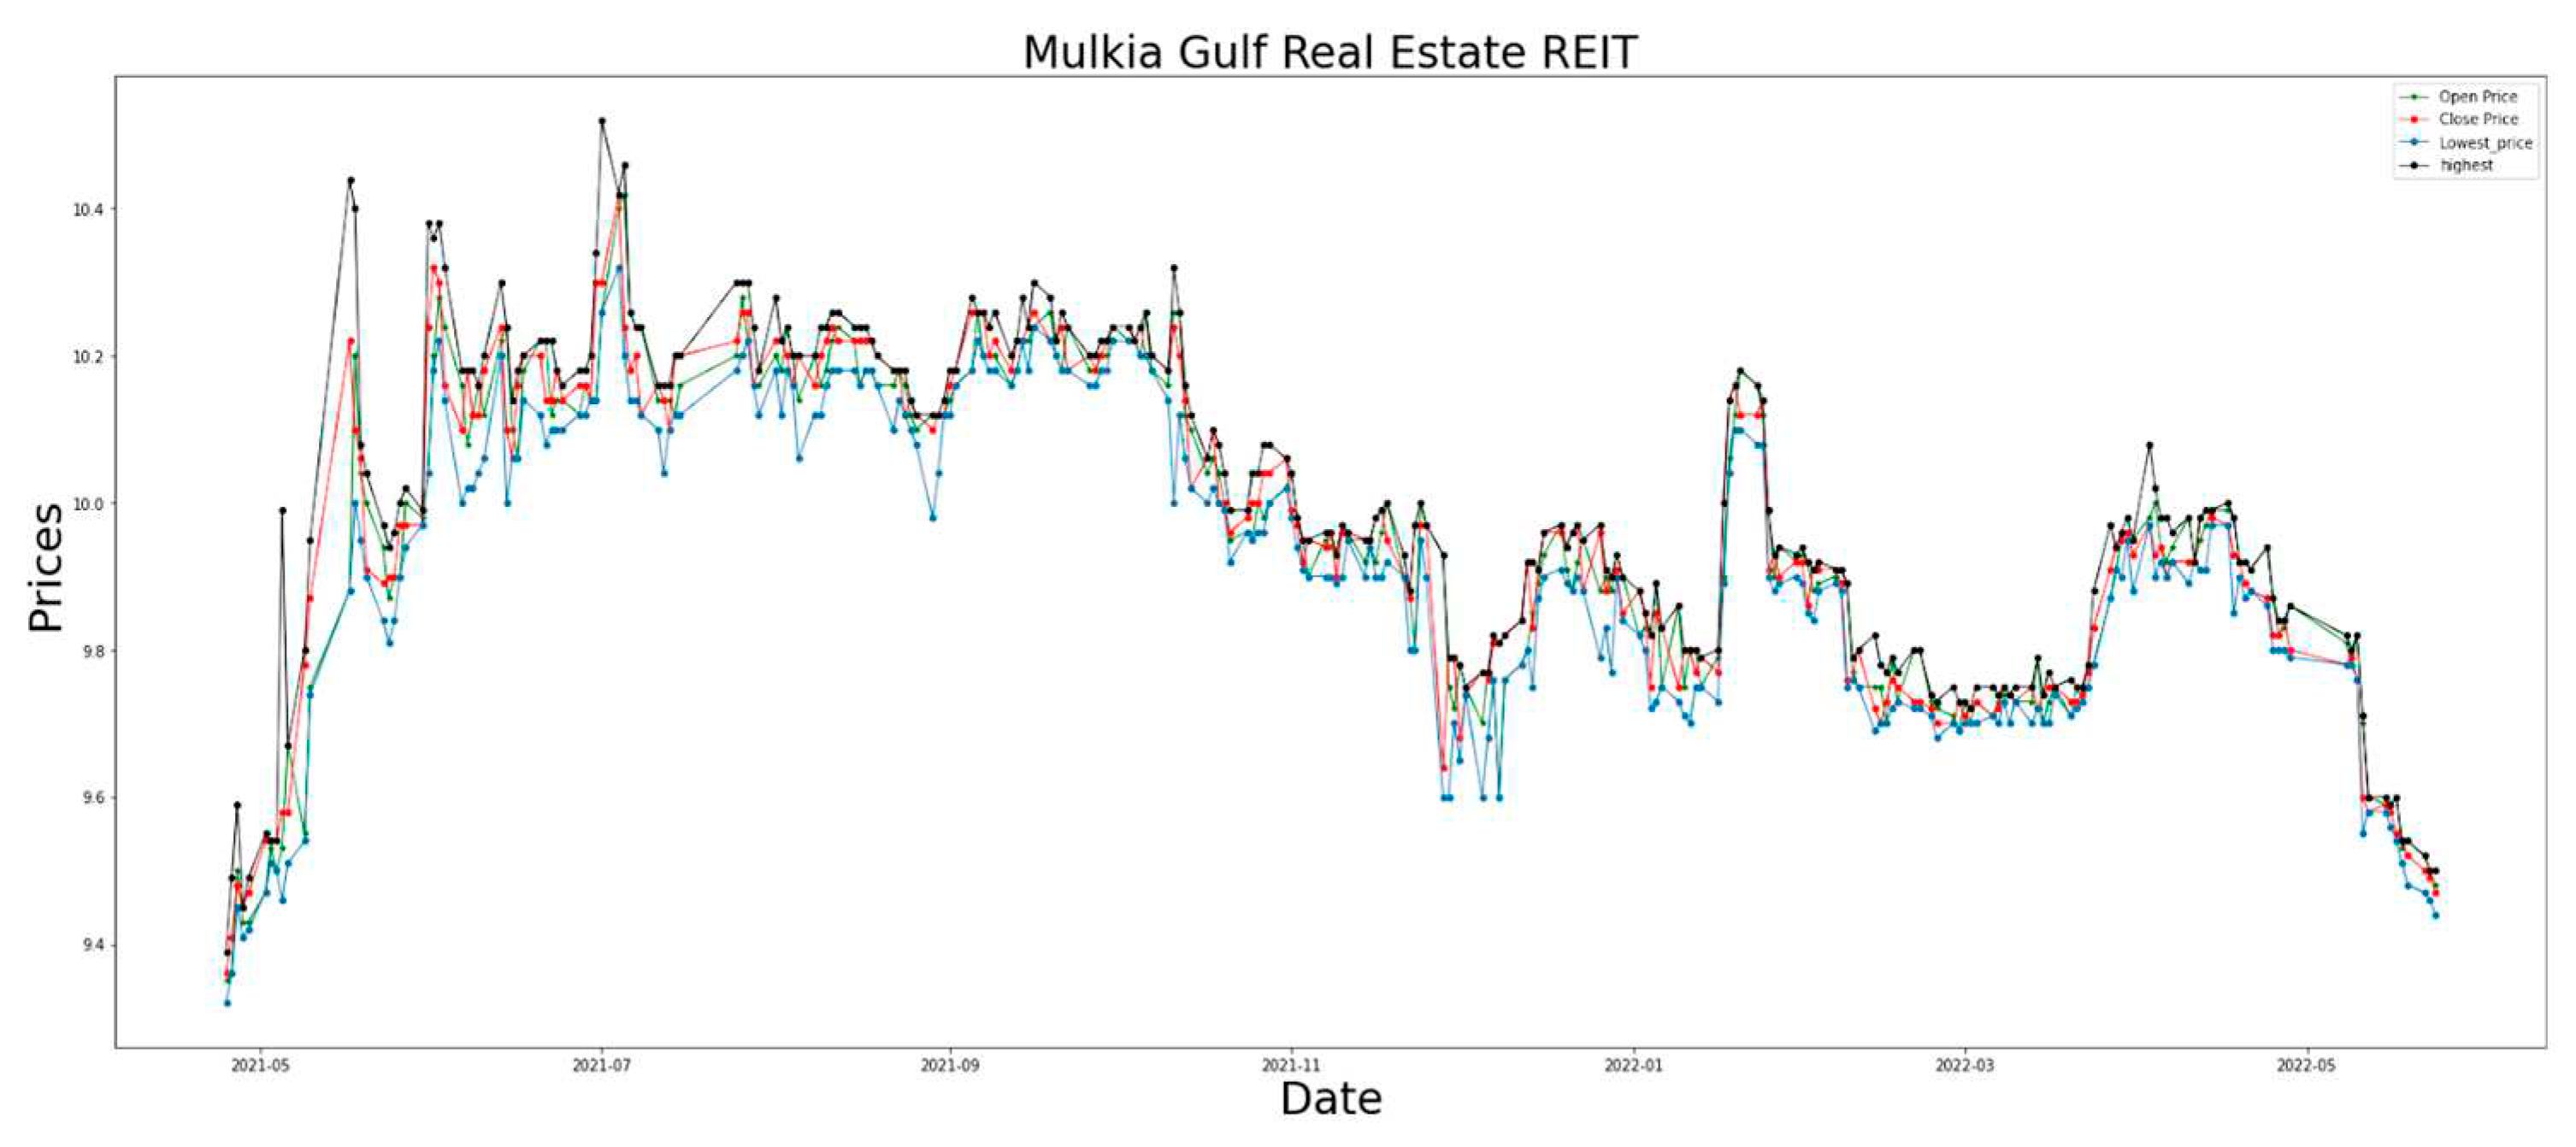
While building a model, firstly, it is mandatory to explore the data, which is called a preliminary analysis of data, where you can plot the data in its original form to find certain structures. With the help of this, we can check the validity of measures, point out any outliers, examine the weightage of different variables, evaluate the effectiveness of certain manipulative variables, etc. there is Adfuller is an in-built Python library to draw the best conclusions from the data when it’s in raw form. The plot indicates an obvious trend that is happening because of certain variables shown in
Figure 3 that provide data and are structured.
3.4. Training Models
As depicted before, Python contains many in-built training models for estimating issues. In this paper, the recommended models to be utilized are SARIMA, Brain Prophet, and FbProphet. These models are now present in Python and are applied to the two arrangements of information (Sheets 1 and 7). The training dataset is utilized to prepare these models independently on both datasets. After training, the result values given by the prepared models are assessed utilizing the score values.
3.4.1. SARIMA (Seasonal Auto-regressive Integrated Moving Average)
The primary model utilized is SARIMAX. Just like ARIMA, SARIMAX additionally estimates fleeting conditions, but it includes seasonality in the forecast. The estimation of SARIMA boundaries is equivalent to ARIMA. Just an added substance variable 𝘮 is added to address the seasonal lags, it very well may be yearly or six months. We compose write the AR, I, and MA parameters for SARIMA as (p,d,q)𝘮. The mathematics behind is especially like ARIMA which works out AR and MA values for integration I. All of these variables are determined by utilizing Eq. (1) and (2):
Forecast is finished by these orders alongside m. A few standard significations are utilized to address the above three, i.e., p, d, and q; "p" is the quantity of perceptions remembered for the model, "d" is the times separating the raw observations, and "q" is the quantity of moving average sizes.
To find these parameters Connection and partial correlational graphs
Figure 4 displays autocorrelation and partial correlational graphs are gotten from our dataset.
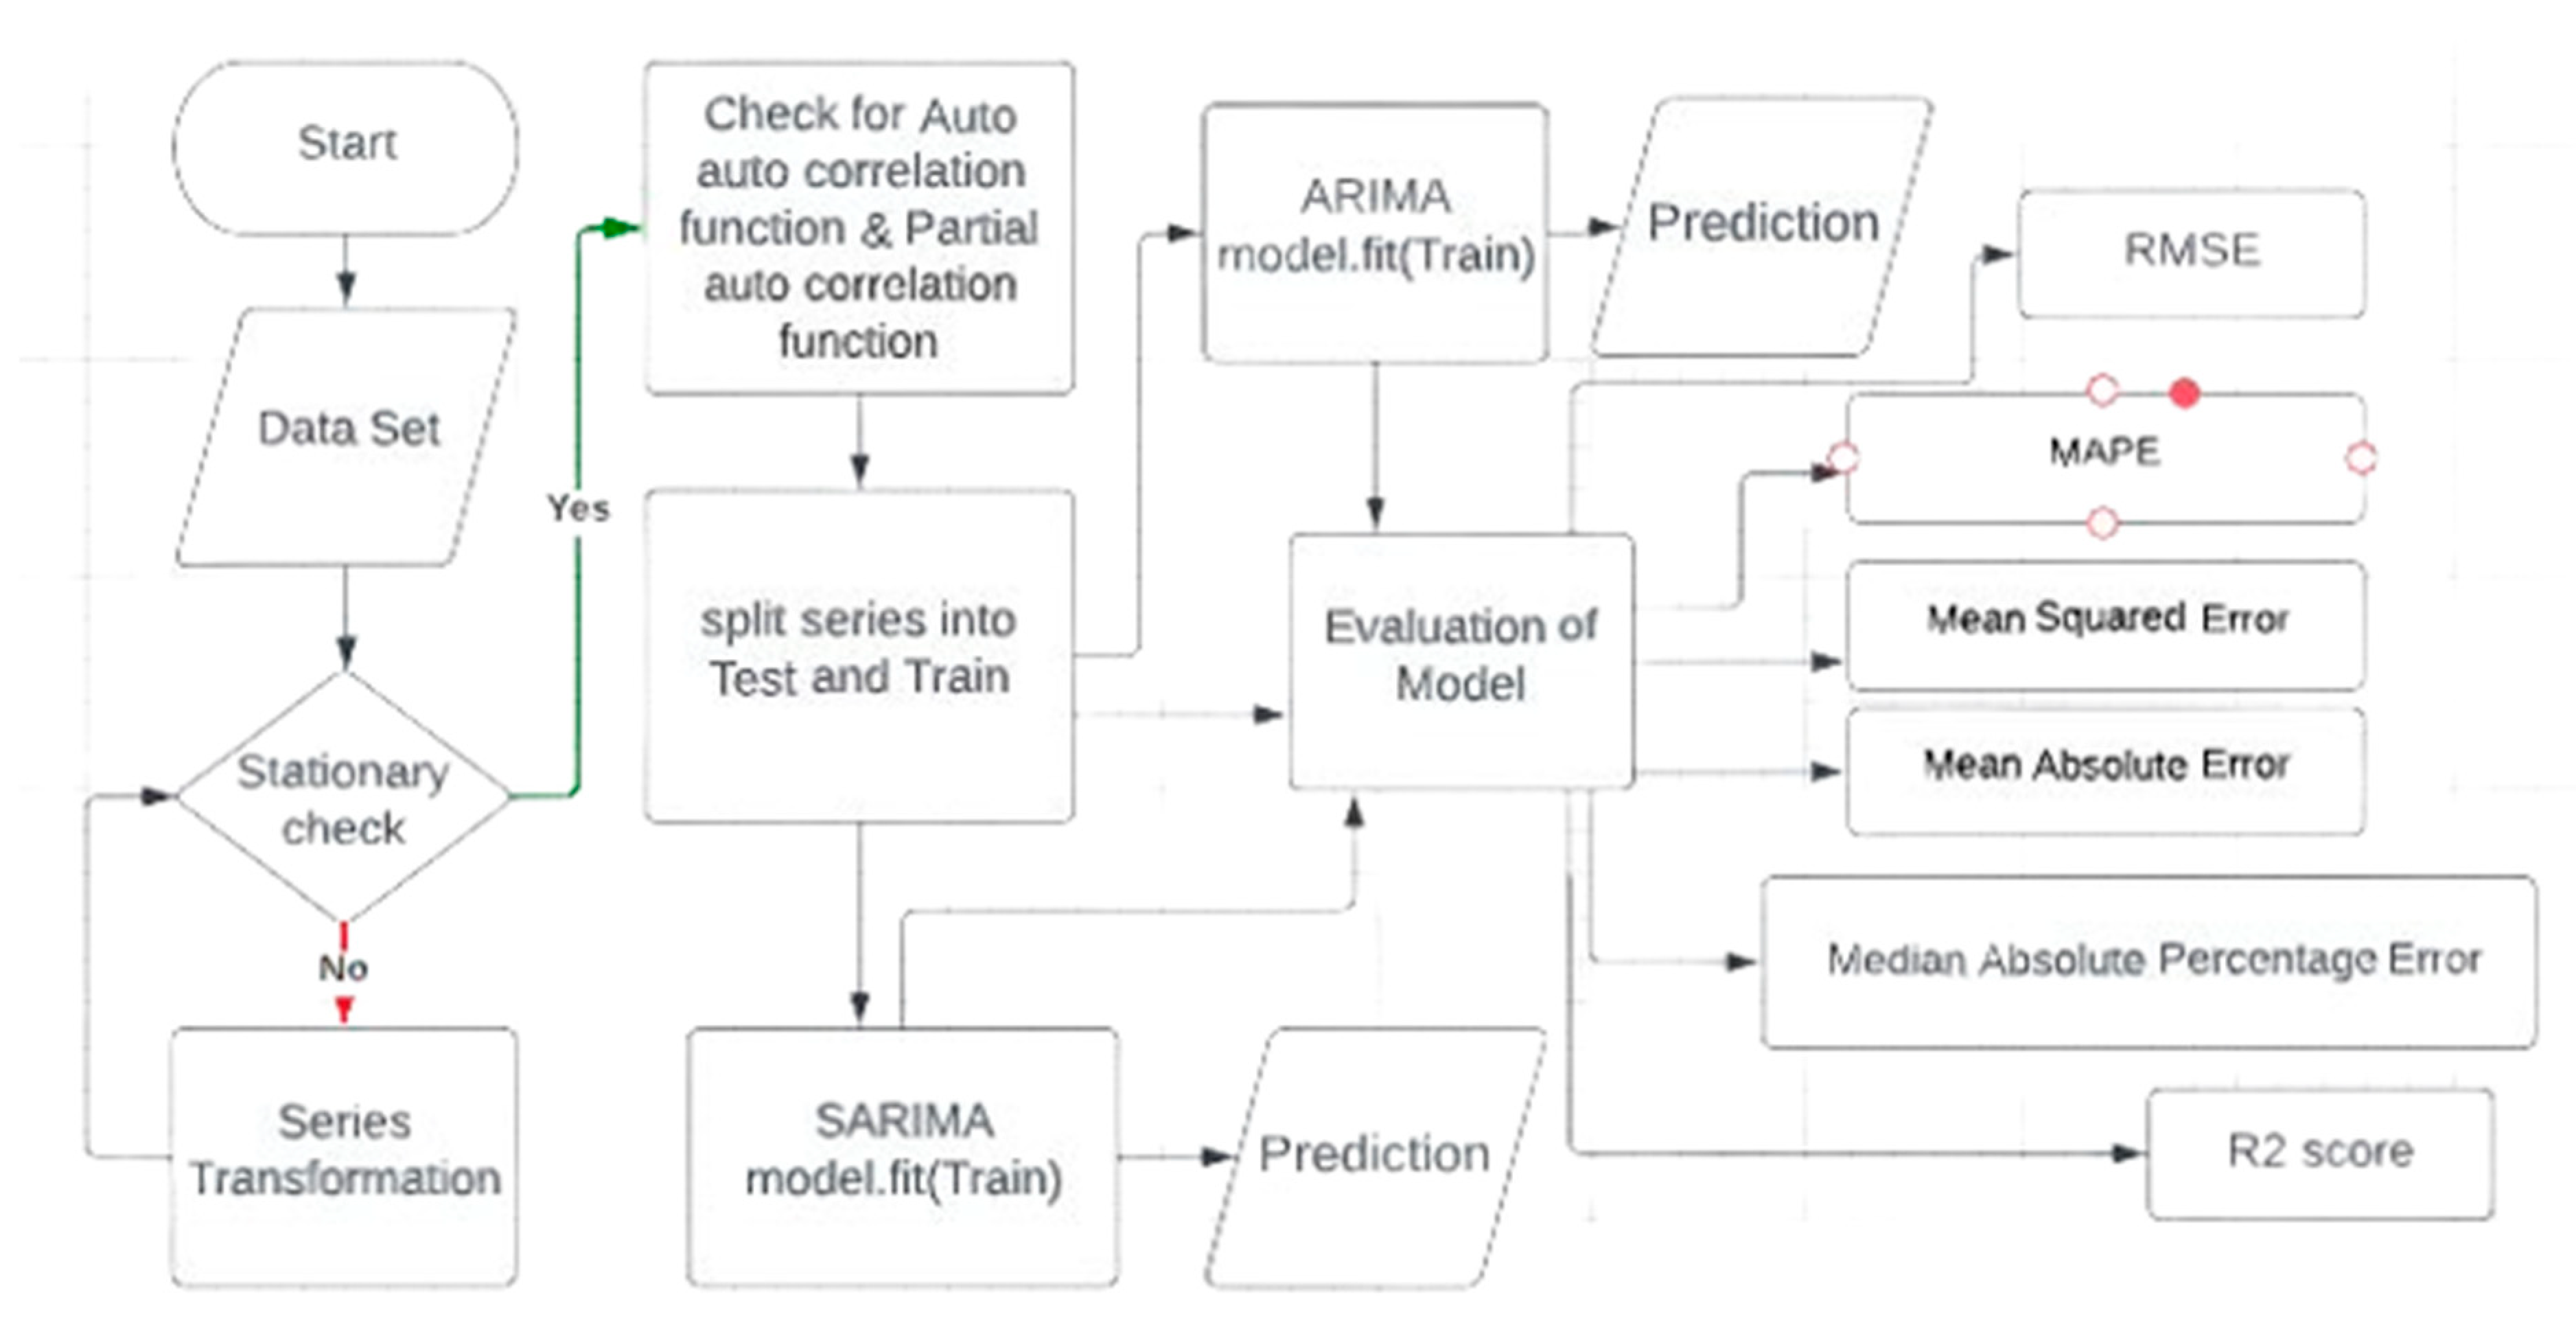
These graphs can be utilized to generally estimate the values of p, d, and q. After getting these underlying solvents, we continue on toward the following stage of dividing the dataset into preparing and testing data. The preparation and fitting of the models are finished utilizing the SARIMAX library.
Figure 5 is utilized to show the method involved with preparing models utilizing SARIMAX. Subsequent to preparing, RMSE, MAPE, MSE, and MAE values are determined for evaluation.
3.4.2. Prophet Models
There is an open-source Python library called Prophet() intended to be utilized for forecasting called an additive regression model, which is made to fit and understand yearly, monthly, and weekly trends that can effectively tackle non-linear regression problems.
This dataset have univariate data, in data there is one variable known as “High Pice” from the dataset of Mulkia Gulf Real that have Date column, predict future values with highest profits. This Prophet model work easily with its main features:
Importing the data
Perform preprocessing (optional step); it's encouraged to do preprocessing to clean data, or probably there is possibility of strange results.
Splitting into test and training data
Fitting the model
Getting prediction data from in- and out-sample data: we get out-sample data by producing a type of dummy data from trained datasets; this dummy data consists of predicted values of high price.
Assess by contrasting the results of the in-sample and out-sample datasets.
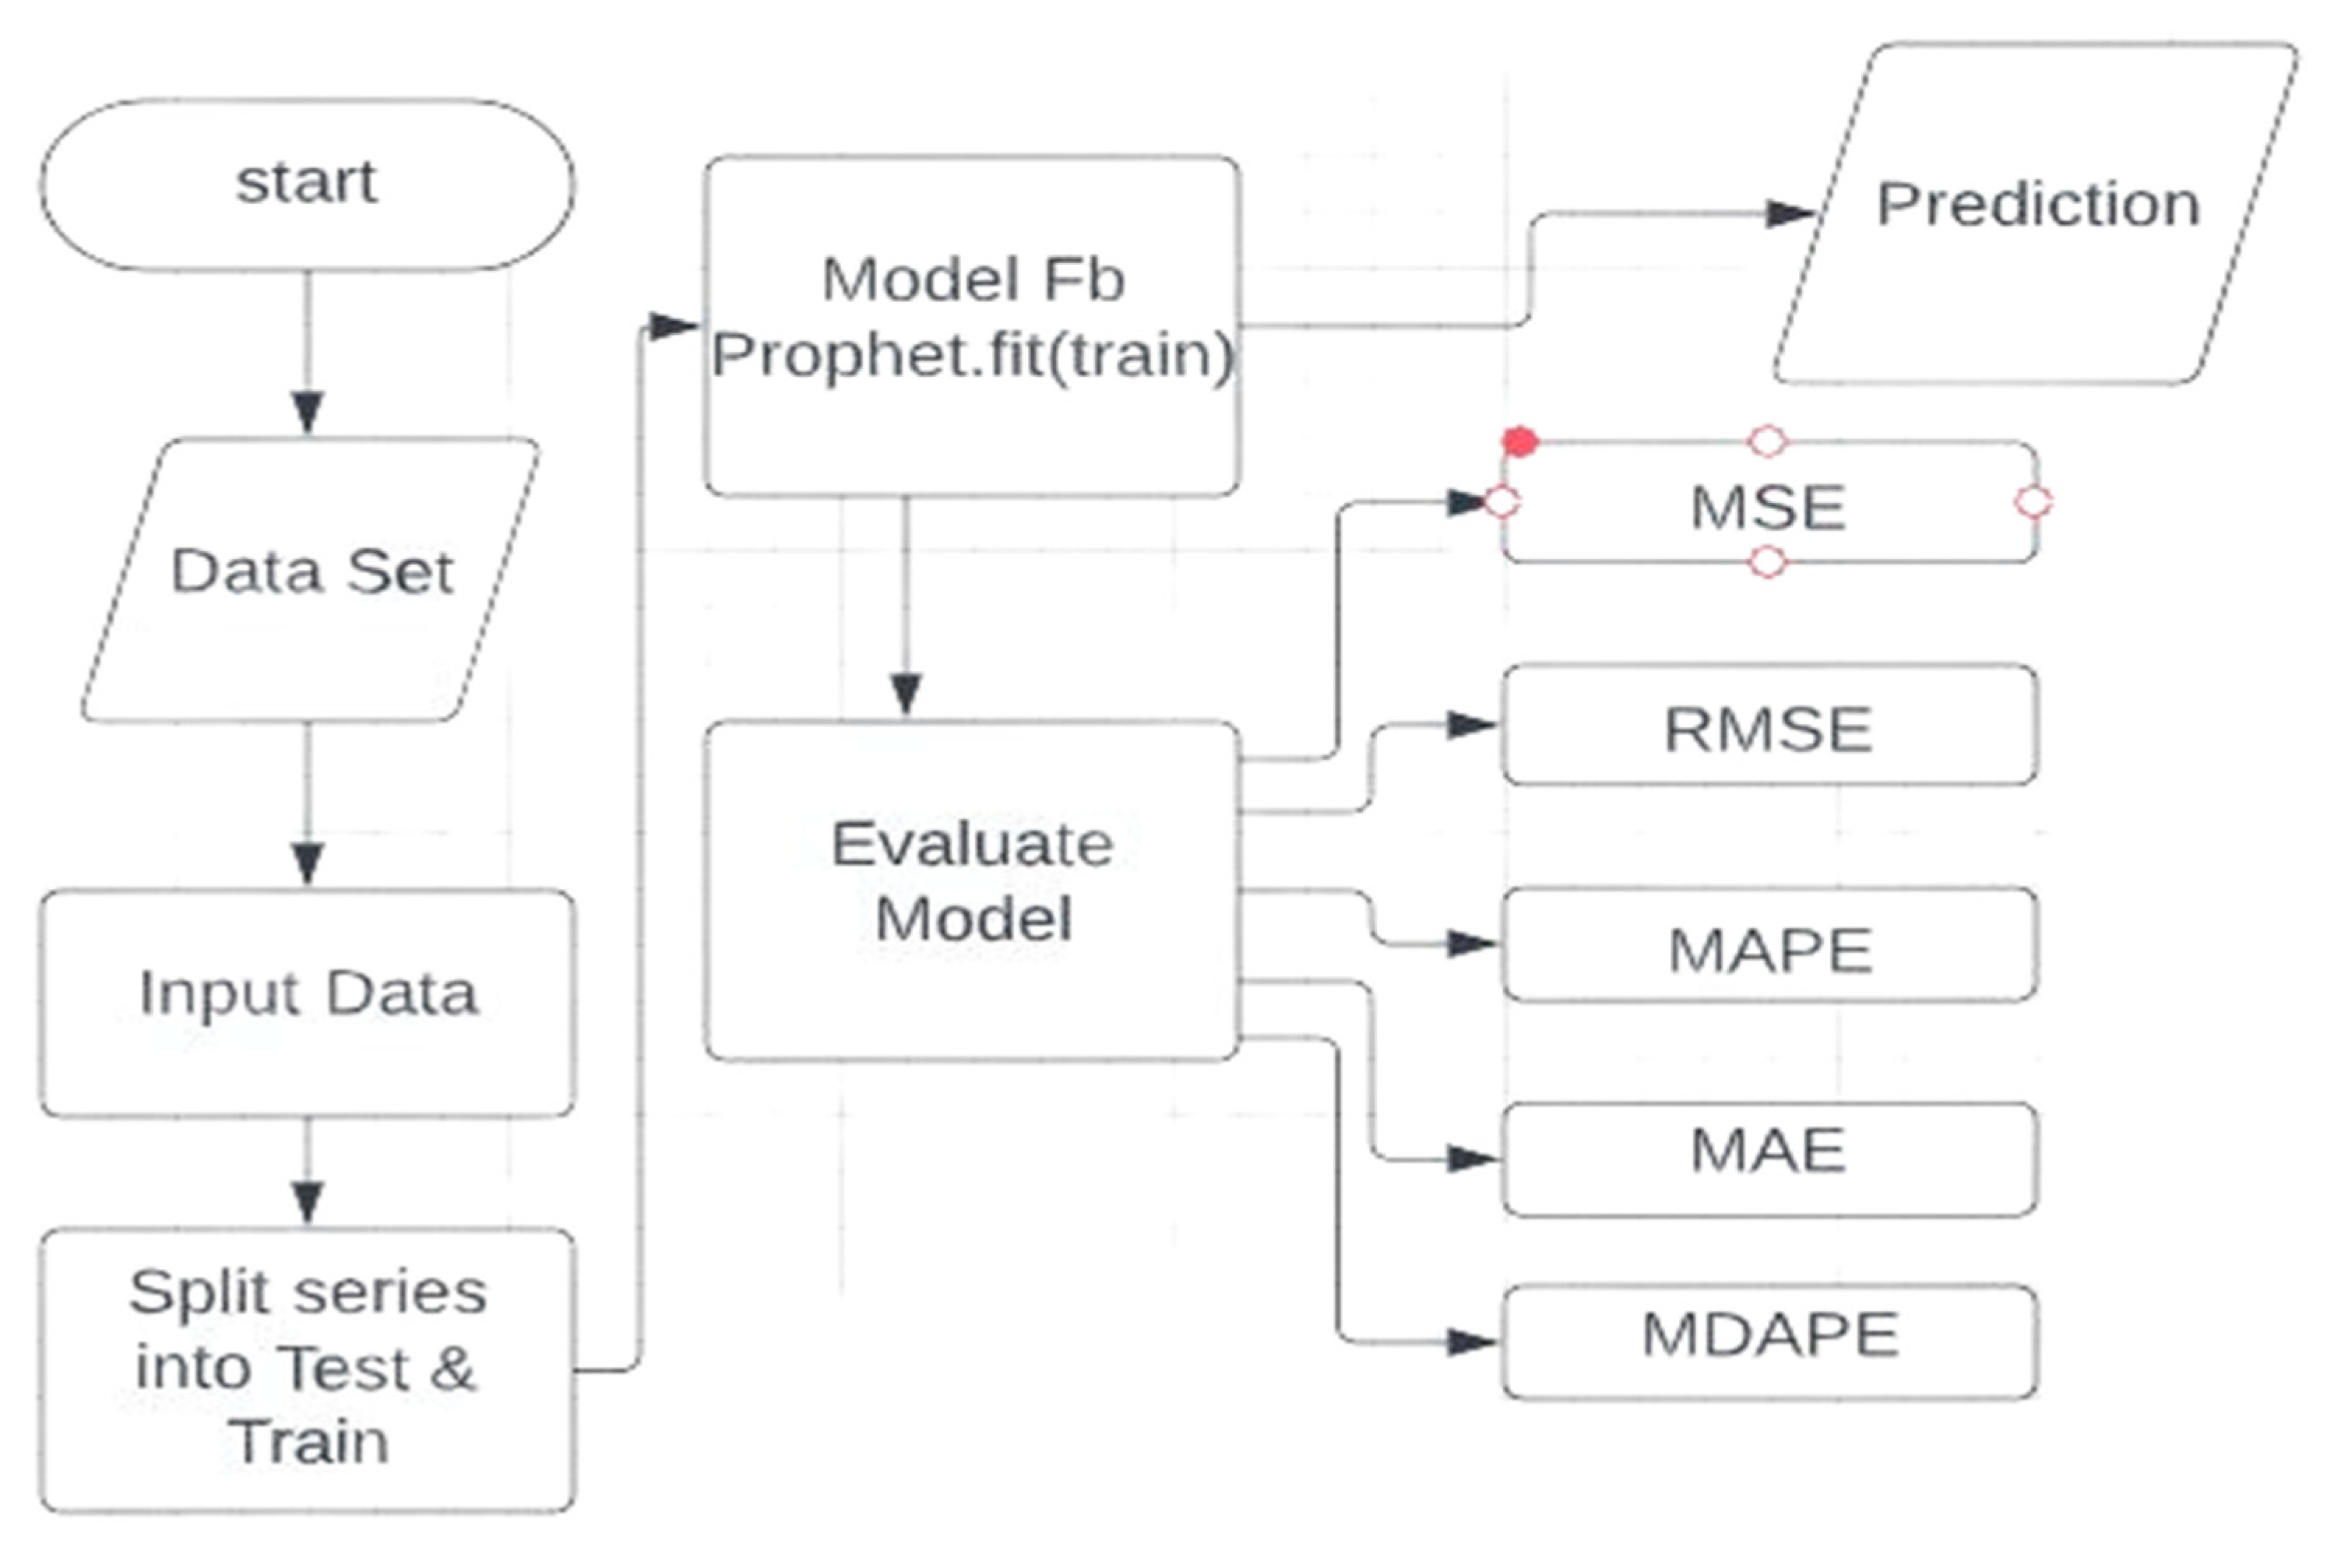
There is only a Facebook Prophet model and the Neural Model libraries that have been utilized to assess the price prediction. There is no change in the process of using these while coding, yet the background technicalities may differ. They are utilized to recognize based on AR Net, and the autoregressive neural networks are neurons designed for forecasting. These are the main differences that give us reason to independently fit and evaluate these two models. Although the evaluation of the Facebook prophet is done with the assistance of simple error differences, as shown in
Figure 6, the functioning of the Facebook prophet model.
While a Facebook prophet is a simple prophet() model that works according to the given general Eq. (3):
In Eq. (3), g (t) represents the prediction trend price-wise, s(t) represents the seasonality pattern, h(t) represents the holiday's effects on prices, and εt represents the white noise data.
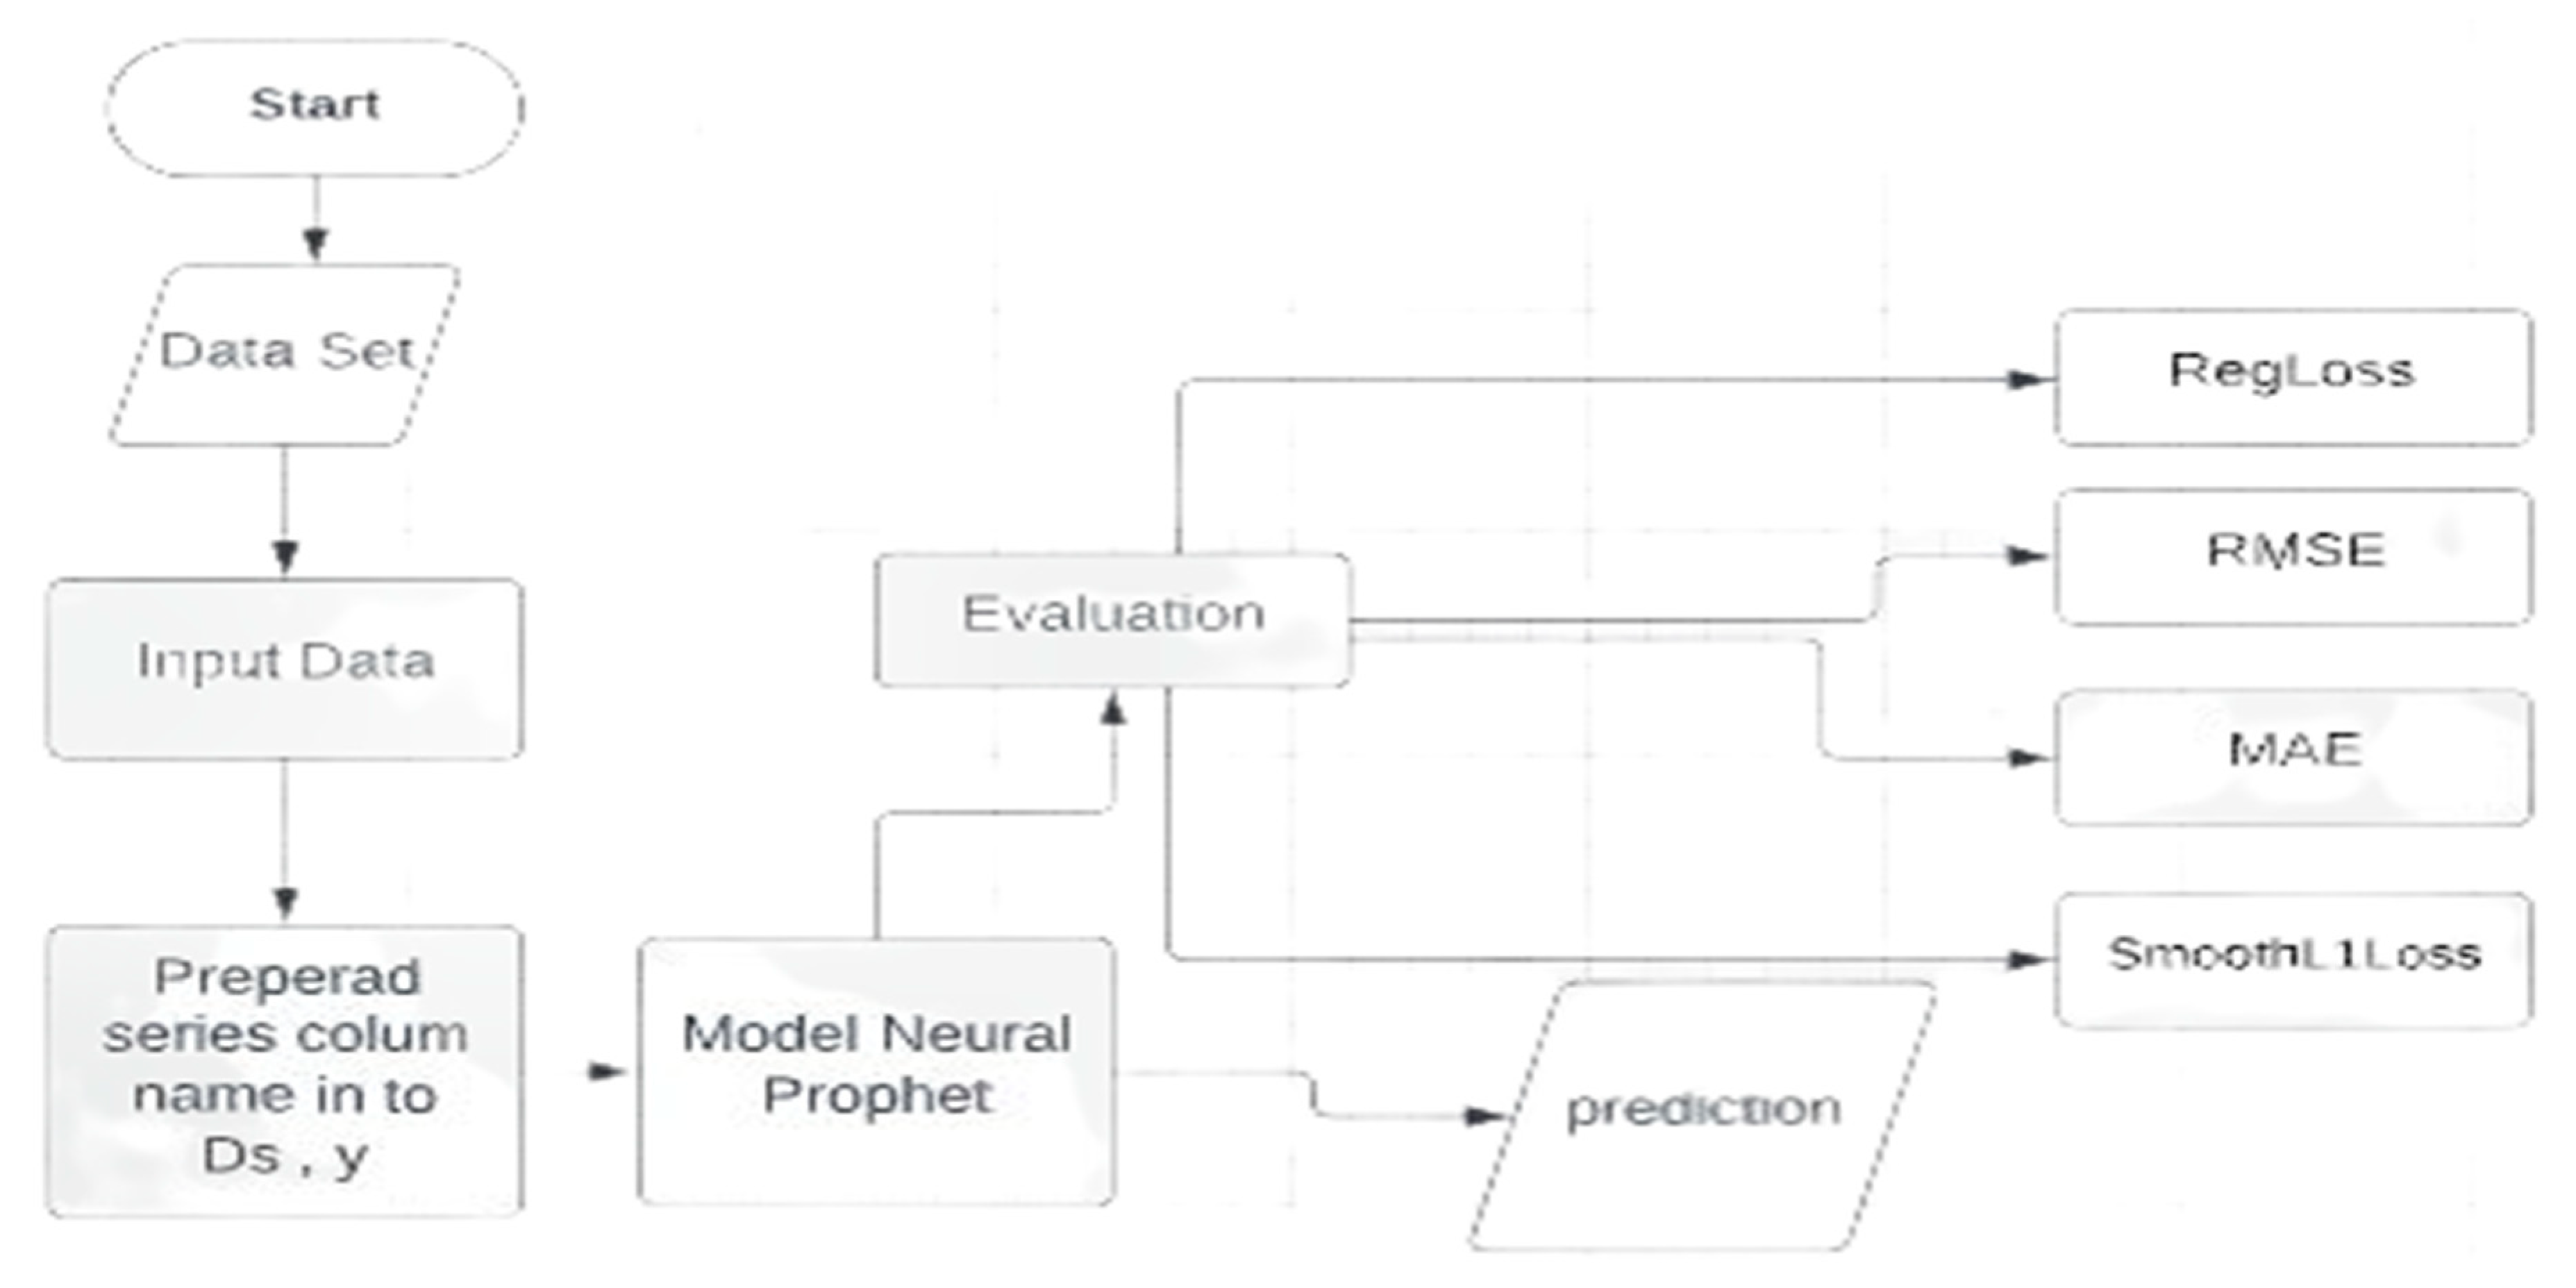
In a Neural Prophet model that inclusion a simple prophet model is included for a neural network. It has pre-built functionality that doesn’t any additional coding. User preferences should need to have a configuration of seasonality modes; aside from data processing, we will just zero in on preparing the data and evaluating its performance based on the in- and out-sample models. There is a workflow of neural prophet models shown in
Figure 7.
The assessment of neural prophet is finished by calculating RegLoss, SmoothL1Loss, and other error evaluation parameters.
4. Results
The fundamental reason for doing this research is to analyze the proficiency and use of three models, and the information utilized for this research is Mulkia GULF real state data to predict the future values of the Saudi stock market. The first model that is used is SARIMA model, and it was prepared using SARIMA and SARIMAX, then imported from statsmodels.tsa in seasonal orders.
Figure 8 is used to show a graphical representation of SARIMA models, and these graphs provide an estimate to predict the performance of SARIMAX models.
The evaluation of the SARIMAX model is assessed by calculating MAPE, MdAPE, and MSE. After the complete evaluation, the R2 score for Sheet 1 is 0.6330271 and -0.7617077 for Sheet 7. Then the MSE value for sheet 1 is 0.1098026 and 0.0851622 for sheet 7, the MAPE value for sheet 1 is 0.0042032 and 0.0035787 for sheet 7, and the values for MdAPE for sheet 1 are 0.1880252 and 0.1204309 for sheet 7. The values that indicate the presence of non-consistent errors have a larger value of MSE, i.e., 0.085 and 0.109.
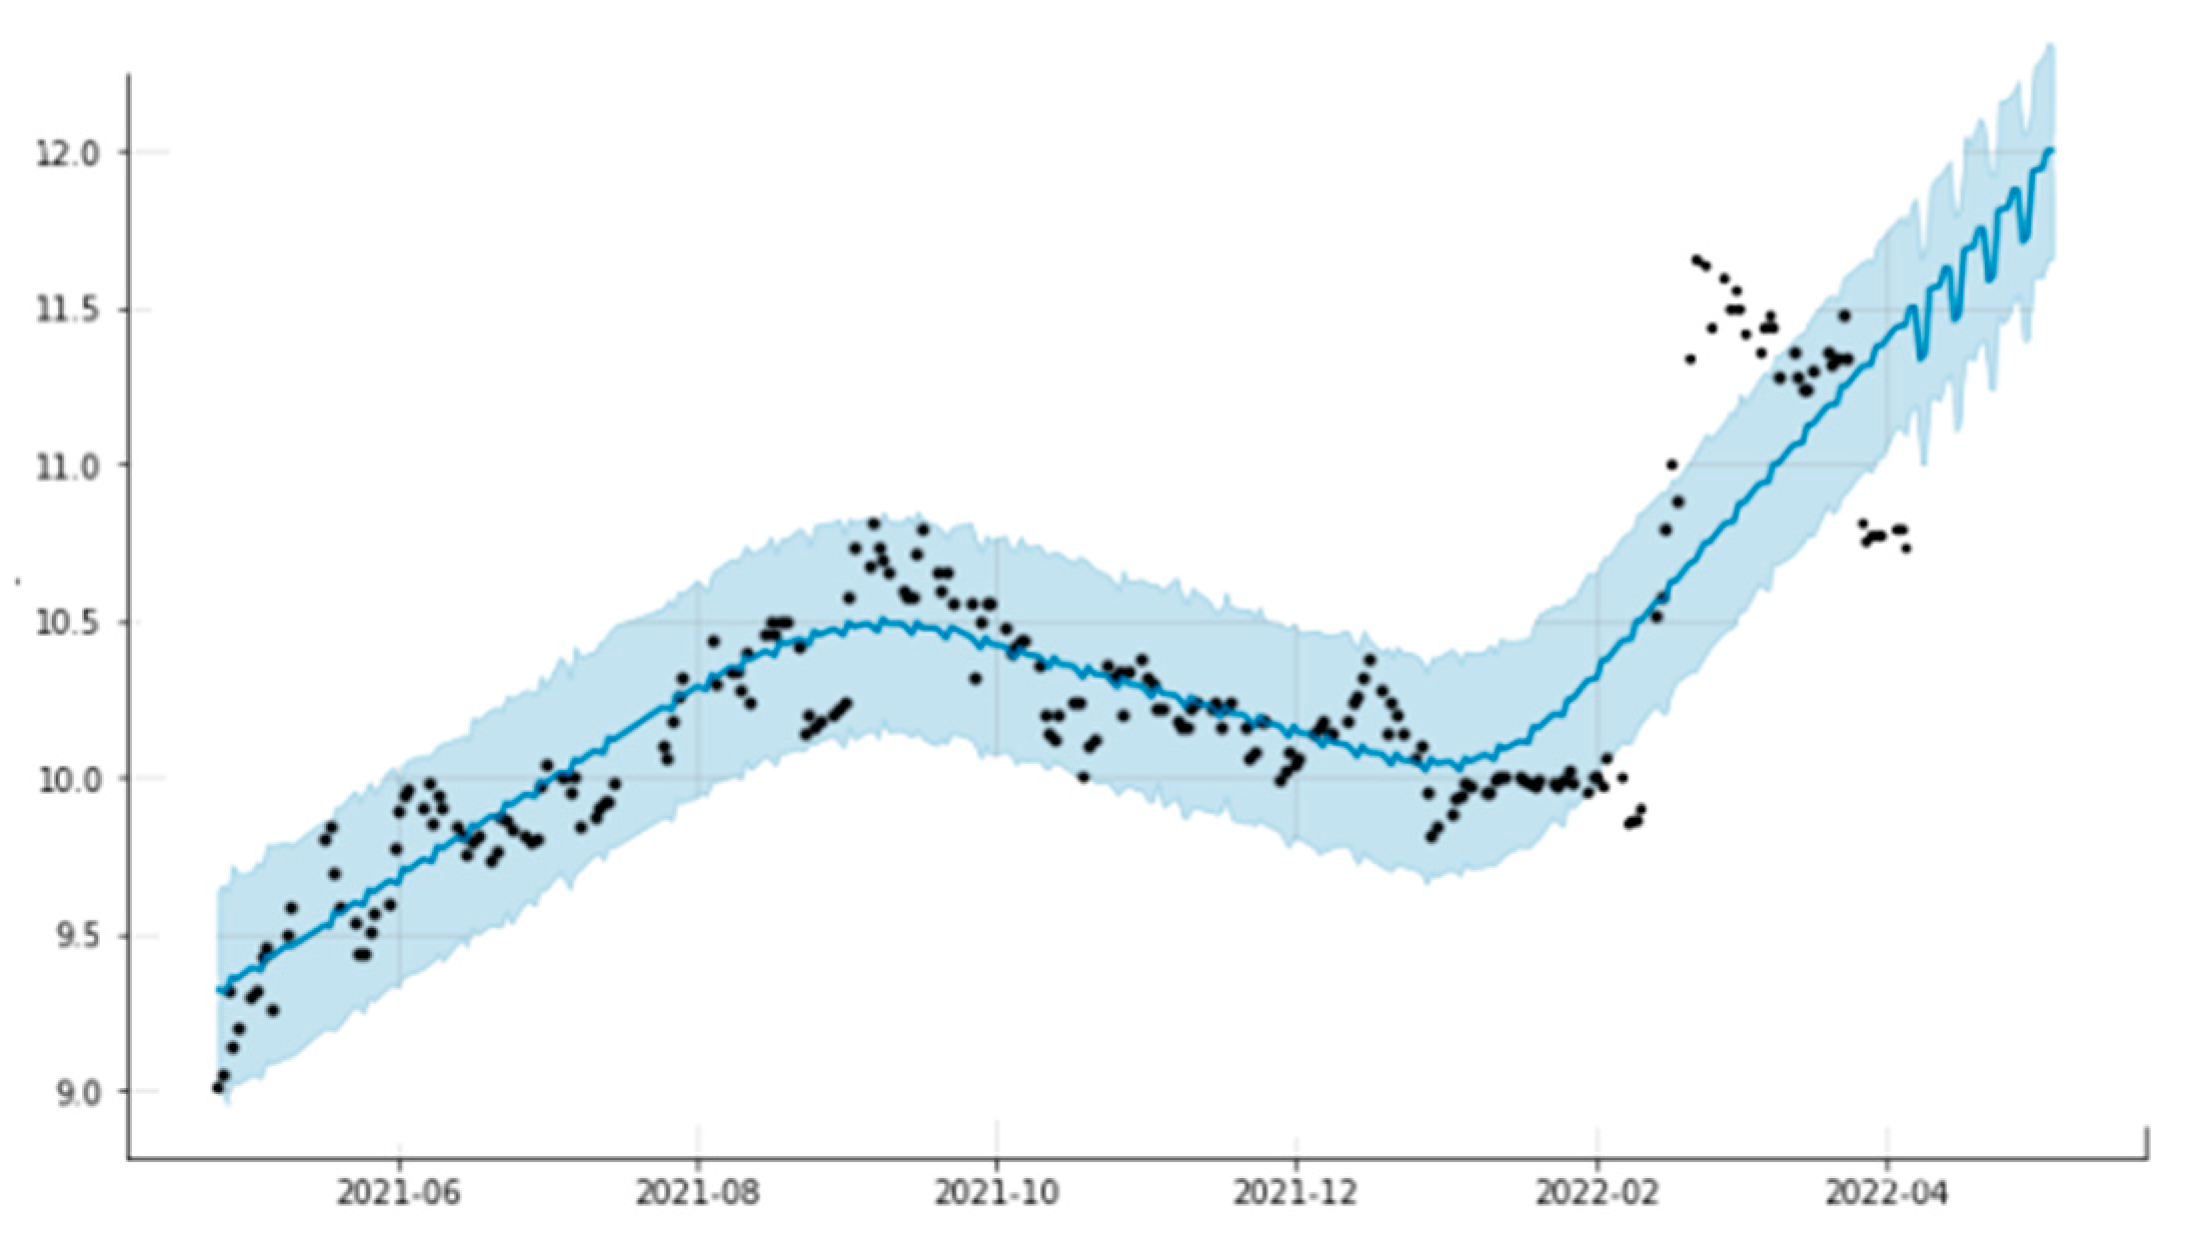
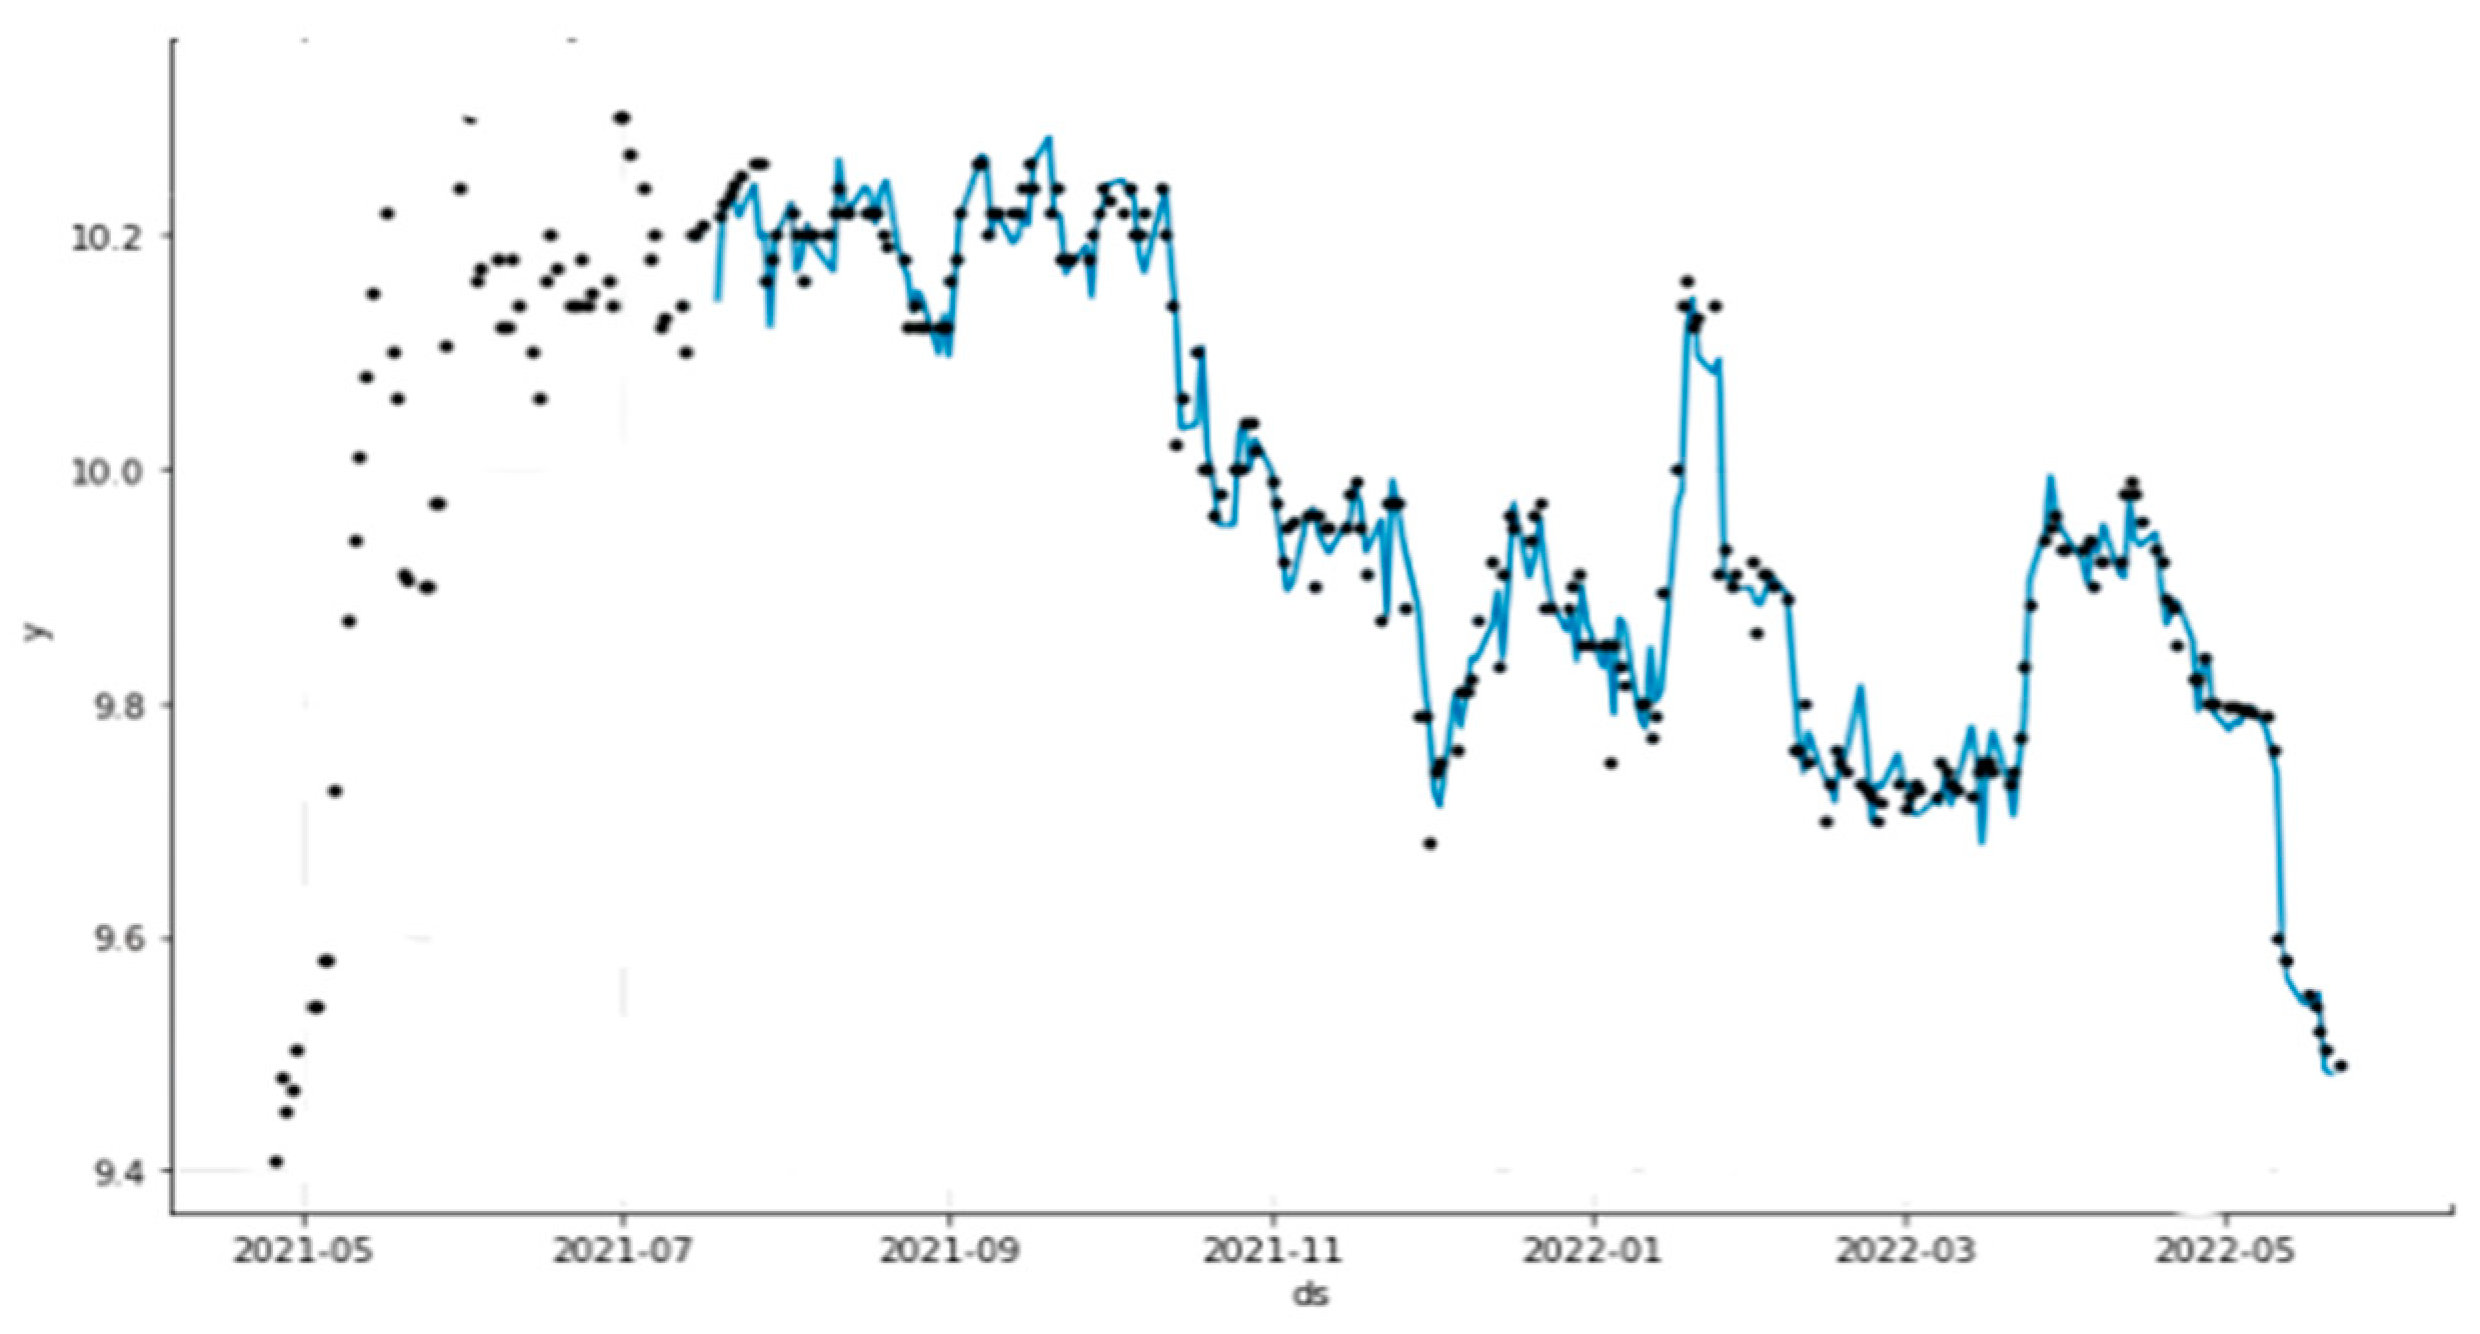
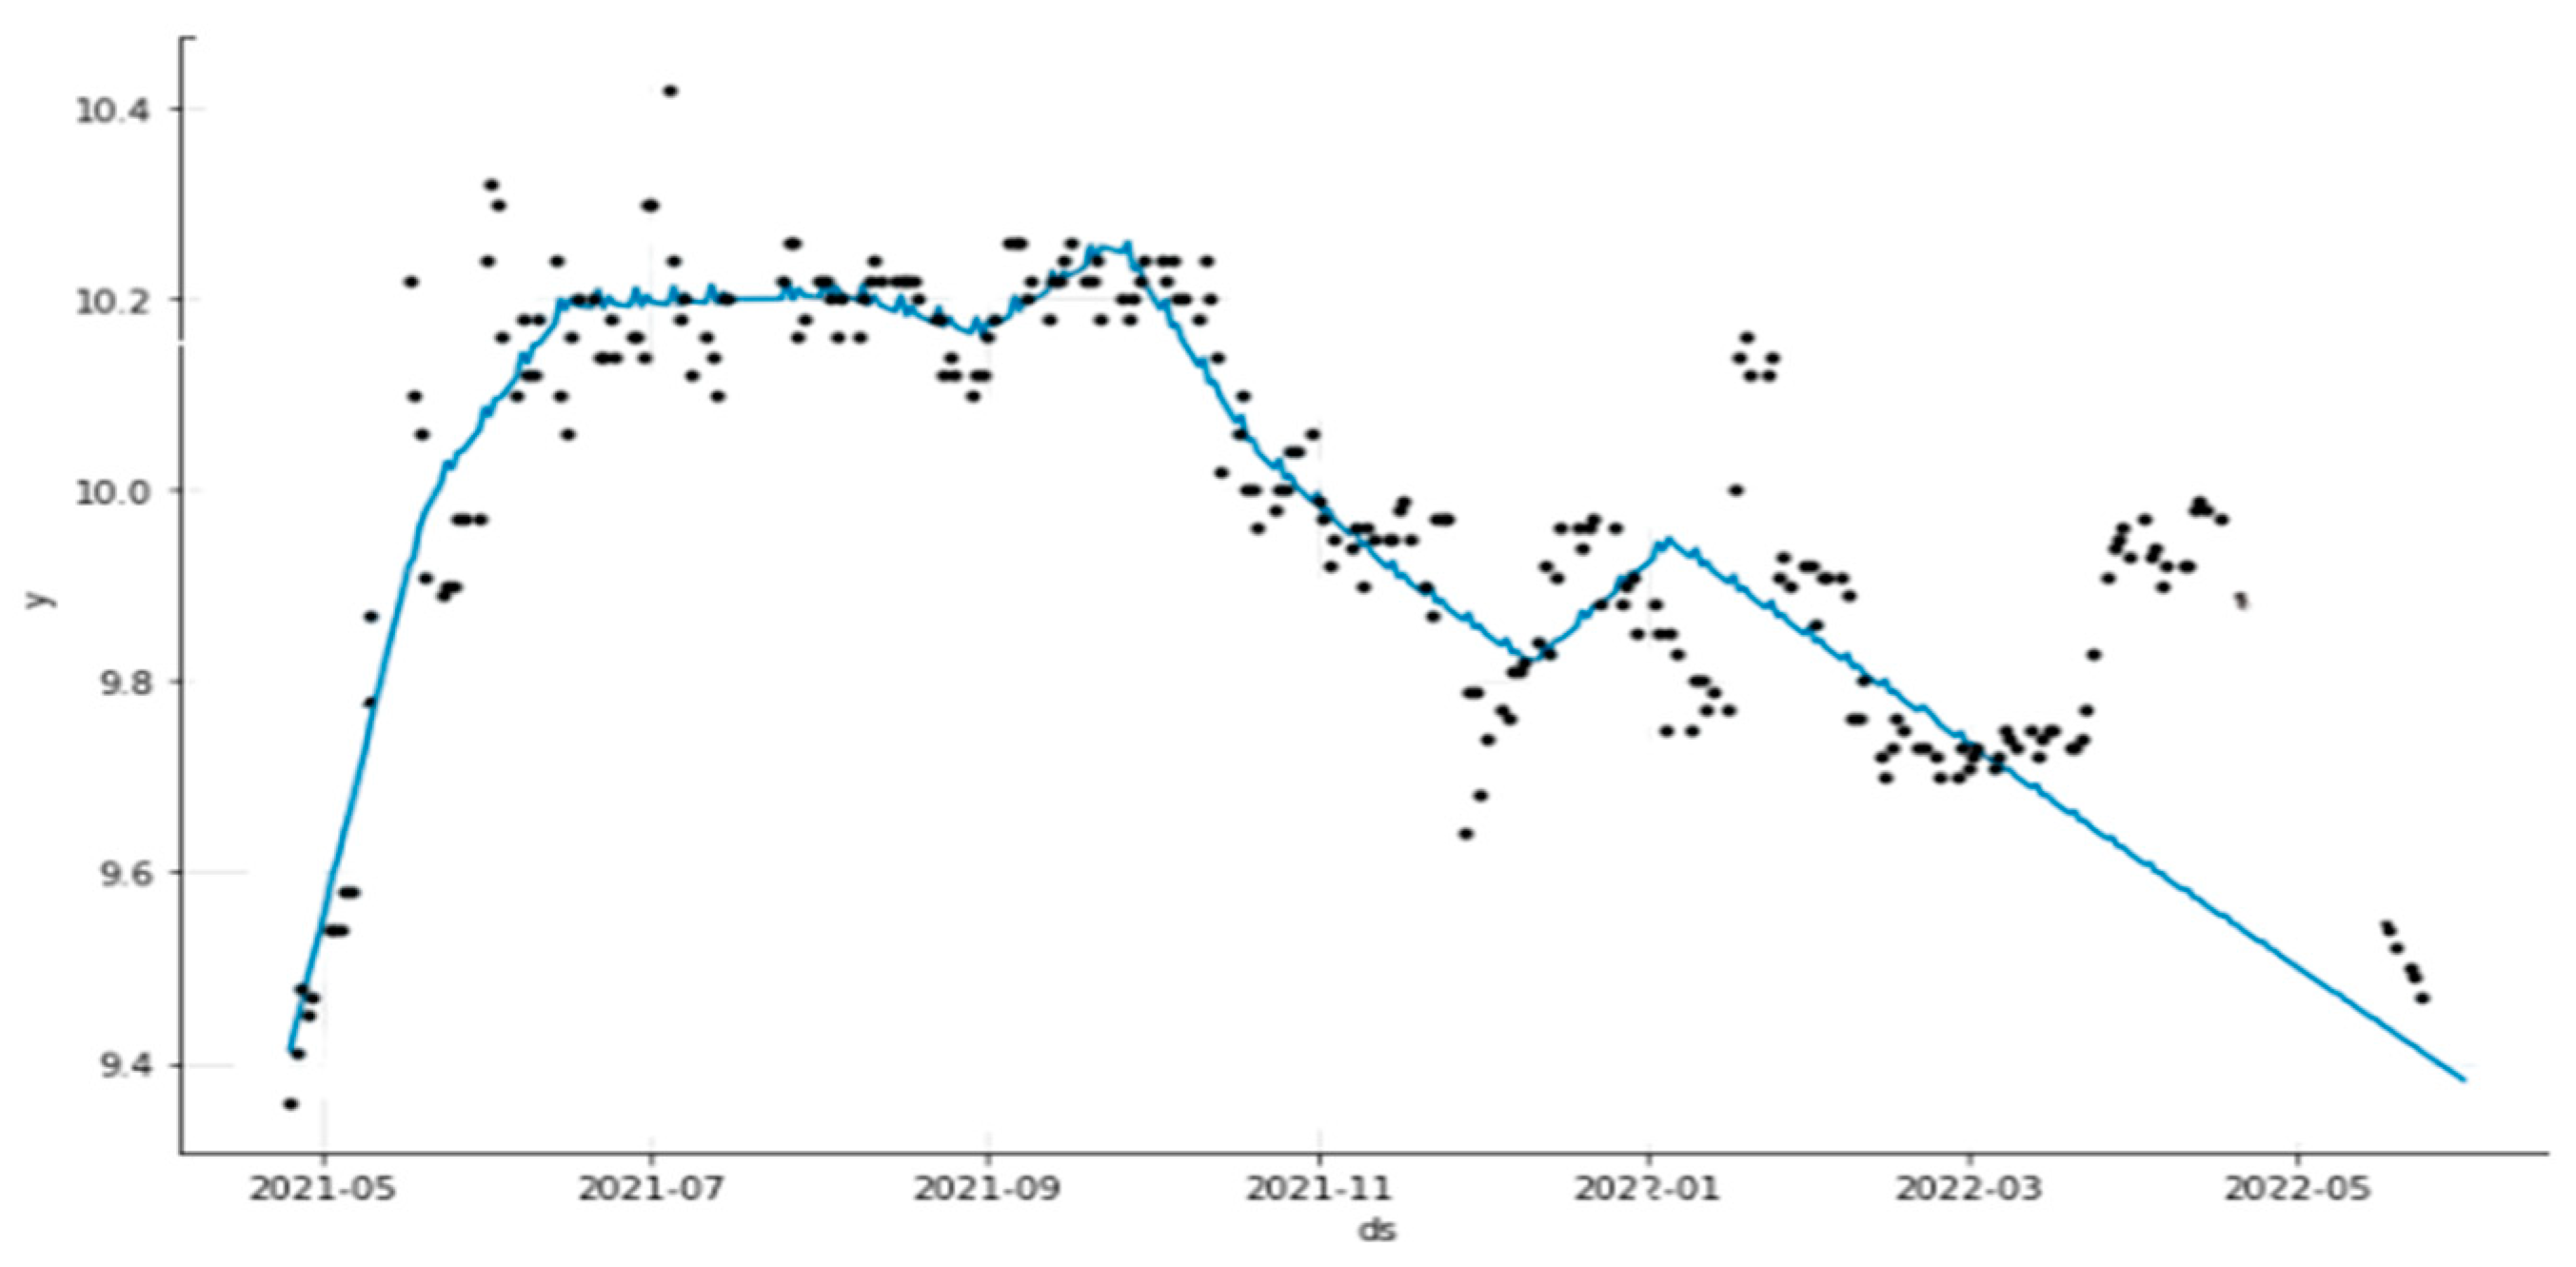
Now there is a next model that is trained with the help of the Facebook prophet model from prohet() from fbprophet. Here are
Figure 9 and
Figure 10 that show the differences between actual and predicted values.
The most important thing to note is that the graphs and dates are scaled along the x-axis labeled as ‘ds’, while the highest price values are scaled with the y-axis labeled as 'y'.
The next evaluation uses the Fb prophet model that is used to evaluate MSE, MAE, MAPE, and MdAPE. The value of R2 for sheet 1 is 0.050958 and for sheet 7 is 050958, then the value for MSE for sheet 1 is 0.735285 and for sheet 7 is 0.028332, then the value for MAE for sheet 1 is 0.823271 and for sheet 7 is 0.154208, now the MAPE value for sheet 1 is 0.075926 and for sheet 7 is 0.015819, and the values for MdAPE in sheet 1 are 7.253010 and 1.656689 for sheet 7. All of these results indicate satisfactory results for the FB Prophet model. Model that trained previously is also a prophet model that is also known as Neural Prophet model.
In this prophet model, the presented model in Python is used as NeuralProphet. Everyone can easily install it and then use it to train their datasets. Here is a graph representation in
Figure 11 and
Figure 12 that is used to display the efficiency of the predicted values without adding seasonality trends. It can be used to compare it with the actual values that are given below:
The wide range of various graphs that are plotted while including the weekly and monthly seasonality modes show similar outcomes. In the previous graphs above, regression demonstrates the dummy values that are utilized to predict the values, and the dark dots that are seen there are actual prices. with the evaluation of the neural prophet model using MAE and RMSE, with the assistance of two additional parameters, Smooth1 loss and RegLoss, the RMSE an incentive for sheet 1 is 0.0954/0.2555 and 0.0945/0.269 for sheet 7, and the values for MAE in sheet 1 are 0.077 and 0.0766 for sheet 7. However, the Koss values that are utilized to give positive outcomes to the proficiency of the model that was utilized, as well as the neural model, seems to work well with smaller datasets, however for this situation, the larger values found in MAE and RMSE.
5. Conclusions
In this paper, we have seen that time series forecasting can easily be done for predicting future market values for the Saudi Exchange, and the data that is used to train this model take from Mulkia GULF real estate. There are three unique Python models that are utilized to train the dataset: SARIMAX, neural Prophet, and Facebook Prophet Model. The evaluation for each model is done by utilizing evaluation parameters like MSE, RMSE, F1 score, precision, and so on. These evaluation parameters are utilized to give the conclusion for each model. The SARIMA model is an evaluation parameter that was utilized here to give the best outcomes (avg. MSE score is - 0.04, avg. MAPE esteem is 0.0038), however it gives best outcomes with context of the values for MSE, i.e., 0.085 and 0.109, which show the presence of non-consistent errors. Although the Facebook prophet model furnishes a satisfactory prediction with a R2 score of 0.50958, an average MSE value of 0.3818, and an average MAPE value of 0.0458725, it likewise offers a typical benefit for MdAPE with a result of 4.454. While there is a neural prophet model that is very well known for giving great accuracy, but in our dataset, it doesn't give the best accuracy. Results demonstrate that the neural prophet recognizes complex patterns and irregularities, while the Facebook prophet model can get a handle on occasional impacts and long-term trends. However, these three models are great in their own domain and work completely great. The SARIMA and Facebook Prophet models are utilized to show seasonality trends, and neural Prophet is more qualified for smaller datasets that have the accuracy to capture the complex nonlinear patterns that are present in time series data.
To conclude all of this, the literature suggests that the performance of SARIMAX, Facebook Prophet, and neural Prophet Models to predict stock prices relies upon many factors, including the quality and amount of data that is accessible, the complexity of the relationships between the variables, and the capacity of the model to capture its patterns and trends. While SARIMAX is utilized to perform improved results to capture complex patterns and seasonal examples, the Facebook prophet model may have more efficiency and be easy to utilize, and neural prophets might be more effective in catching complex relationships in the data, however it requires more ability and implementation to carry out the data. It is essential to take note of that the effectiveness of each model may vary depending on the specific problem at hand, and it is recommended to attempt to try different experiments with various models to figure out which one performs best.
References
- Chatfield, C. Time-series forecasting. CRC press, 2000. [Online]. Available: https://books.google.com.pk/books?id=PFHMBQAAQBAJ&lpg=PR7&ots=fZbsfRhJrj&dq=Time-Series%20Forecasting%20By%20Chris%20Chatfield&lr&pg=PR7#v=onepage&q=Time-Series%20Forecasting%20By%20Chris%20Chatfield&f=false.
- Torres, José F., et al. "Deep learning for time series forecasting: a survey." Big Data 9.1 (2021): 3-21. [CrossRef]
- Nontapa, Chalermrat, et al. "A New Hybrid Forecasting Using Decomposition Method with SARIMAX Model and Artificial Neural Network." Computer Science 16.4 (2021): 1341-1354.
- Cheng, Qian, et al. "Forecasting emergency department hourly occupancy using time series analysis." The American Journal of Emergency Medicine 48 (2021): 177-182. [CrossRef]
- Kritharas, Petros. Developing a SARIMAX Model for Monthly Wind Speed Forecasting in the UK. Diss. Loughborough University, 2014.
- Liu, Nengbao, Vahan Babushkin, and Afshin Afshari. "Short-term forecasting of temperature driven electricity load using time series and neural network model." Journal of Clean Energy Technologies 2.4 (2014): 327-331. [CrossRef]
- Jha, B. K., & Pande, S. (2021, April). Time series forecasting model for supermarket sales using FB-prophet. In 2021 5th International Conference on Computing Methodologies and Communication (ICCMC) (pp. 547-554). IEEE. [CrossRef]
- Triebe, Oskar, et al. "Neuralprophet: Explainable forecasting at scale." arXiv preprint. arXiv:2111.15397.(2021).
- Long, Bowen, Fangya Tan, and Mark Newman. "Forecasting the Monkeypox Outbreak Using ARIMA, Prophet, NeuralProphet, and LSTM Models in the United States." Forecasting 5.1 (2023): 127-137. [CrossRef]
- Shohan, Md Jamal Ahmed, Md Omar Faruque, and Simon Y. Foo. "Forecasting of electric load using a hybrid LSTM-neural prophet model." Energies 15.6 (2022): 2158. [CrossRef]
- Sivaramakrishnan, S., et al. "Forecasting Time Series Data Using ARIMA and Facebook Prophet Models." Big data management in Sensing. River Publishers, 2022. 47-59.
- González Mata, Alejandro. "A comparison between LSTM and Facebook Prophet models: a financial forecasting case study." (2020).
- Zunic, Emir, et al. "Application of facebook's prophet algorithm for successful sales forecasting based on real-world data." arXiv preprint arXiv:2005.07575 (2020). arXiv:2005.07575.
- Mahmud, Sakib. "Bangladesh COVID-19 daily cases time series analysis using facebook prophet model." Available at SSRN 3660368 (2020). [CrossRef]
- Torres, J. F., Hadjout, D., Sebaa, A., Martínez-Álvarez, F., & Troncoso, A. (2021). Deep learning for time series forecasting: a survey. Big Data, 9(1), 3-21. [CrossRef]
- Masini, R. P., Medeiros, M. C., & Mendes, E. F. (2023). Machine learning advances for time series forecasting. Journal of Economic Surveys, 37(1), 76-111. [CrossRef]
- Bergmeir, C., Hyndman, R.J., Koo, B.: A note on the validity of cross-validation for evaluating autoregressive time series prediction. Computational Statistics & Data Analysis 120, 70–83 (2018). [CrossRef]
- Cerqueira, V., Torgo, L., & Mozetič, I. (2020). Evaluating time series forecasting models: An empirical study on performance estimation methods. Machine Learning, 109, 1997-2028. [CrossRef]
- Khare, Kaustubh, et al. "Short term stock price prediction using deep learning." 2017 2nd IEEE international conference on recent trends in electronics, information & communication technology (RTEICT). IEEE, 2017. [CrossRef]
- Sunny, Md Arif Istiake, Mirza Mohd Shahriar Maswood, and Abdullah G. Alharbi. "Deep learning-based stock price prediction using LSTM and bi-directional LSTM model." 2020 2nd Novel Intelligent and Leading Emerging Sciences Conference (NILES). IEEE, 2020. [CrossRef]
- Yu, Pengfei, and Xuesong Yan. "Stock price prediction based on deep neural networks." Neural Computing and Applications 32 (2020): 1609-1628. [CrossRef]
- Nikou, Mahla, Gholamreza Mansourfar, and Jamshid Bagherzadeh. "Stock price prediction using DEEP learning algorithm and its comparison with machine learning algorithms." Intelligent Systems in Accounting, Finance and Management 26.4 (2019): 164-174. [CrossRef]
- Samek, Wojciech, et al. "Explaining deep neural networks and beyond: A review of methods and applications." Proceedings of the IEEE 109.3 (2021): 247-278. [CrossRef]
- Madsen, Henrik. Time series analysis. CRC Press, 2007. [CrossRef]
|
Disclaimer/Publisher’s Note: The statements, opinions and data contained in all publications are solely those of the individual author(s) and contributor(s) and not of MDPI and/or the editor(s). MDPI and/or the editor(s) disclaim responsibility for any injury to people or property resulting from any ideas, methods, instructions or products referred to in the content. |
© 2023 by the authors. Licensee MDPI, Basel, Switzerland. This article is an open access article distributed under the terms and conditions of the Creative Commons Attribution (CC BY) license (http://creativecommons.org/licenses/by/4.0/).
