1. Introduction
The essential premise of Big Bang (BB) cosmology is that the universe is expanding, and Hubble's law [
1] is viewed as the most persuasive proof for cosmic expansion. In present-day cosmology, the velocity interpretation of the redshift (RS) of spectral lines has achieved a dogmatic status, and objections against it have gone unobserved.
Regardless of whether this interpretation is correct or not, Hubble’s law is a RS/distance (
d) relation, and an interpretation of this as a velocity is only a hypothesis. Supporting the velocity interpretation is the good agreement between the observed
z/µ data for SN1a supernovae in the RS range
z < ~ 1.3 with data determined based on the parameters Ώ
M, Ώ
λ, w and H
0 of the ΛCDM model, which is viewed as proof for general expansion. Despite its widespread acceptance, however, this conclusion is equivocal, and the current circumstance is fairly confounding. Based on a semiquantitative examination of SN1a data, Sorrell [
2] reported that in the low-RS range, the Hubble diagram (HD) for a tired light (TL) cosmology gives good agreement with the Type Ia supernova data. A comparable outcome was described by Traunmüller [
3], whose examination of 892 SN1a supernovae
z/µ data also indicated that these were well-matched with the TL model.
The interpretation of the RS of atomic spectral lines suffers from the fact that none of the proposed systems (the expanding space paradigm or the TL mechanism) can be confirmed experimentally, meaning that confidence in each hypothesis should be estimated based on its ability to explain the observational data. One important issue in cosmology is therefore to explain which of the two models fits the observed data better, i.e., whether the HD follows the linear (expanding universe) or the exponential TL relation. In the high RS range, it should be more feasible to check more precisely whether the HD follows a linear or exponential slope.
Very exact
z/μ data for SN1a supernovae, however, are accessible only for a limited range of distances. At RS > ~ 1.3, the optical light emitted by a s, upernova gradually diminishes with distance, making definite estimations difficult. Many attempts have been made to utilize GRB data for computing HDs in the high RS range. The difficulty in building HDs from experimentally measured LGBR z/µ raw data lies in standardising GRB luminosity as a reliable distance indicator in a cosmologically independent way. Additional problems arise from observational biases - like selection and evolution effects - and gravitational lensing biases. To overcome these problems, various calibration methods were proposed, such as those by Liu and Wei [
4], Amati et al. [
5] and calibration through the Dainotti relationship [
6], for example. HDs were created based on the calibrated data [
5,
7,
8,
9,
10] and compared with the CDM model. It was asserted that the data has a good fit to the ΛCDM model. However, a comparison with the competing TL model was not considered. A detailed profile analysis of mixed SN1a, GRB and exclusively GRB data Marosi [
11,
12,
13,
14] has shown that in the RS range 0.031–8.1, the slope of the HD is (or is extremely close to) exponential, which is characteristic of the TL model [
15]. In contrast, the ΛCDM model shows poor agreement with the observation. In contrast, ongoing investigations by Gupta [
16] and Shirokov et al. [
17,
18] have found that although none of the existing studies has given probative affirmation for the ΛCDM model, the conclusion can be drawn that based on the HD test, the TL model can be precluded. This cosmologically significant inconsistency between these two contradictory conclusions requires an amendment.
2. Aims
The HD test represents possibly the most significant proof for identifying the underlying physical nature of the Hubble constant (abbreviated as hCDM = (km s-1 Mpc-1)/100 for ΛCDM and hTL = (Hz s-1 Hz-1)/100 for the TL model), and could provide solid support for the expansion hypothesis, or, in the contrary case, for the legitimacy of the TL model (although this would require modification to the ΛCDM itself).
The aim of the present study was to perform a comparative HD test using cosmology-independent SN1a data and high RS LGRB RS/
μ data. Since both the ΛCDM and the TL model make precise forecasts about the shape of the HD, it ought to be possible to confirm whether the HD shows a linear
or exponential relationship
(where
t represents the flight time of the photons from the co-moving radial distance
d to the observer; for simplicity, we will use
t instead of
d in the following discussion). This could set significant constraints on these contrasting cosmological models.
We do not plan to examine existing issues related to the ΛCDM and TL cosmology, or to accept or reject either model on the basis of hypothetical contentions or hypotheses. The present study is completely cosmology-independent; it is a mathematically based statistical investigation based on cosmology-independent data without the need to turn to cosmological suspicions, meaning that it is unbiased.
3. Datasets and Methods
3.1. SN1a Supernovae
For the model calculations, the cosmological parameters Ώ
M = 0.295, Ώ
λ = 0.705, w = −1.018 and
h0 = 0.7 were used, based on 374 spectroscopically affirmed, upgraded SN1a supernovae from the most recent joint light
-curve analysis (JLA) data index, Betoule et al. [
19].
3.2. Choice of GRB Data
60 low RS and 78 high RS GRB data samples from the Union1 compilation, collected by Liu and Wei [
4](2015). One outlier at ln(
z+1) = 1.2095 with
t = 17491×10
-14 was excluded from the calculation.
193 GRB data samples collected by Amati et al. (2018).
69 LGBR samples calibrated with the Dainotti relationship [
10]. One extreme outlier at z = 2.03 was excluded from thecalculation.
99 calibrated data consisting of the 69 bursts supplemented with 30 further data points collected by Wang et al. [
20].
A comparison of the goodness of fit indicators for data sets b), c), d) and e) is shown in
Table 1. The default parameter for GRBs
h = 0.70, Ώ = 0.287 were used for calculation.
Based on the above quality criteria, we selected 138 calibrated, cosmology-independent GRB data points in the RS range z = 0.0331–8.1 b) and d) and e) for a detailed analysis.
4. Data Processing
Data were introduced on the usual, strongly attenuated logarithmic z/μ scale, and since the contrast between the measured and the modelled data turned out to be clearer on the linear scale, we also considered the less commonly used but more sensitive linear photon flight time t/(z+1) scale. A conspicuous benefit of the t/(z +1) representation is the direct illustration of the shape of the HD, which can be definitively contrasted with the expectations following from equations (1) and (2).
4.1. Data Conversion from µ to t(d) and Vice Versa
For data conversion from
µ to
t we used equation (3), and for conversion from
t to
µ we used equations (4) and (5), as follows:
Conversion of the SN1a µ data to a linear scale was straightforward, as the data were of high precision and equation (3) could directly be applied for conversion without producing disruptive amplification of measurement errors.
Due to experimental difficulties in determining z/μ data at high RS, these data were overwhelmed by substantial scatter, meaning that they could not be converted to the linear t/(z +1) scale without amplifying the scatter and making the converted data unmanageable. Hence, before data conversion, there was a need to either smooth the data scatter by calculating the line of best fit using a suitable arithmetical function or to multiply the t values by an appropriate damping factor, which in this case was selected as 10-14. For data fitting, a third-order polynomial regression was used.
4.2. Goodness of Fit
The goodness of fit was calculated using the likelihood estimator
4.3. Calculations of RS/µ Data
For the ΔCDM model, the ICRAR cosmology calculator was used to calculate the theoretical
z/µ data. For the TL models, the
z/µ data were calculated as follows:
(see: Sorrell 2009[
2]; Traunmüller 2014[
3]; Vigoureux, Vigoureux & Langlois 2014 [
21]).
4.4. Data Presentation
Excel was used for data fitting, refinement, and presentation.
5. Results
5.1. Equivocality of the SN1a Supernovae Hubble Diagram
Since for ΛCDM models the distances in equation (1) are nonlinear in
z (the distances are limited by the maximum value for
d, i.e., the radius of the universe), it is usual to express
d as
. This leads to a linear relationship for the variables
which are the usual coordinates for the graphical presentation of the HD.
For TL models, it follows from equation (2) that
which is linear with distance, with an intercept on zero.
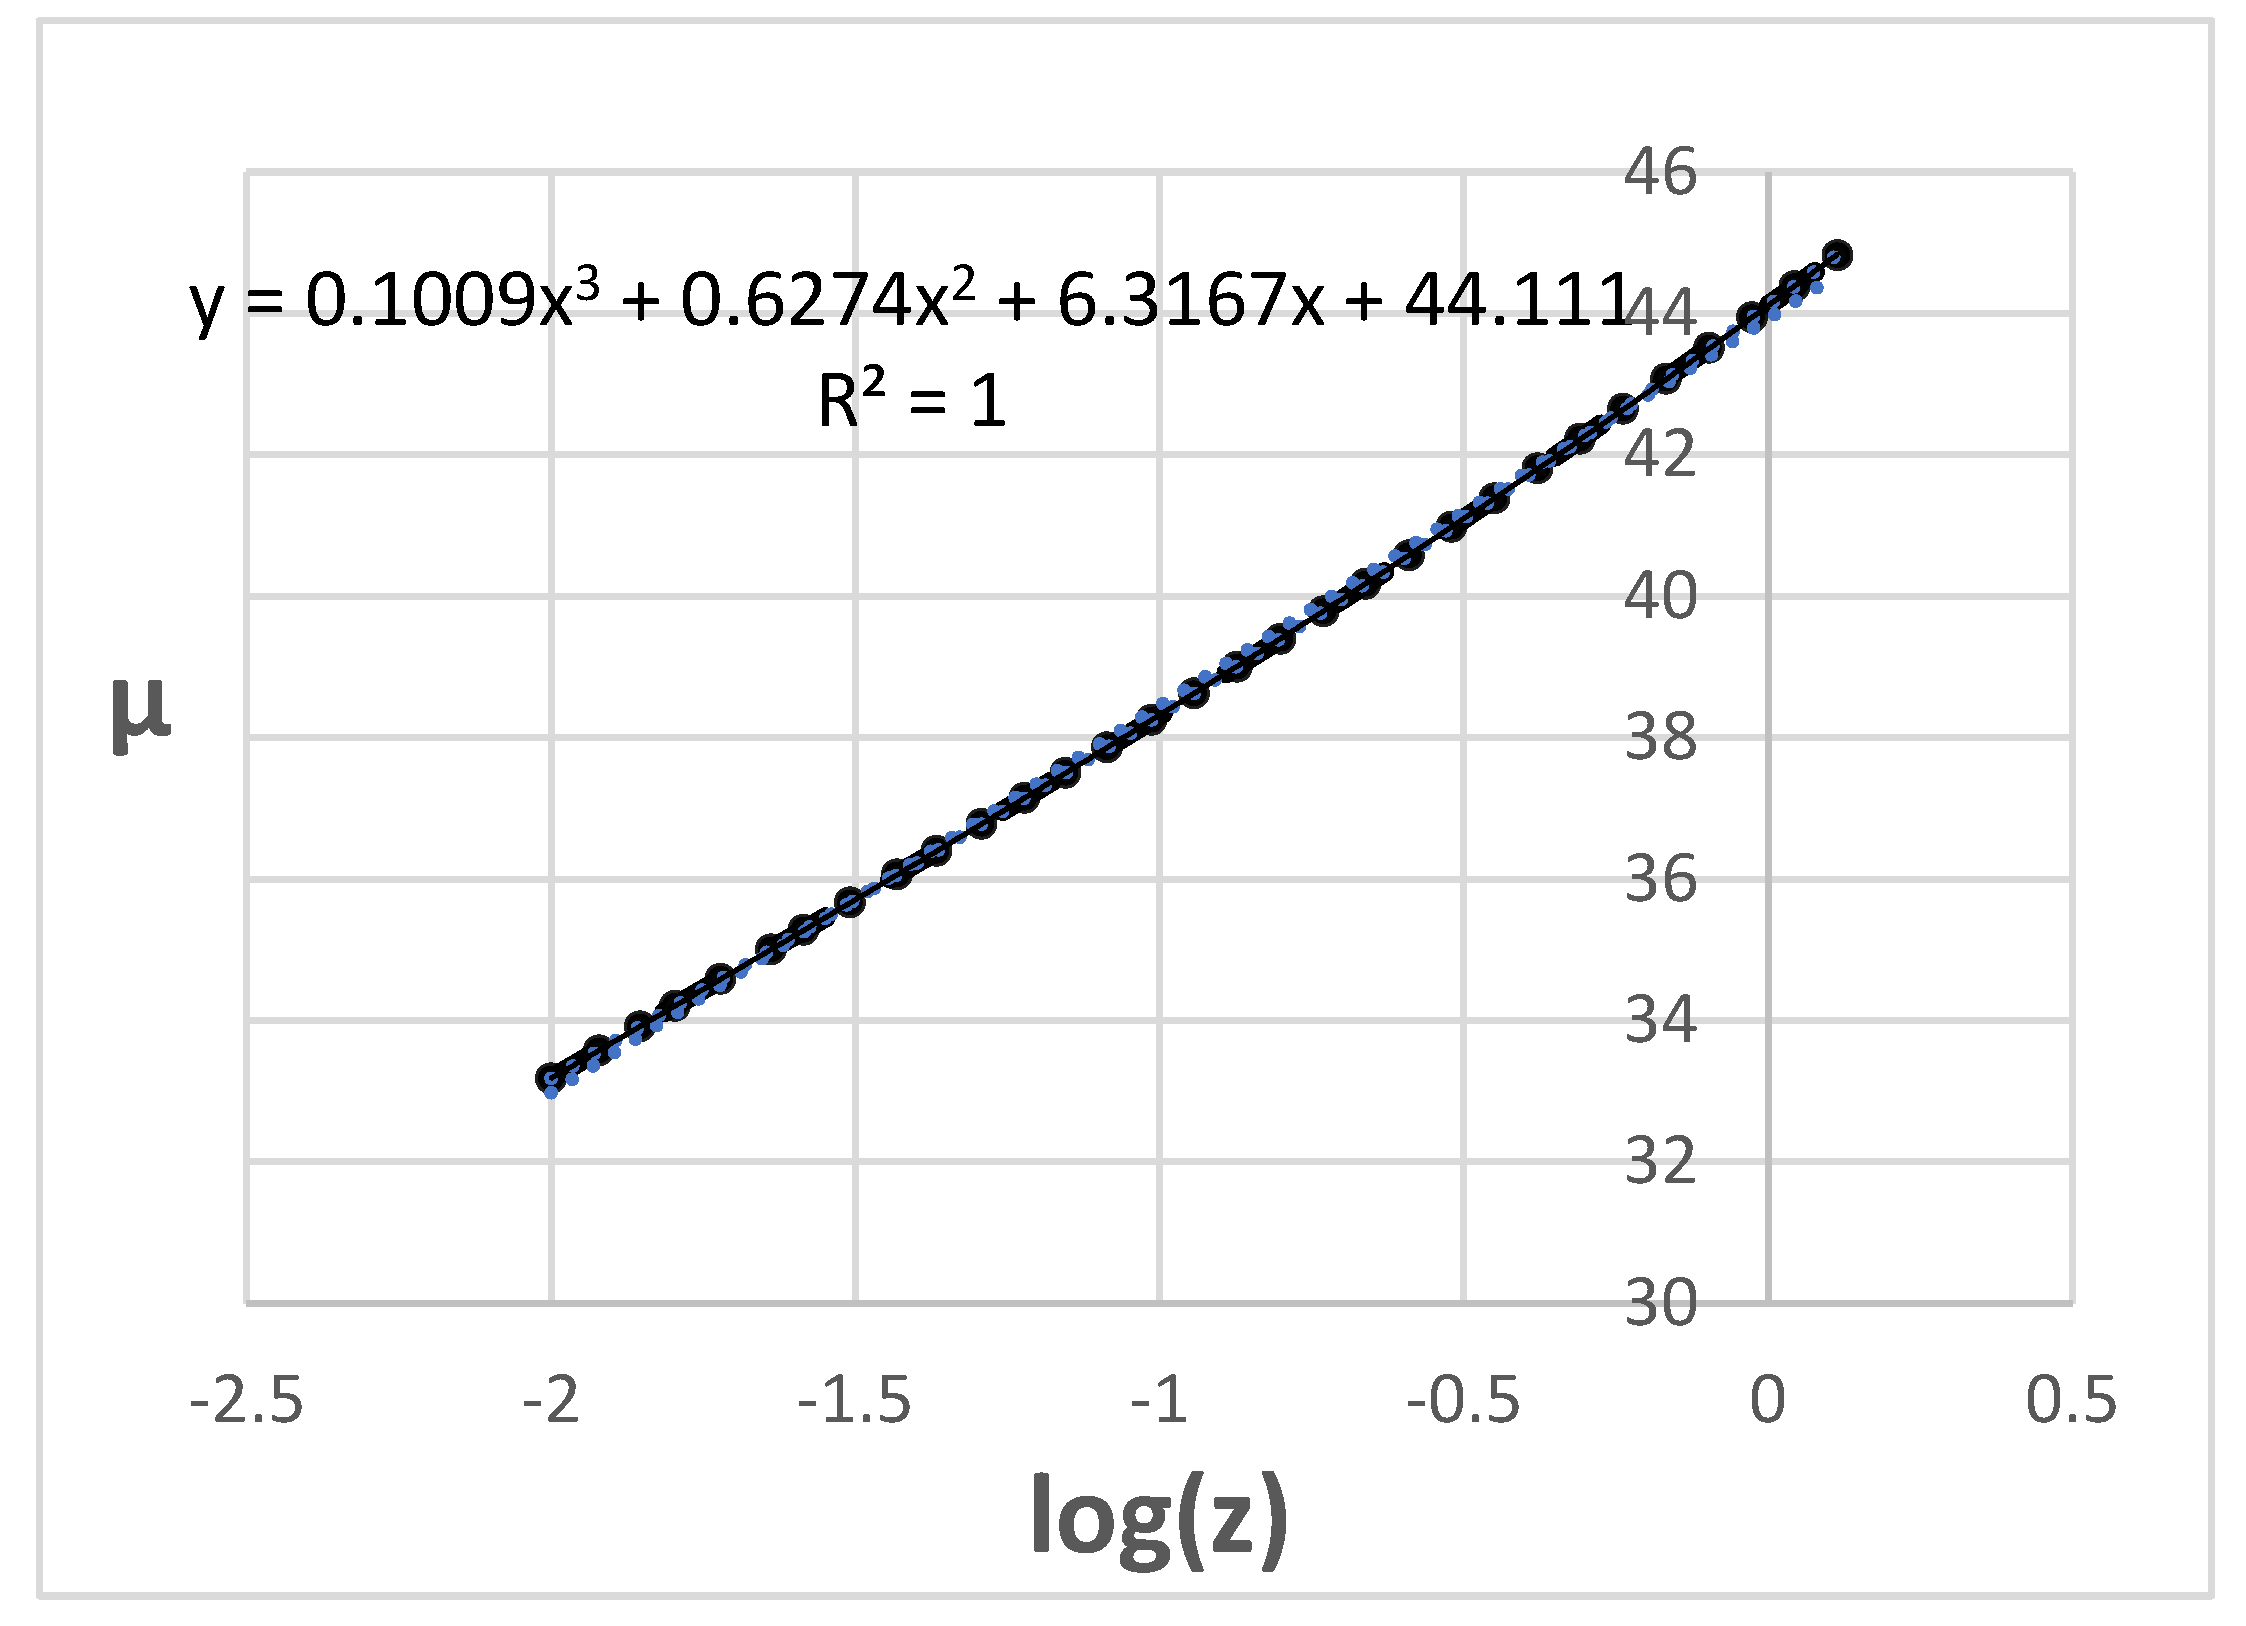
Figure 1 shows the HD calculated with the parameters of the ΛCDM model, as set down by Betoule et al. (2014), in the RS range z = 0.01–1.35 for the log(
z)/
µ presentation.
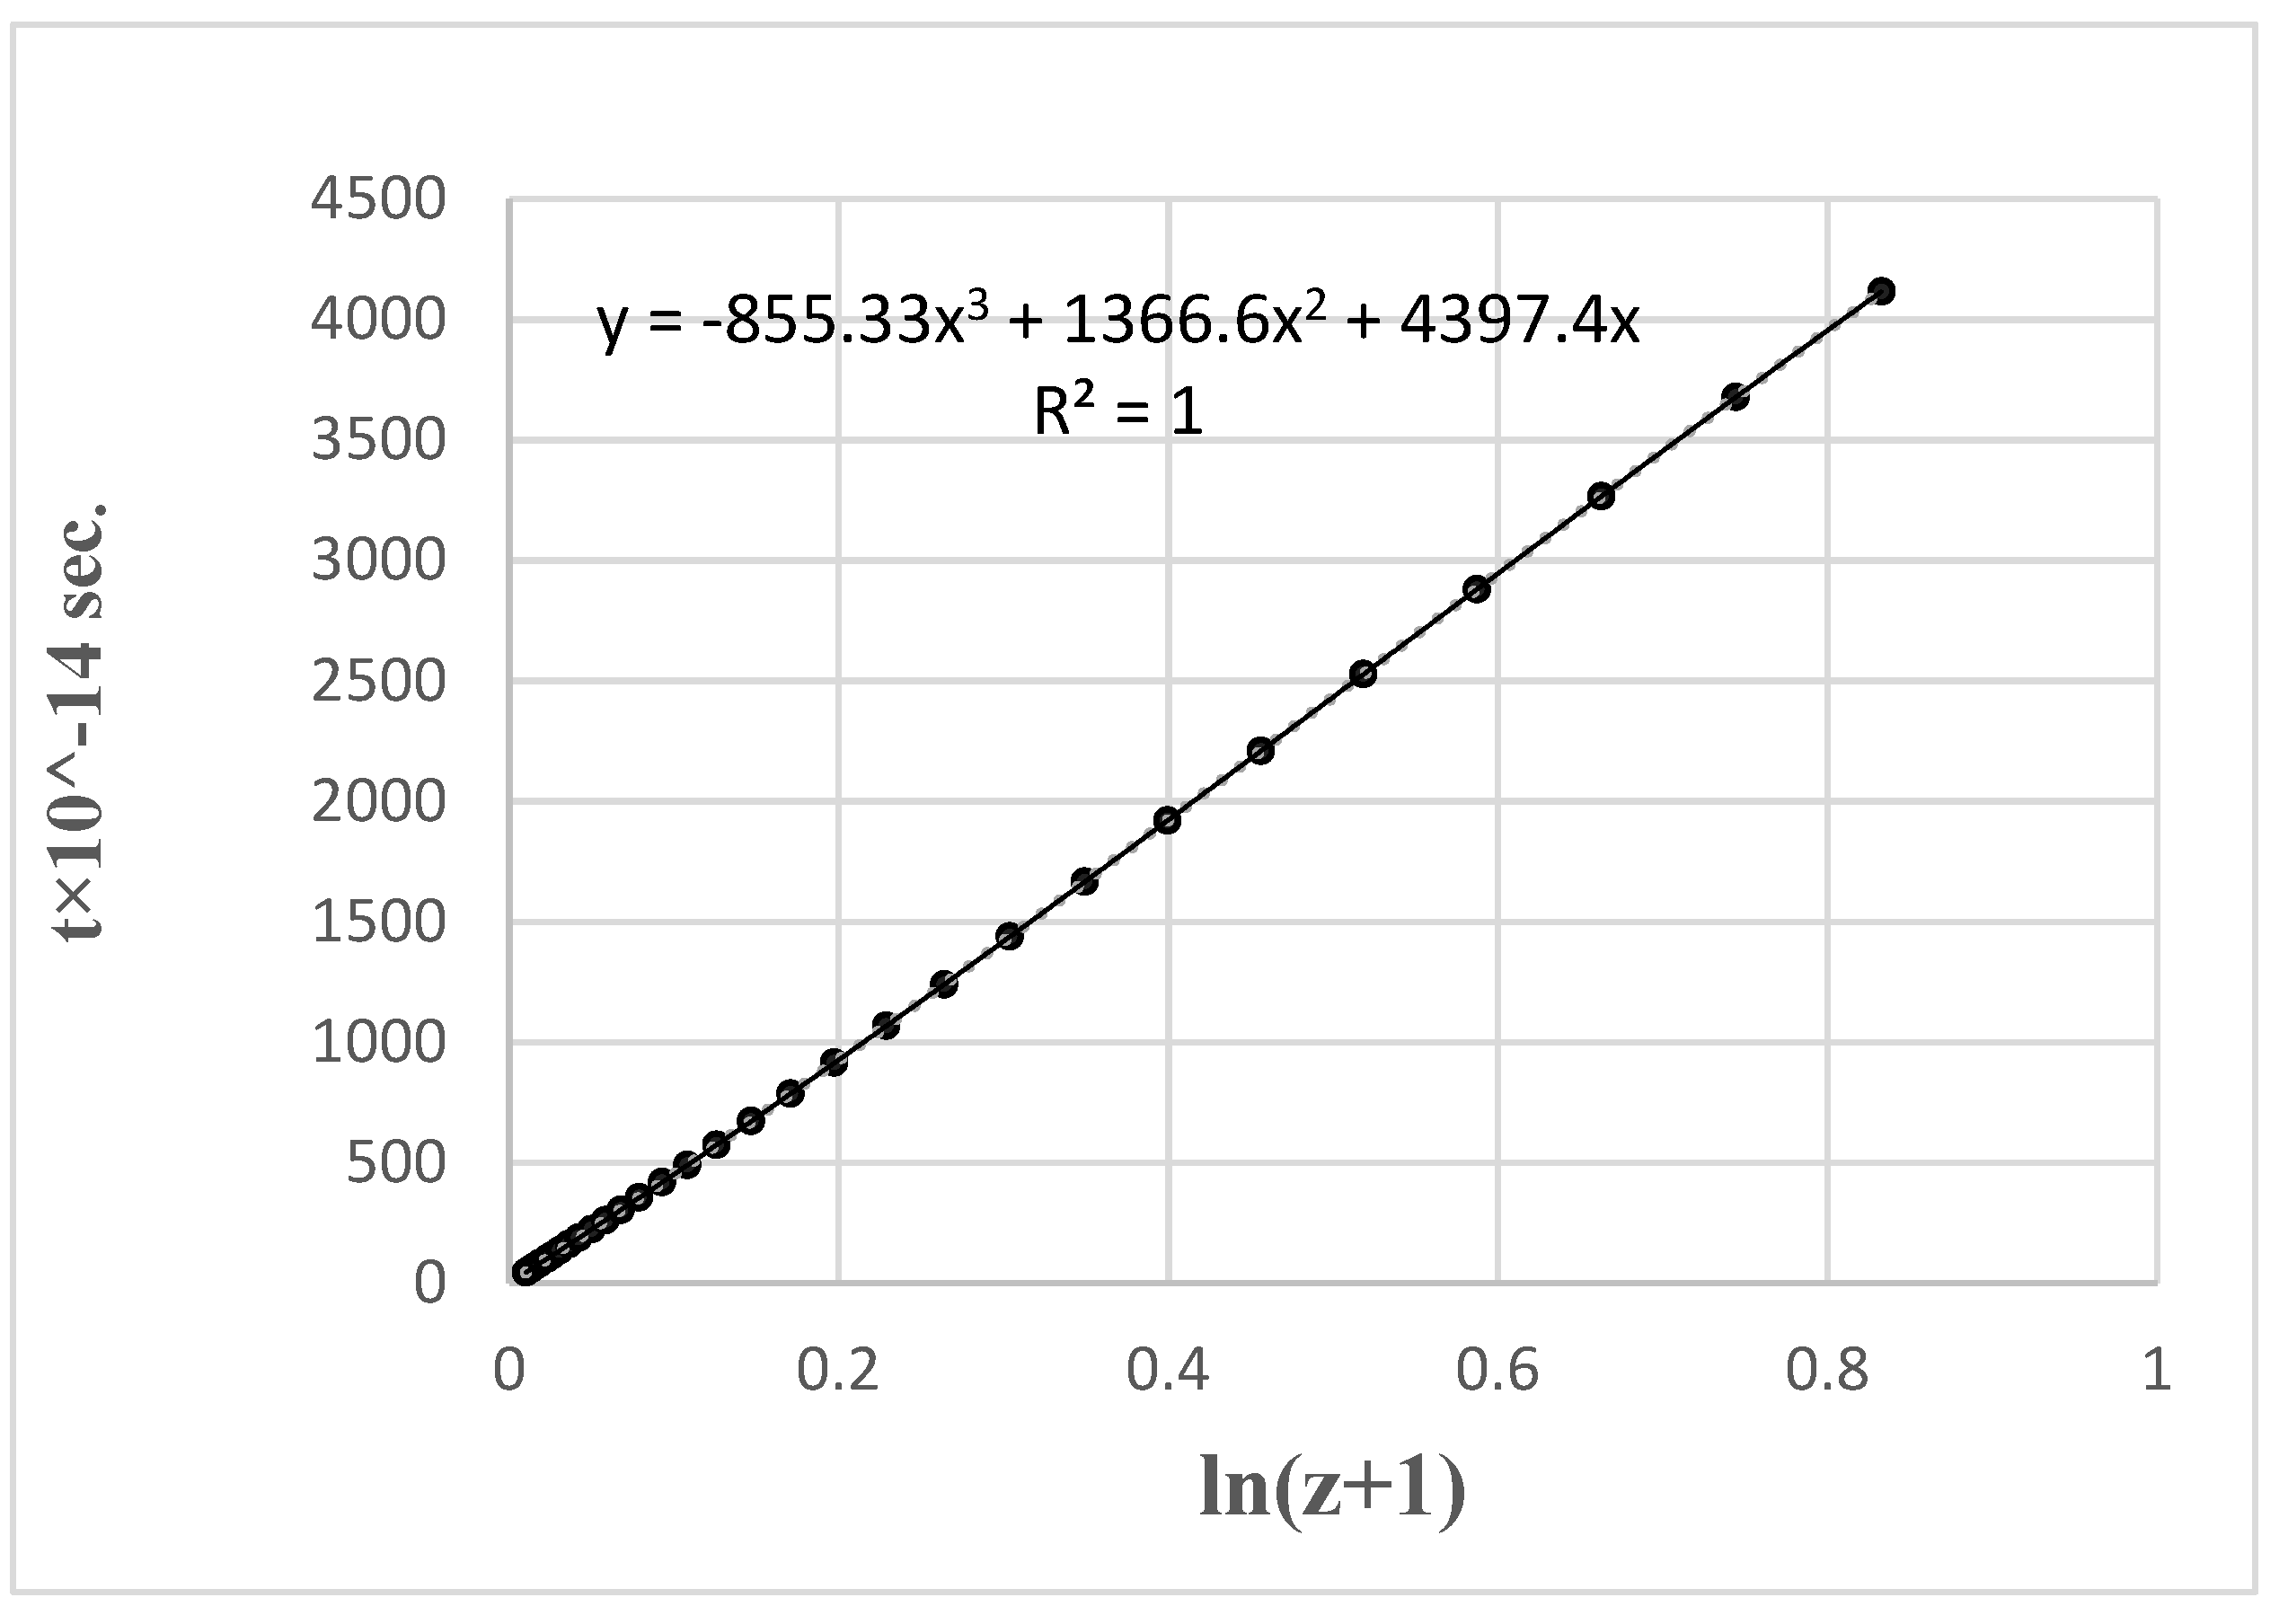
Figure 2 shows the same data plotted on the ln(
z+1)/
t scale.
The fit parameters and goodness of fit indicators are presented in
Table 2 and
Table 3.
As illustrated by Figs. 1 and 2, both equation (8) (the expanding universe model) and equation (9) (the TL model) match the calculated data with very high accuracy. The exceptionally small ∑χ2 values on the order of 10-5–10-6 offer convincing evidence of the equivocality of the ΛCDM and TL model in the low RS range.
The corresponding linear
t/(
z+1) HDs were derived by converting
µ to
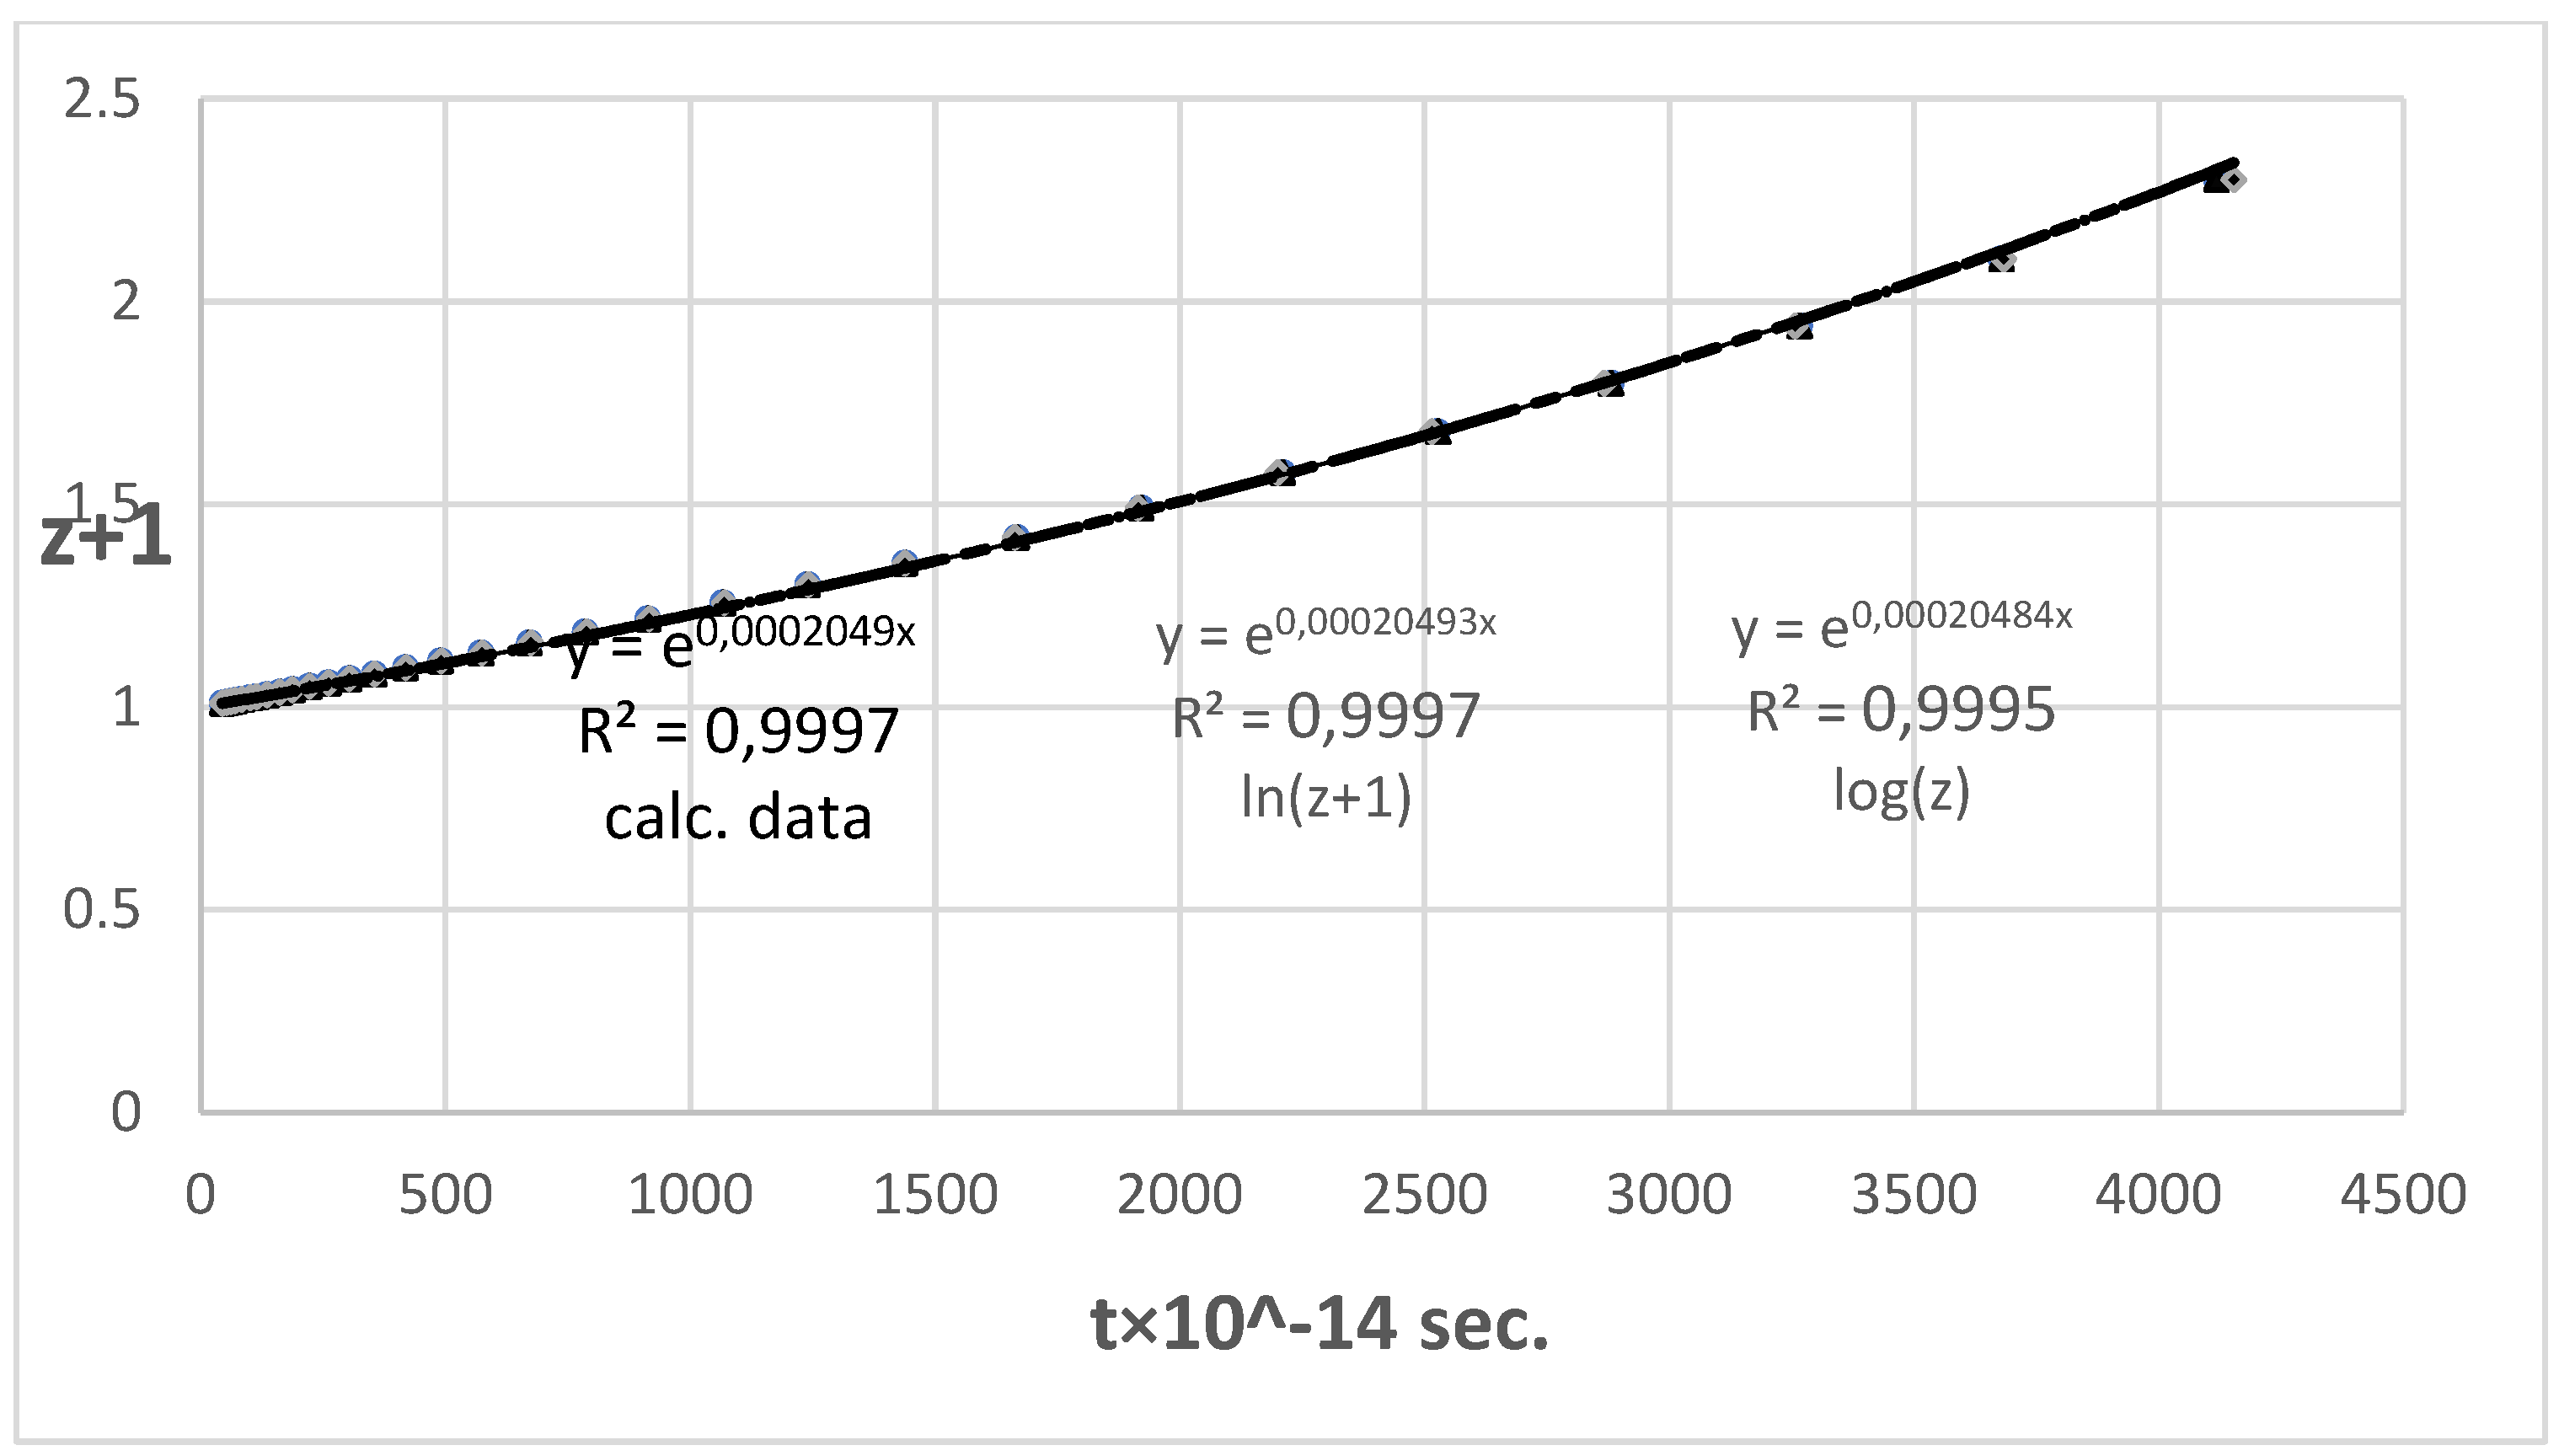
t using equations (3-5) based on the fit coefficients from equations (8) and (9). The linear HDs for both the log(
z) and the ln(
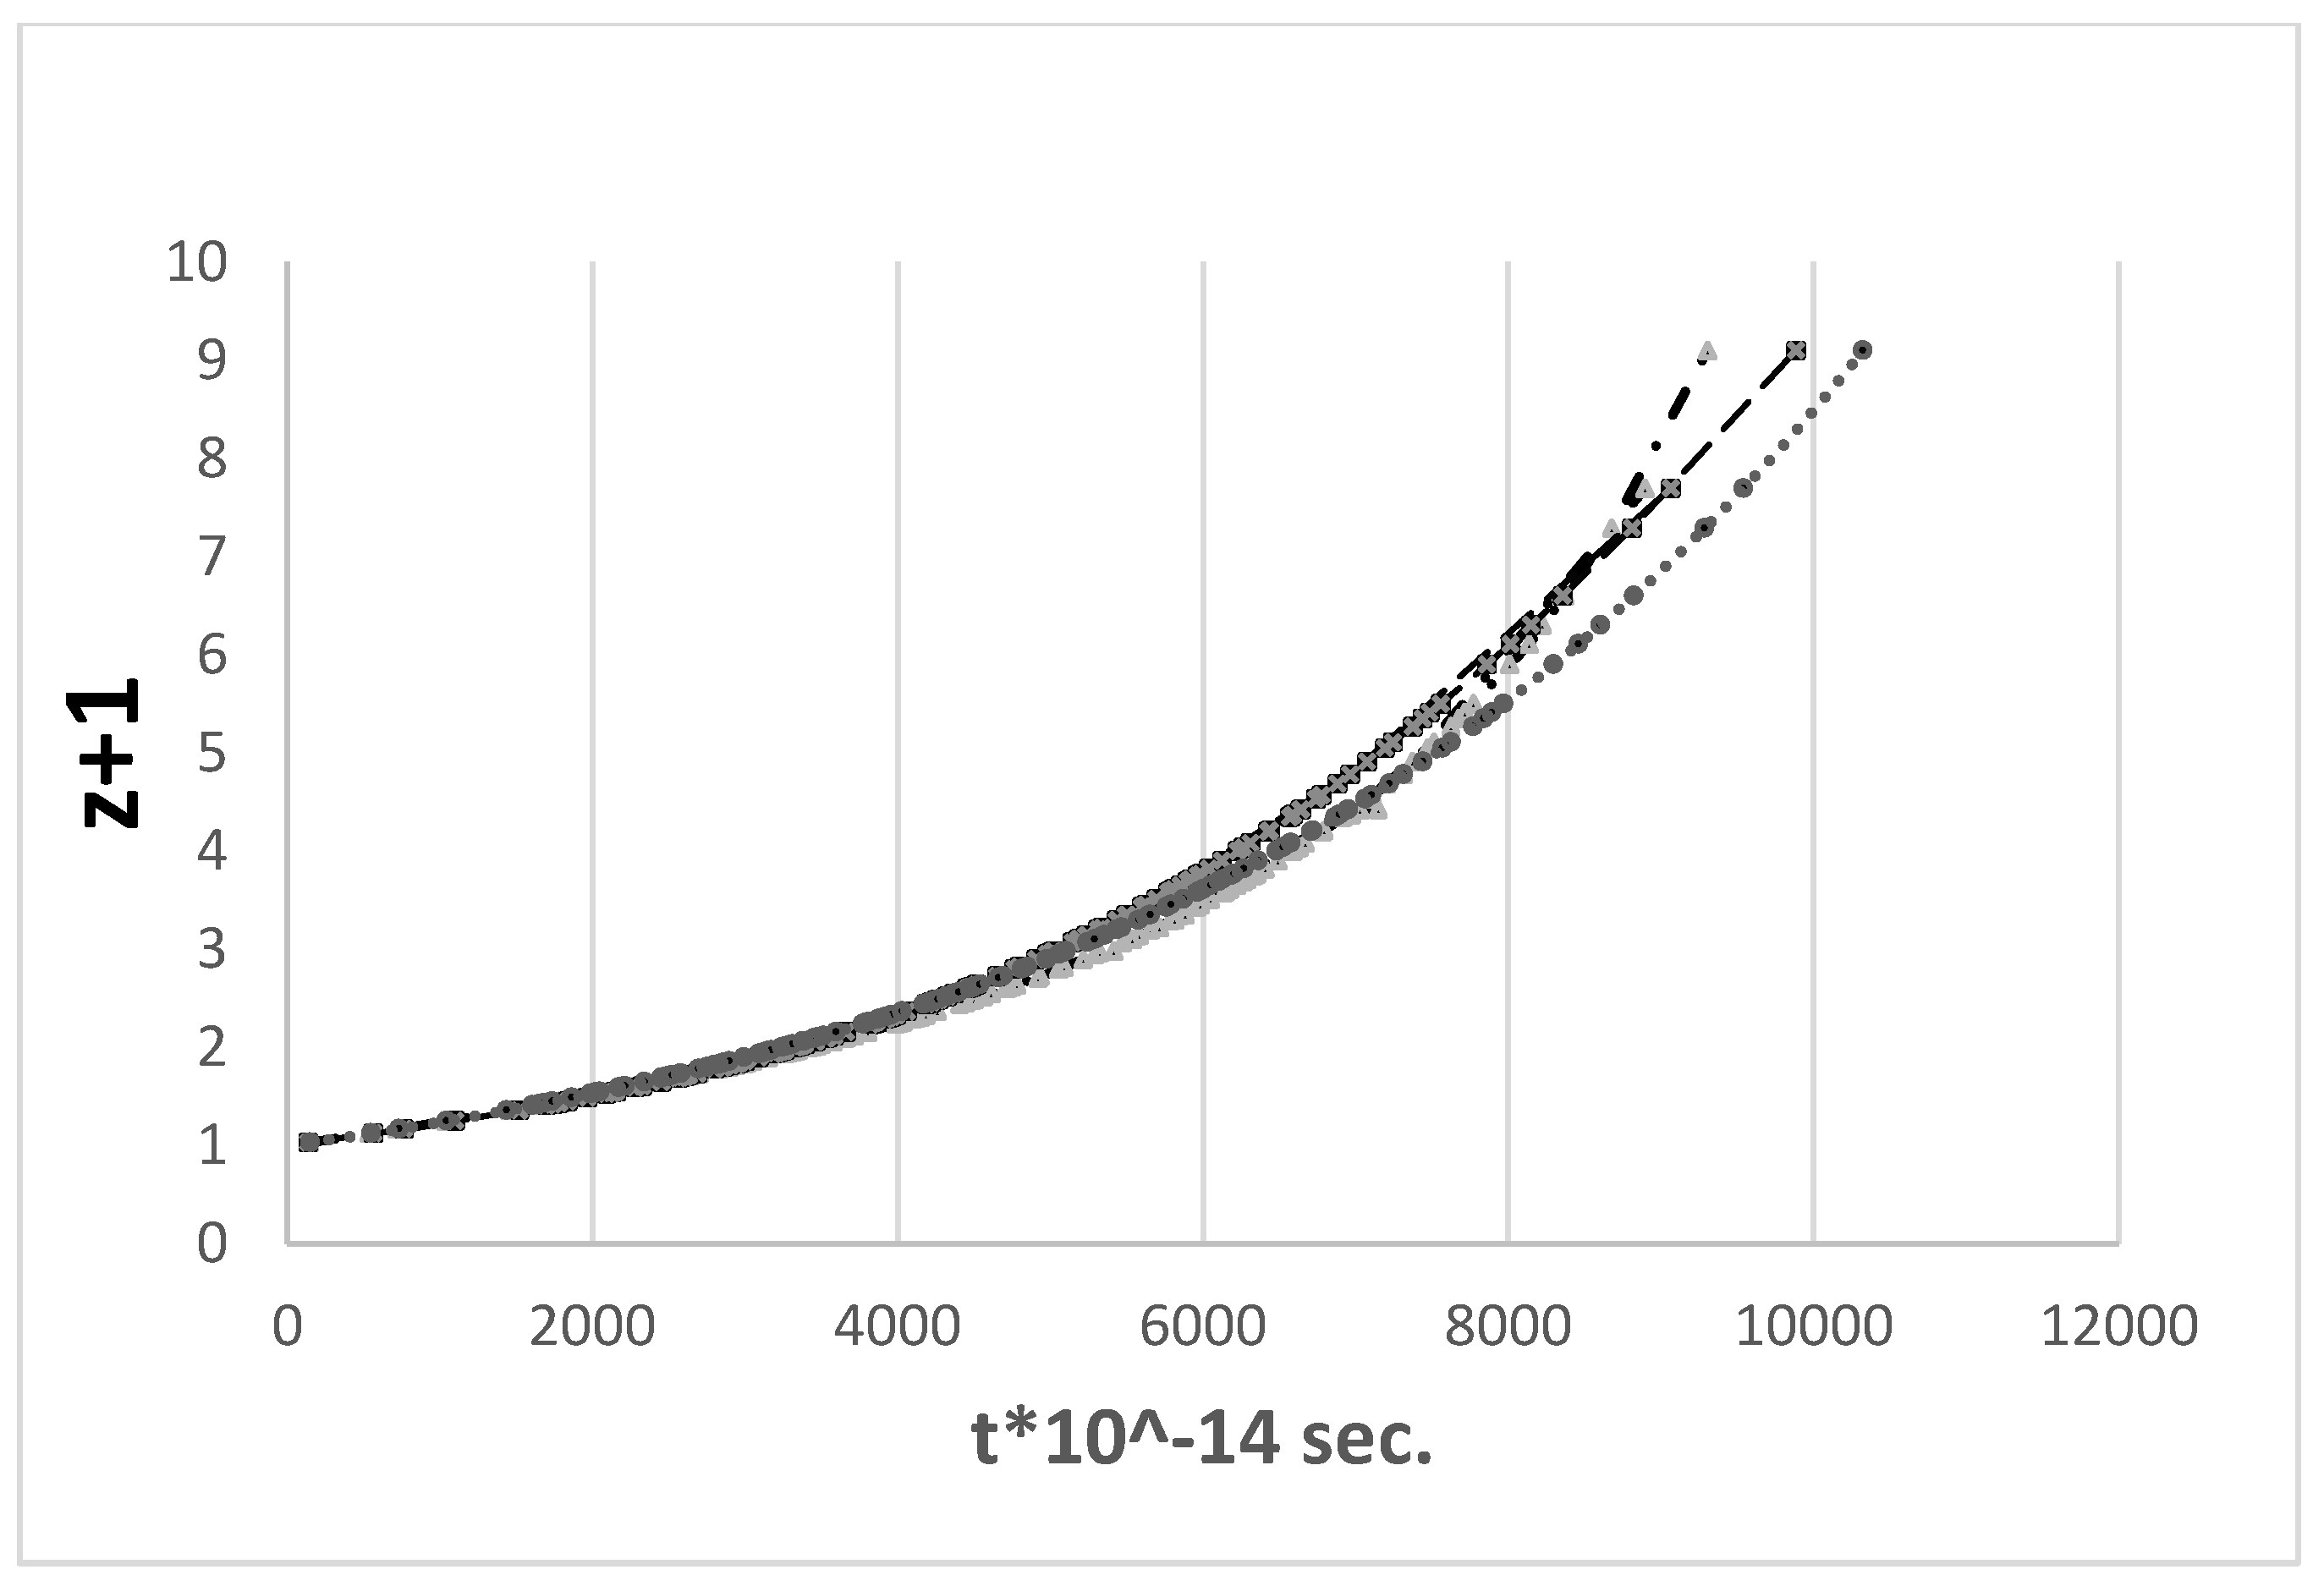
z+1) representations and the linear HD for the calculated data are shown in
Figure 3.
The three curves (i.e., the one calculated based on the parameters of the ΛCDM model, and the log(
z)/
µ and
d/ln(
z+1) lines) have an exponential slope, are closely congruent, and cannot be told apart by visual examination. The corresponding Hubble constants and variances are shown in
Table 4.
The Hubble constants are similar to within 0.5%, with values of hTL = 0.6319 for the logarithmic log(z)/µ fit and 0.6322 for the ln(z+1) fit and calculated data.
Based on model calculations using 35 equidistant data points in the RS range z = 0.03–1.02, the
hTL equivalents for
hCDM = 0.68, 0.70 and 0.73 were determined in a similar way. The results are summarised in
Table 5.
An obvious but frequently overlooked outcome is that, as shown in
Table 5, the equivalent Hubble constants
hCDM and
hTL are different, and this has a significant effect on the comparative evaluation of the ΛCDM and TL models in the high RS range. It can be seen from
Table 6 that the comparison of the observed high RS GRB data with the competing ΛCDM and TL models using
hCDM =
hTL is imprecise.
The ∑
χ2 differences between
hCDM = 0.70 and
hTL = 0.70 for the observed data show that
hTL = 0.70 gives the poorest fit, whereas a comparison of
hCDM = 0.70 with
hTL = 0.66 shows the opposite: the
hTL = 0.66 model gives the best fit to the observed data. The use of
hTL =
hCDM instead of the best fit
hTL for comparison inevitably leads to the wrong conclusion, that the TL model does not fit the data and can therefore be rejected. The results presented here show that for a proper comparison of
∑χ2 for TL models, the correct approach is a Hubble constant close to the expectation value of
hTL, as shown in
Table 5, or, depending on data quality (influence of scatter and/or outliers on
χ2), the best-fit value of
hTL.
6. Hubble Diagram for High RS GRBs, Data Set b
6.1. log(z)/µ Hubble Diagram
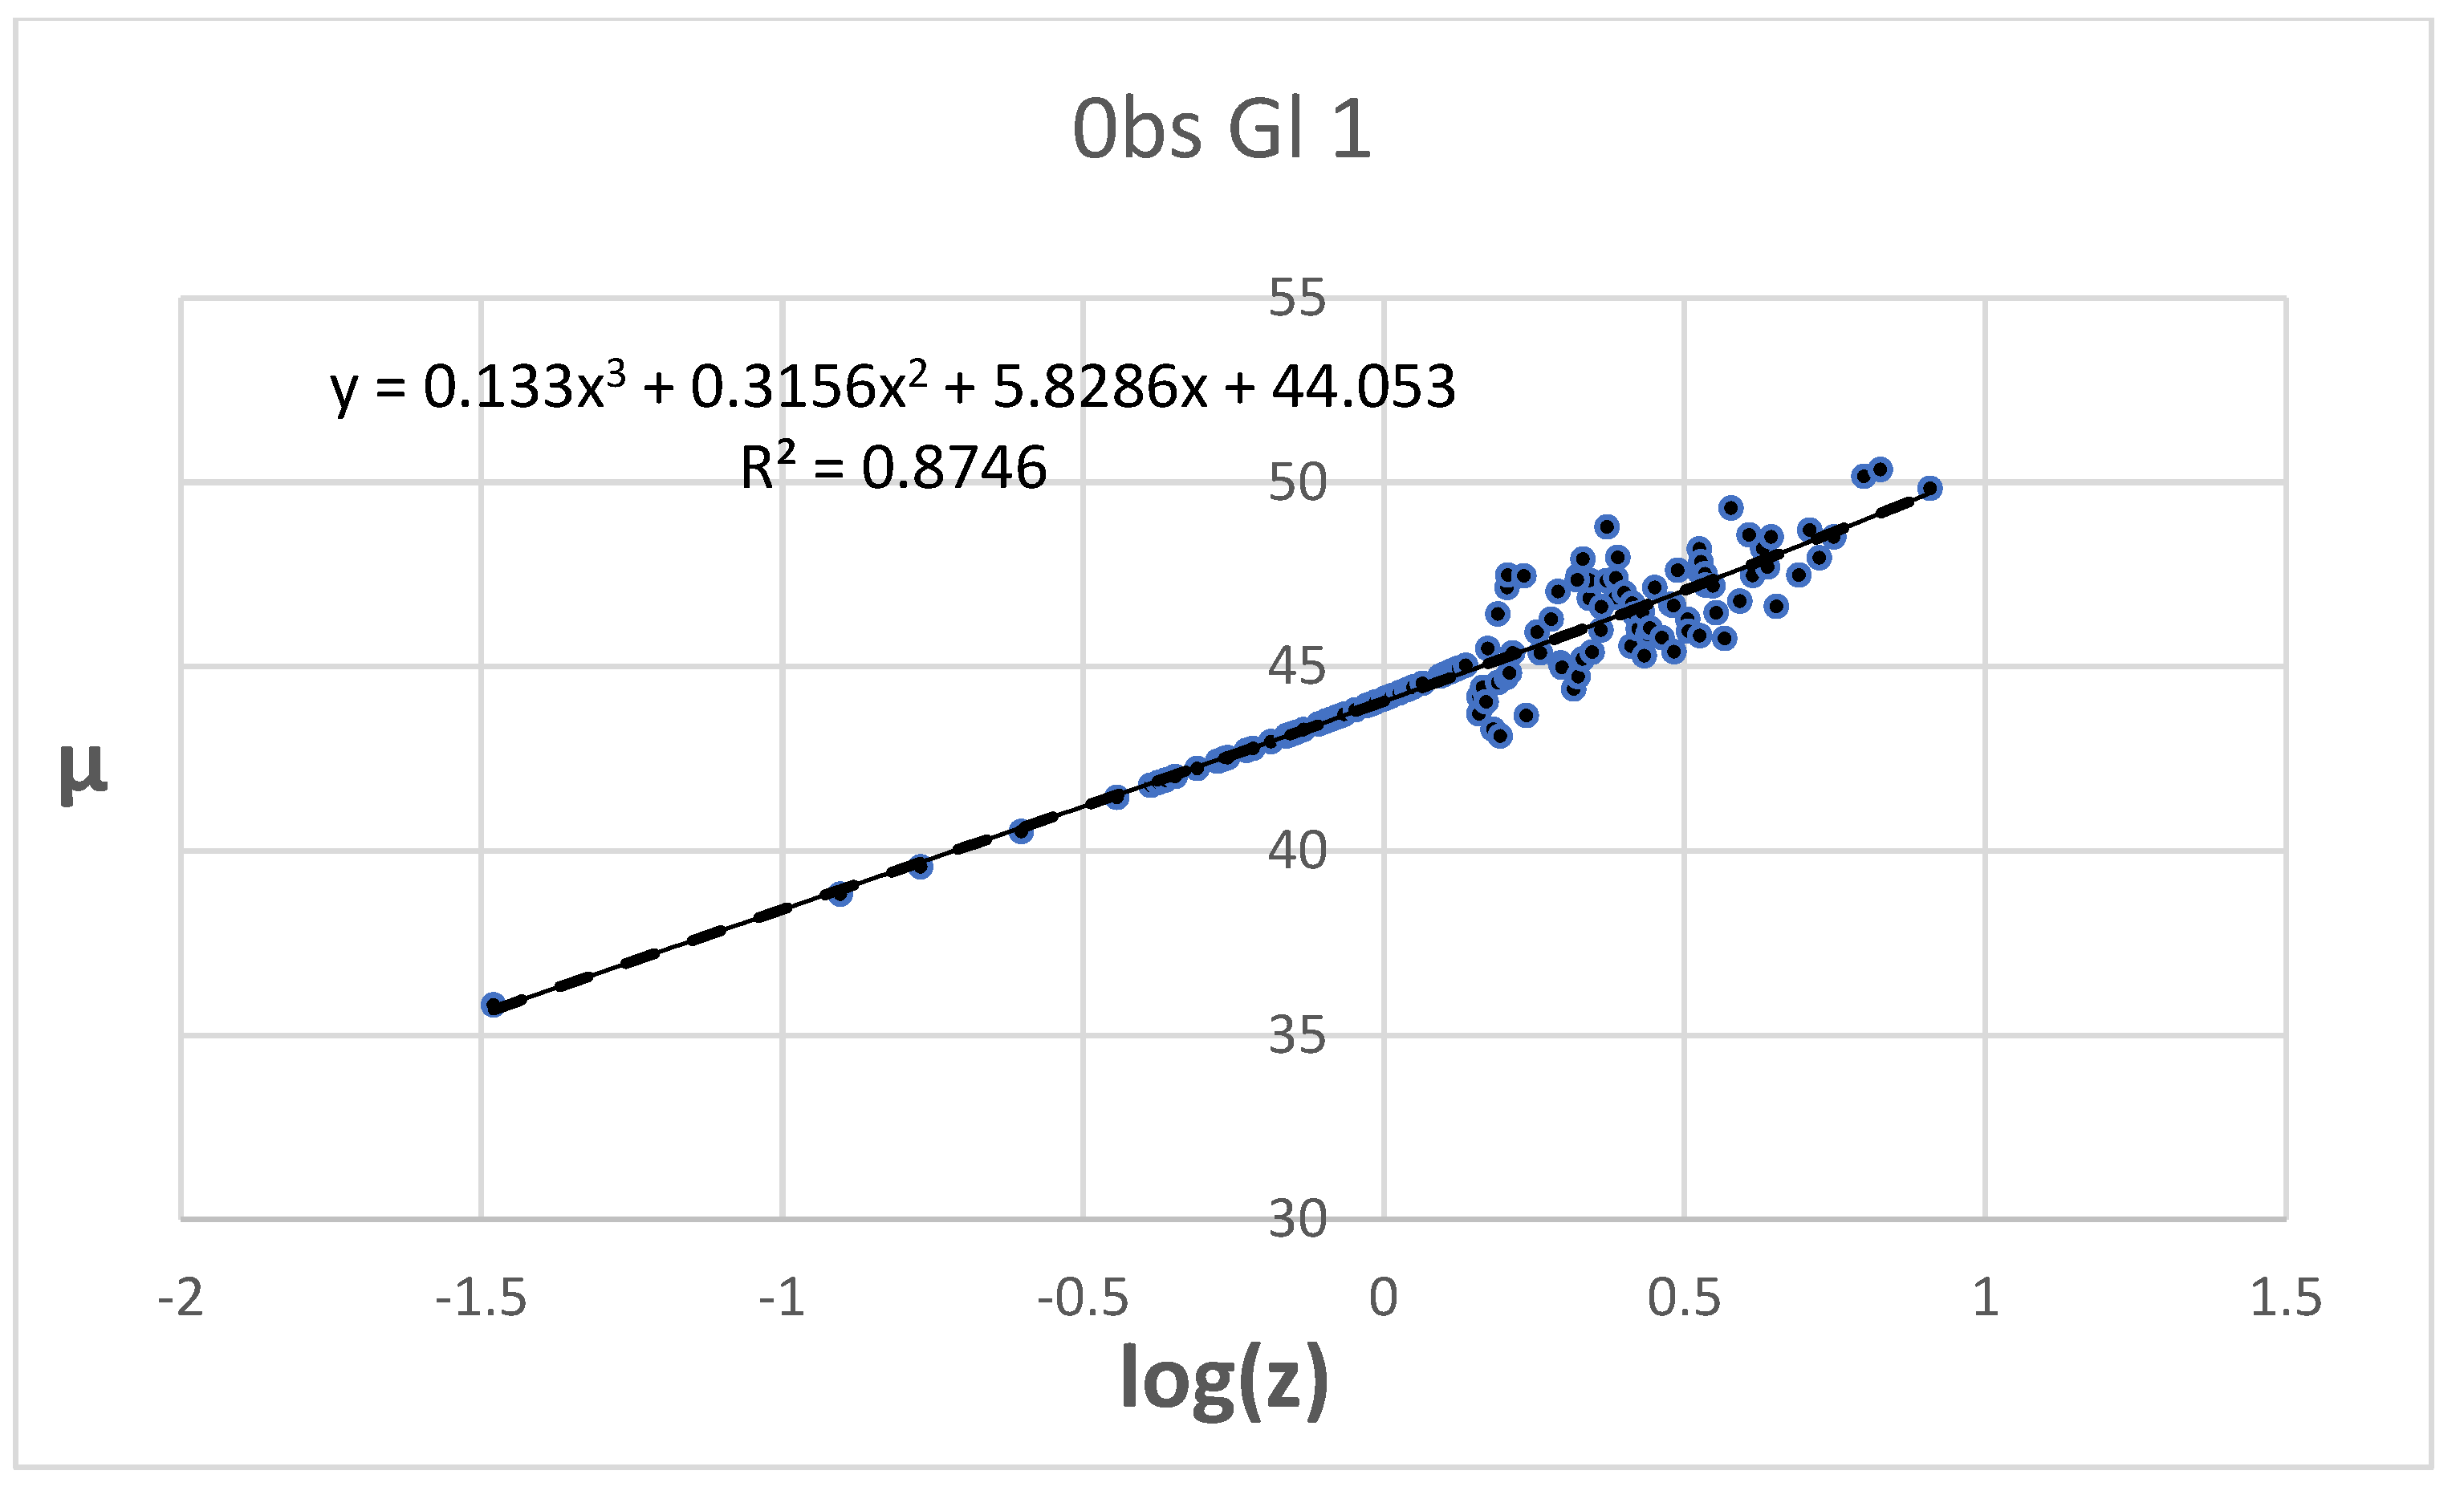
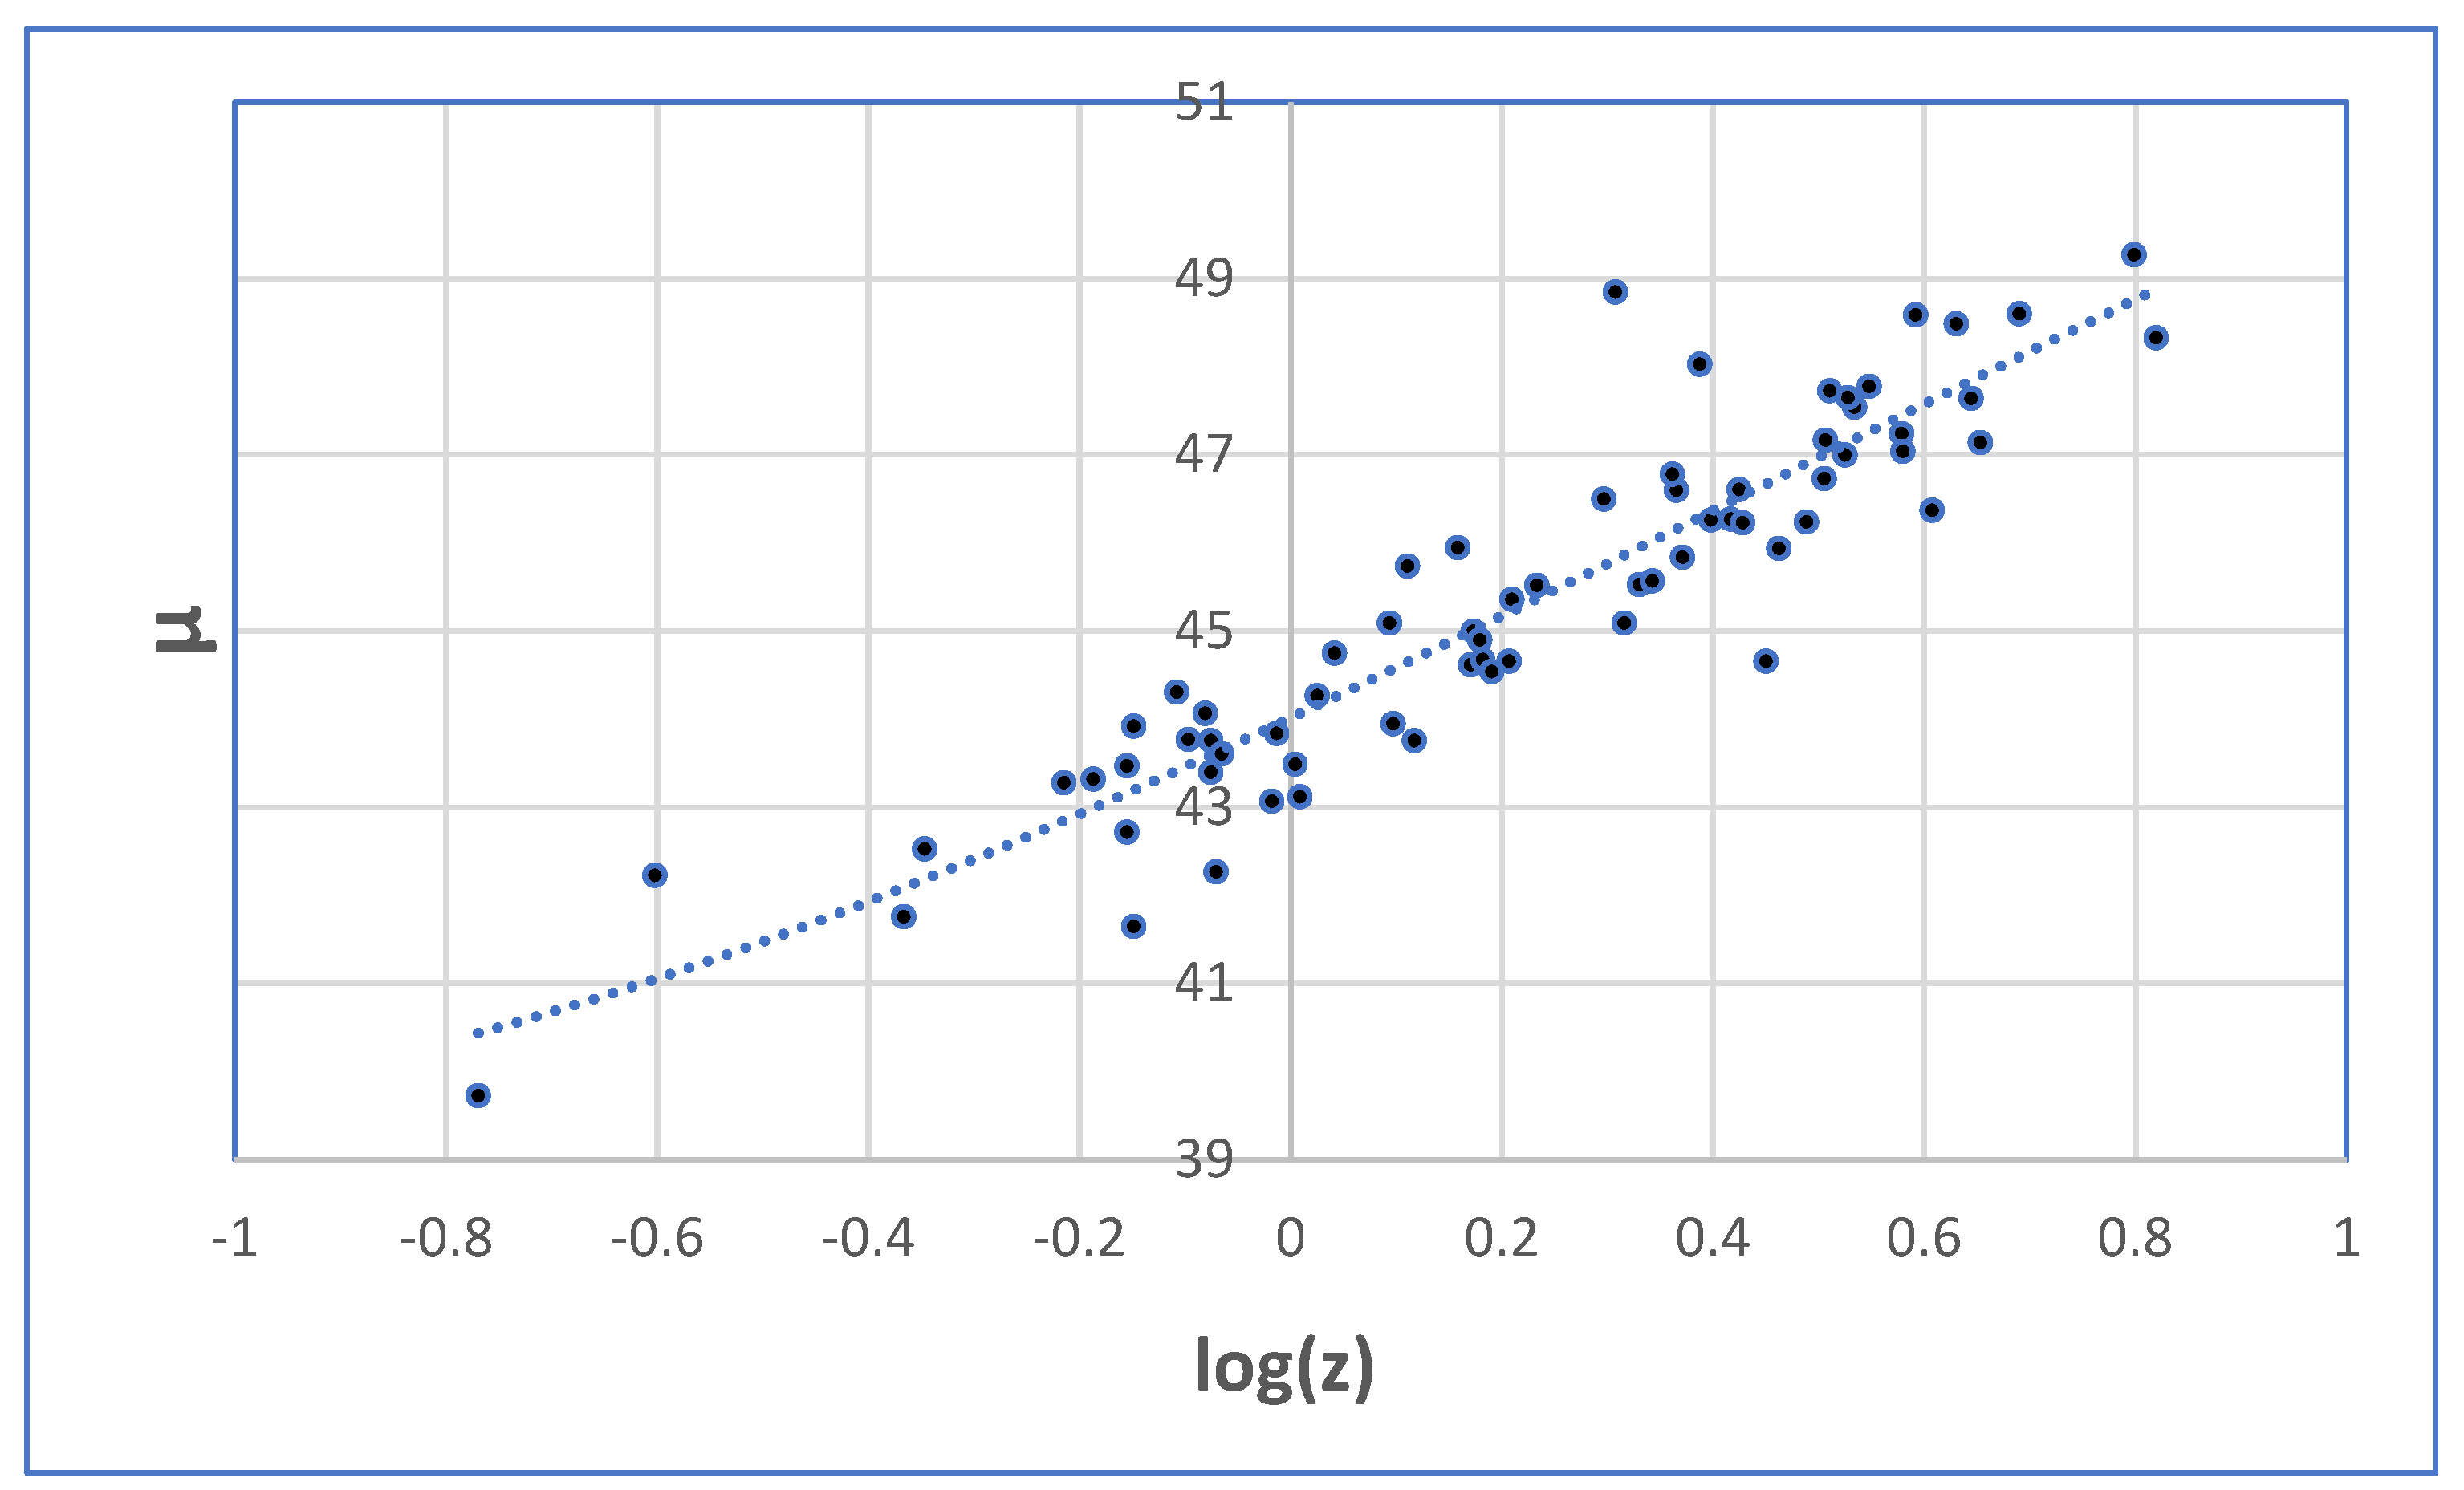
The log(
z)/
µ Hubble diagram is depicted in
Figure 4.
As the data points for high RS show pronounced scatter, the variance of the fit reaches only R
2 = 0.8746, and cannot be improved by any other reasonable mathematical function. The fit coefficients are shown in
Table 7.
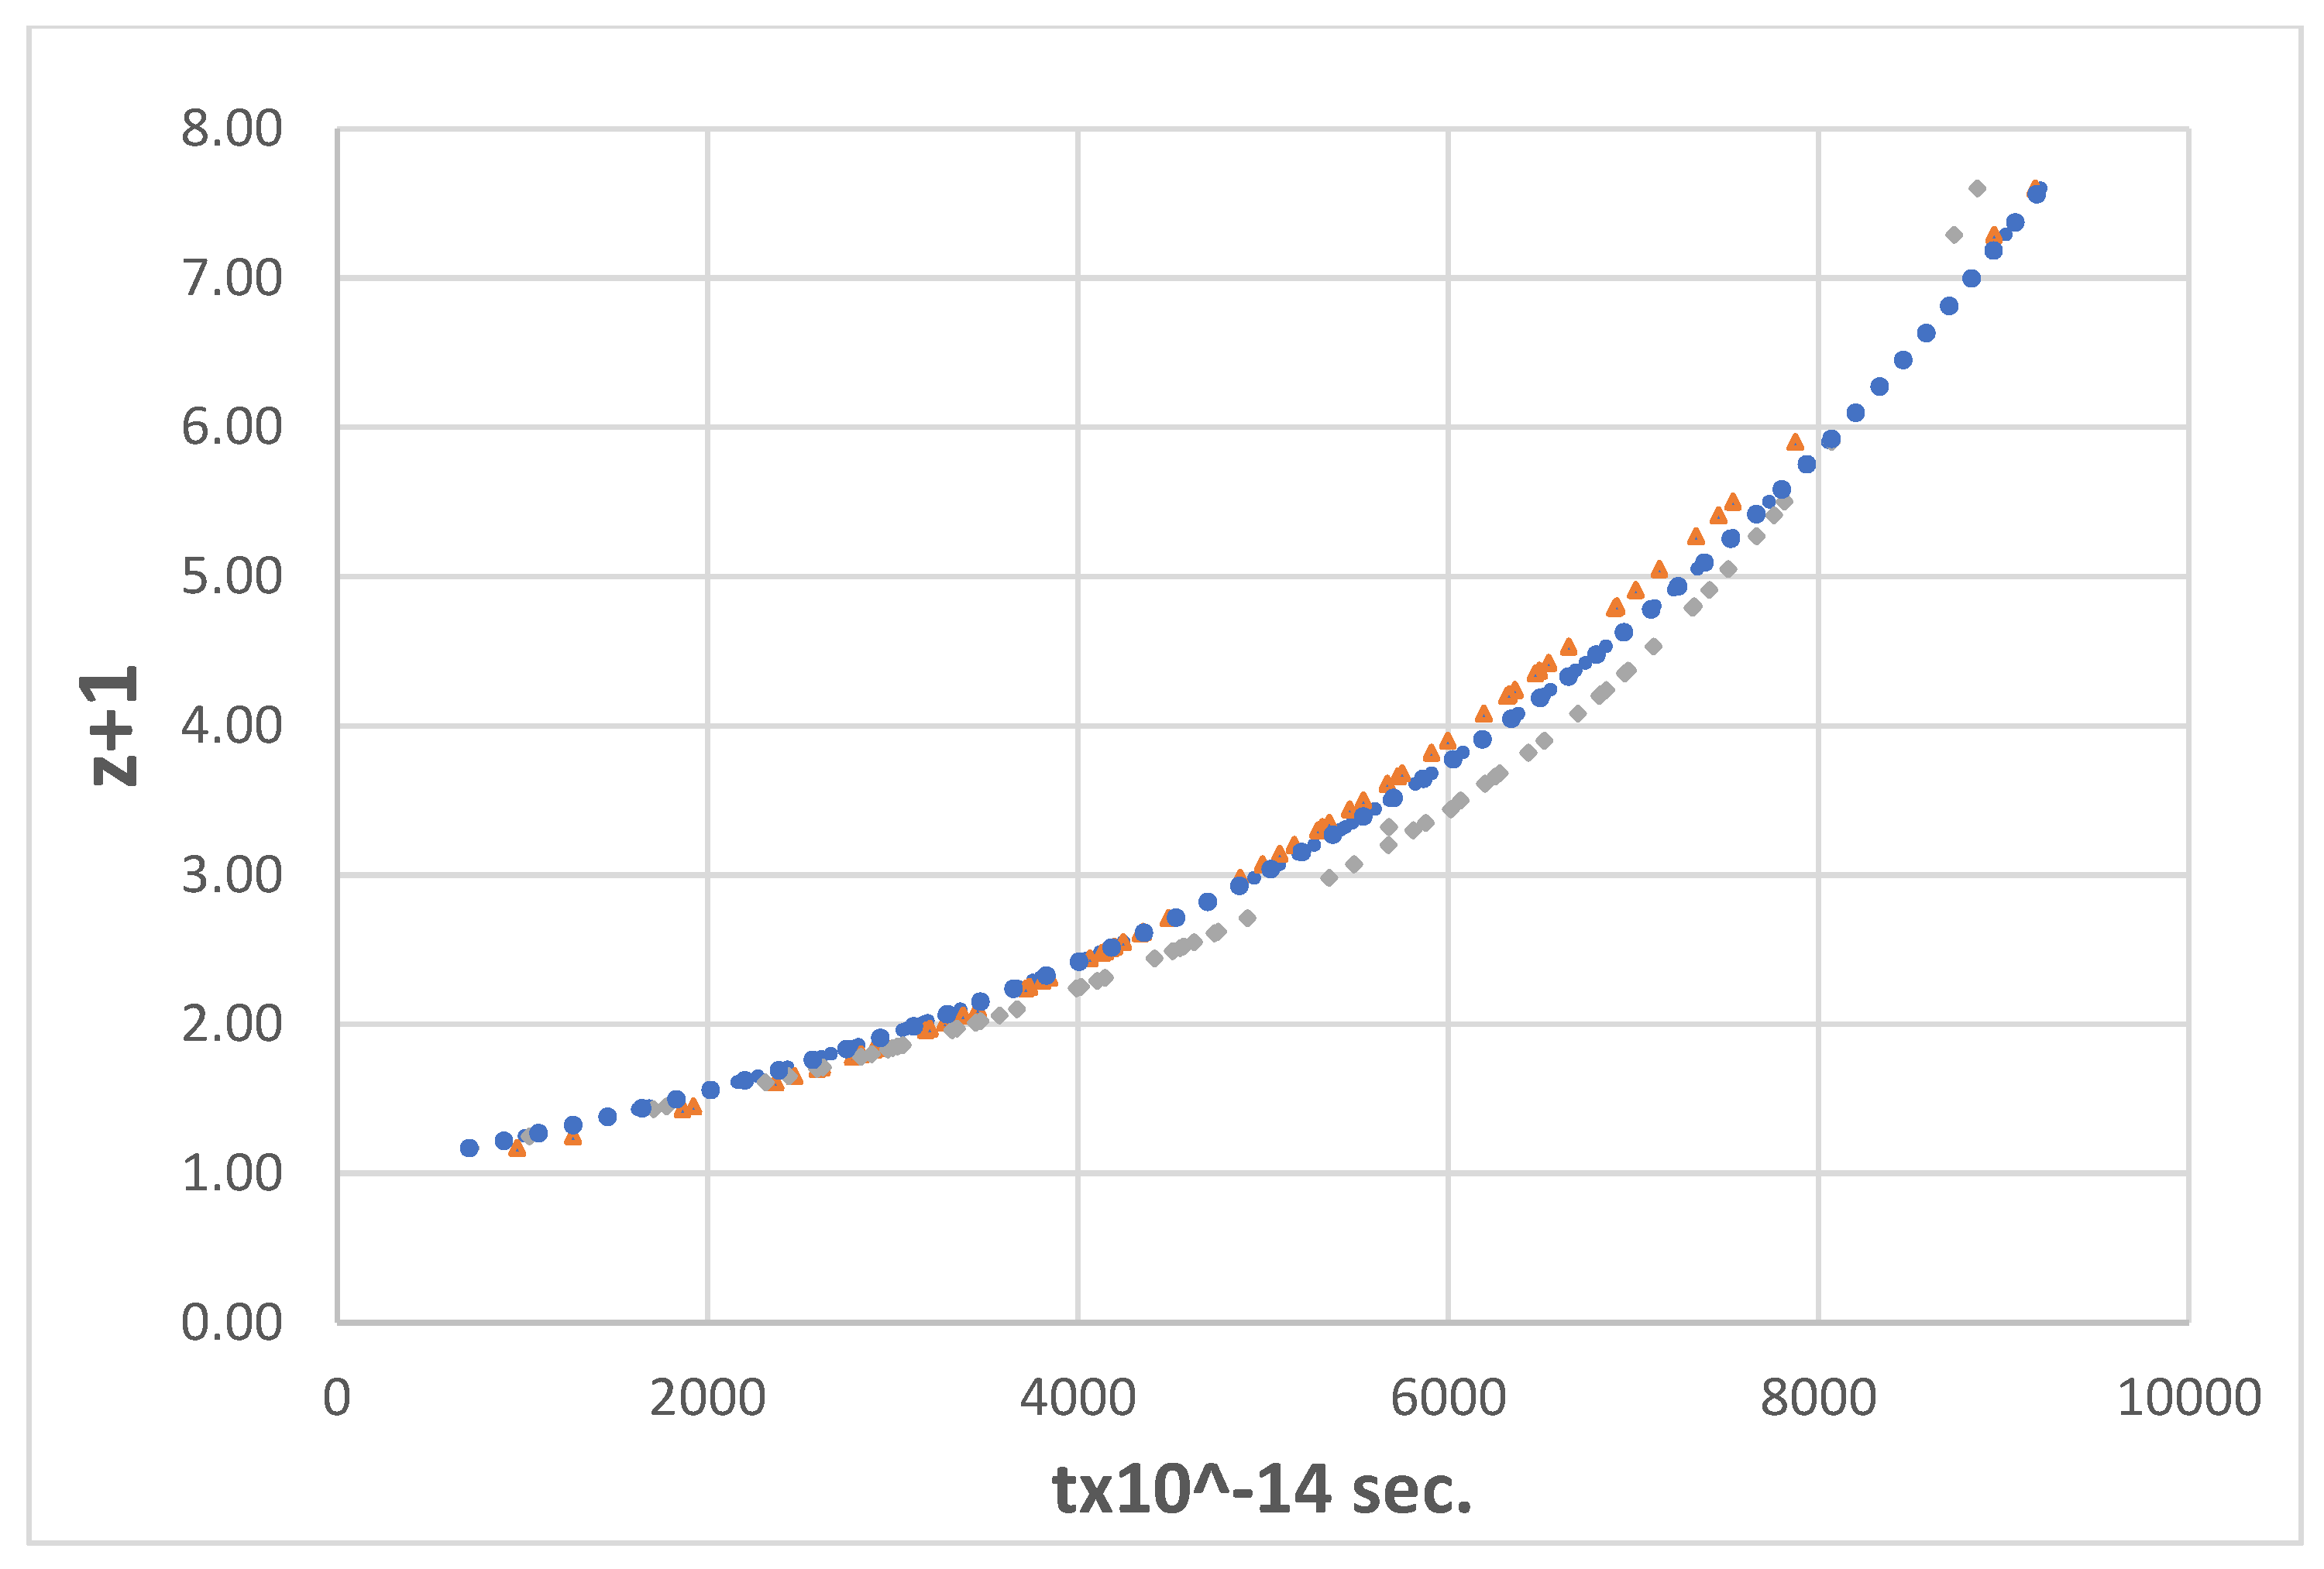
Figure 5 shows the linear
t/(
z+1) HDs inferred from the best fit coefficients of the observed data (squares) together with the corresponding exponential
hTL = 0.66 (dots) and the HD for
hCDM = 0.70 (triangles).
The GRB HD exhibits some irregular shape between
hTL = 0.66 and
hCDM = 0.7 with
and
(µfit,obs stands for calculated magnitudes inferred from the polynomial best-fit function, µTl calc. and µCDM calc. were calculated from
hTL = 0.66 for the TL and from Ώ
M = 0.287, w = -1 and
hCDM = 0.7 for the ΔCDM model, respectively.)
The result favours the TL model, but as can be seen from
Figure 5, the deviation from the ideal exponential shape is too large to draw safe conclusions. A profile examination shows systematic deviations, especially at RS ≥ ~ 3–4, where data points are visible above the exponential line.
In summary, the ΔCDM model shows a poorer fit to the HD calculated on the basis of observed data, which suggests a somewhat better but still not correct portrayal of the TL model. No safe conclusion in favour of or against either of the competing models can be drawn from this result.
6.2. ln(z+1)/t Hubble Diagram
The linear ln(
z+1)/
t Hubble diagram is shown in
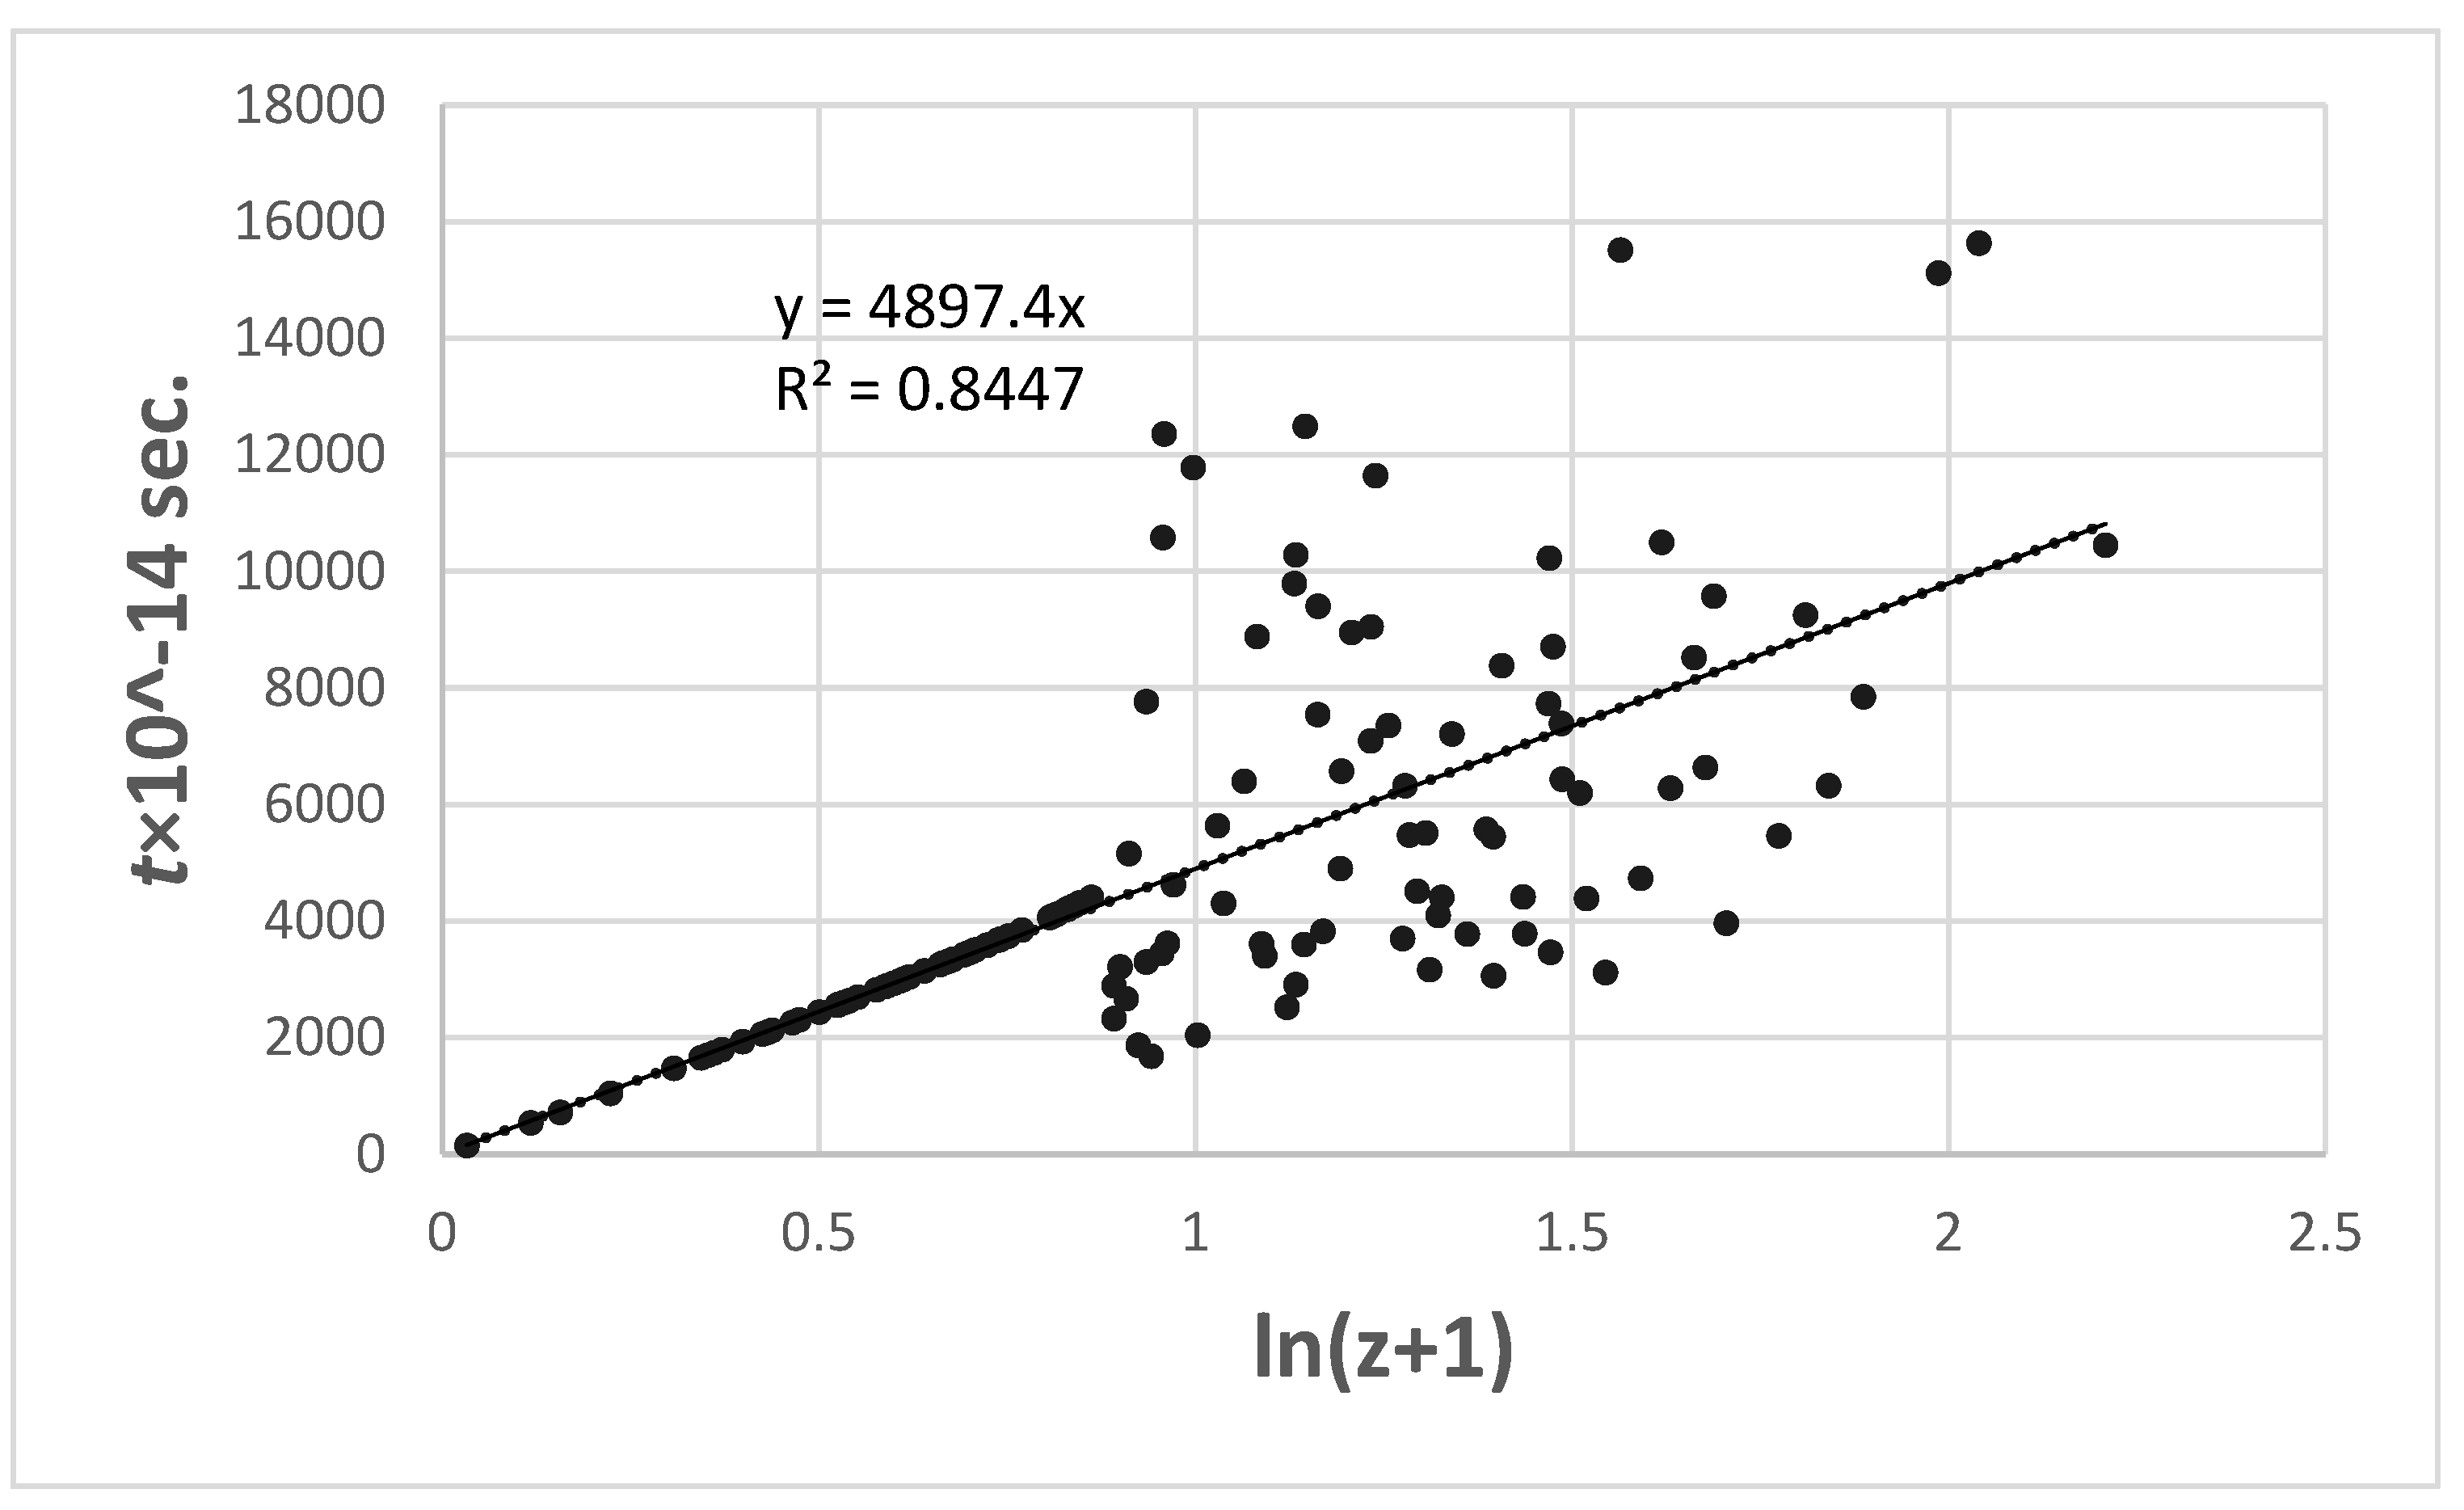
Figure 6.
Despite the extensive scatter in the observed photon flight times even at values of
z ≥ ~ 1.4, the ln(
z+1)/
t diagram is linear. Considering the quality of the data, it shows an astonishingly good variance of R
2 = 0.8447 that could only be worsened by fitting the observed data with higher-order polynomials. From
Figure 6, the equation that describes the photon flight time/
z relationship on the
t×10
-14 scale that goes into the linear
t/(
z+1) diagram is
Figure 7 shows the corresponding
t/ln(
z+1) HD.
The linear HD has a perfect exponential slope, with hTL = 0.63. This is in exceptionally good agreement with the expected value of hTL = 0.632 obtained from model calculations, although it is in clear conflict with the presently accepted point of view that the TL model does not fit the observed RS/µ data. The conclusion from the outcome of the ln(z+1) t-test is that both the low RS SN1a data and the high RS GRB HDs for a TL cosmology give an adequately good fit to the observed data. From an unbiased examination of the data, we see that the TL model cannot be dismissed from further consideration.
7. Hubble Diagram for High RS GRBs, Data Sets d and e
7.1. log(z)/µ Hubble Diagram
The log(
z)/
µ Hubble diagram for data set d) is depicted in
Figure 8. The fit variance reaches R
2 = 0.8553, an acceptable value given the considerable scatter. The fit coefficients are shown in
Table 9.
Figure 9 shows the linear
t/(
z+1) HD inferred from the best fit coefficients of the observed data (squares), alongside the corresponding exponential
hTL = 0.68 (dots) and the HD for
hCDM = 0.70 (triangles). In the RS range of (z + 1) = 2 - 6 particularly, the disparities between the observed and reference HDs are evident even upon visual examination:
the GRB HD shows poor agreement with the ΛCDM model, and the conformity with the TL model is also unconvincing.
(µfit,obs stands for calculated magnitudes inferred from the polynomial best-fit function, µTl calc. and µΛCDM calc. were calculated from
hTL = 0.68 for the TL and from Ώ
M = 0.287, w = -1 and
hCDM = 0.7 for the ΔCDM model, respectively.)
The result is clear: the ΛCDM model can be ruled out, while the deviation from the exponential line is smaller but still too large to draw safe conclusions.
7.2. ln(z+1)/t Hubble Diagram
The linear ln(
z+1)/
t Hubble diagram is depicted in
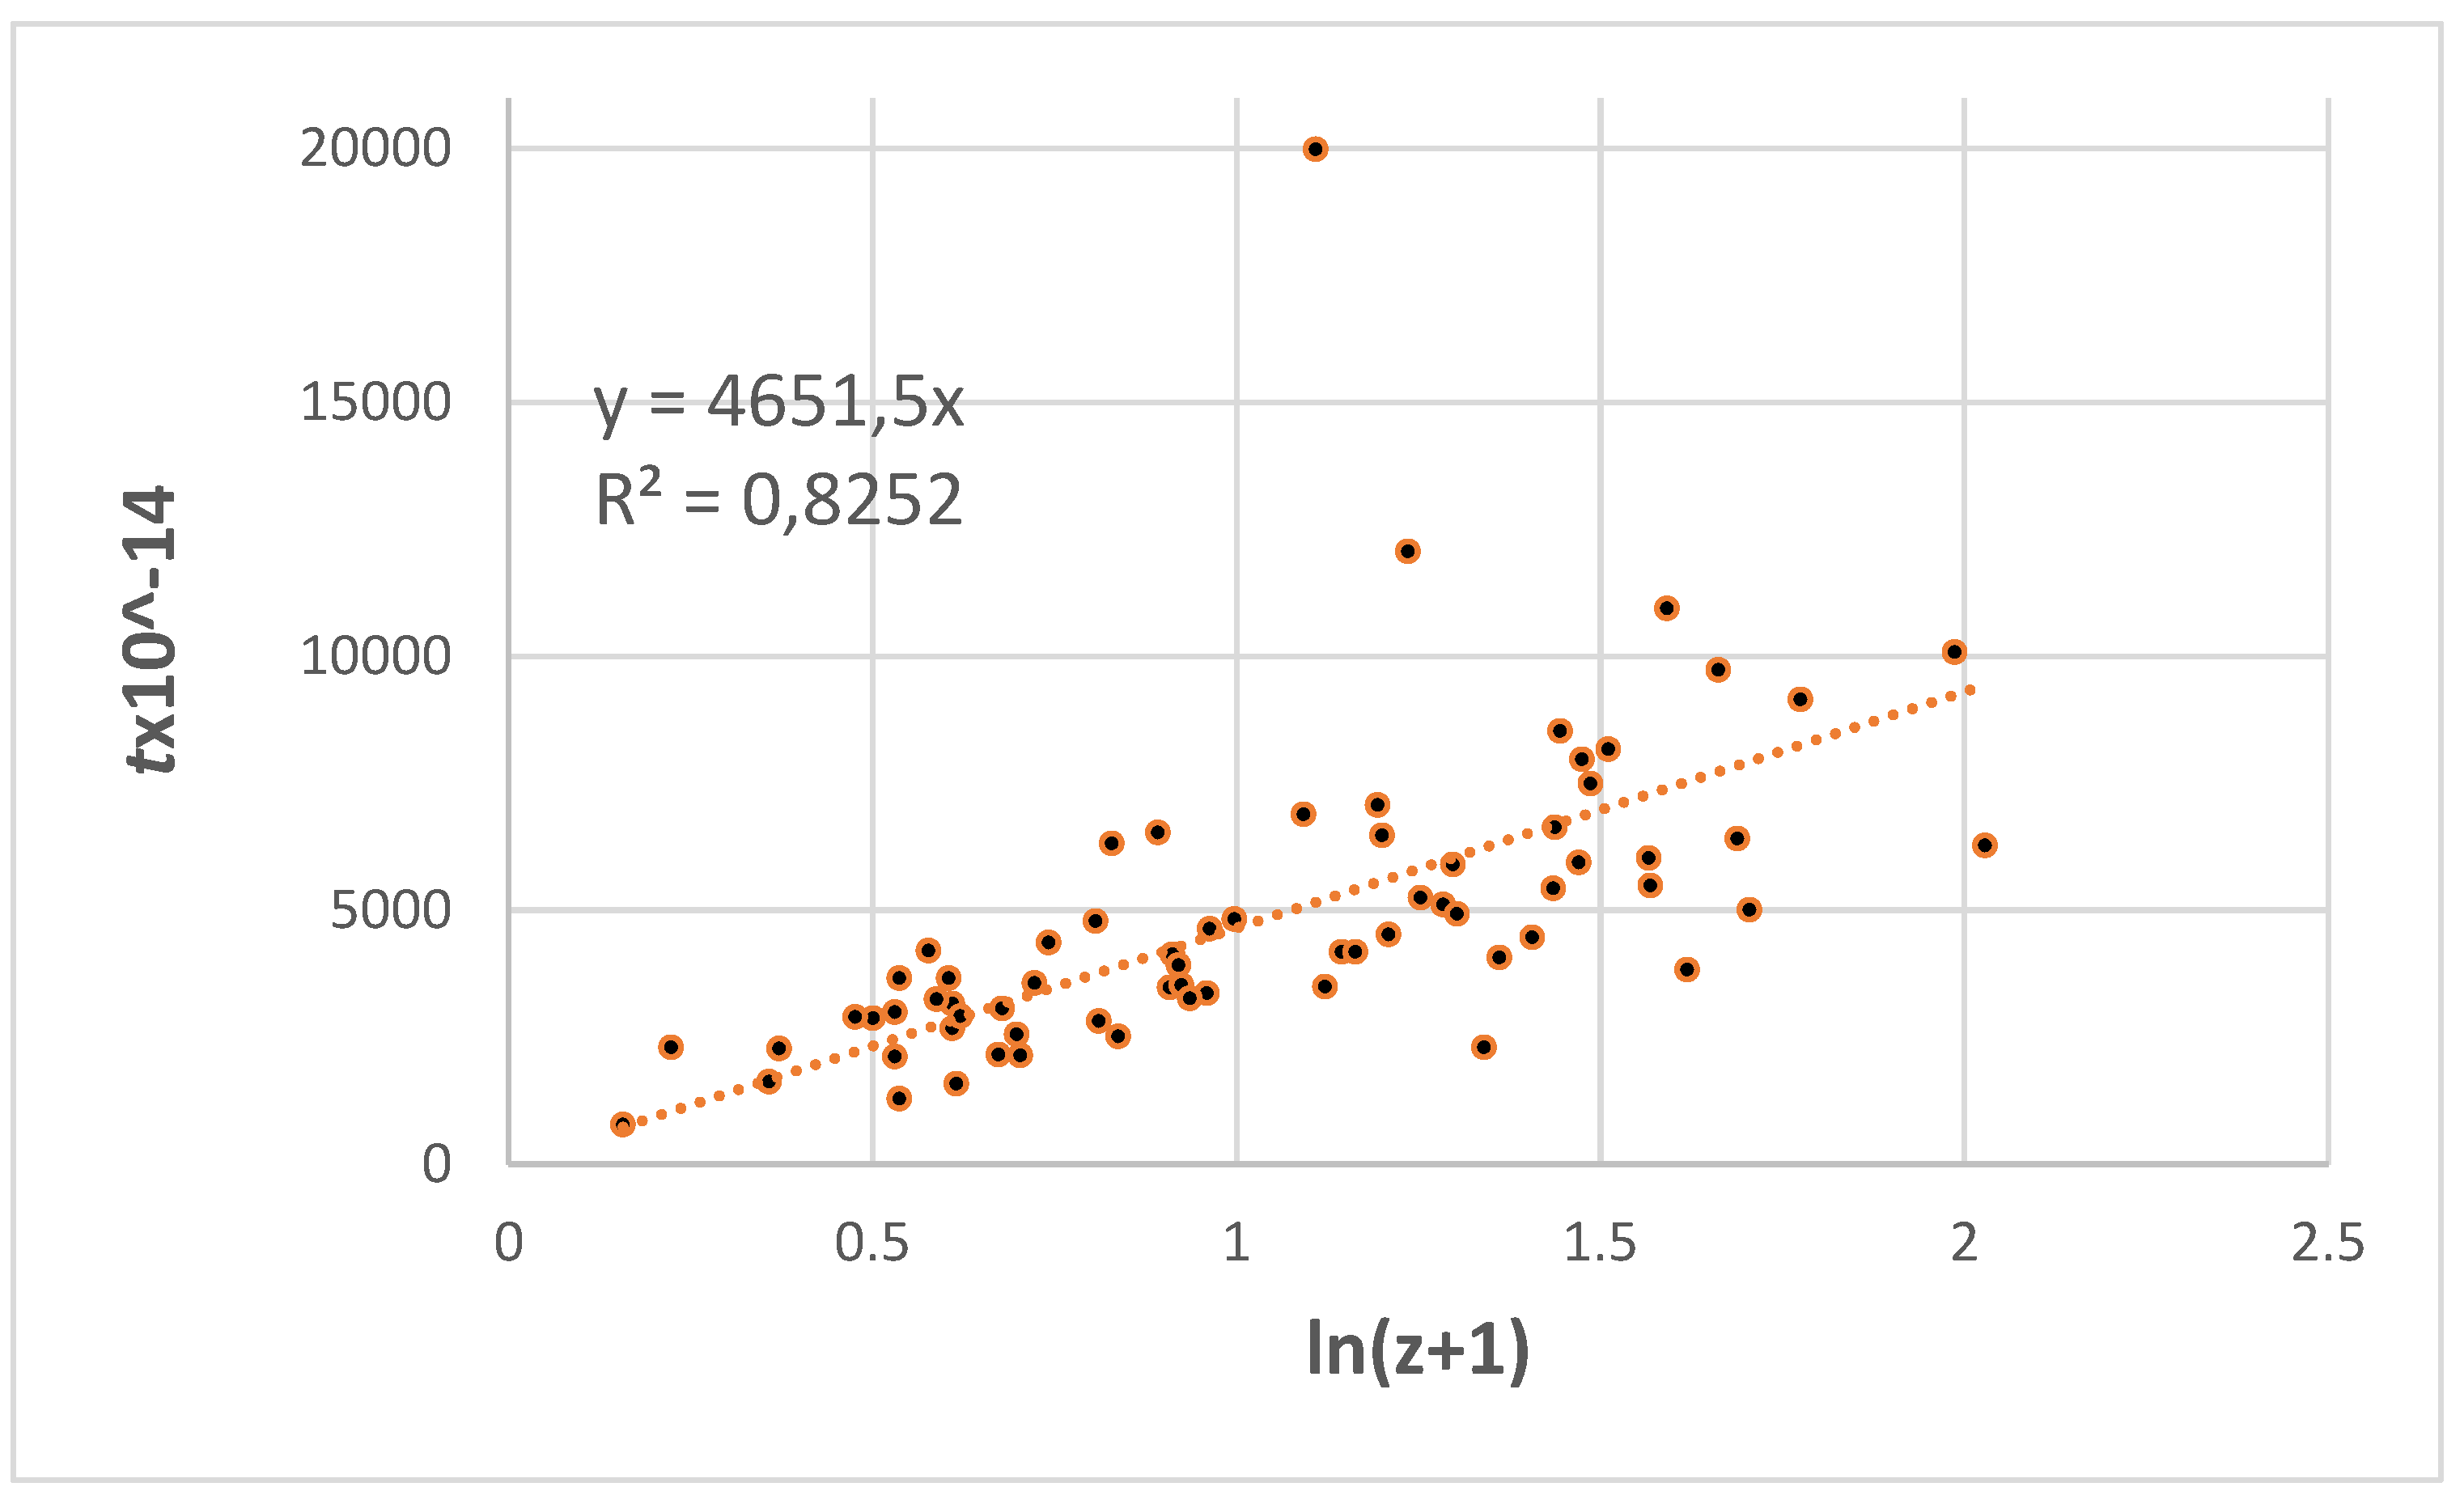
Figure 10. Despite the extensive scatter of the photon flight times, the ln(
z+1)/
t diagram is linear. Considering the quality of the data, the fit exhibits a remarkable variance of R
2 = 0.8252, which would only deteriorate if the observed data is fitted with higher-order polynomials. From
Figure 10, the equation that describes the photon flight time/
z relationship on the
t×10
-14 scale, which goes into the linear
t/(
z+1) diagram, is t = 4651.5xln(z+1).
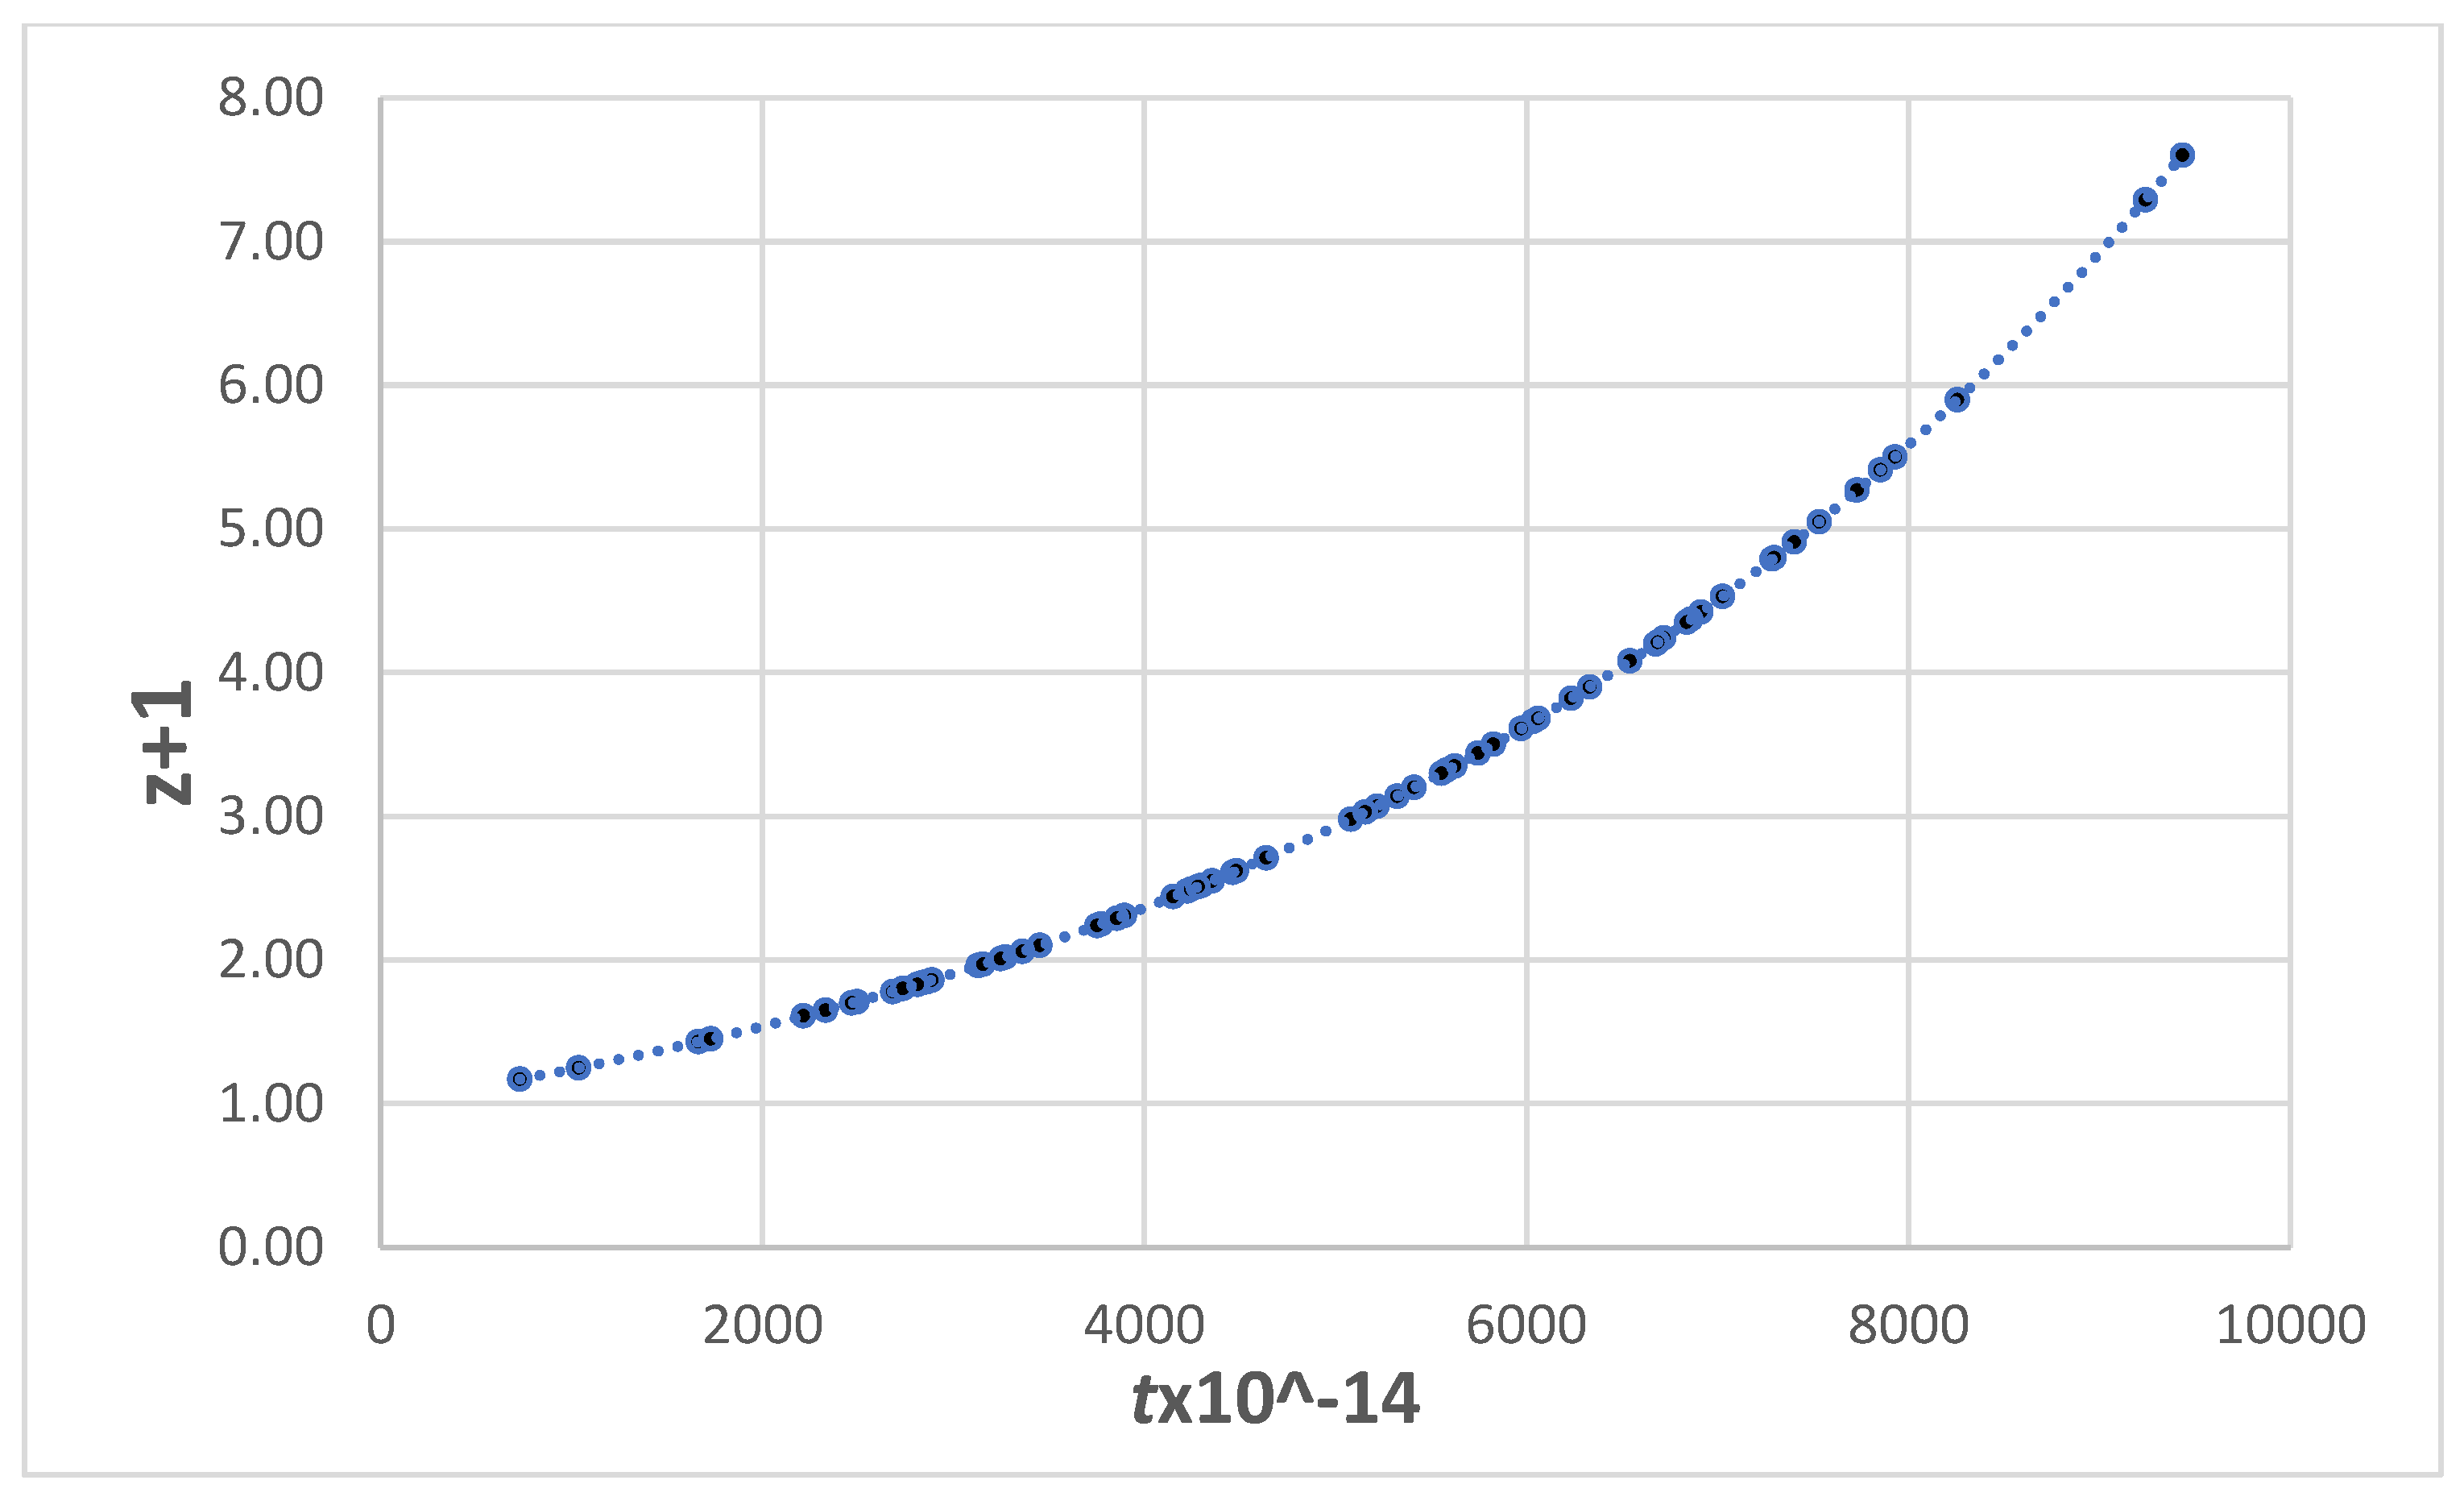
Figure 11 depicts the corresponding
t/(
z+1) HD, illustrating its perfect exponential slope, with
hTL = 0.663, in clear conflict with the prevailing view that the TL model does not align with the observed RS/
µ data.
8. Possible Source and Magnitude of Error
As can be seen in Figure 10 the burst at ln(z+1) = 1.1085 with tx10^14 = 19984 is obviously an outlier. The usual way to test the influence of an outlier on the shape of the HD is to compute the HD with and without the outlier. Results are summarized in
Table 10 and shw that the burst at z = 2.03 with µ = 48.85 is an influential outlier. By removing this burst the slope of the HDs changes greatly from
hTL = 0.6634 to 0.6918 for data set d) and from 0.6677 to 0.6779 for data set e). As the number of data points increases, the outlier's influence becomes more moderate (data set e). Rather than removing this extreme outlier, substituting the uncalibrated
Fid data point for the obviously problematic calibrated one yields more reliable results. The
Fid data point, with µ = 47.93, is close to the bottom of the error limit for the calibrated data with 48.85±1.02. Thus, using the
Fid data point is not arbitrary. Furthermore, a comparison of the Hubble constants calculated using the outlier (rows 1 and 2 in
Table 10) and the
Fid data point (rows 5 and 6 in
Table 10) shows minimal differences, indicating that the magnitude of the
Fid data point has only little impact on the overall result, which remains within an acceptable level of plausibility.
9. Discussion
The most noticeable result from the HD tests is that the prediction of the ΛCDM model with reference to the shape of the HD cannot be verified based on known high RS LGRB data. The linear log(z)/µ HD does not align with the data within acceptable error limits and can therefore be ruled out with a high degree of certainty. This finding is consistent with recent findings from Schokolov et al. (2022). Their analysis of data set (c) reveals that the standard CDM model does not match the observed z/µ data.
The cosmologically important result is that the shape of the HD exhibits an exponential slope, aligning well with data (b), (d) and (e), obtained using different calibration methods, such as Liu and Wang 2015, as well as the Dainotti relationship (Dainotti 2008). The numerical results are summarised in
Table 10
The results from data sets (b), (d) and (e) are individually consistent in their statements regarding the e ponential slope of the HD. However, as shown in Paragraph 6.2 and
Table 10, the derived Hubble constants are numerically different, ranging from
hTL = 0.64 for data set (b) to
hTL = 0.667 for data sets (c) and (d). (The corresponding expectation values for the equivocal CDM and TL models in the low RS range z < 1, as shown in
Table 5, range from
hCDM = 0.70 for
hTL = 0.64 to
hCDM = 0.735 for
hTL = 0.667, and reflect the discrepancy between the default value of
h = 0.70 and the considerably larger value of
h = 0.735 advocated by Riess et al. It is speculated that this discrepancy stems from the variations in data calibration methods and is therefore not a contradiction.)
10. Conclusions
The most remarkable outcome of the HD test introduced in this analysis is that in the low RS range of z = 0.01–1.3, the HD is equivocal and permits no distinction, based on the data, between the ΛCDM and TL models. The HD can be equally well described with the parameter of the ΛCDM model as with the exponential function .
In the high RS ranges up to z = 8.1, regardless of the calibration method, the observed z/µ data conflict with the ΛCDM and favour the TL model for data sets (b), (d) and (e). The key question regarding the actual shape of the HD, as predicted by the ΛCDM or the exponential TL model, seems to lean in favour of the TL model, and the presented results show that excluding the TL model from further consideration is not justified.
Data availability
The author confirms that the data supporting the findings of this study are available within the article and the reference list.
References
- Hubble E., 1929, Proc. Natl. Acad. Sci. U. S. A., 15, 168.
- Sorrell W.H., 2009, Ap&SS, 323, 205.
- Traunmüller H., 2014, Ap&SS, 350, 755.
- Liu J., Wei H., 2015, Gen. Relativ. Gravit., 47,.
- Amati L., D’Agostino R., Luongo O., Muccino M. & Tantalo M., 2018, MNRAS Lett., 486, L46.
- Dainotti M., Cardone M.G. & Capociello V.F. 2008, MNRAS Lett., 391, L 79-L83.
- Schaefer B.E., 2003, ApJ, 583, L67.
- Schaefer B.E., 2003, ApJ, 583, L67.
- Wei H., 2010, J. Cosmol. Astropart. Phys., 2010, 20.
- Cardone M. G., Capociello V.F. & Dainotti M., 2009, Mon. Not. R. Astron. Soc. 400, 775-790 (2009).
- Marosi L.A., 2013, Adv. Astron., 2013, 917104.
- Marosi L.A., 2014, J. Mod. Phys., 5, 29.
- Marosi L.A., 2016, Int. J. Astron. Astrophys., 6, 272.
- Marosi L.A., 2019, Int. J. Astron. Astrophys., 9, 1.
- Zwicky F., 1932, Proc. Natl. Acad. Sci. U. S. A., 15, 773.
- Gupta R.P., 2019, Universe, 5, 102.
- Shirokov S., Sokolov I., Lovyagin N.Y., Amati L. Baryshev Y.V., Sokolov V., Gorokhov V., 2020a, MNRAS, 496, 1530.
- Shirokov S., Sokolov I.V., Vlasyuk V., Amati L., Sokolov V. & Baryshev Y.V. & 2020b, Astrophys. Bull., 75, 207.
- Betoule M. et al., 2014, A&A, 568, A22.
- Wang F.Y., Hu J.P., Zhang G.Q. & Dai Z.G., 2022 The Astrophysical Journal, 924,9 7 (11pp), 2022 January 10.
- Vigoureux J.M., Vigoureux B. & Langlois M., 2014, arXiv:preprint arXiv:1411.3648.
Figure 1.
log(z)/µ Hubble diagram for the 31 calculated z/µ data points.
Figure 1.
log(z)/µ Hubble diagram for the 31 calculated z/µ data points.
Figure 2.
ln(z+1)/t Hubble diagram for the 31 calculated z/d data points.
Figure 2.
ln(z+1)/t Hubble diagram for the 31 calculated z/d data points.
Figure 3.
Linear HDs for the calculated data (dots) and for the log(z)/µ (triangles) and d/ln(z+1) (squares) models.
Figure 3.
Linear HDs for the calculated data (dots) and for the log(z)/µ (triangles) and d/ln(z+1) (squares) models.
Figure 4.
Log(z)/µ Hubble diagram of the observed GRB data.
Figure 4.
Log(z)/µ Hubble diagram of the observed GRB data.
Figure 5.
hCDM = 0.7 (triangles), best fit of the observed data (squares).
Figure 5.
hCDM = 0.7 (triangles), best fit of the observed data (squares).
Figure 6.
Linear HD on the t/(z+1) scale of the observed GRB data.
Figure 6.
Linear HD on the t/(z+1) scale of the observed GRB data.
Figure 7.
t/ln(z+1) HD for the observed GRB data.
Figure 7.
t/ln(z+1) HD for the observed GRB data.
Figure 8.
Linear log(z)/µ HD.
Figure 8.
Linear log(z)/µ HD.
Figure 9.
triangles: observed line, squares: CDM with h = 0.7, dots: TL with h = 68.
Figure 9.
triangles: observed line, squares: CDM with h = 0.7, dots: TL with h = 68.
Figure 10.
linear ln(z+1)/tx10^-14 HD.
Figure 10.
linear ln(z+1)/tx10^-14 HD.
Figure 11.
HD in the t/(z+1) presentation. hTL = 0.6634.
Figure 11.
HD in the t/(z+1) presentation. hTL = 0.6634.
Table 1.
Descritive statistics from the considered DRB data sets.
Table 1.
Descritive statistics from the considered DRB data sets.
| Data set |
(b) |
(c) |
(d) |
(e) |
| No. of data points |
138 |
193 |
69 |
69 +30 |
| Data calibration method |
Liu, Wei |
Amati |
Dainotti |
Dainotti. Wang et al. |
| z range |
0.031–8.1 |
0.03354–8.1 |
0.17-6.6 |
0.17-6.6 |
| Data points z ⸖ 5 |
6 |
5 |
2 |
2 |
| R2 |
0.8746 |
0.7848 |
0.8789 |
0.842 |
| ∑χ2(best fit:obs) |
1.9193 |
5.1282 |
0.9225 |
1.2405 |
| ∑χ2/data point |
0.0139 |
0.02657 |
0.01337 |
0.01257 |
| Standard deviation |
2.196 |
2.2256 |
1.9604 |
1.8314 |
Table 2.
Fit parameters on the linear log(z)µ and ln(z+1)/t scales.
Table 2.
Fit parameters on the linear log(z)µ and ln(z+1)/t scales.
| |
Parameter 1 |
Parameter2 |
Parameter3 |
Parameter 0 |
| log fit |
0.1009 |
0.6274 |
6.3167 |
44.111 |
| ln fit |
−855.33 |
1366.6 |
4397.4 |
0 |
Table 3.
Goodness of fit indicators the linear log(z)µ and ln(z+1)/t scales.
Table 3.
Goodness of fit indicators the linear log(z)µ and ln(z+1)/t scales.
| Fit coordinates |
∑χ2µcalc:
µ fit |
R2
|
P test |
Chiqu-test |
F test |
| log(z)/µ
|
2.673×10⁻⁵
|
1 |
0.9999985 |
1 |
0.9987774 |
| ln(z+1)/t
|
1.810×10⁻⁶
|
1 |
1 |
1 |
0.9987774 |
Table 4.
Hubble constants and variances for the linear t/(z+1) HD.
Table 4.
Hubble constants and variances for the linear t/(z+1) HD.
| Model |
Calculated data |
ln fit |
log fit |
| h |
0.6322 |
0.6322 |
0.6319 |
| R2
|
0.99967 |
0.99967 |
0.99948 |
Table 5.
Equivalent values for hCDM and hTL.
Table 5.
Equivalent values for hCDM and hTL.
|
hCDM
|
hTL
|
hTL/hCDM
|
| 73 |
65.92 |
0.9031 |
| 70 |
63.22 |
0.9031 |
| 68 |
61.41 |
0.9031 |
Table 6.
Comparison of ∑ χ2 values for hCDM = 0.70, hTL = 0.70 and the Best fit hTL = 0 66 with the observed data in the RS range 0.031–8.1.
Table 6.
Comparison of ∑ χ2 values for hCDM = 0.70, hTL = 0.70 and the Best fit hTL = 0 66 with the observed data in the RS range 0.031–8.1.
| Model, calc. µ
|
hCDM = 0.70 |
hTL = 0.66 |
hTL = 0.70 |
| ∑ χ2 µobs/µcalc
|
1.9415 |
1.9397 |
1.9923 |
Table 7.
Fit coefficients for the log(z)/µ Hubble diagram.
Table 7.
Fit coefficients for the log(z)/µ Hubble diagram.
| Parameter 1 |
Parameter 2 |
Parameter 3 |
Parameter 0 |
R2
|
| 0.133 |
0.3156 |
5.8286 |
44.0533 |
0.8746 |
Table 9.
Fit parameters on the linear log(z)/µ scale.
Table 9.
Fit parameters on the linear log(z)/µ scale.
| Parameter |
1 |
2 |
3 |
0 |
R2
|
| Data set d) |
-0.5384 |
0.849 |
5.6176 |
44.011 |
0.8553 |
Table 10.
comparison of data sets d) and e).
Table 10.
comparison of data sets d) and e).
| Data set |
hTL from
ln(z+1)/t fit |
∑χ2 TL from µobs:µTL |
∑χ2 CDM 70
µobs:µCDM |
| (d) all data |
0.6634 |
0.9692 |
0.9844 |
| (e) all data |
0.6677 |
1.3041 |
1.3271 |
| (d) without outlier |
0.6918 |
0.7752 |
0.8018 |
| (e) without outlier |
0.6779 |
1.1108 |
1.3271 |
| (d) fid for z = 2.03 |
0.6602 |
0.8539 |
0.8721 |
| (e) fid for z = 2.03 |
0.6619 |
1.1968 |
1.4065 |
|
Disclaimer/Publisher’s Note: The statements, opinions and data contained in all publications are solely those of the individual author(s) and contributor(s) and not of MDPI and/or the editor(s). MDPI and/or the editor(s) disclaim responsibility for any injury to people or property resulting from any ideas, methods, instructions or products referred to in the content. |
© 2024 by the authors. Licensee MDPI, Basel, Switzerland. This article is an open access article distributed under the terms and conditions of the Creative Commons Attribution (CC BY) license (http://creativecommons.org/licenses/by/4.0/).
